Article

A Multimedia Data Visualization Based on Ad Hoc Communication Networks and Its Application to Disaster Management

1
Faculty of Engineering, Science and Information Systems, University of Tsukuba, Ibaraki Prefecture 305-8573, Japan
2
School of Computer Science, University of Adelaide, Adelaide, SA 5005, Australia
3
Department of Mining Engineering and Metallurgical Engineering, Curtin University, Perth, WA 6433, Australia
4
Department of Spatial Sciences, Curtin University, Perth, WA 6433, Australia
*
Author to whom correspondence should be addressed.
ISPRS Int. J. Geo-Inf. 2015, 4(4), 2004-2018; https://doi.org/10.3390/ijgi4042004
Submission received: 9 July 2015 / Accepted: 11 September 2015 / Published: 10 October 2015
(This article belongs to the Special Issue Bridging the Gap between Geospatial Theory and Technology)

Abstract

:
After massive earthquakes and other large-scale disasters, existing communication infrastructure may become unavailable and, therefore, it can be quite difficult for relief organizations to fully grasp the impact of the disaster on the affected region. Consequently, this will be the cause of delays to offer the strategic assistance, and to provide water and food, etc. In order to solve the problem of re-establishing communication infrastructure to allow for information gathering, we developed an ad hoc mobile communications network for disaster-struck areas using ZigBee. As the communication speed of ZigBee is low, we propose a problem-specific image compression method for the multimedia data visualization. By using the proposed method combined with GPS information, it is possible to quickly grasp the damage situation in the region. Through our communication experiments in Tsukuba City, Japan we confirm the effectiveness of our system as a disaster information gathering and management system.

1. Introduction

When large-scale disasters strike, a quick damage assessment is very important. Especially in the early stages, because of an allocation limitation of available manpower, it will be a key task to rapidly develop a rescue strategy according to precise information. For example, immediately after the Great East Japan Earthquake in 2011, people could not use communication systems, such as mobile phones and the Internet, in disaster-struck areas. With this lack of communication systems, the decision-making process of aid allocation and appropriate rescue operation was delayed [1,2,3,4]. As a result, emergency provisions were not adequately delivered to some evacuation centers.
In this series of research, a disaster management system has been proposed by Ishii and Kawamura [5], which collects and manages disaster information in an integrated fashion at control centers via ad hoc networks in order to support rescue efforts, distributions of relief goods, and so on. Concretely, in case of the disaster, investigators or volunteers install ZigBee terminals (see Figure 1 for an example) that have been stored in the evacuation centers or at other safe storage places in areas with interrupted communications infrastructure immediately after the occurrence of a major disaster. After installation, an ad hoc network is constructed automatically. The locations of these terminals are determined by the radio wave propagation analysis and optimal placement method that was developed by Ishii and Kawamura [5]. Investigators who are investigating the damages with the help of PCs or PDAs can gather information and transfer these data to the control center via the created ZigBee network. Additionally, it is possible that affected members of the public join the efforts of the professional relief organizations and share their information using their own PCs or PDAs.
Figure 1. ZigBee module used in this study.
Ijgi 04 02004 g001
Through this long-term research project, a disaster information management system will be developed and the communication speed, its availability, and the terminal installation time between the control center and evacuation centers will be assessed. As the ZigBee communication network standard is not suitable for the transmission of large volumes of data such as image data due to its low transmission rate (256 kbps), we propose a new transmission method that is the combination of GPS information and improved PIC format compression that focuses on spatial information. In a real-world experiment, we assess the effectiveness and the compression ratios by using our proposed disaster information management system.
The structure of this article is as follows. In Chapter 2, we provide an overview of the whole proposed disaster information management system. Then, we propose our method of transmitting and receiving maps in low-speed communication systems in Chapter 3. Finally, we describe in Chapter 4 our experiments of sending and receiving data in Tsukuba City, Japan.

2. Disaster Information Management Systems

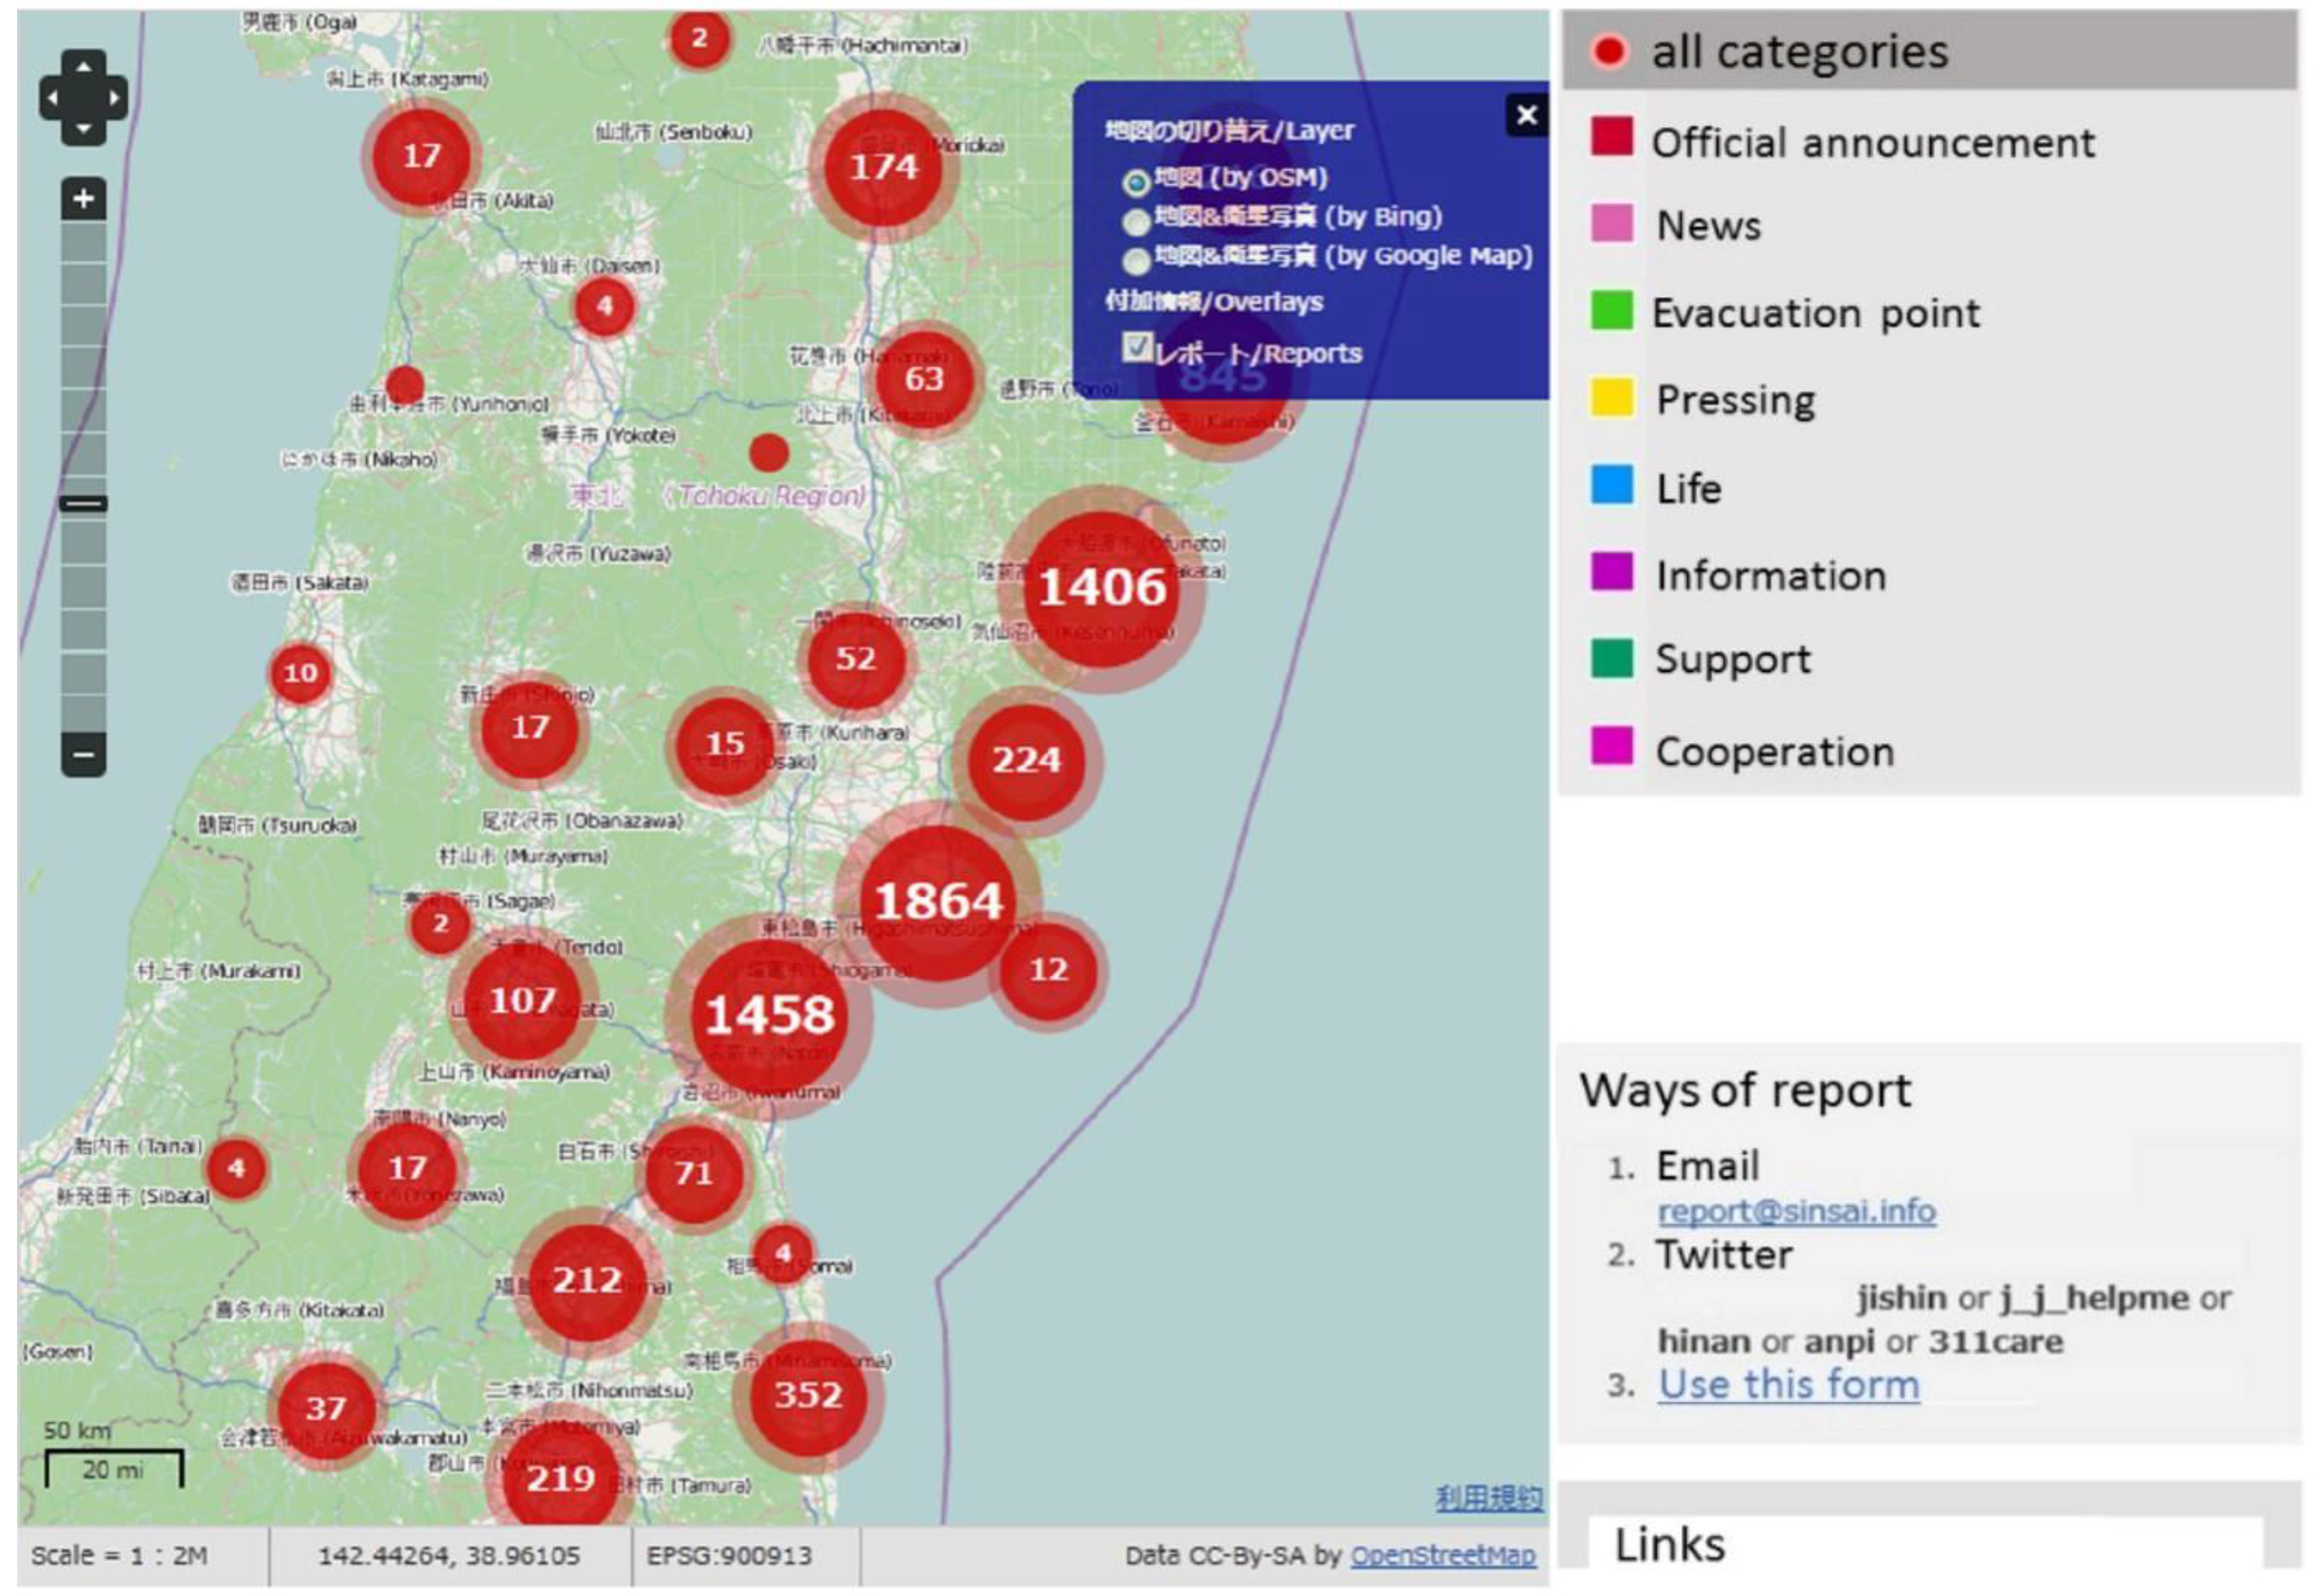
2.1. Current Status of Disaster Information Management

Currently, Multi-Channel Access (MCA) wireless communication systems and Ushahidi are put into effect as disaster information management systems after disasters.
Ushahidi (Figure 2, Watanabe et al. [6,7]) is the system that was used when the riots occurred during the elections in Kenya (2008). This open source web service was created to share information where such incidents occurred. Concretely, users can send information, such as “There is a riot in the area A” or “There is crime in the area B” via email, which will then appear on top of Google Maps. It has also been used to help collect situational information about military actions in the Gaza Strip (2009), Haiti (2010), after the earthquake and tsunami in Japan (2011), to monitor the elections in India and Mexico (2009), and in other cases. When the Great East Japan Earthquake occurred, the disaster information managing system named “sinsai.info”, which is based on Ushahidi, was not only used to grasp the situation of the disaster area, but also to collect and share information about water supplies, official announcements, notices, news, and evacuation calls. It was quickly available and lots of people could understand the situation with the help of the online information visualization. Via email, posts on websites, and via the information sharing service Twitter it was possible to collect information continuously.
Figure 2. One example of a system based on Ushahidi.
Ijgi 04 02004 g002
In contrast to the web service Ushahidi, MCA (Multi-Channel Access System) is a commercial wireless communication system (Figure 3). It supports a large number of system users and can use a variety of radio channels. This system consists of a “control station” that the operating body installs and manages, and of “command” and “mobile stations” that the users install and manage in order to achieve radio communication between the units. For example, this system can be used by local governments to share information with fire-fighters and emergency personnel, even if both teams use different wireless communication technology.
Figure 3. One example of a system based on the Multi-Channel Access System.
Ijgi 04 02004 g003

2.2. Overview of the Proposed Zigbee Disaster Control System

When a large-scale disaster such as the Great East Japan Earthquake occurs, the damage can be severe enough to take out MCA control stations, as well as fixed-line telephones, mobile phone stations, etc. Consequently, it can become difficult to use any of the two above-described disaster information management systems. We consider it an essential requirement for disaster control systems that wireless communication system can work even in such situations where hardly any previously existing infrastructure is available.
In this long-term research project, we develop a disaster information management system that uses the ZigBee communication standard (http://www.zigbee.org/). Figure 4 shows the overall flow of the proposed system. The disaster information management system is installed on PCs located in the control center and in the evacuation centers. This system contains the GIS data (i.e., the geographical map data). The following is the organizational flow of the proposed system:
[Step ①] Immediately after the disaster (Corresponding to ① in Figure 4), the optimal allocation of ZigBee terminals between the control center and evacuation centers is calculated by using the PC in the control center.
[Step ②] The maps are updated with the of Step ① (Corresponding to ② in Figure 4).
[Step ③] Figure 5 illustrates a “ZigBee positioning situation”. The communication terminal equipment carried by the investigators has a ZigBee communication module and a GPS module (corresponding to the red square in Figure 5); it must also display the coverage map using a PC or PDA (corresponding to ② in Figure 4). ZigBee terminals (assumed to have been stockpiled in the city hall or in evacuation centers within hours after the disaster) are placed along the way according to the computed optimal arrangement (Corresponding to ③ in Figure 4).
[Step ④] After the deployment of the ZigBee terminals, data transfers across the ZigBee network are available within the ranges that are visualized on the digital map (Corresponding to ④ of Figure 4). After this installation, this system will continue to work until the batteries run out after several months, or until the terminal are collected again.
Figure 4. The process of establishing connections between centers: when the evacuation centers are established ①, the ZigBee network is planned ②, then the ZigBee nodes are located ③, and the network can be used ④.
Ijgi 04 02004 g004
Figure 5. Screen of the proposed system.
Ijgi 04 02004 g005
Disaster information is information on a variety of materials, such as water supply information, official announcements, notices, news, and location of evacuation centers. In our case, disaster information consists of GPS data and text data, which is displayed on a map as a blue square. In our system, these texts (information) are displayed on the right of the map in chronological order, and once they are selected the corresponding information is highlighted. Additionally, GPS information is highlighted as a color change from blue to green (corresponding to the green of Figure 5), and the relevant text comes up to the first line (corresponding to the yellow of Figure 5). If the PDA or PC have been newly added to this system, or that system is re-connected after a temporary cut of the connection to the network, it is possible to acquire missing information by using the “request update function”.

2.2.1. ZigBee Network

ZigBee is one of the communication standards for wireless sensor networks, and it has mainly been used in instrumentation control (see, for example, Kawamura et al. [2]).
Table 1 is a comparison of ZigBee with other typical wireless communication standards. Due to its characteristics, ZigBee is suitable, for example, for building automation, industrial automation, and home automation. Furthermore, ZigBee is also used in automatic meter reading, in security systems, and in remote control.
Table 1. Comparison of different communication standards.
NameZigBeeWi-FiBluetooth
Communication distance10–3000 m100 m10 m
Communication speed250 kbps11 Mbps1 Mbps
Network capacity65,536 nodes32 nodes7 nodes
Life-time on batteryseveral monthsseveral hoursseveral days
Applicationinstrumentation controlwireless LANwireless accessories
ZigBee has the following four advantages for our scenario:
(1)
Support of a large network
As up to 65,635 terminals (“ZigBees”) can be configured to form one wireless network, and the configuration can happen independently of location and time.
(2)
Ad hoc network
It is easy to build an ad hoc network, and more stable communication can be realized by providing a higher density of terminals along the intended transfer paths.
(3)
Low electric power consumption
Maintaining a long-term battery-powered network is possible.
(4)
Low cost
The costs of the ZigBee terminals are low, so it is possible to configure a wide area network by using a large number of them.
With the recent introduction of Bluetooth Low Energy (BLE) a competitor to ZigBee has been developed. While the energy consumption of BLE is significantly below that of Bluetooth, other features still make it unsuitable for our purposes (see for example, Mohan et al. [8] and Baker [9]). First, BLE is designed for small, local area networks and it is typically set up in star topologies or in one-to-one connections. ZigBee on the other hand is typically run in wider area networks and in mesh topologies that are significantly more robust when individual nodes fail. This is why we decided to build our disaster information management system based on ZigBee.
Despite these desirable advantages, ZigBee has the disadvantage of providing a relatively low communication speed. In practice this means that it is possible to send and receive data, such as text data of some kilobytes, however, it is difficult to transmit and receive multimedia data of some megabytes. To compensate for this problem, we are using a lightweight text-based communication in the present system. For the transmission of map data, we require significantly compressed data.

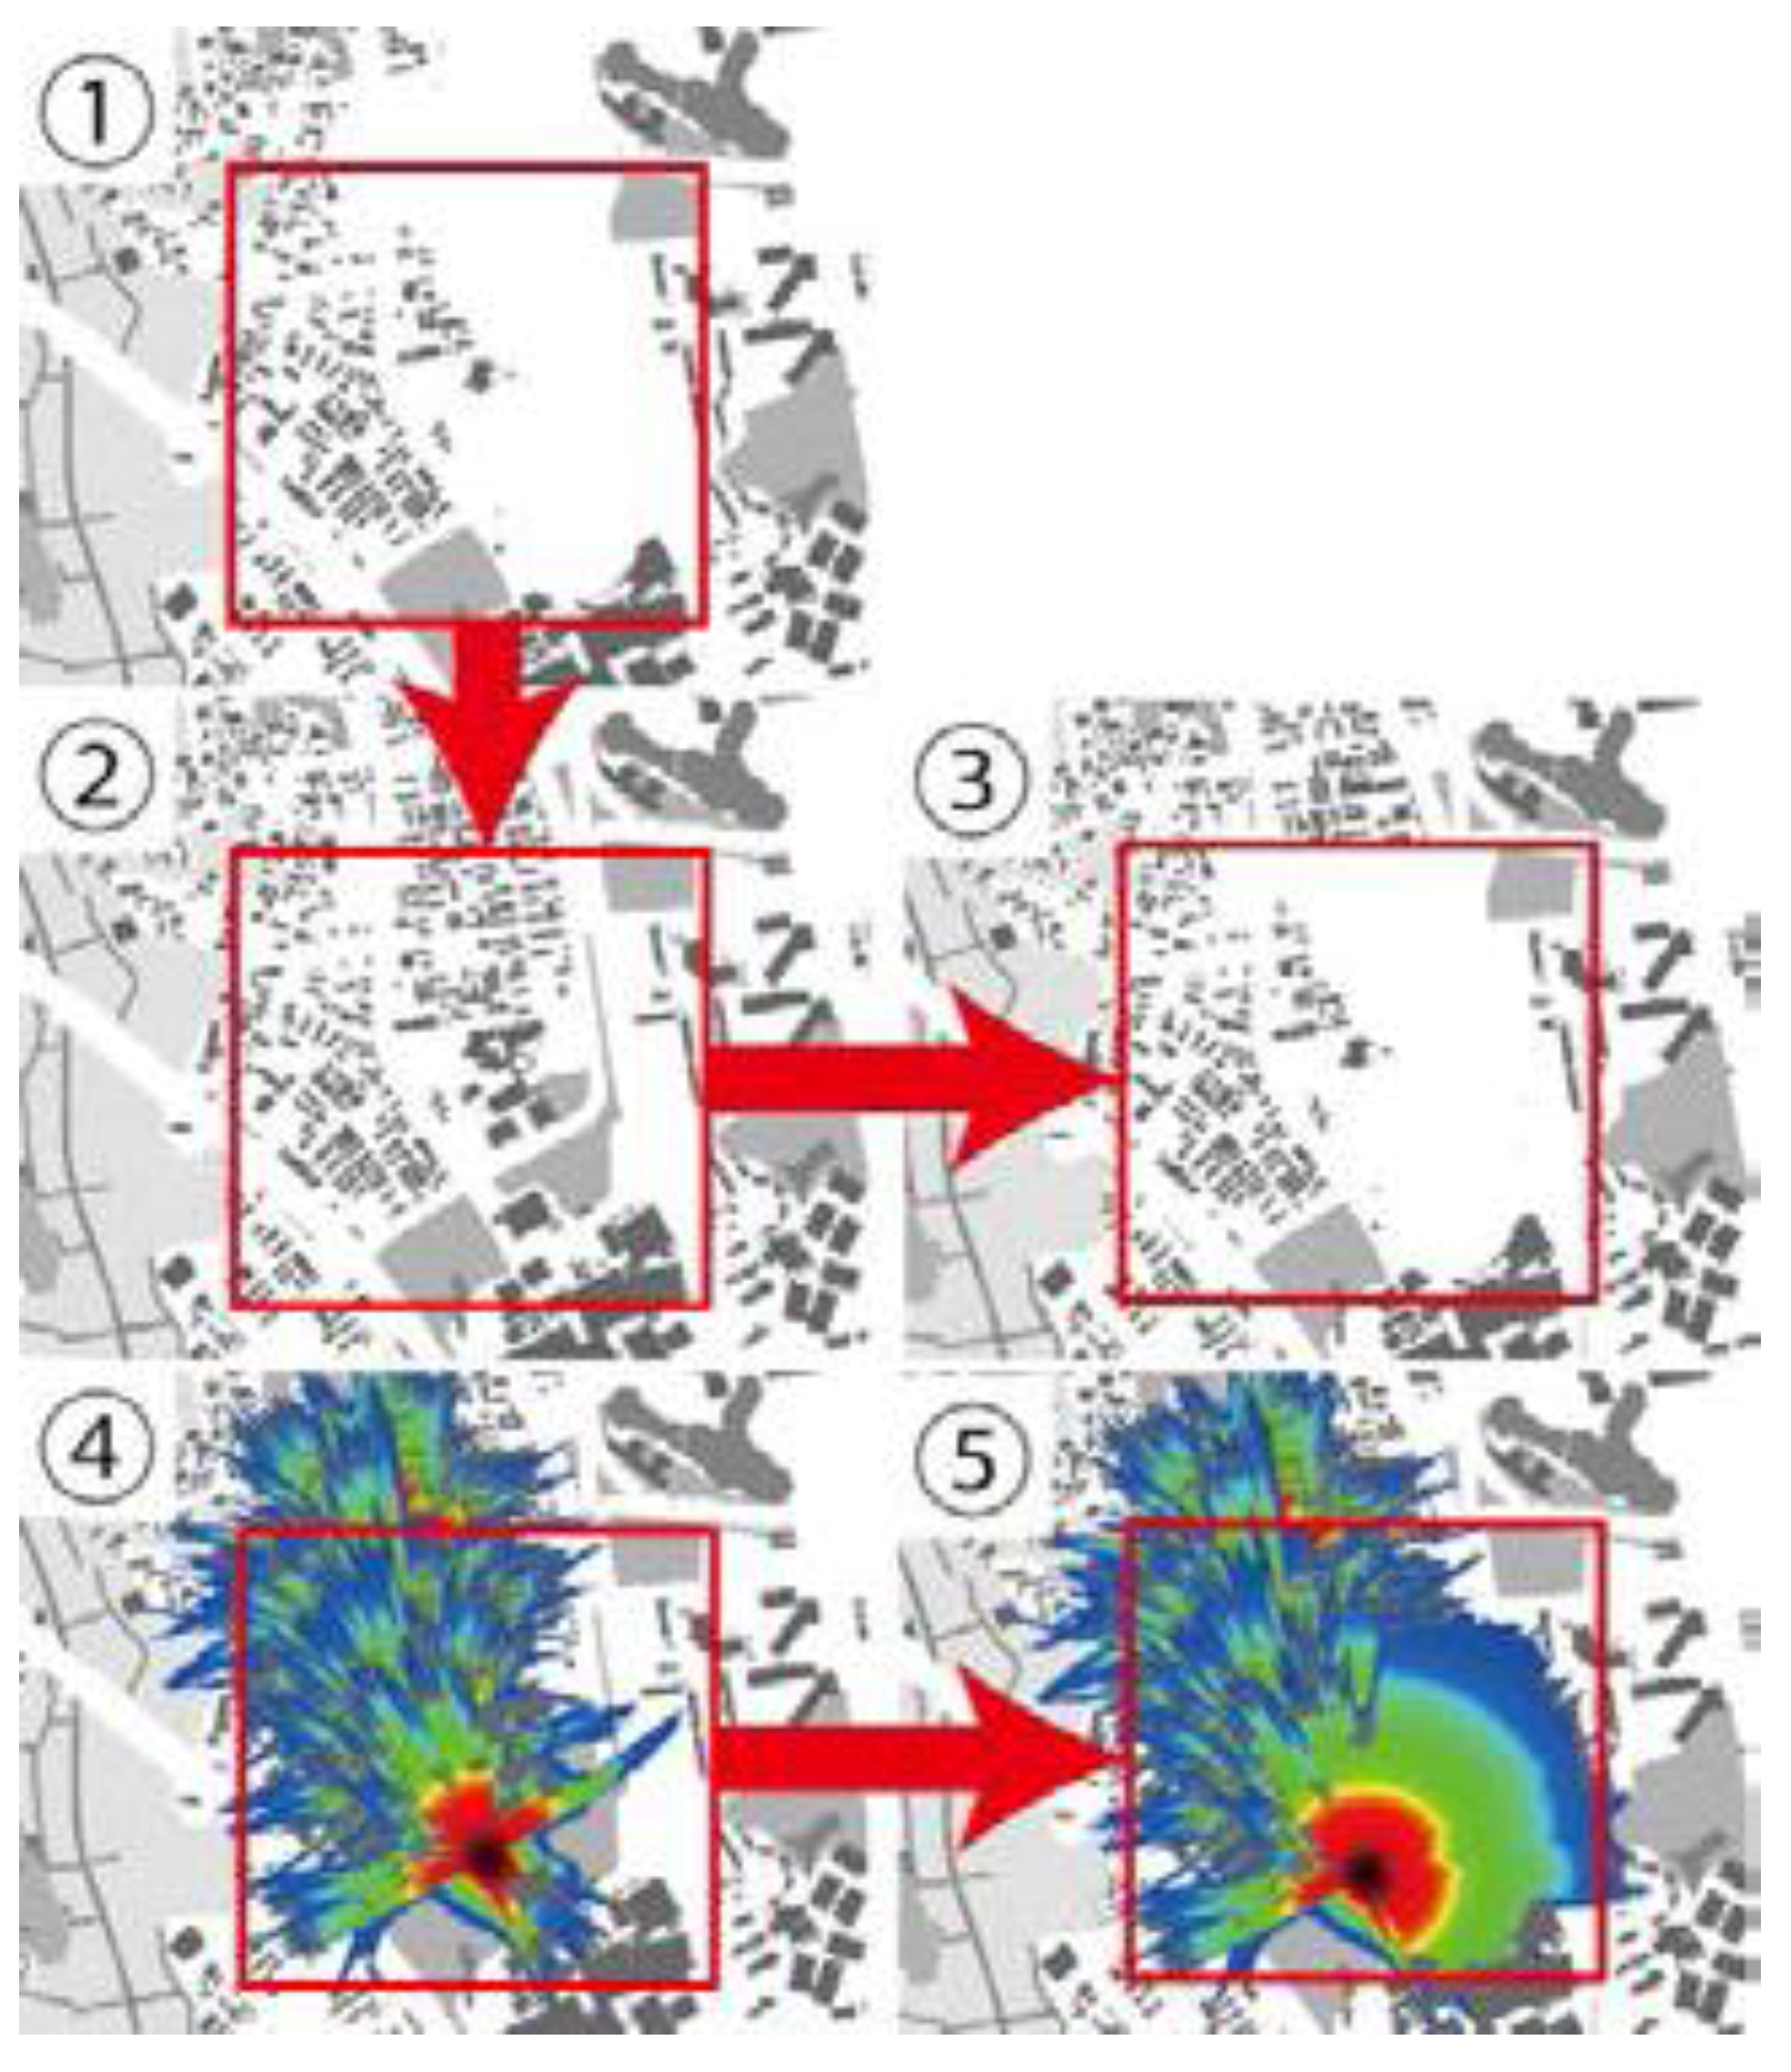
2.2.2. Optimized Arrangement Method and Radio Wave Propagation Analysis

It is necessary to construct the network as quickly as possible immediately after the disaster. In order to establish communication between the control center and all evacuation centers, we must decide on the installation locations of the ZigBee terminals. While deciding, we must consider the locations of woodland and water, because these influence the signal attenuation. There is also a need to respond flexibly to changes in the map information, as structures can collapse, and tsunamis and earthquakes can uproot forests. It is necessary to invest a small amount of computation time for estimating the radio wave propagation.
A radio wave propagation analysis method that was developed by Kawamura et al. is used in this system. This method uses a sequential tracking method that considers the transmission along the line-of-sight only (no transmission through obstacles, reflections, and diffractions) to reduce the computational complexity. The radio attenuation is estimated for different types of vegetation, and digital maps created based on GIS (Geographic Information System) to get the geographic information in the affected area (Ishii and Kawamura [5]). This method is then used by an iterated ray-launching method that greedily connects the control center with the evacuation sites; the eventual terminal locations are then determined along the paths of the simulated connections. The same algorithms are used by Moridi et al. [10] in a mine monitoring and communication system.

3. Transmitting and Receiving Map-Data in Low-Speed Communication

It can be expected that severe disasters change the geographical information, for example, the vegetation is changed, as are man-made structures. Nevertheless, it is necessary that members of the public and of relief organizations can communicate, even when the variations happen. In order to deal with such alterations, our system predicts the radio wave propagation and computes the optimal arrangement using the new map that is obtained and sent to each evacuation center after the disaster. Figure 6 shows the proposed map data transmission method. New map data based on satellite images can be available a few hours after a disaster. This, then, allows us to optimally arrange the terminals based on the situation at hand. Investigators, who have PCs or PDAs to collect disaster related information, need the map of the area and also a visualization of the available range of the radio communication. Therefore, an operator at an evacuation center needs to send updated geographical information (bit-mapped image, ① in Figure 6 shows in the red square the map as updated by a person who is present at the site) based on updated GPS information that is obtained via PCs and PDAs. All information will be combined for the modified map (② in Figure 6 shows the original map, ③ in Figure 6 shows the new map).
Figure 6. Map data update method.
Ijgi 04 02004 g006
Initially, this map image would be a bitmap and its image size would be too large to send across low-speed communication networks, such as a ZigBee network; therefore, image-compression is necessary. In this chapter, we propose a new problem-specific image-compression method.

3.1. Existing Image-Compression Methods

The PIC image format can be used for images that have continuous large areas of same colors, such as maps showing geographical information. Our method adopts PIC’s run-length encoding method to longitudinal (vertical) direction and it has the characteristic of invertible transformation; for an in-depth description, see Carlson [11].
Figure 7 shows the image-compression method by PIC. Figure 7a shows the original state of the image. First of all, the picture is explored for each pixel from upper left to lower right line-by-line. If the color of an exploring pixel is same as some of the next pixel, the color information of the next one is deleted. If the color of the exploring pixel is different from some of the next pixel, the color information of next one is kept. This process is repeated until the lower right corner of the image is reached in order to find all the points where the color changes. Afterwards, all such points form “chains” from the top to the bottom of the image (Figure 7, ■ and ▲). In the actual compression step, the distances between the points where the colors change is recorded, as is the color itself, and also the direction of the chain and the offset.
Figure 7. PIC format. (a) shows the original picture, (b) the right outlines the compression technique.
Ijgi 04 02004 g007

3.2. Proposed Image-Compression Method

The proposed method is an adaption of the PIC method to improve the compression for disaster-related information management systems. Images of maps have few colors because the colors represent just a small number of geographical information categories. The correspondences of geographical information and colors are stored in a database. Since this database does not change, the control center, the evacuation centers, and the investigators can share it in advance. In the database, geographical information and colors are encoded using three bits, e.g., “000 = road, 001 = water area, etc.”. We call this suggested compression method GIM-format (Geographical Information Image). In case further data compression is necessary, we will limit the GIM images to only the sector around the current investigators (suggested image data size is 400 × 400 pixels). We will call this method GIMS-format (GIM Sector).

3.3. Comparison of Image-Compression Methods

Figure 8 shows map images that have four different levels of detail. First, we compress each image with GIM, GIMS, PIC, GIF, PNG, and JPEG using Adobe Illustrator; then we compare the resulting data-sizes. The original image data size is 28,473 kB (3006 × 2622 pixels, bitmap format). Note that, in the case of the GIMS-format, we report the mean of nine 400 × 400 pixels cut-outs from the original image.
Figure 8. Image data used. The four figures (ad) show shows map sections at four different levels of detail.
Ijgi 04 02004 g008
The results of the compressions are shown in Table 2. The GIM- and GIMS-format are the most effective compression methods. The resulting size of the GIM-format is approximately half of the others format images (except PIC-format) and is about 0.6 times the size of the PIC-format. In particular, the more large areas of the same colors are in the images, the more effective the compression is. PIC is more effective for images that have many small areas of same colors. This complements the effectiveness of the GIM-format for images that have many areas of same color.
Table 2. Comparison of compression methods, number are file sizes in KB.
abcd
GIMS3.623.430.430.14
GIM252161216
PIC355226268
GIF5673507920
PNG6154446650
JPG980824268187
It is shown that all images can be compressed to 4k bytes or less by cutting out the important sections; thus, dividing the images makes it possible to transmit only necessary map information via the low-speed ZigBee network.

4. Evaluation Experiment for the Proposed System

4.1. Outline of the Evaluation Experiment

We conducted three experiments to evaluate the proposed disaster control system.
(1)
Following the system flow, the time is measured for the calculation of the optimal locations of four ZigBee terminals.
(2)
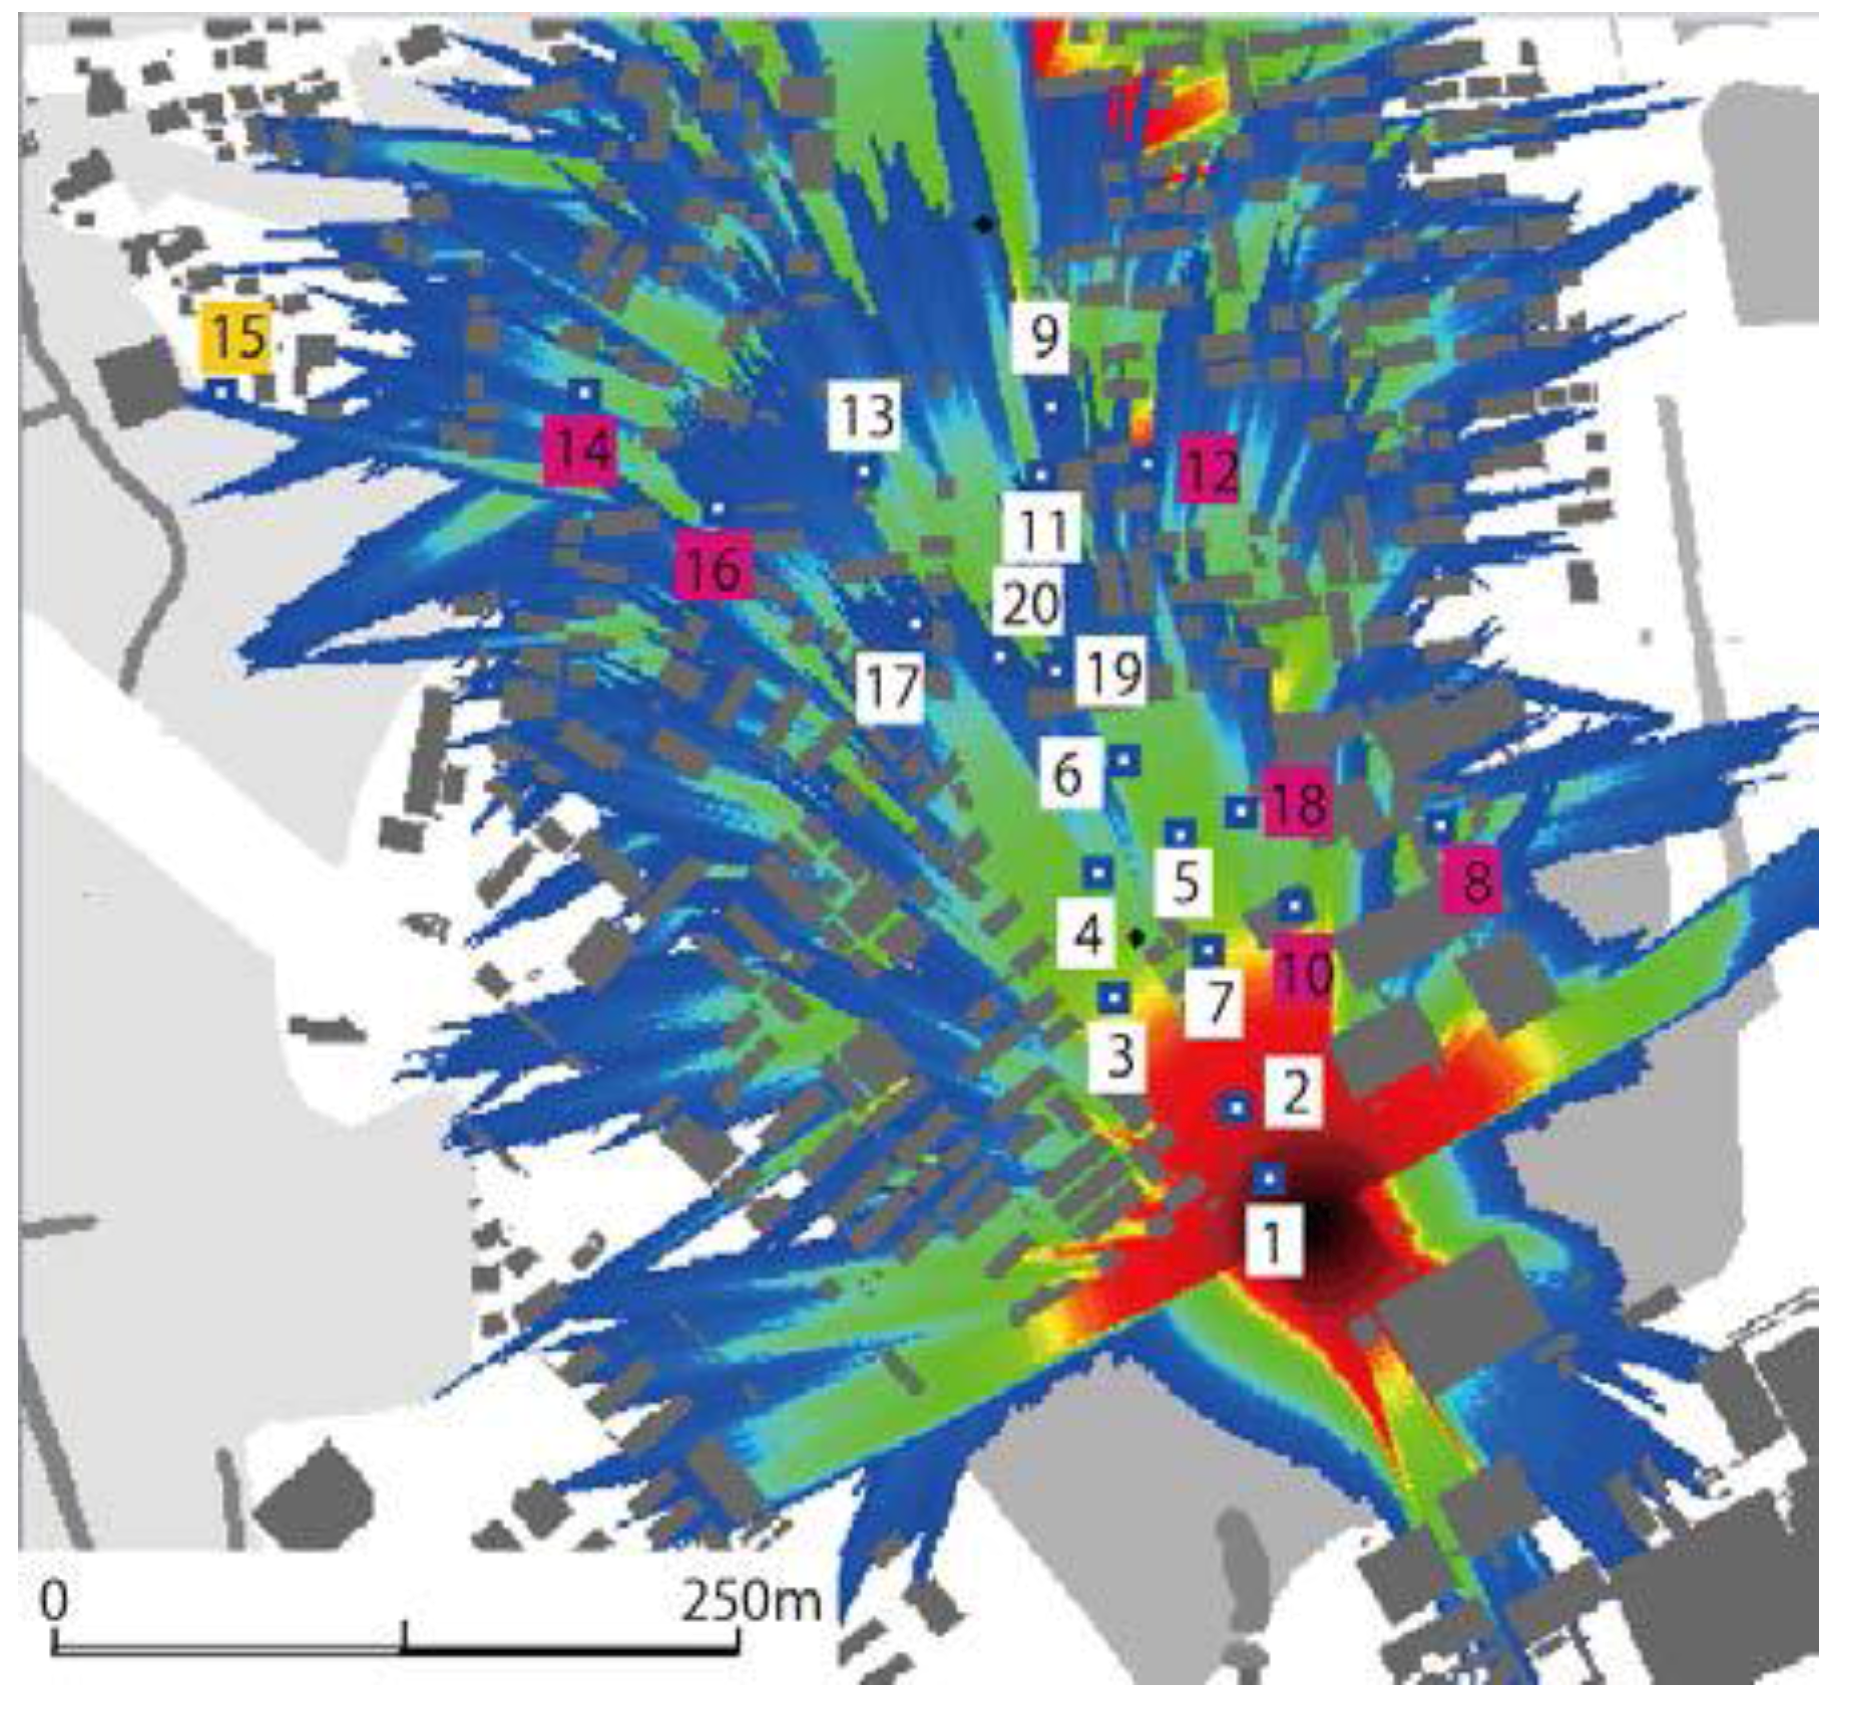
The experimenters transmit and receive disaster related information at 20 different spots. On each spot, the communication speed and the communication quality were measured.
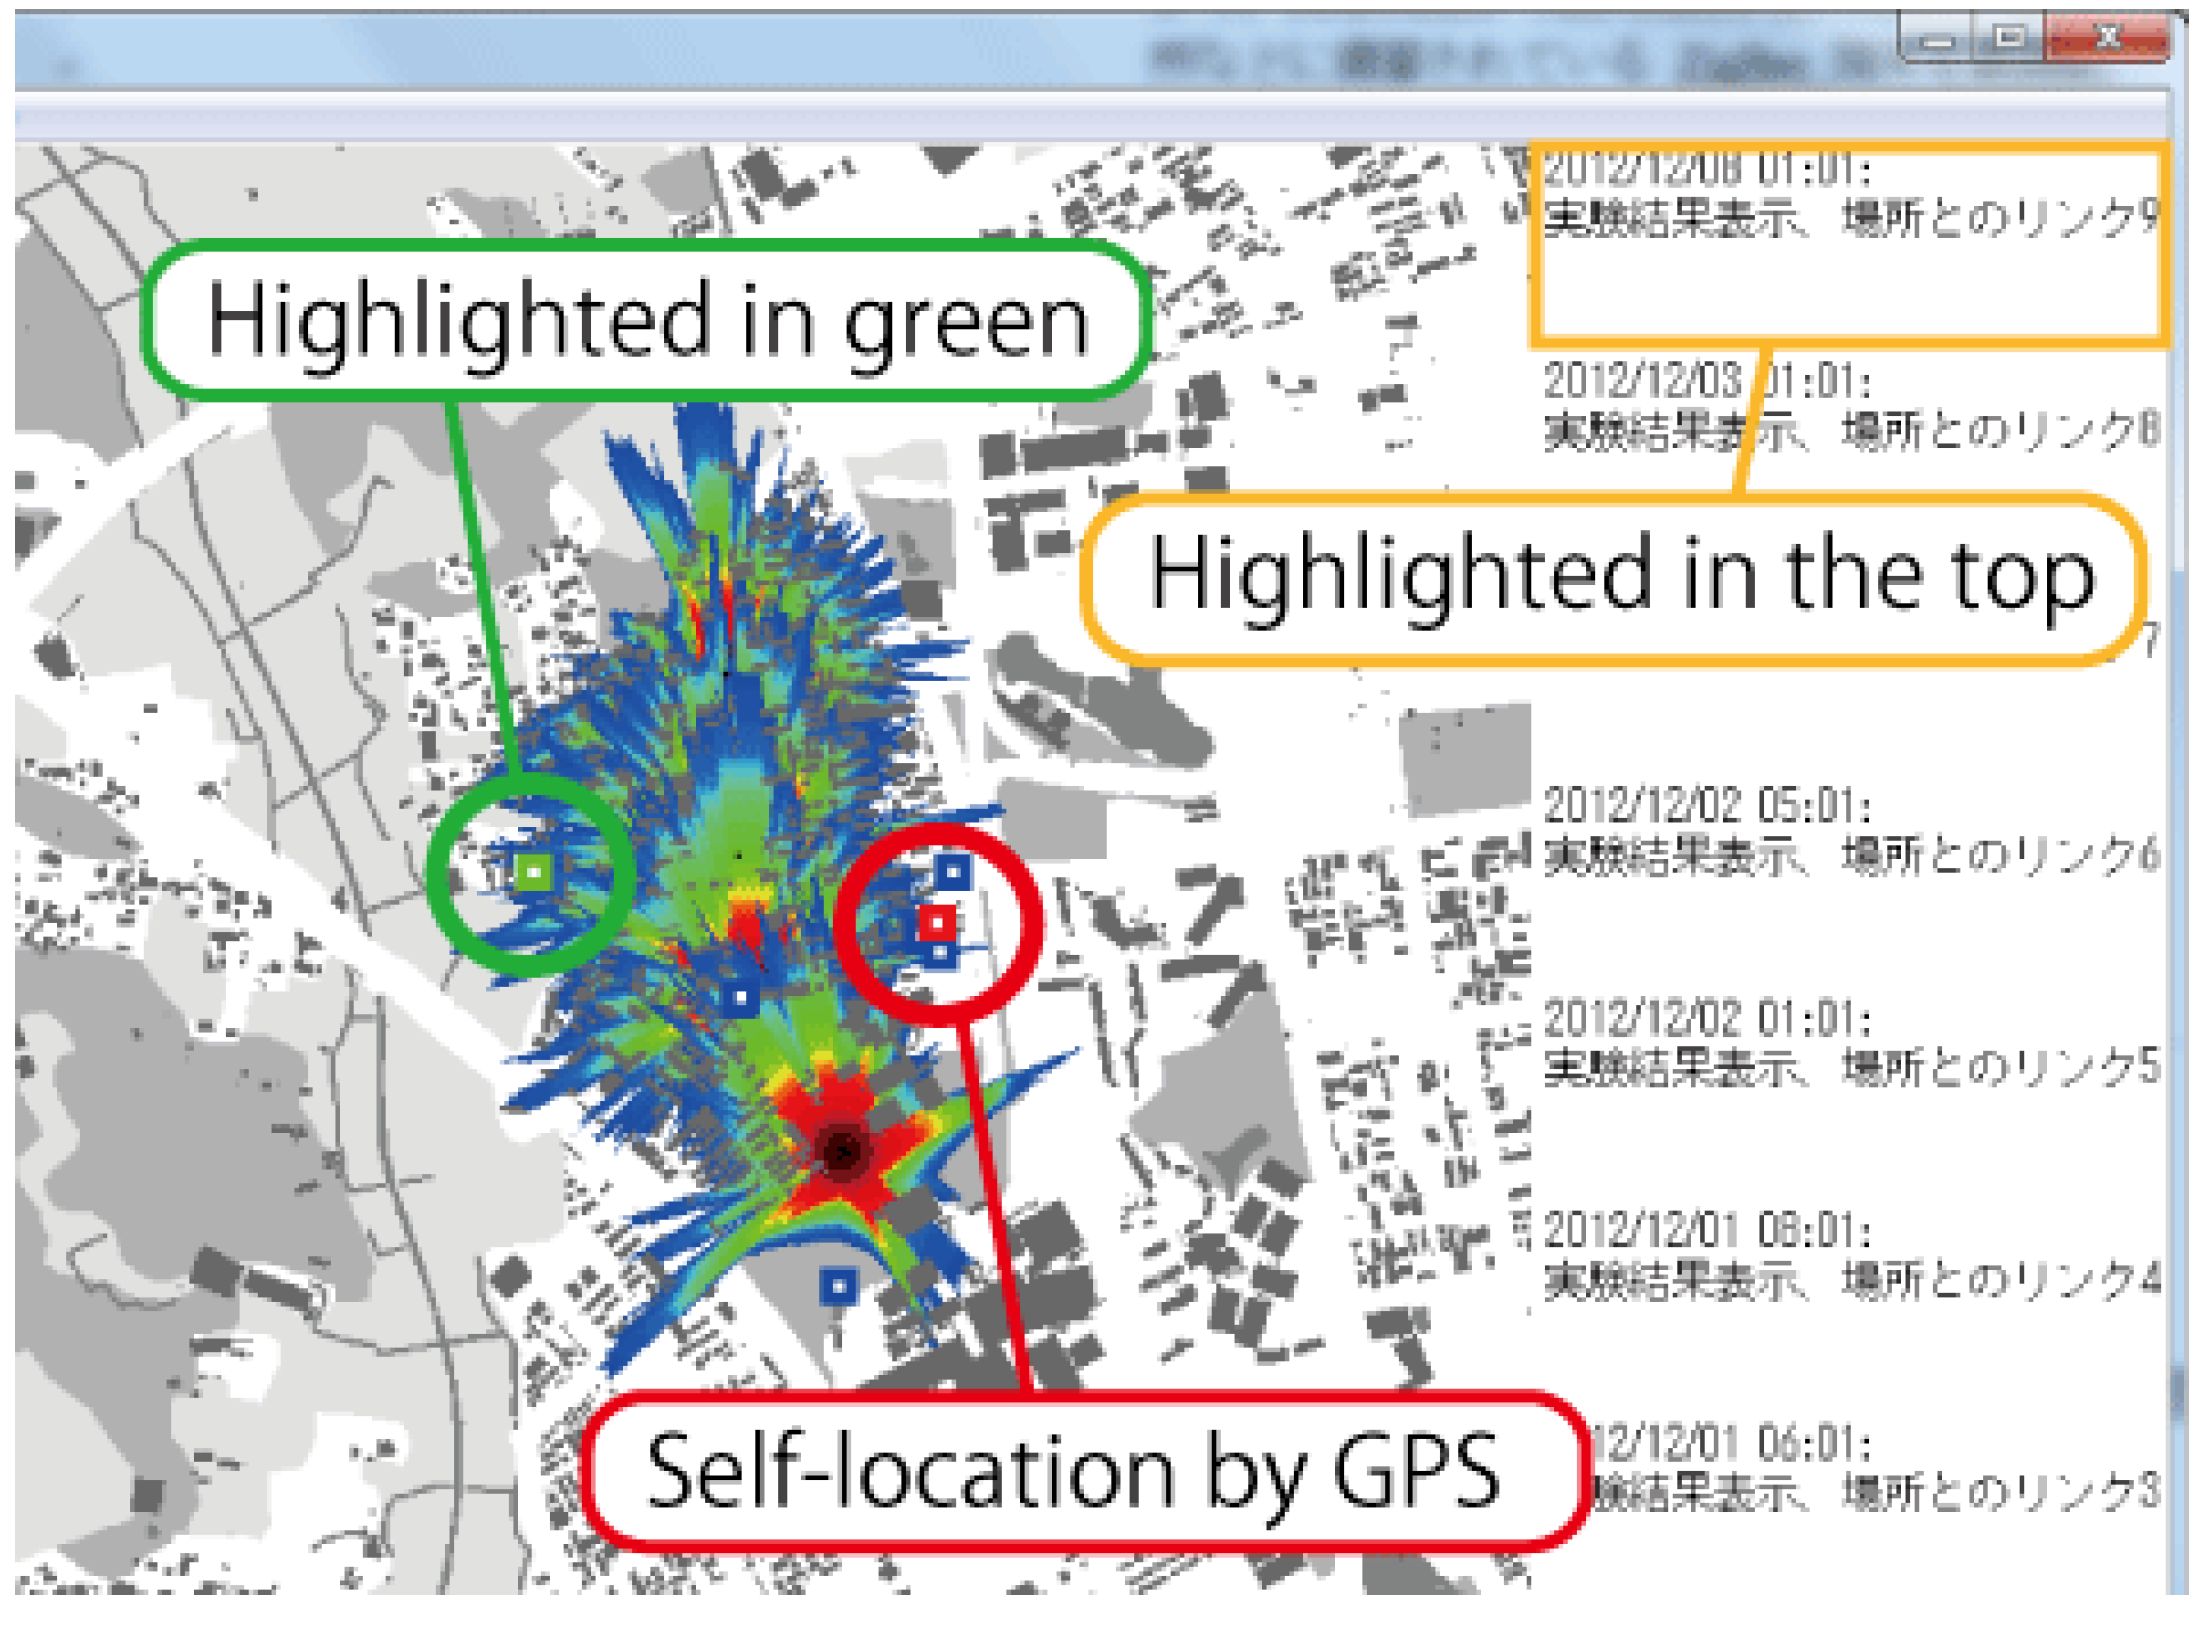
(3)
Then, the experimenters obtain new map information about their vicinity from a control center using GPS information and update it. After that, the new range of the radio communication is calculated and visualized.
The investigated area for the installation of the ZigBee terminals is 800 × 500 meters around Kasuga 4-chome of Tsukuba City, Japan. Figure 9 shows the calculated optimal arrangement of ZigBee terminals. In the first experiment, four ZigBee terminals were placed; the time was measured while an experimenter placed the terminals.
Figure 9. Figure of placement plan.
Ijgi 04 02004 g009
In the second experiment, the data transmitted and received consists of GPS data and “a communication experiment spot + the number of spot”. The data was transmitted from a PC at an evacuation center to a PC on a control center through the ZigBee network. Additionally, the time required to send text data was measured using synchronized clocks on both PCs. By comparing the time-stamps of the messages with the receiving PC’s time, we could calculate the transmission times. In addition, we consider a special (and likely) scenario in this second experiment: in one of the 20 measurements, an investigator leaves the area with ZigBee network coverage while investigating (either accidentally or on purpose) and then returns back into the ZigBee covered area. For this scenario, we have implemented a “request update function” to fetch data from the evacuation center was not received due to the missing signal.
In the third experiment, the map image only around an investigator (experimenter) was cut out and the map data was compressed at the evacuation center. The compressed image was sent to the control center and uncompressed. This process was conducted five times at different spots. As in Section 3, the original image size was 3006 × 2622 pixels, while the images were cut out into the size of 400 × 400 pixels for the GIMS-format.

4.2. Results of the Evaluation Experiment

In this section, we describe the results of our study in Tsukuba City, Japan. In this study, we measured the setup time needed, we measured the availability and speed of our ZigBee network, and we updated the geographical information locally and centrally.

4.2.1. Installation and Preparation Time

The experiment’s starting time was 13:40 and system installation and preparation was completed at 14:12. In these roughly 30 min four ZigBee terminals (including the control center) were placed according to optimal arrangement calculated with a PC in an evacuation center. Based on results of a previous experiment in this area, it was assumed that one person can cover (investigate) 0.4 km2 area in 30 min. We can use these numbers to estimate the resources needed in a real large-scale disaster: if the residential area of Tsukuba City (241.07 km2) would be struck by a disaster, only 100 people (with 24 ZigBees each) would be needed to establish complete coverage with our proposed system within three hours.

4.2.2. Communication Availability

Figure 10 shows the results of transmitting and receiving the multimedia data at 20 spots. 19 spots were located inside of coverage of ZigBee communication and one was located “out of range” as described above. At 13 spots (Figure 10, numbers on white background) out of the 19 spots, data reception was possible. At the six others spots (Figure 10, numbers on red background), communication failed. There are buildings or elevated areas between these spots (Figure 10, numbers 8, 10, 12, 14, 16). The reasons of these failures are probably diffractions of the radio waves. As reflection, diffraction, and permeation of radio waves were not considered when the radio wave attenuation was estimated, the estimation error will be large in case there are a lot of buildings at that moment. Data obtained by an experimenter at spot 15 (Figure 10, yellow square) was stored when it was observed, and it was sent after the experimenter came inside the coverage of the ZigBee network. Subsequently, the stored data was received at the control center. This was a successful proof of the concept that an investigator can collect data while being out of the communication range and then share this data when coming into the communication range again.
Figure 10. Experimental results of communication situation.
Ijgi 04 02004 g010

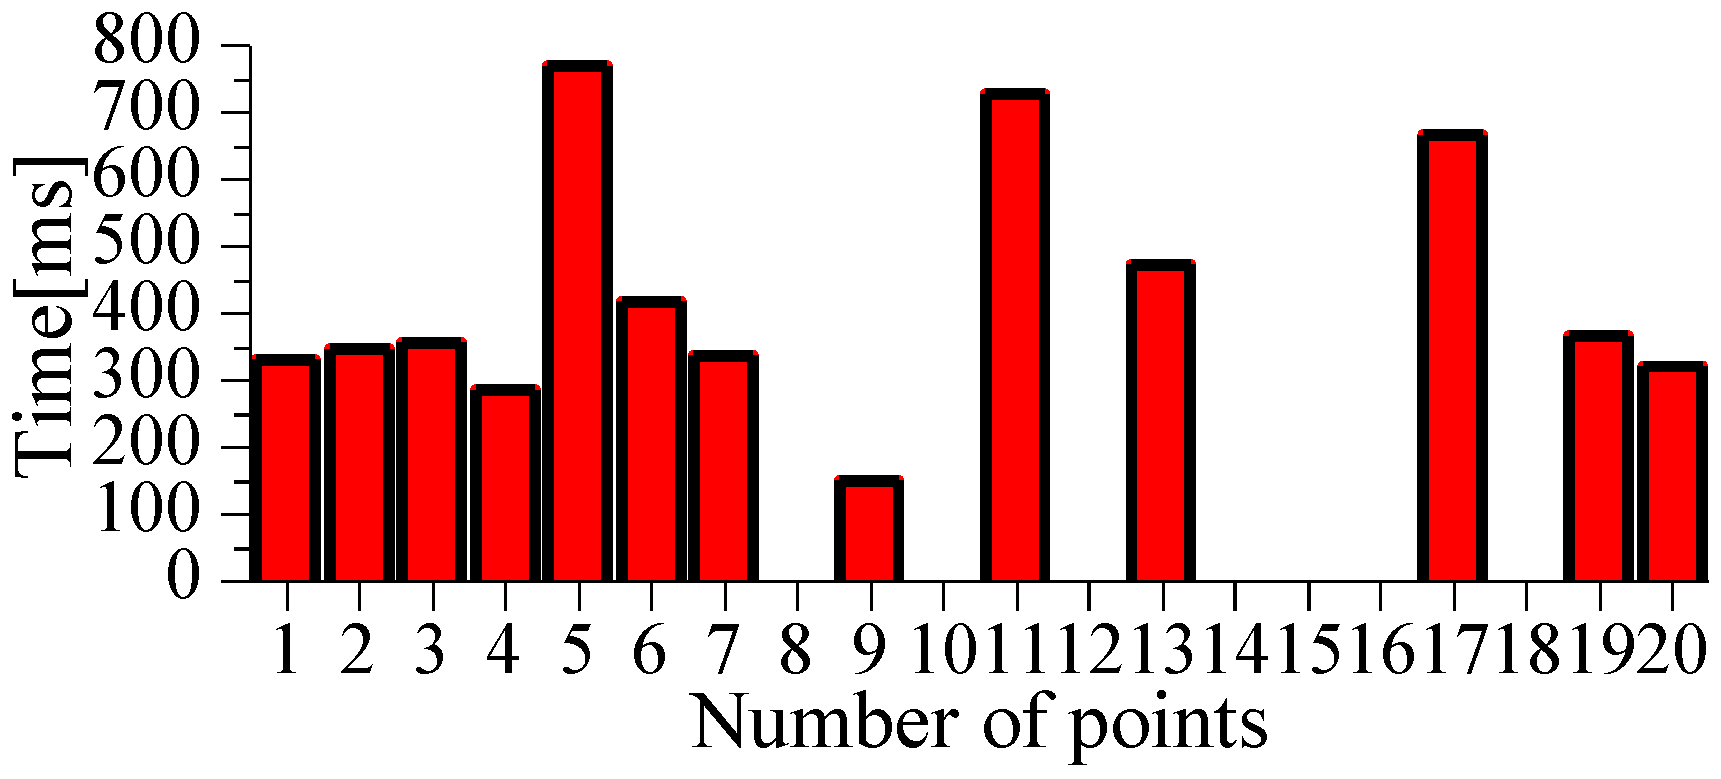
4.2.3. Communication Speed

Figure 11 shows the communication speed at each spot. Communication speeds were measured while the data was transmitted from an evacuation center to a control center at each spots. The images were transmitted and received at 300 ms intervals to prevent one image from splitting into two data sets. Many results concentrated around 300 ms regardless of the distance between the measured spot and the control center, and regardless of how many terminals the data went through. Interestingly, at three spots (Figure 11, numbers 5, 11, 17), results are around 700 ms. This means that first transmission or recipient failed, so the data was transmitted a second time. Thus, the resulting communication time increased to approximately 300 × 2 (ms).
Figure 11. Experimental results of the communication speed tests.
Ijgi 04 02004 g011

4.2.4. Sending and Receiving Geographical Data Updates

Figure 12 shows the process of a geographical information update (image update) with a PC in an evacuation center. ① in Figure 12 is sent by an investigator to the control center after a disaster, and ② in Figure 12 is a stored image obtained before a disaster at an evacuation center. ③ in Figure 12 in the evacuation center is update from ② to ① only around the investigators GPS location. ④ in Figure 12 shows the result of prediction of radio wave propagation based on the old pre-disaster map and ⑤ in Figure 12 shows the result of it based on the updated post-disaster map. Using only the geographical information around an investigator significantly reduces the size of the transmitted data; moreover, the investigators know where to go to communicate based on the updated coverage prediction, so they can easily receive and transmit disaster-related information.
Figure 12. Experimental results of sending and receiving geographical data updates.
Ijgi 04 02004 g012

5. Conclusions

In this article, we described and evaluated a ZigBee wireless communication system that can be used to quickly gather information and to coordinate efforts when existing communication networks are become unavailable.
We proposed the GIM-format for geographical information and compared it with other image-compression methods. The size of GIM-format compressed images is approximately half of those generated by the other formats (except for the PIC-format). In particular, when the images have many large areas of identical colors (as it is the case of geographical data), the compression is very effective. In addition, we showed that the file size can be reduced further by limiting the image dimensions to the area of interest around the investigator’s GPS location.
Through extensive experiments in Tsukuba City, we confirmed that our proposed disaster communication system can be used to gather disaster-related information and to send that data to the control center, which can then update the map for all investigators.
In addition, the experiment of transmitting and receiving map-data proved that the method is effective for the low-speed communication network of ZigBee terminals.
To conclude, the proposed disaster control system can be an alternative communication infrastructure when existing infrastructure is damaged by a major disaster. The system is easy to use even for laypeople, which enables the affected people to assist the professional organizations in their emergency relief efforts.

Acknowledgments

The authors would like to thank the reviewers and the editors for their comprehensive feedback, which helped to improve the quality of the article.

Author Contributions

All authors collaborated on this article in different ways that range from the inception of the idea, to the implementation of the tool, the conduct of the study, and the editing of the article. All authors contributed enough to warrant their coauthorship.

Conflicts of Interest

The authors declare no conflict of interest.

References

  1. Sugit, H.; Fukuta, T.; Tamura, T.; Yokoi, T.; Hara, T.; Kashima, T.; Azuhata, T.; Shibasaki, B.; Yagi, Y. IISEE-NET: Information network for earthquake disaster mitigation of developing countries. In Bulletin of the International Institute of Seismology and Earthquake Engineering; Building Research Institute: Ibaraki, Japan, 2003; pp. 137–143. [Google Scholar]
  2. Kawamura, Y.; Dewan, A.; Veenendaal, B.; Shibuya, T.; Hayashi, M.; Kitahara, I.; Nobuhara, H.; Ishii, K. Using GIS to develop a mobile communications network for disaster-damaged areas. Int. J. Digit. Earth 2014, 7, 279–293. [Google Scholar] [CrossRef]
  3. Kawamura, Y.; Ishii, K.; Jang, H.; Wagner, M.; Nobuhara, H.; Dewan, A.; Veenendaal, B.; Kitahara, I. Analysis of radio wave propagation in an urban environment and its application to initial disaster response support. J. Dis. Res. 2015, 10, 655–666. [Google Scholar]
  4. Nakahata, Y.; Kawamura, Y. Development of the landslide observation system using ZigBee. In Proceedings of the 2010 Society of Instrument and Control Engineers Annual Conference (SICE), Taipei, Taiwan, 18–21 August 2010; pp. 1191–1194.
  5. Ishii, K.; Kawamura, Y. Analysis of radio wave propagation in an urban environment and its application to initial disaster response support. In Proceedings of the 2010 Society of Instrument and Control Engineers Annual Conference (SICE), Taipei, Taiwan, 18–21 August 2010; pp. 1195–1198.
  6. Watanabe, N.; Uno, K. Utilization of sensor Web and spatial information platform as a supportive measure for field work monitoring. Rep. Inst. Sci. Tech. Res. 2011, 23, 62–66. [Google Scholar]
  7. Watanabe, K.; Ichikawa, T. A study of the information exchanging system for a person requiring care at the time of earthquake disaster. SIG Tech. Rep. 2006, 92, 25–29. [Google Scholar]
  8. Mohan, M.; George, N.; Davis, D. ZigBee technology for data communication—A comparative study with other wireless technologies. Int. J. Adv. Res. Comput. Sci. 2014, 5, 261–265. [Google Scholar]
  9. Baker, N. ZigBee and Bluetooth strengths and weaknesses for industrial applications. Comput. Contr. Engin. J. 2005, 16, 20–25. [Google Scholar] [CrossRef]
  10. Moridi, M.A.; Kawamura, Y.; Sharifzadeh, M.; Chanda, E.K.; Wagner, M.; Jang, H.; Okawa, H. Development of underground mine monitoring and communication system integrated ZigBee and GIS. Int. J. Min. Sci. Technol. 2015, in press. [Google Scholar] [CrossRef]
  11. Carlson, W.E. A Survey of Computer Graphics Image Encoding and Storage Formats. Comput. Graph. 1991, 25, 67–75. [Google Scholar] [CrossRef]

