1. Introduction
Worldwide accessibility to the Internet is a defining phenomenon of the present time that reshapes the world as we currently know it. A key component in this contribution is the social media that comes in many forms, including blogs, photo-sharing platforms, chat applications and last, but not least, Social Networks (SNs). The number of SN users is expected to reach 2.5 billion by 2018 [
1], which is around a third of the Earth’s entire population. “A social network can be defined as an abstract structure comprised of individuals connected by one or more types of relations such as friendships, common interests and shared knowledge” [
2]. With the advances of location acquisition and wireless communication technologies, another dimension has been added to the existing SNs, which is the location dimension, bridging the gap between the physical world and the social networking services. SNs got affected by this new dimension in two main ways:
Geo-enrichment of SNs, enabling users to share geo-tagged content in the form of check-ins, geo-tagged photos or notes.
There appeared a new breed of social networks called Location-Based Social Networks (LBSNs) where locations are the root elements of the network structure. Hence, a location can be a stand-alone entity of the network having relationships with other locations and users.
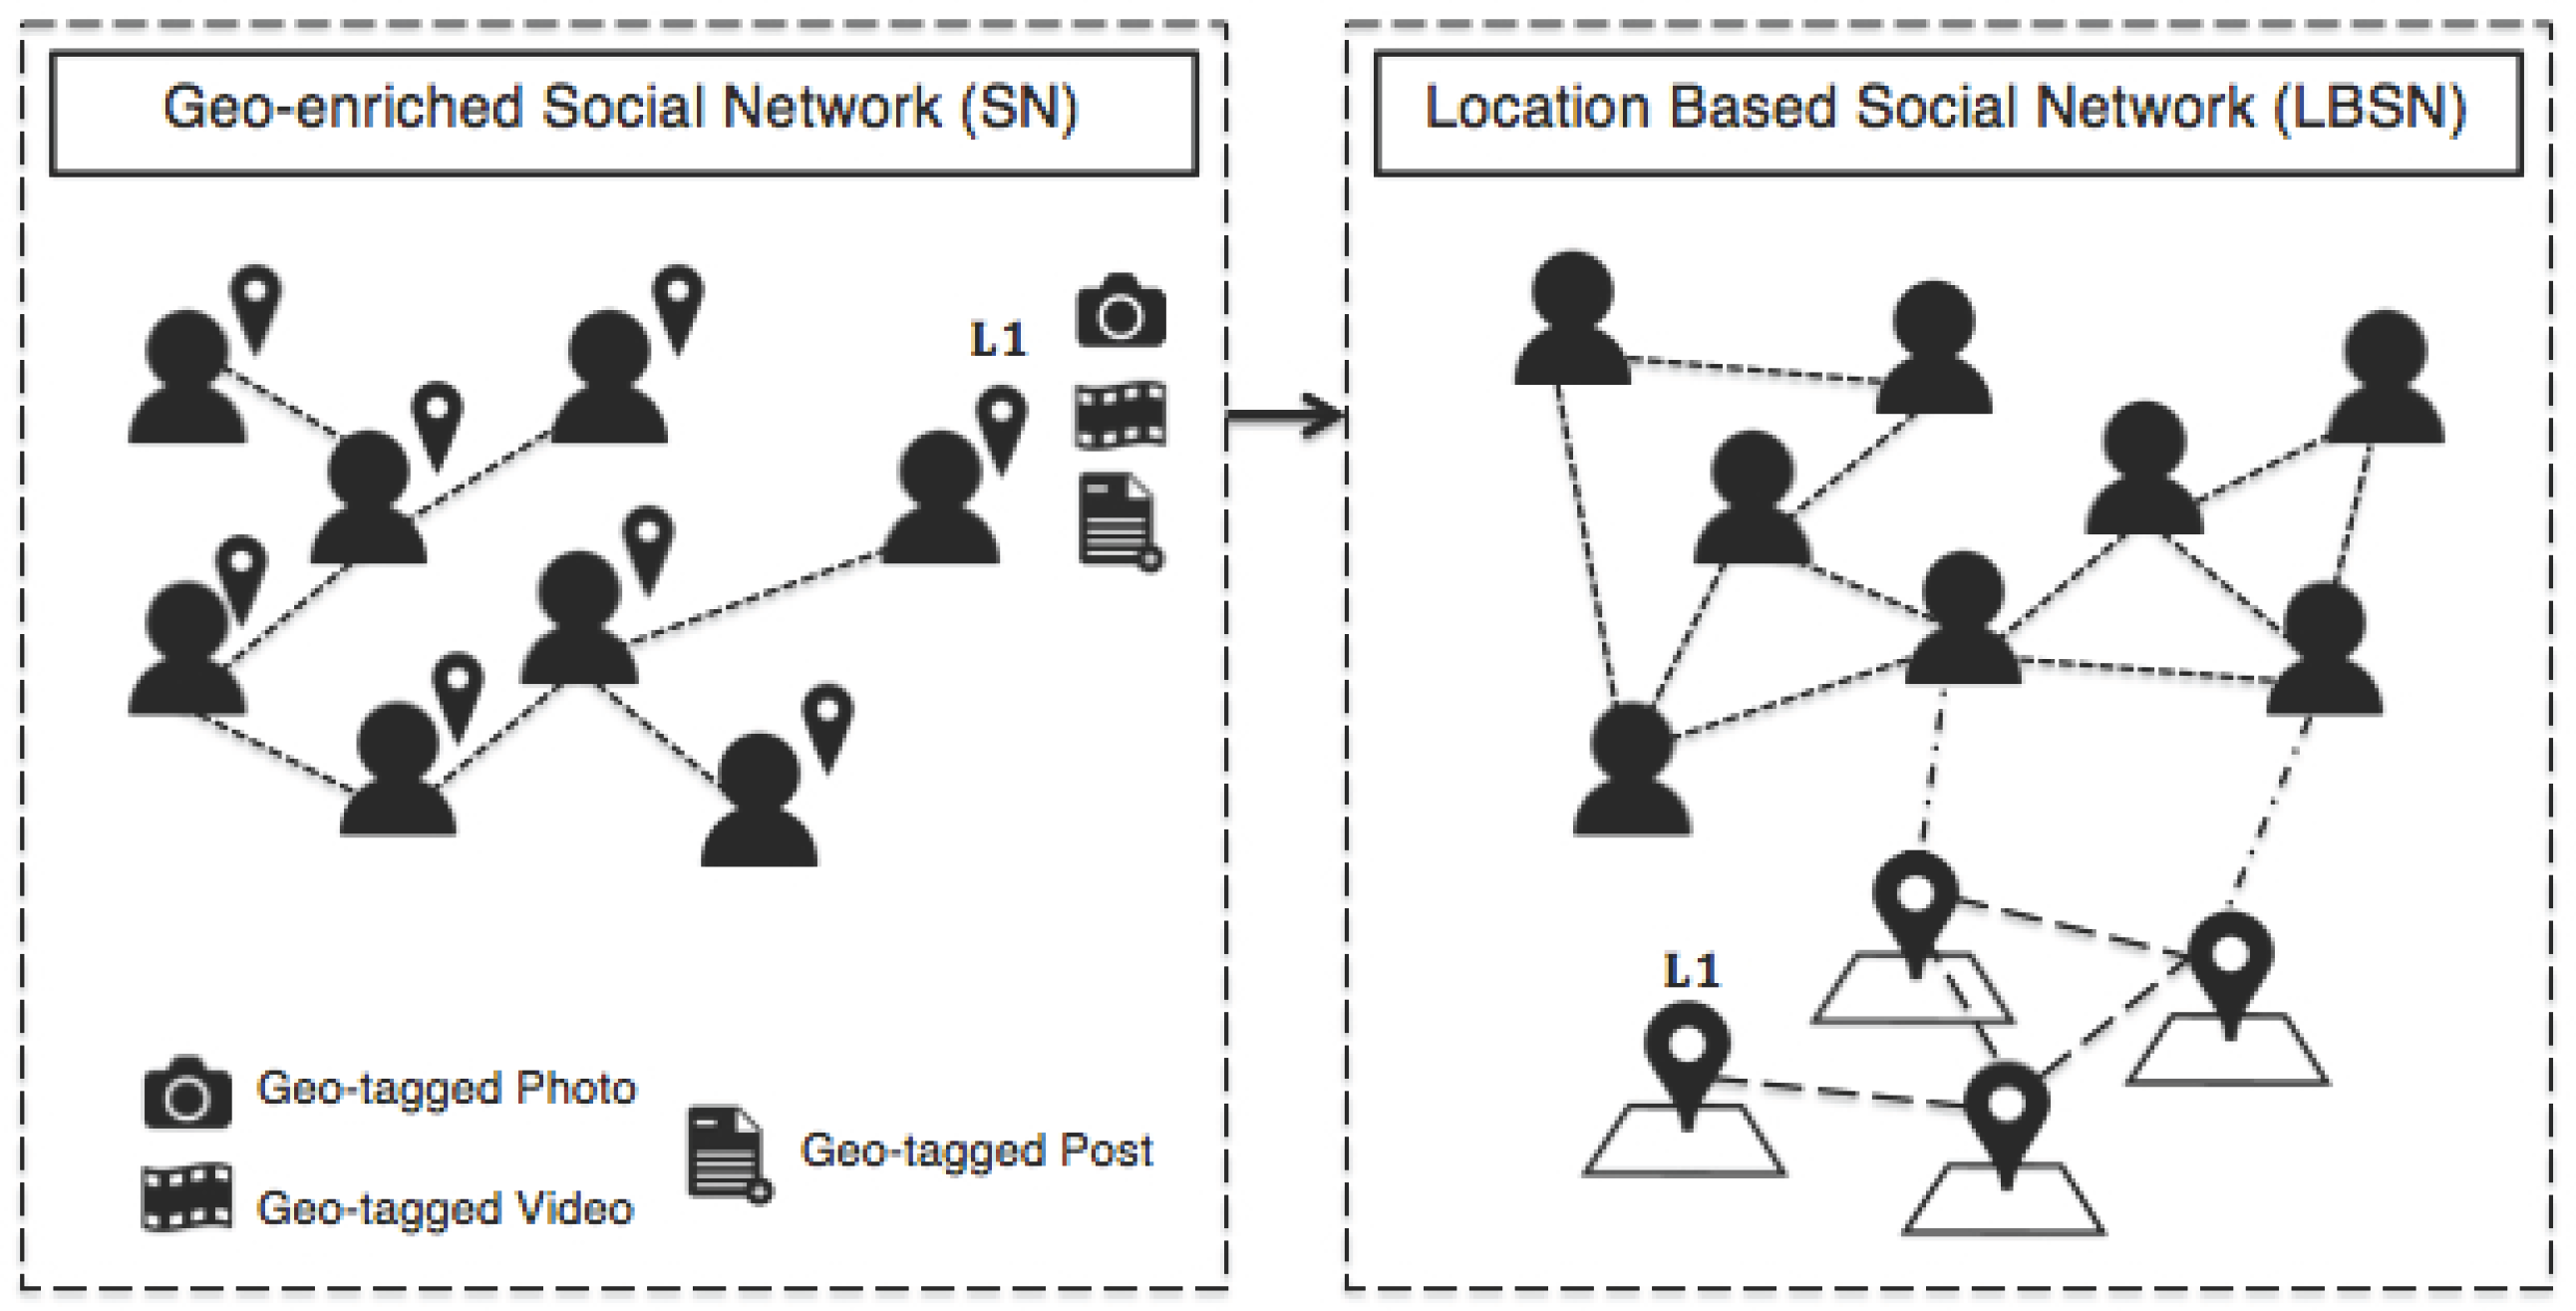
While SNs allow only users to be entities, LBSNs allow both users and locations. Consequently, the relationships in SNs are only user-user, whereas the relationships in LBSNs can be: user-user, user-location and location-location. In an SN, a user-user relationship is derived from a real-world connection between two users [
3] (e.g., friendship, co-worker, family). In LBSNs, a user-user relationship can additionally indicate a connection derived from the user locations (e.g., co-location, common interest, activities). In LBSNs, locations can relate to users (e.g., visit, work, study) and to other locations (e.g., neighborhood, containment, correlation). Because locations are entities on their own in LBSNs, concepts like distance, hierarchical containment and sequential ordering are considered as distinguishable features of LBSNs; which place them apart from SNs. A clear distinction between those two types of social networks is illustrated in
Figure 1.
While LBSNs are richer than SNs in terms of the network structure and the range of functionality that can be provided, LBSNs failed to attract as many users as SNs. Based on the literature in [
4,
5,
6,
7,
8], we created
Figure 2, which compares the growth rate of Instagram, the fastest growing SN, with Foursquare, the fastest growing LBSN. According to [
9] in 2012, while Instagram has added 10 million users in 10 days, Foursquare added 15 million users in a year.
A main reason behind this gap is because SNs are designed to provide value not only for active users, but also for passive users (i.e., users who do not often generate content or engage with their network, but instead, act as observers). For example, according to [
10], only 42% of Facebook users are active users who engage with their network and contribute with content, while the remaining 58% are passive users. The main services of LBSNs (e.g., Foursquare) are broadcasting user locations to their network and recommending places based on proximity and query match. The value of these services depends on the engagement of the user, either through input in the form of venue tips and ratings or having enough friends to share location updates.
On the one hand, SNs have more users and more content than LBSNs. However, on the other hand, LBSNs, due to their inherent spatial capabilities, have a larger capacity to understand the users and their context, allowing for a wider range of applications. Furthermore, LBSNs have a better understanding of user preferences, behaviors, interesting locations, travel sequences, event detection, etc. In this paper, our research was motivated by three main findings:
SNs, due to the large user base, have vast amounts of geo-tagged content, which is under-utilized because of the lack of spatial processing capabilities. Precisely, geo-tagged media in photo-sharing SNs (e.g., Instagram) are always associated with tag annotations by which, if exploited, the location content will be enriched significantly. They also provide what can be called “collective wisdom”, i.e., identifying interesting items/activities at a location based on people’s previous experiences at that location.
LBSNs, despite their spatial processing capabilities, fail to attract a large user base, because they provide less value for passive users. They also rely heavily on user profiles, user location history and user trajectories to provide recommendations, adding to the severity of the cold start problem. Therefore, the quality of personalized recommendations is not reliant on the technology alone, but also on user activities and properties.
In all previous related works, factors affecting personalized location recommendation are limited to user demographics, location proximity, user mobility and location history. However, a specific user interest at any point of time was not addressed before. For example, a user wants a list of restaurants serving the best burger in town on the condition that they are within a specified geo-range. To fulfill this request, the user profile and user location history will not be as important as identifying which restaurants serve the best burger. In other words, it is not only about ranking locations, but also about ranking interesting items/activities in locations.
Therefore, we propose joining SNs with LBSNs in a way that uses the advantages of both. In this way, we will enrich the LBSNs’ content with the geo-tagged content of SNs, which will allow the following benefits: (1) the utilization of the geo-tagged content of SNs will be maximized when it is made available to LBSNs, because of their spatial processing capabilities; (2) based on this enriched content in LBSNs, personalized interest-aware recommendation can be offered for both active and passive users. Thus, it will attract the pool of passive users that can still capture value from LBSNs with minimal behavioral changes and contribution.
In this paper, we illustrate and examine these benefits by proposing a novel Interest-Aware Location-Based Recommender (IALBR). This recommender is built upon an LBSN and uses geo-tagged content generated from an SN. This paper’s contributions can be summarized as follows:
Linking SNs and LBSN for interest-aware recommendation: joining geo-tagged media annotations in SNs to their corresponding locations in LBSNs.
Interest-aware recommendation and scoring: the IALBR supports recommendations (e.g., restaurants) matching a very specific user interest (e.g., French fries). This recommendation is done based on a new scoring methodology that takes into consideration both the popularity of an interest in the location and the popularity of the location.
The rest of this paper is organized as follows:
Section 2 summarizes the related work.
Section 3 gives an overview of the proposed IALBR system while showcasing the underlying architecture, data model and system modules.
Section 4 demonstrates the application scenario.
Section 5 evaluates the proposed IALBR along with the associated experiments and results conducted to examine the proposed system.
Section 6 contains a further discussion, and
Section 7 concludes the paper and presents the future work.
2. Related Work
Based on the framework proposed in [
2], there are four types of recommenders in LBSNs: (1) the location recommender, which suggests stand-alone locations (e.g., Points of Interests (POIs)) or sequential locations (e.g., travel routes); (2) the user recommender, which suggests expert users, potential friends or communities; (3) the activity recommender, which suggests activities that could be of interest to the user; (4) the social media recommender, which suggests social media content. The scope of this research falls in the first type, location recommender. Within this type, the proposed framework in [
2] categorized the related works based on the data sources used, as follows: (1) user profile-based; (2) user location history-based; (3) user trajectory-based; and we added to this categorization the (4) location information-based and the (5) hybrid recommenders.
User profile-based: These are recommenders that suggest locations by matching location semantics or metadata with user profiles. For example, [
11] matches user profile data (e.g., gender, income and age) with the price and category of a restaurant using a Bayesian network model. Others took into consideration the proximity of the candidate location [
12] or supported low-end devices [
13] by focusing on using the user address and social affinity. In [
14,
15,
16], the authors tried to explore spatial and temporal relations between locations within trajectories by extracting features and identifying correlations and sub-sequences related to the user’s preferred activities.
User location history-based: These are recommenders that use user location history either through the ratings they give to locations they visited or through their check-in history. For example [
17,
18,
19,
20,
21,
22] provided personalized recommendations for locations taking into account other user’s rating using Collaborative Filtering (CF) models. Hence, this improved the quality of recommendation by ignoring poorly-reviewed locations that could match a user profile in the user profile-based recommenders. The CF-based recommendation was done by first identifying similar users, using their rating history, and then selecting a subset of candidate locations based on the user’s location and, finally, predicting the rating a user would give to this location. The work in [
23] also developed a random walk-based model that recommended new venues by learning from both social ties and check-ins simultaneously. Furthermore, the authors in [
24] used check-in data to model the probability of a user’s check-in on a location as a Multi-center Gaussian Model (MGM). This was done through fusing matrix factorization with geographical and social influence. The authors in [
25] also leveraged check-in data for location recommendation through using weighted matrix factorization that incorporates spatial clustering. Recently, [
26] introduced a personalized location recommendation approach that is based on identifying correlations between POIs through capitalizing on historical check-in data of users.
User trajectory-based: These are recommenders that estimate user preferences based on the sequence of visited locations, the path traveled and the stay time at locations. Example systems include [
27,
28,
29,
30,
31,
32,
33], which proposed recommendation frameworks, which suggest interesting locations by mining GPS trajectory data. The authors in [
34] proposed GTAG, a time-aware location recommender that took into account both geographic and temporal influences through exploiting large volumes of user spatiotemporal trajectory data. Recently, [
26] developed a new model for location recommendation called LOREthat extracted sequential patterns from the historical check-in data of all users to use them in predicting the location that users might be interested in visiting.
Location information-based: These are recommenders that recommend POIs based on location information represented in POI properties (e.g., spatial location), user-generated content (e.g., tips), user geo-tagged media, etc. Among those recommenders is ORec [
35], an opinion-based recommendation framework that recommends POIs based on user opinions found in venue tips. In [
36], the authors used Implicit-feedback Content-aware Collaborative Filtering (ICFF) for location recommendation to incorporate semantic content (e.g., geo-tagged tweets) without negative sampling (i.e., user’s negative preferences). Furthermore, the authors in [
37] proposed Geo-SAGE, a geographical sparse additive generative model for POI recommendation, which exploited and the integrated geographical and social influence, temporal effect and content information of POIs for recommendation. Furthermore, [
38,
39] proposed systems that exploit geo-tagged media on photo-sharing applications to identify semantically meaningful tourist locations. They applied collaborative filtering to obtain tourist’s preferences in one city, from their public geo-tagged photos, and used it for personalized travel recommendation in another city.
Hybrid: These are recommenders that integrate the above categories of data sources for location recommendation. For example, the authors in [
40] used a probabilistic factor model that takes into account user preferences by counting user check-ins (user location history), geographical influence (location information) and user mobility behaviors (user trajectory) to provide personalized recommendation of places. The authors in [
41] developed a recommendation framework that capitalized on POI information, represented as location properties, user interests and sentiment detection, to improve POI recommendation in LBSNs. Another example can be found in [
42], which proposed a recommender system that mines large-scale sets of geo-tagged media (location information) to identify the most popular landmarks, as well as the best travel routing between the landmarks (user trajectory) to be used for road-based travel recommendation. A similar, but more personalized framework was proposed in [
43] where large-scale sets of photographer geo-tagged media (location information) were mined to identify routes (user trajectory) across interesting landmarks, using them to develop probabilistic photographer behavior models for personalized travel route recommendation.
Our proposed LBSN recommender falls under the location information-based category and differs from the related works in two ways: (1) exploiting geo-tagged media: to the best of our knowledge, the proposed approach is the first to leverage the huge amount of geo-tagged content existing in photo-sharing SNs to extract the most popular items existing in a specific location to be used for location recommendation in LBSNs; (2) interest granularity: the other recommenders are either too generic, having recommendations based on public opinions on locations or travel routes extracted from GPS trajectories in a city, regardless of location categories (i.e., restaurants, parks, shopping malls, etc.); or less generic (more personalized); or recommenders that filter candidate locations based on categories (i.e., restaurants). However, none of them considered specific interest-based recommendation (e.g., the user wants to eat a burger instead of just going to a nearby restaurant). Furthermore, the proposed recommender supports high-level and generic queries (e.g., bakery) and low-level queries (e.g., cheesecake) within a user-specified geo-spatial range.
3. IALBR System Design
This section first introduces the architecture of the IALBR system, then it presents the used data model, followed by a formal description of the IALBR system modules. The main concept behind the IALBR, which is built upon LBSNs, is that venues in LBSNs get enriched with the corresponding geo-tagged content from SNs. In other words, we join the venue information in both LBSN and SN. As a result, we create a dataset that is rich in tags and tips about venues. This dataset is then used as the basis for user interest queries. We also propose a novel scoring method for ranking the query results.
3.1. System Architecture
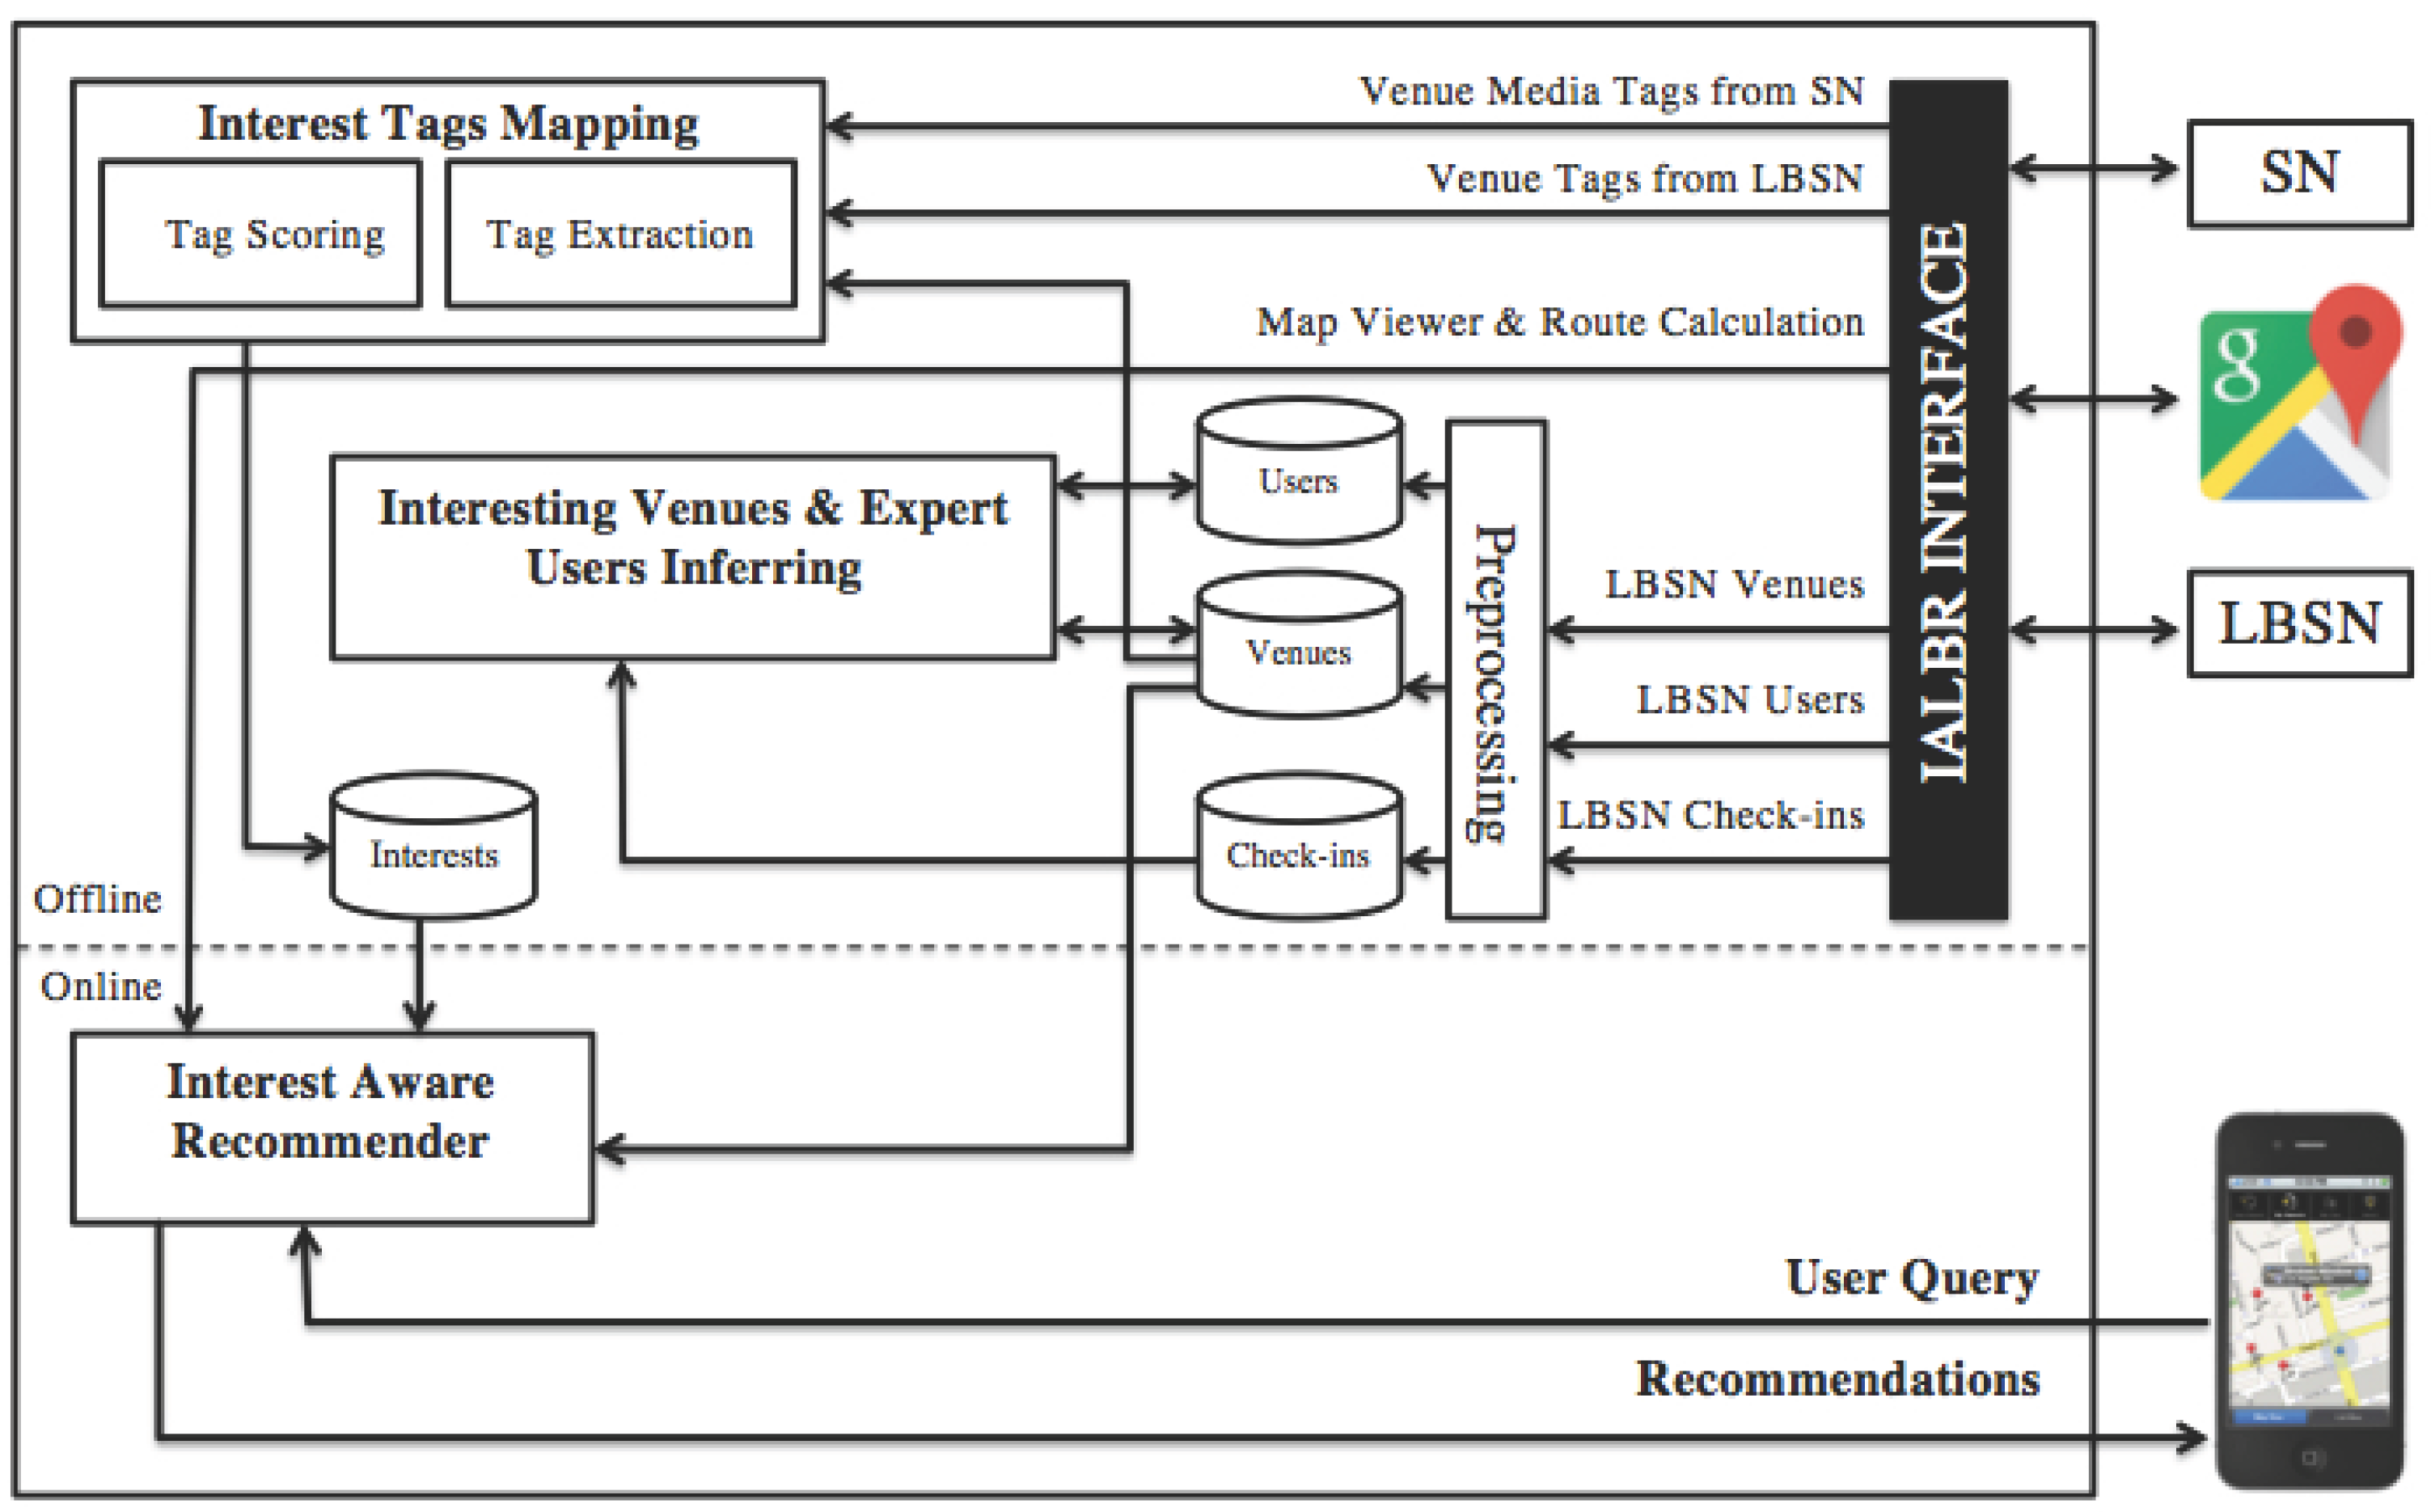
IALBR is composed of three main modules: (1) interest tags mapping module; (2) interesting venues and expert user inferring module; and (3) interest-aware recommender module. It is also composed of several data stores containing data about users, venues, interests and check-ins. IALBR is designed to be an extension to existing LBSNs that will be joined to SNs to enrich their venue information. It provides a recommender that complements the location-based services of existing LBSNs by making them more interest aware through capitalizing on the richness of the geo-tagged content in SNs. Furthermore, the addition of the interest tags dimension to the current LBSN user and location dimension creates a new horizon of applications that support diverse levels of preference granularity.
Figure 3 depicts the generic architecture of IALBR.
The way of joining the venue information in both SN and LBSN varies according to the used SN and LBSN. Several criteria can be employed to improve the join accuracy (e.g., spatial proximity, name similarity, tag similarity, etc). Some existing SNs and LBSNs maintain common keys for venues. Instagram and Foursquare, for instance, maintain such keys. In this work, we used them to illustrate and implement our system. The IALBR activities can be summarized into two main groups:
Offline modeling: This starts by crawling Instagram geo-tagged media corresponding to Foursquare venues using Instagram API functions and venue unique keys, common to Foursquare and Instagram. It then extracts the geo-tagged media tags representing interests in order to calculate interest scores based on the frequency of occurrence of those tags. It also extracts the interest tags annotating this venue on Foursquare. Finally, an average-weighted score is calculated for each interest tag based on its frequency of occurrence in both the LBSN and the SN.
Figure 4 shows geo-tagged media extracted from a venue called “Teds” on Instagram. Each photo contains tags annotating it. In this example, the interest tags resembling these photos are: #strawberry, #mojito, #moltencake, #chocolatesouffle, #macncheese, #macroni and #cheese.
Another important offline process is done at the interesting venues and expert user inferring module, where users get hub scores and venues get authority scores using check-in information. A user having a high hub score is a user who visits many interesting venues (i.e., venues having high authority scores), and a venue having a high authority score is a venue visited by many expert users (i.e., users having high hub scores).
Online recommendation: This starts when the IALBR receives a user query asking for venues matching an interest (e.g., burger) within a specific geo-range (e.g., 10 km). A power score p is calculated for venues matching this interest and are within the predetermined geo-range. This power score is calculated based on the interest tag score resulting from the interest tags mapping module and the venue’s authority score resulting from the interesting venues and expert user inferring module. Finally, it returns back a ranked list of venue recommendations.
3.2. Data Model
A venue in an LBSN (e.g., Foursquare) is described as:
This means that a venue
has a name
n, belongs to category
c, existing at a longitude
lon and a latitude
lat. We further enrich this venue entry by an authority score
indicating the popularity of this venue. This score is computed using the Hypertext-Induced Topic Search (HITS) method [
32]. An example of a venue would be presented as: (“Walter Foods”, “American Restaurant”, −73.95861, 40.71341, 5.89).
Similarly, let
U be the set containing all users of the same LBSN. A user can be modeled as follows:
where a user
has a name
n and home city
hc. We enrich the user entry by a calculated hub score
. This score is calculated using the method in [
32], as well. A higher hub score indicates that the user is experienced and that his/her tags are more trusted. An example of a user would be presented as: (“Thomas Rossi”, “Washington, DC”, 2.97).
Users in
U perform check-ins in venues
V. This check-in history is obtained from the LBSN. We group the check-ins by the user and represent the history of a user as:
meaning a user
has an ordered list of pairs
, where
is the venue and
is a time-stamp. An example of check-ins for a user would be presented as: (“Thomas Rossi”, < (“Amrit”, 17 January 2013 9:02:30), (“TUM”, 17 January 2013 9:05:51), (“Marineplatz”, 17 January 2013 9:05:51)>). Let
C be the set of such entries for all users in
U.
Finally, we compute the list of interests
τ. Let
τ be the set containing all interests extracted from the descriptive tags of geo-tagged media in a selected SN (e.g., Instagram) and extracted from the tags annotating all venues in the LBSN. An interest can be modeled as follows:
This means that an interest with the name is represented in the form of an ordered list of pairs , where each pair contains a venue and a score , which is the weight of the interest at venue calculated in the interest mapping module. An example would be (“Burger”, <(“Walter Foods”, 64), (“Burger King”, 58), (“ShaknShack”, 42)>).
3.3. Interest Tags Mapping Module
This module fills in the list τ by collecting data from both the LBSN and the SN. For all of the venues coming from the LBSN, it extracts the corresponding descriptive tags from both the SN and the LBSN. Every has both tags and tips in the LBSN. Tags are keywords that best describe the venue, in an LBSN. Tips (one of the most popular interaction mechanisms in LBSNs, like Yelp, Foursquare, whrrl, etc.) are user posts that correspond to the venue. This scoring method applies for both of them. Typically, LBSNs extract tags by analyzing the tips. In the SN, these descriptive tags exist in the form of annotations on geo-tagged social media content. We are only interested in the geo-tagged media that are related to the set of venues V, coming from the LBSN.
A pre-processing task has to be done to keep only the tags that reflect interests. For example, an Indian restaurant containing geo-tagged media tags like #foodie #love #favourite #indian #restaurant #beryani will be reduced to #indian #restaurant #beryani after the pre-processing. This might be done by removing non-indicative tags, like stop words, the name of the place, etc. These remaining tags are what we call interest in τ.
Following the pre-processing, we proceed by constructing the list for every interest. That is, we construct the list of venues fulfilling this interest along with scores that indicate how well the interest is met in this venue. This score s is a weighted average score that combines two scores and .
The score
calculated in Equation (1) indicates the popularity of the interest in a venue using only the LBSN’s tips, where
denotes tips corresponding to a venue
v, containing an
interest. For example, “I love this place” is not considered a tip in our scoring method, while “This place makes a great burger” will be counted as a tip indicating an
interest (burger). Thus, the final score will be a percentage of venue tips, which is coming from the LBSN and containing the given
interest.
The score
calculated in Equation (2) indicates the popularity of the interest in a venue using only the SN geo-tagged media, where
denotes geo-tagged media items corresponding to a venue
v having annotations containing an
interest. Therefore, the final score will be a percentage of venue geo-tagged media items, coming from the SN, containing the given
interest.
Finally, for every
in
τ, the average weighted score
of
in every venue
meeting this interest is calculated using Equation (3).
3.4. Interesting Places and Expert User Inferring Module
The Hypertext-Induced Topic Search (HITS) [
32] is used to infer interesting venues and experienced users.
Figure 5 illustrates the main idea of the HITS-based inference model. In this model, a user visit to a venue is regarded as a directed link from the user to that venue. Thus, a user is a hub if he/she has check-ins in many venues, and a venue is an authority if it has been checked-in by many users. Following that, a scoring algorithm is applied to the proposed model, which gives users and venues scores based on those edges. The assigned scores to each user and venue indicate the popularity of the venue and the travel experience of the user.
This interesting places and expert user inferring module of IALBR uses a HITS-based inference model [
32] to identify experienced users and interesting venues to support our interest-aware recommendation. Given the set
C containing the history of check-ins for all users
U, for every venue
, an authority score
is calculated. This score indicates how popular this venue is, based on the hub scores of the users who checked-in this venue. It also calculates for every user
a hub score
based on the authority scores of the venues visited by this user. Since there is a mutual reinforcement relationship between the hub users and the authority venues, they are both calculated using the power iteration method shown in Equations (4) and (5).
where
σ is the number of check-ins of user
in
and
λ is the number of check-ins of user
in
.
3.5. Interest-Aware Recommender Module
This module is responsible for receiving interest-aware location-based queries and returning back a ranked list of venues having matching interests. A user query can be modeled as follows:
An example of a user query would be presented as:
q = <Thomas Rossi, −6.98, 42, ”
Fries”, 1 mile>. The recommendations are made using our interest-aware recommender algorithm (i.e., demonstrated in Algorithm 1) having as data the set of all interests
τ calculated in the interest tags mapping module and the set of all venues
V enriched by the venue authority scores
calculated in the interesting places and expert user inferring module. It retrieves a ranked list of the venues meeting the user
interest and within the specified geo-range. Their ranking is based on the power score calculated in Equation (6).
where
is the average weighted score of an
at a venue
. Its value is less than one; while
is the authority score of venue
calculated using HITS. This way, the power score
p of an
will be a fraction of the total authority of the venue
, determined by the popularity of the
in it, i.e., the higher the value of
p, the higher is the popularity of the
in
.
| Algorithm 1: Interest aware recommender. |
| input : (1) User geographic location loc; (2) recommendation geo-range r; (3) user interest i |
| output:A sorted list L of venue recommendations. |
|
![Ijgi 05 00245 i001]() |
4. System Implementation
We implemented the proposed IALBR as an android mobile application on top of an LBSN (Foursquare) and joined it with an SN (Instagram) using their API functions. Foursquare has been chosen since it is the largest LBSN to date, while Instagram is the fastest growing SN having a huge user base contributing large amounts of geo-tagged media, which can be directly mapped to Foursquare’s venues. Additionally, user-generated geo-tagged media on Instagram support preference granularity; for example: when a user uploads a photo on Instagram while having dinner at an Indian restaurant, the tags associating this photo will be something like #biryani #indianfood #amrit #berlin, i.e., food item, food category, restaurant and city. Moreover, interest tags extracted from geo-tagged media are mostly positive tags, i.e., when a user uploads a photo of a food item they tried at a restaurant, it is because they like it. This conclusion is derived from [
44], a research study that examined the behavior of common users on Instagram. We are using PostgreSQL, since it has an advanced geo-spatial handling. Moreover, we integrated the application with Google Maps for the map view and direction features.
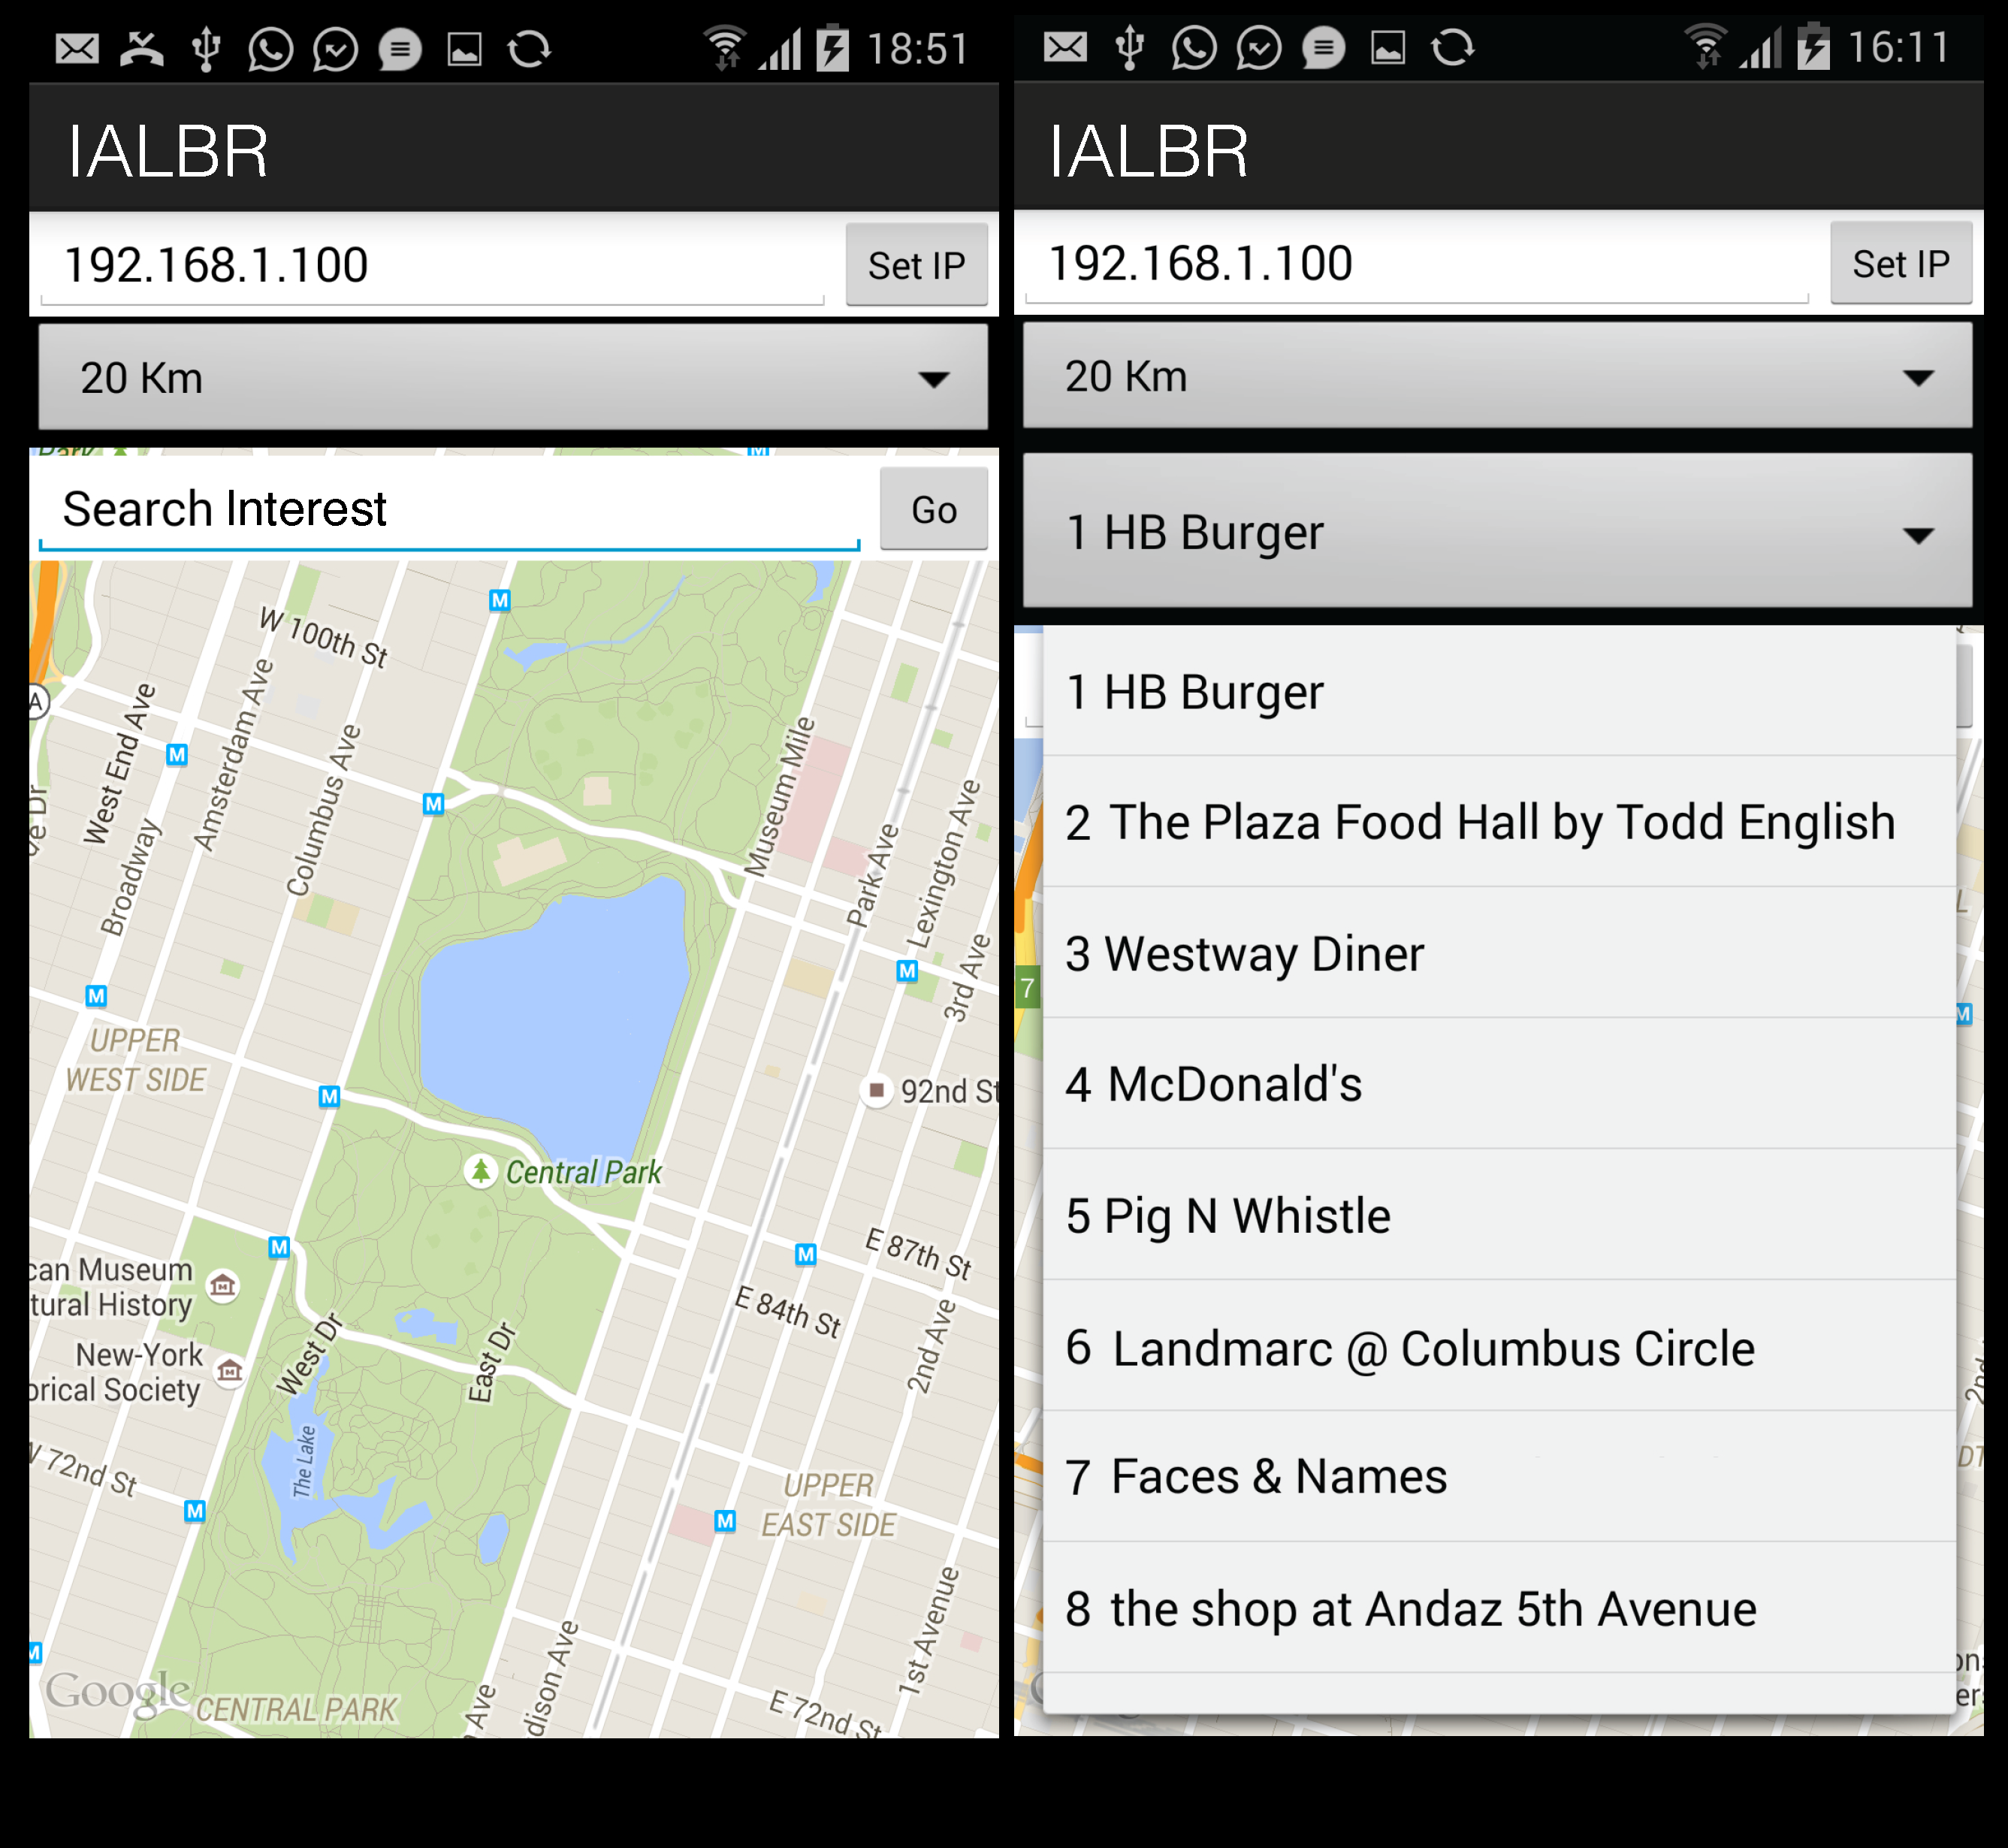
When the user logs into the application, the homepage shown in
Figure 6a appears to the user. The user types an interest in the “Search Interest” text field and selects a geo-range (in kilometers) for venue recommendations. For example, if a user selects the range “20 km” and “burger” as an interest and then clicks the “Go” button, the query is executed, and a number of venues matching the user’s interest appears, as shown in
Figure 6b.
7. Conclusions
This paper presents an Interest-Aware Location-Based Recommender system (IALBR), which uses geo-tagged social media content to provide venue recommendations to a user query at a specific position within a predetermined geo-range. The recommendations are based on the popularity of the query item in the venue and the popularity of this place calculated using the HITS-based inference model. This kind of recommendation supports high-level queries (e.g., bakery) and low-level queries (e.g., bagel). It leverages the huge amount of geo-tagged content existing in social media in order to extract the most frequent ones and uses them for location recommendation and interest matching. We evaluated our proposed system using multiple experiments based on data collected from Foursquare, having 35,023 venues, 10,377 tips and 392,247 check-ins generated from 17,463 users in NYC. For the venues in this dataset, we crawled 641,079 geo-tagged media items from Instagram to extract 217,511 tags representing interests associated with those venues. Foursquare and Instagram are meant to be examples for LBSNs and SNs, without loss of generality, because many other LBSNs and SNs share similar features. The main contribution of our approach lies in: (1) providing interest-based venue recommendations having the ability to respond to interests of different types (e.g., activity or food item) and of varying abstraction levels (e.g., generic food category or specific food item); (2) the information about venues in a given LBSN is enriched with geo-tagged content collected from a photo-sharing social network.
In terms of future work, we seek to handle complex queries (e.g., question answering, interest synonyms, etc.) as our implementation handles so far only one-word queries. We also intend to join LBSNs with SNs without being limited to pre-existing unique keys between the LBSN (Foursquare) and the SN (Instagram) for this join. This will significantly enrich the locations by including other geo-referenced information in other LBSNs that do not share same keys (e.g., flicker, twitter, etc.). Furthermore, we need to work on identifying the polarity (positive, neutral, negative) of the venue tips and geo-tagged media that contain the queried interest, before calculating the average weighted score of that interest at that venue. Another future research direction includes making the IALBR approach a self-learning approach, i.e., users will rate recommendations given by the system, and this rating will be used in interest scoring.


