Abstract
Delimitating trade areas is a major business concern. Today, mobile communication technologies make it possible to use social media data for this purpose. Few studies however, have focused on methods to extract suitable samples from social media data for trade area delimitation. In our case study, we divided Beijing into regular grid cells and extracted activity centers for each social media user. Ten sample sets were obtained by selecting users based on the retail agglomerations they visited and aggregating user activity centers to each grid cell. We calculated distance and visitation frequency attributes for each user and each grid cell. The distance value of a grid cell is the average distance of user activity centers in this grid cell to a retail agglomeration. The visitation frequency of a grid cell refers to the average count of visits to retail agglomerations by user activity centers for a cell. The calculated attribute values of 10 sets were input into a Huff model and the delimitated trade areas were evaluated. Results show that sets obtained by aggregating user activity centers have a better delimitating effect than sets obtained without aggregation. Differences in the distribution and intensity of trade areas also became apparent.
1. Introduction
Delimitating trade areas can help businesses understand market opportunities, the distribution of customers, and customer characteristics to devise more competitive business strategies. Thus, delimitating trade areas is a major concern of retail and service firms [1]. According to Huff, a trade area is “a geographically delineated region containing potential customers for whom there exists a probability greater than zero of their purchasing a given class of products or services offered for sale by a particular firm or by a particular agglomeration of firms” [2]. An empirical understanding of trade areas, therefore, is the foundation for strategic business intelligence and the premise behind location selection for new commercial facilities or catering services.
The traditional data source for delimitating trade areas is often customer information obtained from surveys. This information can include the place of residence and the visitation frequency for given commercial facilities. Respondent information collected from questionnaires is relatively complete and each respondent can be treated as a sample subject when delimitating trade areas. Managers can use these delimitated trade areas to locate new supermarkets with less uncertainty [3] and for accurate estimation of individual store sales [4]. Surveys are the most commonly used way of getting customer information, but they are labor-intensive and time-consuming [5]. In addition, response rates and number of respondents are relatively low [6]. Therefore, other data and other methods to understand and delimitate trade areas are needed. Social media might provide a solution.
Social media data open up promising new opportunities to better understand consumer behaviors and delimitate trade areas. These data are more easily obtained than survey data, reflecting the behaviors of a large number of users over relatively long periods rather than the behaviors of a small sample of consumers; serving as a proxy for the larger population. Social media data are limited however, because they cannot reflect completed user activities in the real world. We can only observe the activities that an individual shares on social media [7,8,9,10]. In this paper, we focus on developing new ways for delimitating trade areas using social media in ways that overcome the partial and incomplete qualities of this rich data source.
There is a growing body of research on social media data as applied to trade area analysis. Hu et al. [11] designed an experiment for trade area mining with check-in data obtained from social media services. The trade areas mined in this way were highly correlated to urban planning but were not appropriate for delimitating the trade area of a given store or retail agglomeration. Qu et al. [12] treated each individual Flicker user as a sample subject. Based on these data, they delimitated trade areas for different kinds of commercial facilities, without evaluation. Because the social media data does not reflect complete activities, it is not appropriate to treat each individual user as a sample subject when delimitating trade areas. To date, no existing studies have investigated how to extract samples from social media data that are suitable for delimitating trade areas. Our research addresses this problem and provides a practical solution for businesses in a cost effective way.
We propose an improved method to delimitate trade areas using social media data. In our approach, the density-based spatial clustering of applications with noise (DBSCAN) clustering algorithm was applied to extract the activity center for each Sina Weibo user. Then, 10 sample sets were grouped by selecting users based on the number of pre-defined areas they visited and aggregating these user activity centers to each grid cell. We calculated distance and visitation frequency attributes for each user and each grid cell. The distance value of a grid cell is the average distance of user activity centers in this grid cell to a retail agglomeration. Visitation frequency of a grid cell refers to the average count of visits to retail agglomerations by user activity centers for this cell. The distance and visitation frequency attributes of 10 sample sets were input in the Huff model, a traditional trade area delimitating method. The Root Mean Square Error (RMSE) and coefficient of determination (R2) were used to evaluate delimitated trade areas. Our results show that using spatial units to aggregate social media users improves the delimitation of trade areas. These results also reveal the size and intensity characteristics of different trade areas.
2. Background
2.1. Trade Area Delimitating Method
There is a variety of methods to delimitate and analyze trade areas. The main methods include the Ring model, Voronoi model, regression model, the analog method, and Huff model. These methods range from the simple such as the ring model, to the complex and sophisticated, such as Huff model. All methods need a large quantity of samples, except the Ring and Voronoi models.
Adapting Christaller’s central place theory [13], a concentric morphological model was proposed by Applebaum and Cohen [14] to delimitate a store’s trade area by drawing rings around the store location, with the store as the center point. A problem with this approach is that a trade area is often made of non-isotropic distributions of consumers that may distort the trade area pattern [15].
Voronoi methods provide a quick and simple way of defining trade areas, based on the mathematical concept of Thiessen polygons. A Thiessen polygon is a partitioning of a plane into regions based on distance to points in a specific subset of the plane [16]. The disadvantage of this method is the assumption that there are no influencing factors on trade area delimitation other than Euclidian distance.
The regression method seeks to measure a parameter of performance by correlating it to various socio-economic, environmental, and marketing variables [17]. Regression is not widely applied trade area delimitation since it requires many observations, and more explanatory variables must be included [18].
A popular empirical method based on previous experience for determining trade area borders is the analog method [19]. This method first plots the place of residence on the map. Then, different levels of trade area are defined according to the number of contained customers. The disadvantage of the analog method is that the delimitated trade area cannot reveal competitive relations between different commercial facilities [20].
The Huff model is one of the most common used methods for delimitating trade area [15]. This model assumes that the trade area is decided by two factors: (1) the distances between customers and the different commercial facilities; (2) the attractiveness of each facility [2]. The Huff model can be taken as:
where Pij is the probability of customers located in region i go to visit commercial facility or retail agglomeration j; Aj is the attractiveness of facility or retail agglomeration j; Dij is the distance between i and j, and α, λ are sensitive parameters of the attractiveness and distance, respectively. Huff first defined default α and λ as 1 and 2. Gautschi [21] as well as Eppli and Shilling [22] suggest that the sensitive parameters may be significantly overstated in previous Huff model research. Accordingly, parameter calibration is very necessary during applying Huff model to delimitate trade areas. The visitation possibilities, distances, and the attractiveness are the necessary attributes of each subject that is input to the Huff model.
Compared to other trade area methods, the influencing factors considered by the Huff model are relatively complete. A Huff model can delimitate a trade area with accuracy and reveal the competitive relation between facilities in detail. Therefore, in this paper, we used Huff model to delimitate trade areas.
2.2. Sina Weibo
Sina Weibo, established in 2009, is one of the largest social media services in China [23]. As of December 2012, active users can number 4.6 million daily with about 100 million messages posted every day [24]. Sina Weibo allows users to update brief content called “microblogs” in the form of short sentences, individual images, web page links, or video links. Similar to Twitter messages called “tweets”, Sina Weibo users can only post messages within a 140-Chinese-character limit. Sina Weibo functions are very similar to Twitter, such as retweets (RTs), mentioned (@), and hashtags (#) [25].
Sina Weibo allows users to check in at Points of Interest (POIs). These check-in data can be used to delimitate trade areas in the real world [12]. Check-in data are different from the shopping behavior of actual customers but are more easily obtained and can provide useful information about customer activities.
3. Data and Study Area
3.1. Data Collection and Pre-Processing
In order to obtain the Sina Weibo data related to the daily lives of people, we collected geo-tagged social media data with the Sina API and filtered out the noise. We applied the API named “place/nearby_timeline” provided by Sina Weibo to collect the geo-tagged data in Beijing. This API can obtain the Sina Weibo data located in circles with given centers and radiuses. The center can be located anywhere and the radius can be set to any value ranging from 2 to 11 kilometers. A series of circles of with radius of 10 kilometers were set to cover the core area of Beijing. By filtering out duplicates, we collected in total 16,682,330 geo-tagged Weibo messages posted between 1 January 2014 and 28 February 2015. Examples of the Weibo data are shown in Table 1. Each Weibo messsage contains several attributes: Weibo ID, user ID, the place of registration, the time of the Weibo posting, Weibo text, the coordinate of posting location, check-in POI ID, and name. Among these attributes, the place of registration refers to the city or district where a user lives but is not the exact location of their residence. The user place of residence must therefore be extracted from their Sina Weibo data.

Table 1.
Sina Weibo data samples.
The noise in Sina Weibo data was filtered out during pre-processing. Based on the experiences of a previous study [25], the noise was mainly advertisements posted in Sina Weibo and most of advertisements had particular symbols, such as “【】”. After the filtering process, 16,676,720 Weibo messages posted by 2,428,705 users were retained for further analysis.
3.2. Study Area
Beijing is the capital of China and ranks as the second largest metropolis in China in terms of area after Shanghai. Retail agglomerations formed in tandem with the overall economic development of these metropolitan areas. In our research, we used the largest five retail agglomerations in Beijing as test cases. The locations and distributions of these five Beijing retail agglomerations, collected in a field investigation, are shown in Figure 1. The boundaries of Zhongguancun (“Z”) are Zhongguangcun Street, Suzhou Street, the West Road of North Fourth Ring, and the South Road of Haidian. Xidan (“X”) is south of Xirongxian Hutong, and north of Lingjing Hutong, with Xidan North Street as the axis. Wangfujing (“W”) is the oldest retail agglomeration in Beijing. Based on Wangfujing Street, the Wangfujing retail agglomeration is south of Changan Street, north of Dengshi, east of Jingyu Hutong and west of Donganmeng Street. Chaowai (“C”) is west of the East Second Ring, east of the East Third Ring road, with Chaowai Street as the axis. Guomao (“G”) is the largest retail agglomeration in Beijing right now. It is located at the intersection of East Third Ring and Jianguomen Street. All retail agglomerations are in the east-west section of Beijing except Zhongguancun. Each agglomeration has connectivity and a relatively convenient traffic pattern.
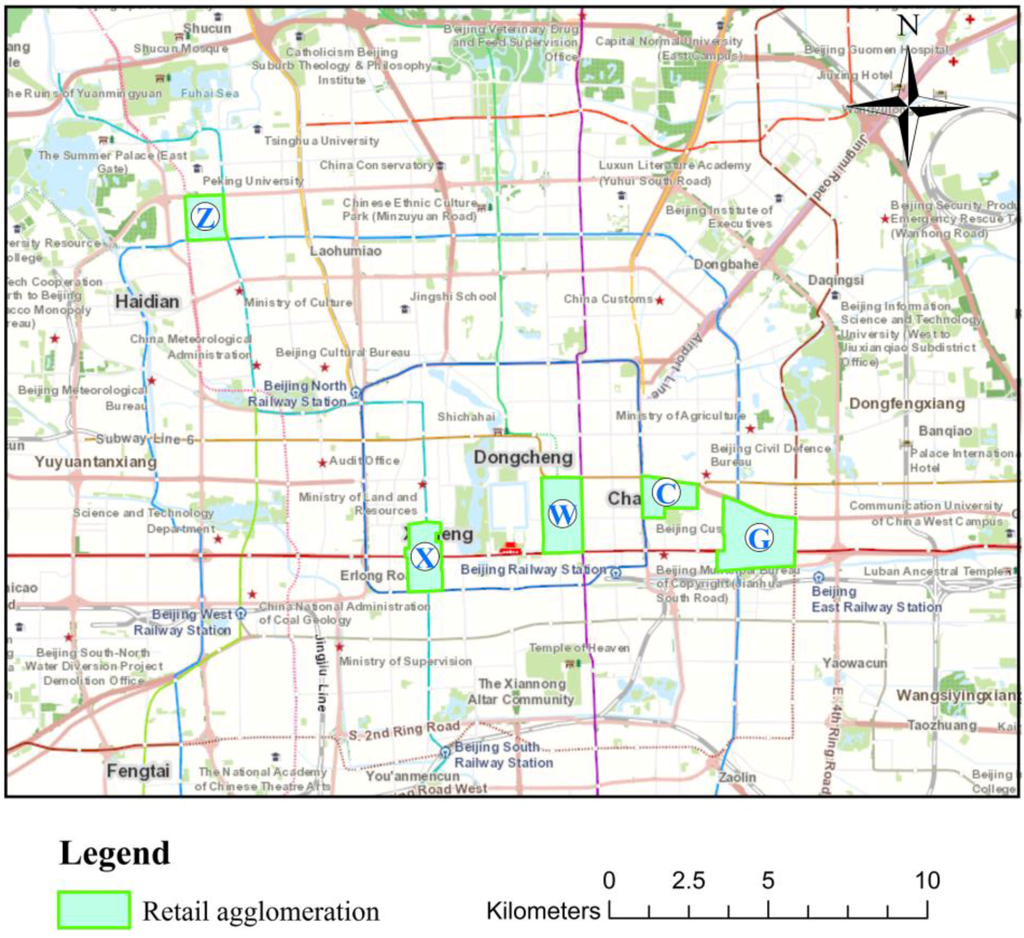
Figure 1.
The distribution of each retail agglomeration.
4. Methods
In this section, based on Huff model, we detail our tour method for extracting samples that can be fit for delimitating trade area from social media data. The tour framework is shown in Figure 2. First, we extract the social media users attracted by each retail agglomeration. Then, the DBSCAN clustering algorithm is applied to extract the activity center for each user. The term activity center refers to the mean center point of the geographical area where a user most frequently shows up [26]. We calculated visitation frequency, travel distance, and attractiveness for each retail agglomeration. Different sample sets were obtained by user selection and spatial aggregation. In the last step, we evaluated the delimitated trade areas with different sample sets.
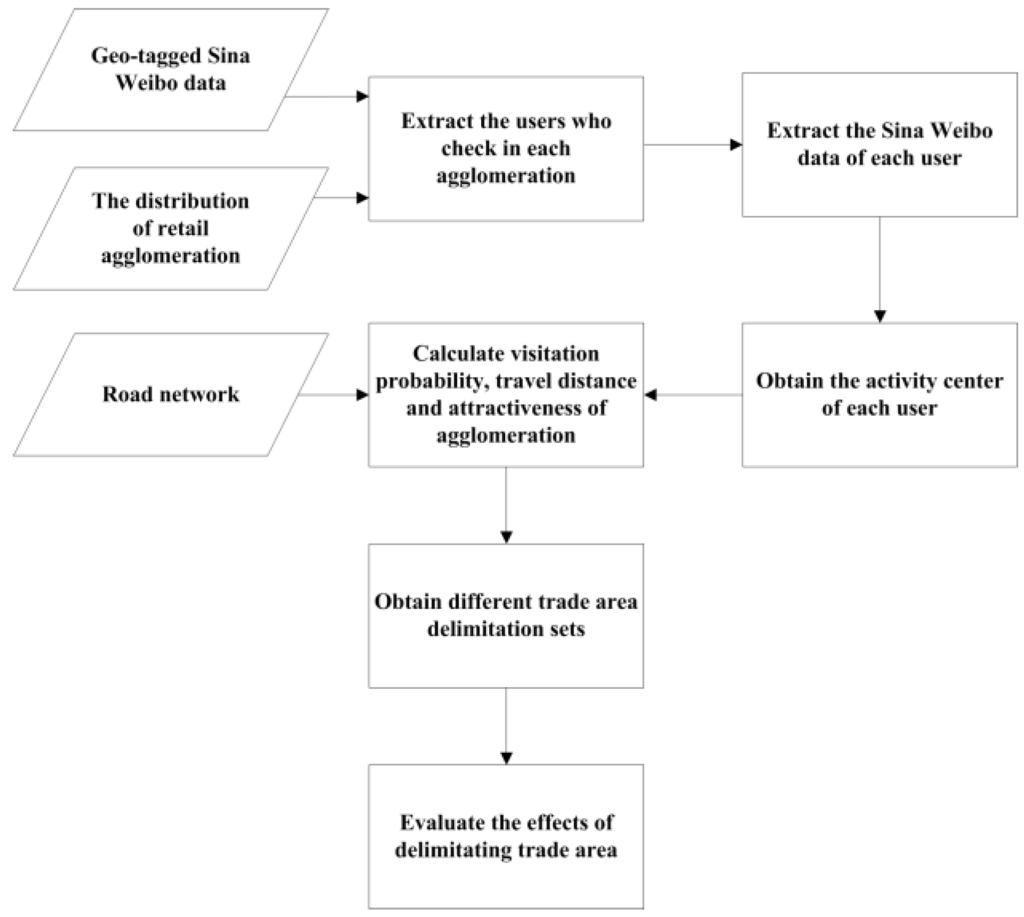
Figure 2.
The framework for obtaining samples fit for delimitating trade areas from social media data.
4.1. Extracting Attracted Users
Large facilities contribute the most to the attractiveness of a retail agglomeration [27]. Because most commercial facilities are open from 9:00 AM to 10:00 PM [28], we extracted users who checked in at these retail agglomerations during this time-period and designated them as attracted users. Overall, 87,215 attracted users were extracted from our data set and accounted for 3.6% of total users.
4.2. Extracting Activity Centers
In this section, we discuss how the DBSAN clustering algorithm was applied to extract activity centers from the tours of attracted users to replace the place of residence in traditional customer information.
In addition to place of residence, other places where users frequently show up include work, supermarkets, and libraries [29,30]. The geo-tagged Sina Weibo data from a user who shared his check-ins on Sina Weibo is shown as an example in Figure 3. There are three areas with high point densities; most of this user’s check-in points are found in these areas. By manually analyzing the Weibo texts in different areas, rich semantic information conveying the practical subjective meaning of these different areas to the user can be inferred: (1) there are many points overlapping at the same place in the area containing point A. The text of a Weibo on location A is “狂追猛跑追上一辆公交车…之后早到单位十分钟!” (After hurrying to catch a bus, I arrived at the workplace 10 minutes earlier!). This demonstrates that this area may be a workplace; (2) the text on location B is “袜子未免太好看了吧!买了15双…” (The socks are very good-looking! I have brought 15 pairs…). Therefore, the area containing point B maybe the user’s shopping and leisure place; (3) the area containing point C is the largest with the highest point density. The text on location C is “6点15出家门上班,9点半终于到家了,晚安。” (Leave home for work at 6:15 AM, and eventually back home at 9:30 PM. Tired, goodnight.). This indicates this area may be the user’s home.
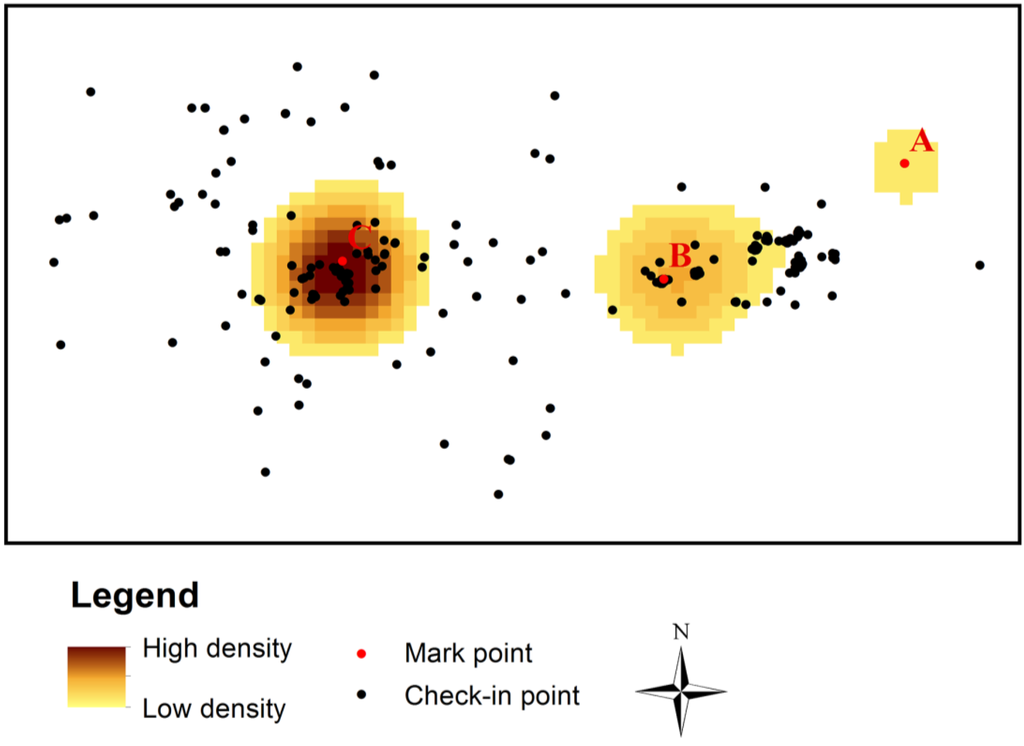
Figure 3.
The areas with high point density.
Traditional studies often use the place of residence to delimitate a trade area. Alternatively, a trade area based on areas frequently visited by customers is often used to support decision-making by business and urban planning agencies [12]. Frequently visited areas extracted for each user might permit a better understanding of consumer behaviors and thereby help businesses develop strategies to attract customers when they are located close to any one of the frequently visited areas.
Previous research has applied the DBSCAN algorithm to detect density clusters and extract activity centers for individuals from geo-tagged social media data [26,31]. Based on this research, we used DBSCAN to obtain each individual user’s frequently visited areas. For users with less than three areas, the point centroid of all areas was treated as the activity center. For users with more than three areas, the center of the top three active areas was extracted as the activity center. DBSCAN is a spatial clustering algorithm based on density proposed by Ester in 1996 [32]. Eps (search radius) and MinPts (the minimum number of points required to form a dense region) are two important parameters in this algorithm. DBSCAN has two advantages over many other clustering algorithms such as, K-means: (1) it does not require specification of the number of clusters in the data a priori, (2) and can find arbitrarily shaped clusters. Because of these advantages, DBSCAN is more suitable for extracting frequently visited areas. The module “sklearn.cluster” in the “scikit-learn” Python package was applied to cluster check-in points. Based on the previous work applying DBSCAN to cluster social media data [12], we set the Eps to one kilometer and MinPts to 10, separately, finding that 61.17% of users had no cluster. This is because many users had very few check-in points over a 14-month period, and these points did not form a cluster. The users with more than one cluster account for 15.36% of the users who had clusters. This indicates that there were a large number of users having more than one frequently visited area. Based on these clustering results, the activity centers were derived.
4.3. Calculating Observed Visitation Probability, Travel Distance, and Attractiveness of Retail Agglomeration
Observed visitation probability, travel distance, and attractiveness are necessary input values when applying a Huff model. In this section, we discuss methods to obtain these three values. All values were calculated using Python and were then loaded to Mathlab to execute the Huff model.
The number of check-in points in an agglomeration for each user was treated as the user visitation frequency by agglomeration. The observed visitation probability Pij of user i going to agglomeration j was calculated as:
where Aij is user i’s visitation frequency to agglomeration j and n is the number of agglomerations. Some users may check in many times during one visit to an agglomeration. To counter the influence of over aggressive check-ins, we removed duplicate check-ins in an agglomeration on the same day.
Based on the obtained activity center and road network in Beijing, we used the Dijkstra algorithm to calculate the shortest network distance between users and the centers of retail agglomerations as travel distances. The Dijkstra algorithm is an algorithm for finding the shortest paths between nodes in a graph [33]. In the real world, people actualize their social and economic activities on street networks [20]. Therefore, in contrast to the traditional Euclidian distance, network distance as calculated with the Dijkstra algorithm, can reflect the true distance that people travel when going to a target location or area [20].
In each retail agglomeration, most customers are attracted by large commercial facilities anchoring a retail area. Thus, the business areas of these large facilities can be treated as a proxy measure of the attractiveness of a retail agglomeration in general [27]. The sum of the areas of facilities with more 10,000 square meters was determined based on a field survey. This area value was used as an indicator of the attractiveness of the five retail agglomerations. The total area of each agglomeration is shown in Table 2.
Table 2.
The total area of each agglomeration.
4.4. Obtaining Different Trade Area Delimitation Sets
4.4.1. User Selection
A previous study revealed that different people have different behavior patterns [34]. To reveal differences in consumer behavior between social media users with different attributions, we selected users based on the number of retail agglomerations they visited. For each user, the number of visited agglomerations is her or his most important attribution. The fewer retail agglomerations a user visited, the more likely this user may prefer specific individual agglomerations. We counted the number of agglomerations they visited. The users visiting 1, 2, 3, and 4 agglomerations were filtered out. The combined values for visited agglomerations by each user are shown in Figure 4. Most users only visited one agglomeration. As the number of visited agglomerations increased, the number of users decreased. Each attracted user was treated as a sample subject and all users are treated as sample set 1. We selected the users visiting more than 1, 2, 3, and 4 agglomerations as sets 2, 3, 4, and 5, respectively.
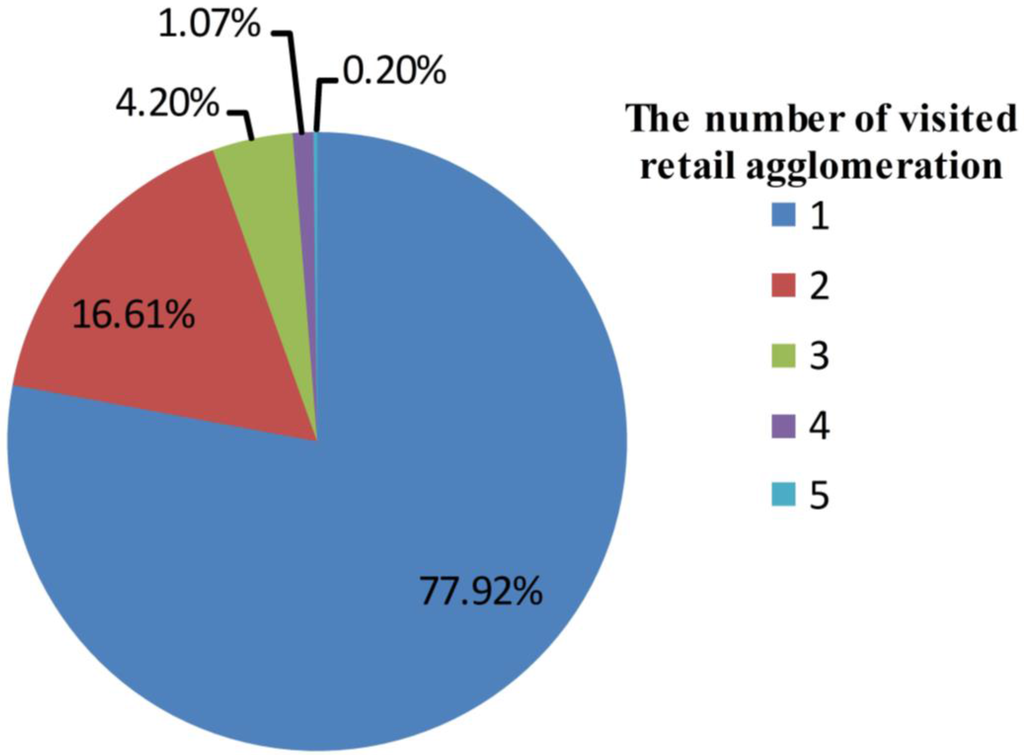
Figure 4.
The visited agglomerations for 87,215 Sina Weibo users.
4.4.2. Spatial Aggregation
We divided the study area into regular spatial units and aggregated user activity centers to each of these spatial units. The visitation probability, and travel distance of each spatial unit were averaged for users whose activity centers in a unit; these aggregated values were included as attributes of each unit [35]. The check-in points of each user are incomplete; this incompleteness could impact the delimitation of trade areas. Previous studies based on traditional surveys indicate that individual questionnaire respondents have a certain probability toward random visitation probabilities (the small number problem) and furthermore, these probabilities have an impact on delimitation of trade areas [35]. Spatial aggregation can ameliorate the influence of random probabilities and incomplete activities on trade area delimitation.
In this study, to avoid the bias caused by administrative divisions, we used regular 400 meter × 400 meter grid cells to divide Beijing into 18492 units following the work of Yue Yang [28]. In many of these units, the total visitation frequency to each retail agglomeration was relatively low. The lower the visitation frequency of a unit, the more likely that this unit was affected by random visitation probabilities [36]. Therefore, we filtered out grid cells with a total visitation frequency of less than 30, retaining 1827 grid cells for further analysis. These grid cells cover the core areas and the most active areas in Beijing. Each grid cell was treated as a sample subject. By aggregating all user activity centers to each grid cell, we obtained a set treated as sample set 6. We aggregated the activity centers of users visiting more than 1, 2, 3, 4 agglomerations to generate sets that were treated as set 7, 8, 9, 10, respectively.
4.5. Evaluation Method and Indices
Based on the Levenberg-Marquard algorithm in Mathlab, we evaluated the distance sensitive parameter (λ) and attractiveness sensitive parameter (α). The Levenberg-Marquard algorithm is an iterative method to solve model simulation problems [37]. The Root Mean Square Error (RMSE) and the coefficient of determination (R2) were used to reveal the differences between trade areas delimitated using different sample sets. RMSE measures the variance between estimated and observed values to evaluate the models. RMSE is calculated as follows:
where yi and xi are the observed and simulated visitation probability for each agglomeration, N is the number of sample subjects.
The coefficient of determination R2 describes the amount of variation in the dependent variable that can be explained by its association with the independent variable. R2 is calculated as follows:
where yi and xi are the observed and simulated visitation probability for each agglomeration; N is the number of sample subjects; and represent averages of the observed and simulated value, respectively; and σy and σx are the standard errors of the observed and simulated value, respectively. The acceptable value of R2 can vary depending on the type of comparisons being made, but ideally, R2 should be greater than 0.5 [38].
5. Results and Discussion
5.1. Comparing the Effects of Different Sets
By comparing the effects of different sets, we found that the sample set obtained using representing all user activity centers aggregated to spatial units delimitated trade areas better than the other sets tested. Furthermore, our comparative results indicate that the effects of different sets on trade area delimitation were visibly different from each other. The effects of different sample sets are shown in Table 3. The users visiting more than 1, 2, 3, 4 retail agglomerations was treated as gt1, 2, 3, 4, respectively.
Table 3.
The effects of different sample sets.
The sets without aggregated user activity centers were ineffective for trade area delimitation. As shown in Table 3, from set 1 to set 5, the highest value of R2 is only 0.25. This may be because in social media data, user check-in points do not reflect complete activities in the real world. By filtering out user activity centers in a step-by-step manner, the R2, RMSE, the distance sensitive parameter (λ), and attractiveness sensitive parameter (α) all decreased. This result indicates that the more agglomerations users visit, the less attention they pay to the travel distance or the attractiveness of an agglomeration.
Compared to the sets without aggregation, the sets obtained by aggregating user activity centers were more effective for delimitating trade areas. As shown in Table 3, the sample set (set 6) aggregating all users has the highest value of R2 (0.64). By filtering out users visiting 1, 2, 3, 4 retail agglomerations in a step-by-step manner, the R2 decreased and RMSE increased. This indicates that the delimitating effect cannot be improved by removing the users with relatively strong choice preferences. Similar to the sample sets without aggregation, sensitive parameters also decreased from set 6 to set 10.
The sensitivity parameters calibrated for these 10 sample sets are different from the default parameters (α = 1, λ = 2) used in previous studies. The effect of set 6 was the best, because the R2 of set 6 was the highest and RMSE was the lowest. The α and λ calibrated by this sample set were 1.84 and 1.44, respectively. In contrast to the default parameters used in previous studies, our attractiveness sensitive parameter was relatively higher and the distance parameter was lower. This may indicate that improvements in urban traffic conditions have made customers more sensitive to attractiveness and less sensitive to travel distance than in the past.
5.2. Trade Area Analysis
We applied the Huff model parameters calibrated by set 6 to delimitate the trade area. There are the sharp differences in the distribution and intensity of trade areas for the different retail agglomerations studied. The extent and direction of the trade area for each retail agglomeration is shown in Figure 5 while the overlap of these trade areas is shown in Figure 6. Among all agglomerations, the trade area for G is the largest. The trade area of G extends to the east along a major road and the western side of the trade area overlaps with other trade areas. This indicates that G only competes with other agglomerations in the west. The Z trade area is far from other agglomerations but the southeastern part of the Z trade area overlaps with other areas. The trade area of C is the smallest. This is because the attractiveness of C is relatively low and C is close to other agglomerations with higher attractiveness.
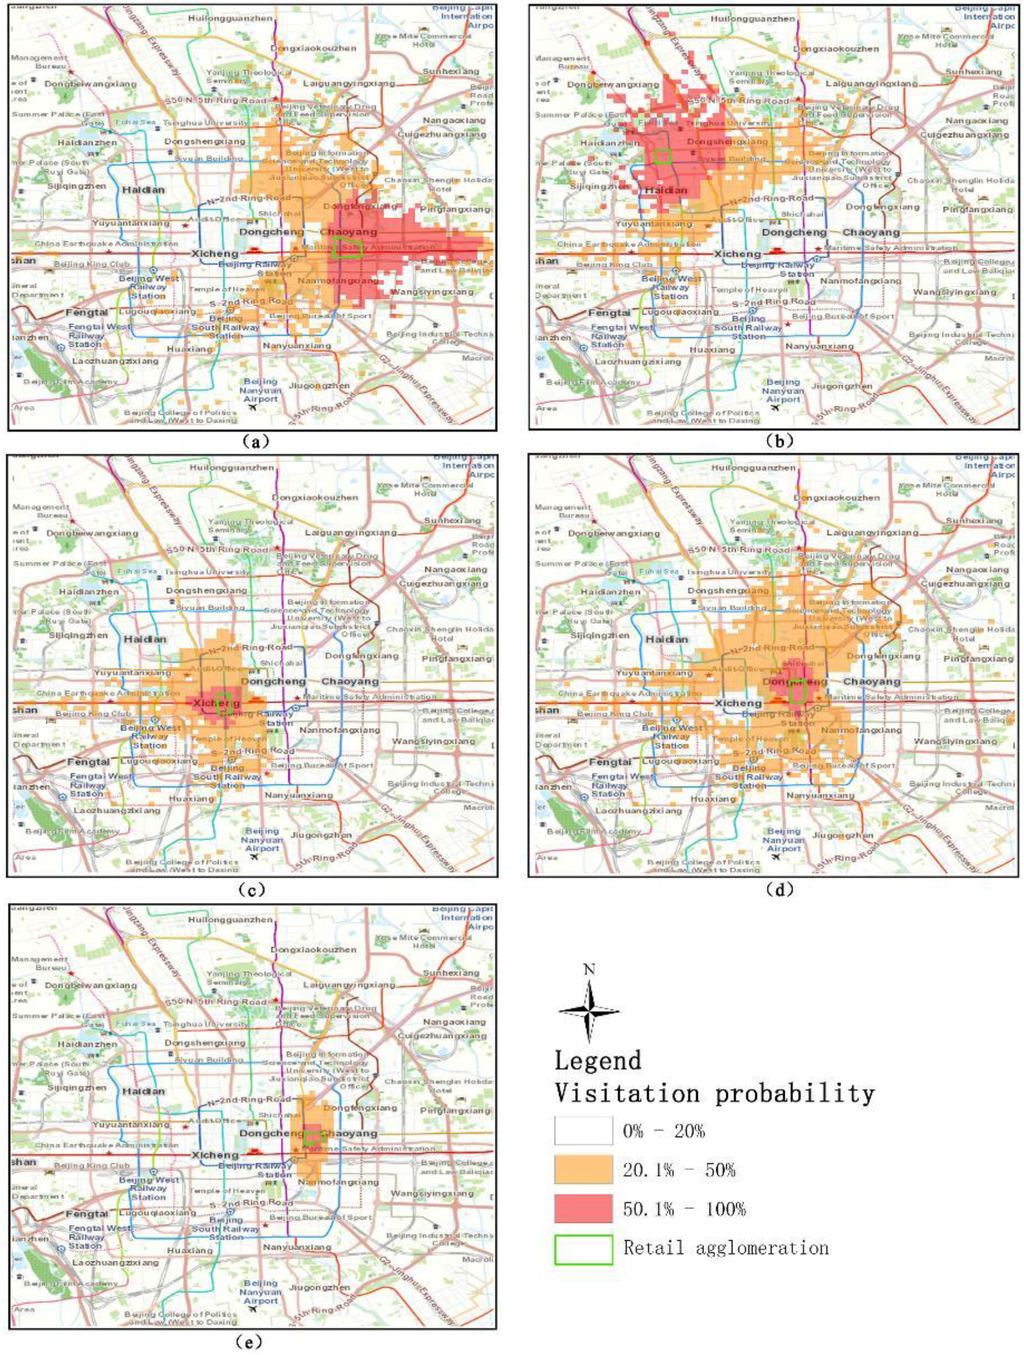
Figure 5.
The trade area of each retail agglomeration: (a) the trade area of G retail agglomeration; (b) the trade area of Z retail agglomeration; (c) the trade area of X retail agglomeration; (d) the trade area of W retail agglomeration; (e) the trade area of C retail agglomeration.
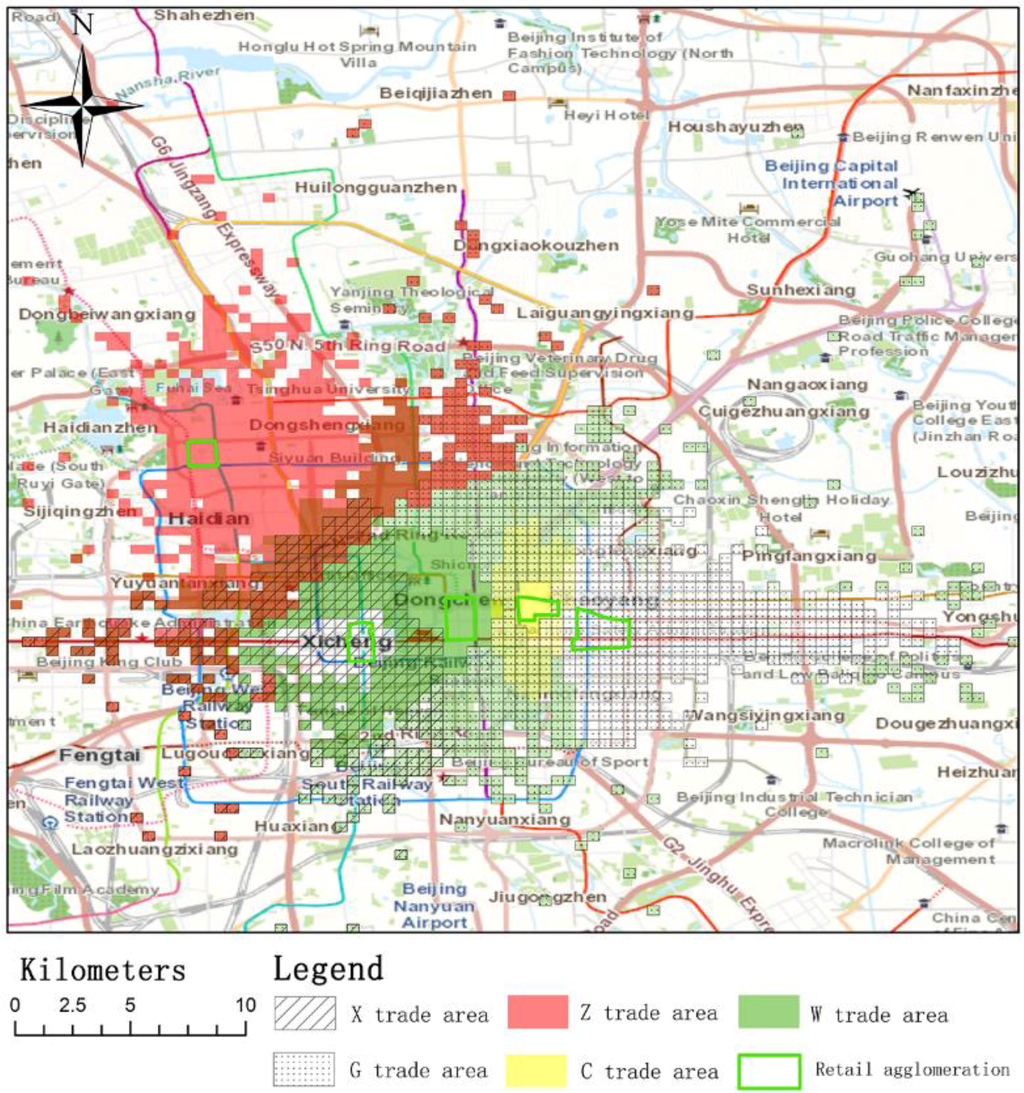
Figure 6.
The overlap of different trade areas.
6. Conclusions
The development of mobile communication technology provides new opportunities to investigate problems in the real world through social media data [39,40,41,42,43]. Based on a Huff model, we obtained different sample sets for delimitating trade areas from social media data. Our results show that the sets obtained by spatially aggregating all user activity centers are most suitable for delimitating trade areas and have a better effect than the sets without aggregation. The results also reveal differences in the distribution and intensity of trade areas for different retail agglomerations. Our findings have many important social and economic implications. Based on the delimitated trade area, urban planners can locate new retail agglomerations more effectively. Additionally, businesses can take advantage of this approach to analyze the distribution of their customers and predict commercial performance more accurately.
Although our preliminary study suggests a practical method for using social media data to delimitate trade area effectively, we need to pay more attention to how to use social media for further analysis of the distribution of trade areas and the behaviors of attracted customers. In future studies, challenges and problems specific to social media will be addressed, such as:
- (1)
- The age structure of social media users; most social media users are young people and the age structure of users is different from the real world [24]. Our research team will explore the impact of age structure on trade area delimitation.
- (2)
- The modifiable area unit problem (MAUP); we used 400 meter × 400 meter grid cells for aggregation. Different sizes of spatial units may lead to different results. In future work, we aim to obtain the best-fit spatial unit by trying different sizes and shapes of spatial units.
- (3)
- Social media user selection; social media users have many attributes, such as gender, place of household registration, educational levels, and the number of Weibo fans. In trade area analysis, we will categorize users based on these personal characteristics that may influence trade area delimitation.
- (4)
- Retail agglomeration attractiveness; the business area is the most important influencing factor for attractiveness. Other factors such as parking, history, and price level may also influence attractiveness. In order to explore the impact of these other factors, we will collect more statistical information related to each agglomeration.
- (5)
- Textual information; social media data contains a large amount of text information. This information reflects public opinion about commercial facilities and agglomerations. Future studies are needed to explore this rich, textual, semantic information for a better understanding of customer thinking and behavior patterns.
Acknowledgments
This work is funded by the National Natural Science Foundation of China (Grant No. 41271399), China Special Fund for Surveying, Mapping and Geoinformation Research in the Public Interest (Grant No. 201512015) and the National Science Foundation 1416509, ACI-1535031,1535081.
Author Contributions
YandongWang and XinyueYe conceived and designed the experiments; Senbao Liu and Teng Wang performed the experiments; Wei Jiang and Senbao Liu analyzed the data; Yandong Wang and Xinyue Ye contributed reagents/materials/analysis tools; Wei Jiang wrote the paper.
Conflicts of Interest
The authors declare no conflict of interest.
References
- Rosenbloom, B. The trade area mix and retailing mix: A retail strategy matrix. J. Mark. 1976, 40, 58–66. [Google Scholar] [CrossRef]
- Huff, D.L. Defining and estimating a trading area. J. Mark. 1964, 28, 34–38. [Google Scholar] [CrossRef]
- Suárez, V.R.; Gutiérrez-Acuña, J.L.; Rodríguez, D.M. Locating a supermarket using a locally calibrated huff model. Int. J. Geogr. Inf. Sci. 2015, 29, 217–233. [Google Scholar] [CrossRef]
- Li, Y.; Liu, L. Assessing the impact of retail location on store performance: A comparison of Wal-Mart and Kmart stores in Cincinnati. Appl. Geogr. 2012, 32, 591–600. [Google Scholar] [CrossRef]
- O’Kelly, M.E. Trade-area models and choice-based samples: Methods. Environ. Plan. A 1999, 31, 613–627. [Google Scholar] [CrossRef]
- Lin, M.; Lucas, H.C.; Shmueli, G. Research commentary-too big to fail: Large samples and the p-value problem. Inf. Syst. Res. 2013, 24, 906–917. [Google Scholar] [CrossRef]
- Adnan, M.; Leak, A.; Longley, P. A geocomputational analysis of Twitter activity around different world cities. Geo-Spat. Inf. Sci. 2014, 17, 145–152. [Google Scholar] [CrossRef]
- Sun, Y. Investigating “locality” of intra-urban spatial interactions in New York city using foursquare data. ISPRS Int. J. Geo-Inf. 2016. [Google Scholar] [CrossRef]
- Laylavi, F.; Rajabifard, A.; Kalantari, M. A multi-element approach to location inference of twitter: A case for emergency response. ISPRS Int. J. Geo-Inf. 2016. [Google Scholar] [CrossRef]
- Granell, C.; Ostermann, F.O. Beyond data collection: Objectives and methods of research using VGI and geo-social media for disaster management. Comput. Environ. Urban Syst. 2016, in press. [Google Scholar] [CrossRef]
- Hu, Q.; Wang, M.; Li, Q. Urban hotspot and commercial area exploration with check-in data. Acta Geod. Cartogr. Sin. 2014, 43, 314–321. [Google Scholar]
- Qu, Y.; Zhang, J. Trade area analysis using user generated mobile location data. In Proceedings of the 22nd International Conference on World Wide Web, New York, NY, USA, 13–17 May 2013; pp. 1053–1064.
- Christaller, W. Central Places in Southern Germany; Prentice-Hall: Englewood, NJ, USA, 1966. [Google Scholar]
- Applebaum, W.; Cohen, S.B. The dynamics of store trading areas and market equilibrium 1. Ann. Assoc. Am. Geogr. 1961, 51, 73–101. [Google Scholar] [CrossRef]
- Baray, J.; Cliquet, G. Delineating store trade areas through morphological analysis. Eur. J. Oper. Res. 2007, 182, 886–898. [Google Scholar] [CrossRef]
- Aurenhammer, F. Voronoi diagrams—A survey of a fundamental geometric data structure. ACM Comput. Surv. (CSUR) 1991, 23, 345–405. [Google Scholar] [CrossRef]
- Ghosh, A.; Rushton, G. Spatial Analysis and Location-Allocation Models; Van Nostrand Reinhold Company: New York, NY, USA, 1987. [Google Scholar]
- Mendes, A.B.; Themido, I.H. Multi-outlet retail site location assessment. Int. Trans. Oper. Res. 2004, 11, 1–18. [Google Scholar] [CrossRef]
- Applebaum, W. Methods for determining store trade areas, market penetration, and potential sales. J. Mark. Res. 1966, 3, 127–141. [Google Scholar] [CrossRef]
- Cui, C.; Wang, J.; Pu, Y.; Ma, J.; Chen, G. GIS-based method of delimitating trade area for retail chains. Int. J. Geogr. Inf. Sci. 2012, 26, 1863–1879. [Google Scholar] [CrossRef]
- Gautschi, D.A. Specification of patronage models for retail center choice. J. Mark. Res. 1981, 18, 162–174. [Google Scholar] [CrossRef]
- Mark, E.; James, S. How critical is a good location to a regional shopping center? J. Real Estate Res. 1996, 12, 459–468. [Google Scholar]
- Chen, S.; Zhang, H.; Lin, M.; Lv, S. Comparision of microblogging service between Sina Weibo and Twitter. In Proceedings of the 2011 International Conference on Computer Science and Network Technology (ICCSNT), Guangzhou, China, 24–26 December 2011; pp. 2259–2263.
- The Registration of Sina Weibo has Reached 500 Million. Available online: http://tech.sina.com.cn/i/2013-02-25/09348086534.shtml (accessed on 20 May 2016).
- Jiang, W.; Wang, Y.; Tsou, M.H.; Fu, X. Using social media to detect outdoor air pollution and monitor air quality index (aqi): A geo-targeted spatiotemporal analysis framework with Sina Weibo (Chinese Twitter). PLoS ONE 2015, 10, e0141185. [Google Scholar] [CrossRef] [PubMed]
- Zhou, C.; Frankowski, D.; Ludford, P.; Shekhar, S.; Terveen, L. Discovering personally meaningful places: An interactive clustering approach. ACM Trans. Inf. Syst. (TOIS) 2007, 25, 1–31. [Google Scholar] [CrossRef]
- Pan, H.; Li, Y.; Dang, A. Application of network huff model for commercial network planning at suburban–taking Wujin district, Changzhou as a case. Ann. GIS 2013, 19, 131–141. [Google Scholar] [CrossRef]
- Yue, Y.; Wang, H.; Hu, B.; Li, Q.; Li, Y.; Yeh, A.G. Exploratory calibration of a spatial interaction model using taxi GPS trajectories. Comput. Environ. Urban Syst. 2012, 36, 140–153. [Google Scholar] [CrossRef]
- Gonzalez, M.C.; Hidalgo, C.A.; Barabasi, A.L. Understanding individual human mobility patterns. Nature 2008, 453, 779–782. [Google Scholar] [CrossRef] [PubMed]
- Lv, M.; Chen, L.; Chen, G. Discovering personally semantic places from GPS trajectories. In Proceedings of the 21st ACM International Conference on Information and knowledge Management, New York, NY, USA, 29 October–2 November 2012; pp. 1552–1556.
- Campagna, M.; Floris, R.; Massa, P. The role of social media geographic information (SMGI) in spatial planning. In Planning Support Systems and Smart Cities; Lecture Notes in Geoinformation and Cartography; Geertman, S., Ed.; Springer International Publishing: Basel, Switzerland, 2015; pp. 41–60. [Google Scholar]
- Ester, M.; Kriegel, H.P.; Sander, J.; Xu, X. A density-based algorithm for discovering clusters in large spatial databases with noise. In Proceedings of the Second International Conference on Knowledge Discovery and Data Mining, Portland, OR, USA, 2–4 August 1996; pp. 226–231.
- Dijkstra, E.W. A note on two problems in connexion with graphs. Numer. Math. 1959, 1, 269–271. [Google Scholar] [CrossRef]
- Zhao, Z.; Shaw, S.L.; Xu, Y.; Lu, F.; Chen, J.; Yin, L. Understanding the bias of call detail records in human mobility research. Int. J. Geogr. Inf. Sci. 2016, 30, 1738–1762. [Google Scholar] [CrossRef]
- Markham, F.; Doran, B.; Young, M. Estimating gambling venue catchments for impact assessment using a calibrated gravity model. Int. J. Geogr. Inf. Sci. 2014, 28, 326–342. [Google Scholar] [CrossRef]
- Batty, M.; Sikdar, P. Spatial aggregation in gravity models: 4. Generalisations and large-scale applications. Environ. Plan. A 1982, 14, 795–822. [Google Scholar] [CrossRef] [PubMed]
- Marquardt, D.W. An algorithm for least-squares estimation of nonlinear parameters. J. Soc. Ind. Appl. Math. 1963, 11, 431–441. [Google Scholar] [CrossRef]
- Khatib, Z.; Chang, K.T.; Ou, Y. Impacts of analysis zone structures on modeled statewide traffic. J. Trans. Eng. 2001, 127, 31–38. [Google Scholar] [CrossRef]
- Wang, Y.; Wang, T.; Ye, X.; Zhu, J.; Lee, J. Using social media for emergency response and urban sustainability: A case study of the 2012 Beijing rainstorm. Sustainability 2016, 8, 142–153. [Google Scholar] [CrossRef]
- Wang, Z.; Ye, X.; Tsou, M. Spatial, temporal, and content analysis of Twitter for wildfire hazards. Nat. Hazards 2016, 83, 523–540. [Google Scholar] [CrossRef]
- Li, S.; Ye, X.; Lee, J.; Gong, J.; Qin, C. Spatiotemporal analysis of housing prices in China: A big data perspective. Appl. Spat. Anal. Policy 2016. [Google Scholar] [CrossRef]
- Shaw, S.; Tsou, M.; Ye, X. Human dynamics in the mobile and big data Era. Int. J. Geogr. Inf. Sci. 2016, 30, 1687–1693. [Google Scholar] [CrossRef]
- Yang, X.; Ye, X.; Sui, D.Z. We know where you are: In space and place-enriching the geographical context through social media. Int. J. Appl. Geospat. Res. 2016, 7, 61–75. [Google Scholar] [CrossRef]
© 2016 by the authors; licensee MDPI, Basel, Switzerland. This article is an open access article distributed under the terms and conditions of the Creative Commons Attribution (CC-BY) license (http://creativecommons.org/licenses/by/4.0/).