Deriving Ephemeral Gullies from VHR Image in Loess Hilly Areas through Directional Edge Detection


1
Key Laboratory of Virtual Geographic Environment, Ministry of Education, Nanjing Normal University, Nanjing 210023, China
2
State Key Laboratory Cultivation Base of Geographical Environment Evolution, Nanjing 210023, China
3
Jiangsu Center for Collaborative Innovation in Geographical Information Resource Development and Application, Nanjing 210023, China
*
Author to whom correspondence should be addressed.
ISPRS Int. J. Geo-Inf. 2017, 6(11), 371; https://doi.org/10.3390/ijgi6110371
Submission received: 6 September 2017
/
Revised: 13 November 2017
/
Accepted: 15 November 2017
/
Published: 18 November 2017
Abstract
:Monitoring ephemeral gullies facilitates water planning and soil conservation. Artificial interpretation based on high spatial resolution images is the main method for monitoring ephemeral gullies in large areas; however, this method is time consuming. In this study, a semiautomatic method for extracting ephemeral gullies in loess hilly areas based on directional edge detection is proposed. First, the area where ephemeral gullies developed was extracted because the weak trace of ephemeral gullies in images can hardly be detected by most image detectors, which avoided the noise from other large gullies. Second, a Canny edge detector was employed to extract all edges in the image. Then, those edges along the direction where ephemeral gullies developed were searched and coded as candidate ephemeral gullies. Finally, the ephemeral gullies were identified through filtering of pseudo-gullies by setting the appropriate length threshold. Experiments in three loess hilly areas showed that accuracy ranged from 38.18% to 85.05%, completeness ranged from 82.35% to 92.86%, and quality ranged from 35.29% to 79.82%. The quality of the remote sensing images highly affected the results. The accuracy was significantly improved when the image was used with less grass and shrubs. The length threshold in directional searching also affected the accuracy. A small threshold resulted in additional noise and disconnected gullies, whereas a large threshold disregarded the short gullies. A reasonable threshold can be obtained through the index of quality. The threshold also exhibits a strong relationship with the average length of ephemeral gullies, and this relationship can help obtain the optimum threshold in the hilly area of the Northern Loess Plateau of China.
1. Introduction
Ephemeral gullies are small channels eroded by concentrated flow, often erased by cultivation, but recurring in the same place during subsequent runoff events [1,2]. Ephemeral gullies are widely distributed in the hillslope of the Chinese Loess Plateau [3,4]. An ephemeral gully generally occurs in slope croplands. The width and depth of an ephemeral gully are larger than that of a rill, but smaller than that of a bank gully (Figure 1) [5,6,7]. Ephemeral gullies not only engulf farmlands, but also transport sediments and pollutants [8]. In the area of the Xingzi watershed of the Loess Plateau of China, the area where ephemeral gullies are distributed constitutes 35% of the upslope area, and the soil loss amount accounts for 35–75% of the total slope erosion [9].
Many studies focused on geomorphic threshold conditions for ephemeral gully incision [10,11,12,13,14,15,16], influencing factors of ephemeral gully erosion [17,18,19,20,21], and an ephemeral gully erosion model [22,23,24,25,26,27] to elucidate the importance of ephemeral gullies in gully erosion. The position, shape, and distribution of ephemeral gullies are the necessary information for most previously-mentioned studies.
The morphological characteristics of ephemeral gully can be acquired through a high-resolution digital elevation model (DEM) from field surveys because the width and depth of ephemeral gullies typically do not exceed 100 cm in the Loess Plateau of China [3]. In field surveys, a needle board with closely spaced needles for measuring surface roughness [28,29,30], digital photogram [31,32,33,34], global positioning system, light detection and ranging (LIDAR) [35,36,37,38,39], and unmanned aerial vehicles [40,41,42,43] are usually employed. Field surveys, particularly high-resolution DEM generation, cover only a single slope or a small area due to their disadvantages of high cost and time consumption, thus making them unsuitable for gully investigation of a large area. Instead of field surveys, high-resolution remote sensing images were employed to monitor gully erosion, with the advantages of high spatial resolution and multiperiod images, as well as large area coverage [44].
To date, visual interpretation of imagery is the prevalent method for ephemeral gully extraction. Drawing gullies from images remains labor intensive, and the result is highly influenced by personal knowledge and experience [45,46,47,48]. An ephemeral gully exhibits an elongated feature and has a width of 0.5 m to 1 m, thereby occupying only one or two cells in very high resolution (VHR) images, such as IKONOS or QuickBird. Moreover, the hillslope ephemeral gully spectrum is not that different from its surroundings, which makes automatic detection of the ephemeral gully from the background difficult. Shruthi et al. [49,50] developed a knowledge-based generic method for mapping a gully system through an object-oriented image analysis based on IKONOS and GeoEye-1 data and a high-resolution digital surface model (DSM), which exhibited substantial achievement in ephemeral gully extraction. However, their method relies on high-resolution DSM, which is expensive and frequently unavailable in large areas [51].
An ephemeral gully usually develops in upslope areas and presents linear erosion features characterized by long, narrow shapes and light tones [48]. Thus, ephemeral gullies can be distinguished from the background of an image through the linear extraction method. Numerous linear feature extraction methods, which mainly focused on road extraction from VHR satellite images, were developed [52,53]. The image characteristics of ephemeral gullies are different from that of roads in the aspects of width, size, gray value, contrast with surroundings, and noise. The features of ephemeral gullies in images can also be affected by the sensor type, spectral and spatial resolutions, weather, light variation, and ground characteristic. Road extraction methods cannot be directly applied in ephemeral gully extraction, but provide valuable techniques for gully extraction. Among those methods, established edge detection methods, such as Roberts, Log, and Canny, contribute to the extraction of potential linear features from images [54,55,56,57]. In this regard, a directional edge detection method for ephemeral gully extraction is proposed. First, irrelevant areas are removed to exclude noises from other irrelevant objects by using a previously-proposed multidirectional hill-shading model [58] and obtaining the region where ephemeral gullies develop. Then, all linear features could be detected by the Canny edge detector and regarded as candidate gullies. According to the direction of ephemeral gullies, a directional searching algorithm is executed to filter candidates. Finally, ephemeral gully lines are generated by connecting the identified gully cells with an appropriate length parameter along the gully direction. The objectives of this study are as follows: (1) examine the potential of directional edge detection in mapping ephemeral gully erosion features from VHR images; (2) establish relative parameters in loess hilly areas; and (3) assess the accuracy of the results by comparing them with a manually-digitized gully.
2. Area and Data
2.1. Areas
A substantial number of ephemeral gullies developed in the Loess Plateau of China [3]. A total of three small areas distributed in loess hilly areas, which have different directions, lengths, spacing, and densities of ephemeral gullies, were selected as test and validation areas. T1 is located north of Jingbian County with an area of 0.23 km2. Ephemeral gullies in this area are mainly distributed in the northeast direction. T1 is the test area for the application of the ephemeral gully extraction methods. The two other test areas, namely T2 (Dingbian) and T3 (Huanxian), are both distant from T1 with different characteristics of ephemeral gullies. T2 and T3 are used to validate the applicability of the proposed method. The detailed information on the areas is listed in Table 1. All three areas are in the loess hill of the Northern Loess Plateau of China. The locations and images of the study sites are shown in Figure 2.
2.2. Data
High-resolution image of Pléiades, with an imaging date of 6 October 2013, has a 50 cm spatial resolution at the panchromatic band and can be used for experiments in the T1 area because the trace of ephemeral gullies can be detected at this level of spatial resolution. The images for the two other areas were downloaded from Google Earth at a spatial resolution of 0.5 m. The imaging date of T2 is 30 August 2009 and that of T3 is 30 July 2015. Similar to the images of Pléiades, these images are used to validate the method for different sources of images.
As previously mentioned, DEM was used to extract the areas where ephemeral gullies developed. The DEM with 1 m resolution for T1 area was generated by interpolating the point cloud from field survey LIDAR using a Riegl VZ400 terrestrial laser scanner (RIEGL Laser Measurement Systems GmbH, Horn, Austria). The DEM with 5 m resolution for the two other areas were obtained from the National Administration of Surveying, Mapping, and Geoinformation. The region where ephemeral gullies distribute can be acquired through easing large gully-affected areas, namely, the gully boundary.
3. Method
3.1. Basic Idea
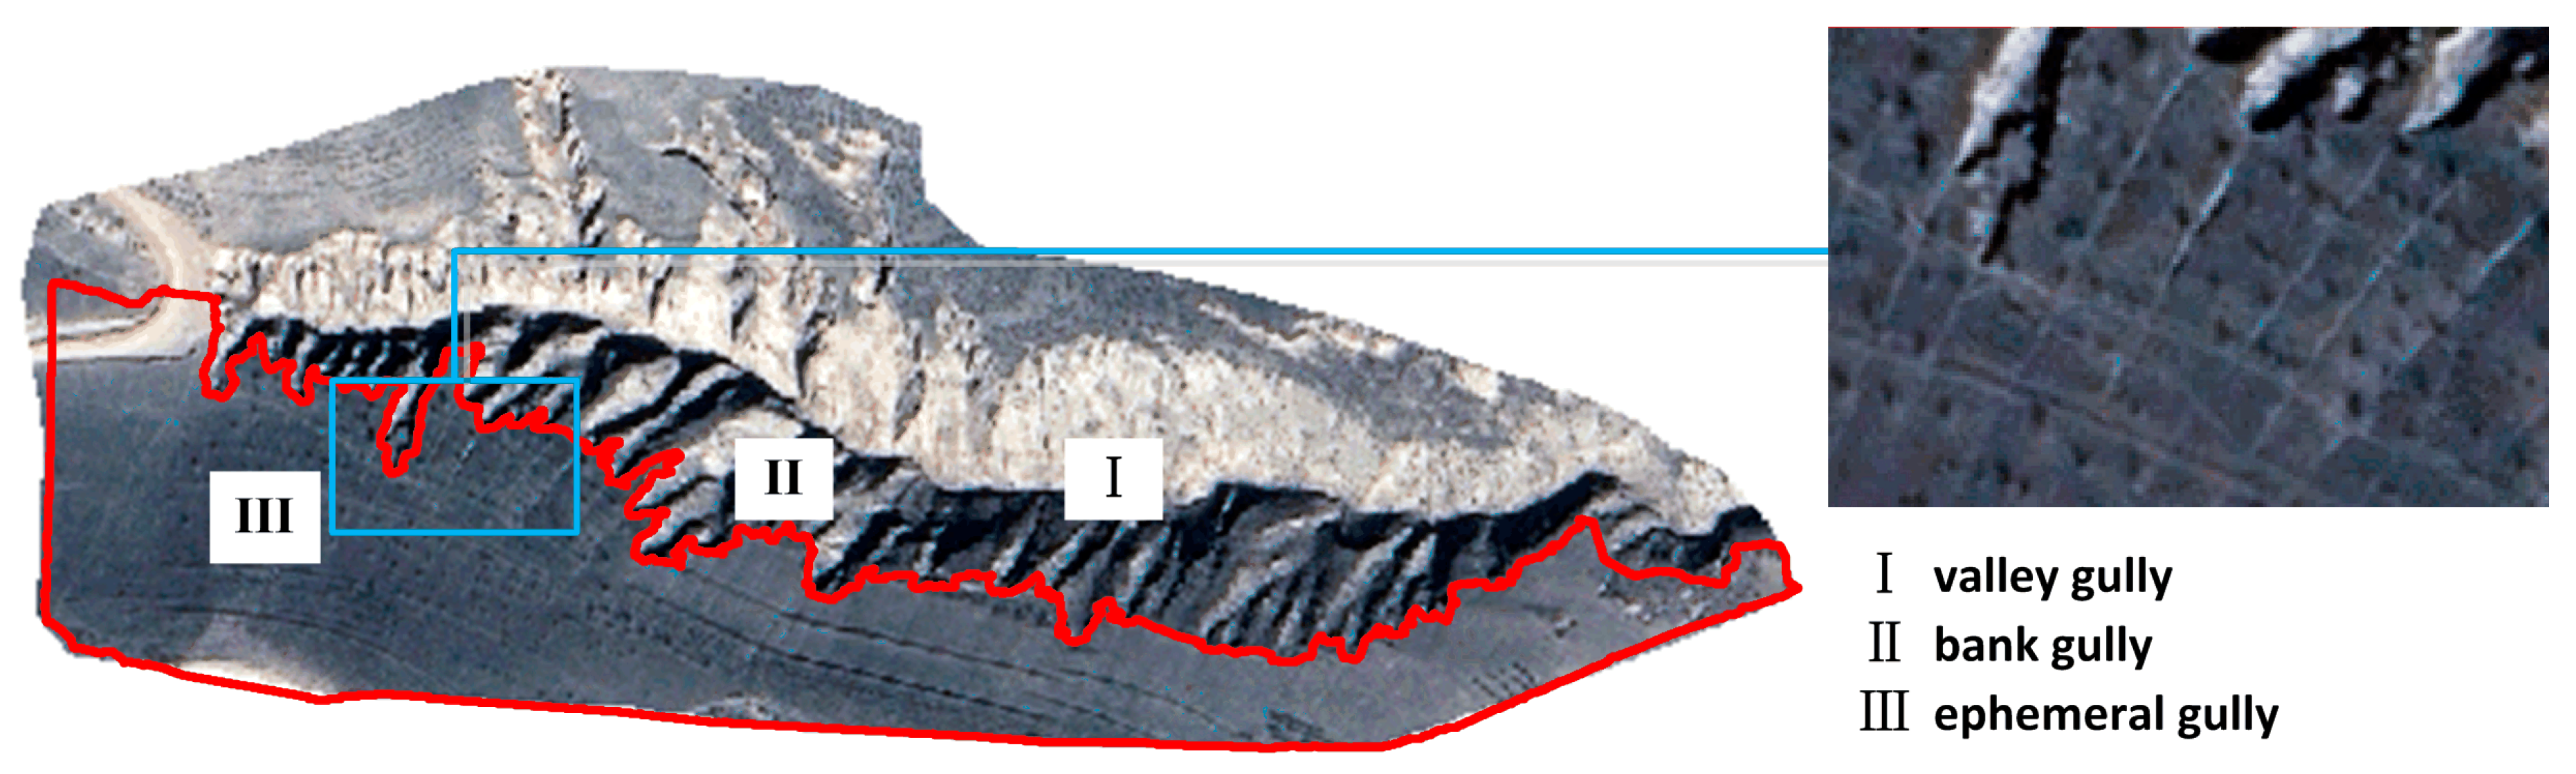
The ephemeral gullies in the Loess Plateau usually develop with a depth of 30–100 cm and a width of 40–100 cm [3,4,6]. These ephemeral gullies are typically distributed in upslope areas, and their longitude profiles match with terrain surface slopes. As no evident shoulder line can be found in ephemeral gullies, they present a linear feature with 0.5 m to 1 m widths. A gully system, including valley, bank, and ephemeral gullies in the T1 area, is presented in Figure 3. In this system, valley and bank gullies can be easily identified, whereas the gray value of ephemeral gully is extremely weak and indistinct from its neighboring cells, thereby making identification difficult.
The area where ephemeral gullies developed should be separated from valley and bank gully areas to filter noise from irrelevant objects. The affected area of valley and bank gullies could be identified by DEM-based gully boundary extraction methods [58,59,60,61,62]. The area where ephemeral gullies developed is shown by the red lines in Figure 3, which makes image edge detection possible after the removal of other strong spectral reflectance regions.
Figure 4 shows the main procedure of ephemeral gully extraction. Based on the segmented image, wherein only ephemeral gullies existed, a directional edge detection method was proposed. First, an edge-detecting operator was employed to detect all small linear edges, which were regarded as candidates of ephemeral gullies. Then, according to the direction of the ephemeral gully distribution, the direction-searching rules were designed, as described in Section 3.3. Only the cells retrieved by searching rules were regarded as part of the ephemeral gully. Then, ephemeral gullies were extracted by connecting the retrieved neighboring cells with an appropriate length threshold. Finally, ephemeral gullies were presented as a line by converting the raster to a vector.
3.2. Edge Detection
Well-known edge detection operators, which include Roberts, Sobel, Prewitt, Log, and Canny, can generate significantly different results with different kinds of images [63]. An experiment was conducted to compare the capabilities of these operators in detecting weak spectral information of ephemeral gullies. The operators of Roberts, Sobel, and Prewitt cannot detect ephemeral gullies (as shown in Figure 5b–d, respectively), and the Log operator can detect only a part of the ephemeral gullies (Figure 5e). By contrast, although a considerable amount of noise is detected, the Canny operator can detect nearly all the ephemeral gullies (Figure 5f). Therefore, the Canny edge detector was selected for ephemeral gully extraction.
The algorithm of the Canny edge detector includes the following four main steps [64]:
(1) Filtering image
The Canny algorithm uses a two-dimensional Gaussian function to smooth the image and filter the noise through the following convolution operation:
where denotes the parameter of the Gaussian filter. It controls the extent of the smoothing image.
(2) Calculating gradient
The second step is to calculate the magnitude and direction of image gradient based on a 2 × 2 area of neighboring cells. The approximation of the first-order partial derivative on the x- and y-directions can be derived by using the following formulas:
The magnitude of the image gradient is:
The direction of the image gradient is:
(3) Non-maximum suppression (NMS)
The NMS process can help guarantee that each edge has one-pixel width. The Canny algorithm uses 3 × 3 neighboring cells to execute interpolation of the gradient magnitude along the gradient direction. If the magnitude M(i, j) is larger than the two interpolation results on the gradient direction, then it will be marked as the candidate edge point; otherwise, it will be marked as a non-edge point. The candidate edge image will be acquired.
(4) Checking and connecting the edges
The double-threshold method was employed to select the edge points after the NMS process. The pixels whose gradient magnitude is larger than the high threshold will be marked as edge points, and those whose gradient magnitude is lower than the low threshold will be regarded as non-edge points. The remaining pixels will be marked as candidate edge points. Only those candidate edge points that connect with the edge points will be marked as edge points. Then, the final edge image will be acquired.
In this process, the double-threshold parameters will significantly influence the edge image result. Thus, an experiment was designed to select suitable thresholds of the Canny operator according to the principle of detecting numerous edges despite the noise. The aim of this principle is to allow detection of all the ephemeral gullies. The result after Canny edge detection, that is, the edge image, will be used for ephemeral gully identification.
3.3. Directional Detection
3.3.1. Ephemeral Gully Direction
A large-scale field investigation showed that ephemeral gullies are generally distributed parallel in a slope area, and their direction varies in different slope areas. Although ephemeral gullies can be observed in many different directions, four typical directions are abstracted by inducting similar directions, which are sufficient to represent most ephemeral gully directions. Figure 6 shows the four typical directions, which include northeast to southwest (direction I), north to south (direction II), northwest to southeast (direction III), and west to east (direction IV). Therefore, the searching rules were conducted based on these directions. After Canny edge detection, a considerable amount of noise could be removed from the image through a directional searching filter. A searching order is provided for each direction. The detailed searching rules are presented in Section 3.3.2.
3.3.2. Directional Searching Rules
The edge image after Canny edge detection is a matrix with 0s and 1s, where one is regarded as edges, including ephemeral gullies, and a considerable amount of noise. The directional searching rules were designed to identify the cells from the ephemeral gully and filter out noise. Considering that the four preceding types of directions mentioned are abstracted, the key of the searching rules is the searching order under a set direction. Figure 7 shows the operating searching rules in each direction.
For example, Direction I is used to detect ephemeral gullies in the northeast–southwest direction. The searching order is lower left, left, and lower cells of the current grid. The search starts from the first line of the edge image. When the current cell value is 1, this cell is marked as a candidate gully, and its lower left cell is searched. If the lower left cell has a value of 1, then this cell is marked as a candidate gully and its lower left cell is searched to identify a new current cell. If the lower left cell has a value of 0, then the left cell is searched. If the left cell has a value of 0, then the lower cell is searched. If the lower cell has a value of 0, then the search is stopped and the procedure for the next object is started until the last row of the edge image is traversed (Figure 7). For the last row, the search order is the right, upper right, and upper cells of the current grid in the case of missing gully cells of the last line.
For Directions II, III, or IV, the searching rules are basically the same, except for the search order priority (Figure 6 and Figure 7). When traversing the last row of the images at Direction II, the upper left, upper, and upper right cells of the current candidate object are searched in order. When traversing the last row of the images at Direction III, the left, upper left, and upper cells of the current candidate object are searched. When traversing the last row of the images at Direction IV, the left, upper left, and lower left cells of the current candidate object are searched.
3.3.3. Identifying Ephemeral Gullies
Many noise cells were removed after the directional searching process. However, a few pseudo-gully cells still existed in the image. Neighboring candidate cells were connected along the search direction to identify ephemeral gullies. Then, a length threshold was set according to the planar elongated feature of the ephemeral gully. Only those connected cells with lengths larger than the threshold were identified as ephemeral gullies and coded as an object. The optimum length of the threshold for ephemeral gullies will be discussed in Section 4.1.2. After directional searching and coding, the image can be reclassified according to its code because each ephemeral gully has its own code. The ephemeral gully can be extracted as a line by converting the raster to a vector.
3.4. Reference Data and Accuracy Assessment
3.4.1. Reference Data
Manual interpretation of VHR images is widely used to assess the extraction of linear objects, such as roads and gullies, from images [52,54,58,61]. Therefore, the reference data are generated by manual image interpretation. The ephemeral gullies are manually drawn as a line by tracing the parallel directional features presented in the satellite image. The field survey of the T1 area has been conducted to validate the reliability of the results from image interpretation. When compared with the field investigation, the image interpretation of the hillslope gullies was highly accurate at the position and line morphology. Owing to the existence of the minimal difference between the image interpretation result and the field survey, the ephemeral gullies in other test areas were drawn by visual image interpretation and as reference data (ground truth) to validate the accuracy of this method in other areas.
3.4.2. Accuracy Assessment
Accuracy assessment is typically reduced to a mathematical problem based on the comparison of analytical results and reference data [49]. A total of four indices, namely completeness, correctness, quality, and length ratio, were employed for quantitative accuracy assessment from the aspects of position and length. The first three indices were widely used in assessing the extracted road result from the images [65,66]. Owing to the similar objective for linear feature extraction, position, and length were introduced in the accuracy assessment in this study:
where TP indicates the true positive and is the number of lines existing in both reference and extracted ephemeral gullies; FN indicates the false negative and is the number of lines existing in the reference gullies but not in the extracted gullies; and FP indicates the false positive and is the number of lines existing in the extracted gullies but not in the reference gullies. Length rate measures the length accuracy of extracted gullies and is the ratio of the total length from extracted gullies and the length from reference gullies.
4. Results and Discussion
4.1. Parameter Comparison
The sensitivity threshold of the Canny edge detector and the length threshold for directional searching are the two parameters that influenced the extracted result. The experiments for optimum parameters were conducted and analyzed.
4.1.1. Threshold of the Canny Parameter
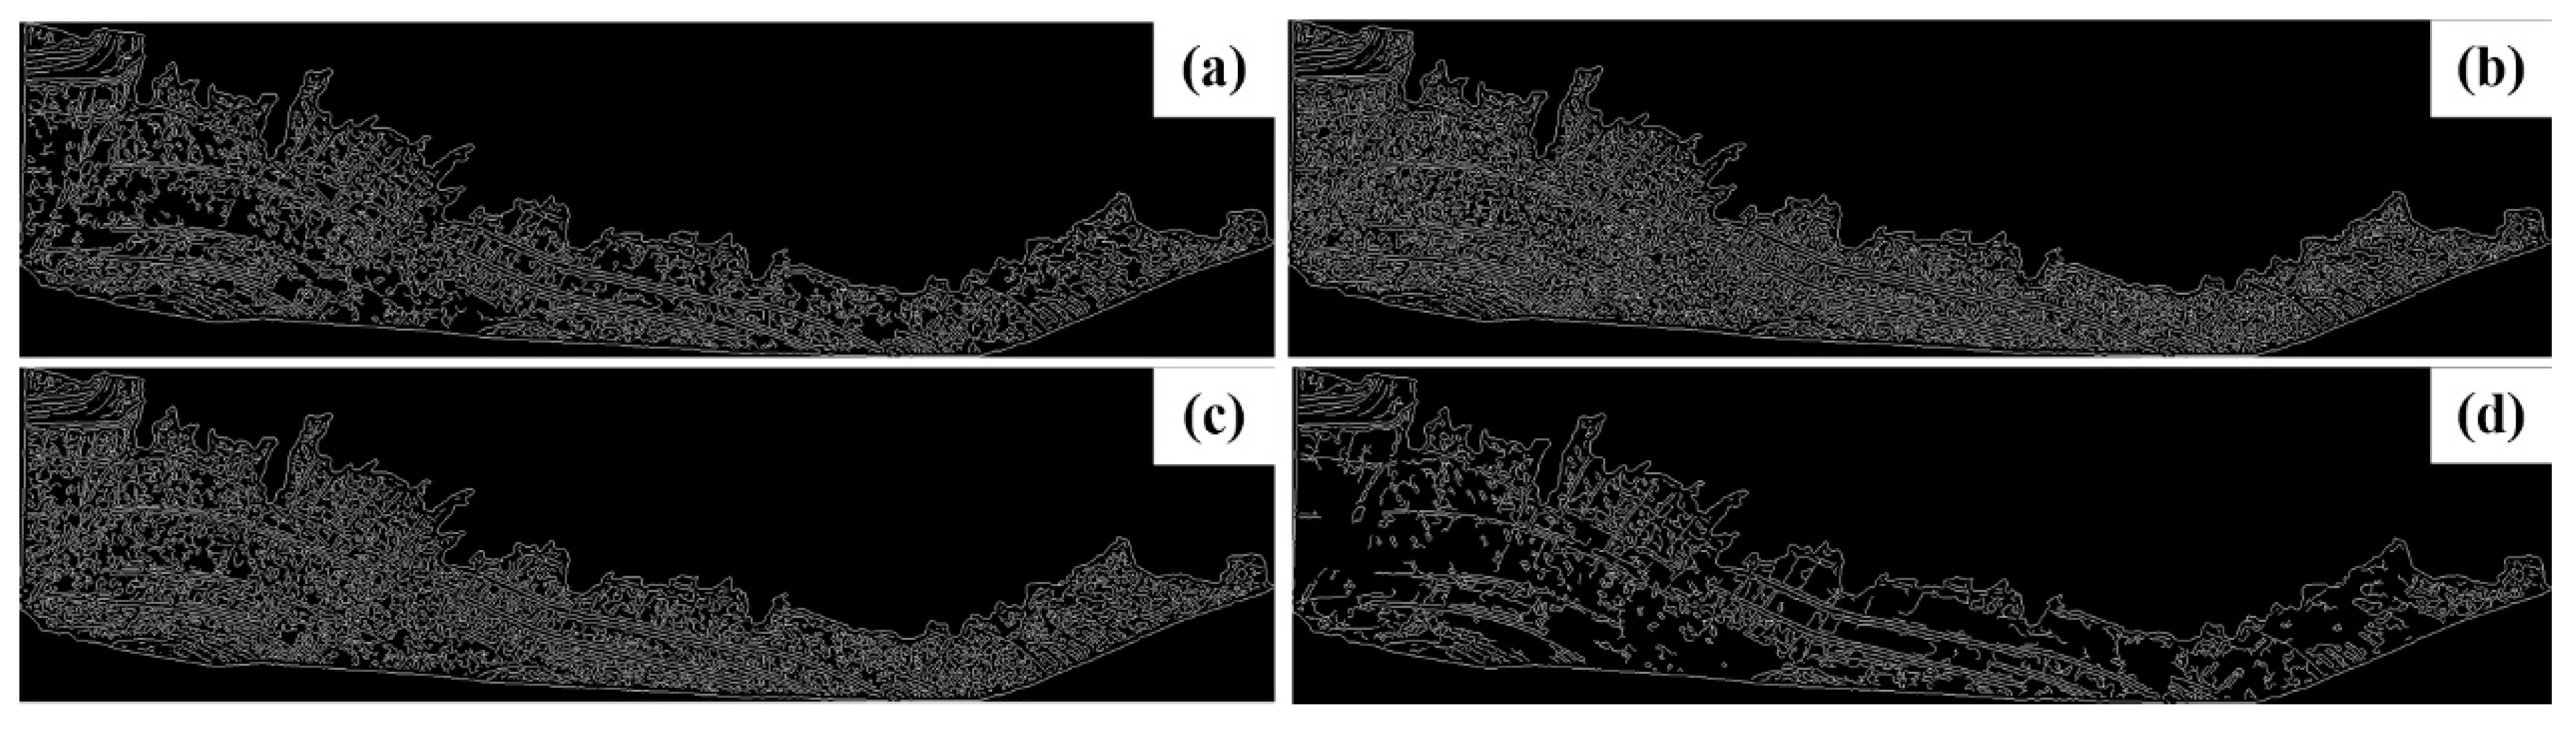
The parameter threshold of the Canny operator affected the edge-detected result. The results from different thresholds were compared and showed that a large threshold leads to fewer detected edges (Figure 8). Each result was generated by an upper and lower threshold. The lower threshold is automatically determined by a given upper threshold in MATLAB. The edges with vertical direction are fewer when the upper threshold is 0.05 (Figure 8d). The edges should be detected as much as possible due to the weak traces of ephemeral gullies in the image. Therefore, from the comparison of results with different thresholds, the upper threshold of 0.01 (Figure 8b) is used for edge detection because all candidate cells belonging to the ephemeral gully can be included.
4.1.2. Length Threshold
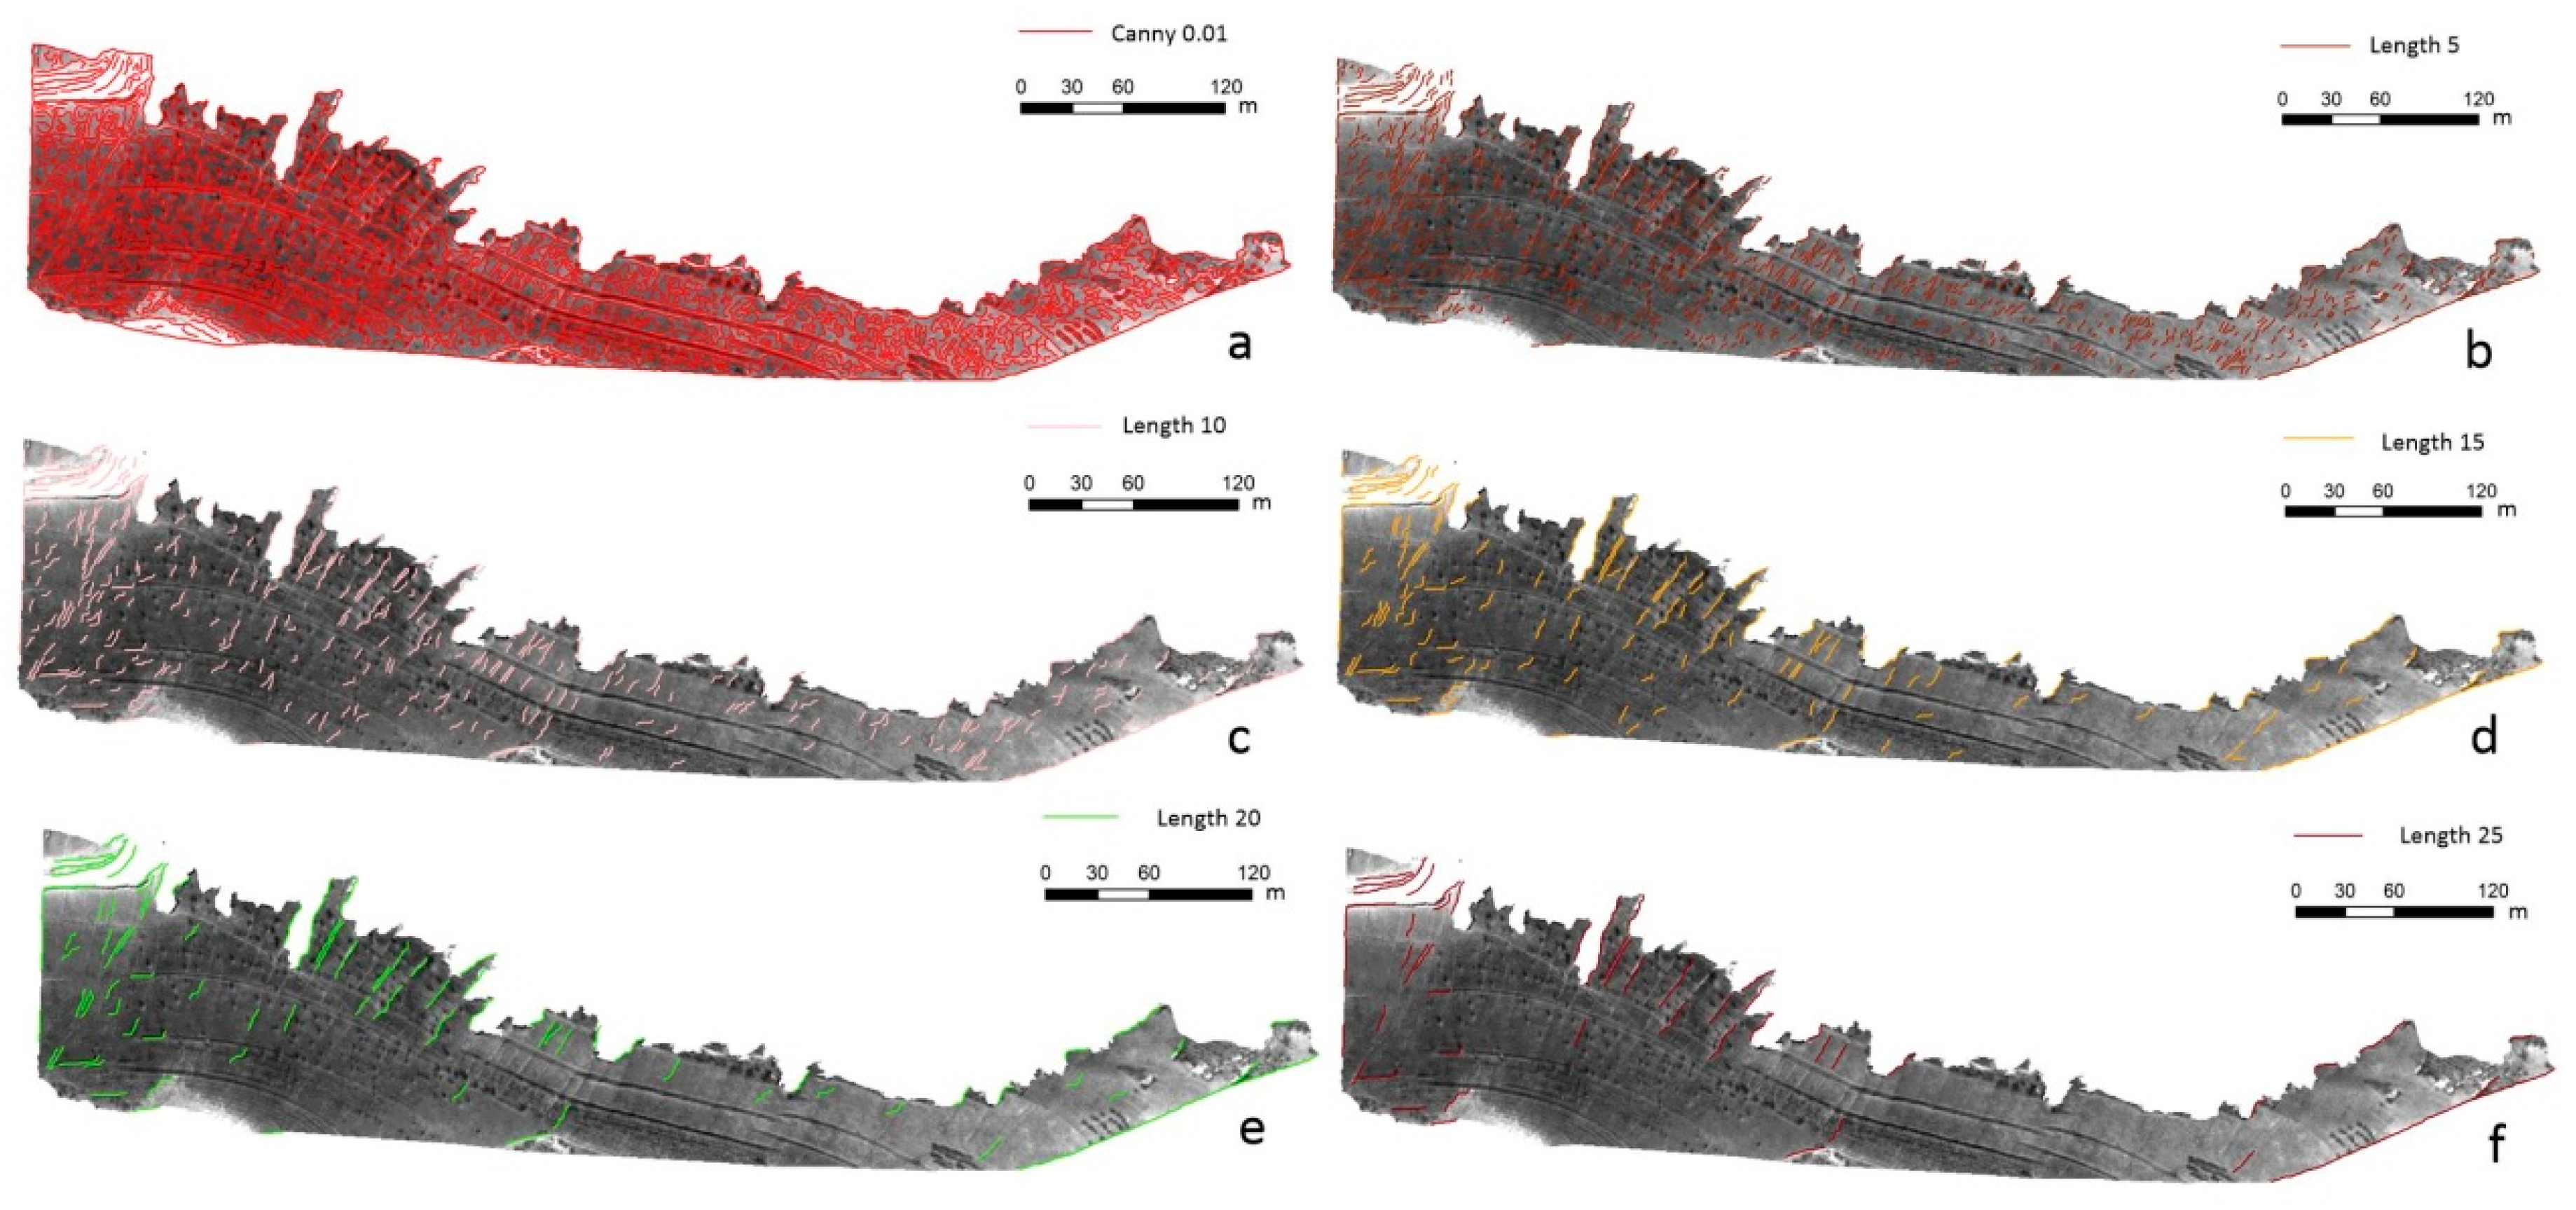
After Canny edge detection, the image contained considerable noise (Figure 9a). The directional identification of linear objects facilitated the recognition of the ephemeral gully and removal of the noise. The length threshold in directional detection can influence the identified result. An appropriate length along the ephemeral gully direction can distinguish the ephemeral gully from the noise. Figure 9 shows the results with different length thresholds.
A large threshold leads to fewer ephemeral gullies and noise. Considerable noise and pseudo-gullies were observed in the result at length thresholds of 5 m, 10 m, and 15 m. The ephemeral gullies were also discontinuous with small length thresholds (Figure 9b–d). With the increase in the length threshold, the detected gullies decreased. However, the ephemeral gullies that were correctly identified increased among the detected gullies (Figure 9e). If the length threshold continued to increase, then a few short ephemeral gullies will be ignored, and the ephemeral gullies that were correctly detected would decrease (Figure 9f). Therefore, quantitative assessment (Section 3.4.2) should be employed to set the appropriate length threshold.
Given the width of ephemeral gullies ranging from 0.5 m to 1 m, gully lines unavoidably exhibit a slight offset when converting the raster to a vector. In calculating the quantitative indices, the extracted gullies, which fall within the 1 m buffer zone on both sides of manually-interpreted gullies, were regarded as correctly detected. The results were compared with different length thresholds ranging from 5 m to 20 m in the T1 area (Table 2).
In the T1 area, with the increase in the threshold, the correctness initially increases and subsequently decreases, whereas the completeness and length rate persistently decrease. Quality is regarded as an assessment criterion due to its capability to comprehensively indicate correctness and completeness. With the highest quality of 35.29%, the corresponding length threshold is 8.5 m, which is the optimum value for the T1 test area.
4.2. Result
The proposed method is applied to the two other test areas (that is, T2 and T3) to validate its application to different kinds of remote sensing images and different distribution patterns of ephemeral gullies.
The extracted results denoted by blue lines are compared with the results generated by manual interpretation denoted by red lines (Figure 10). Although the direction, length, and space of ephemeral gullies are different in the three test areas, the majority of ephemeral gullies can be identified. The position of the extracted gullies corresponds highly to the reference data. However, a few ephemeral gullies are neglected, and the extracted gullies are generally shorter than those obtained from manual interpretation.
The parameters and assessment indices used are significantly different in the three areas (Table 3). Correctness indicates how correctly the ephemeral gully was extracted. T1 has the lowest correctness, which indicates that no more than 40% of the gullies were correctly identified. This result can be attributed to the weak contrast of ephemeral gully in the gray image value and additional image noise (that is, shrub and field trails) compared with the two other images. The ephemeral gully presented by the high-resolution images are only one or two cell widths and are easily covered by shrub or grass, thus making it difficult to distinguish such gullies from the background. Although the images from the T2 and T3 areas were obtained in summer, a relatively clear trace of ephemeral gullies can be detected with less grass and shrubs. Therefore, the correctness of the two areas was much higher than that of T1.
Completeness reflects how completely the ephemeral gully was detected. Completeness was higher than correctness in all three areas. This finding indicates that although the length of the extracted gullies may not match with their real length, the proposed method can detect the overwhelming majority of ephemeral gullies. The ephemeral gully directions are different in T3, but the completeness is highest in this area, thereby validating the effectiveness of the directional detection method proposed in this study.
Quality reflects the overall assessment of correctness and completeness. Quality exhibited a similar trend to that of correctness and ranged from 35.29% to 79.82%. Except for the T1 area, the results from the T2 and T3 areas were regarded as acceptable. Such low quality in the T1 area can be attributed to the presence of dense grass in ephemeral gullies, thereby resulting in a weak gray value contrast between ephemeral gullies and the background in the image (Figure 1). By contrast, the ephemeral gullies in the two other images are more clearly detected with less grass in the ephemeral gullies (Figure 2).
The length ratio indicates the coincidence in shape between ephemeral and extracted gullies. A high length ratio indicates a high integrity and a matched morphology. This finding indicates the significant difference in different test areas (Table 3). The length of the extracted gullies is usually shorter than their actual length. The highest length is 71.4% in T2, where the ephemeral gully shows a nearly parallel direction. A uniform direction leads to a high matching of the extracted gully. The gully directions are not as uniform in T1 and T3 as that in T2, thereby resulting in lower length matching. In addition, extracting the field trails in the images of T1 and T3 was easier than the ephemeral gully. The field trails and inconsistent gully directions affected the continuity of ephemeral gully extraction.
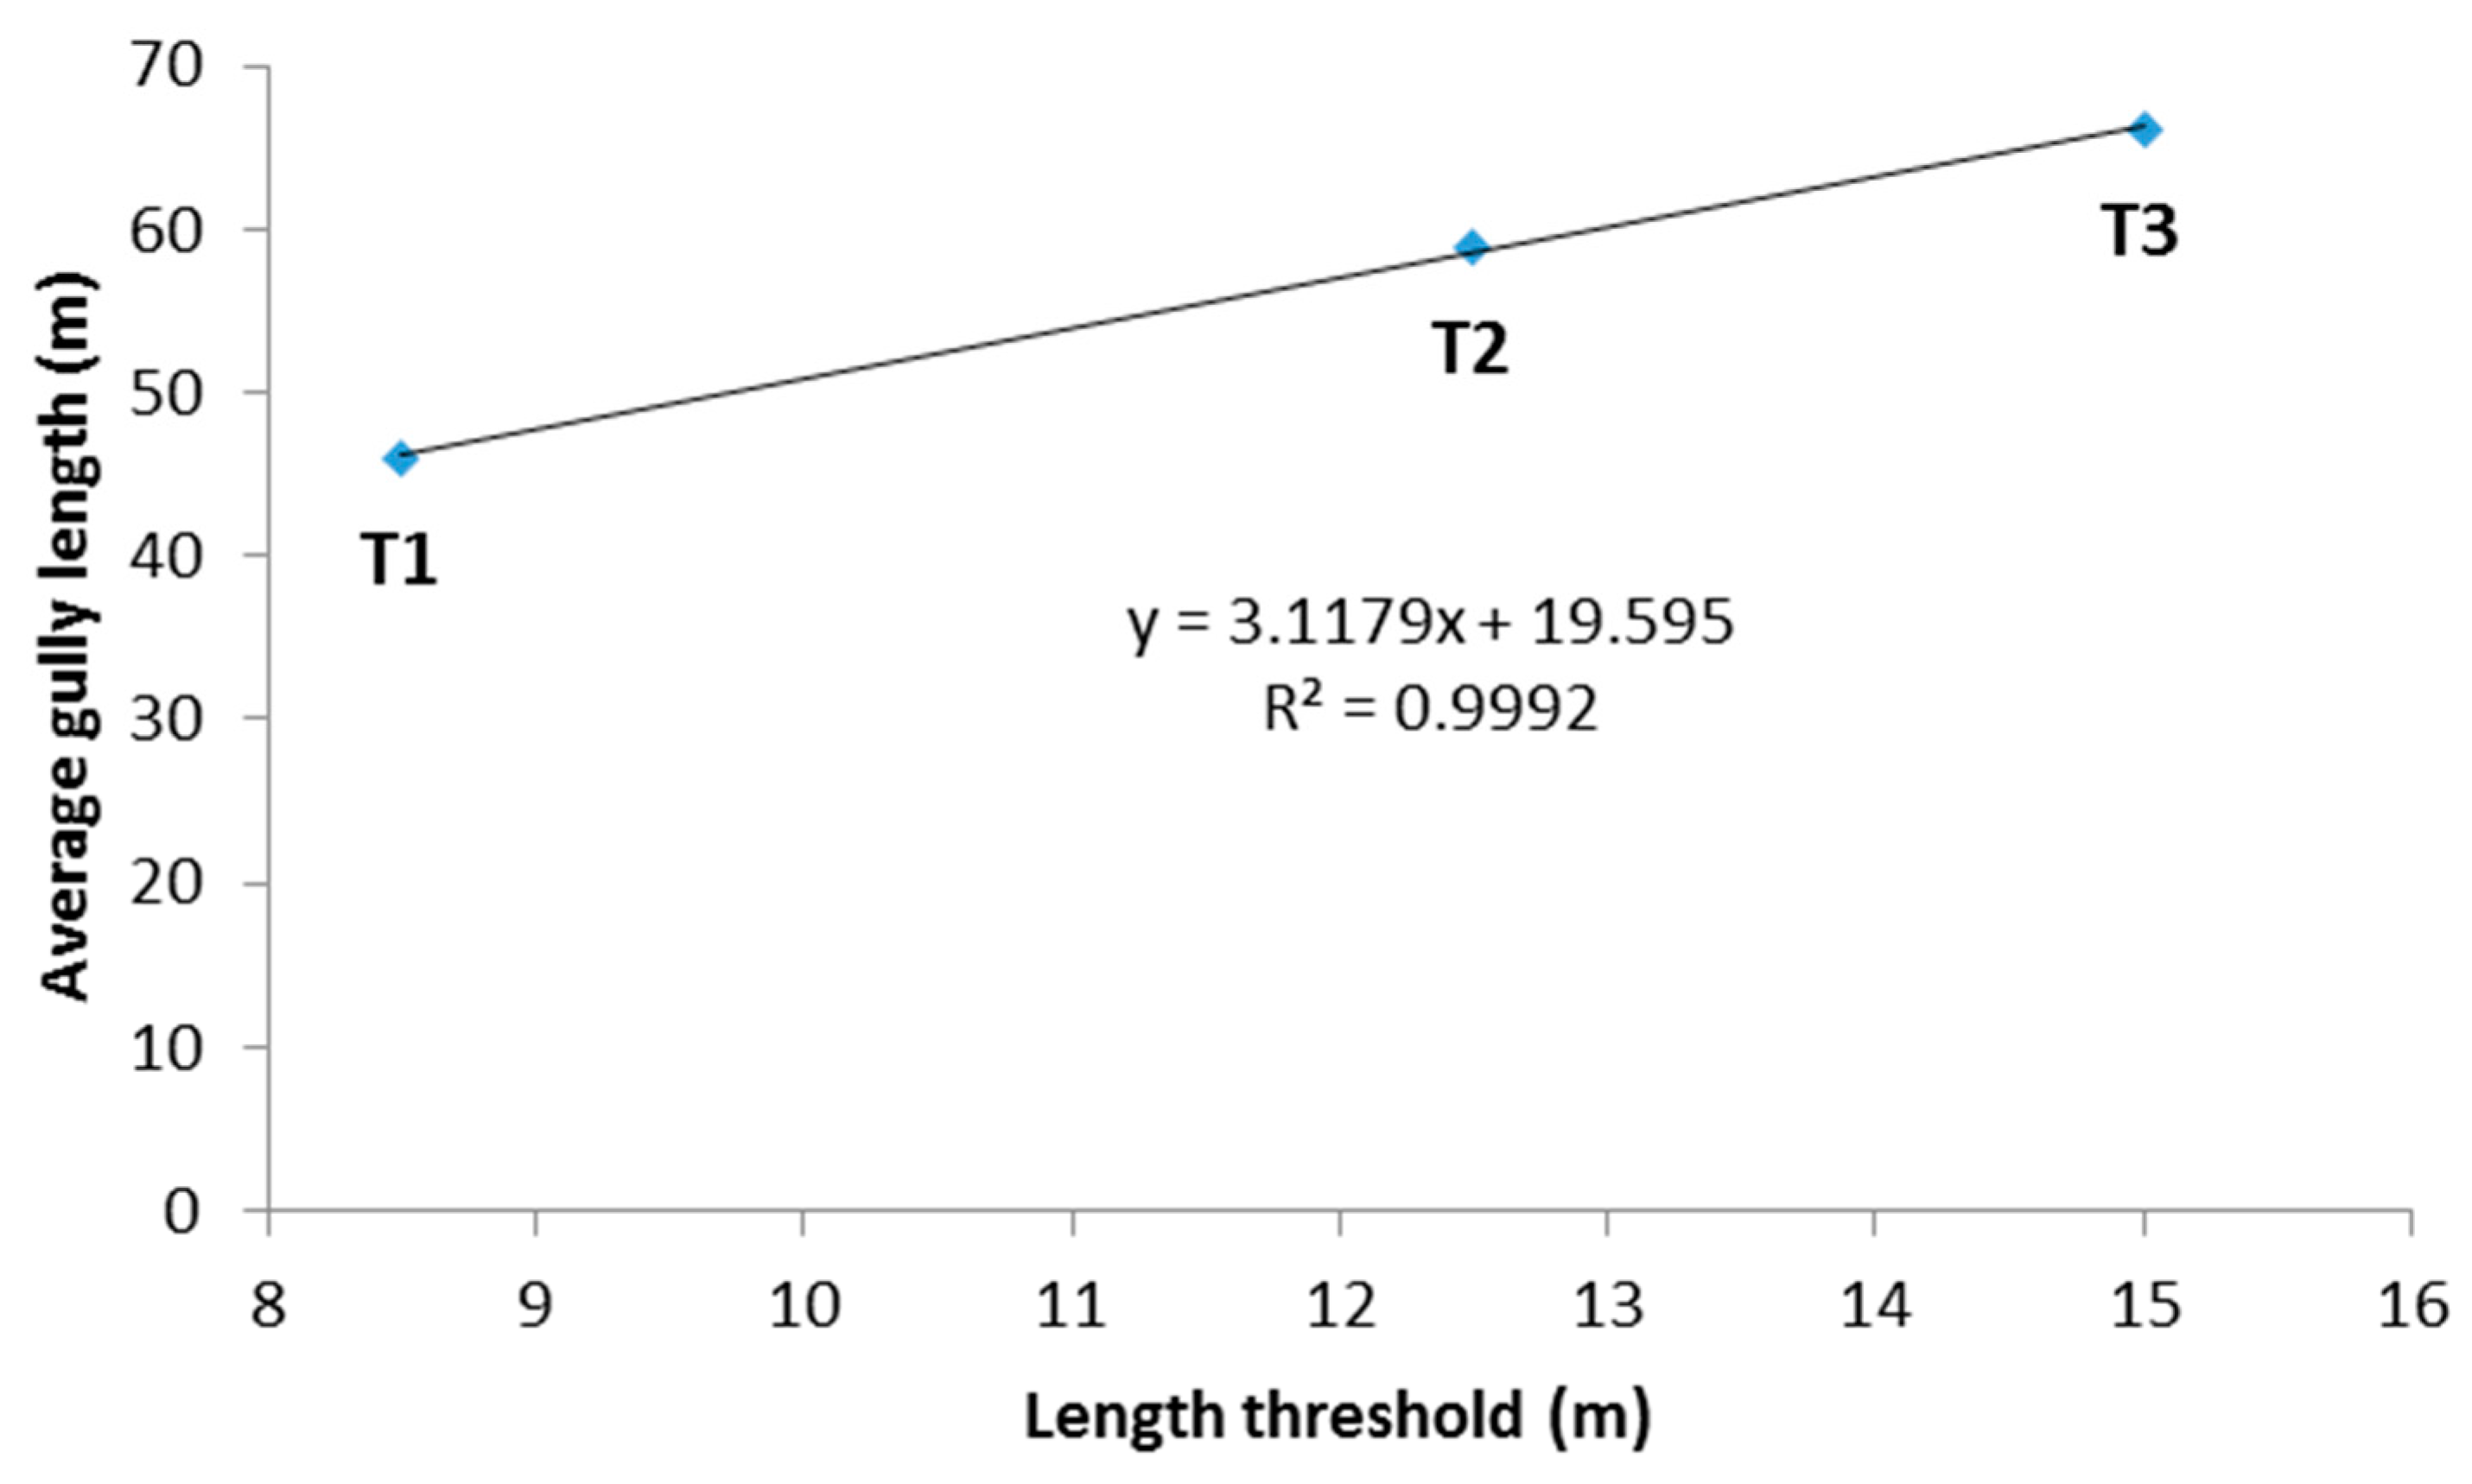
The parameters of length threshold were different in the three areas. T1 has the shortest length threshold of 8.5 m, followed by T2 and T3. Length threshold played a key role in ephemeral gully extraction to filter the remaining noise in the image after Canny edge detection. A small threshold may include considerable noise apart from ephemeral gullies. Meanwhile, a large threshold would neglect short ephemeral gullies. The optimum threshold should be a balance of maximum noise removal and ephemeral gully detection. Therefore, the length threshold acquired by the quality index through a series of experiments was optimally certified. A positive correlation between the length threshold and average gully length was observed, with the R2 value of 0.99 (Figure 11). This finding indicates that a long average ephemeral gully leads to a large threshold. Notably, a long average ephemeral gully leads to highly accurate extraction results.
5. Conclusions
Soil loss is definitely intensified with the development of the hillslope ephemeral gully. Monitoring ephemeral gullies will help researchers understand their numbers, densities, and distributions, which are used for soil planning and water conservation [67].
This study proposed a method for semi-automatically mapping ephemeral gullies based on VHR images. Experiments in three different areas with different source VHR images verified the replicability of this method. The accuracy of the extracted results varied largely in the three areas. Except for T1 area, which exhibits the lowest accuracy, the accuracy of correctness ranged from 71.11% to 85.05%, completeness ranged from 91.43% to 92.86%, and quality ranged from 66.67% to 79.82%. Although the accuracy in the T1 area was low, the performance of the directional edge detection method in other areas was regarded as acceptable. This finding will be beneficial in extracting ephemeral gullies in a large area.
The quality of the remote sensing image is the key factor influencing the performance of this method. The image of the T1 area was inappropriately tested for ephemeral gully extraction because the grass and shrubs within the ephemeral gullies are similar to that of the surroundings, which led to no apparent spectrum contrast difference between the ephemeral gully and background. The high accuracy of ephemeral gully extraction relies on an image with no or less grass within ephemeral gullies. Generally, grass and shrubs are dried in the winter season in the Northern Chinese Loess Plateau. The morphology of ephemeral gullies in the land surface is clearer than that in the summer season. Therefore, the image acquired in the winter season is believed to help improve the accuracy of gully extraction. Perciano combined different sources and temporal images to improve the accuracy of road extraction [68]. The improvement of ephemeral gully extraction could be assessed by adopting multisource and multi-temporal images in the future.
The optimum length threshold in directional detection can be determined by using the index of quality. The optimum length threshold differs in various areas. However, the length thresholds exhibit a strong positive relationship with the average length of ephemeral gullies within the three areas. Additional experiments in other areas should be conducted to validate this relationship when applying the proposed method in loess hilly areas of the Northern Loess Plateau of China.
The accuracy of ephemeral gully extraction still needs to be improved in future works, particularly in the aspect of adaptive length threshold in directional edge searching.
Acknowledgments
We are grateful for the financial support provided by the National Natural Science Foundation of China (grant numbers 41771415, 41471316), the Priority Academic Program Development of Jiangsu Higher Education Institutions (number 164320H116), and the Postgraduate Research and Practice Innovation Program of Jiangsu Province (number KYCX17_1066).
Author Contributions
Xin Yang conceived and designed the methodology and wrote the paper; Wen Dai performed the experiments and data analysis; and Guoan Tang and Min Li supervised the study and reviewed the manuscript. All authors read and approved the manuscript.
Conflicts of Interest
The authors declare no conflict of interest.
References
- Poesen, J.; Govers, G.; Boardman, J.; Foster, I.D.L.; Dearing, J.A. Gully erosion in the loam belt of belgium: Typology and control measures. In Soil Erosion on Agricultural Land, Proceedings of a Workshop Sponsored by the British Geomorphological Research Group, Coventry, UK, January 1989; John Wiley & Sons Ltd.: Hoboken, NJ, USA, 1990; pp. 513–530. [Google Scholar]
- Jwa, P. Conditions for gully formation in the belgian loam belt and some ways to control them. Soil Technol. 1989, 2, 78–81. [Google Scholar]
- Zhu, X. Classification on the soil erosion in the loess region. Acta Pedol. Sin. 1956, 4, 99–115. (In Chinese) [Google Scholar]
- Laixing, L. A tentative classification of landforms in the loess plateau. Acta Geogr. Sin. 1956, 23, 201–222. (In Chinese) [Google Scholar]
- Foster, G.R. Understanding ephemeral gully erosion. Soil Conserv. 1986, 2, 90–125. [Google Scholar]
- Liu, Y.B.; Zhu, X.M.; Zhou, P.H.; Tang, K.L. The laws of hillslope channel erosion occurrence and development on loess plateau. Mem. Northwest. Inst. Soil Water Conserv. Acad. Sin. 1988, 1, 9–18. (In Chinese) [Google Scholar]
- Poesen, J.W.A.; Torri, D.B.; Vanwalleghem, T. Gully erosion: Procedures to adopt when modelling soil erosion in landscapes affected by gullying. In Handbook of Erosion Modelling; John Wiley & Sons: Chichester, UK, 2010; pp. 360–386. [Google Scholar]
- Zheng, F.; Xu, X.; Qin, C. A review of gully erosion process research. Trans. Chin. Soc. Agric. Mach. 2016, 47, 48–59. (In Chinese) [Google Scholar]
- Tang, K.; Zheng, S.; Xi, D.; Sun, B. Soil erosion and its prevention and control of sloping farmland in the xingzi watershed of loess plateau of China. J. Soil Water Conserv. 1983, 43–48. (In Chinese) [Google Scholar]
- Vandaele, K.; Poesen, J.; Govers, G.; Wesemael, B.V. Geomorphic threshold conditions for ephemeral gully incision. Geomorphology 1996, 16, 161–173. [Google Scholar] [CrossRef]
- Desmet, P.J.J.; Poesen, J.; Govers, G.; Vandaele, K. Importance of slope gradient and contributing area for optimal prediction of the initiation and trajectory of ephemeral gullies. Catena 1999, 37, 377–392. [Google Scholar] [CrossRef]
- Moore, I.D.; Burch, G.J.; Mackenzie, D.H. Topographic effects on the distribution of surface soil water and the location of ephemeral gullies. Trans. ASAE 1988, 31, 1098–1107. [Google Scholar] [CrossRef]
- Vanwalleghem, T.; Poesen, J.; Nachtergaele, J.; Verstraeten, G. Characteristics, controlling factors and importance of deep gullies under cropland on loess-derived soils. Geomorphology 2005, 69, 76–91. [Google Scholar] [CrossRef]
- Zhang, K. A study on characteristic value of shallow gully erosion genesis on slope farmland in the leess plateau. J. Soil Water Conserv. 1991, 2, 8–13. (In Chinese) [Google Scholar]
- Bin-Bing, L.I.; Zheng, F.L.; Zhang, P. Geomorphic threshold determination for ephemeral gully and gully erosion areas in the loess hilly gully region. Bull. Soil Water Conserv. 2008, 5, 16–20. [Google Scholar]
- Gang, H.U.; Yong Qiu, W.U.; Liu, B.Y.; Zhang, Y.G.; Wei, X. Geomorphic threshold model for ephemeral gully incision in rolling hills with black soil in northeast china. Sci. Geogr. Sin. 2006, 26, 449–454. (In Chinese) [Google Scholar]
- Capra, A.; Porto, P.; Scicolone, B. Relationships between rainfall characteristics and ephemeral gully erosion in a cultivated catchment in sicily (Italy). Soil Tillage Res. 2009, 105, 77–87. [Google Scholar] [CrossRef]
- Wilson, G. Understanding soil-pipe flow and its role in ephemeral gully erosion. Hydrol. Process. 2011, 25, 2354–2364. [Google Scholar] [CrossRef]
- Wilson, G.V.; Rigby, J.R.; Dabney, S.M. Soil pipe collapses in a loess pasture of goodwin creek watershed, mississippi: Role of soil properties and past land use. Earth Surf. Process. Landf. 2015, 40, 1448–1463. [Google Scholar] [CrossRef]
- Zheng, F.; Kang, S. Erosion and sediment yield in different zones of loess slopes. Chin. Geogr. Sci. 1998, 53, 422–428. (In Chinese) [Google Scholar]
- Keli, Z. A studay on distribution of erosion and sediment yield on loess slope and the relationship between the distribution and rain characteristics. J. Sediment Res. 1991, 4, 39–46. (In Chinese) [Google Scholar]
- Woodward, D.E. Method to predict cropland ephemeral gully erosion. Catena 1999, 37, 393–399. [Google Scholar] [CrossRef]
- Daggupati, P.; Sheshukov, A.Y.; Douglas-Mankin, K.R. Evaluating ephemeral gullies with a process-based topographic index model. Catena 2014, 113, 177–186. [Google Scholar] [CrossRef]
- Gordon, L.M.; Bennett, S.J.; Bingner, R.L.; Theurer, F.D.; Alonso, C.V. Simulating ephemeral gully erosion in annagnps. Trans. ASABE 2007, 50, 857–866. [Google Scholar] [CrossRef]
- Taguas, E.V.; Yuan, Y.; Bingner, R.L.; Gómez, J.A. Modeling the contribution of ephemeral gully erosion under different soil managements: A case study in an olive orchard microcatchment using the annagnps model. Catena 2012, 98, 1–16. [Google Scholar] [CrossRef]
- Li, H.; Cruse, R.M.; Bingner, R.L.; Gesch, K.R.; Zhang, X. Evaluating ephemeral gully erosion impact on zea mays l. Yield and economics using annagnps. Soil Tillage Res. 2016, 155, 157–165. [Google Scholar] [CrossRef]
- Jiang, Z.S.; Zheng, F.L.; Min, W.U. Prediction model of water erosion on hillslopes. J. Sediment Res. 2005, 4, 1–6. (In Chinese) [Google Scholar]
- Zhang, Y.D.; Shu-Fang, W.U.; Feng, H.; Huo, Y.Y. Experimental study of rill dynamic development process and its critical dynamic conditions on loess slope. J. Sediment Res. 2013, 2, 25–32. (In Chinese) [Google Scholar]
- Miernecki, M.; Wigneron, J.P.; Lopez-Baeza, E.; Kerr, Y.; Jeu, R.D.; Lannoy, G.J.M.D.; Jackson, T.J.; O’Neill, P.E.; Schwank, M.; Moran, R.F. Comparison of smos and smap soil moisture retrieval approaches using tower-based radiometer data over a vineyard field. Remote Sens. Environ. 2014, 154, 89–101. [Google Scholar] [CrossRef] [Green Version]
- Fernandez-Moran, R.; Wigneron, J.P.; Lopez-Baeza, E.; Al-Yaari, A.; Coll-Pajaron, A.; Mialon, A.; Miernecki, M.; Parrens, M.; Salgado-Hernanz, P.M.; Schwank, M. Roughness and vegetation parameterizations at l-band for soil moisture retrievals over a vineyard field. Remote Sens. Environ. 2015, 170, 269–279. [Google Scholar] [CrossRef]
- Wells, R.R.; Momm, H.G.; Bennett, S.J.; Gesch, K.R.; Dabney, S.M.; Cruse, R.; Wilson, G.V. A measurement method for rill and ephemeral gully erosion assessments. Soil Sci. Soc. Am. J. 2016, 80, 203–214. [Google Scholar] [CrossRef]
- Wells, R.R.; Momm, H.G.; Rigby, J.R.; Bennett, S.J.; Bingner, R.L.; Dabney, S.M. An empirical investigation of gully widening rates in upland concentrated flows. Catena 2013, 101, 114–121. [Google Scholar] [CrossRef]
- Gessesse, G.D.; Fuchs, H.; Mansberger, R.; Klik, A.; Rieke-Zapp, D.H. Assessment of erosion, deposition and rill development on irregular soil surfaces using close range digital photogrammetry. Photogramm. Rec. 2010, 25, 299–318. [Google Scholar] [CrossRef]
- Berger, C.; Schulze, M.; Rieke-Zapp, D.; Schlunegger, F. Rill development and soil erosion: A laboratory study of slope and rainfall intensity. Earth Surf. Process. Landf. 2010, 35, 1456–1467. [Google Scholar] [CrossRef]
- Zhang, P.; Zheng, F.; Chen, J.; Wang, B.; Ding, X. Application of high-precision gps to dynamic monitoring gully erosion processes. Trop. Geogr. 2009, 29, 398–406. (In Chinese) [Google Scholar]
- Shellberg, J.G.; Spencer, J.; Brooks, A.P.; Pietsch, T.J. Degradation of the mitchell river fluvial megafan by alluvial gully erosion increased by post-european land use change, queensland, australia. Geomorphology 2016, 266, 105–120. [Google Scholar] [CrossRef]
- Choi, K.; Chang, M.H.; Mi, H.K.; Oh, C.R.; Jung, J.H. Morphologic evolution of macrotidal estuarine channels in gomso bay, west coast of korea: Implications for the architectural development of inclined heterolithic stratification. Mar. Geol. 2013, 346, 343–354. [Google Scholar] [CrossRef]
- Fuller, I.C.; Marden, M. Slope–channel coupling in steepland terrain: A field-based conceptual model from the tarndale gully and fan, waipaoa catchment, new zealand. Geomorphology 2011, 128, 105–115. [Google Scholar] [CrossRef]
- Perroy, R.L.; Bookhagen, B.; Asner, G.P.; Chadwick, O.A. Comparison of gully erosion estimates using airborne and ground-based lidar on santa cruz island, california. Geomorphology 2010, 118, 288–300. [Google Scholar] [CrossRef]
- Peter, K.D.; D’Oleire-Oltmanns, S.; Ries, J.B.; Marzolff, I.; Hssaine, A.A. Soil erosion in gully catchments affected by land-levelling measures in the souss basin, morocco, analysed by rainfall simulation and uav remote sensing data. Catena 2014, 113, 24–40. [Google Scholar] [CrossRef]
- Eltner, A.; Baumgart, P.; Maas, H.G.; Faust, D. Multi-temporal uav data for automatic measurement of rill and interrill erosion on loess soil. Earth Surf. Process. Landf. 2015, 40, 741–755. [Google Scholar] [CrossRef]
- Stöcker, C.; Eltner, A.; Karrasch, P. Measuring gullies by synergetic application of uav and close range photogrammetry—A case study from andalusia, spain. Catena 2015, 132, 1–11. [Google Scholar] [CrossRef]
- Neugirg, F.; Kaiser, A.; Schmidt, J.; Becht, M.; Haas, F. Quantification, analysis and modelling of soil erosion on steep slopes using lidar and uav photographs. Proc. Int. Assoc. Hydrol. Sci. 2015, 367, 51–58. [Google Scholar] [CrossRef]
- Goodwin, N.R.; Armston, J.D.; Muir, J.; Stiller, I. Monitoring gully change: A comparison of airborne and terrestrial laser scanning using a case study from aratula, queensland. Geomorphology 2017, 282, 195–208. [Google Scholar] [CrossRef]
- Li, A.Y.; Wu, X.Q.; Zhu, Q.K. Distribution characteristics and relation with site type of ephemeral gully in loess plateau of northern shaanxi province. J. Northwest A F Univ. 2010, 38, 79–85. (In Chinese) [Google Scholar]
- Zhao, W.J.; Zhi-Chao, X.U.; Zhang, Y.; Zhu, Y.; Zhu, Q.K. Study on distribution of ephemeral gullies in semiarid loess area. Arid Zone Res. 2011, 28, 586–591. (In Chinese) [Google Scholar]
- Maugnard, A.; Dyck, S.V.; Bielders, C.L. Assessing the regional and temporal variability of the topographic threshold for ephemeral gully initiation using quantile regression in wallonia (Belgium). Geomorphology 2014, 206, 165–177. [Google Scholar] [CrossRef]
- Fiorucci, F.; Ardizzone, F.; Rossi, M.; Torri, D. The use of stereoscopic satellite images to map rills and ephemeral gullies. Remote Sens. 2015, 7, 14151–14178. [Google Scholar] [CrossRef]
- Shruthi, R.B.V.; Kerle, N.; Jetten, V. Object-based gully feature extraction using high spatial resolution imagery. Geomorphology 2011, 134, 260–268. [Google Scholar] [CrossRef]
- Shruthi, R.B.V.; Kerle, N.; Jetten, V.; Abdellah, L.; Machmach, I. Quantifying temporal changes in gully erosion areas with object oriented analysis. Catena 2015, 128, 262–277. [Google Scholar] [CrossRef]
- Shruthi, R.B.; Kerle, N.; Jetten, V.; Stein, A. Object-based gully system prediction from medium resolution imagery using random forests. Geomorphology 2014, 216, 283–294. [Google Scholar] [CrossRef]
- Mena, J.B. State of the art on automatic road extraction for gis update: A novel classification. Pattern Recognit. Lett. 2003, 24, 3037–3058. [Google Scholar] [CrossRef]
- Wang, W.; Yang, N.; Zhang, Y.; Wang, F.; Cao, T.; Eklund, P. A review of road extraction from remote sensing images. J. Traffic Transp. Eng. 2016, 3, 271–282. [Google Scholar] [CrossRef]
- Hu, J.; Razdan, A.; Femiani, J.C.; Cui, M.; Wonka, P. Road network extraction and intersection detection from aerial images by tracking road footprints. IEEE Trans. Geosci. Remote Sens. 2007, 45, 4144–4157. [Google Scholar] [CrossRef]
- He, Y.; Wang, H.; Zhang, B. Color-based road detection in urban traffic scenes. IEEE Trans. Intell. Transp. Syst. 2004, 5, 309–318. [Google Scholar] [CrossRef]
- Auclair-Fortier, M.F.; Ziou, D.; Armenakis, C. Survey of work on road extraction in aerial and satellite images. In Proceedings of the 1999 USENIX Annual Technical Conference, Monterey, CA, USA, 6–11 June 1999. [Google Scholar]
- Kluge, K. Extracting road curvature and orientation from image edge points without perceptual grouping into features. In Proceedings of the Intelligent Vehicles ’94 Symposium, Paris, France, 24–26 October 1994; pp. 109–114. [Google Scholar]
- Yang, X.; Li, M.; Na, J.; Liu, K. Gully boundary extraction based on multidirectional hill-shading from high-resolution dems. Trans. Gis 2017, 1–13. [Google Scholar] [CrossRef]
- Yan, S.J.; Tang, G.A.; Li, F.Y.; Zhang, L. Snake model for the extraction of loess shoulder-line from dems. J. Mt. Sci. 2014, 11, 1552–1559. [Google Scholar] [CrossRef]
- Jiang, S.; Tang, G.; Liu, K. A new extraction method of loess shoulder-line based on marr-hildreth operator and terrain mask. PLoS ONE 2015, 10, e0123804. [Google Scholar] [CrossRef] [PubMed]
- Kai, L.; Hu, D.; Guoan, T.; A-Xing, Z.; Xin, Y.; Sheng, J.; Jianjun, C. An object-based approach for two-level gully feature mapping using high-resolution dem and imagery: A case study on hilly loess plateau region, china. Chin. Geogr. Sci. 2017, 27, 415–430. [Google Scholar]
- Kai, L.; Hu, D.; Guoan, T.; Jiaming, N.; Xiaoli, H.; Zhengguang, X.; Xin, Y.; Fayuan, L. Detection of catchment-scale gully-affected areas using unmanned aerial vehicle (uav) on the chinese loess plateau. ISPRS Int. J. Geo-Inf. 2016, 5, 238. [Google Scholar]
- Pal, N.R.; Pal, S.K. A review on image segmentation techniques. Pattern Recognit. 1993, 26, 1277–1294. [Google Scholar] [CrossRef]
- Rong, W.; Li, Z.; Zhang, W.; Sun, L. An improved canny edge detection algorithm. In Proceedings of the 2014 IEEE International Conference on Mechatronics and Automation (ICMA), Tianjin, China, 3–6 August 2014; pp. 577–582. [Google Scholar]
- Clode, S.; Rottensteiner, F.; Kootsookos, P.; Zelniker, E. Detection and vectorization of roads from lidar data. Photogramm. Eng. Remote Sens. 2007, 73, 517–535. [Google Scholar] [CrossRef]
- Li, M.; Stein, A.; Bijker, W.; Zhan, Q. Region-based urban road extraction from vhr satellite images using binary partition tree. Int. J. Appl. Earth Obs. Geoinf. 2016, 44, 217–225. [Google Scholar] [CrossRef]
- Poesen, J.; Nachtergaele, J.; Verstraeten, G.; Valentin, C. Gully erosion and environmental change: Importance and research needs. Catena 2003, 50, 91–133. [Google Scholar] [CrossRef]
- Perciano, T.; Tupin, F.; Hirata, R., Jr.; Cesar, R.M., Jr. A two-level markov random field for road network extraction and its application with optical, sar, and multitemporal data. Int. J. Remote Sens. 2016, 37, 3584–3610. [Google Scholar] [CrossRef]
Figure 1.
Pictures of ephemeral gullies in Jingbian (test area, T1), Loess Plateau of China: (a) ephemeral gullies in south side slope; (b) ephemeral gullies in the west side slope.
Figure 1.
Pictures of ephemeral gullies in Jingbian (test area, T1), Loess Plateau of China: (a) ephemeral gullies in south side slope; (b) ephemeral gullies in the west side slope.
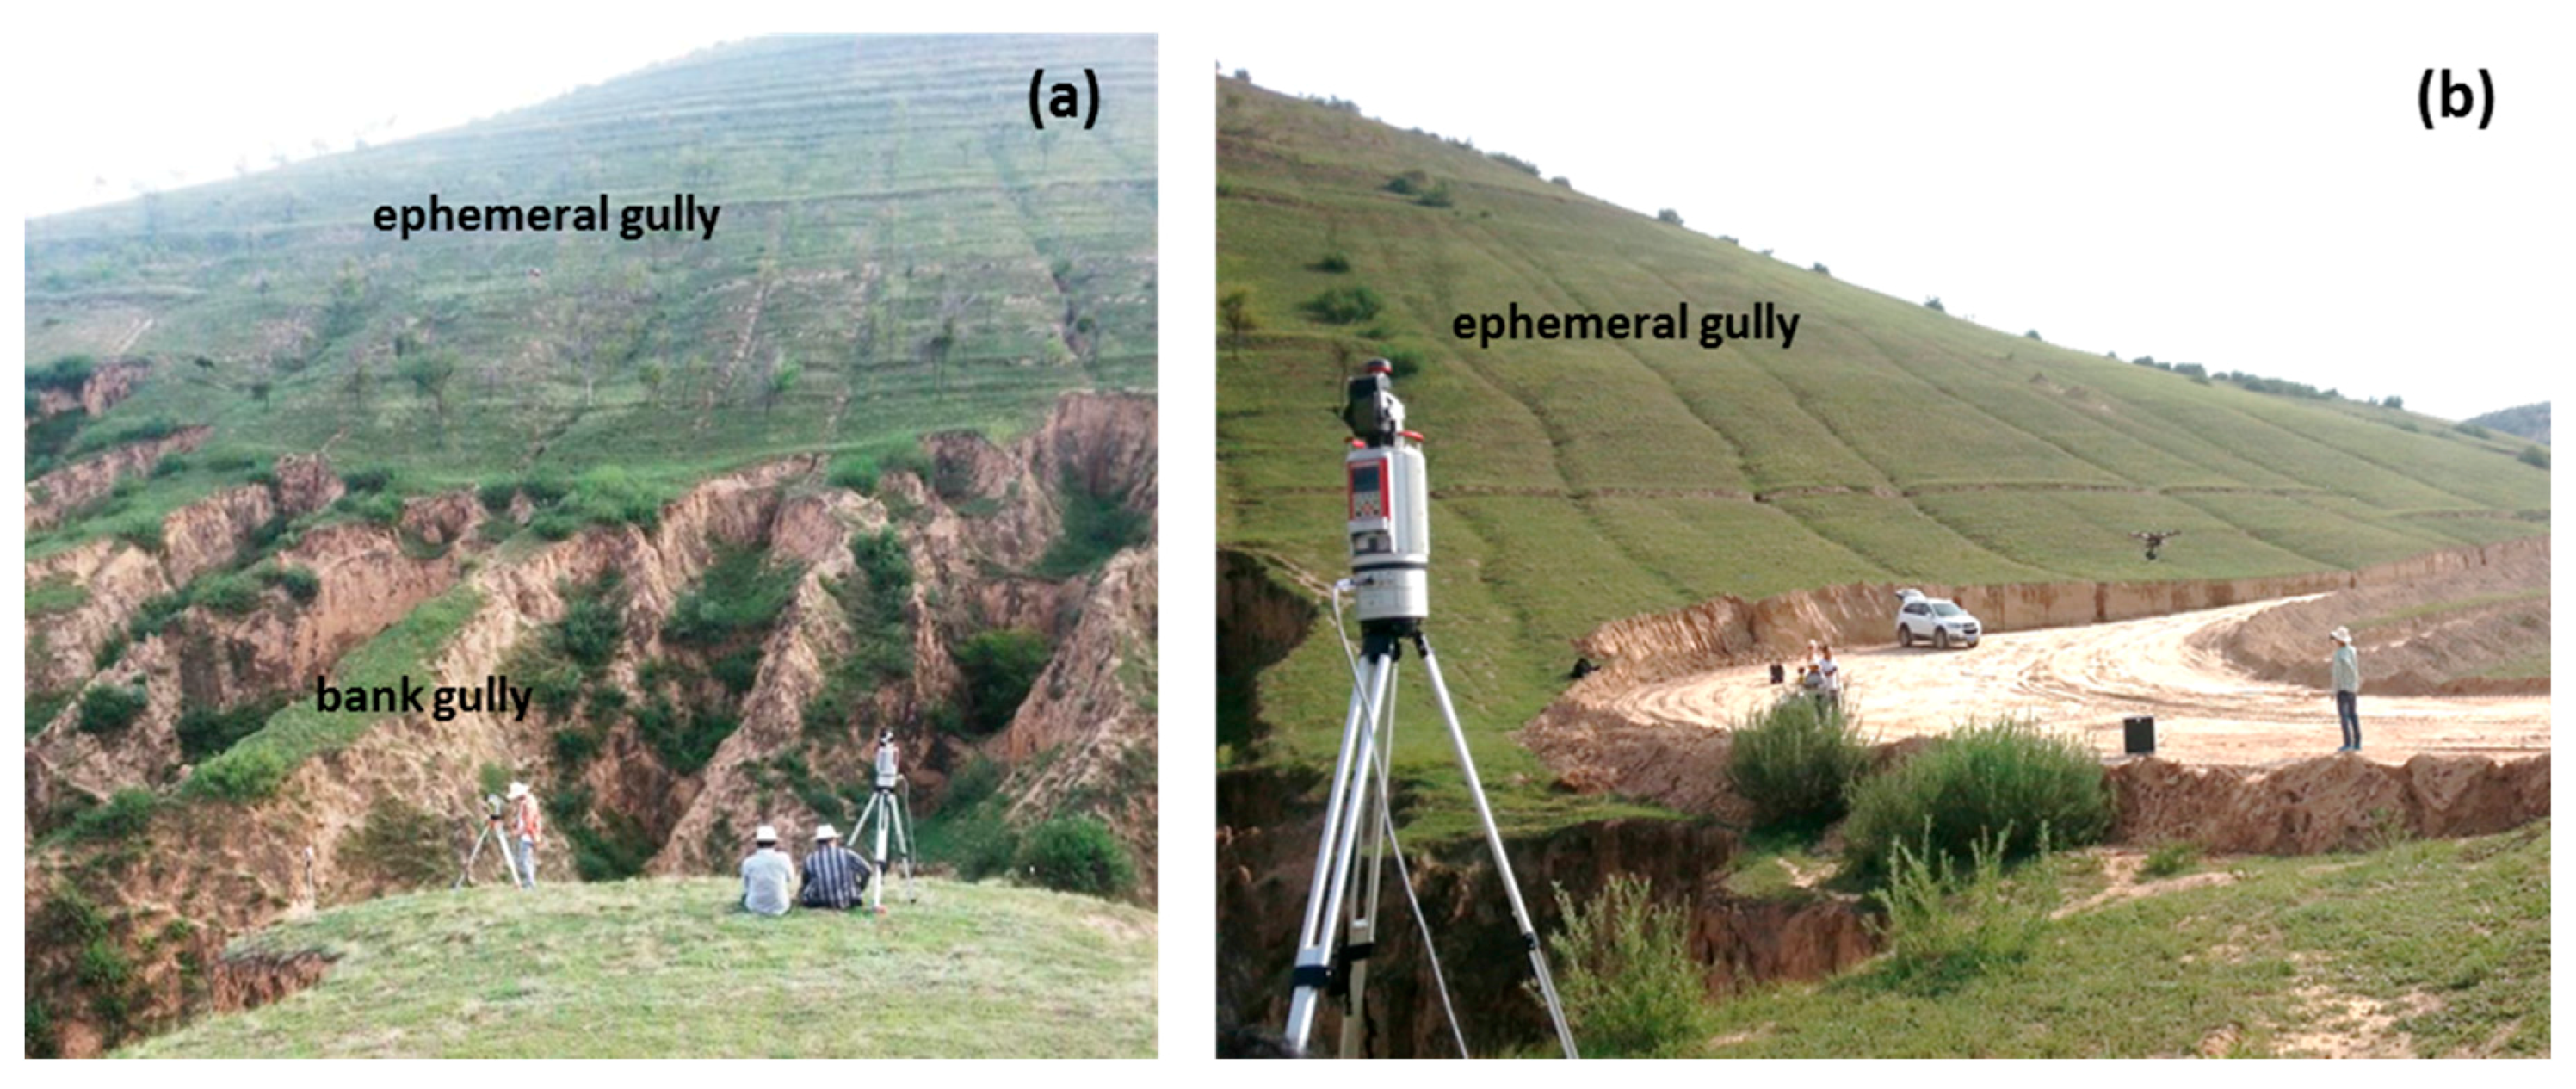
Figure 2.
Location of the study areas and their images: (a) location of the study areas; (b) image of T1; (c) image of T3; and (d) image of T2.
Figure 2.
Location of the study areas and their images: (a) location of the study areas; (b) image of T1; (c) image of T3; and (d) image of T2.

Figure 3.
Ephemeral gullies and their location in a gully system in a high-resolution image.

Figure 4.
Workflow of ephemeral gully extraction.
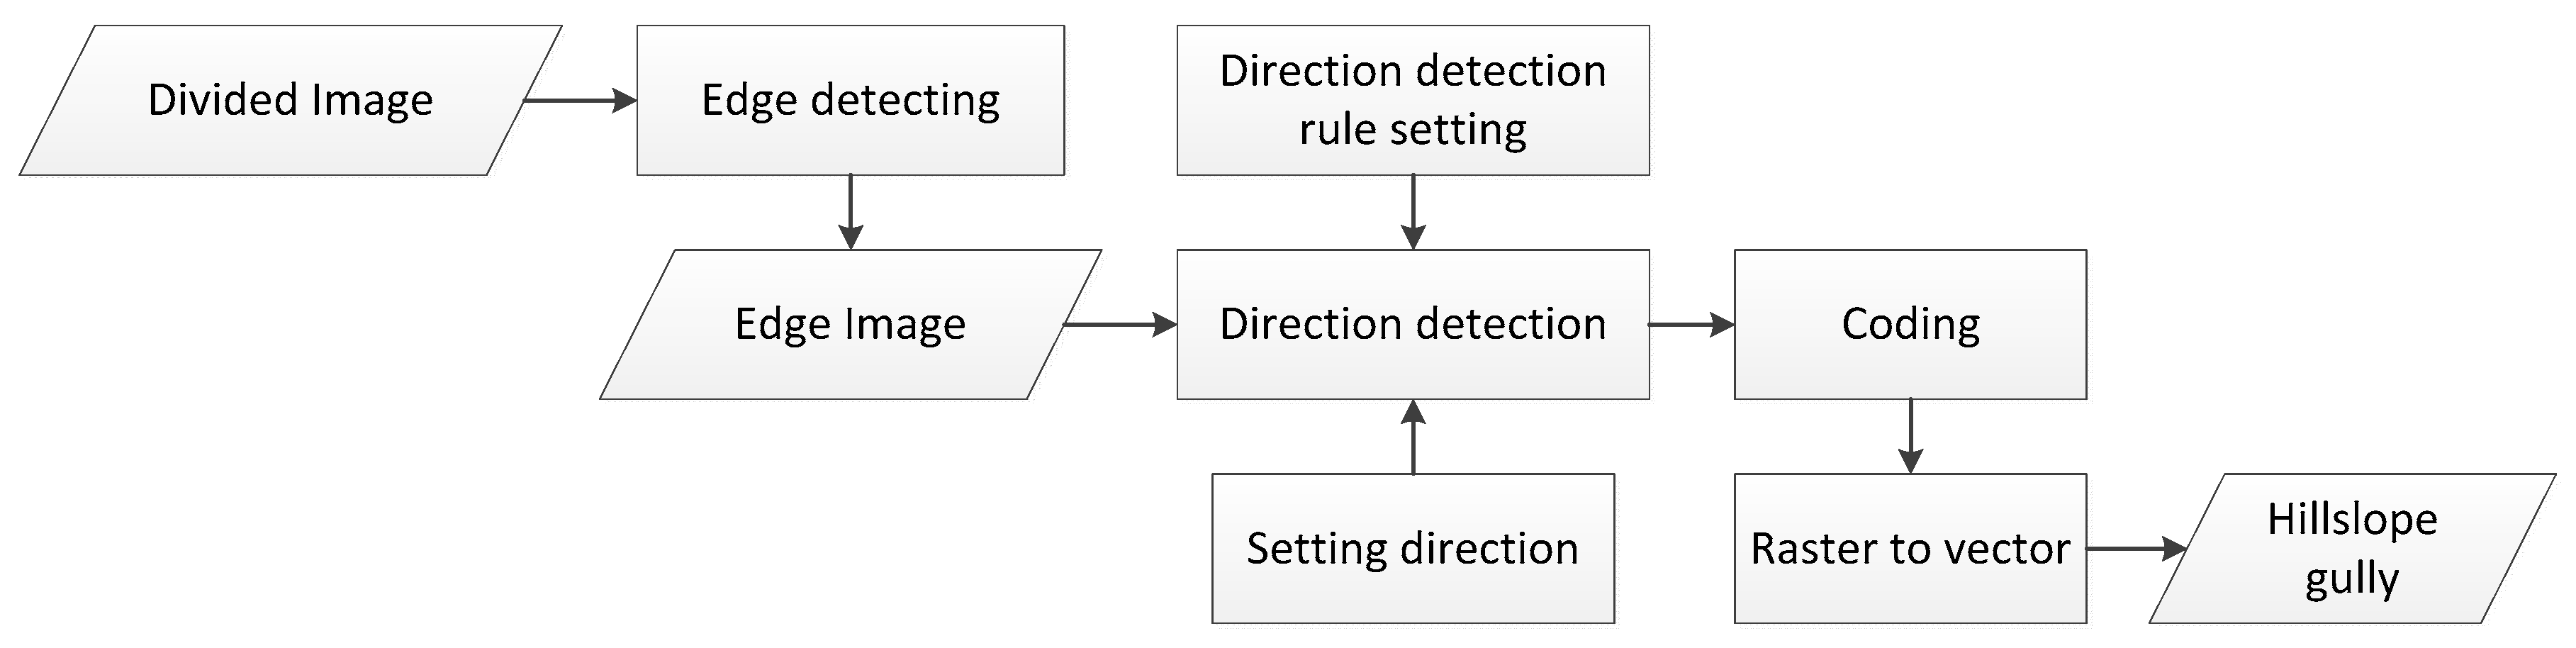
Figure 5.
Comparison of results from different edge detection operators in T1 area: (a) image of the upslope area with ephemeral gully developed; (b) Roberts operator; (c) Sobel operator; (d) Prewitt operator; (e) Log operator; and (f) Canny operator.
Figure 5.
Comparison of results from different edge detection operators in T1 area: (a) image of the upslope area with ephemeral gully developed; (b) Roberts operator; (c) Sobel operator; (d) Prewitt operator; (e) Log operator; and (f) Canny operator.
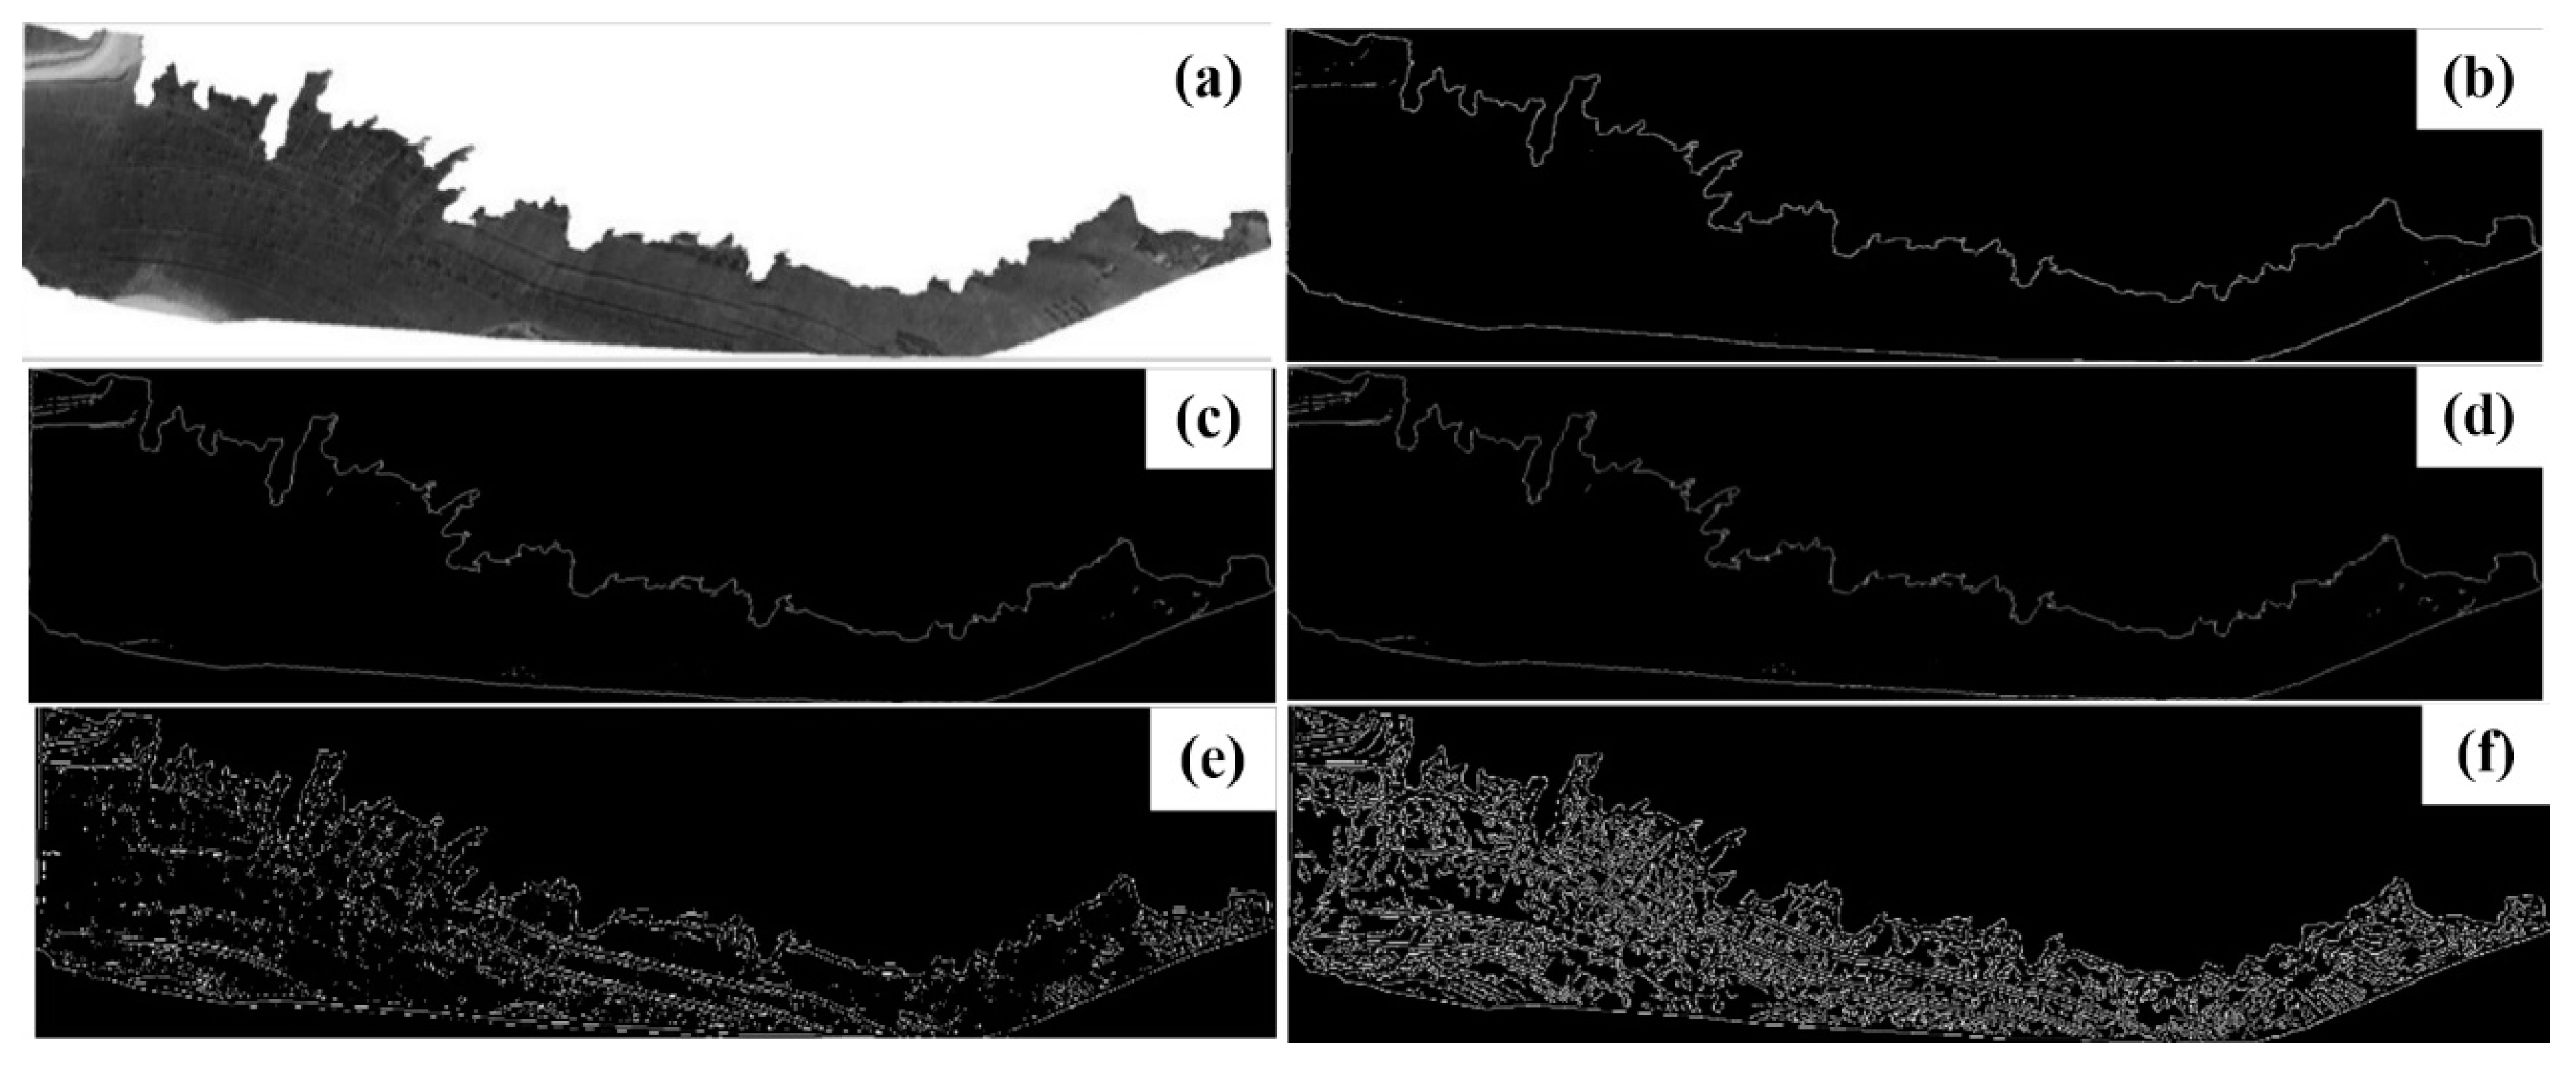
Figure 6.
Ephemeral gully directions and their searching order.
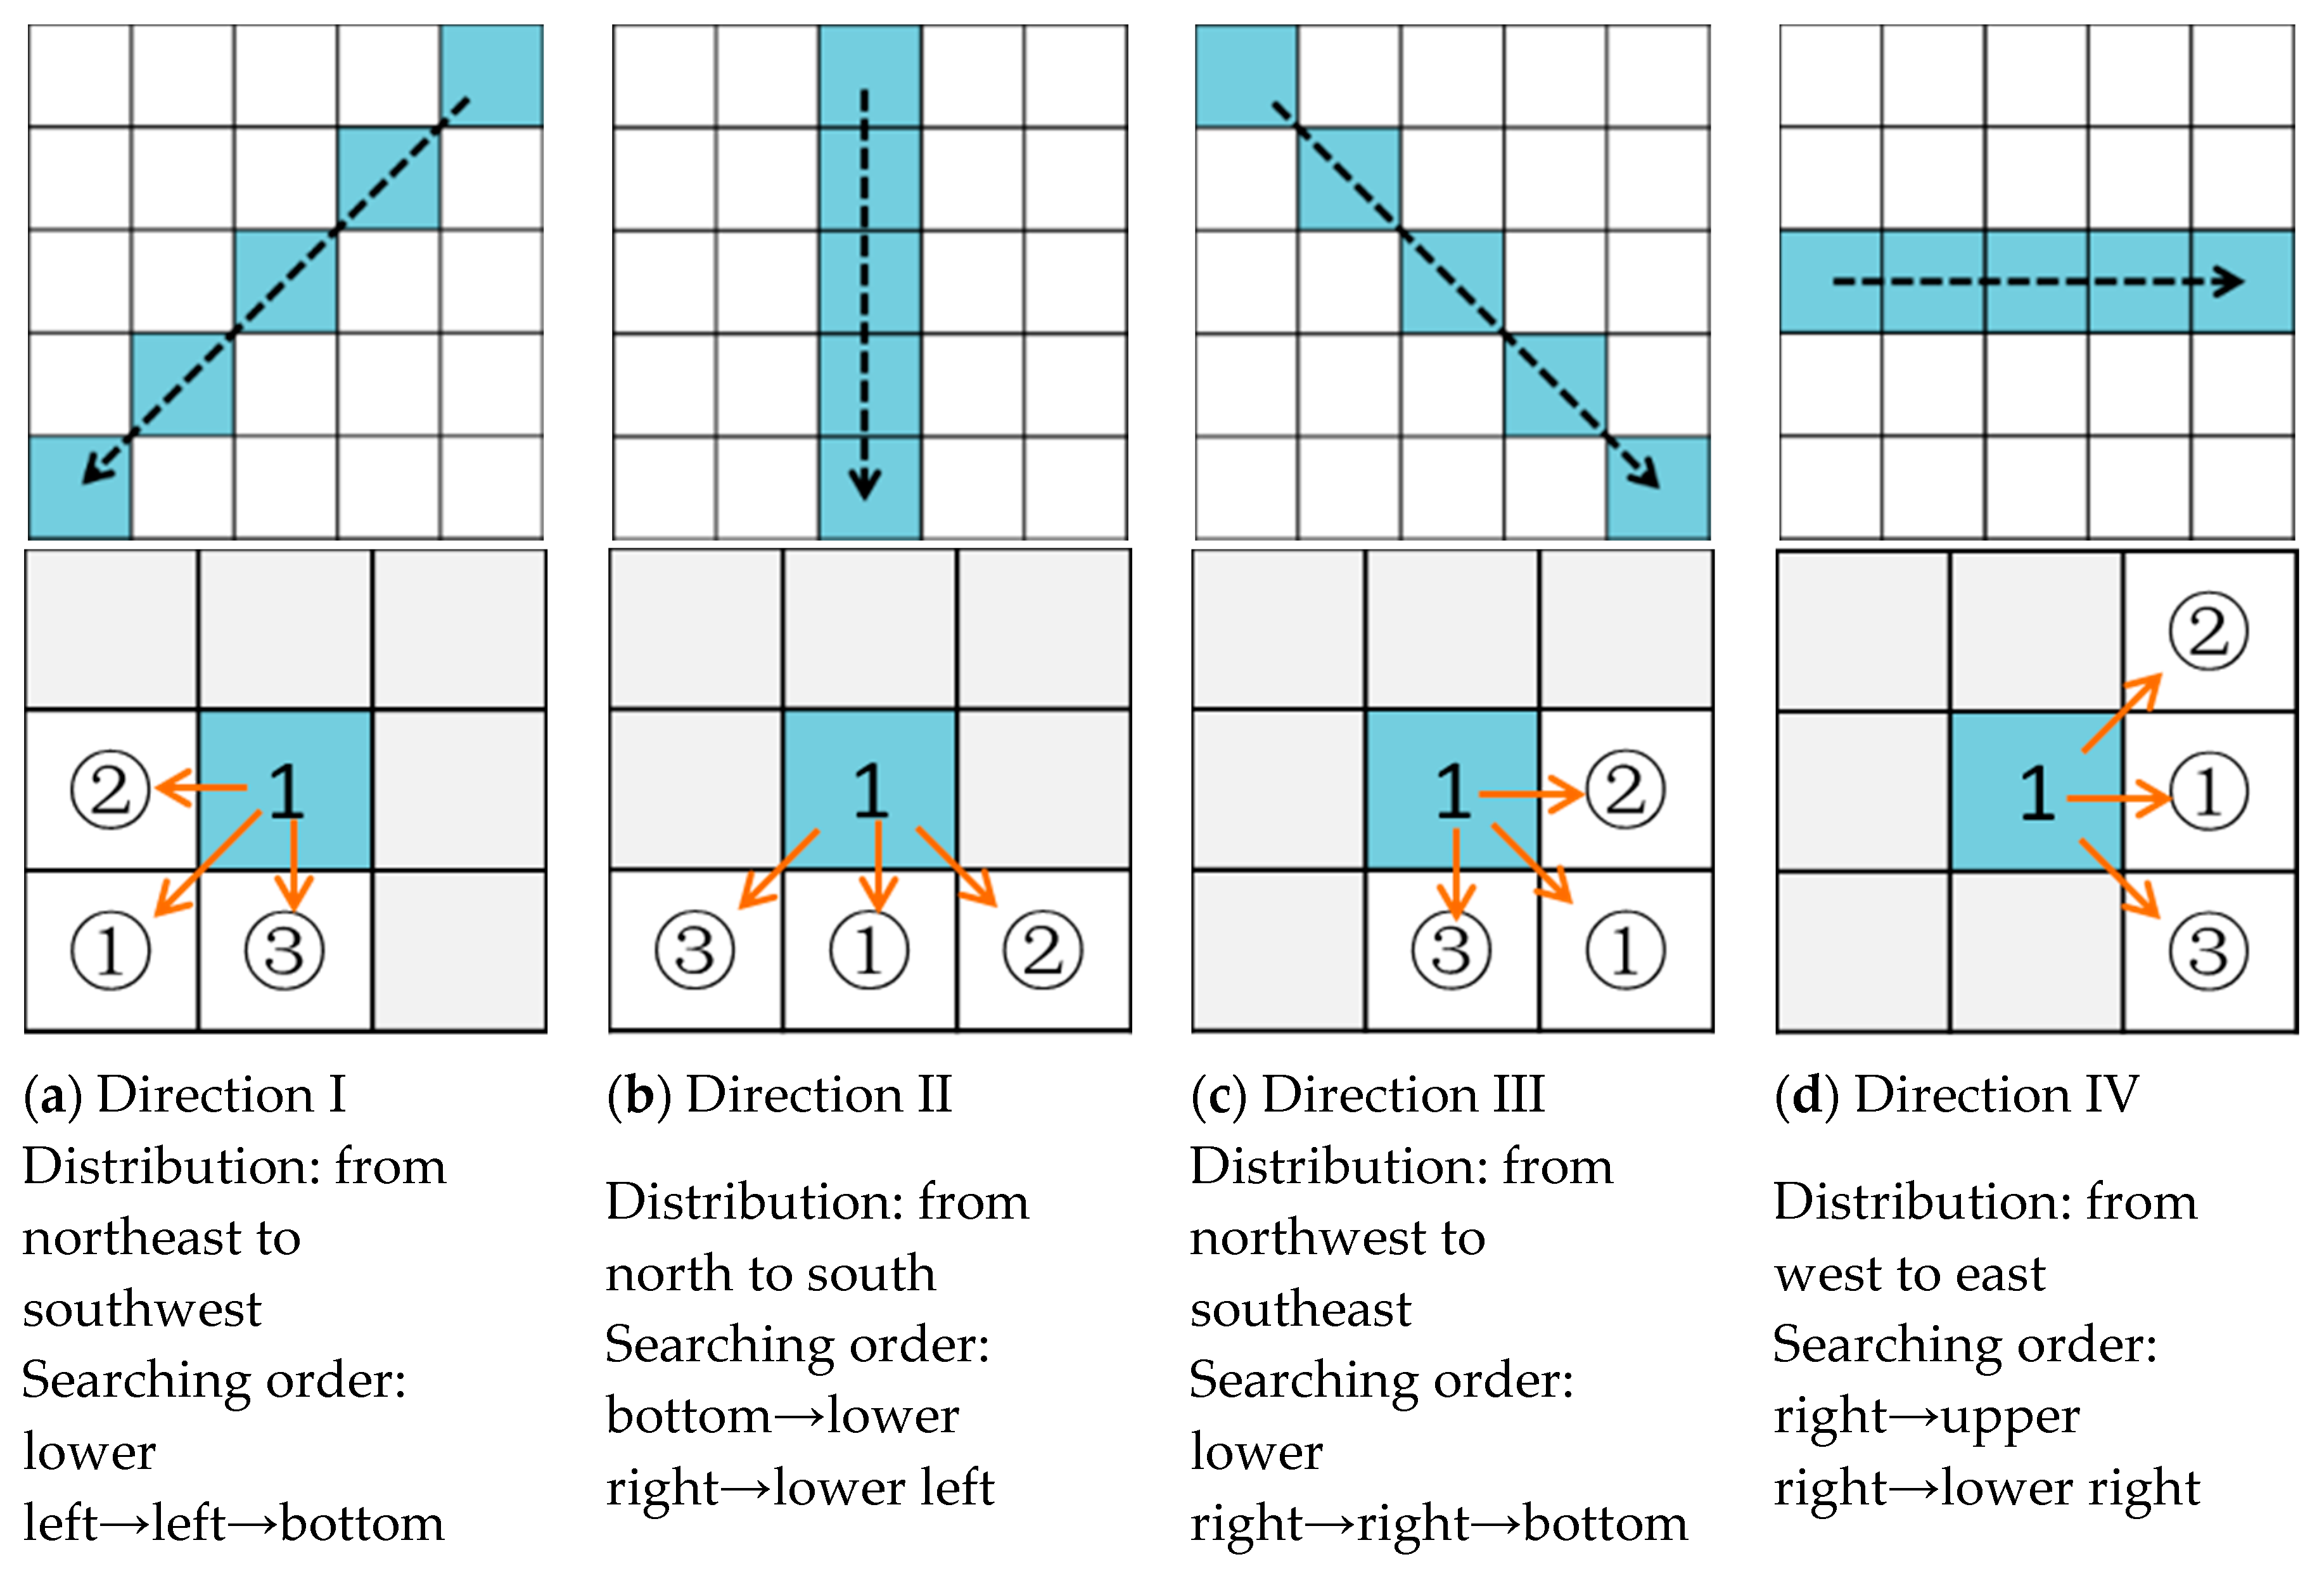
Figure 7.
Directional searching rules of four typical directions.

Figure 8.
Comparison of the sensitivity thresholds of the Canny operator: (a) the self-adapt threshold; (b) the threshold of upper 0.01 and lower 0.004; (c) the threshold of upper 0.02 and lower 0.008; and (d) the threshold of upper 0.05 and lower 0.02.
Figure 8.
Comparison of the sensitivity thresholds of the Canny operator: (a) the self-adapt threshold; (b) the threshold of upper 0.01 and lower 0.004; (c) the threshold of upper 0.02 and lower 0.008; and (d) the threshold of upper 0.05 and lower 0.02.

Figure 9.
Results of different length thresholds: (a) original result of the Canny edge detection; and (b–f) are directional detection results with length threshold of 5, 10, 15, 20, and 25 m respectively.
Figure 9.
Results of different length thresholds: (a) original result of the Canny edge detection; and (b–f) are directional detection results with length threshold of 5, 10, 15, 20, and 25 m respectively.

Figure 10.
Extracted results of ephemeral gullies and their comparison with manual interpretation results : (T1) result in Jingbian area; (T2) result in Dingbian area; and (T3) result in Huanxian area.
Figure 10.
Extracted results of ephemeral gullies and their comparison with manual interpretation results : (T1) result in Jingbian area; (T2) result in Dingbian area; and (T3) result in Huanxian area.
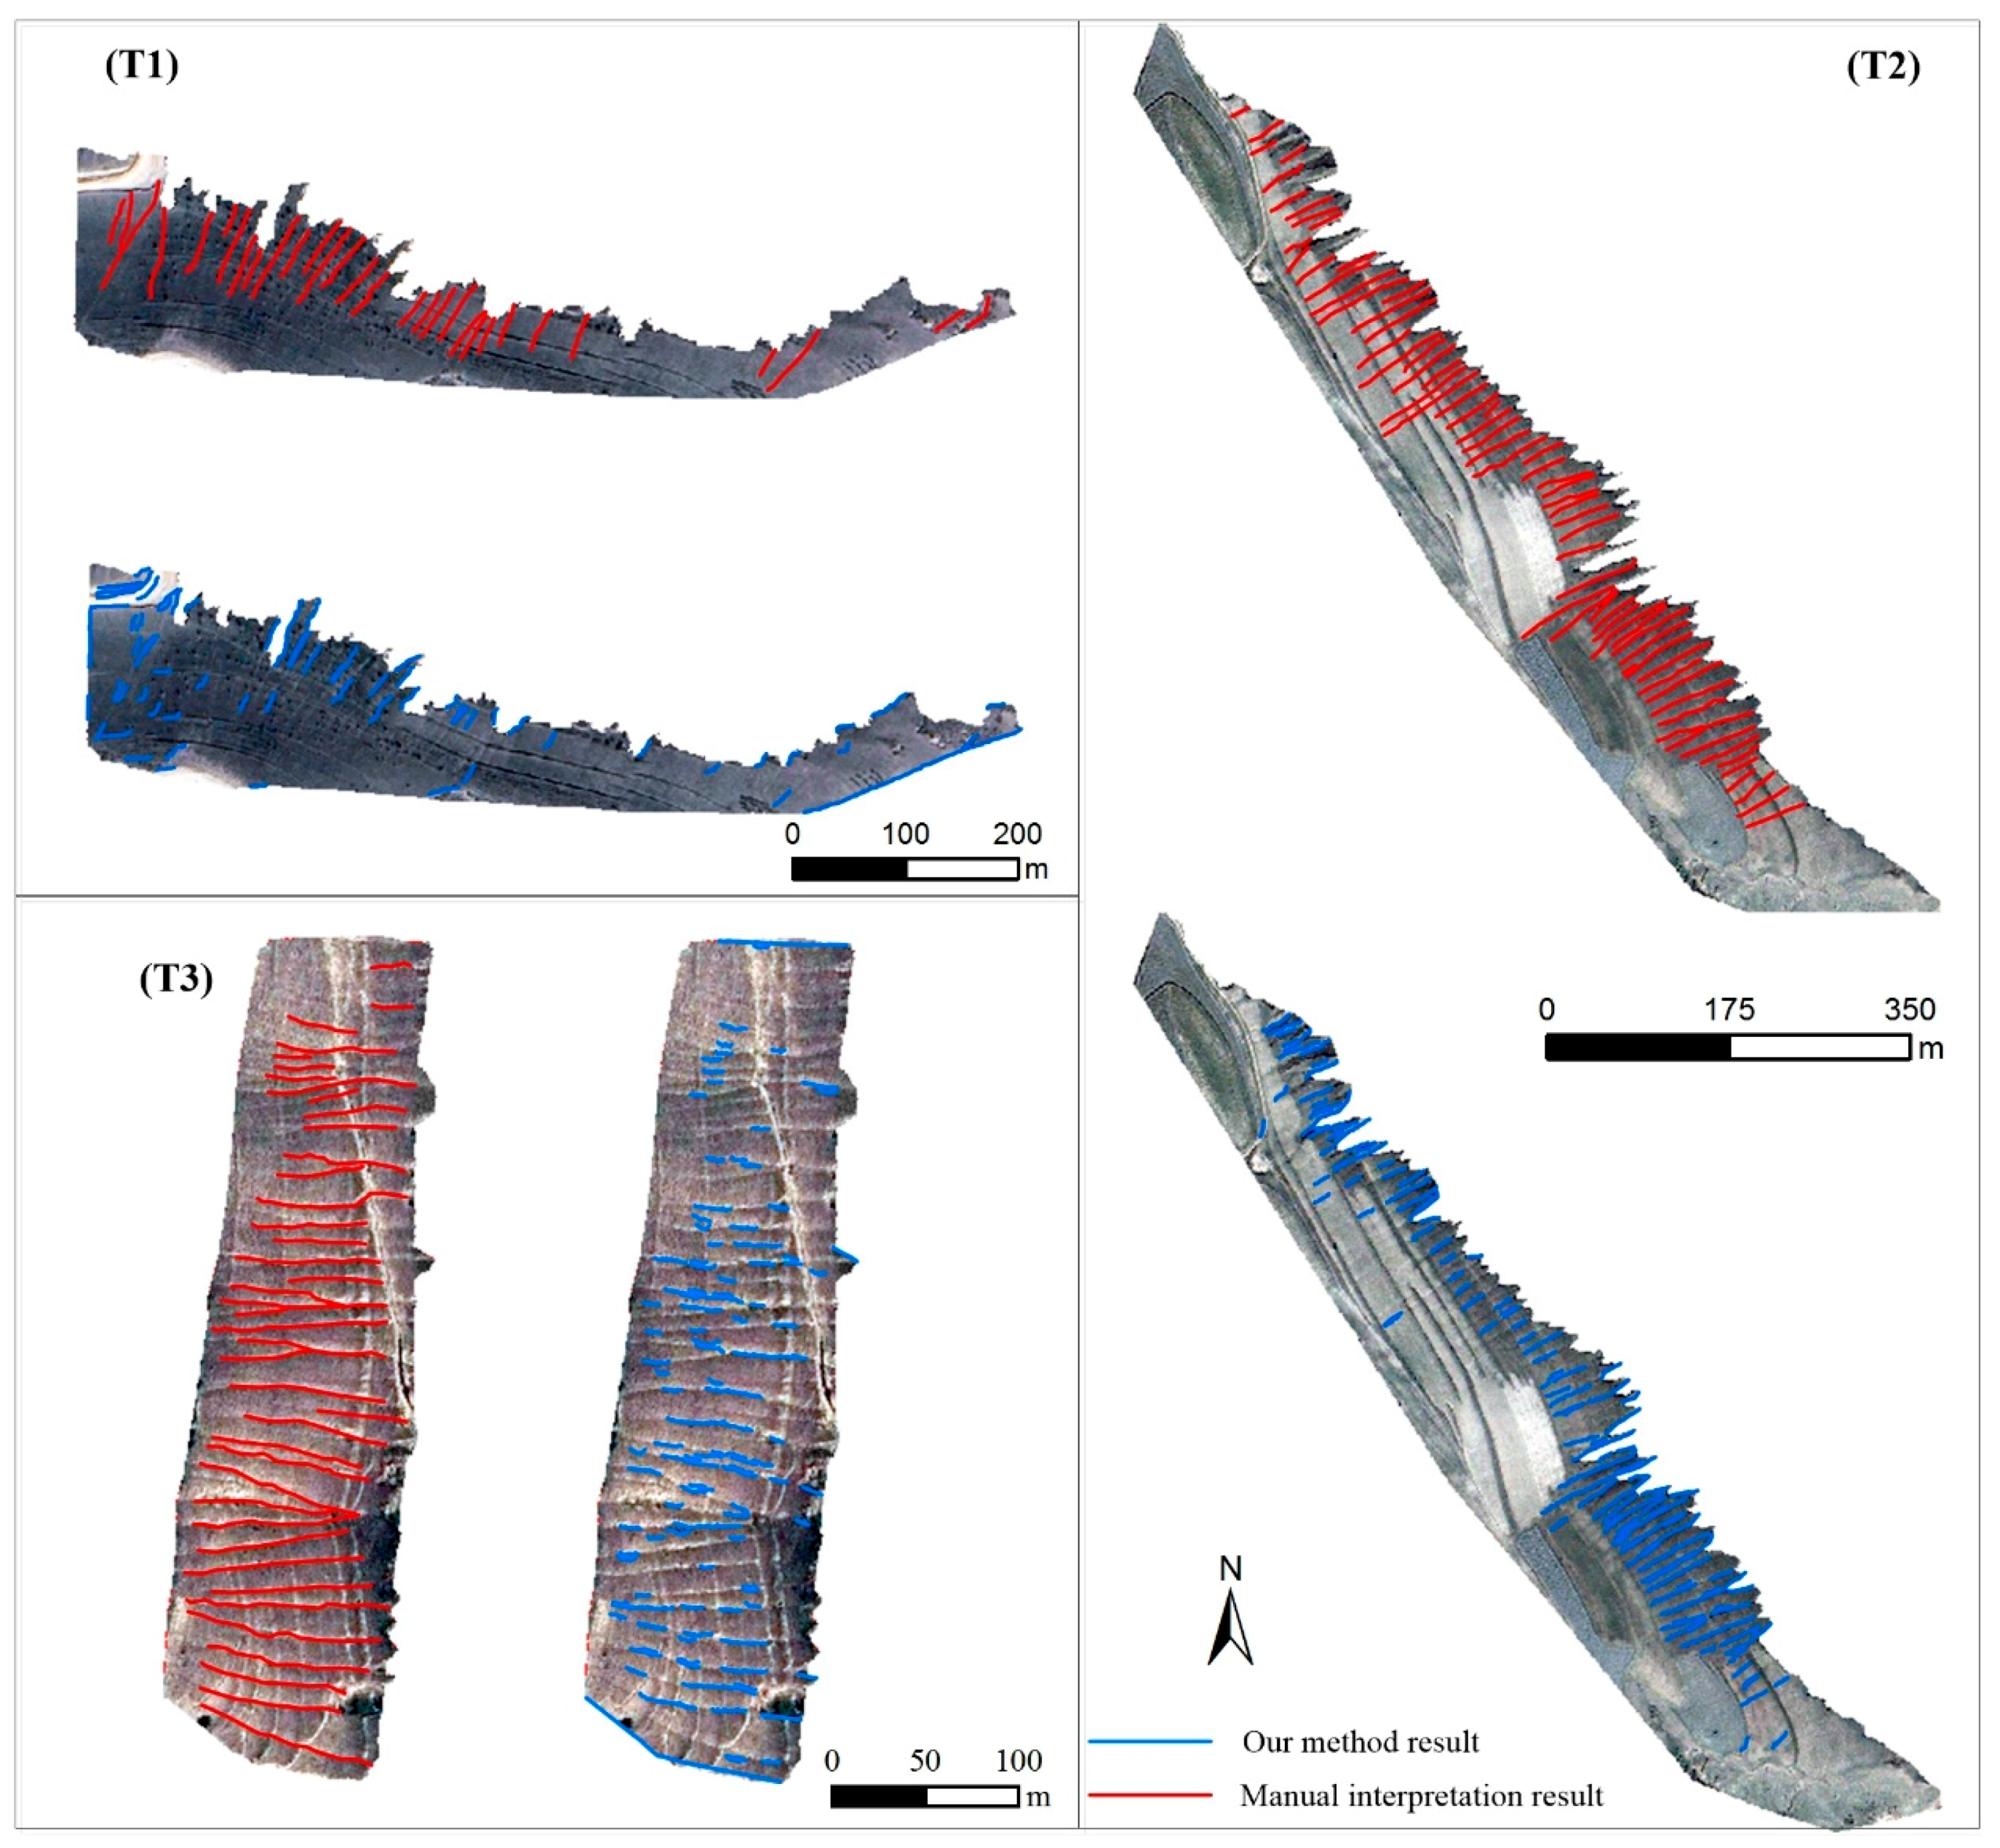
Figure 11.
The relationship between the length threshold and the average gully length in three test areas.
Figure 11.
The relationship between the length threshold and the average gully length in three test areas.

Table 1.
Information on areas and data used.
| Test Area | Position (WGS84) | Area (km2) | Altitude (m) | Remote Sensing Image | Ephemeral Gully Characteristics |
|---|---|---|---|---|---|
| T1 (Jingbian) | 37°28′49″–37°28′59″ N; 108°48′2″–108°48′35″ E | 0.23 | 1348–1556 | Images from Pléiades with 0.5 m spatial resolution | Nearly north-south direction. Locating at one side slope of valley. Length ranges from 16 m to 96 m with average space interval of 10 m. |
| T2 (Dingbian) | 37°12′30″–37°13′03″ N; 108°01′09″–108°1′43″ E | 0.27 | 1438–1630 | Images from Google Earth with 0.5 m spatial resolution. | Gentle northeast-southwest direction. Obvious difference in numbers and length on both sides of the valley. Average length is 59 m in one slope side. About 15 m of space interval of ephemeral gully. |
| T3 (Huanxian) | 36°12′31″–36°13′17″ N; 107°12′42″–07°13′03″ E | 0.39 | 1409–1581 | Images from Google Earth with 0.5 m spatial resolution. | West-east direction. Length ranges from 19 m to 109 m with an average of 66 m. Average space interval is about 13 m. |
Table 2.
Accuracy with different length thresholds in the T1 area.
| Length Threshold (m) | TP | FN | FP | Correctness | Completeness | Quality | Length Rate |
|---|---|---|---|---|---|---|---|
| 5 | 86 | 0 | 215 | 28.57% | 100.00% | 28.57% | 69.60% |
| 7.5 | 46 | 8 | 87 | 34.59% | 85.19% | 32.62% | 50.66% |
| 8 | 43 | 8 | 77 | 35.83% | 84.31% | 33.59% | 48.71% |
| 8.5 | 42 | 9 | 68 | 38.18% | 82.35% | 35.29% | 47.96% |
| 9 | 38 | 10 | 61 | 38.38% | 79.17% | 34.86% | 44.97% |
| 9.5 | 35 | 12 | 56 | 38.46% | 74.47% | 33.98% | 42.64% |
| 10 | 32 | 12 | 52 | 38.10% | 72.73% | 33.33% | 39.92% |
| 10.5 | 27 | 13 | 39 | 40.91% | 67.50% | 34.18% | 36.55% |
| 11 | 26 | 14 | 36 | 41.94% | 65.00% | 34.21% | 35.70% |
| 11.5 | 24 | 16 | 36 | 40.00% | 60.00% | 31.58% | 33.84% |
| 12 | 22 | 16 | 32 | 40.74% | 57.89% | 31.43% | 31.76% |
| 12.5 | 20 | 17 | 29 | 40.82% | 54.05% | 30.30% | 29.47% |
| 13 | 18 | 18 | 24 | 42.86% | 50.00% | 30.00% | 27.53% |
| 13.5 | 14 | 21 | 23 | 37.84% | 40.00% | 24.14% | 23.07% |
| 14 | 12 | 21 | 22 | 35.29% | 36.36% | 21.82% | 20.67% |
| 14.5 | 9 | 23 | 22 | 29.03% | 28.13% | 16.67% | 17.09% |
| 15 | 8 | 24 | 22 | 26.67% | 25.00% | 14.81% | 15.68% |
| 17.5 | 7 | 25 | 19 | 26.92% | 21.88% | 13.73% | 14.20% |
| 20 | 7 | 25 | 12 | 36.84% | 21.88% | 15.91% | 14.20% |
Table 3.
Parameters and accuracy indices in the three areas.
| Areas | Length Threshold | Correctness | Completeness | Quality | Length Rate |
|---|---|---|---|---|---|
| T1 (Jingbian) | 8.5 | 38.18% | 82.35% | 35.29% | 47.96% |
| T2 (Dingbian) | 12.5 | 71.11% | 91.43% | 66.67% | 71.44% |
| T3 (Huanxian) | 15 | 85.05% | 92.86% | 79.82% | 46.41% |
© 2017 by the authors. Licensee MDPI, Basel, Switzerland. This article is an open access article distributed under the terms and conditions of the Creative Commons Attribution (CC BY) license (http://creativecommons.org/licenses/by/4.0/).
Share and Cite
MDPI and ACS Style
Yang, X.; Dai, W.; Tang, G.; Li, M. Deriving Ephemeral Gullies from VHR Image in Loess Hilly Areas through Directional Edge Detection. ISPRS Int. J. Geo-Inf. 2017, 6, 371. https://doi.org/10.3390/ijgi6110371
AMA Style
Yang X, Dai W, Tang G, Li M. Deriving Ephemeral Gullies from VHR Image in Loess Hilly Areas through Directional Edge Detection. ISPRS International Journal of Geo-Information. 2017; 6(11):371. https://doi.org/10.3390/ijgi6110371
Chicago/Turabian StyleYang, Xin, Wen Dai, Guoan Tang, and Min Li. 2017. "Deriving Ephemeral Gullies from VHR Image in Loess Hilly Areas through Directional Edge Detection" ISPRS International Journal of Geo-Information 6, no. 11: 371. https://doi.org/10.3390/ijgi6110371
Note that from the first issue of 2016, this journal uses article numbers instead of page numbers. See further details here.