
An Integrated Approach for Monitoring and Information Management of the Guanling Landslide (China)


Abstract
:1. Introduction
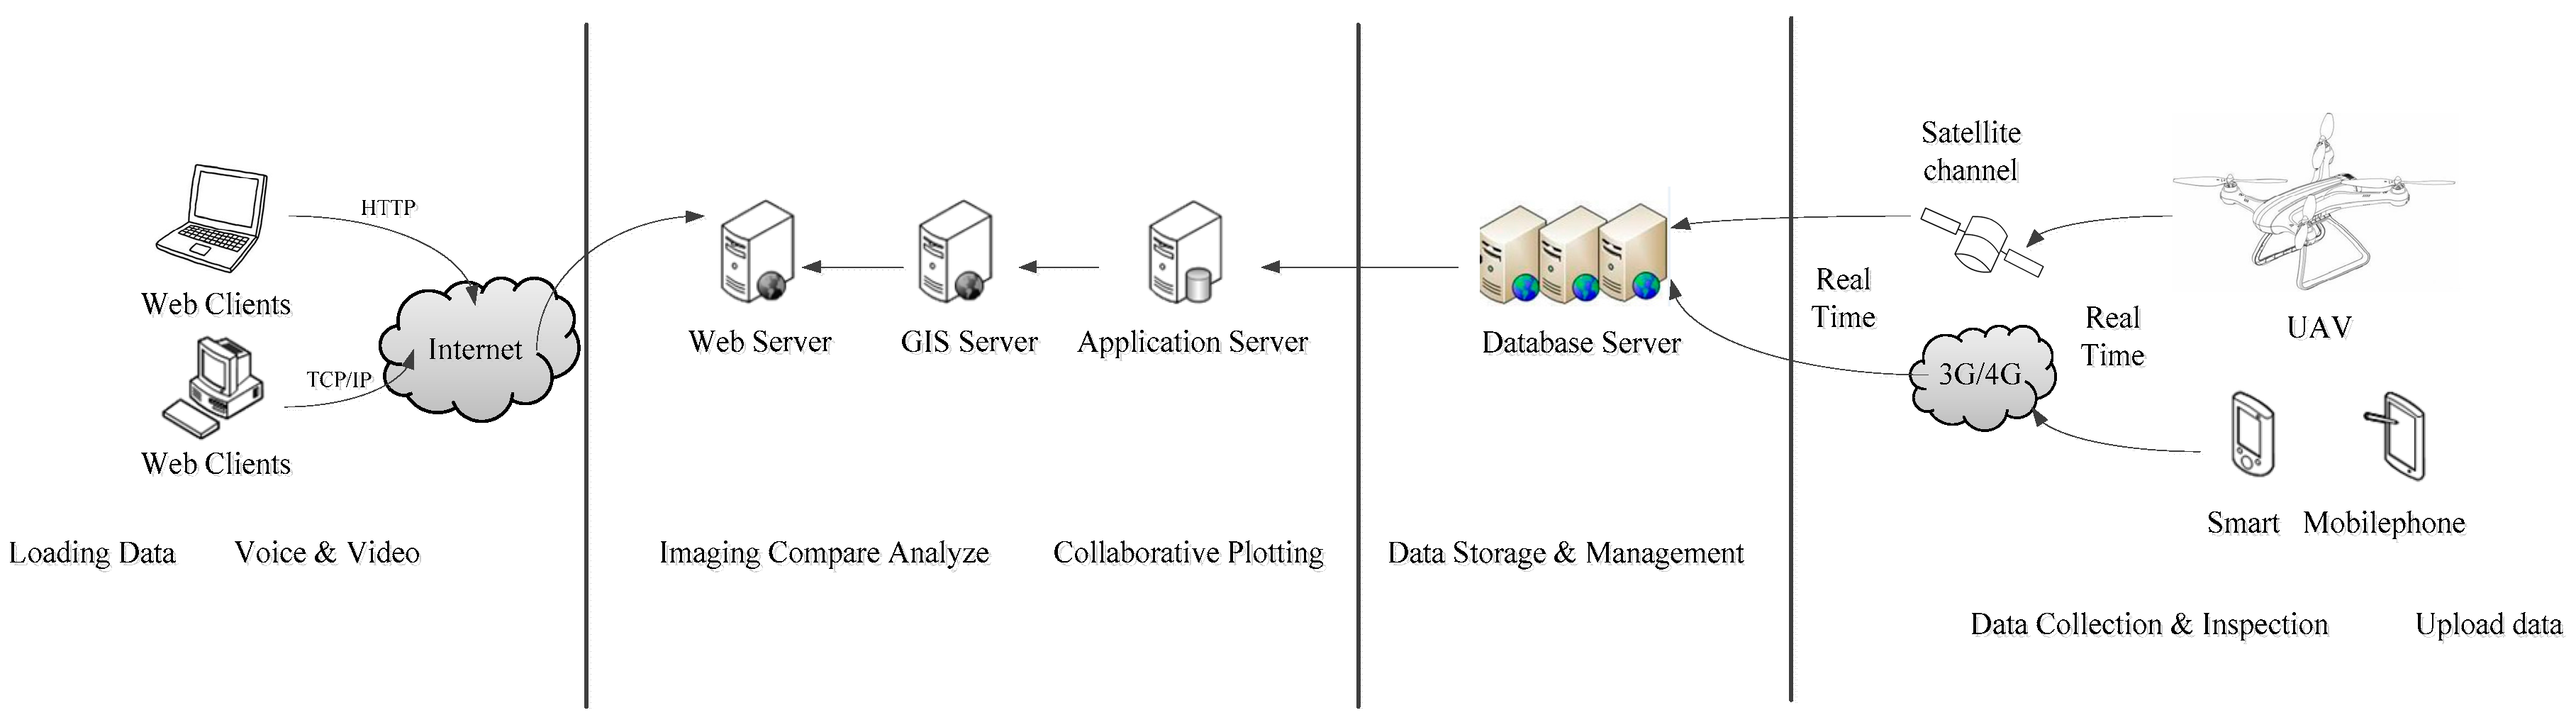
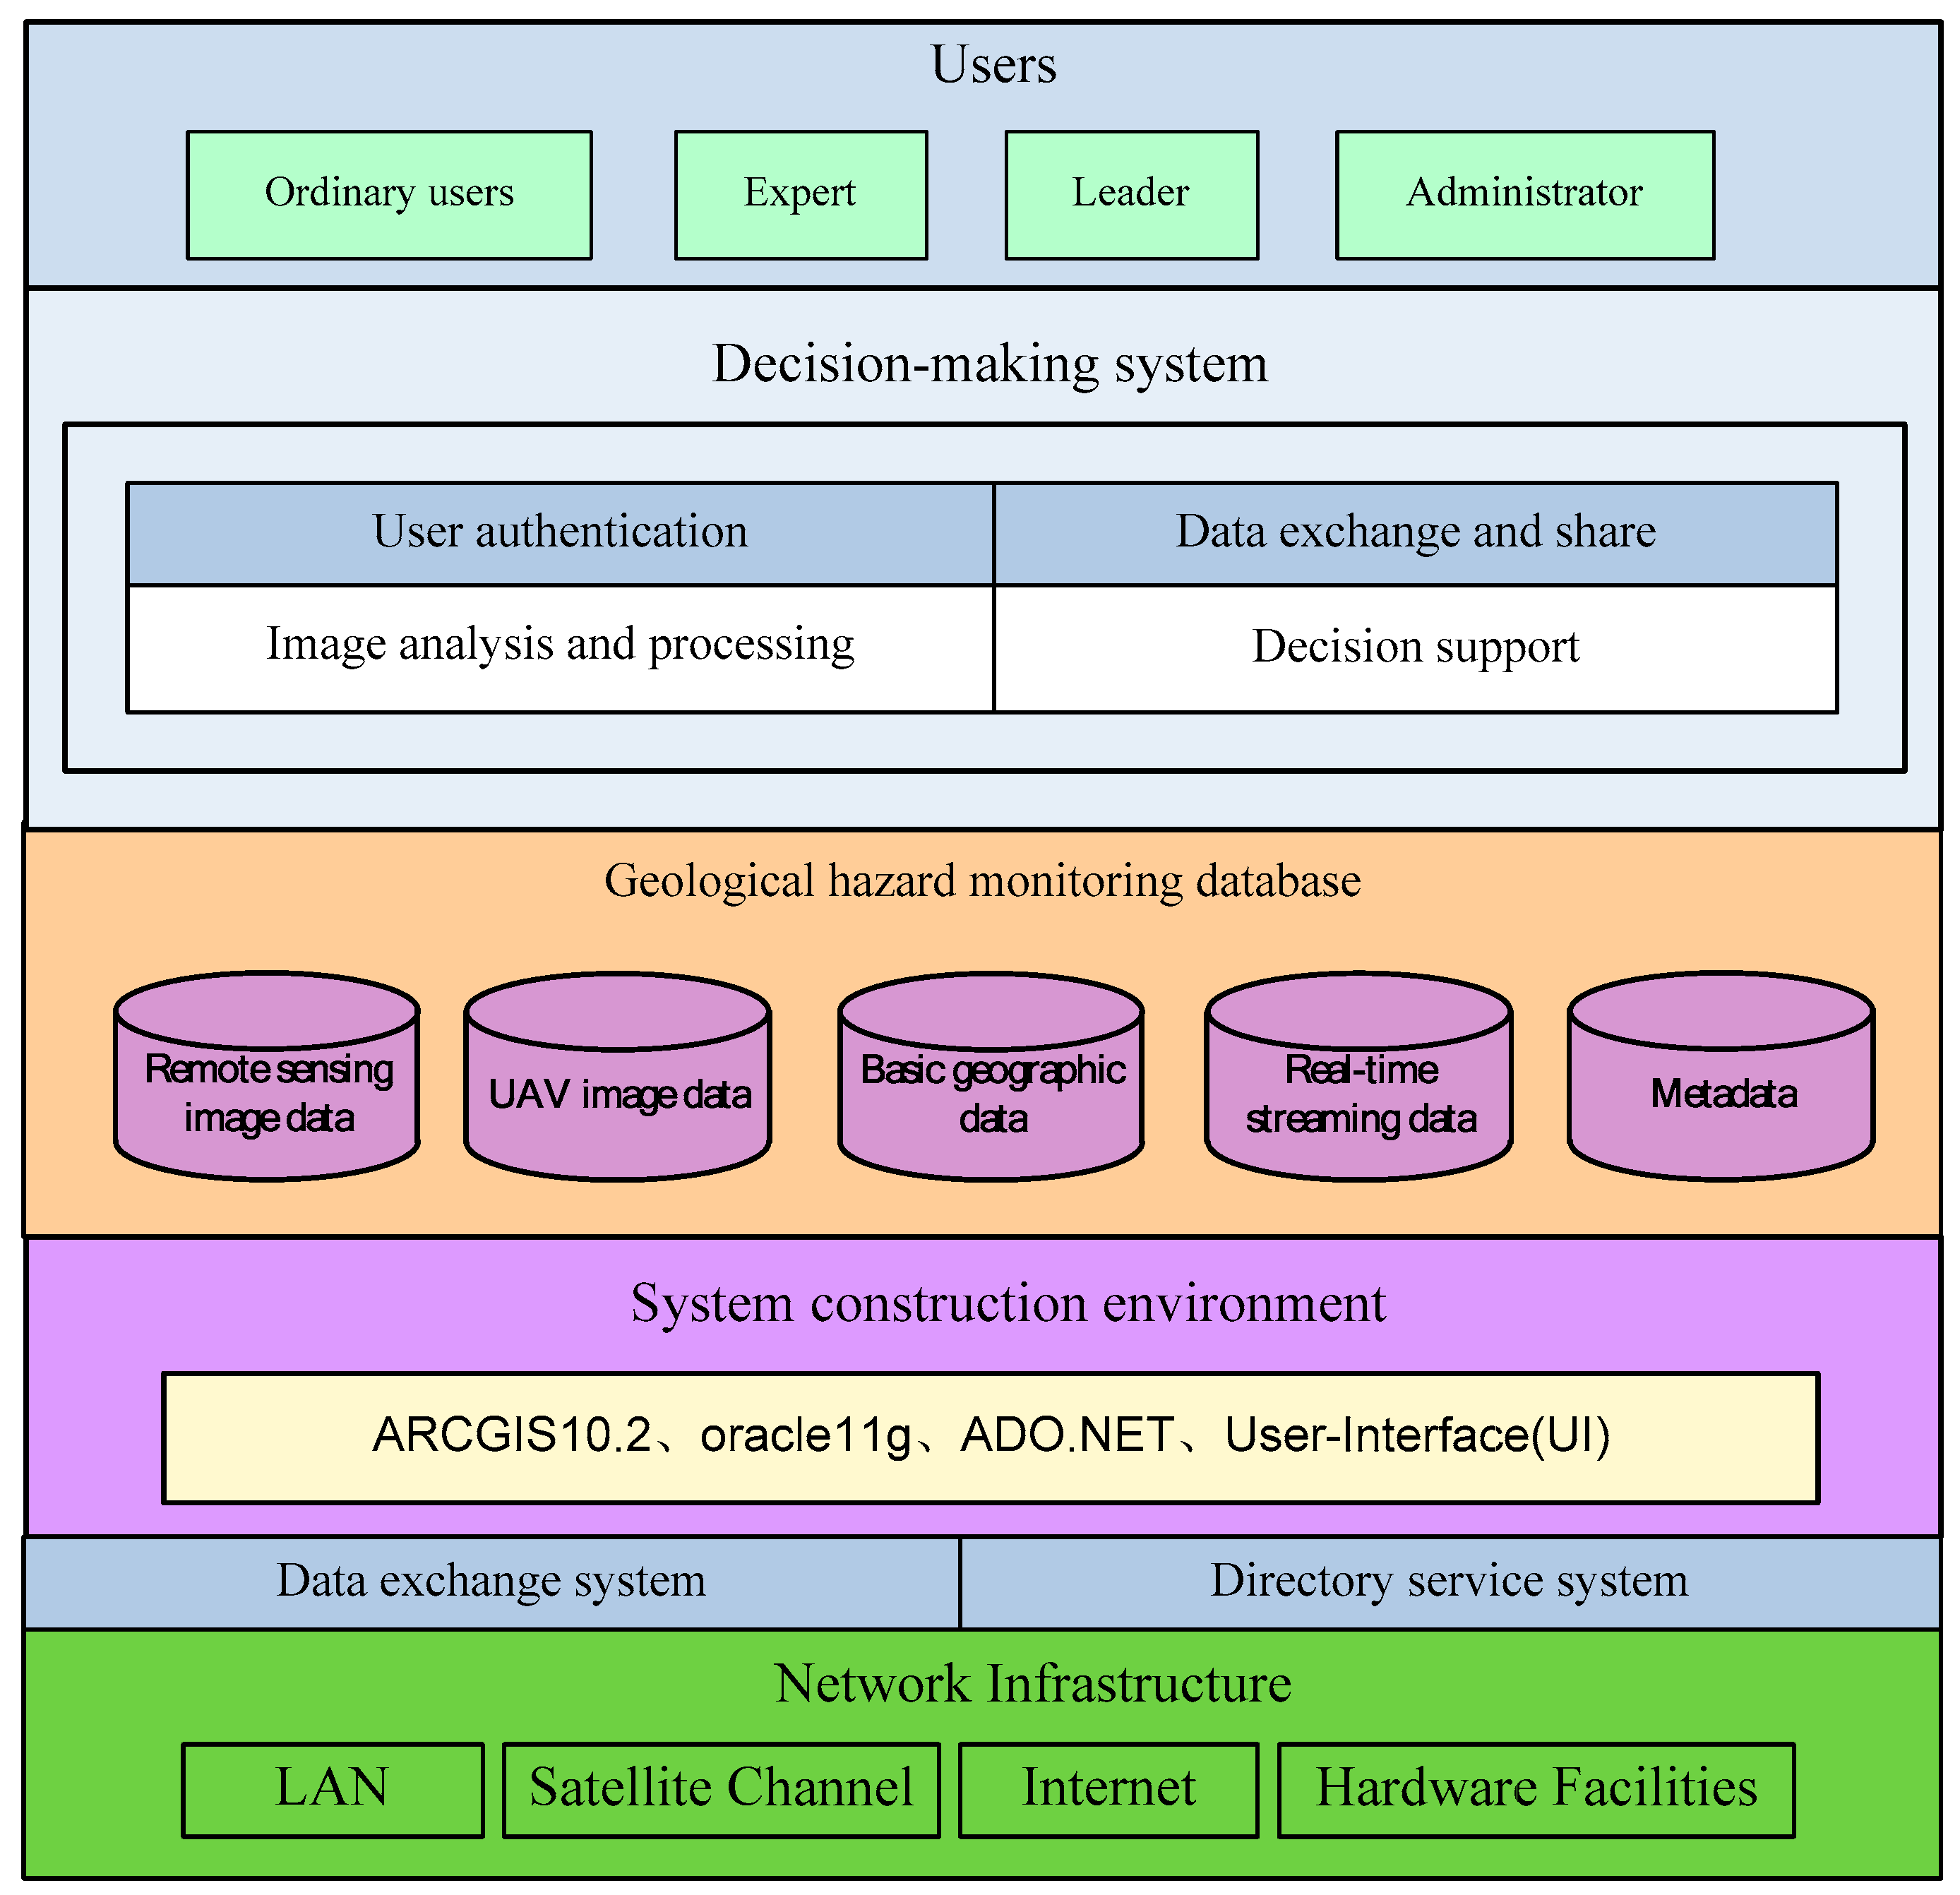
2. Methodical Basis and System Design
3. Case Study
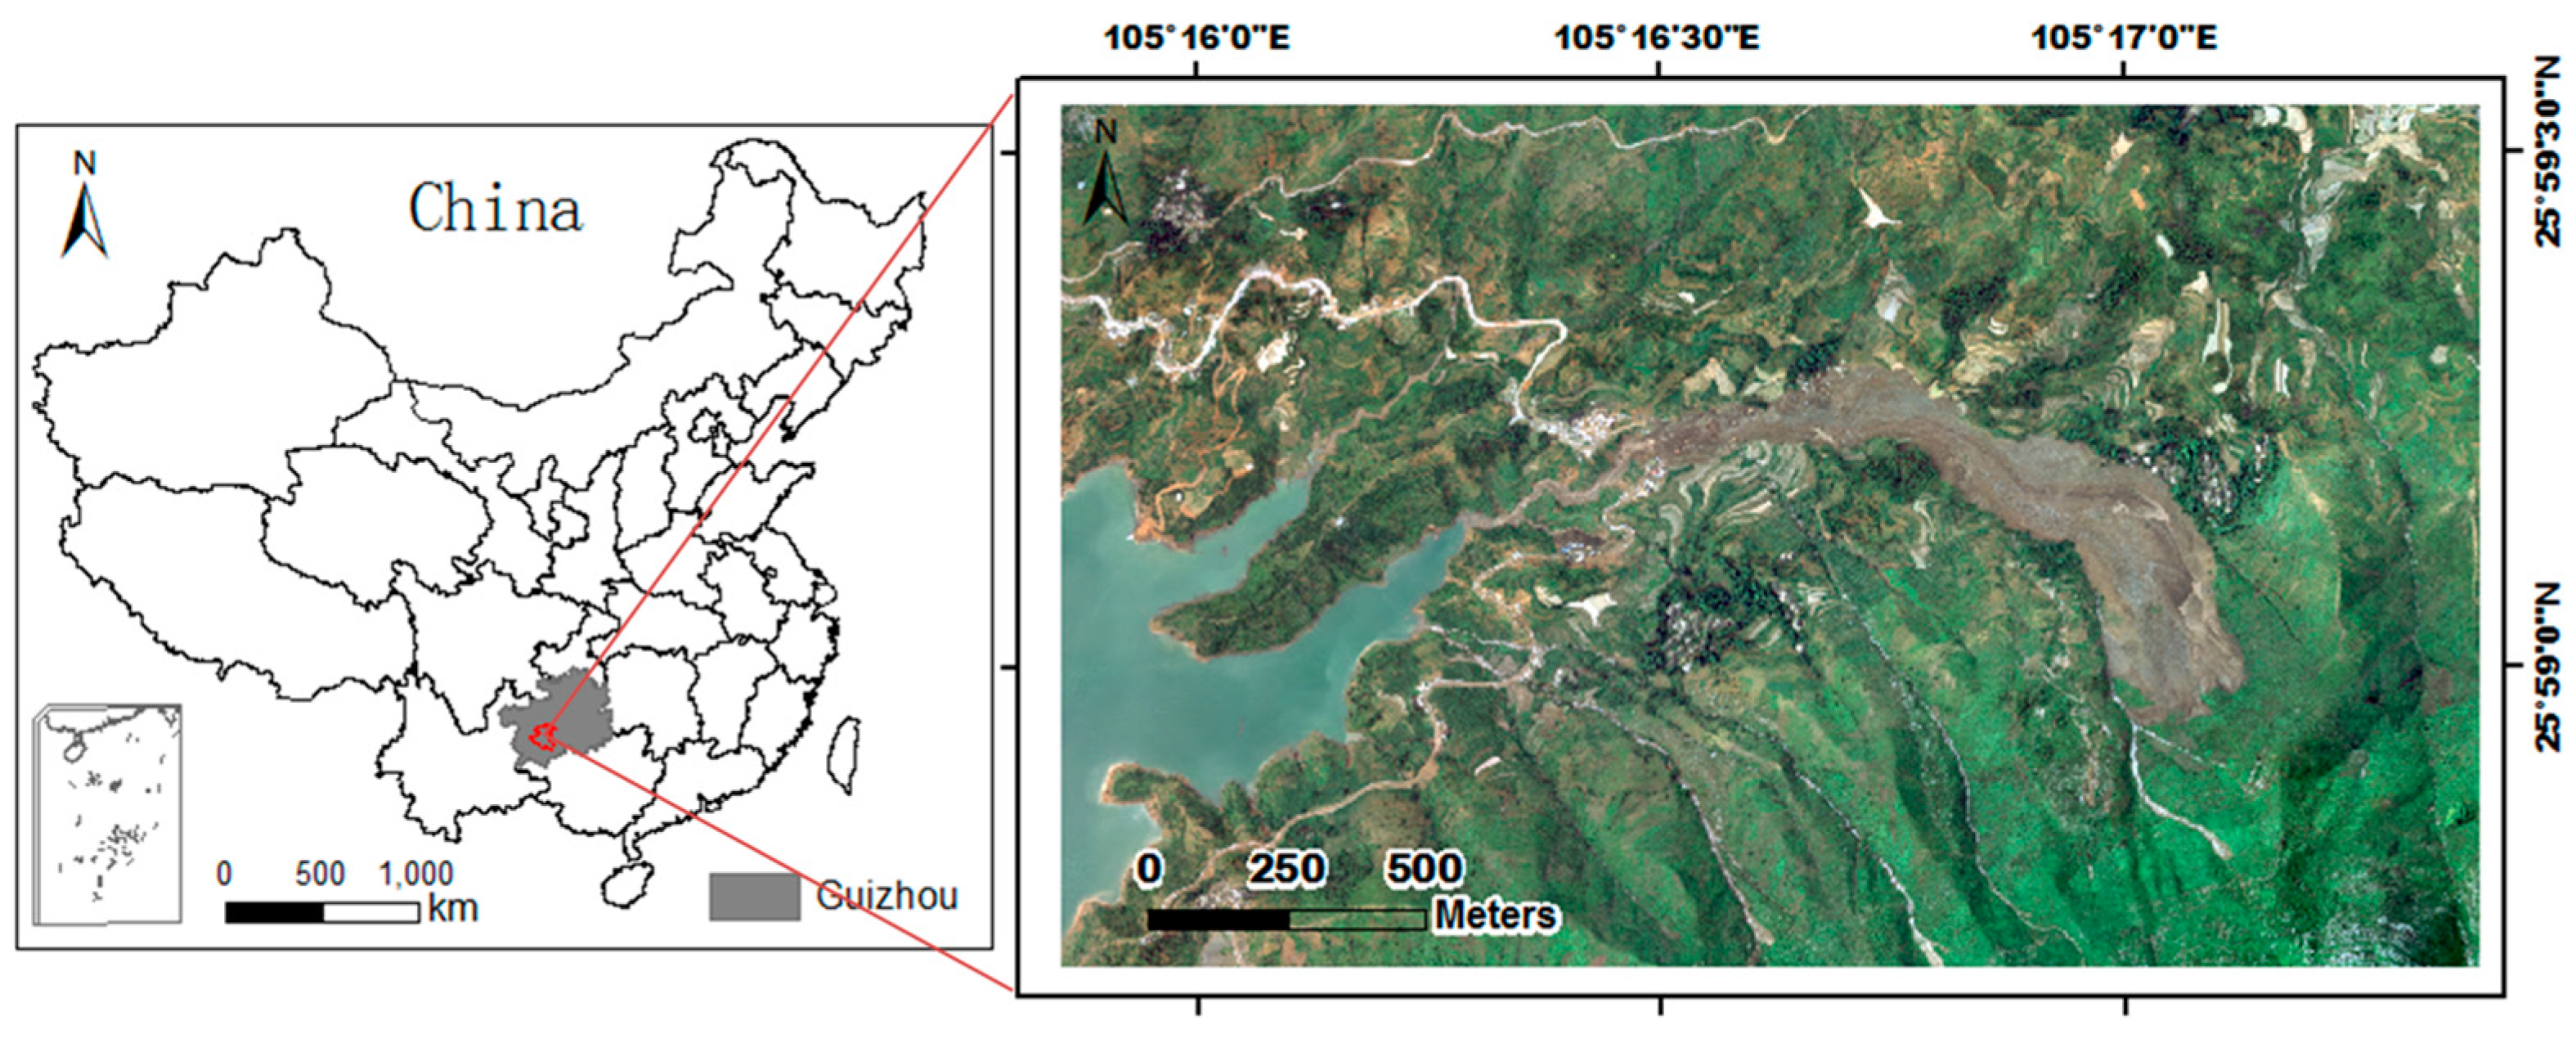
3.1. Study Area
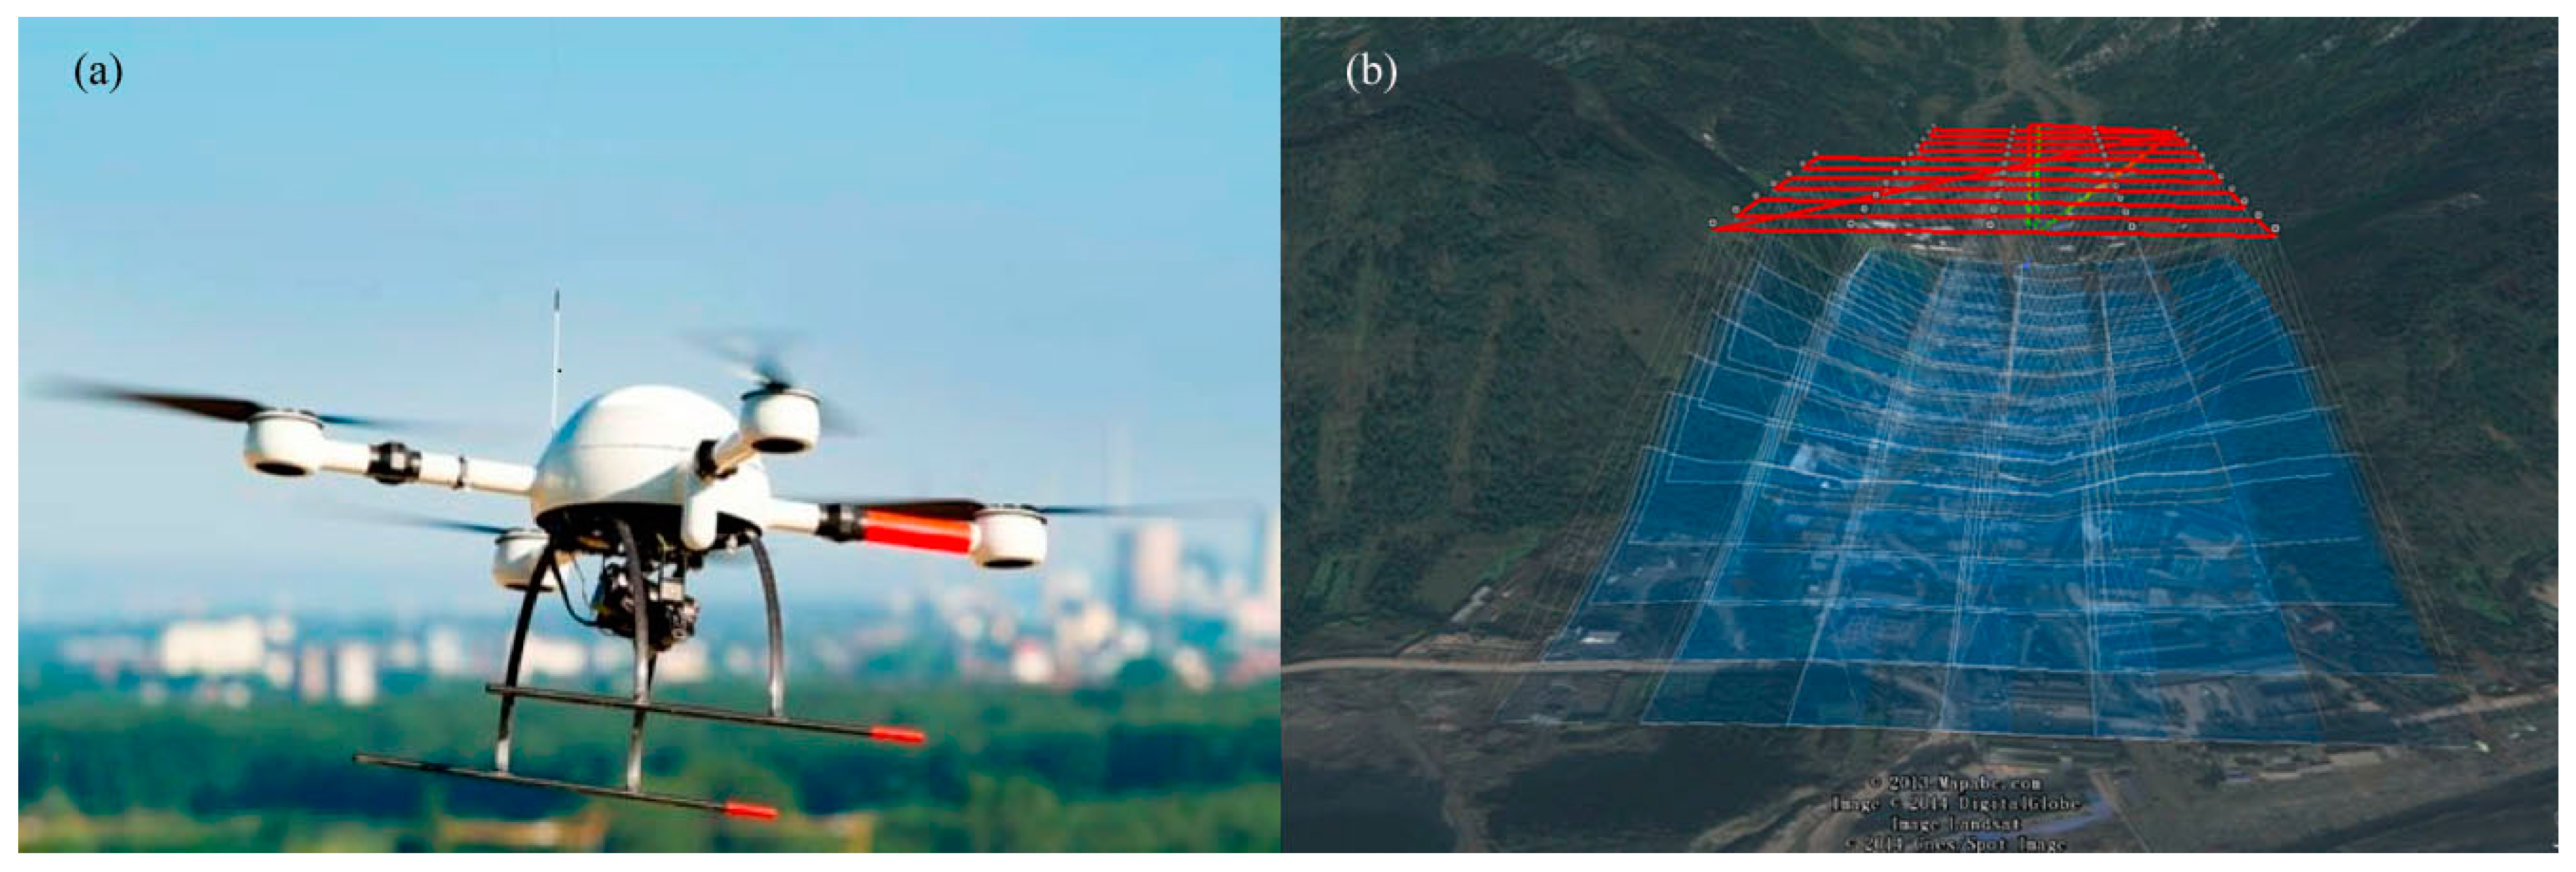
3.2. Data Sources
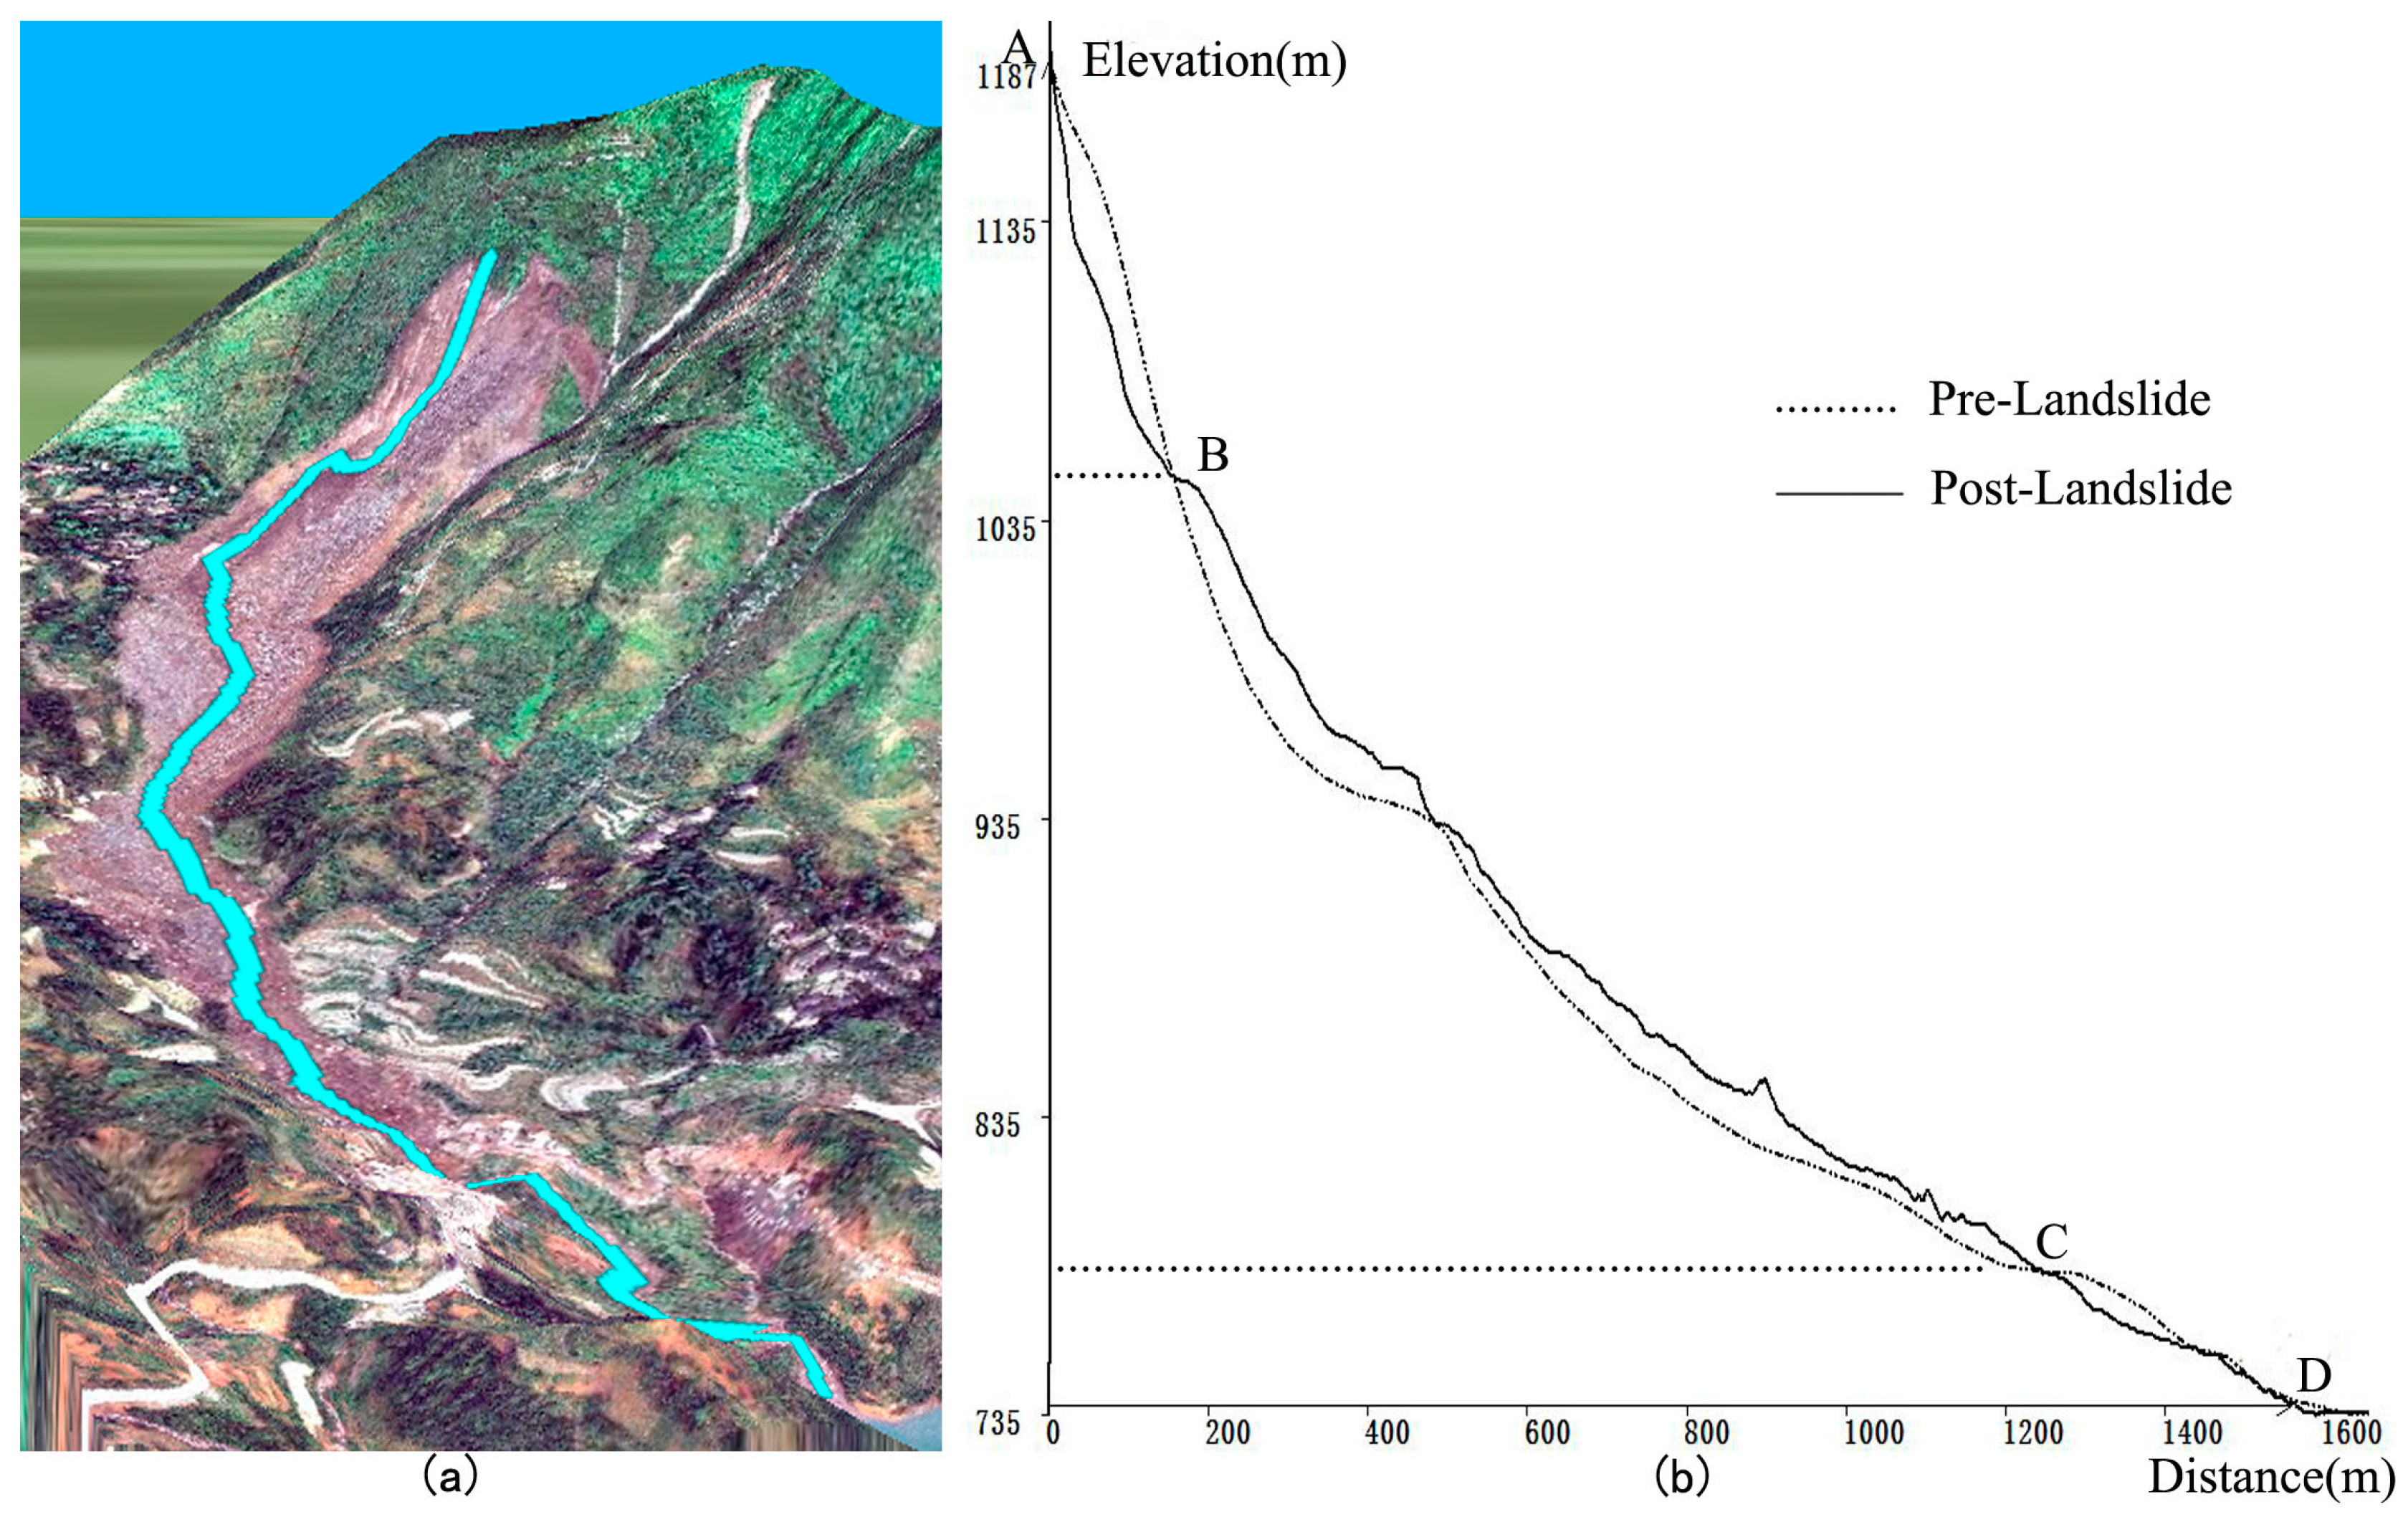
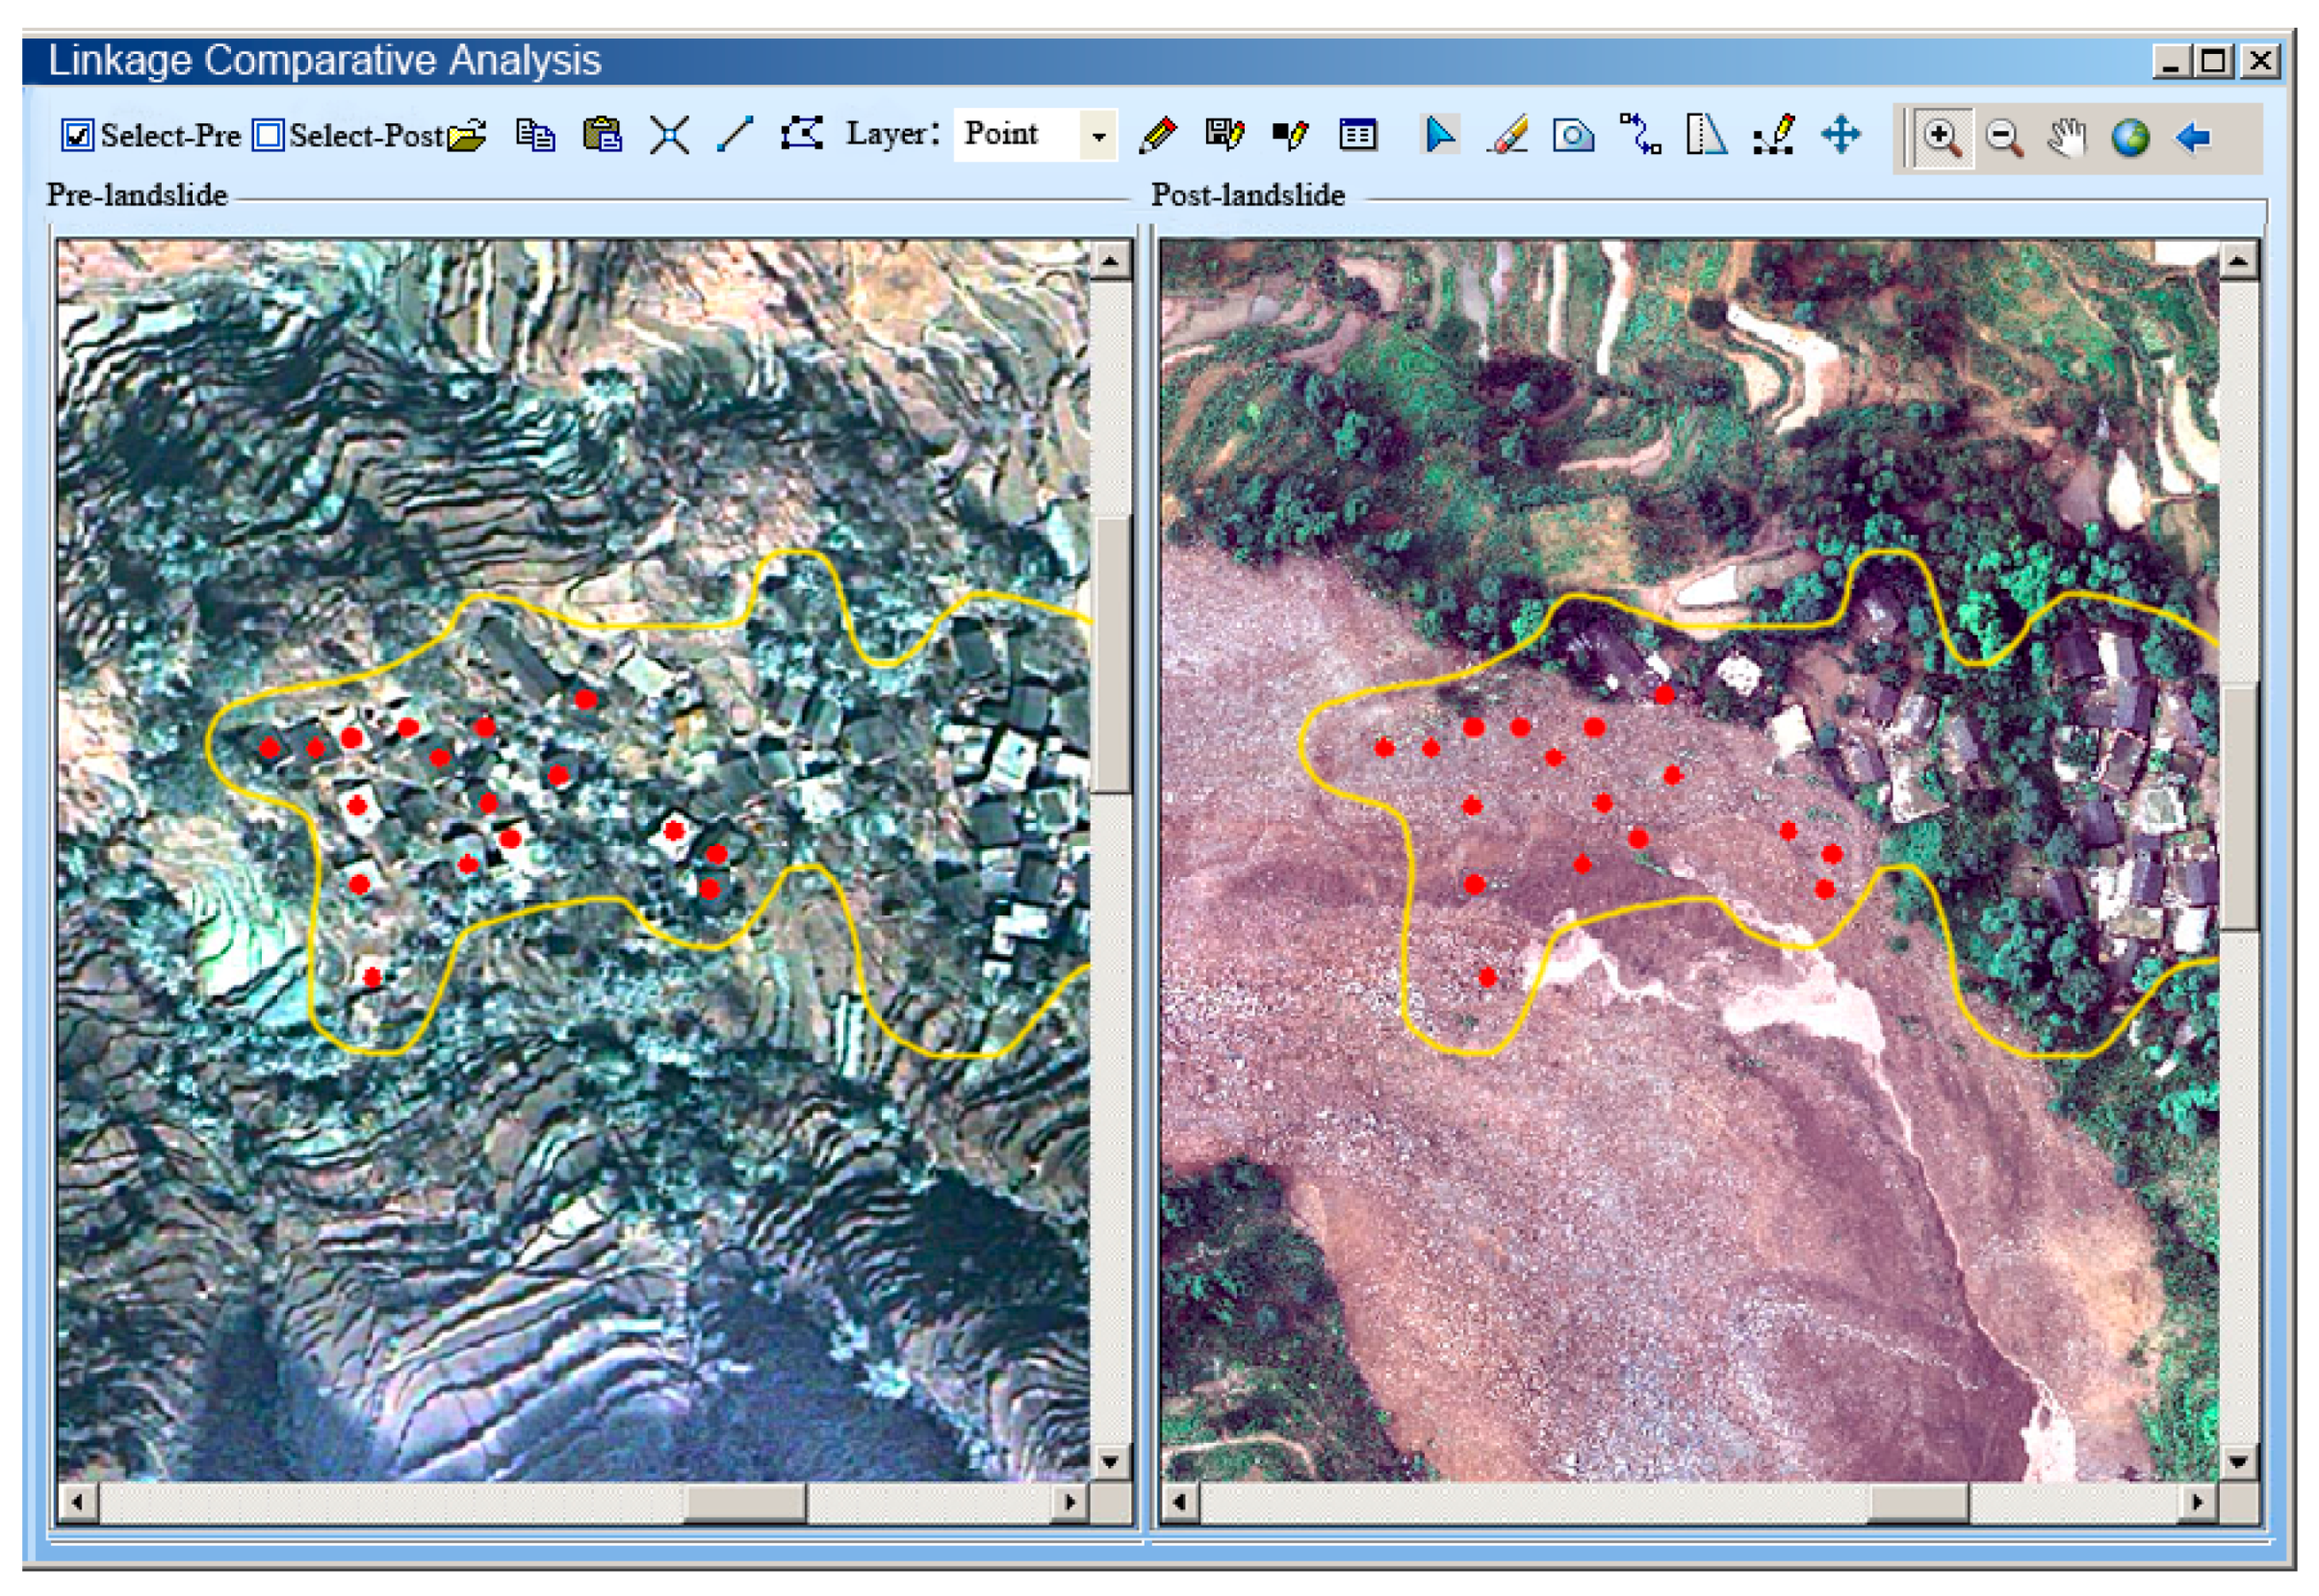
3.3. Image Interpretation
- The section from Point A to Point B belonged to the negative terrain. Its elevation ranged from 1085 m to 1199 m, and the elevation difference was 114 m. The length of the AB section was about 200 m in the crack direction. Before the landslide, the degree of the slope in this section ranged from 26 to 37 degrees, while the slope changed to a range between 39 and 53 degrees after the landslide.
- The section from Point B to Point C belonged to the positive terrain. Its elevation ranged from 755 m to 1085 m, and the elevation difference was 330 m. The length of the BC section was about 1150 m in the crack direction. Before the landslide, the degree of the slope in this section ranged from 9 to 16 degrees, while the slope changed to a range between 0 and 15 degrees after the landslide.
- The section from Point C to Point D belonged to the negative terrain. Its elevation ranged from 735 m to 755 m. The length of the CD section in the crack direction was about 350 m. After the landslide, this section changed to a nearly flat area.
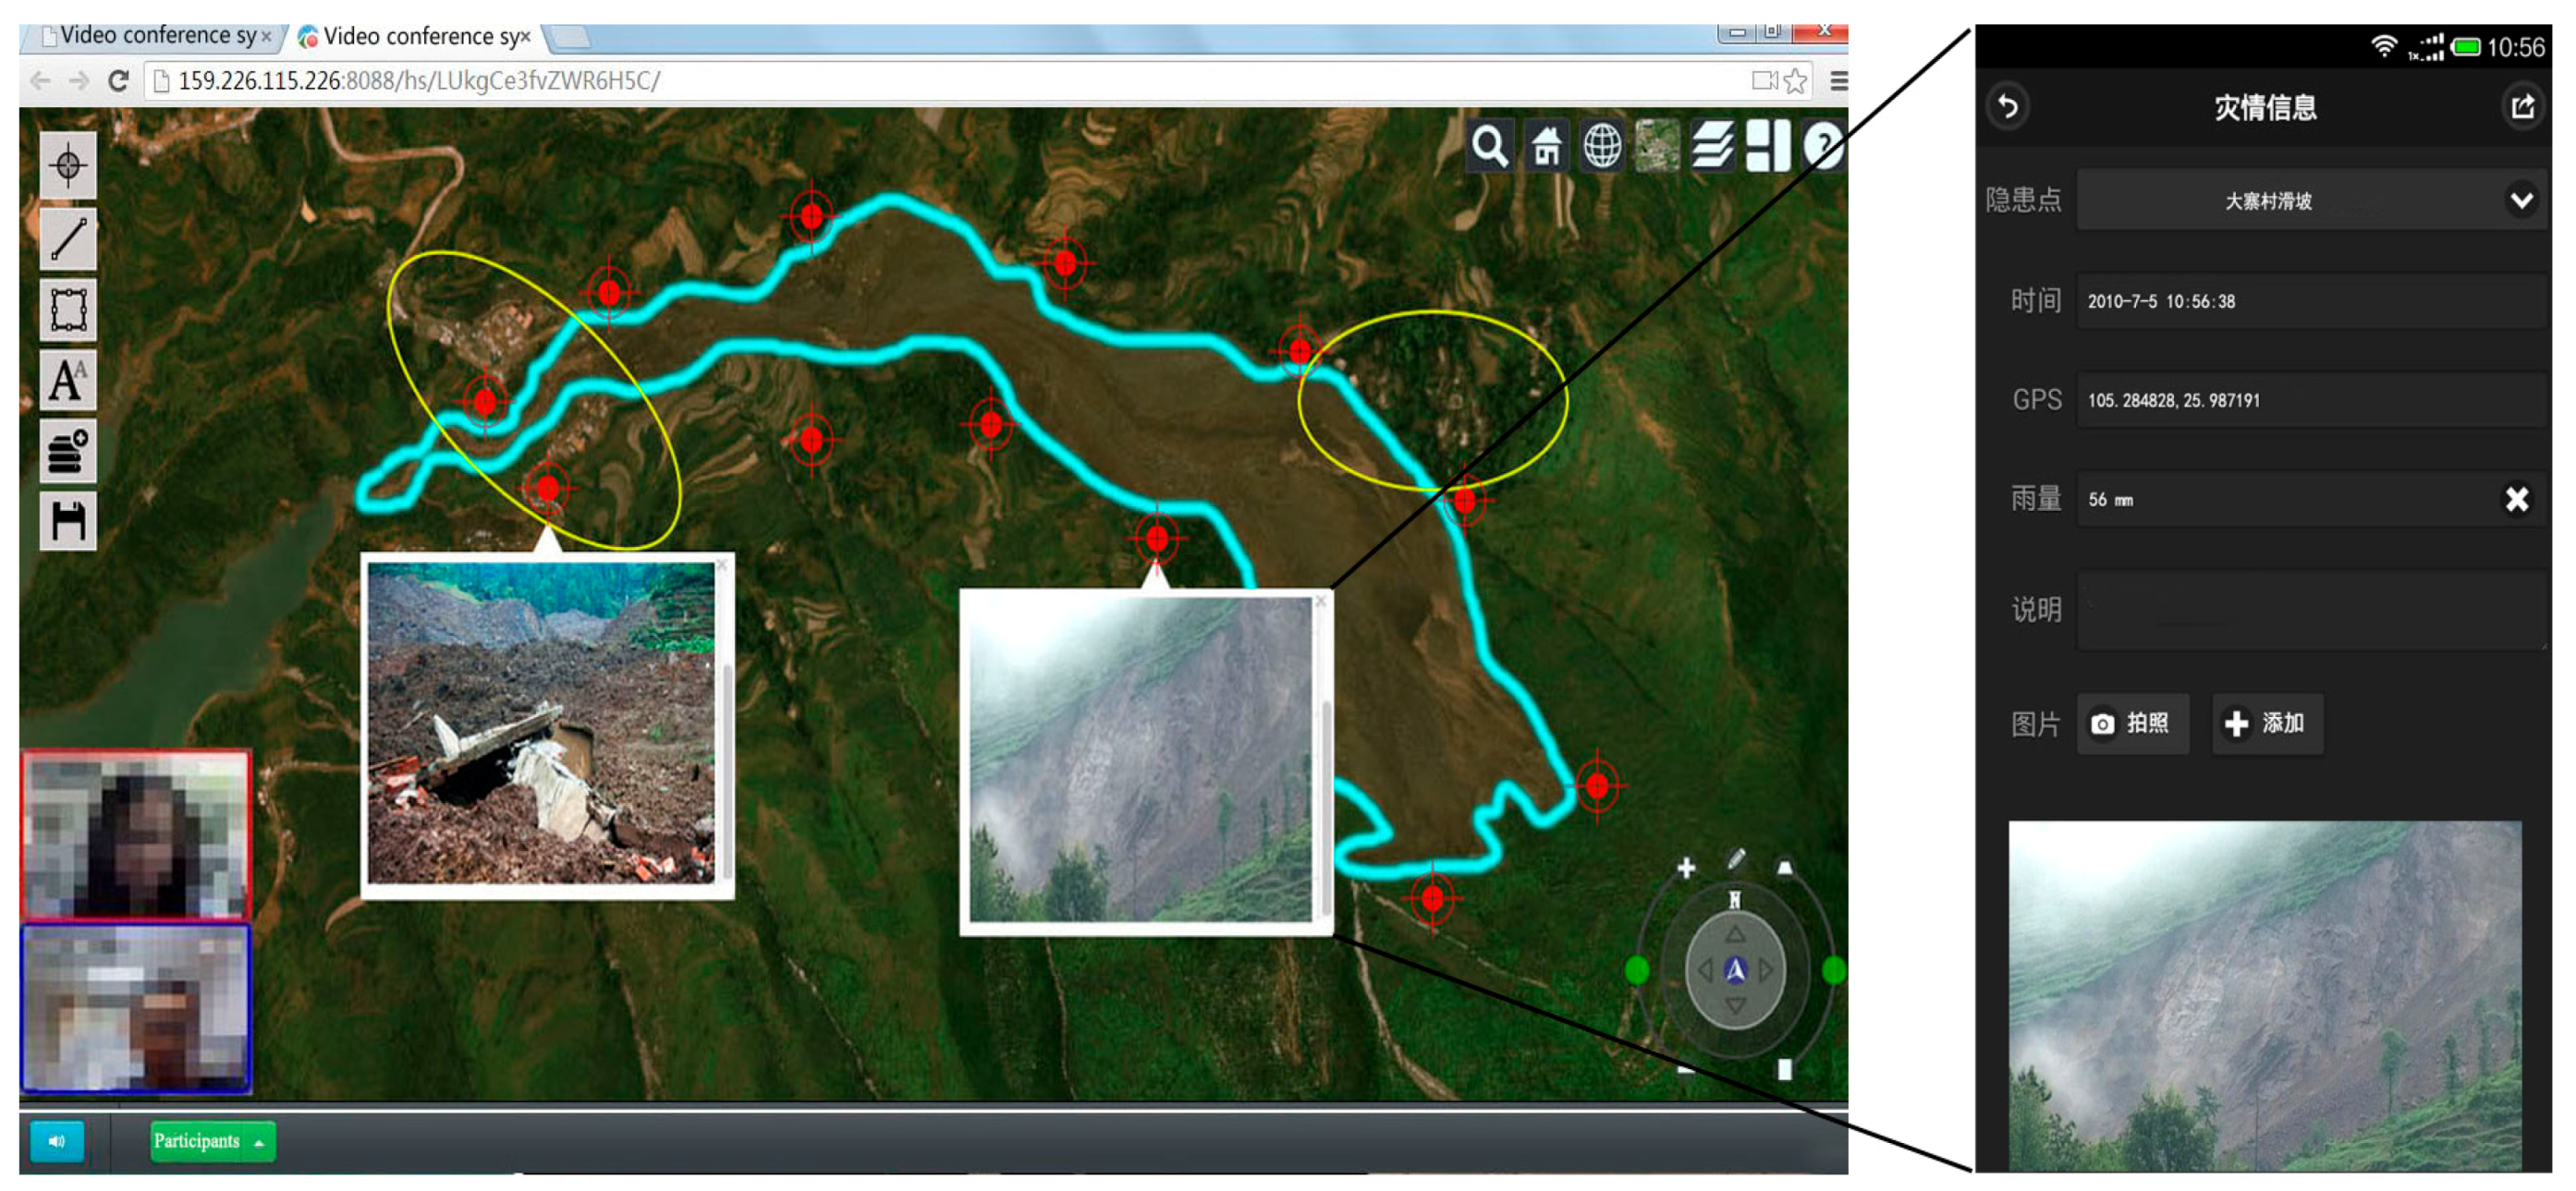
3.4. Implementation of Emergency Management Platform
4. Discussion
4.1. Data Requirement
4.2. Hazard Assessment
4.3. Online Cooperating Platform
5. Conclusions
Acknowledgments
Author Contributions
Conflicts of Interest
References
- Lan, H.X.; Zhou, C.H.; Wang, L.J.; Zhang, H.Y.; Li, R.H. Landslide hazard spatial analysis and prediction using GIS in the Xiaojiang watershed, Yunnan, China. Eng. Geol. 2004, 76, 109–128. [Google Scholar] [CrossRef]
- Tang, C.; Ma, G.; Chang, M.; Li, W.; Zhang, D.; Jia, T.; Zhou, Z. Landslides triggered by the 20 April 2013 Lushan earthquake, Sichuan Province, China. Eng. Geol. 2015, 187, 45–55. [Google Scholar] [CrossRef]
- Hervás, J.; Barredo, J.I.; Rosin, P.L.; Pasuto, A.; Mantovani, F.; Silvano, S. Monitoring landslides from optical remotely sensed imagery: The case history of Tessina landslide, Italy. Geomorphology 2003, 54, 63–75. [Google Scholar] [CrossRef]
- Metternicht, G.; Hurni, L.; Gogu, R. Remote sensing of landslides: An analysis of the potential contribution to geo-spatial systems for hazard assessment in mountainous environments. Remote Sens. Environ. 2005, 98, 284–303. [Google Scholar] [CrossRef]
- Biswajeet, P.; Saro, L. Utilization of Optical Remote Sensing Data and GIS Tools for Regional Landslide Hazard Analysis Using an Artificial Neural Network Model. Earth Sci. Front. 2007, 14, 143–151. [Google Scholar] [CrossRef]
- McKillop, R.J.; Clague, J.J. Statistical, remote sensing-based approach for estimating the probability of catastrophic drainage from moraine-dammed lakes in southwestern British Columbia. Glob. Planet. Chang. 2007, 56, 153–171. [Google Scholar] [CrossRef]
- Brien, D.L.; Reid, M.E. Assessing deep-seated landslide susceptibility using 3-D groundwater and slope-stability analyses, southwestern Seattle, Washington. Rev. Eng. Geol. 2008, 20, 83–101. [Google Scholar] [CrossRef]
- Van Westen, C.J.; Lulie Getahun, F. Analyzing the evolution of the Tessina landslide using aerial photographs and digital elevation models. Geomorphology 2003, 54, 77–89. [Google Scholar] [CrossRef]
- Kääb, A. Photogrammetry for early recognition of high mountain hazards: New techniques and applications. Phys. Chem. Earth Part B 2000, 25, 765–770. [Google Scholar] [CrossRef]
- Schulz, W.H. Landslide susceptibility revealed by LIDAR imagery and historical records, Seattle, Washington. Eng. Geol. 2007, 89, 67–87. [Google Scholar] [CrossRef]
- Niethammer, U.; James, M.R.; Rothmund, S.; Travelletti, J.; Joswig, M. UAV-based remote sensing of the Super-Sauze landslide: Evaluation and results. Eng. Geol. 2012, 128, 2–11. [Google Scholar] [CrossRef]
- Carrara, A.; Cardinali, M.; Guzzetti, F.; Reichenbach, P. Gis Technology in Mapping Landslide Hazard. In Geographical Information Systems in Assessing Natural Hazards; Carrara, A., Guzzetti, F., Eds.; Advances in Natural and Technological Hazards Research; Springer: Dordrecht, The Netherlands, 1995; pp. 135–175. [Google Scholar]
- Sarkar, S.; Kanungo, D.P. An Integrated Approach for Landslide Susceptibility Mapping Using Remote Sensing and GIS. Photogramm. Eng. Remote Sens. 2004, 70, 617–625. [Google Scholar] [CrossRef]
- Assilzadeh, H.; Levy, J.K.; Wang, X. Landslide Catastrophes and Disaster Risk Reduction: A GIS Framework for Landslide Prevention and Management. Remote Sens. 2010, 2, 2259–2273. [Google Scholar] [CrossRef]
- Thennavan, E.; Ganapathy, G.P.; Sekaran, S.S.C.; Rajawat, A.S. Use of GIS in assessing building vulnerability for landslide hazard in The Nilgiris, Western Ghats, India. Nat. Hazards 2016, 82, 1–20. [Google Scholar] [CrossRef]
- Barredo, J.; Benavides, A.; Hervás, J.; van Westen, C.J. Comparing heuristic landslide hazard assessment techniques using GIS in the Tirajana basin, Gran Canaria Island, Spain. Int. J. Appl. Earth Obs. Geoinf. 2000, 2, 9–23. [Google Scholar] [CrossRef]
- He, Y.P.; Xie, H.; Cui, P.; Wei, F.Q.; Zhong, D.L.; Gardner, J.S. GIS-based hazard mapping and zonation of debris flows in Xiaojiang Basin, southwestern China. Environ. Geol. 2003, 45, 286–293. [Google Scholar] [CrossRef]
- Raghuvanshi, T.K.; Negassa, L.; Kala, P.M. GIS based Grid overlay method versus modeling approach—A comparative study for landslide hazard zonation (LHZ) in Meta Robi District of West Showa Zone in Ethiopia. Egypt. J. Remote Sens. Space Sci. 2015, 18, 235–250. [Google Scholar] [CrossRef]
- Showalter, P.S. Remote sensing’s use in disaster research: A review. Disaster Prev. Manag. 2001, 10, 21–29. [Google Scholar] [CrossRef]
- Olsen, M.J.; Chen, Z.; Hutchinson, T.; Kuester, F. Optical techniques for multiscale damage assessment. Geomat. Nat. Hazards Risk 2013, 4, 49–70. [Google Scholar] [CrossRef]
- Fekete, A.; Tzavella, K.; Armas, I.; Binner, J.; Garschagen, M.; Giupponi, C.; Mojtahed, V.; Pettita, M.; Schneiderbauer, S.; Serre, D. Critical Data Source; Tool or Even Infrastructure? Challenges of Geographic Information Systems and Remote Sensing for Disaster Risk Governance. ISPRS Int. J. Geo-Inf. 2015, 4, 1848–1869. [Google Scholar] [CrossRef]
- Lichter, M.; Grinberger, A.Y.; Felsenstein, D. Simulating and Communicating Outcomes in Disaster Management Situations. ISPRS Int. J. Geo-Inf. 2015, 4, 1827–1847. [Google Scholar] [CrossRef]
- Hagemeier-Klose, M.; Wagner, K. Evaluation of flood hazard maps in print and web mapping services as information tools in flood risk communication. Nat. Hazards Earth Syst. Sci. 2009, 9, 563–574. [Google Scholar] [CrossRef]
- Huang, R. Mechanisms of large-scale landslides in China. Bull. Eng. Geol. Environ. 2011, 71, 161–170. [Google Scholar] [CrossRef]
- Chen, G.; Li, X.; Chen, W.; Cheng, X.; Zhang, Y.; Liu, S. Extraction and application analysis of landslide influential factors based on LiDAR DEM: A case study in the Three Gorges area, China. Nat. Hazards 2014, 74, 509–526. [Google Scholar] [CrossRef]
- Birk, R.; Baldauf, B.; Ohlemacher, R.; Andreoli, L. Evaluating a system of systems approach for integrated global weather, climate, and hazard monitoring. In Proceedings of the AIAA SPACE 2008 Conference & Exposition, San Diego, CA, USA, 9–11 September 2008; Volume 7085.
- Verhoeven, G. Taking computer vision aloft—Archaeological three-dimensional reconstructions from aerial photographs with photoscan. Archaeol. Prospect. 2011, 18, 67–73. [Google Scholar] [CrossRef]
- Kersten, T.P.; Lindstaedt, M. Image-Based Low-Cost Systems for Automatic 3D Recording and Modelling of Archaeological Finds and Objects. In Proceedings of the EuroMed 2012 4th International Conference on Progress in Cultural Heritage Preservation, Limassol, Cyprus, 29 October–3 November 2012; Ioannides, M., Fritsch, D., Leissner, J., Davies, R., Remondino, F., Caffo, R., Eds.; Springer: Berlin/Heidelberg, Germany, 2012; pp. 1–10. [Google Scholar]
- Quantin, C.; Allemand, P.; Delacourt, C. Morphology and geometry of Valles Marineris landslides. Planet. Space Sci. 2004, 52, 1011–1022. [Google Scholar] [CrossRef]
- Fell, R.; Corominas, J.; Bonnard, C.; Cascini, L.; Leroi, E.; Savage, W.Z. Guidelines for landslide susceptibility, hazard and risk zoning for land-use planning. Eng. Geol. 2008, 102, 99–111. [Google Scholar] [CrossRef]
- Cascini, L. Applicability of landslide susceptibility and hazard zoning at different scales. Eng. Geol. 2008, 102, 164–177. [Google Scholar] [CrossRef]
- Chacón, J.; Irigaray, C.; Fernández, T.; Hamdouni, R.E. Eng. Geol. maps: Landslides and geographical information systems. Bull. Eng. Geol. Environ. 2006, 65, 341–411. [Google Scholar] [CrossRef]
- Carrara, A.; Cardinali, M.; Detti, R.; Guzzetti, F.; Pasqui, V.; Reichenbach, P. GIS techniques and statistical models in evaluating landslide hazard. Earth Surf. Process. Landf. 1991, 16, 427–445. [Google Scholar] [CrossRef]
- Aleotti, P.; Chowdhury, R. Landslide hazard assessment: Summary review and new perspectives. Bull. Eng. Geol. Environ. 1999, 58, 21–44. [Google Scholar] [CrossRef]
- Tate, E.; Burton, C.G.; Berry, M.; Emrich, C.T.; Cutter, S.L. Integrated Hazards Mapping Tool. Trans. GIS 2011, 15, 689–706. [Google Scholar] [CrossRef]


| Layer | Format | Acquired Date | Description |
|---|---|---|---|
| Pre-landslide | |||
| QuickBird image | Raster | 06.02.2010 | Spatial resolution: multi-spectral band 2.4 m and panchromatic band 0.61 m |
| Topographical map | Raster | 2009 | The scale of 1:50,000 |
| DEM | Raster | 2009 | Extracted from topographical data in 5 m resolution |
| Slope map | Raster | 2009 | Extracted from DEM before landslide |
| TIN | Vector | 2009 | Generated based on DEM |
| Land use map | Vector | 2010 | The land use map was classified by QuickBird image and topographical map |
| Administrative border | Vector | 2010 | Administrative division of the study area |
| Post-landslide | |||
| Aerial image | Raster | 30.06.2010 | True color in 0.1 m resolution |
| Landslide extent | Vector | 30.06.2010 | Delineated based on the aerial image |
| DEM | Raster | 30.06.2010 | Derived from POS data in 2 m resolution |
| Slope map | Raster | 30.06.2010 | Extracted from DEM after landslide |
| TIN | Vector | 30.06.2010 | Generated based on DEM |
© 2017 by the authors. Licensee MDPI, Basel, Switzerland. This article is an open access article distributed under the terms and conditions of the Creative Commons Attribution (CC BY) license ( http://creativecommons.org/licenses/by/4.0/).
Share and Cite
Hou, W.; Lu, X.; Wu, P.; Xue, A.; Li, L. An Integrated Approach for Monitoring and Information Management of the Guanling Landslide (China). ISPRS Int. J. Geo-Inf. 2017, 6, 79. https://doi.org/10.3390/ijgi6030079
Hou W, Lu X, Wu P, Xue A, Li L. An Integrated Approach for Monitoring and Information Management of the Guanling Landslide (China). ISPRS International Journal of Geo-Information. 2017; 6(3):79. https://doi.org/10.3390/ijgi6030079
Chicago/Turabian StyleHou, Wei, Xuejun Lu, Pengda Wu, An Xue, and Liuke Li. 2017. "An Integrated Approach for Monitoring and Information Management of the Guanling Landslide (China)" ISPRS International Journal of Geo-Information 6, no. 3: 79. https://doi.org/10.3390/ijgi6030079
APA StyleHou, W., Lu, X., Wu, P., Xue, A., & Li, L. (2017). An Integrated Approach for Monitoring and Information Management of the Guanling Landslide (China). ISPRS International Journal of Geo-Information, 6(3), 79. https://doi.org/10.3390/ijgi6030079