1. Introduction
The city of Quito follows a grid model [
1], in which streets run at right angles to each other forming a grid and it imposes a very strict geometrical order. At the end of the 19th century and the beginning of the 20th century, the city of Quito experienced a number of deep urban transformations and needed a global urban plan to control the process [
2]. This plan proposed to create a new suburb in the south side with the name of Villaflora. The interest and importance with respect to the heritage of this suburb lie in its urban model, which is still today, in many senses unique in the city of Quito. Therefore, it is important to preserve this urban typology, since it represents an iconic reference for the local culture and for the overall urban discipline. In order to measure the value of this suburb in terms of heritage, it is necessary to define a framework that allows us to identify and understand the elements that are more or less relevant for the urban model [
3].
A field study carried out in 2016 on the city itself, consisting of review and analysis of the 795 parcels or buildings in which the urban plot is divided, clearly reveals to us a disappointing result regarding the patrimonial conservation of the original architectural features in this neighbourhood [
4]. Currently, very few of the existing buildings in the neighbourhood maintain their original architectural elements. Over time there has been a degradation of the elements that motivated its creation.
Given the circumstances of this deterioration, it is necessary to take suitable measures to restore those areas of the neighbourhood that are most representative or important for the residents and visitors. However, the economic resources to carry out urban reconstruction are scarce; therefore, the investment must be optimized by choosing those elements for which investment is most profitable.
In addition, the neighbourhood restoration project should not affect the existing commercial structure. Commerce and, in general, the entire tertiary sector play an important role in the lives of citizens, since a great part of urban life experiences involves places of consumption or exchange of goods. The removal or alteration of the commerce that has evolved in a natural way may damage the functionality of the overall tertiary structure of the neighbourhood [
5,
6].
Consequently, the main objective of this work is the definition of priorities for the development of an urban restoration plan with the objective of improving the state of conservation of the buildings of Villaflora without altering its commercial structure. In order to achieve the objective, a comparative study of the degree of patrimonial conservation is carried out in relation to the existing tertiary structure of the neighbourhood. This comparison takes place both locally and globally; locally, we consider the individual plots and globally, we consider the whole neighbourhood.
For our purposes, we needed to quantify a widespread concept: the heritage value of the neighbourhood of Villaflora. Firstly, we quantified the heritage value and then we applied the complex network theory to these values. In this sense, many different theories about patrimonial heritage and how to deal with it have been proposed in the literature but, to the best of our knowledge, they are not based on network theory. From the time of Viollet-le-Duc or Ruskin [
7] different views have been proposed, from highly preservative to more flexible perspectives, and from strongly exclusive, to more inclusive theories [
8]. Therefore, from the Venice Charter (1964) to the Charter of Krakow (2000), or in other words from Brandi [
9] to the present situation, in the discipline it has has been admitted that not only the great architectonic works from the past are valuable patrimony, but other modest expressions of architecture may also be so [
10]. The challenge is then how to find and define the attributes which capture this kind of value in such architectural elements, which might arise from different perspectives, including social, cultural and artistic perspectives. This is because even if we accept a wide definition of the concept of heritage [
11] as we do today, the truth is this part of the city has not traditionally been considered of value and its current situation is one of deterioration.
Locally, the buildings that make up the urban plot are considered and the dataset related to the heritage conservation value of each individual building is analysed. However, another dataset is obtained as it includes the data referring to the commercial endowments allocated to each building. Thus, we have two actualized geolocated datasets in the spatial network that models the urban fabric of the neighbourhood of Villaflora.
Globally, we represent the city as a complex network [
12,
13], since an urban network is more than the sum of its individual components, as there is a direct influence between the nodes through their direct and indirect connections. In addition, we must take into account that the information present in the network is subjected to a very specific topology [
14]. In fact, the conclusions that can be drawn at the individual level may be contradictory when considering a larger scale, where the movement of people and human flows can not be simplified to a series of individual elements [
15,
16]. A study of the neighbourhood of Villaflora as a complex urban network will facilitate the task of proposing a restoration in certain parts of the city, without affecting its natural commercial structure [
17].
The relationship of both scales is carried out by applying the Adapted PageRank Algorithm Modified (APAM) [
18]. This algorithm constitutes a centrality measure of a complex network with information associated to the nodes [
19,
20,
21]. It allows us to estimate the importance or the request of the public spaces, taking into account the local information of each building, as well as the topology of the urban layout at the neighbourhood level.
The overlapping of the results of the APAM centrality with the data referring to the patrimonial conservation degree of the buildings leads us to identify the neighbourhood locations that are more appropriate for carrying out urban actions oriented to developing improvements in the patrimonial conservation of the neighbourhood of Villaflora.
2. A Dataset to Obtain a Heritage Conservation Index
To obtain the dataset, fieldwork was carried out in Villaflora during the summer of 2016. For a detailed description of the fieldwork performed, see [
4]. In any case, we will describe some important aspects of this dataset.
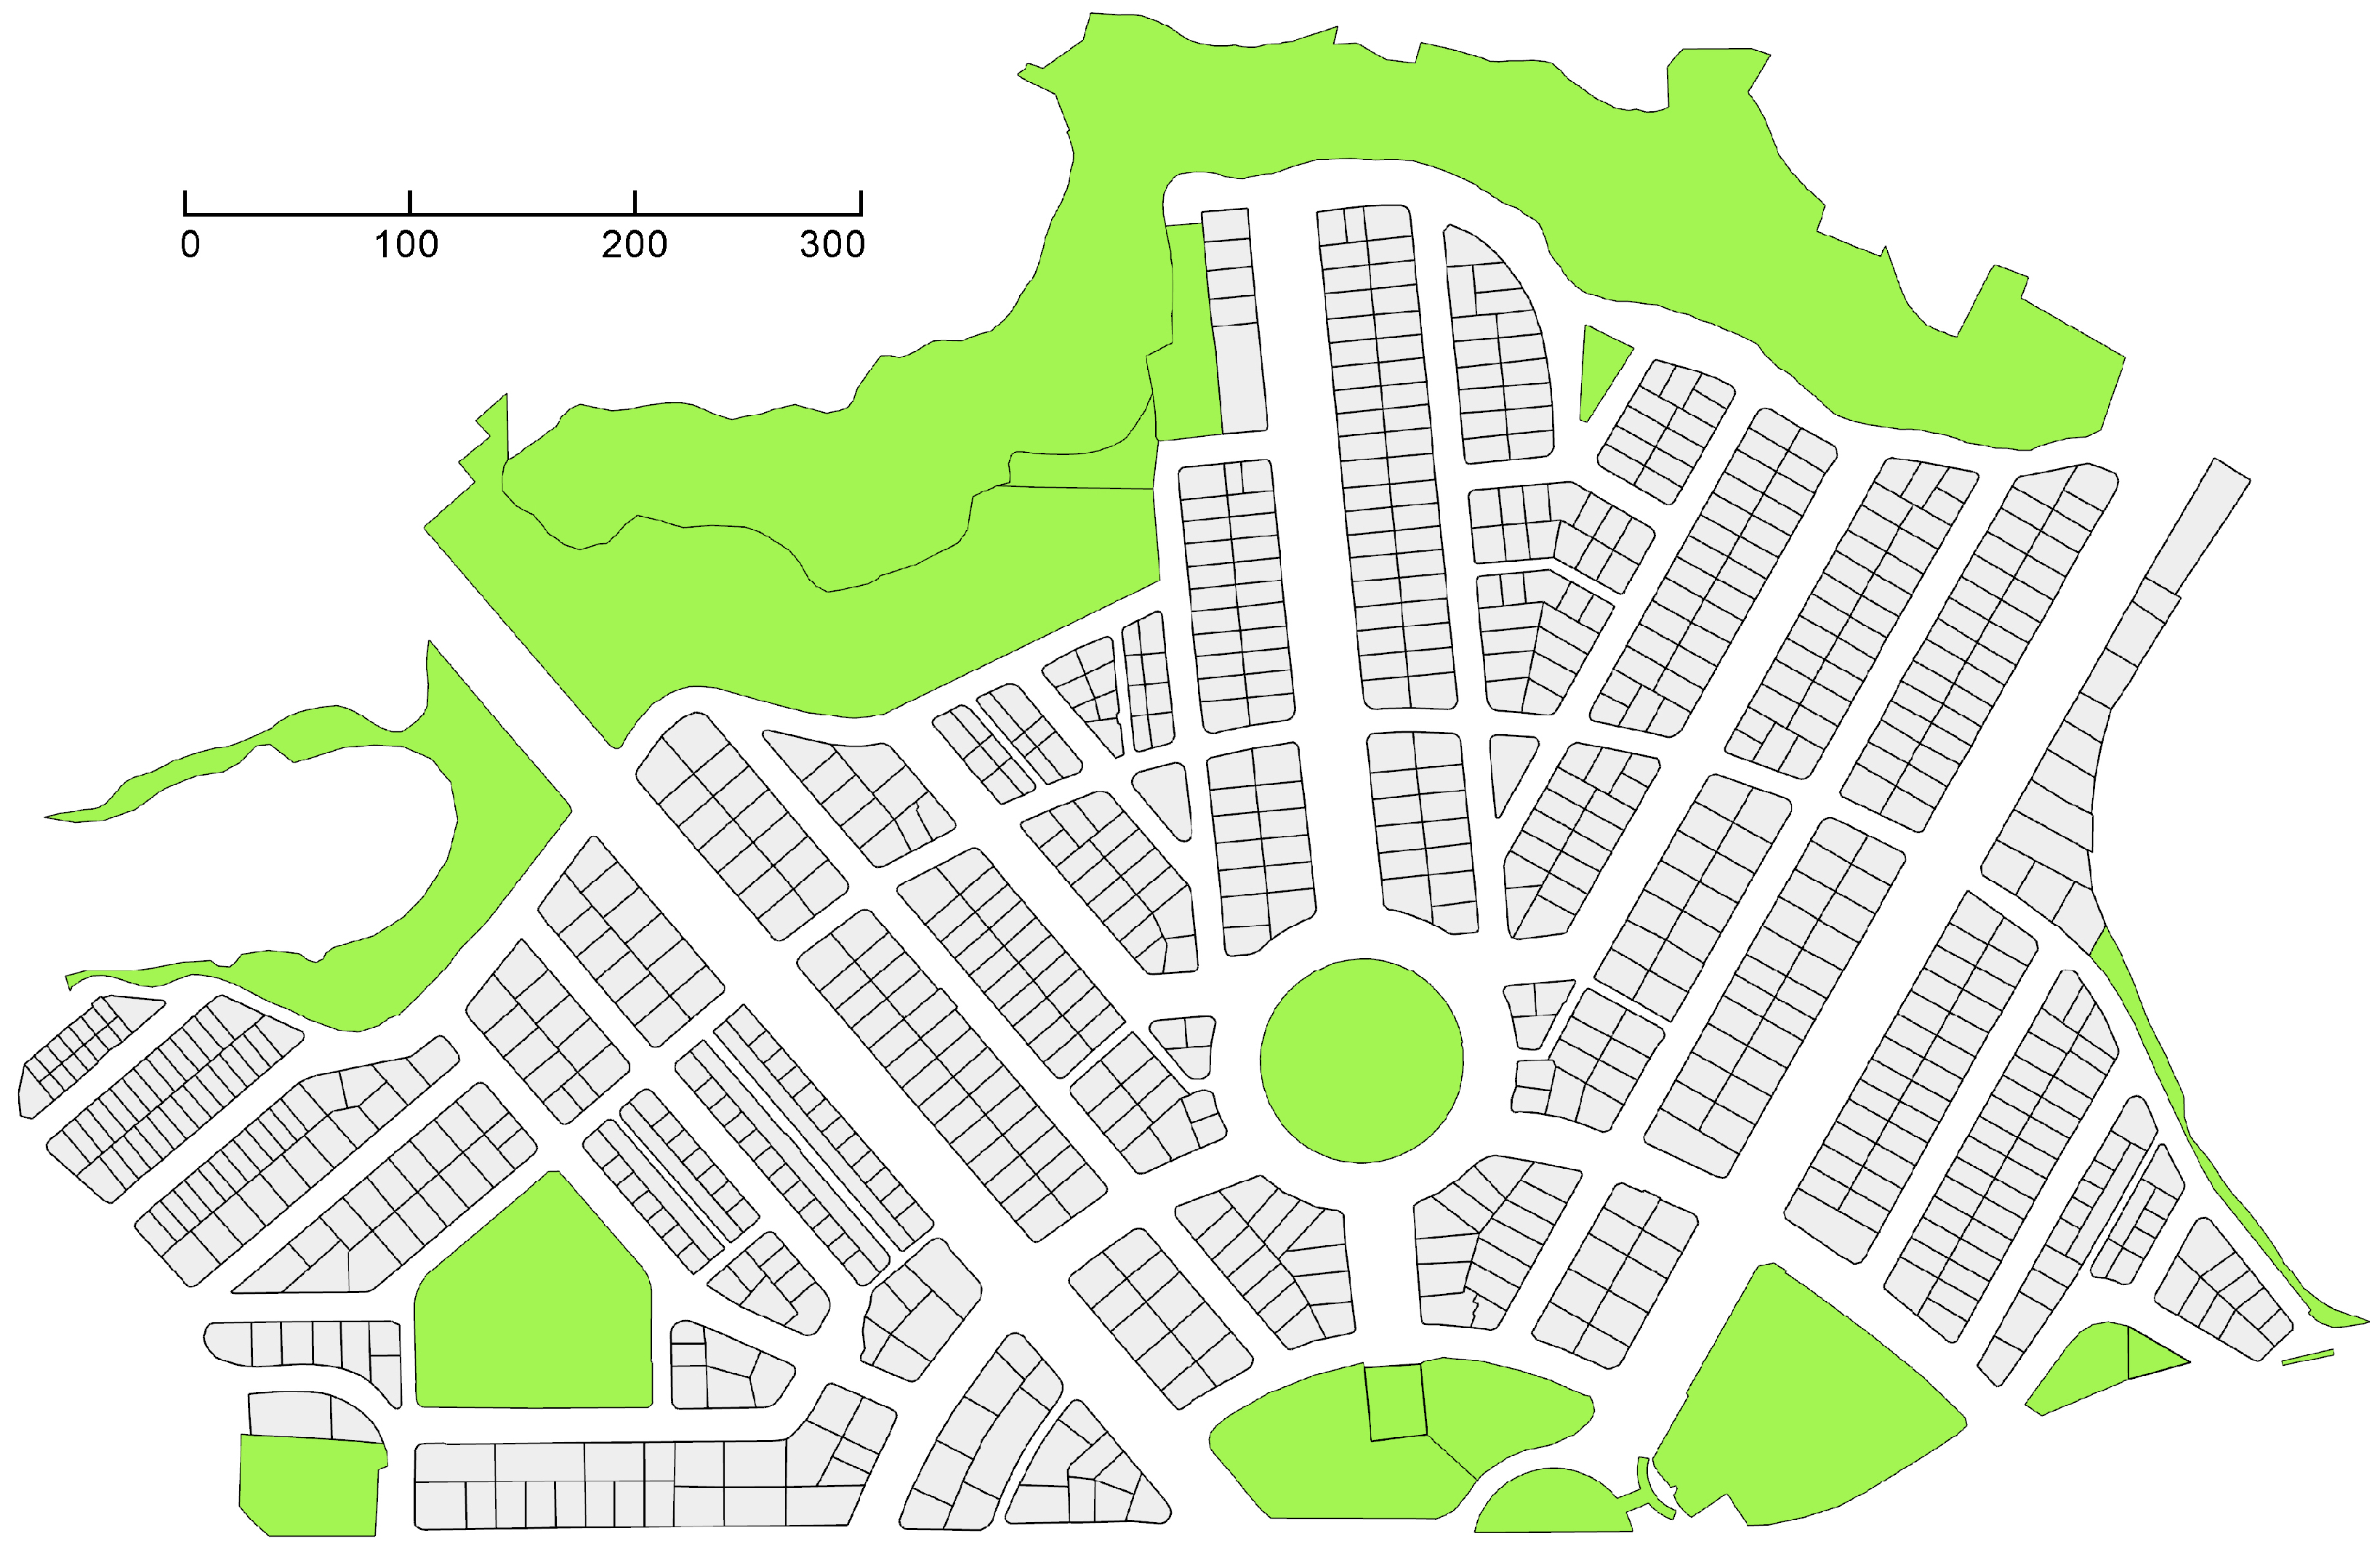
Figure 1 shows the map of the urban area of Villaflora. In this map we have divided the built space into 795 plots that represent the different existing buildings that are going to be object of the analysis throughout the work. A reference number is assigned to each plot or building with the purpose of its later identification and geolocation.
Even if we use a wide definition of the concept of
patrimony [
11], this part of the city has not traditionally been considered of value. In fact, at present this part of the city is quite damaged and distorted. In our case, mentioned previously, the value of the Villaflora suburb lies in its urban model. The architecture is modest—homes initially planned for public workers, without any notable building in the ensemble, with unremarkable building techniques and materials used. From this perspective, the buildings in Villaflora could not be included as part of the city’s patrimony in a traditional sense. This neighbourhood is the result of applying an urban model which is in many aspects unique in the city of Quito: while there might be other areas where this model has been partially used, the garden suburb model was applied with deepest and strongest results in Villaflora. Hence, we will measure the patrimonial value of each architectonical element based on its capacity to express this model; the higher the contribution of a building to the garden suburb model, the larger its patrimonial value.
In order to quantify Villaflora’s patrimonial value, we use a system of indicators. Our methodology is similar to that followed by previous authors, such as Gehl in [
22] and Salvador Rueda—head of the Agencia de Ecología Urbana in Barcelona. However, they apply the methodology from an urban perspective and we apply it from a patrimonial perspective. We first define a list of categories which are relevant for Villaflora’s morphology and next, we assign a value to each of them. We consider a list of categories consisting of all the elements that play a relevant role in the garden suburb model. We propose a list of nine elements, namely: roof shape, cover material, surface material on the façade, colours, windows, ornamental elements, garden fences, scale, and global volume. Then, a numeric value for each indicator is assigned according to how much it contributes to the garden suburb model.
Let us explain this process in more detail. To perform the quantification of each parcel, we define a data matrix denoted by in which its n rows represent the n buildings studied in the neighbourhood, and each of its k columns represents the nine indicators associated with these buildings. Specifically, an element is the value we attach to the indicator at parcel . Simplifying, we can say that is a data matrix. However, if we establish k characteristics associated to the different buildings, not all of them have the same relevance or influence in the study of heritage conservation. Therefore, we need to assign a weight to each feature studied. So, a ()-vector is constructed, where the element that occupies the i-th row is the multiplicative factor associated with the property or characteristic .
In our fieldwork, we take,
Then, if we calculate the product,
we obtain a
vector (
) that contains the heritage conservation values we assign to every building of the neighbourhood.
Given this framework, we carried out comprehensive fieldwork to identify each architectural element in every building of the Villaflora suburb. In addition, each element is assigned a value according to its degree of conservation at the present time in relation to the original canons.
As a result of the process of quantification of the heritage conservation value of the buildings in the urban area, we have a numerical value that we refer to as Heritage Conservation value or HC value associated to each one of these buildings or plots, a unique item of data that characterizes each element individually. We will denote in the following a particular HC value for the building i as .
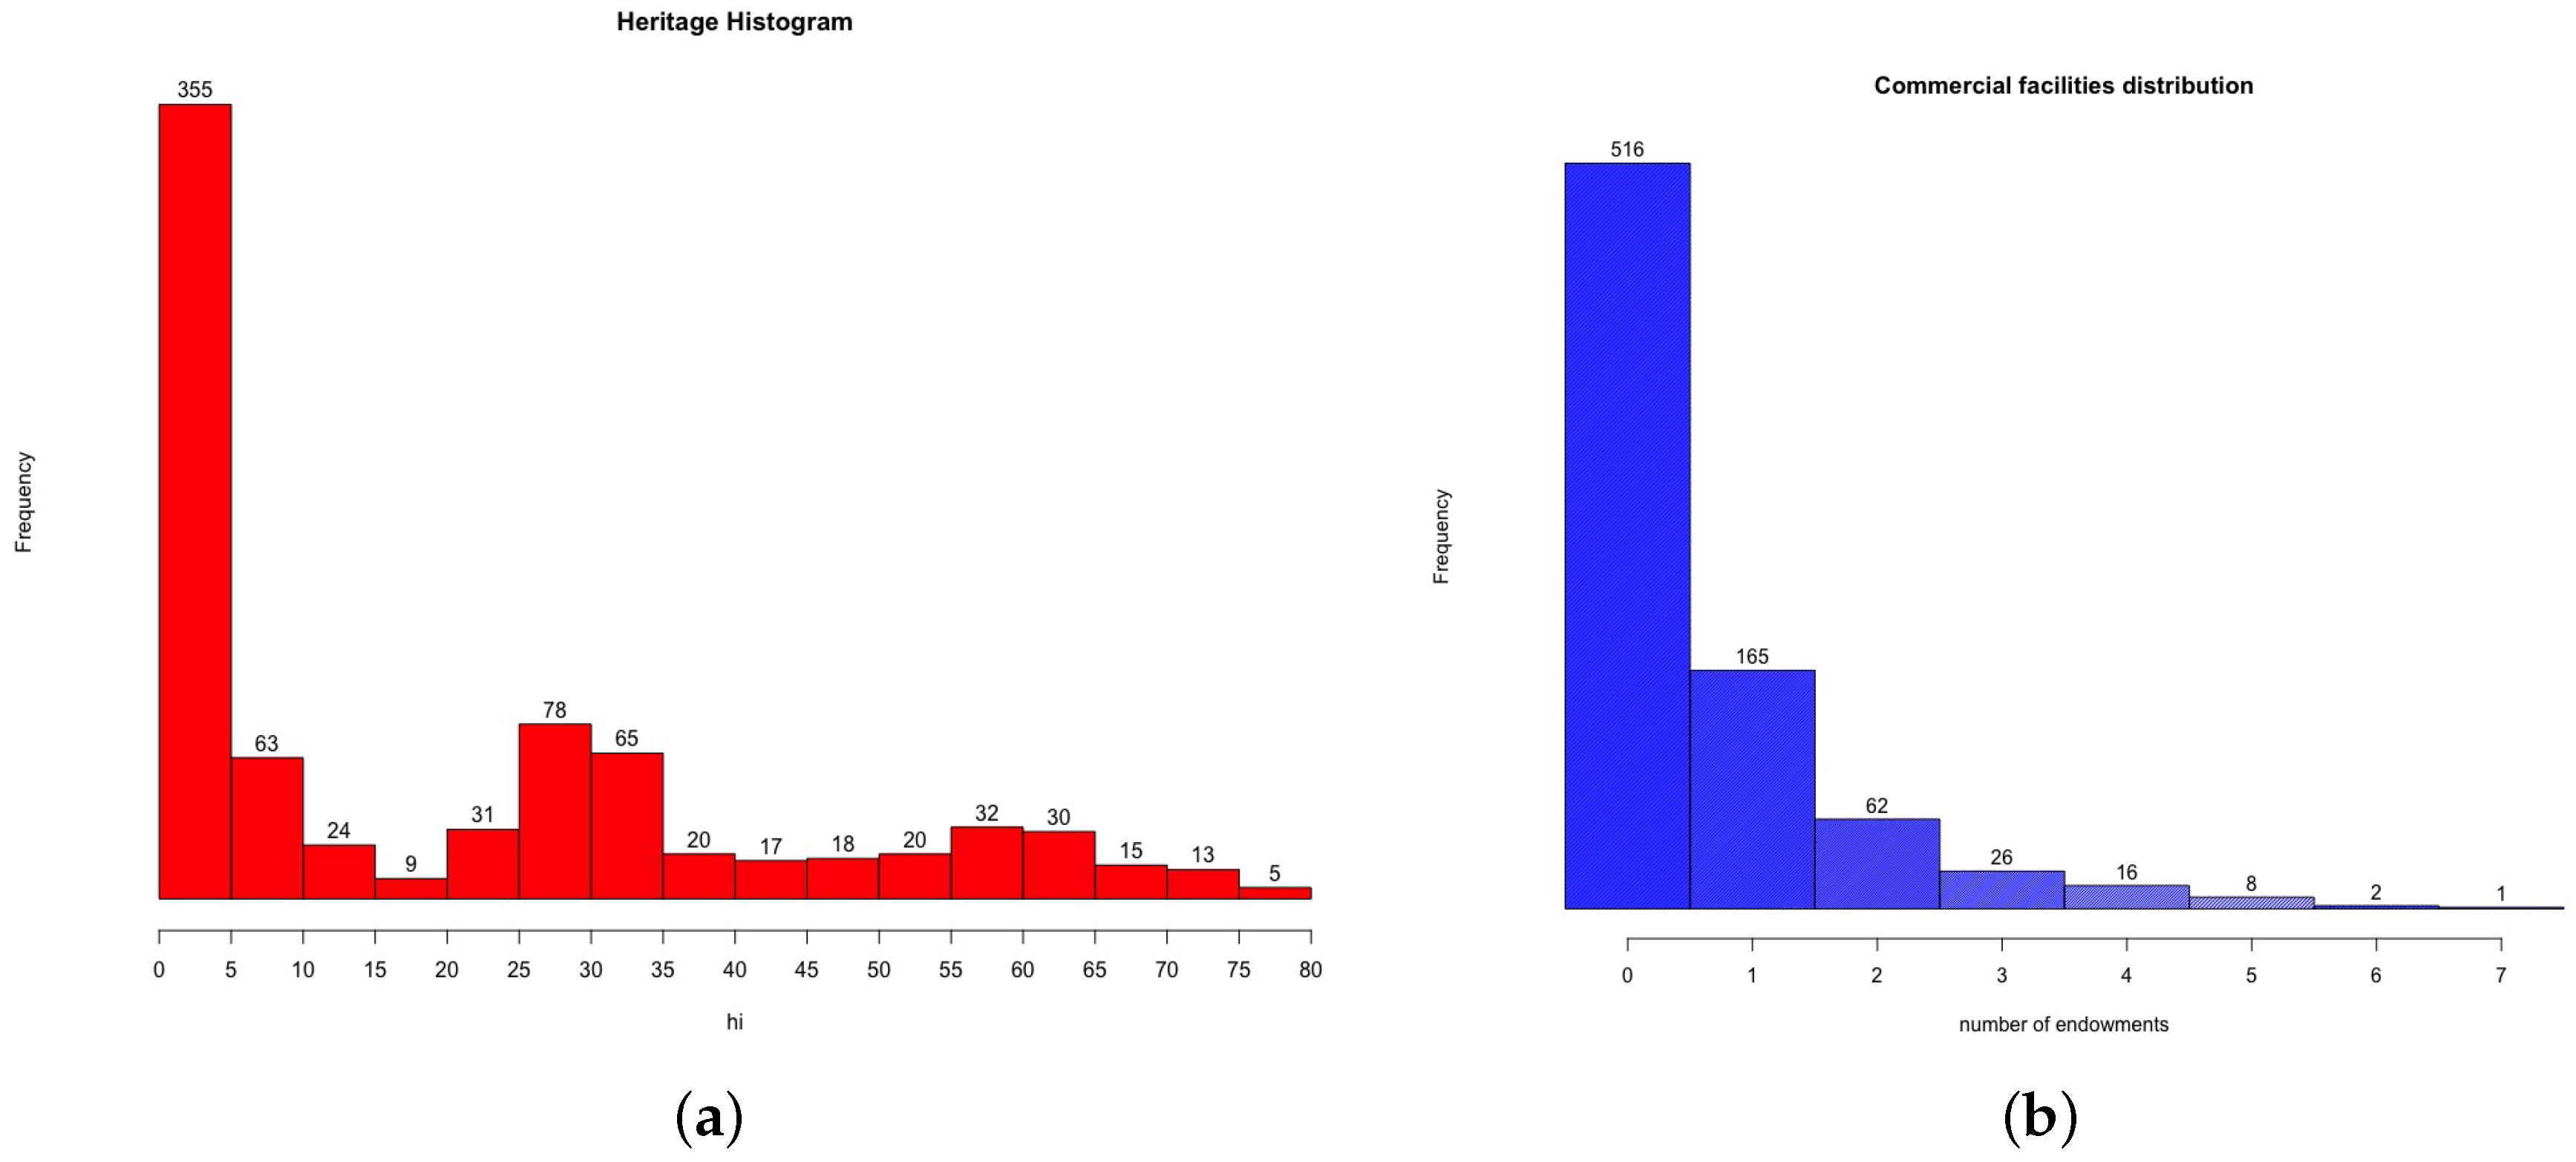
We summarize the data obtained in the histogram of frequencies shown in
Figure 2a. It is a continuous variable so we take intervals of 5 units to measure the frequencies.
Note that we have 355 buildings in the neighbourhood with a null value of heritage conservation, which represents a very considerable amount.
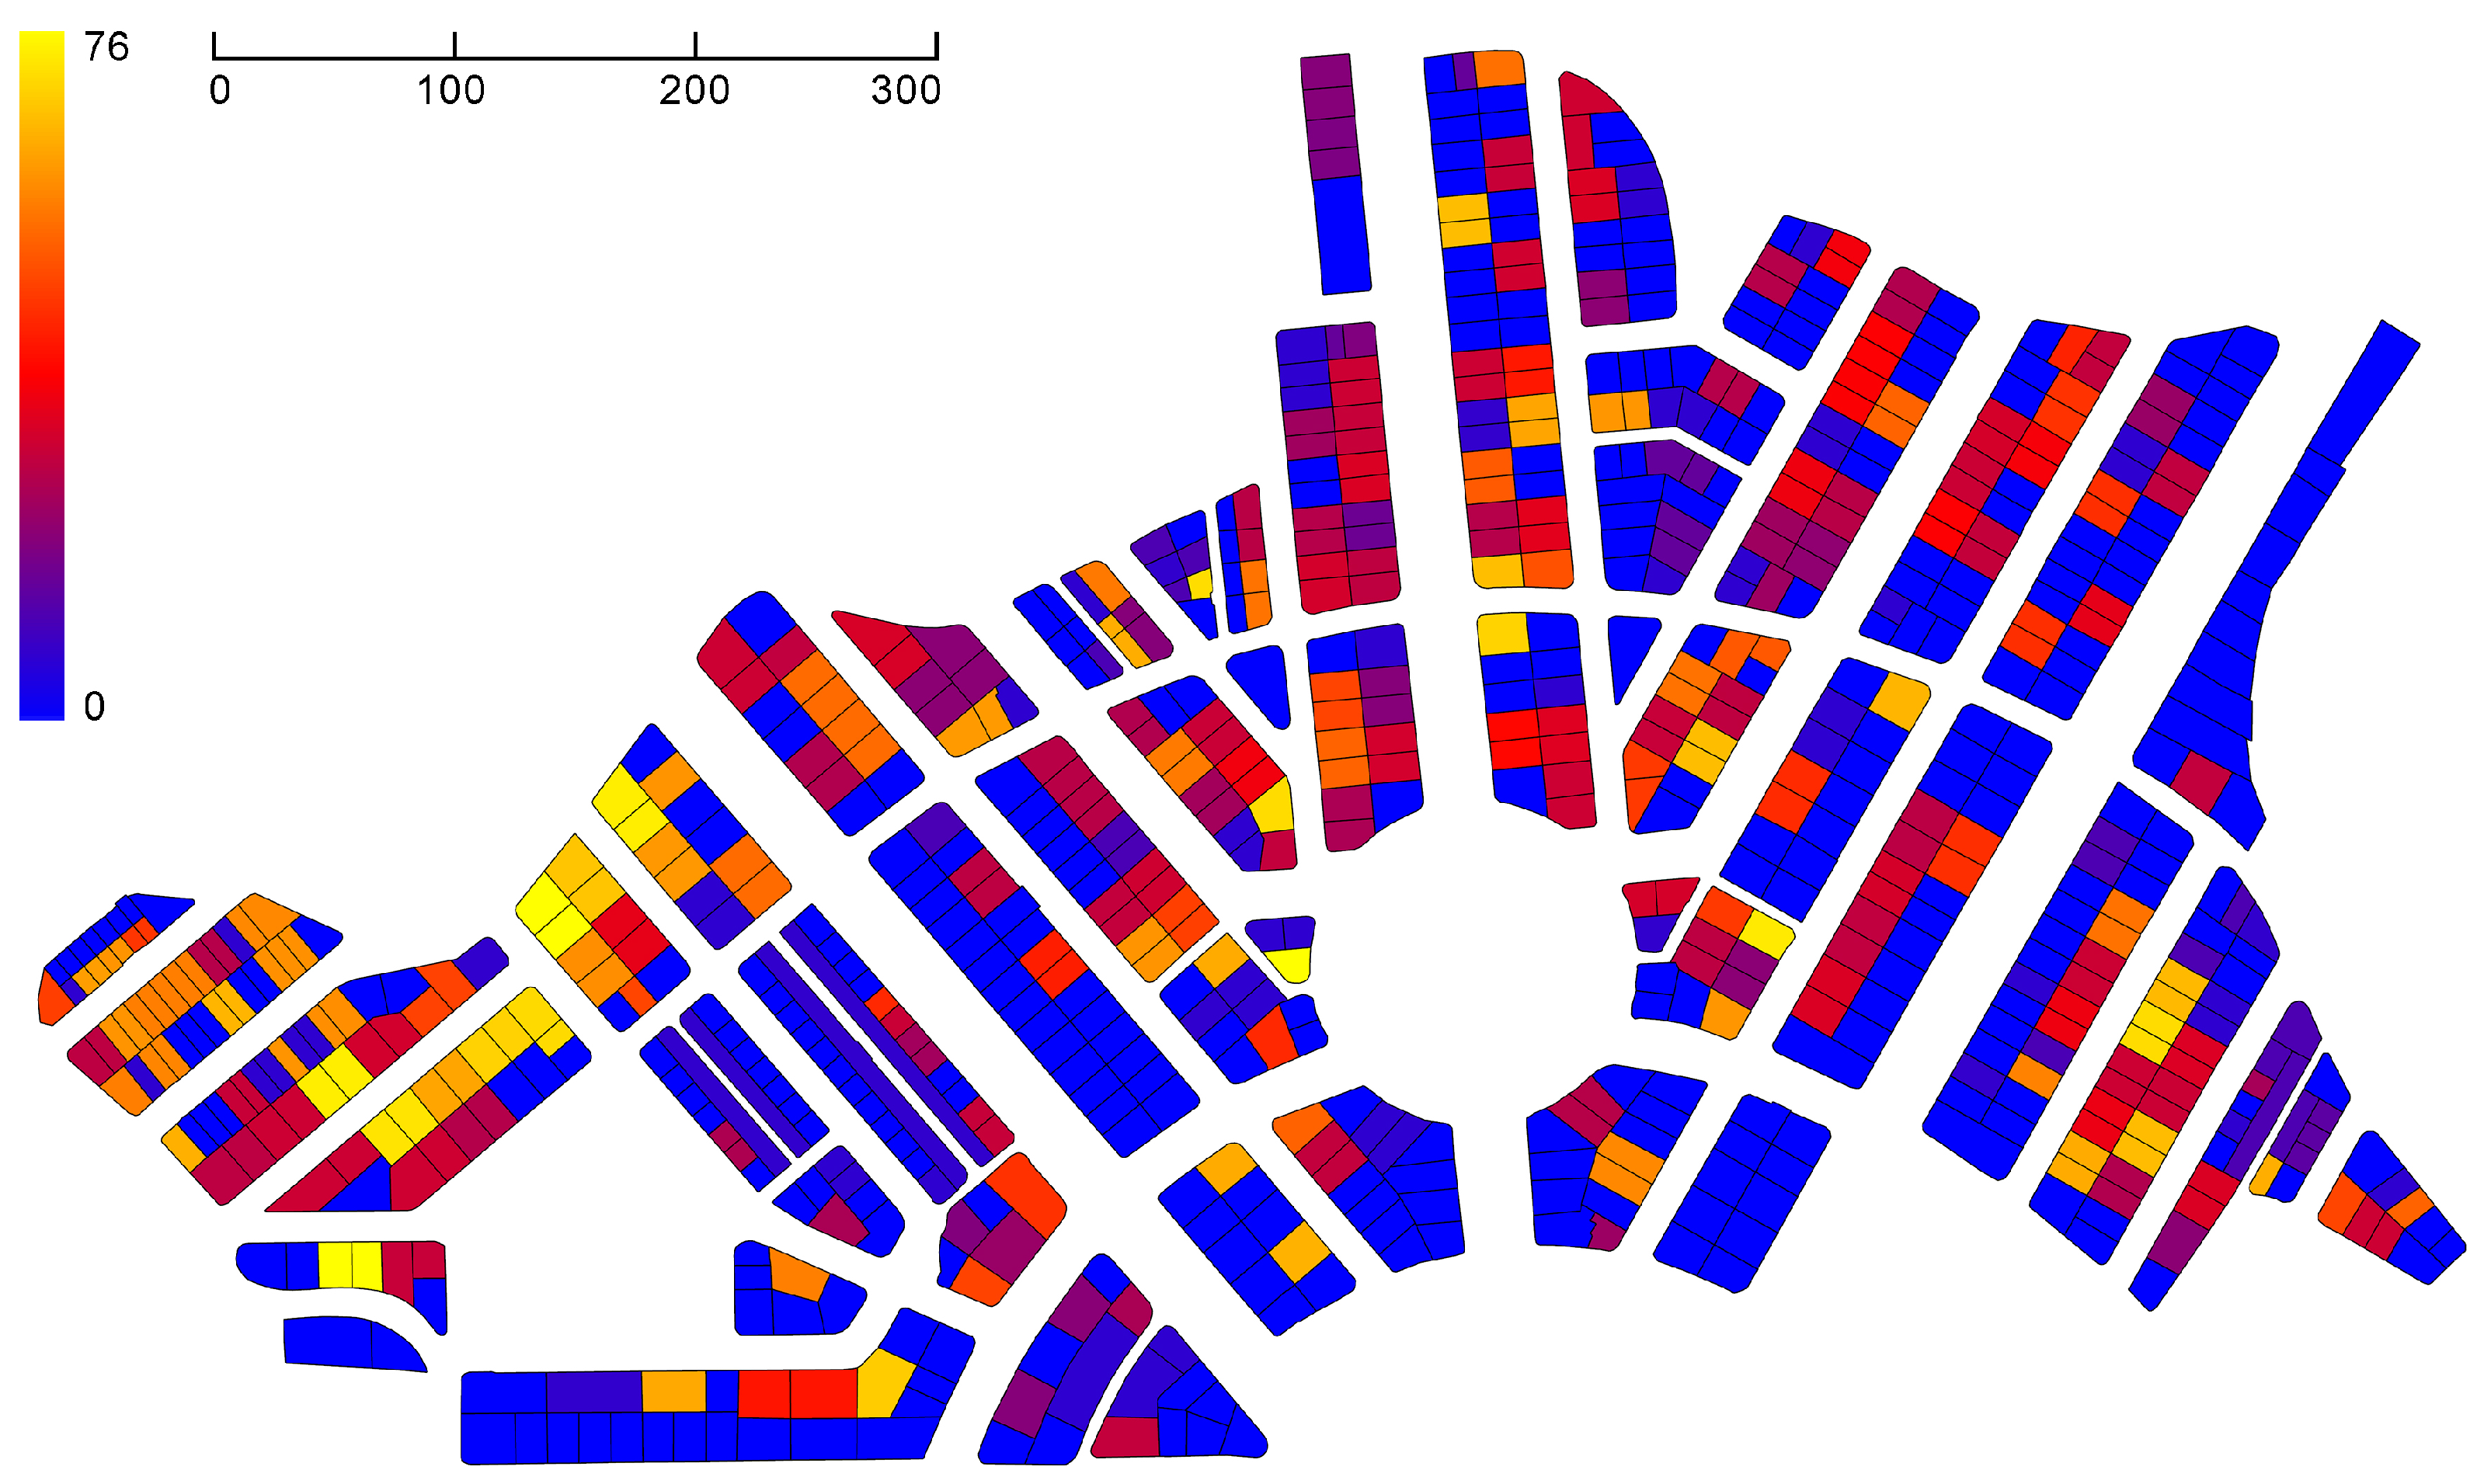
A visualization of the values obtained for each building following the chromatic scale described in the image is shown in
Figure 3, where we can distinguish in yellow the buildings with a higher value of patrimonial conservation.
From the simple observation of the image shown in
Figure 3 we can appreciate that there is an area, in the western part of the image, where some buildings (plots) with a high conservation of the heritage architectural elements are concentrated. In this area there is a concentration of
interesting buildings that does not occur in the rest of the urban area, where the dispersion of these patrimonial buildings is much greater.
We also highlight the large number of plots that heve an HC value equal to zero. We can find blocks of buildings where they have this value, which means that degradation is very important and evident from the point of view of architecture conservation. This degradation can be due to several factors, among which we emphasize the own individual needs of the residents or the aggregation of new elements that are not in agreement with the elements of the original design. For instance, houses that are reformed to modernize or to expand their capacity, and businesses or facilities that are incorporated and require drastic reforms of architectural elements, among others.
3. A Study of the Commercial Activity in the Neighbourhood
We can say that the service sector in general contributes to the vitality of the public space in cities which, at the same time, articulates the different activities and establishes linkages between individuals and the city spaces [
23]. Bearing in mind that the liveability of a city largely depends on how heterogeneous and inviting its public places are, and that
the presence of people in itself signals which places are worthwhile ([
22], page 63), it is then possible to assume that the location of commercial establishments and recreational venues has a lot to do with where successful public spaces are in a city. At the same time, these spaces, which are likely to have a certain degree of popularity, often act as symbols that reflect the city’s image and identity [
24].
Based on these reflections, we measure the commercial activity that is developed in the neighbourhood in order to better understand how it participates in the social and public life of residents. This will produce a new dataset with real data updated on the day the fieldwork is carried out. The collection of this information was performed by visual inspection of the places.
Commercial activity has been classified into four sectors:
Type 1: Bars, restaurants, cafes, ...
Type 2: Sales offices and bank offices.
Type 3: Shops with an area less than 300 square metres.
Type 4: Big shops (department stores, shopping centres, ...) with an area greater than 300 square metres.
As a result of the work of identifying the endowments related to commercial activity, each building of the urban layout is assigned a vector that reflects the number of endowments present in the same respect to each of the four sectors analysed.
In
Figure 2b we show a graph of frequencies similar to the one performed for the data related to the heritage value, taking into account that the variable is now discrete, so it is not necessary to work with intervals, but with the discrete values themselves. We do not particularize any commercial sector, since we consider the total data obtained as the sum of existing commercial allocations in all sectors.
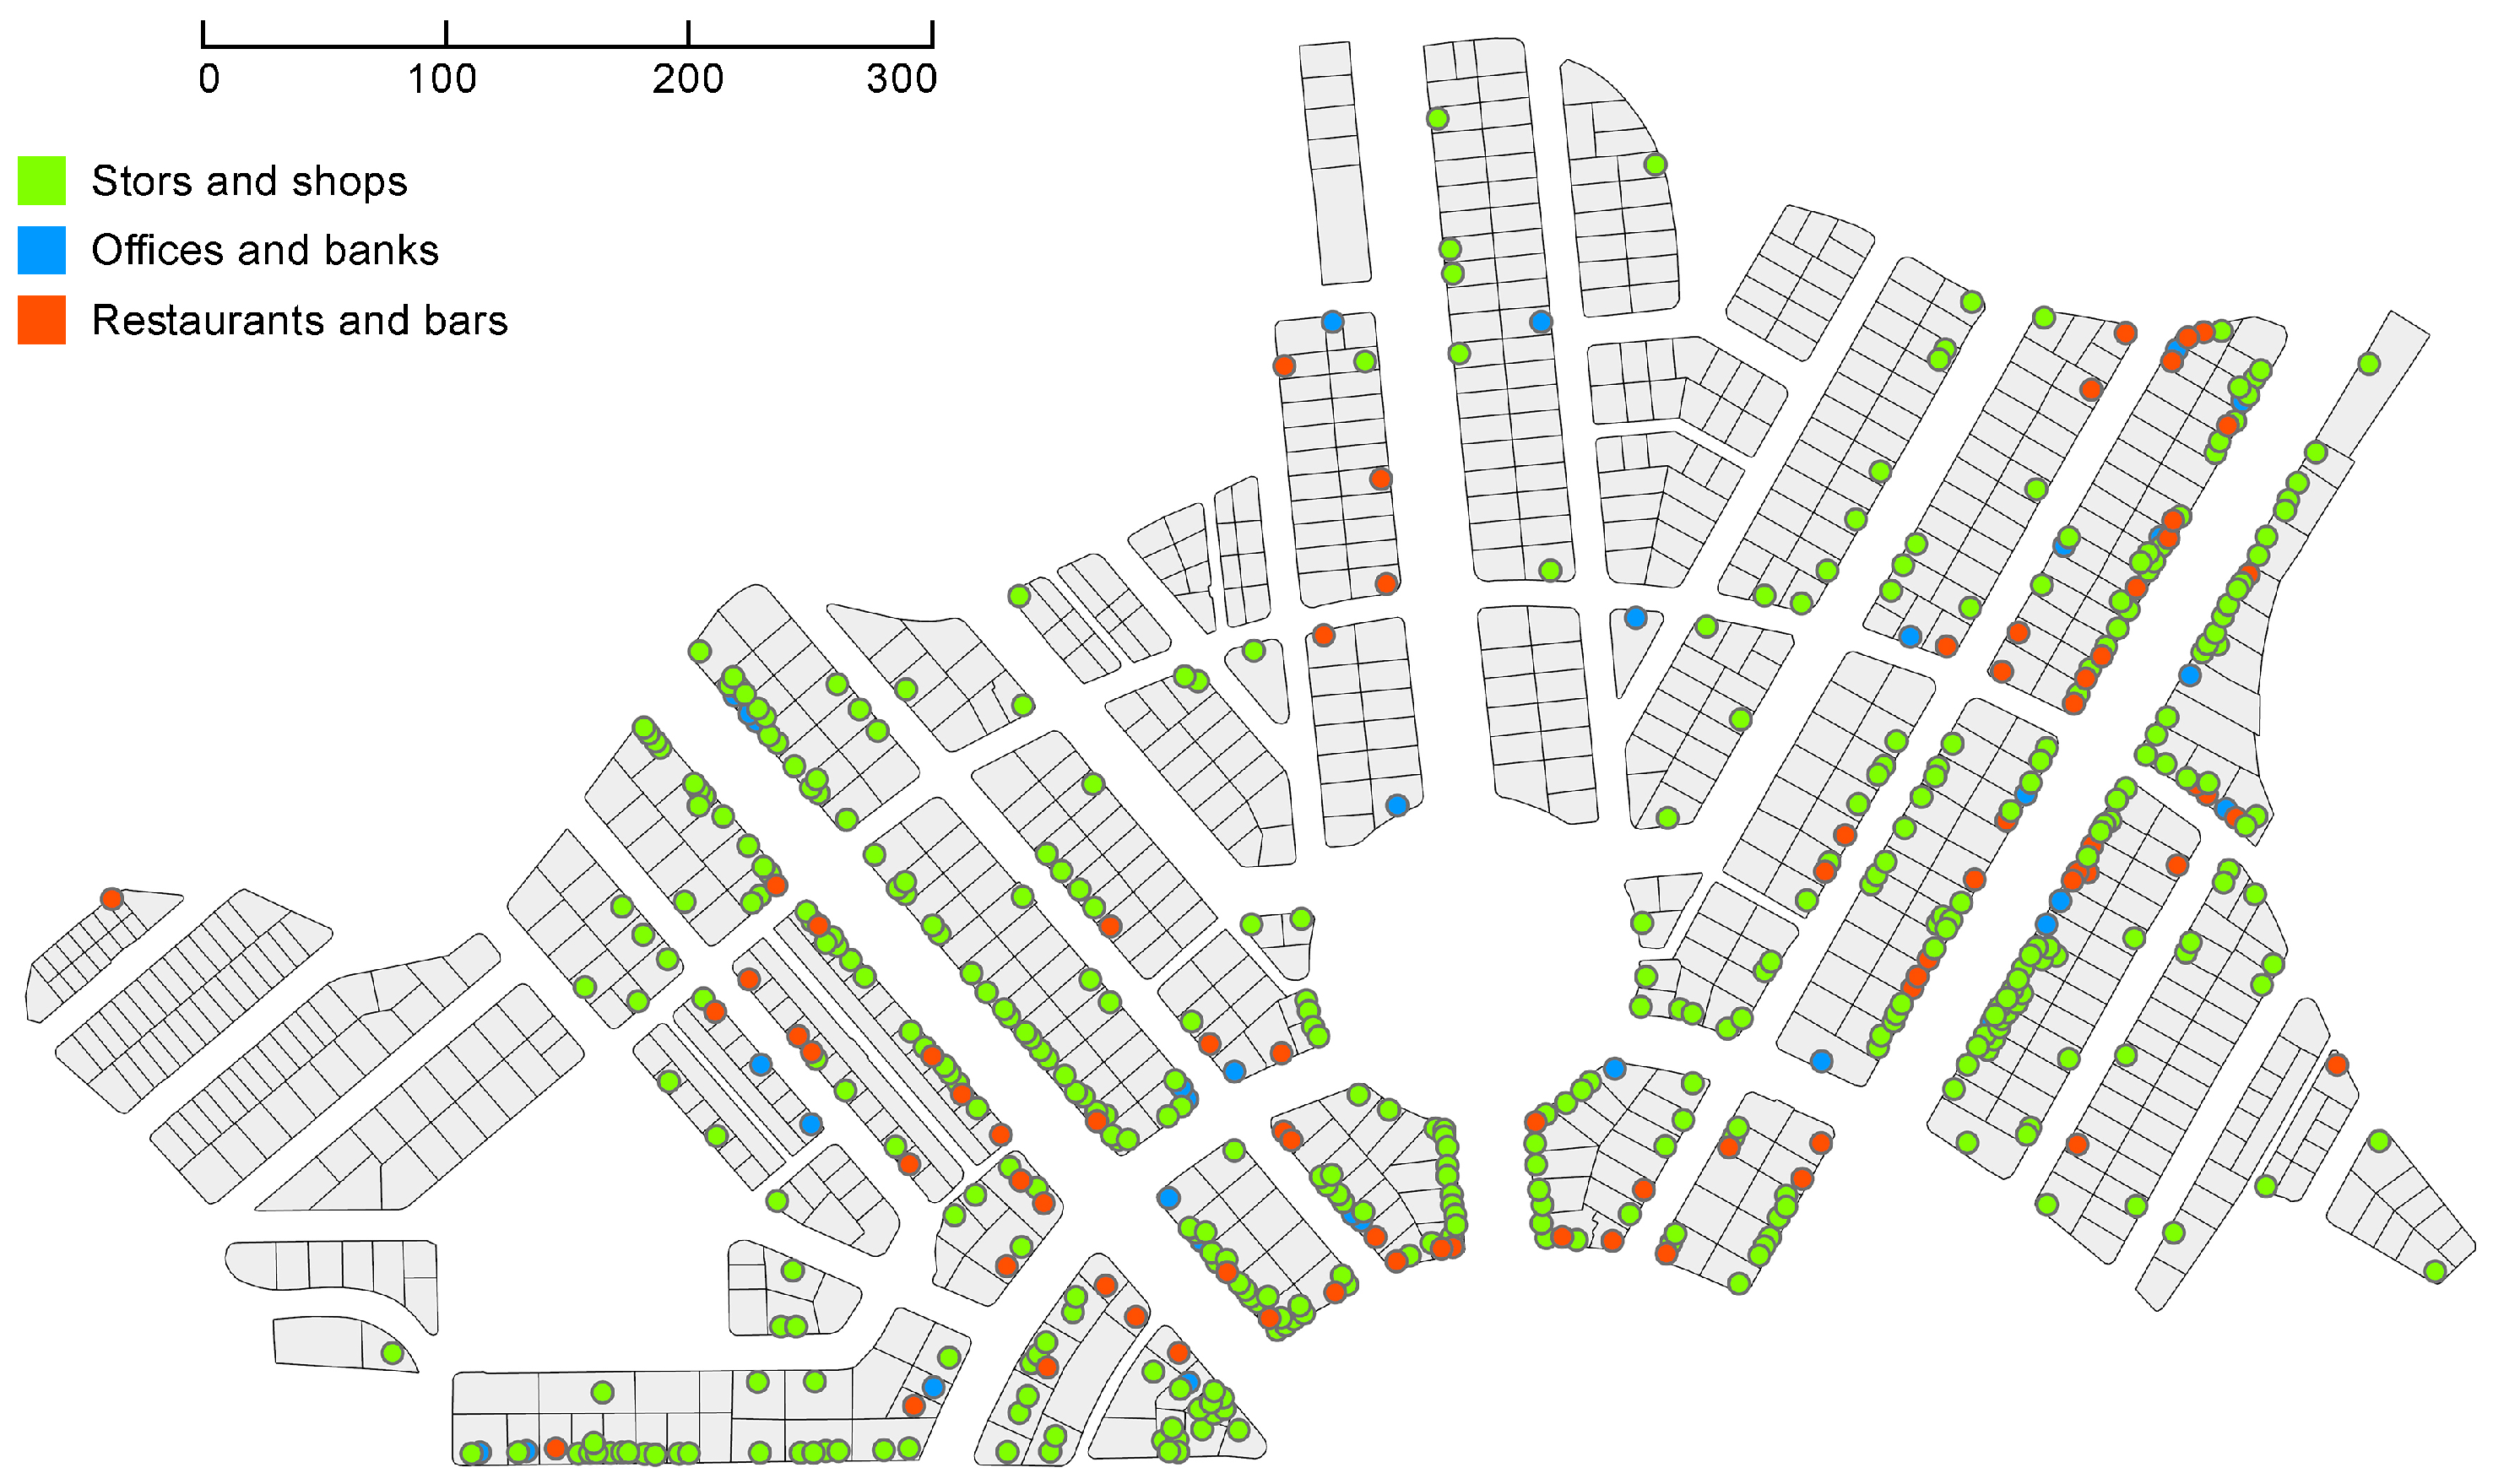
In
Figure 4 we have geo-referenced all the endowments and facilities related to the four sectors of the commercial activities described above.
We show the geolocation of venues that represent commercial activity, such as stores (including gyms, learning academies and small commerce), with green circles. The restaurants and bars have been represented by red circles, while the banking offices or companies have been geolocated using blue circles. Note the clear concentration of commerce in the two main arteries of the neighbourhood, although there are relatively large areas where there is no commercial activity and, therefore, the presence of humans in the streets is very scarce.
The first thing that strikes us is that there are no provisions of type 4 throughout the urban fabric, ie, we can not find large shopping centres or large stores in the neighbourhood. This fact clearly shows us some of the characteristics of the activity developed in the streets. It is also notable the high number of buildings that do not have any commercial endowment, which means a low presence of people in the street in those public spaces.
4. Analysing Both Datasets
We now compare the datasets obtained through the corresponding fieldworks in order to extract all the possible information from the local perspective of each building.
We construct a general table (see
Table 1) in order to unify datasets. Each row represents an urban plot or building. The table consists of the following columns: an identifier (ID) that allows us to geolocate each element on the map, three columns for each of the commercial sectors 1, 2 and 3, i.e., food-services, offices and shops, respectively. Another column is used to compute the total number of commercial facilities for each element, adding the endowments of the three sectors. In the next column we can see the HC index, denoted by
. The last column represents the centrality value of each element after running the APAM algorithm.
In order to establish a comparison between both datasets, we construct a new table that reflects the basic statistical parameters of the variables involved in the study.
Table 2 shows the basic statistical parameters such as the maximum and minimum values of each variable (maximum and minimum), the values corresponding to the first quartile and third quartile (1Q and 3Q, respectively), as well as the median and the mean. In terms of dispersion measures, the standard deviation has been calculated to know the degree of dispersion of the data with respect to the mean value. We have added the calculation of the mean plus the standard deviation (upper rounded),
; its usefulness will be seen later.
Looking at the data shown in
Table 2, several facts attract our attention. To begin with, all median and first quartile values are equal to 0 for all variables regarding commercial endowments. This gives us an idea of the limited commercial activity present in the neighbourhood, speaking in local terms. Concerning the patrimonial conservation value
, the median is
, which is a very low value. With regard to endowments, the value of the third quartile (3Q), for total endowments, is equal to 1, which means that
of the buildings only have 0 or 1 commercial endowments. On the other hand, we highlight the high value of the standard deviation of the patrimonial conservation value.
In order to compare the two main variables such as the total number of commercial endowments and the HC value , we are interested in determining the limits from which we can consider high and especially significant values of the different variables object of the comparative. For example, which values of the patrimonial conservation index of a building are significantly high taking into account the collected data? On the other hand we ask, what number of endowments do we establish to affirm that a building has high and significant commercial activity?
To answer these questions with respect to establishing limits from which we consider significant values in the variables, we have defined the value . Thus, when a value of a certain variable is greater than to the maximum, we say that it is a significant value or positive.
As for the significant values from the negative point for its low value, the situation is different. Observing the graphs of frequencies we notice the large number of elements with null values in the studied variables. This leads us to take the null values as negative significant values.
Consequently, in view of the results exposed in
Table 2, we consider that buildings with a total of commercial endowments of three or more units are very significant or
positive with respect to the commercial activity. On the other hand, buildings with an
index greater than 42 are considered as having a very good patrimonial conservation level or as being
positive.
In this framework, we proceed to compare both characteristics from the databases: heritage and commercial activity. To perform this task, we establish the following groups in the global set of 795 buildings:
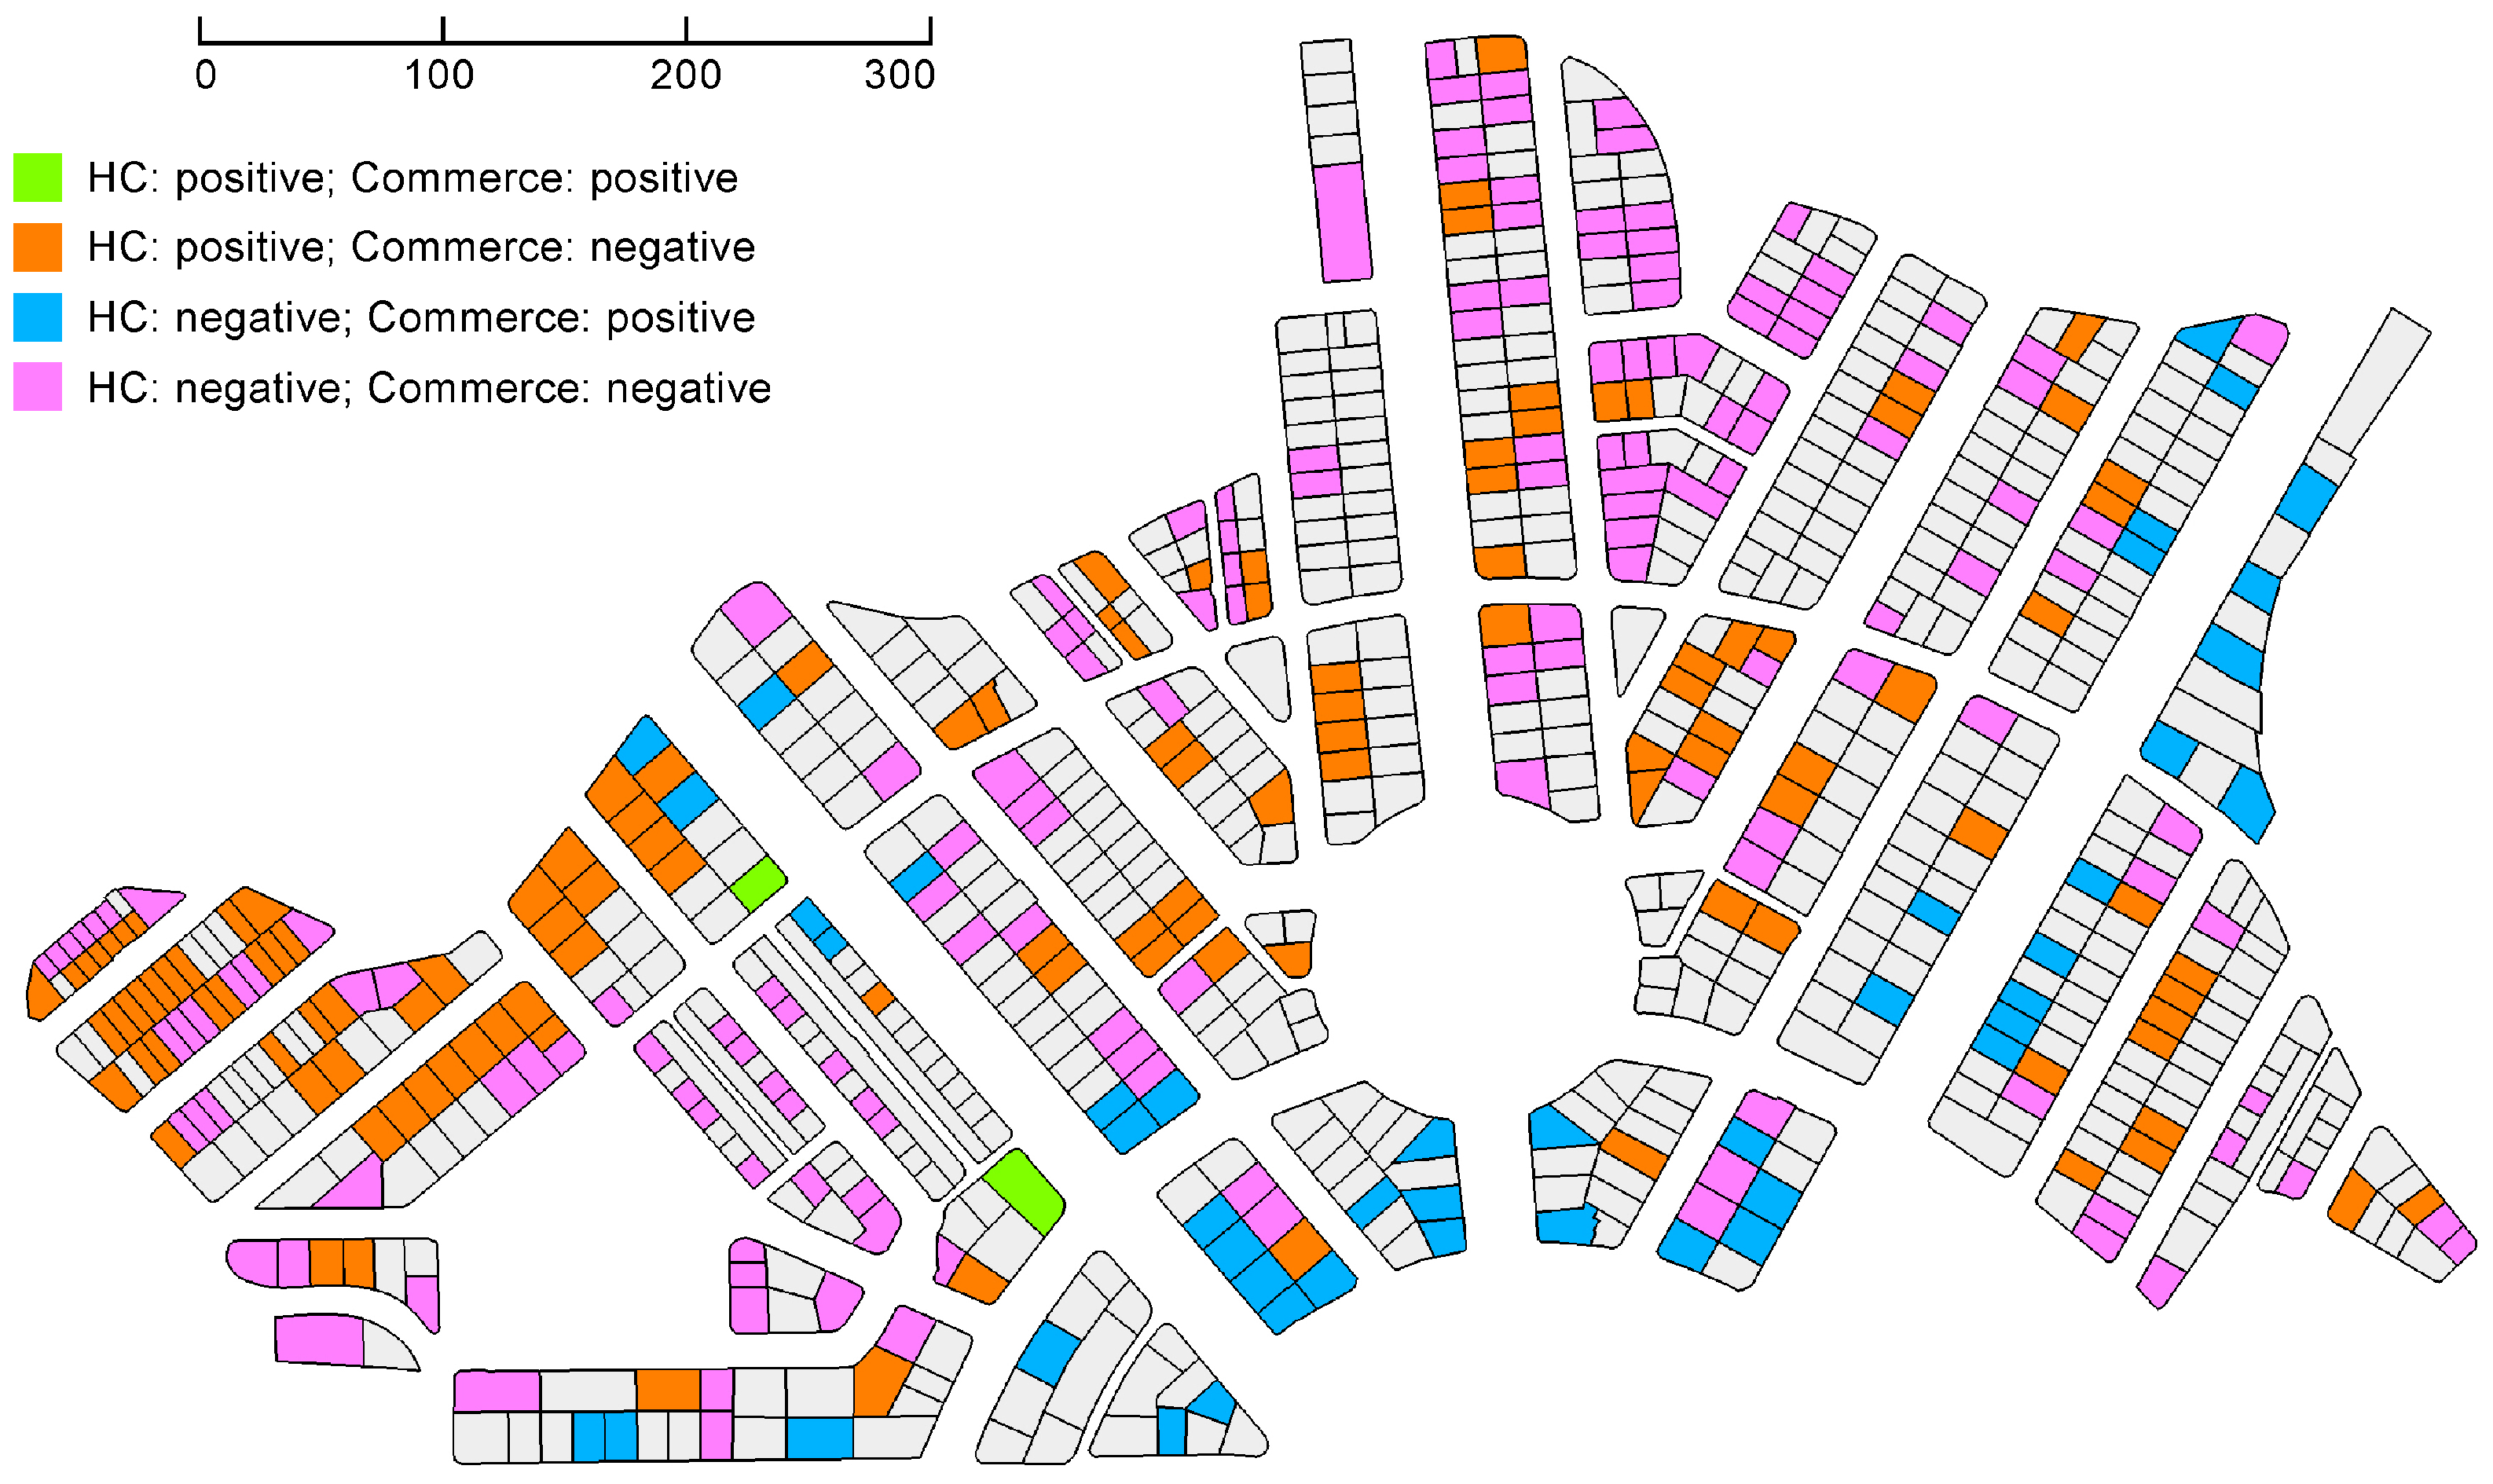
Elements with positive value and positive commercial activity.
Elements with positive value and negative commercial activity.
Elements with negative value and positive commercial activity.
Elements with negative value and negative commercial activity.
The results obtained from this comparison have been summarized in
Table 3 and have been graphically displayed by means of
Figure 5.
We can say that the perfect situation occurs when an element has very high values of both patrimonial conservation and commercial activity, that is, both values are positive.
4.1. Global Commercial Activity Index Computed by APAM
In [
25], Agryzkov et al. show how an algorithm for ranking the nodes of an urban network, as Adapted PageRank Algorithm (APA) [
26], may be used to analyse and represent the commercial activity of a city, establishing areas in the city where there may exist a greater concentration of people in public spaces. As already mentioned in a previous section, the fundamental reason for using this algorithm, taking the dataset generated by the number of commercial endowments located on each building, is based on the fact that it provides an estimate of the places or areas where we can find more people transiting in public spaces. This estimation is done in function of the ranking of the importance of the nodes according to the characteristics or properties that we are measuring. In our case, we will obtain a classification or ranking of the nodes in order of importance according to their commercial activity and, therefore, as a function of the greater presence and flows of the passers-by.
To establish a classification of nodes of the network using the APAM algorithm, firstly we need to assign the data obtained from the fieldwork (commercial facilities) to the nodes of the network. In the the primal graph, each node represents an intersection and, since the data are located in every parcel, we need to use a criterion to assign data to the nodes. The criterion that we follow in the assignment process is to consider the endowments existing in the buildings that are in the polygon of which is a vertex.
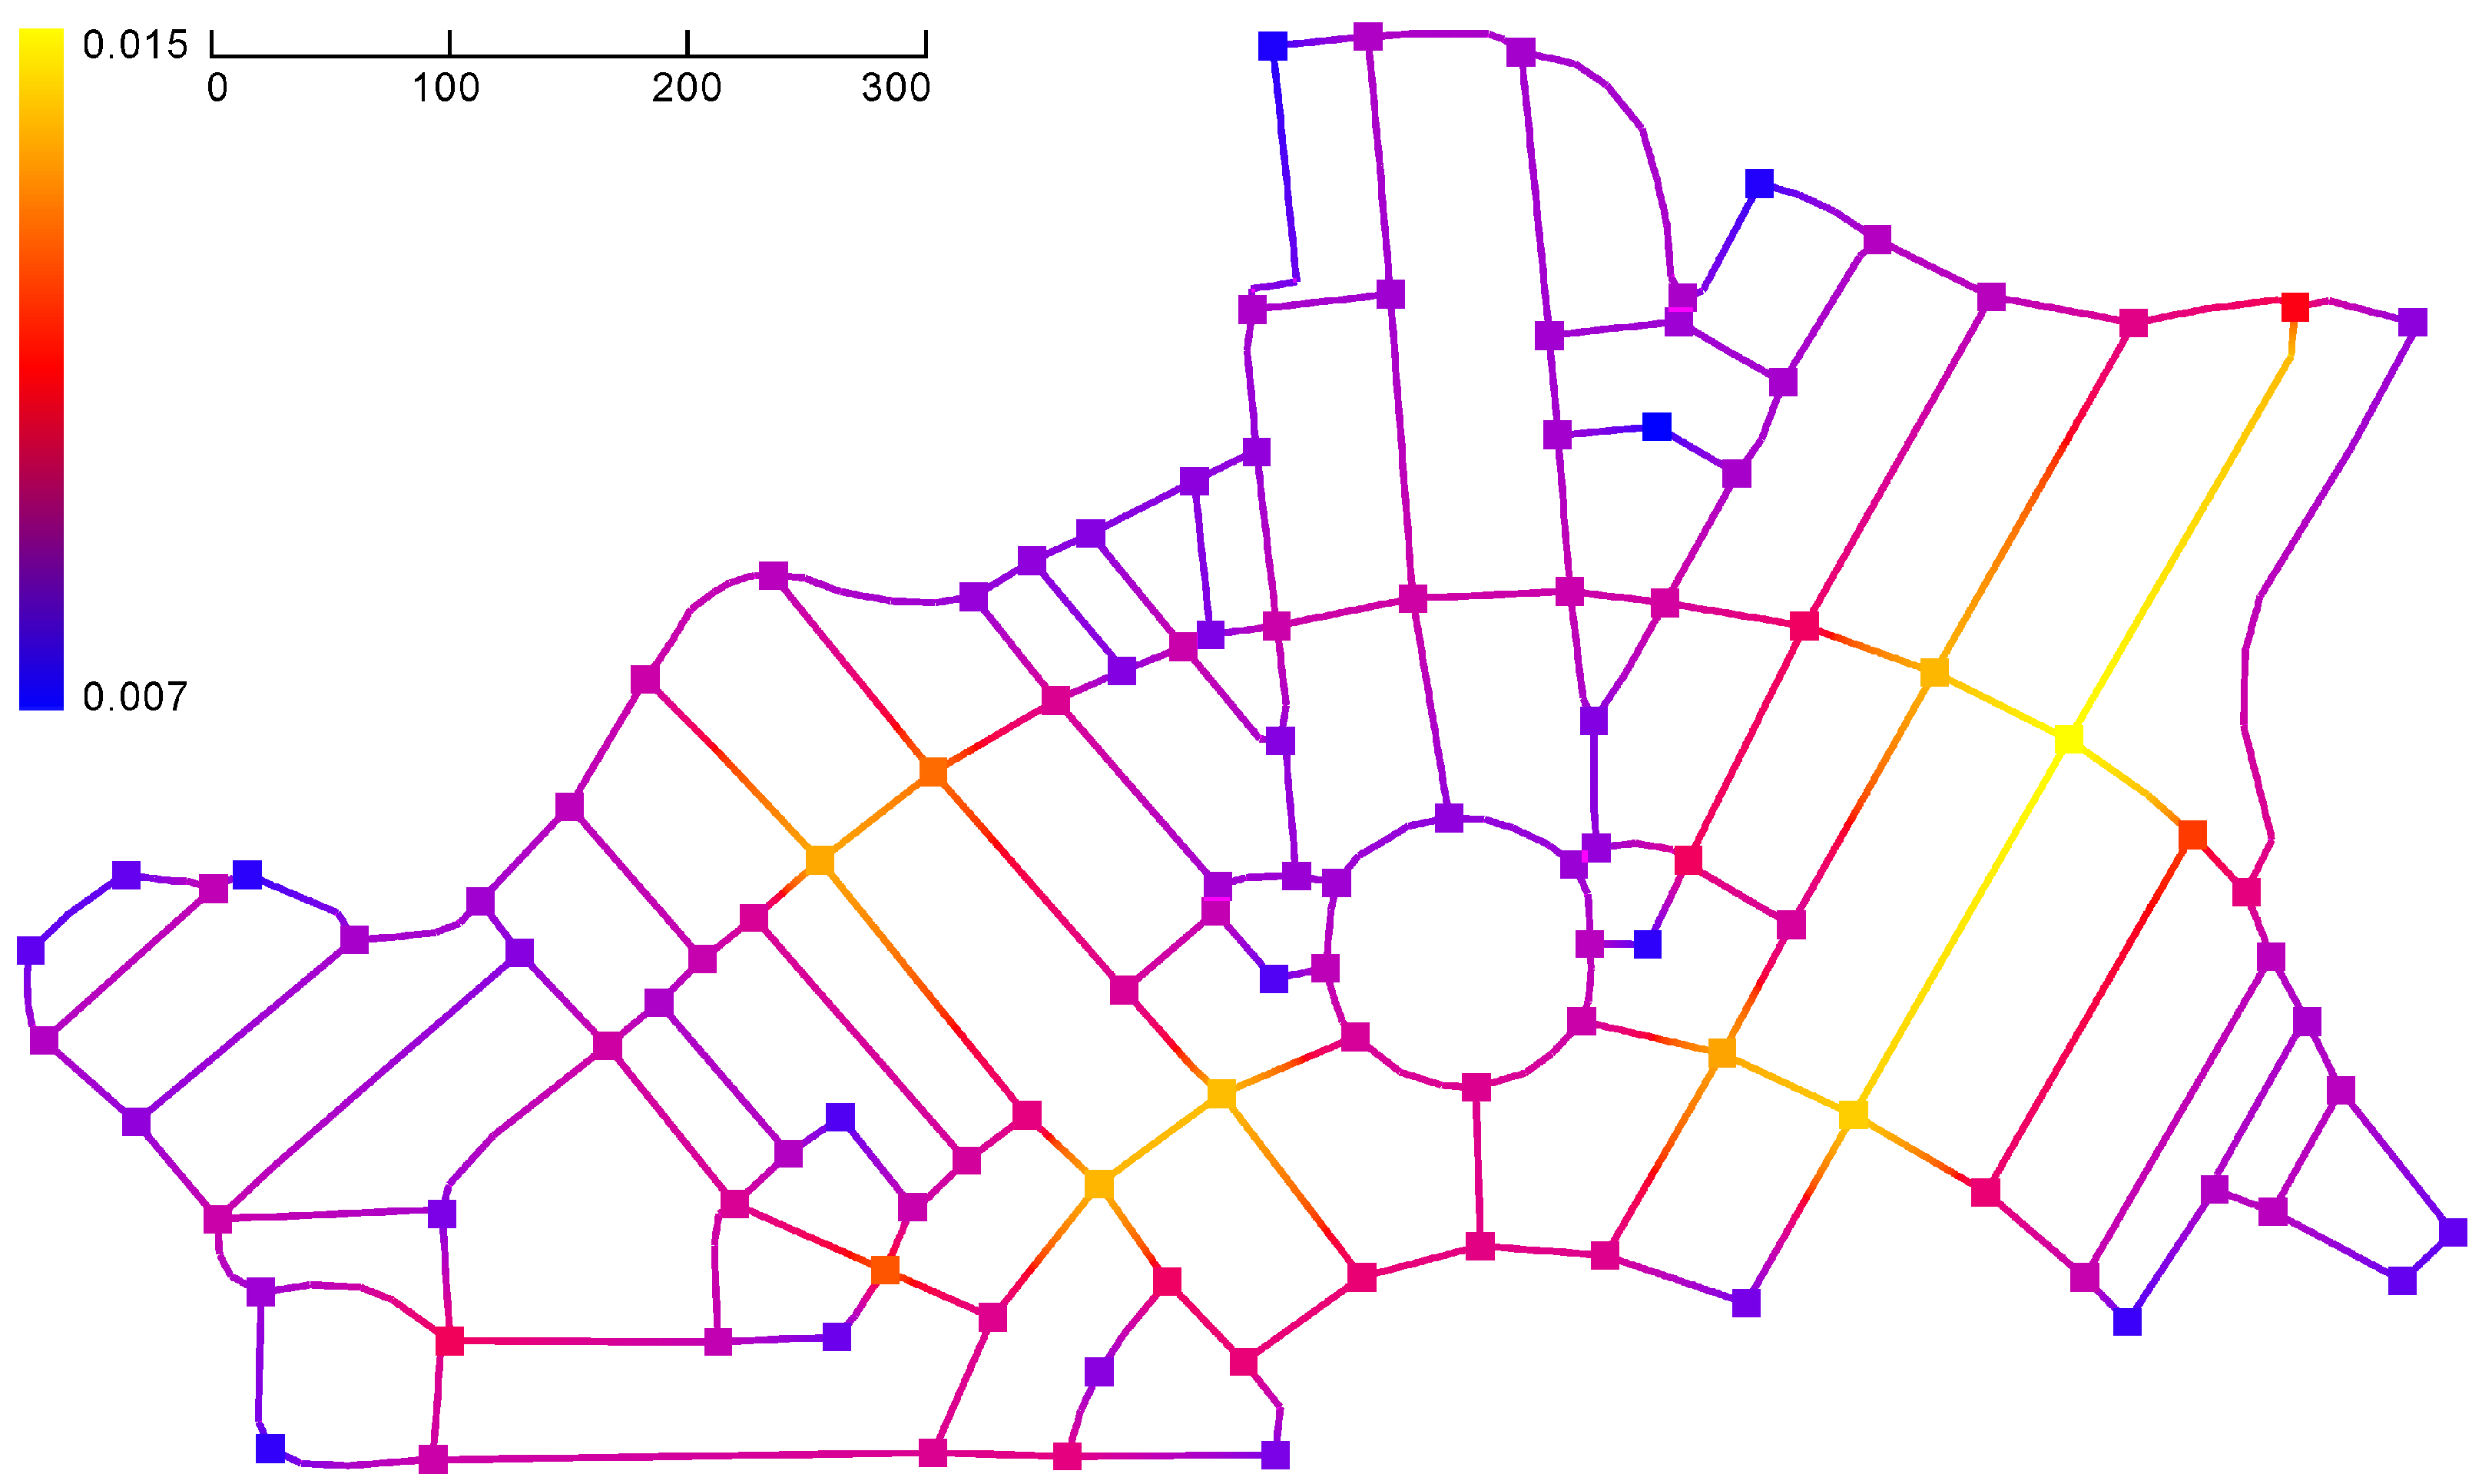
Figure 6 shows us the result of applying APAM to the primal graph of Villaflora, taking as a data set those values related to commercial activity. The results shown in
Figure 6 are in absolute agreement with the characteristics of the data at the individual level; two main arteries are observed with the most central nodes, as well as the southern part of the central roundabout in which the most important nodes are concentrated. This means that it is precisely in those areas where there is a greater influx and movement of people through the streets and public spaces.
The calculation made by the APAM algorithm for the nodes of the network allows us to obtain a value for each node of the primal graph according to its importance within the network. We now consider the possibility of assigning to each building of the urban plot a value related to its importance within the network and with respect to the commercial activity developed in the city. In other words, this value represents the greater or lesser presence of human activity that we can associate to this building according to the global parameters measured by the APAM algorithm. This index no longer has to coincide with the individual values of commercial endowments that each building has in the database. Now what we measure with this index is the presence of human activity.
This individual index of each building can be easily determined as the mean of the APAM values of the vertices of the polygon in which it is located. Naturally, the parcels or buildings that they find inside a polygon have the same index since they share the same vertices or nodes. These indices have been calculated individually for each building and have been called the APAM index. They are in the last column of the
Table 2.
In the same way that we were interested in determining very high and very low values (
positive and
negative, respectively) for the HC index and the number of commercial endowments, we are also interested in determining
positive values for the APAM index. That is, we want to identify the areas or places in the urban network where we can find more human activity. Following the same criteria used in the previous cases, we establish the parameter,
as the limit, considering that bigger values for the APAM index represent high values of the centrality.
4.2. Analysing Heritage from the Centrality Perspective
In the same way that we developed a comparative between the individual values of the patrimonial conservation with the number of commercial endowments present in each building, we can make a similar comparison replacing the value giving the number of endowments with the value that has been obtained after running the APAM algorithm. The idea now is different; are not concerned about the number of commercial endowments, but rather the greater or lesser human activity in the area.
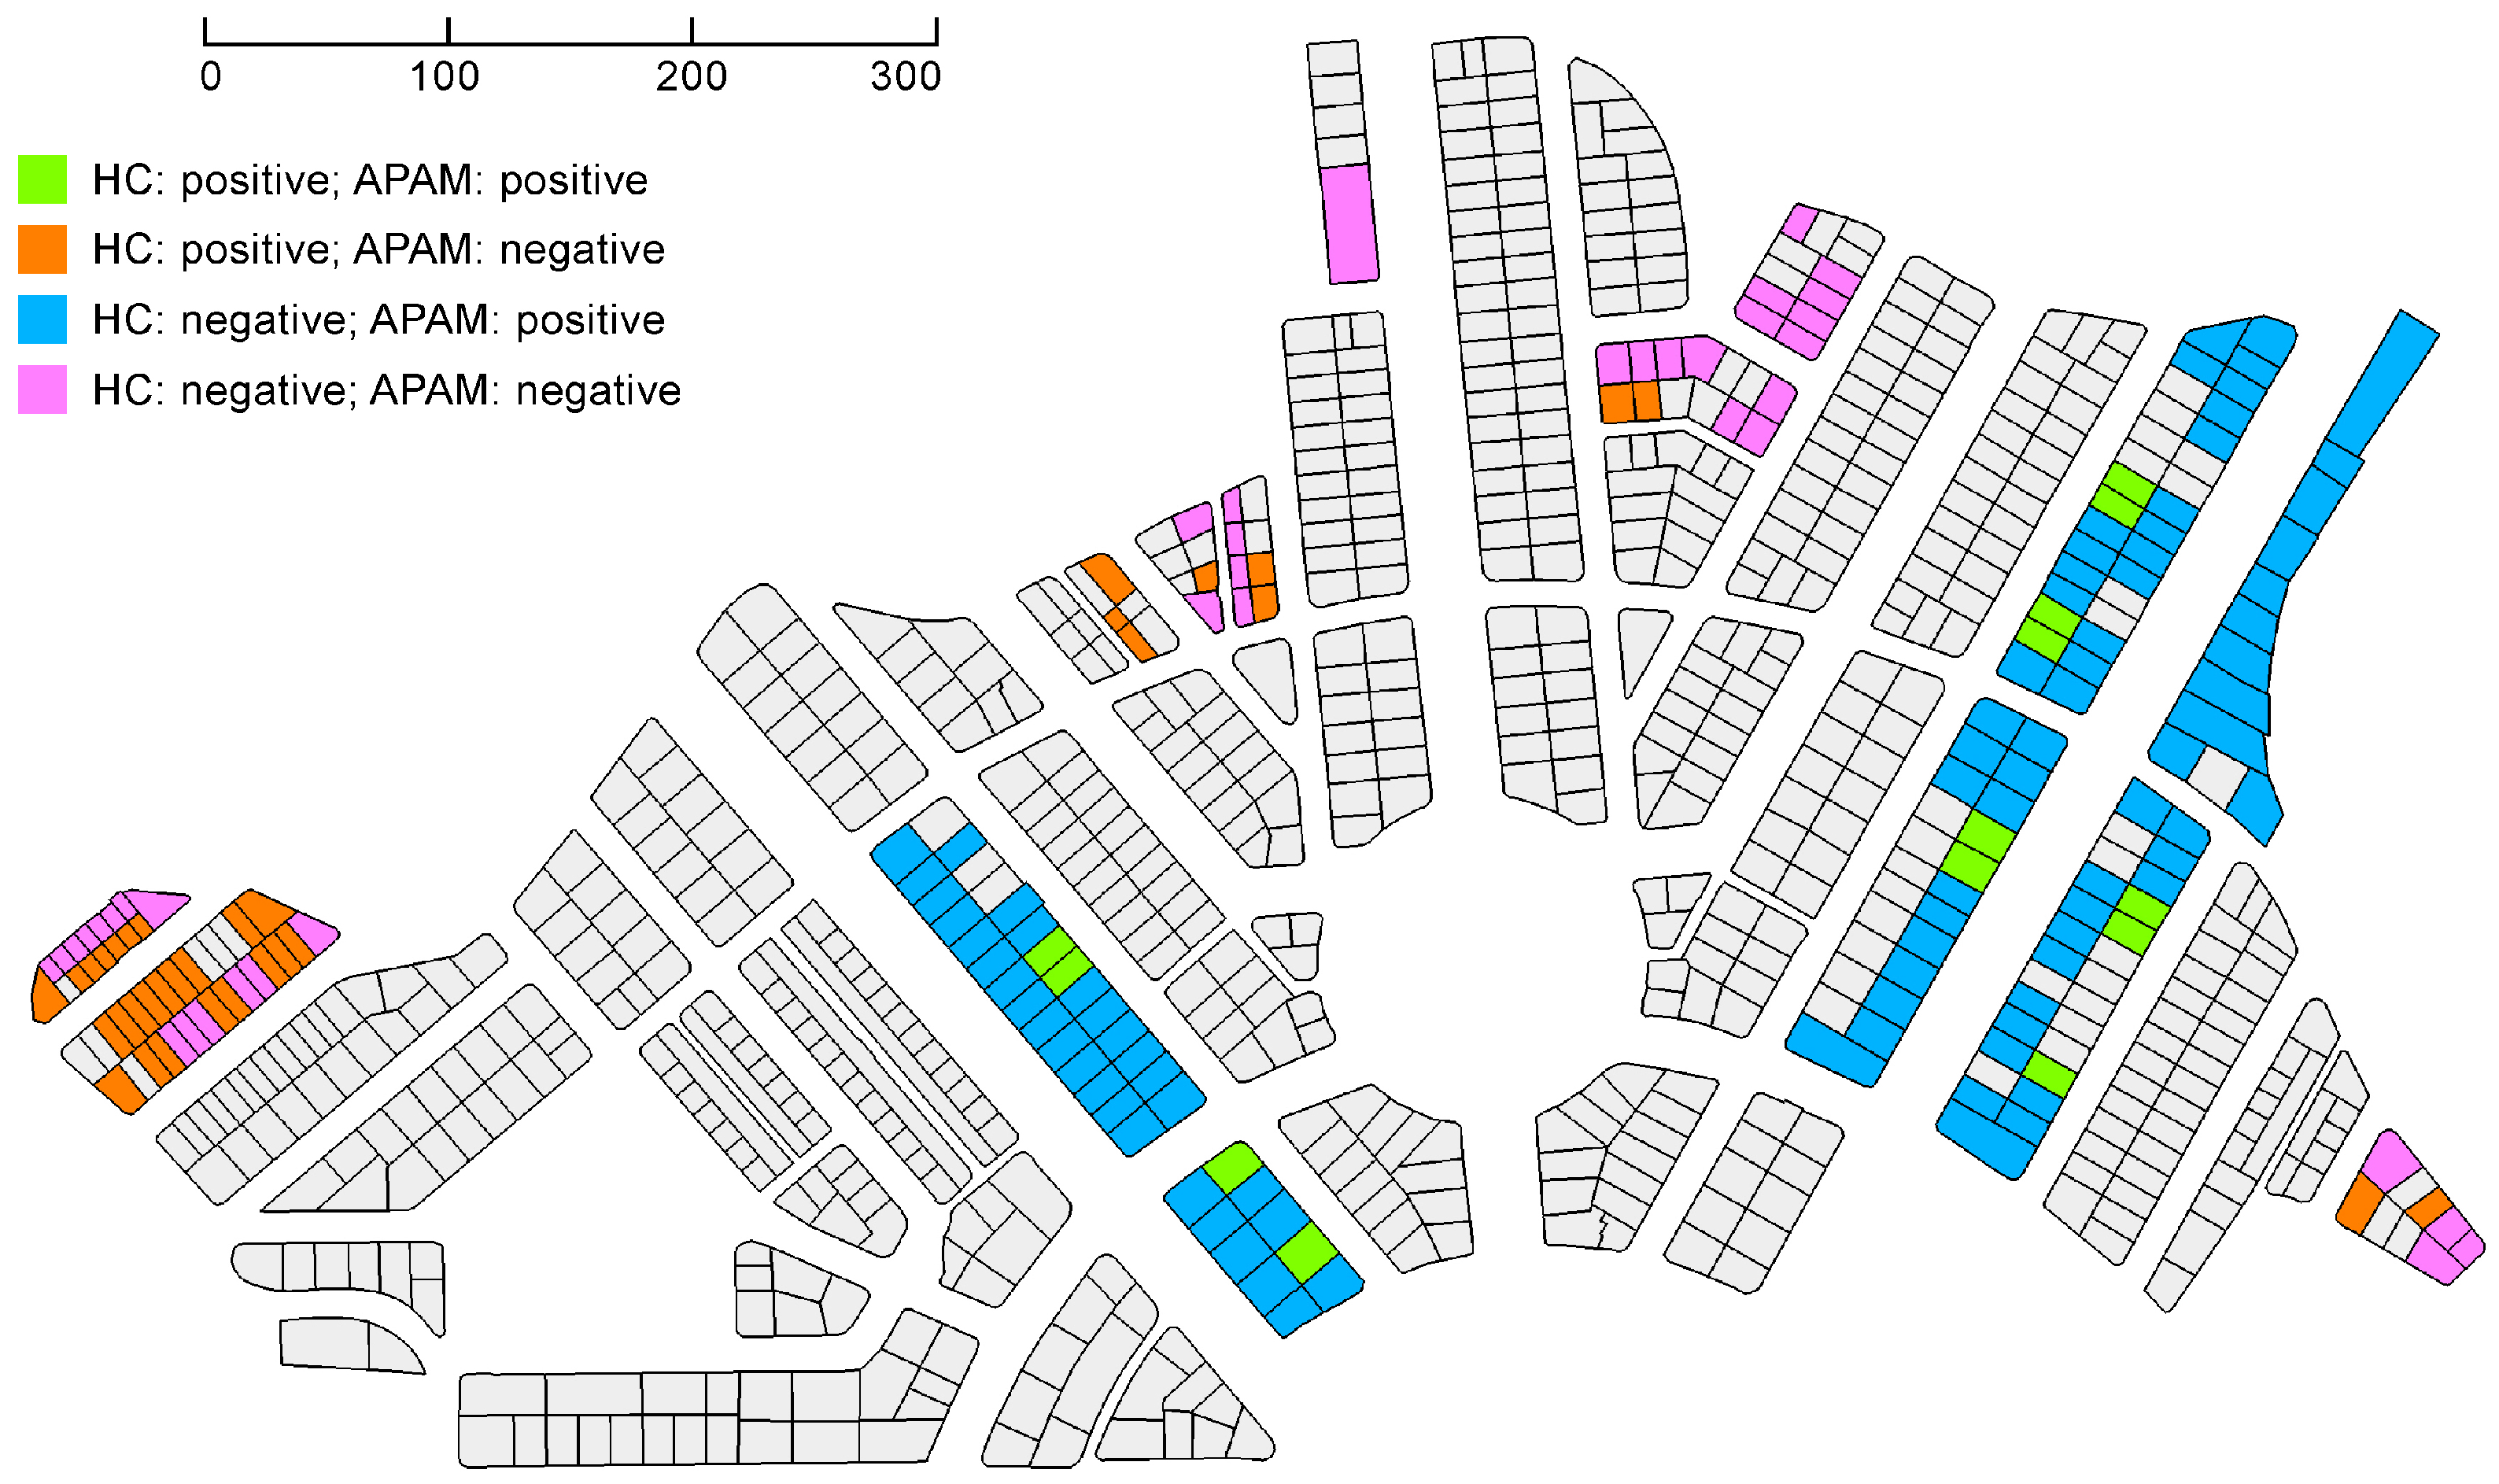
We can consider a set of situations such as those reflected in
Table 3, so that we compare the value HC and APAM of each building, obtaining the following results:
Positive values of HC and APAM indices, respectively. These are places with a high patrimonial conservation index and where there is a high human activity with presence of people due to the commercial activity of the zone. With these characteristics there are 13 elements that have been drawn in the map that appears in
Figure 7, in green colour.
Positive values of HC index and
negative value of the APAM index. These are places with a high patrimonial conservation index and where there is no human presence in the public space. There are a total of 31 elements verifying these conditions. They have been drawn on the map in
Figure 7 in orange colour.
Negative values of HC index and
positive value of the APAM index. These are places with null patrimonial conservation level in an environment with high commercial activity and human presence in this area. The 89 blocks that meet these conditions have been collected and are drawn in the map of
Figure 7 in blue colour.
Negative values of HC and APAM indices, respectively. These are places without patrimonial interest and with very low human activity in the surrounding due to lack of commercial activity. There are a total of 39 buildings with these characteristics and have also been located on the map of
Figure 7 in pink colour.
Note the substantial differences that occur when comparing the maps (see
Figure 5 and
Figure 7). In
Figure 5 the individual data is reflected on a local scale, whereas in
Figure 7 the data of each element is computed not individually, but as part of a network that is characterized by different parameters, where the relevance of each element is given by its own importance and the importance of the elements that are around it.
We also emphasize that the two elements appearing in the map in
Figure 5 in green with positive values for HC and APAM indices do not appear in the map in
Figure 7 as elements with highly positive values. Notice that now there are 13 new elements located precisely in the two main commercial arteries of the neighbourhood, which is absolutely expected, since they are areas of maximum presence of people in the streets.
We also clearly see in the map in
Figure 7 how the buildings or parcels with null HC value and with a high APAM index are all located in the two arteries of the neighbourhood where almost all commercial activity is found with the highest presence of shops and restaurants.
4.3. Taking Decisions to Improve the Heritage Conservation
As discussed in the introduction, the main purpose of this work is the definition of priorities for of the urban restoration plan which aimed to increase the heritage value of the building without altering the commerce layer of the neighbourhood of Villaflora.
The reason for not eliminating commercial endowments in the neighbourhood is obvious: these have been born as a consequence of the needs of the inhabitants of the neighbourhood over time. Therefore, the elimination of some of them would break the existing balance. This leads us to the need to consider restoration of elements that do not have any type of services or commercial endowments, since the restoration itself would lead to the elimination of these endowments as a consequence of the rigid architectural rules on which the whole neighbourhood was designed. In short, what we do not want is to alter the tertiary structure of the neighbourhood.
We also seek as a primary objective to optimize the economic resources available for the restoration of individual elements. This means that we should consider carrying out patrimonial conservation actions on elements that are very exposed to the presence of people in the streets and public spaces. It does not make much sense to make big economic investments in improving individual elements where there are no services or endowments and, therefore, there is no human flow. This idea is directly related to the APAM index calculated in the previous section, which provided us those areas or points of the city where the influx and traffic of people in the neighbourhood was higher.
Consequently, taking into account the study carried out so far, both locally (buildings) and globally (urban network), we prioritize in patrimonial restoration actions those elements that have the following characteristics: a very high value of centrality, which means a very high APAM index and no commercial endowments or services.
However, we must bear in mind that within the elements that have a positive value of APAM index and have no endowments, we must consider another variable, as it is the individual patrimonial conservation index which provides us information about the level of architectonic conservation of the building in relation to its original design. Thus, we can distinguish the following groups of elements with differentiated characteristics:
Elements with a positive APAM index, no commercial endowments and a positive value for the patrimonial conservation.
Elements with a positive APAM index, no commercial endowments and an intermediate value for the patrimonial conservation.
Elements with a positive APAM index, no commercial endowments and a negative value for the patrimonial conservation.
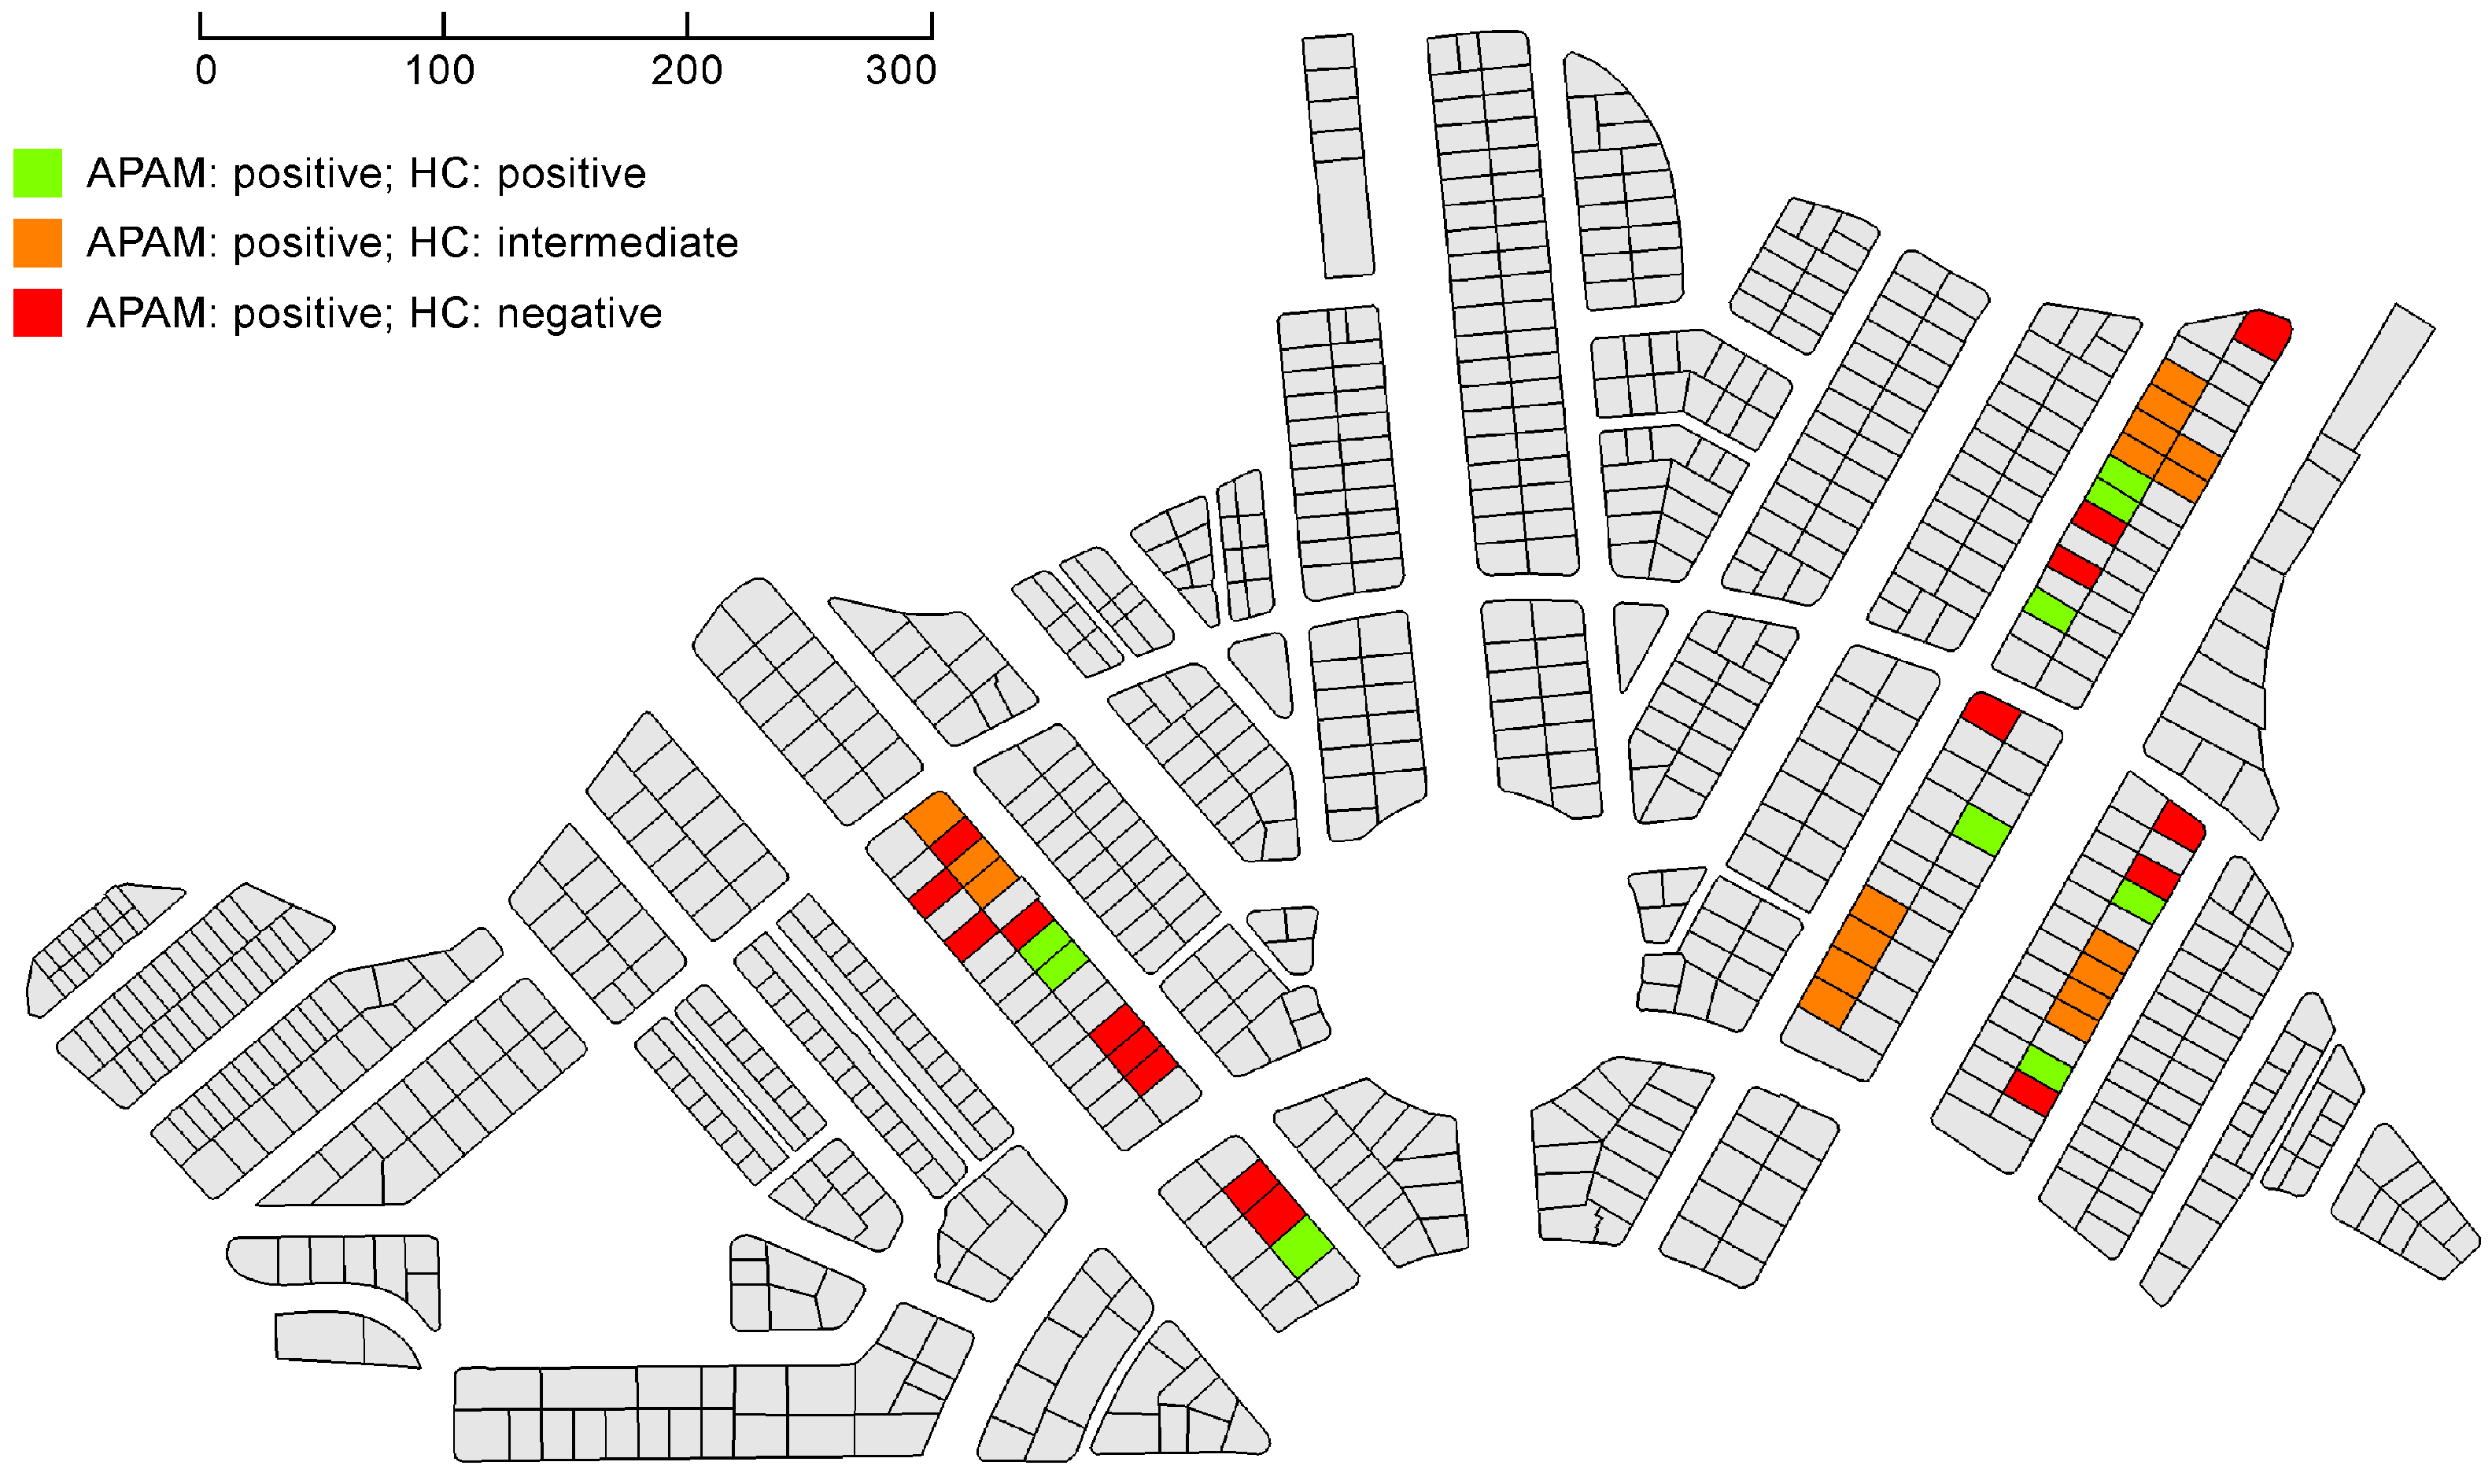
The map reflecting the quantity and geographic location of these three sets of elements is shown in
Figure 8, where the elements with positive, intermediate, and negative
values have been drawn in green, red, and orange, respectively. We refer to elements with intermediate
value as those verifying that
.
If we consider the first set of elements, that is, those that have a very high APAM value, null endowments and services, and a very high patrimonial value, we must point out that these are elements that are not harmful to the image of the city. In addition, their image would improve with very little investment, since the patrimonial conservation degree is already high. To these elements we would assign a priority of low urban performance. We have represented them in green colour.
The second set of elements also has a high APAM value and null endowments, although its patrimonial conservation degree is intermediate. These elements are moderately damaging to the urban image and a moderate investment would be required to significantly enhance their image. This leads us to consider a priority of medium urban performance. These elements appear in the map in orange colour.
Finally, we have the elements with null patrimonial conservation value (red colour in the map), but are located in areas with flows of people due to commercial activity. These are the elements that are most harmful to the image of people walking in the streets and avenues. Here, the economic investment is very important due to a high level of architectural degradation, although the reward in the change of the image is very high. We would assign a priority of high urban performance.
5. Conclusions
The interest and importance in terms of the heritage of Villaflora lie in its urban model, which is still in many senses unique. Therefore, it is important to preserve this urban typology. Over the years, the neighbourhood has undergone major deterioration, especially at the architectural level, with very few buildings that maintain a high degree of conservation regarding the architectural features of the original design.
We aim to improve the heritage aspect of the neighbourhood by defining the priority of actions that maximize the investment in the best possible way. The original design of the neighbourhood, without commercial endowments or services, has caused that the commerce layer has evolved in a natural way and responds to the needs of the people living there. Therefore, we plan to carry out actions on buildings that do not have commercial endowments so as not to break the existing commerce balance.
To achieve the objective, it is necessary to study the neighbourhood from a global perspective, such as through an urban network, where the individual elements are characterized by their local data, but also by their connections and the urban network’s own topology.
We use an algorithm of centrality of urban networks to determine the places or areas of the neighbourhood where human activity is taking place, product of the commercial activity that is developed in the streets and squares. The execution of this algorithm reflects two main arteries of the neighbourhood where the majority of the commercial activity is concentrated and where the majority of the services are found. In these streets we did not find, as expected, a high concentration of buildings with a high level of architectural conservation.
The combination of the results obtained from the descriptive statistics and the application of the APAM algorithm allowed us to classify the patrimonial degradation of the neighbourhood of Villaflora into two groups. The first group consists of buildings located in the main arteries of the neighborhood whose patrimonial value is affected by the aggregation of commercial services. The second one consists of buildings without a specific location whose patrimonial degradation is due to reasons which cannot be attributed to commercial activity. From this classification we can conclude that the buildings belonging to the second group present a scattered location while the buildings of the first group present a specific location, more precisely, they are concentrated in areas of the major pedestrian traffic.
Finally, we have established a set of priorities for the urban restoration plan of the neighbourhood of Villaflora. The developed priorities take into account the amount of the local commerce of each building, the degree of building conservation, and the building exposure to the people flow under the perspective of the global network of the suburb of Villaflora.
As we have seen in this work, the analysis of the city using network theory allows us to obtain the results based on the relationships between the individual data following the topology of the urban layout. These results become impossible to obtain using the continuous map of the city.


