Article

OSM Data Import as an Outreach Tool to Trigger Community Growth? A Case Study in Miami

by
Levente Juhász
* and
Hartwig H. Hochmair
Fort Lauderdale Research and Education Center, University of Florida, Davie, FL 33314, USA
*
Author to whom correspondence should be addressed.
ISPRS Int. J. Geo-Inf. 2018, 7(3), 113; https://doi.org/10.3390/ijgi7030113
Submission received: 1 January 2018 / Revised: 26 February 2018 / Accepted: 12 March 2018 / Published: 15 March 2018
(This article belongs to the Special Issue Geoinformatics in Citizen Science)

Abstract

:
This paper presents the results of a study that explored if and how an OpenStreetMap (OSM) data import task can contribute to OSM community growth. Different outreach techniques were used to introduce a building import task to three targeted OSM user groups. First, existing OSM members were contacted and asked to join the data import project. Second, several local community events were organized with Maptime Miami to engage local mappers in OSM contribution activities. Third, the import task was introduced as an extra credit assignment in two GIS courses at the University of Florida. The paper analyzes spatio-temporal user contributions of these target groups to assess the effectiveness of the different outreach techniques for recruitment and retention of OSM contributors. Results suggest that the type of prospective users that were contacted through our outreach efforts, and their different motivations play a major role in their editing activity. Results also revealed differences in editing patterns between newly recruited users and already established mappers. More specifically, long-term engagement of newly registered OSM mappers did not succeed, whereas already established contributors continued to import and improve data. In general, we found that an OSM data import project can add valuable data to the map, but also that encouraging long-term engagement of new users, whether it be within the academic environment or outside, proved to be challenging.

Graphical Abstract

1. Introduction

OpenStreetMap (OSM) is one of the most prominent Volunteered Geographic Information (VGI) [1] projects to date that implements a collaborative workflow and aims to create a freely available map database of the entire world. VGI users in general, and in the case of OSM specifically, use a set of tools, such as field surveys, on-screen digitizing from aerial imagery, and software to create verifiable information on the ground [2]. The success of OSM is based on a large and active user base that interacts with other contributors, and validates and corrects errors made by them [3]. OSM data is released under the Open Database License (ODbL) (https://opendatacommons.org/licenses/odbl/), which allows to freely copy, distribute, transmit and adapt the data as long as its source is credited. Derivative work needs to be released under the same license. ODbL prohibits the use of copyrighted material (e.g., commercial maps) without explicit permission.
As OSM is a collaborative project, local contributors often organize social events (so-called mapping parties) all over the world. These mapping parties are effective ways for local community building and social collaboration within OSM [4], facilitating face to face meetings among online data contributors. A prime goal of mapping parties is to introduce OSM to new members through hands-on mapping sessions. These sessions can include joint field surveys (e.g., to record house numbers) and data editing tutorials (e.g., to teach how to trace roads from imagery). The effect of mapping parties on user and data growth has been analyzed in various studies. For example, it was observed that during a mapping party, participants tend to edit more than usual [5]. This increased activity is more pronounced for light and medium contributors than for heavy users. This fact could be due to the leading role of heavy users in organizing the mapping parties. Similar behavior was also observed for another collaborative project, Wikipedia, where the most committed users took up organizational roles [6]. Another study describes the organizational and planning aspects of a mapping party held in connection with a geospatial conference [7]. The organizers concluded that, although contributed data was of very high quality, on a wider scale the mapping party had not contributed a very large amount of data. Not all of the data collected during the field survey was uploaded to OSM due to lack of time during the mapping party, incomplete training, and users’ lack of confidence in using OSM tools. Analyzing contribution patterns after a mapping party held in London, 50% of new OSM members were found to stop contributions in the week after the event [8]. Another study estimated that only 64% of new OSM contributors “survive” their first day, after which the estimated survival rate decreases [9], suggesting that the 50% withdrawal rate observed in [8] is not specific to mapping parties. Apart from mapping parties, OSM shows other characteristics of a social project. For example, after the Haiti Earthquake in 2010, a new project called the Humanitarian OpenStreetMap Team (HOT) emerged to generate freely available geographic data in areas affected by natural disasters [10]. As a response to that event, 600 remotely located volunteer mappers built a base layer map for Haiti nearly from scratch. This map was then used in the field by response teams to support residents and save lives. In 2013, HOT evolved into a registered US non-profit organization (https://www.hotosm.org) that aims to create and provide free, up-to-date maps for relief organizations responding to natural and man-made crises. Their mapping efforts primarily use an online tool called the Tasking Manager (TM).
Besides field surveys and on-screen digitizing from remote sensing imagery, OSM also allows the integration of other datasets available under licenses compatible with ODbL (e.g., CC0 (https://creativecommons.org/share-your-work/public-domain/cc0/)). This usually triggers subsequent user contributions and edits of imported data. Permissible datasets include public domain data that is often published by government agencies. Importing data through automatic means is one of the most controversial topics within the OSM community as this method is different from the core approach of OSM, which is to manually add verifiable data to the map [11]. However, the general consensus is that imports, if carefully executed, add value to OSM. The OSM community discusses import related issues in a dedicated channel (https://lists.openstreetmap.org/listinfo/imports). Numerous OSM data import tasks have been executed so far [12], and some studies have evaluated the effect of data imports on OSM data quality and user participation. For example, one study described the effects of US Census TIGER/Line import on data completeness [13]. Challenges associated with the matching of tags between imported data sources and the OSM tagging structure are discussed in [14]. In [15], the authors discuss inconsistencies in the level of detail within VGI data and found examples of OSM data imports that cause this problem. For example, buildings imported from the French cadastral sources can overlap with land parcels imported from the European CORINE Land Cover dataset because of the different scale of those data sources. OSM data imports can be beneficial for the data donor as well. For example, the Department of National Resources of Canada allowed the OSM community to import their national dataset with the hope that the community would further improve it. These improvements (upon approval) could then be fed back into the national dataset [16].
The research presented in this study describes experiences with a local OSM data import in Miami-Dade County, Florida. More specifically, it evaluates how effective a building import task is at engaging different targeted community groups in OSM participation. The import task of this study integrates a public domain dataset (building footprints) in Miami-Dade County. Targeted communities were asked to join the import project and to manually edit OSM data in the hope that this mapping experience would trigger community growth. These targeted groups were (1) existing members of the OSM community contacted through the OSM site; (2) users reached by Maptime Miami, a local chapter of an initiative built around open knowledge and geospatial technologies; and (3) students enrolled in two courses of the Geomatics Program at the University of Florida who were introduced to the import task as part of their course work. The success of VGI projects generally depends on participants, therefore understanding their motivation is key for the success of such projects [17]. The motivation of VGI users can be divided into two distinct categories, namely extrinsic motivation, that is, related to outside factors (e.g., receiving compensation) and intrinsic motivation that originates directly from the user (e.g., gaining new knowledge or recreation) [18]. Our different outreach techniques were expected to reach users with both motivation categories.
OSM building imports are useful to improve the quality of the OSM building layer, which is generally still low compared to that of road network data. The completeness of buildings mapped in OSM relative to official data from national mapping and cadastral agencies has been examined in several studies. For example, it was found that completeness levels vary widely between different cities, e.g., between 12% and 48% for selected parts of Germany [19], and between 30% and 75% for three cities in the United Kingdom [20]. Completeness evaluation and positional accuracy assessment was also performed for Milan, Italy [21], which revealed a decreasing trend in completeness from the city center towards the outskirts. Positional accuracy was found to be similar across the city, probably due the constant accuracy of the underlying imagery from which buildings were traced. It is worth mentioning, however, that calculated completeness values differ strongly between applied methods. One study measured building completeness for a medium-sized German city with two common unit-based methods and found that the count ratio method underestimates building completeness, whereas the area ratio method overestimates it [22]. Another study examined completeness, semantic accuracy, position accuracy, and shape accuracy of OSM building footprints for Munich, Germany, revealing a high completeness and semantic accuracy, whereas in terms of shape some architectural details are missing [23]. In [24], the authors proposed an intrinsic approach for OSM quality assessment. As part of OSM data analysis for Madrid (Spain), San Francisco (USA) and Yaoundé (Cameroon), they found that buildings imported through a bulk upload lack attribute completeness when compared to areas without bulk upload.

2. Materials and Methods

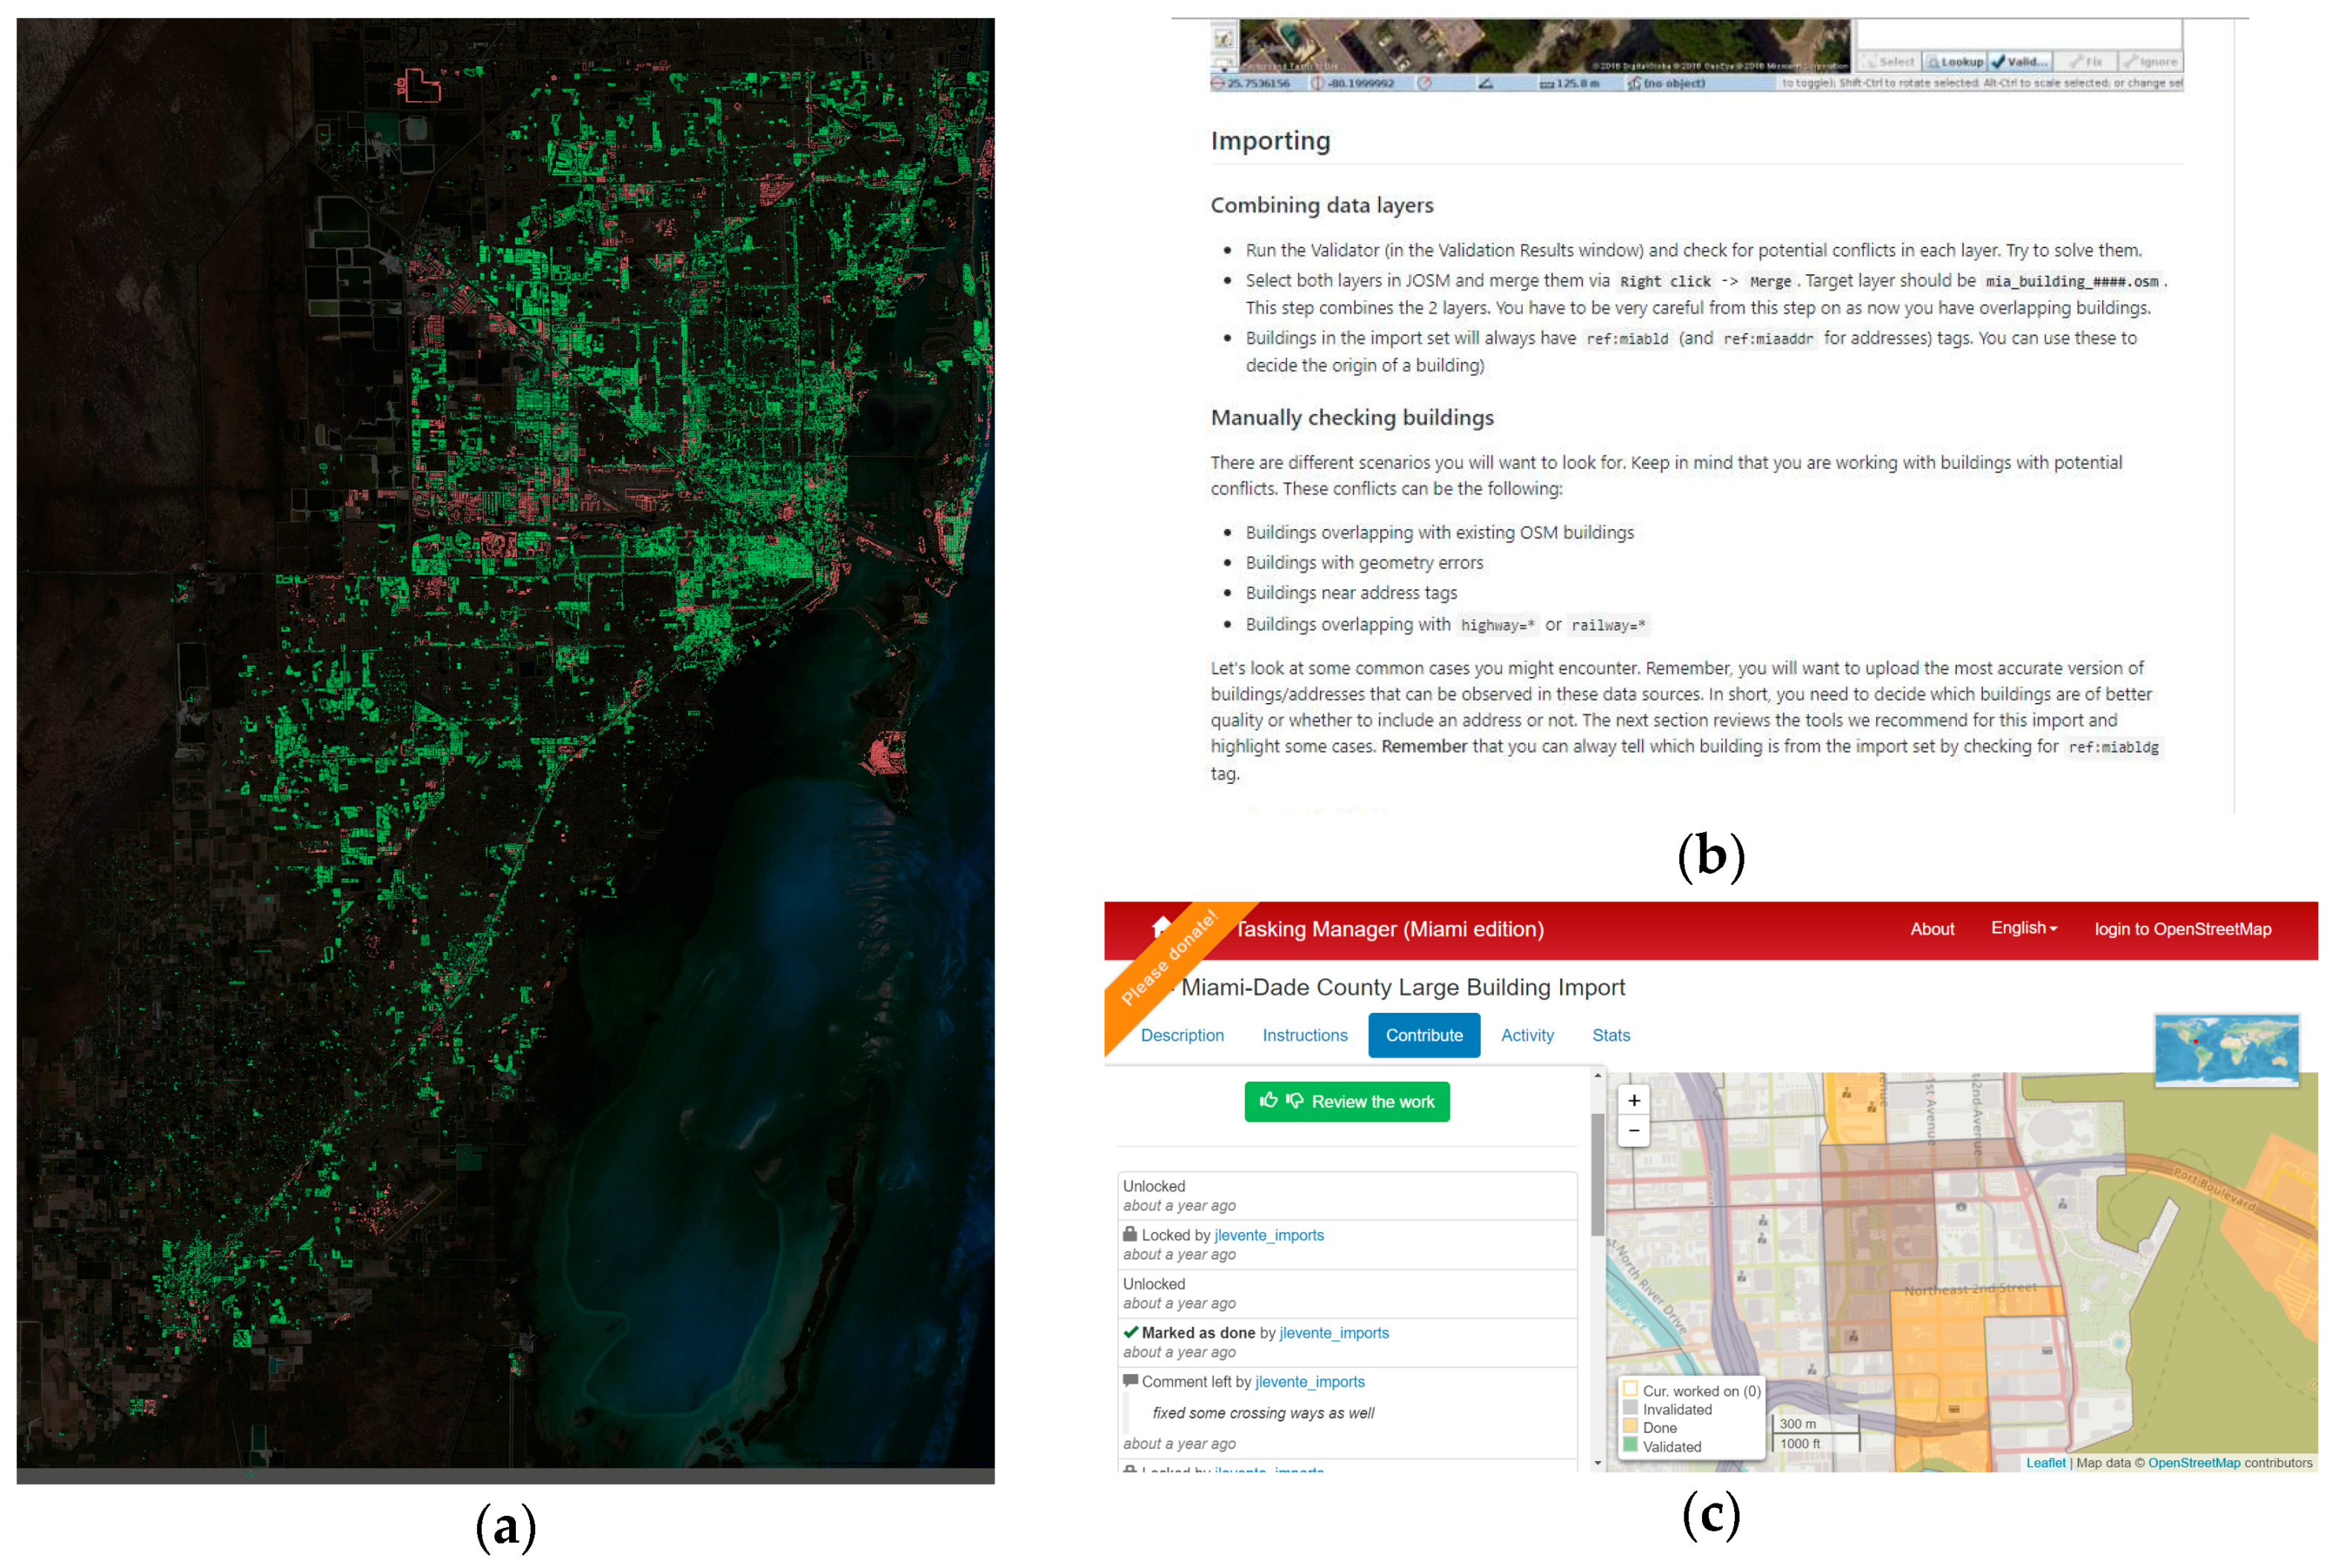
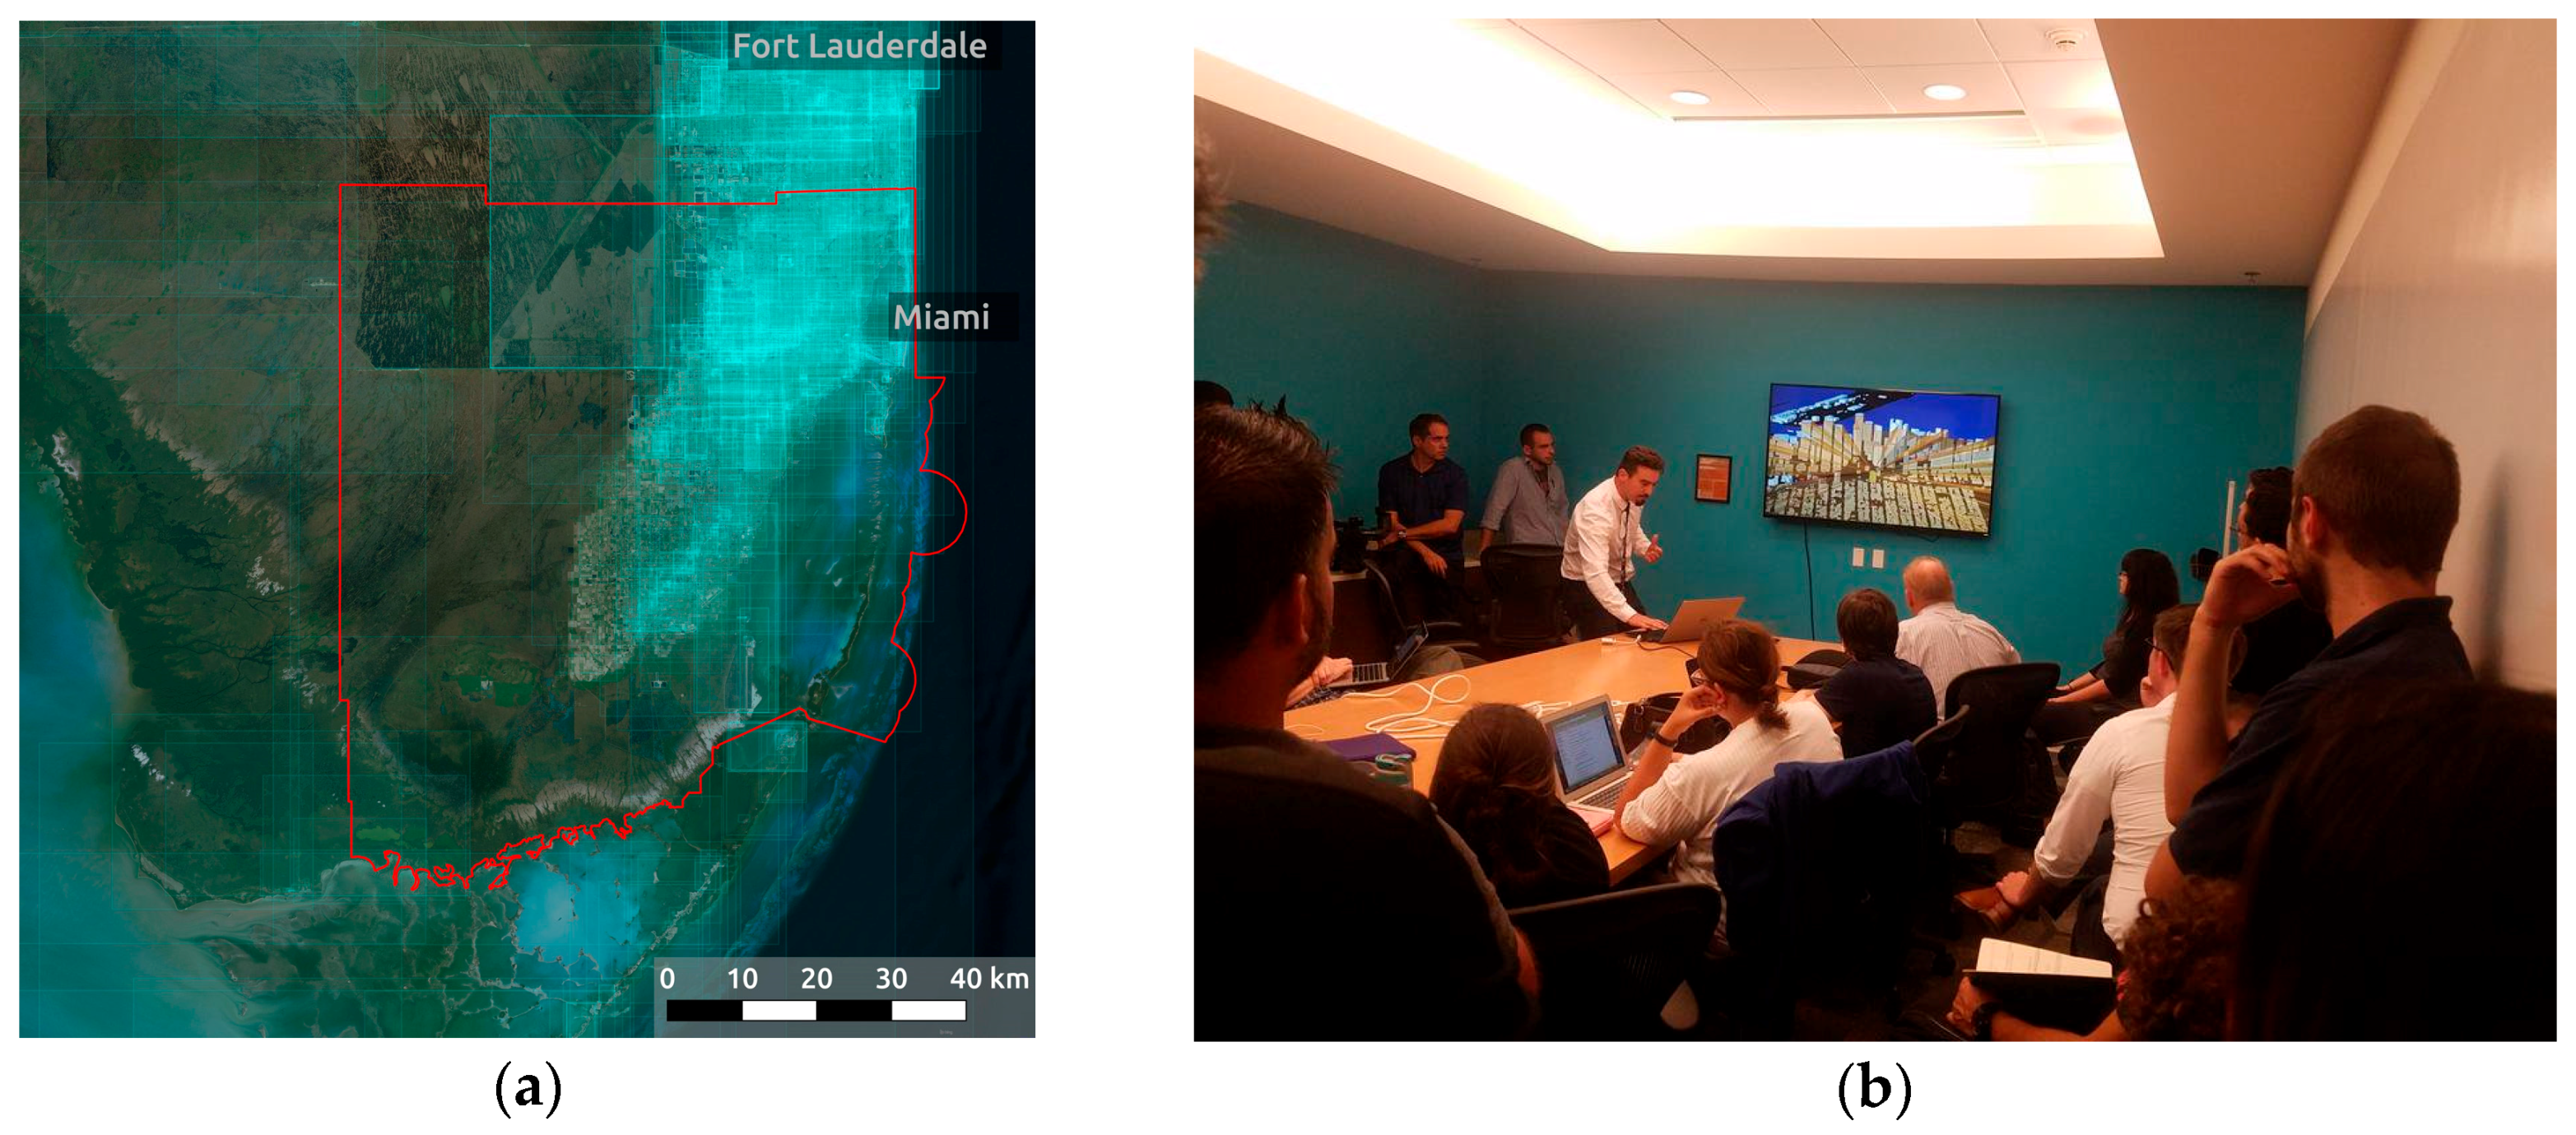
2.1. Miami-Dade Large Building Import

On 16 May 2016, Maptime Miami (https://www.meetup.com/Maptime-Miami/) proposed an OSM data import of Large Building Footprints (http://gis.mdc.opendata.arcgis.com/datasets/1e87b925717747c7b59979caa7779039_1) from Miami-Dade County’s Open Data repository to kick-start Miami’s OSM, which lags behind other major cities in the United States both in terms of contributor numbers and data completeness. To ensure that a data import is not harmful for OSM, such projects need to adhere to strict guidelines, which include local community buy-in, announcements on different OSM channels (Wiki, mailing lists) and the ability for the community to review and test both the data to be imported and the methods used during the import process. These guidelines were followed for this project and the import was discussed within the US OSM community.
Other building imports, such as the ones in Los Angeles and New York City rely exclusively on the OSM community and therefore require many active contributors to manually review and import buildings. Due to the low number of OSM contributors in South Florida and the lack of existing buildings in OSM, the first author of this paper, as part of Maptime Miami, implemented a hybrid approach that consisted of an automated bulk upload of buildings and a manual community review of remaining buildings where needed. For this purpose, a software tool (https://github.com/jlevente/MiamiOSM-buildings) was developed and open sourced to pre-process the building dataset, to perform quality checks and to separate the dataset into two parts. Hence, one part of the dataset was uploaded automatically, and the other one was set aside for the community to review. The latter set contained buildings with detected conflicts (overlap with existing OSM buildings, road or railroad features, geometry errors, etc.) whereas the rest of the dataset (i.e., buildings with no geometry issues and no overlaps) was uploaded automatically from a dedicated import account (https://www.openstreetmap.org/user/MiamiBuildingsImport) with upload scripts. A description of the workflow and the software tool is available at https://github.com/jlevente/MiamiOSM-buildings. In Figure 1a, the features in green represent buildings in the automatic bucket (i.e., no conflicts) whereas those in red represent buildings for the community review process. The dataset consists of 95,536 large buildings that are defined as structures in commercial, industrial or other non-residential areas. Additionally, structures larger than approximately 750 m2 (e.g., townhomes, condominiums) are also classified as large buildings. The dataset was derived from high resolution aerial imagery by both automatic photogrammetric methods and manual digitization and is available for download unprojected (in geographic coordinates). After visual inspection, the building layer was found to be of high quality. Buildings also contained building height information in feet, which was converted to meters and also imported along with the geometry. Additionally, an address dataset was spatially merged with the buildings to provide accurate street level information along with the buildings. A total of 84,348 buildings were uploaded automatically (green features in Figure 1a), which left nearly 11,000 buildings for the manual review process (red features in Figure 1a). All import buildings were tagged with the “ref:miabldg” (http://wiki.openstreetmap.org/wiki/Key:ref:miabldg) key for easy identification.
The remaining 11,000 buildings were split by US Census Block Groups to provide a manageable number of buildings for manual review. A custom workflow was developed and explained in a detailed tutorial (Figure 1b). The workflow uses the JOSM editor since it can load multiple datasets and since it provides superior tools for data editing compared to the Web based iD editor [25]. The tutorial used screenshots, explanations and specific instructions detailing how to execute the import steps. The tutorial was tested by multiple members of Maptime Miami before releasing it. To administer the progress and to provide a central interface for users, a dedicated TM instance was set up at http://tasks.osm.jlevente.com. A screenshot of the interface is shown in Figure 1c. On this site, contributors can log in with their OSM username and then select a block group within Miami-Dade County to work on. Once a user selects an area, it will be locked for an hour to avoid concurrent edits. This lock is visible on the website for other users currently browsing the site. The TM instance contains hyperlinks to the tutorial and provides an easy way to load data into JOSM. For example, by pressing a button in TM, JOSM on the user’s computer loads data from the selected area and zooms to the extent of the import area. The general steps of the import workflow are as follows:
  • User logs on to TM
  • User selects and locks an area to work on
  • In TM, user loads current OSM data coverage into JOSM
  • In TM, user loads import building dataset into JOSM
  • In JOSM, user merges the import and OSM datasets into one single layer
  • In JOSM, user works on resolving conflicts and refers to the tutorial if needed
  • In JOSM, user runs the validation tool to ensure all data is correct and ready for upload
  • User uploads data to OSM
  • User marks TM task as “done” or unlocks it if task is unfinished

2.2. Outreach Techniques and Target Audiences

To reach a sufficient number of contributors for the project, different user groups were targeted and introduced to the import. This also allows to explore the willingness of different user groups to participate in this import and provides a better understanding of the impact different user groups have on OSM.

2.2.1. Students

The import project was introduced at two courses in the Geomatics Program at the University of Florida, which are GIS Programming (Fall 2016, graduate level) and GIS Analysis (Spring 2017, undergraduate and graduate level). Participation in this study was voluntary and students received extra credit to complete this task. Both courses are offered in an online format and therefore students were located in different parts of Florida. In both courses a lecture was dedicated to the import where students were given an overview of the import task and received information about the available resources (tutorial, TM, etc.). A hands-on editing session that illustrated the import process in detail was demonstrated live and also recorded to make it available for review later on. To earn full extra credit, students were asked to import at least 50 buildings.
Before the submission deadline, seven students needed assistance and troubleshooting associated with the assignment. Encountered problems included technical issues with JOSM and fixing errors in the submitted OSM edits. The early edits of a few students contained some building outlines traced from aerial imagery, but without the “building = yes” tags. These students did not initially realize the importance of tags and were asked to fix their edits so that the added buildings would be recognized as buildings in OSM. In one instance, some changesets that only contained overlapping (hence incorrect) buildings needed to be manually reverted. This was due to skipped steps 6 and 7 described in Section 2.1 from a student’s side.

2.2.2. Existing OSM Community and Local Community

On 1 August 2016, the 50 most active mappers in Miami-Dade County between March 2015 and August 2016 were contacted through the OSM messaging system. A contributor’s activity was measured by the total number of edits (including geometry changes, feature additions, modifications and deletions) observed in all changesets of the user whose centroids were located in Miami. Since messaging involved navigating to these user’s profiles, automatic filtering of bots was not necessary. Two of the original top 50 accounts were removed from the list as one was found to be a bot, and the other one was the first author’s OSM profile. These users were replaced with OSM users originally in the 51st and 52nd place. Figure 2a shows the spatial distribution of OSM changesets (cyan transparent rectangles) around Miami-Dade County within this period, where the most active areas correspond well to the Miami metropolitan area. An introductory message was sent to the top 50 users, informing them about the import and listing all the resources (chat room, code repository, tutorials, meetups). It was assumed that the most active local mappers could be reached with this method.
In addition to messaging OSM users, Maptime Miami organized meetings on the Meetup platform almost every month. These meetups were announced in different social media platforms (Facebook, Twitter, Meetup) and promoted by Maptime Miami and other Miami based community organizations, such as Code for Miami and Venture Café Miami. These meetups were organized around the import process. Most of the meetups included an interactive session where organizers helped new users getting started with OSM and importing buildings (Figure 2b). Between 1 August and 31 December 2016, a total of four meetups were dedicated to the import project.
Since OSM implements a free tagging system there is no control over how users indicate that their edit is related to the Miami-Dade Large Building Import project (if they indicate it at all). To identify users who directly interacted with this import process, we gathered usernames from three different sources. First, all users were extracted from the TM instance. Since this is the interface where users can download the import dataset, the users who contribute to this project according to the provided tutorial, will show up in this list. Another possible use case is when a user, instead of going through the import process, finds out about the project through editing OSM and chooses to improve the buildings that have been imported so far. These users tend to be more experienced and can be identified by analyzing a history dump and extracting all new features that match the “ref:miabldg” tag. There is another way for users to contribute to the import task without showing up in the TM or in the history dump. Namely, users could indicate the import process on the changeset level without marking individual features [25,26]. Our TM instance was configured so that the JOSM editor automatically populated the changeset comment field with the #miabuildings hashtag, which makes it possible to query these edits later.
For the remainder of the paper, users described in this section (contacted through direct messages, gathered from TM or history and changeset dumps) are referred to as community users. Besides the two targeted groups (students and community users), there will also be other OSM members that are not directly involved with the outreach activities described before, but who instead edit already imported buildings, e.g., by adding more attributes or refining building outlines.

3. Results

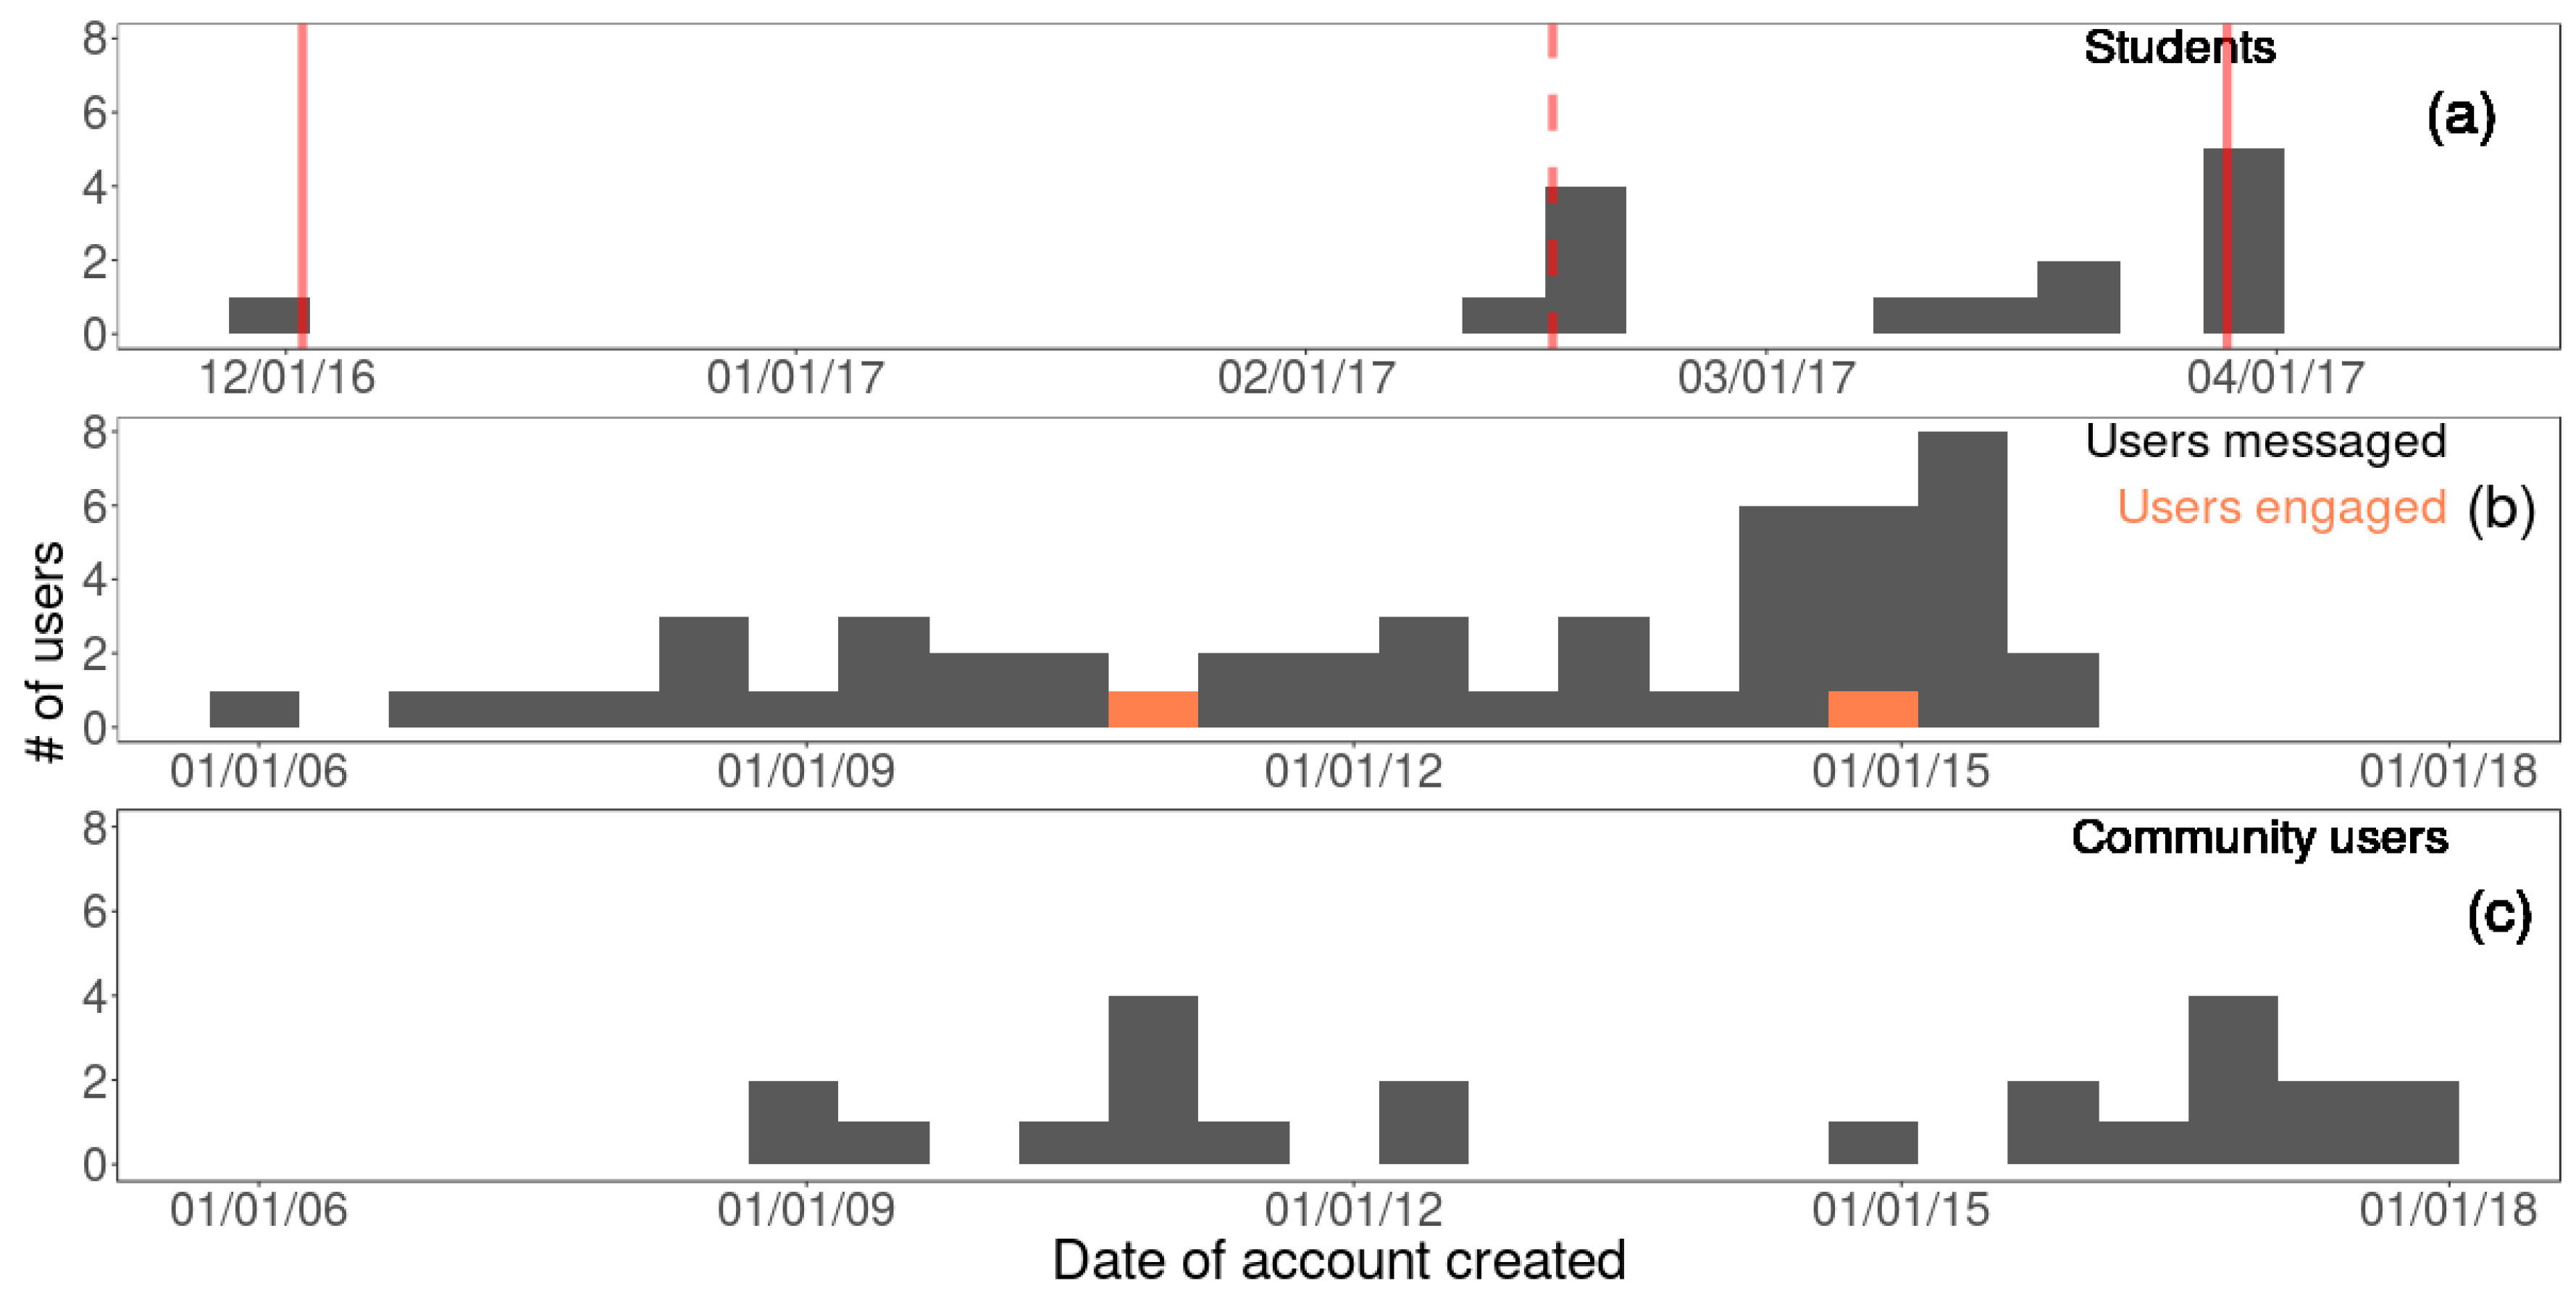
3.1. Participation Numbers

3.1.1. Students

Overall, 16 student submissions were received (Fall 2016, GIS Programming: 1/15 graduate students; Spring 2017, GIS Analysis: 14/26 graduate students, 1/3 undergraduate students). 15 of these 16 students received extra credit offered for the assignment. The difference in student activity between both courses might be due to the different nature of these classes as a programming class is rather technical and the focus is not on data sources and data analysis. The participation rate in the GIS Analysis class of 51% is a little higher than participation rates in extra credit activities in other studies with participation rates below 40% [27,28]. This might be due to the online nature of the extra credit opportunity, which did not involve commuting to campus. The grade distribution for GIS Analysis suggests that students from the whole grade spectrum participated in the bonus assignment. More specifically, 7/14 (50%) A-students, 7/13 (54%) B-students, 1/1 D-student, and 0/1 F-students participated, showing that the motivation across top (A) students, good (B) students, and poor (D, F) students to participate in the extra credit assignment is similar. This is somewhat different from earlier studies that showed that significantly more students who earned below the average and average elected not to participate in extra credit tasks [28]. A grade improvement due to the completed bonus assignment can be observed for seven out of the 15 participating students in this class.
The impact students had on OSM through participation in this extra credit assignment can be measured by the number of edits they made. On average, each student added 104 buildings (median: 87), although the assignment asked for a minimum of 50 buildings only. This resulted in a total of 1554 buildings in OSM through students. The median and mean number of buildings edited did not vary significantly between student performance (i.e., A through F letter grades considered before extra credit), which indicates that the work performance and motivation among all students who participated is comparable, independent of their overall course performance.
Contributions to the OSM mapping platform are in general, predominantly made by male users [29,30]. As opposed to this, the extra credit assignment did not reflect this usual gender bias. More specifically, the GIS Analysis course had a total enrollment of 29 students (31.0% female), with 15 students participating in the extra credit assignment. Among these 15 participants, 40.0% were female, which is higher than the percent of female enrollment in the course (31.0%). However, the difference is not statistically significant, suggesting that, if a reward by grade is involved, male and female students are similarly motivated to participate in OSM contributions. This is in-line with previous findings from an earlier study about volunteer research participation among 193 undergraduate students [28], which suggests that the difference between participation rates of women and men may not be meaningful.

3.1.2. Community Users

The 50 most active OSM contributors between March 2015 and August 2016 in Miami-Dade County who were contacted via direct messages submitted between 1 and 594 changesets (mean: 92, median: 27) in Miami-Dade County during this period. The number of map edits per user ranged between 518 and 62,555 (mean: 4052, median: 1324). The OSM sign up date of these 50 users was extracted from the main API. A histogram shows that the majority of these top 50 users are long standing OSM members who registered to the project between December 2006 and April 2015 (Figure 3b). Only seven out to the 50 users responded to the initial query. Four mappers provided supportive feedback but were not able to help out due to busy schedules or unfamiliarity with the area. The three remaining users did contribute to the project, although their user names did not show in the TM. This means that their contributions lean towards quality checks and follow up fixes. In fact, these users opened several OSM notes, provided changeset discussions and fixed several data issues in the proximity of import buildings. These contributions are also valuable parts of data imports.
Thirteen of the “top 50” mappers are Mapbox (https://www.mapbox.com/) employees working for the Data team, which operates worldwide on creating new data, improving existing features and fixing errors reported by OSM users. The fact that these users appear in the “top contributors in Miami” list indicates a small and generally inactive OSM user base in Miami-Dade County.
The TM had 30 users listed, though not all of them contributed to the project through data edits. By analyzing the history dump after 1 August 2016, 34 users were identified to add original import buildings to OSM. 18 of these users also submitted changesets with the #miabuildings import hashtag and showed up in either the TM or in the list of users extracted from the history dump. After combining users that used the #miabuildings import hashtag with those that did not, and excluding student accounts and the official import account that was used to automatically upload buildings, 32 unique users were left that were considered community users as their interaction with the import process was first-hand. These 32 community users are responsible for around the same number of buildings (1547) as the student group (1554). However, 9 of the community users (identified through TM) did not add any import buildings to OSM, but rather ran some other edits. This shows that the initial interest in an import project (expressed by signing up for the TM with their OSM credentials) does not always result in actual contributions. The remaining 23 contributors added 67 import buildings to the project on average, which implies a smaller import rate than for students (see Table 1). A two-sample t-test showed that there was a significant difference in the log transformed number of imported buildings between community users (M = 2.6, SD = 1.9) and students (M = 4.5, SD = 0.6): t(27.24) = 4.41, p < 0.001. These results suggest that different user engagement techniques have a different effect on user activity. In this case, the higher activity of students could have been driven by their desire for a higher grade. As opposed to this, community users would not experience any short-term gain (e.g., monetary or prestige) from the import task. This means that although in the short run students handled more imports per user, in the longer run it can be expected that community users provide more data than non-community users, since social mappers were previously found to contribute continuously [5]. Although that latter study analyzed mapping parties, we consider them the same as our categorization of community mappers as they are working towards a defined goal (import buildings) and also meet face to face at social events occasionally.
The import task became an organic part of OSM where data were further edited by the community. Such edits include further refinements of building geometries and tag additions (e.g., the name of a hotel). A total of 177 OSM users that were otherwise not related to the import process have interacted with import buildings so far. This is similar to OSM users interacting with the pedestrian network imported as part of the TIGER dataset [13] or excessively editing ways after a local import [31]. Such observed follow-up edits demonstrate the additional benefits of data imports.

3.1.3. New and Existing Users

Besides our user distinction that is based on recruitment efforts (students, community), users can also be classified across these categories into new and established OSM users. Accordingly, it is possible to analyze if data imports engage new and existing users differently. Analyzing the OSM editing history of users contributing to data imports or edits, it was found that 23 users came for the first time in contact with OSM during the import task and could therefore be classified as new users. This includes all 15 participating students and eight newly registered users through community outreach (Section 2.2.2). All of the remaining users created their accounts at least three months before the actual import task began. The first two columns of Table 1 show that students were significantly more active in the import task than those new users who were recruited through community events, which is supported by a two-sample t-test on the log transformed number of buildings: t(8.45) = 6.5; p < 0.001. These different levels of activity can likely be attributed to different motivations between those two groups of newly engaged OSM users (see Section 3.1.2). To refine the activity analysis of community users, and specifically to identify the effect of the import task on the new OSM members we compare the activity of new community users to existing community users. A two-sample t-test conducted on the log transformed number of imported buildings between existing users (N = 15, M = 3.3, SD = 2.0) and new users gained through community outreach (N = 8, M = 1.4, SD = 1.3) shows that existing members add significantly more buildings (t(20.01) = −2.73, p = 0.01) than new community users. Furthermore, the effect of motivation on import activity remains significant (t(8.45) = 6.5, p < 0.001) when compared between students (extrinsic) and existing community members (intrinsic).
These results show that data imports, at least in the short run, benefit most from (a) existing community members and (b) highly motivated users who gain some economic benefit (such as extra credit which can lead to better job placement chances through better grades). As opposed to this, new community users without an obvious economic benefit tend to generate less data. A stable base of OSM community contributors is, however, necessary to keep OSM data up-to-date in the long run. Therefore, although only a small number of building imports were observed for new community members, a data import task like the one analyzed in this study, will help to retain the critical mass of OSM community users that is needed to sustain data quality in the long run.

3.2. Mapping Behavior

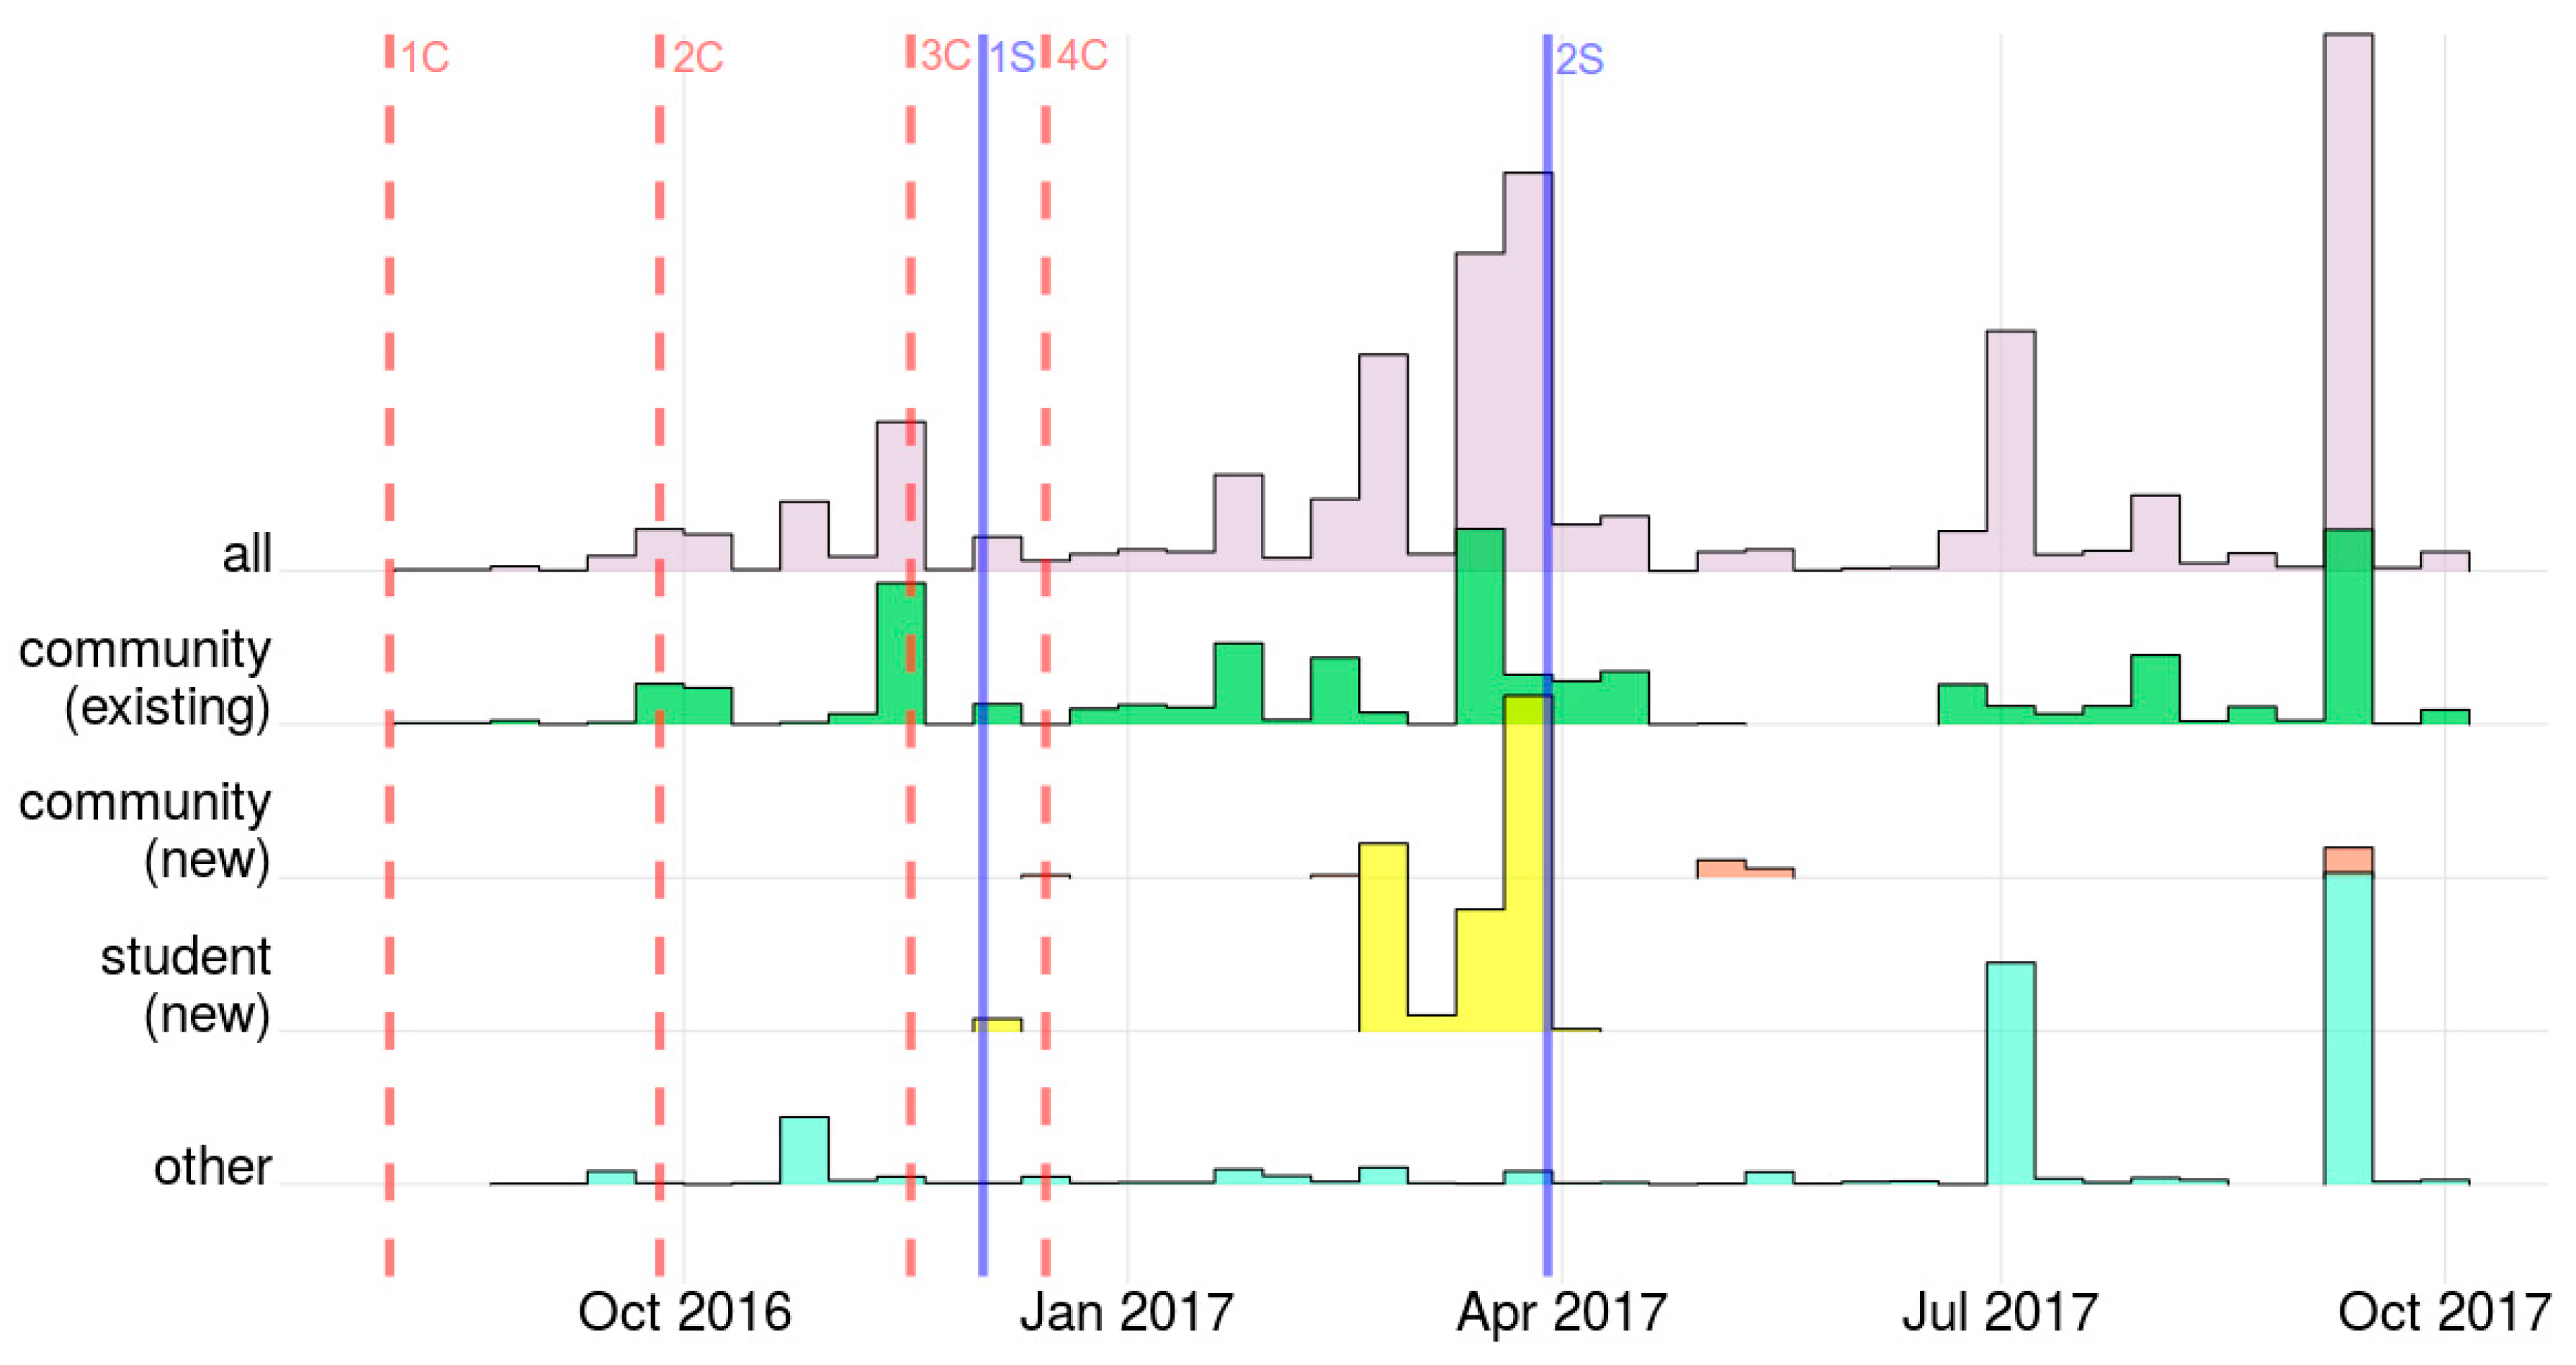
3.2.1. Temporal Aspects

Figure 3 shows the histograms of OSM sign up dates which were extracted from the main API for students (Figure 3a), for the top 50 users contacted via direct messages (Figure 3b) and for community users (engaged through Maptime Miami; Figure 3c). Student sign up dates follow closely specific academic events during the semester, such as the introduction of the extra credit assignment in a lecture (15 February 2017, shown with a vertical dashed line) or assignment deadlines. The due dates (solid vertical lines) for GIS Programming were 2 December 2016 and 29 March 2017 for GIS Analysis, respectively. Most of the contacted users from the “top 50-editing list” have prior mapping experience, which is reflected by the fact that the majority of these users signed up more than a year before the import project. Community users who interacted with the import dataset first-handed consist of both new and experienced mappers. 40% of the community user group signed up to the OSM platform after the first discussions in May 2016 and 35% of them after August 2016, when the tasks were made available to the public, resembling the group of new mappers. This suggests that increased social media activity and local outreach can be an effective method in recruiting new contributors.
To explore how different users interacted with the import task over time, their activities were plotted based on interactions with import buildings (addition, edits) between August 2016 and October 2017. A time-series visualization has been used in other studies to assess trends, seasonal and random components involved in OSM contribution activities [32]. Figure 4 shows the overall import related activity and the activity of different user groups over time. The activity of community users and students is directly associated with the import, as these groups were involved in the addition of original buildings. On the other hand, the group “other” is only indirectly associated with the import. Their activities include tag additions and follow up edits. The overall activity, which is the sum of the group activities, shows distinct peaks. This suggests that the import did not happen at a constant pace but that different events triggered increased activity over shorter periods of time. More specifically, dashed vertical lines in Figure 4 represent community related events (meetups), while solid vertical lines show due dates of home assignments for students. These events are listed in a chronological order in Table 2.
Community users (23 individuals) learned about the import project through various channels, such as meetups, message reach out, social media, OSM Wiki pages, and mailing list communications. Fifteen of these users are existing members and can therefore be classified as experienced mappers. There is an association between the amount of early contributions of this group (Fall 2016) and the community events held at that time (Figure 4). Event 1C did not trigger any significant activity, as it was a technical presentation along with general information about the proposed import process. As opposed to this, discernable import activities before the first hands on mapping session (2C) can be attributed to organizers testing the import process and to a few early users who followed the online conversations in the chat group. An even stronger increase in community activity can be observed during and after hands on mapping sessions 2C and 3C. A similar event (4C), however, did not have such an effect due to low participation before the holidays. It is also evident from the plot that the community user group remained active even when no more community events were organized. The motivation of these users can be classified as intrinsic as they were offered no monetary or other benefits or gains, yet they participated in the import and contributed to its success. This group mainly consists of locals. The continuing interest of these users in the building import can be explained by the pride of place concept [33], which describes the desire of the mapper to see one’s own home town or region (Miami-Dade County in this context) on the map. Their behavior is also similar to previous findings about loyal OSM users who regularly check and update their “pet locations”, which is the area where they edit most frequently [34].
Newly recruited community users show a different activity pattern. Surprisingly, no editing activity for these users was recorded until event 4C, even though three of the eight new users in this category signed up before that date. We attribute this to the fact that OSM, especially a data import task, may seem challenging and overwhelming at first. Our community events with high participation numbers did not seem to provide a good platform for engaging new contributors. In contrast, event 4C was not well attended, which provided an opportunity to dedicate more time and attention to newcomers who were present. Three users with no prior OSM experience attended this event, out of which one user (a local) successfully imported several buildings and added even more at later dates during that month. The remaining two users at this meetup were not interested in the import, but rather in general discussions about mapping. Figure 4 also shows that the long-term engagement of new community members is only sporadic. Unlike the existing community group, their contributions are ad hoc and can be traced back to social media posts or other events (e.g., HOT mapping), but then quickly vanish. This is similar to what has been revealed for mapping parties through user interviews, where users cannot be engaged for longer periods [34].
Students in the GIS Programming (one student) and GIS Analysis (15 students) classes focused their activities around the due dates of their home assignments (1S and 2S on Figure 4). Even though students were introduced to this extra credit task months before the due date (on 28 October 2016 for 1S and 15 February 2017 for 2S), their activity peaked right before the deadline and then quickly declined. This suggests that students were highly active before the deadlines but otherwise spent very little time on the task. This is in line with common practice of college students postponing assigned tasks until the day or night before due dates [35,36]. The figure also reveals that none of the students remained active after submitting their assignments, which indicates that our import task was not successful in attracting students to become permanent OSM contributors. Only two out of 16 students who completed the extra credit assignment have some ties to the project area in Miami-Dade, either by working or having grown up in Miami, based on class introductions posted by students. This general lack of ties to the study area for almost all students may explain the absence of motivation for students to voluntarily continue with OSM mapping activities after completing their assignment. Instead, students appear to be motivated primarily by the prospect of improved course grades, which can be classified as an extrinsic motivator [18].
The activities of the remaining user group (“other”) in Figure 4 are not associated with either community events or student assignment deadlines. These contributions tend to follow a random pattern and could be a result of people spending their vacation in Miami and editing the map in the meantime or a regular OSM editor making some edits. The first distinct activity peak of other users in July 2017 is caused by one user (again, otherwise not related to the data import) adding building level information (“building:levels”) to 342 of the import buildings. The other peak in September 2017 is related to HOT Hurricane Irma relief, which drew a large amount of editing activity to Miami. Interestingly, this humanitarian mapping project increased the building import activity of the community user group (both new and existing members) as well (September 2017 activity of the community group in Figure 4). This effect can be attributed to those local members of the community group that contribute to HOT projects as well. The fact that the Hurricane Irma mapping event overlapped with the import area gave these users an opportunity to further map their home region.

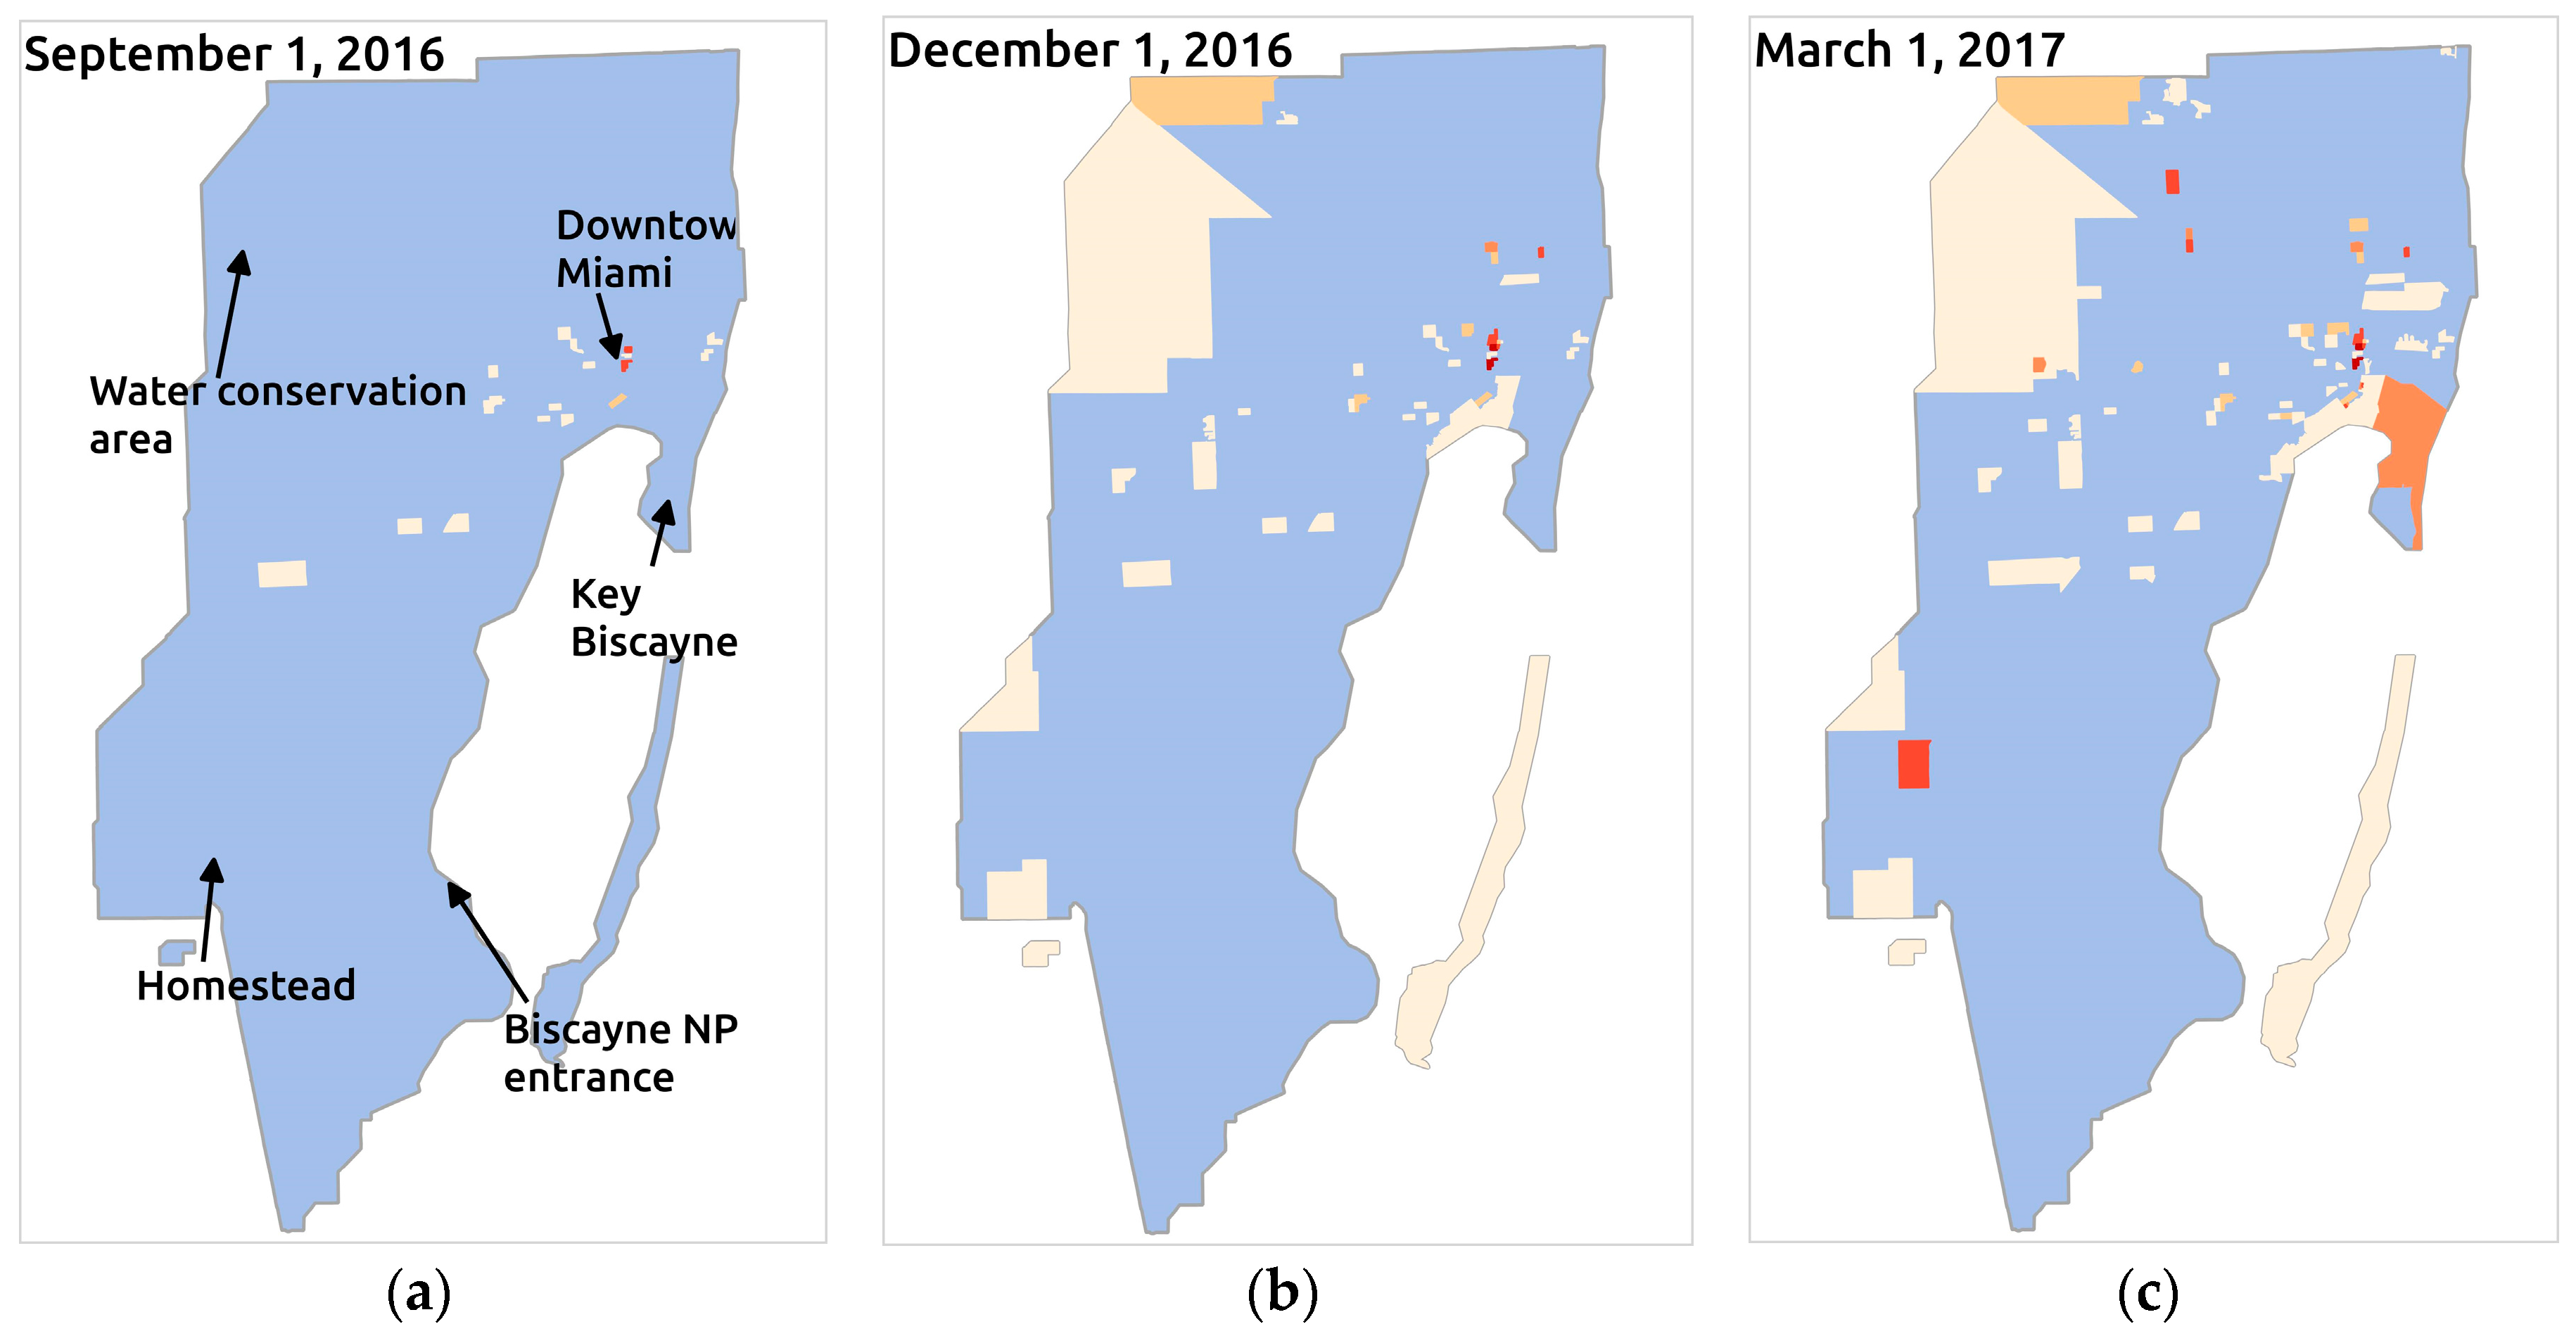
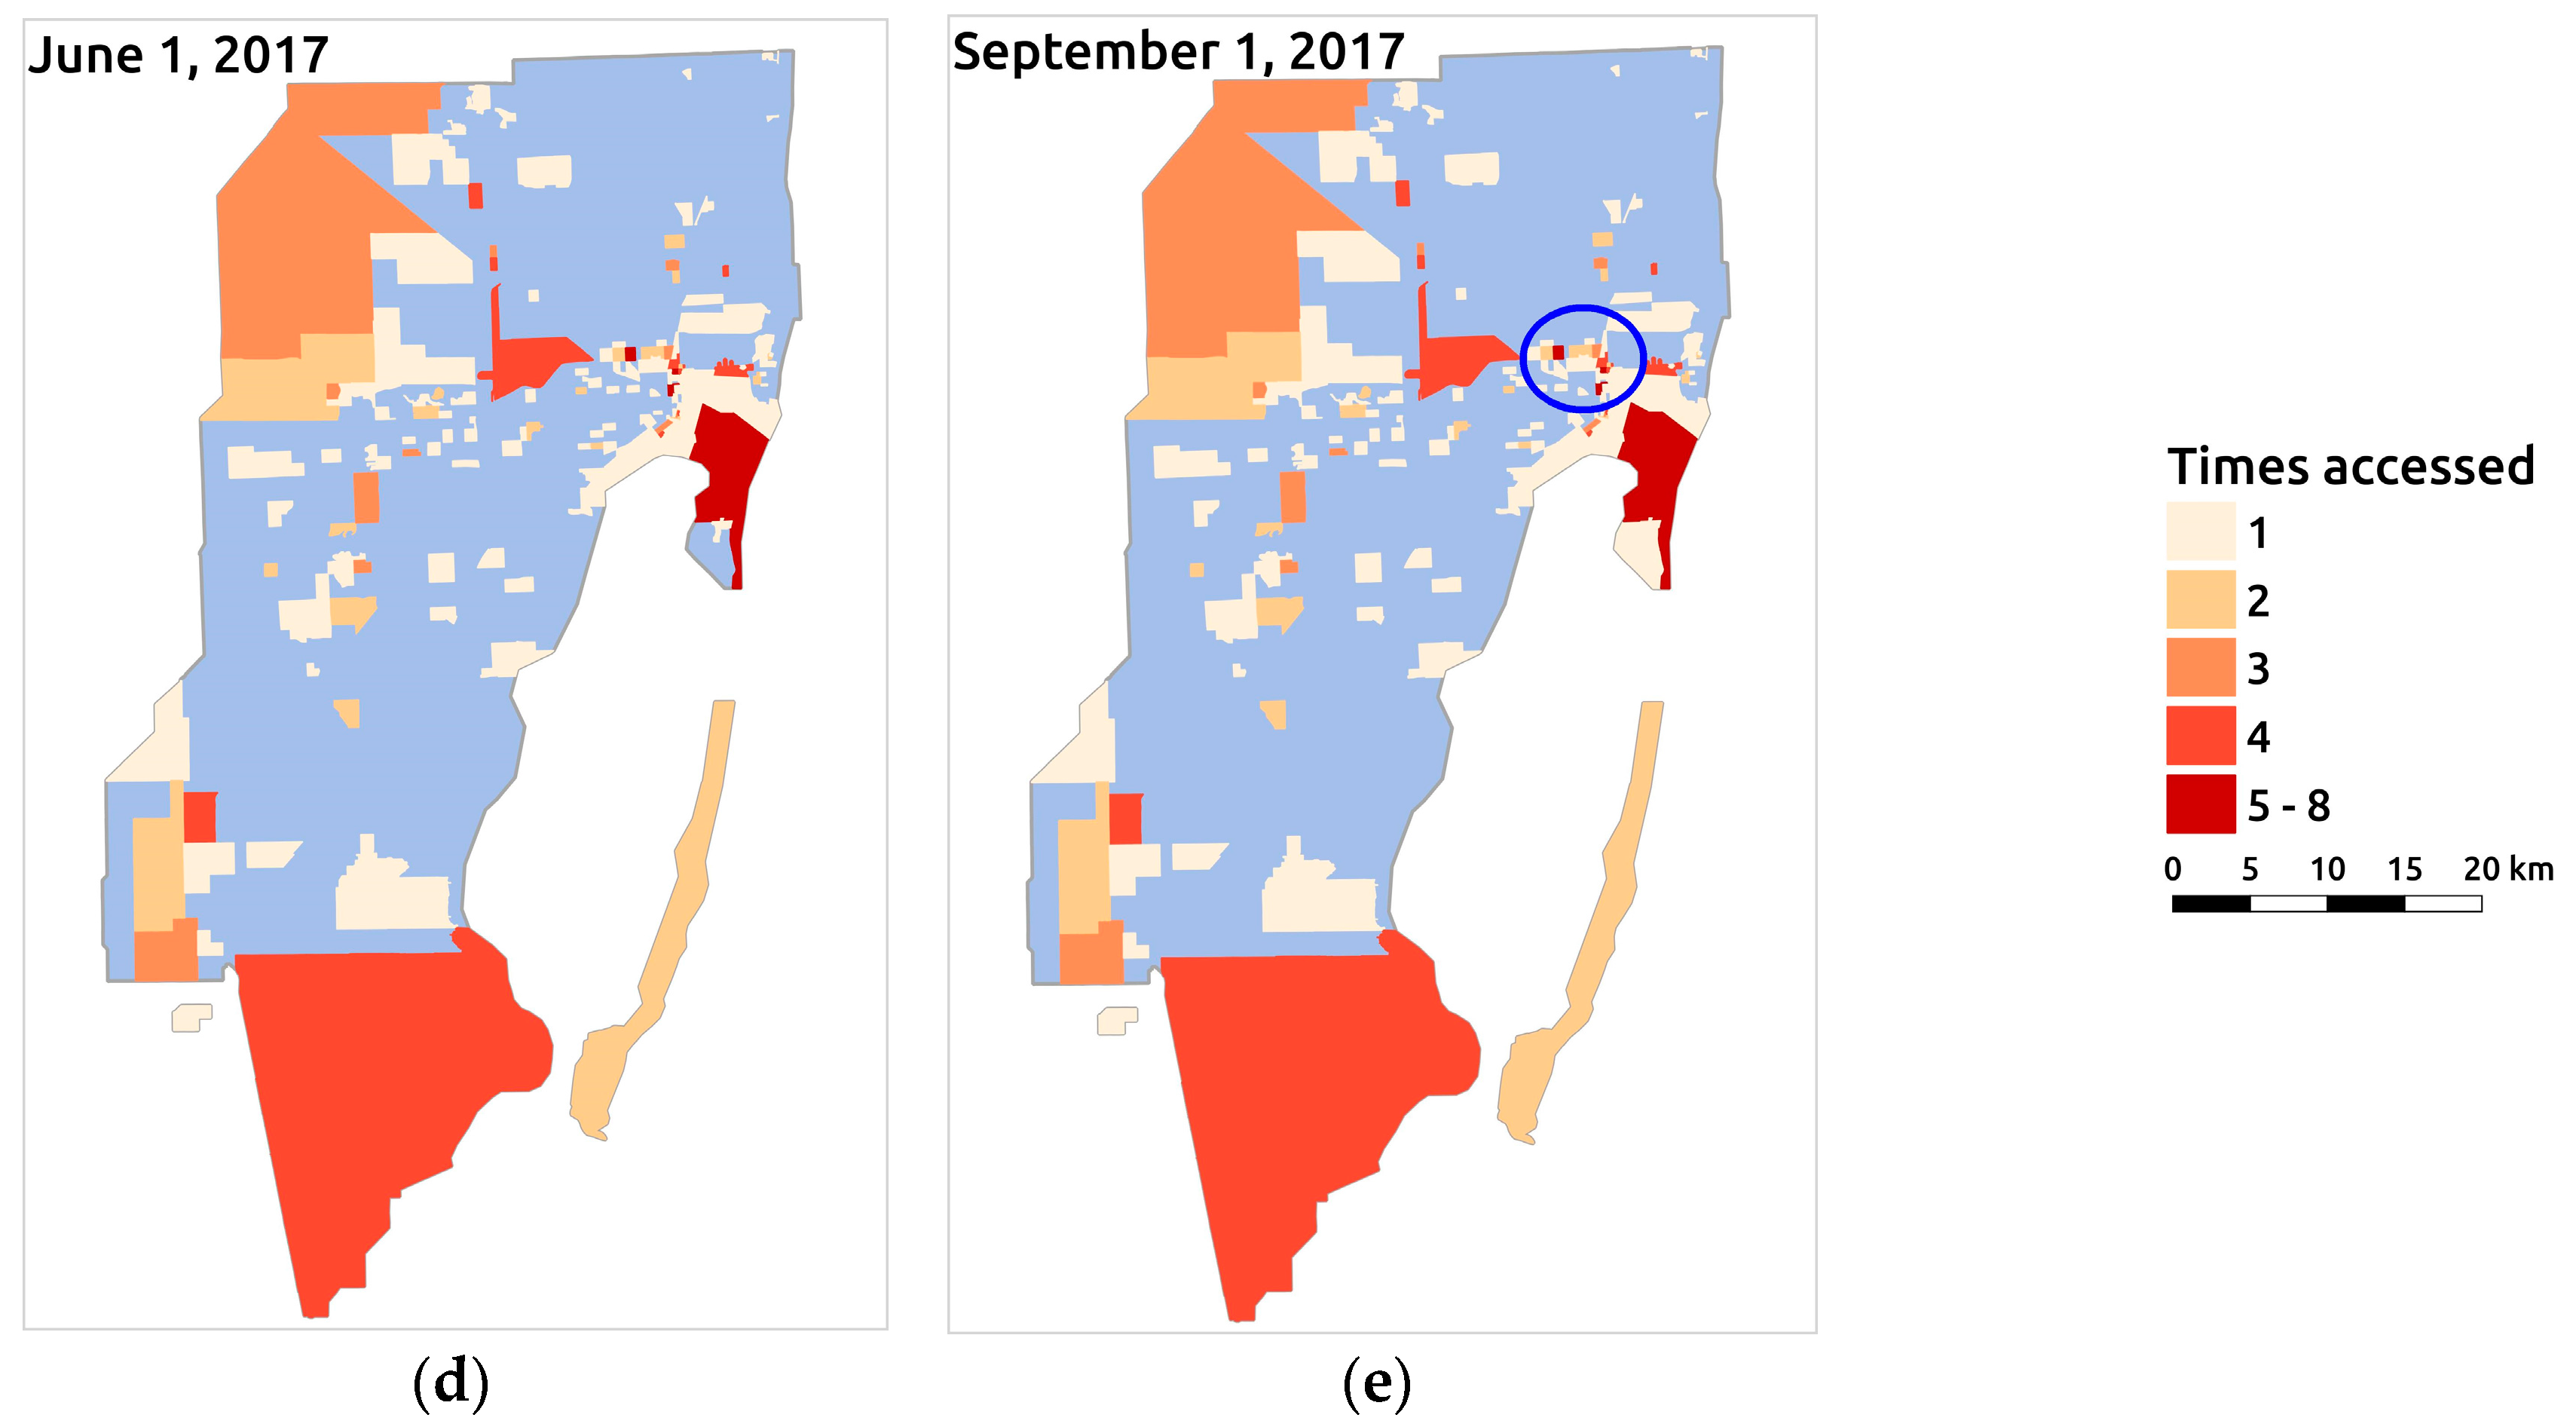
3.2.2. Spatial Aspects

The Tasking Manager logs user activity by storing when users accessed (i.e., locked) individual tasks. This information allowed us to explore which areas users prioritized for data imports and editing. Tasks were spatially subdivided into US Census block groups which contain approximately the same number of residents. Figure 5 provides an overview of the cumulative number of times a task was locked over time. There is no limit as to how many times a task can be locked by users. Even when a task is marked as “done”, another user can still interact with it, for example to validate edits.
The spatial distribution of activities shows a few distinct patterns. Since US Census block groups contain approximately the same number of residents, they tend to be larger around the edge of the project area, which has a low population density. Therefore, these census block groups appear more prominently on the map, which makes them more likely to be chosen by contributors, especially by those who lack local knowledge about the spatial layout of the study area. These larger census blocks show agricultural (Homestead), natural (Water conservation area), or industrial (e.g., quarries) characteristics and were often locked by users. Also, centrally located areas, where tasks are smaller in size, tend to be very popular among mappers, probably because of some mappers’ interest in learning more about the city center regions. Accordingly, frequently locked tasks can be found in Downtown Miami (blue circle in Figure 5e), the financial district (Brickell) south of Downtown Miami, or Key Biscayne, which is a scenic and touristic island. Users locked 201 tasks, out of which 91 were marked as “done”. These marked areas are highlighted in Figure 6 (green polygons) among other areas that showed only some or no activity. Approximately 45% of the areas end up being finished once a user locks them. A large number of tasks marked as done are found in natural areas, which require only a few or no building imports. Also, downtown areas showed a similarly high number of finished tasks, probably due to higher user interest in these areas. It has to be noted that a task is not automatically marked as “done”. Therefore, in reality the number of tasks that are already finished could be higher. There was no evidence of users erroneously marking tasks as finished. Also, 41% of the total task areas (1591) contain no buildings to be imported. These tasks require no work, and therefore could easily increase the completion rate if set to “done”. However, only 27 of the 650 tasks that involved no buildings have been marked as “done” so far.
Figure 7a shows that most tasks are locked only once (143), while only a few are locked more than 5 times. This can be expected because once an area has been correctly imported with all building conflicts removed, there is no need to work on it anymore. Accordingly, most tasks (174), whether finished or unfinished, were only worked on by one mapper (Figure 7b). A few popular tasks show that some areas remain interesting for OSM users, even though they are marked as “done”. The most popular tasks were locked by three different users. These two distributions closely follow a power law function with an exponent value of 2.39 and an adjusted R2 of 0.94 in the case of task locks (Figure 7a), and an exponent of 2.95 and an adjusted R2 of 0.99 in the case of the number of users working on a task (Figure 7b). These heavy-tailed distributions follow a similar pattern observed many times in user-generated data. However, the level of information, especially in Figure 7b, is somewhat limited since only three data points were used for the regression.

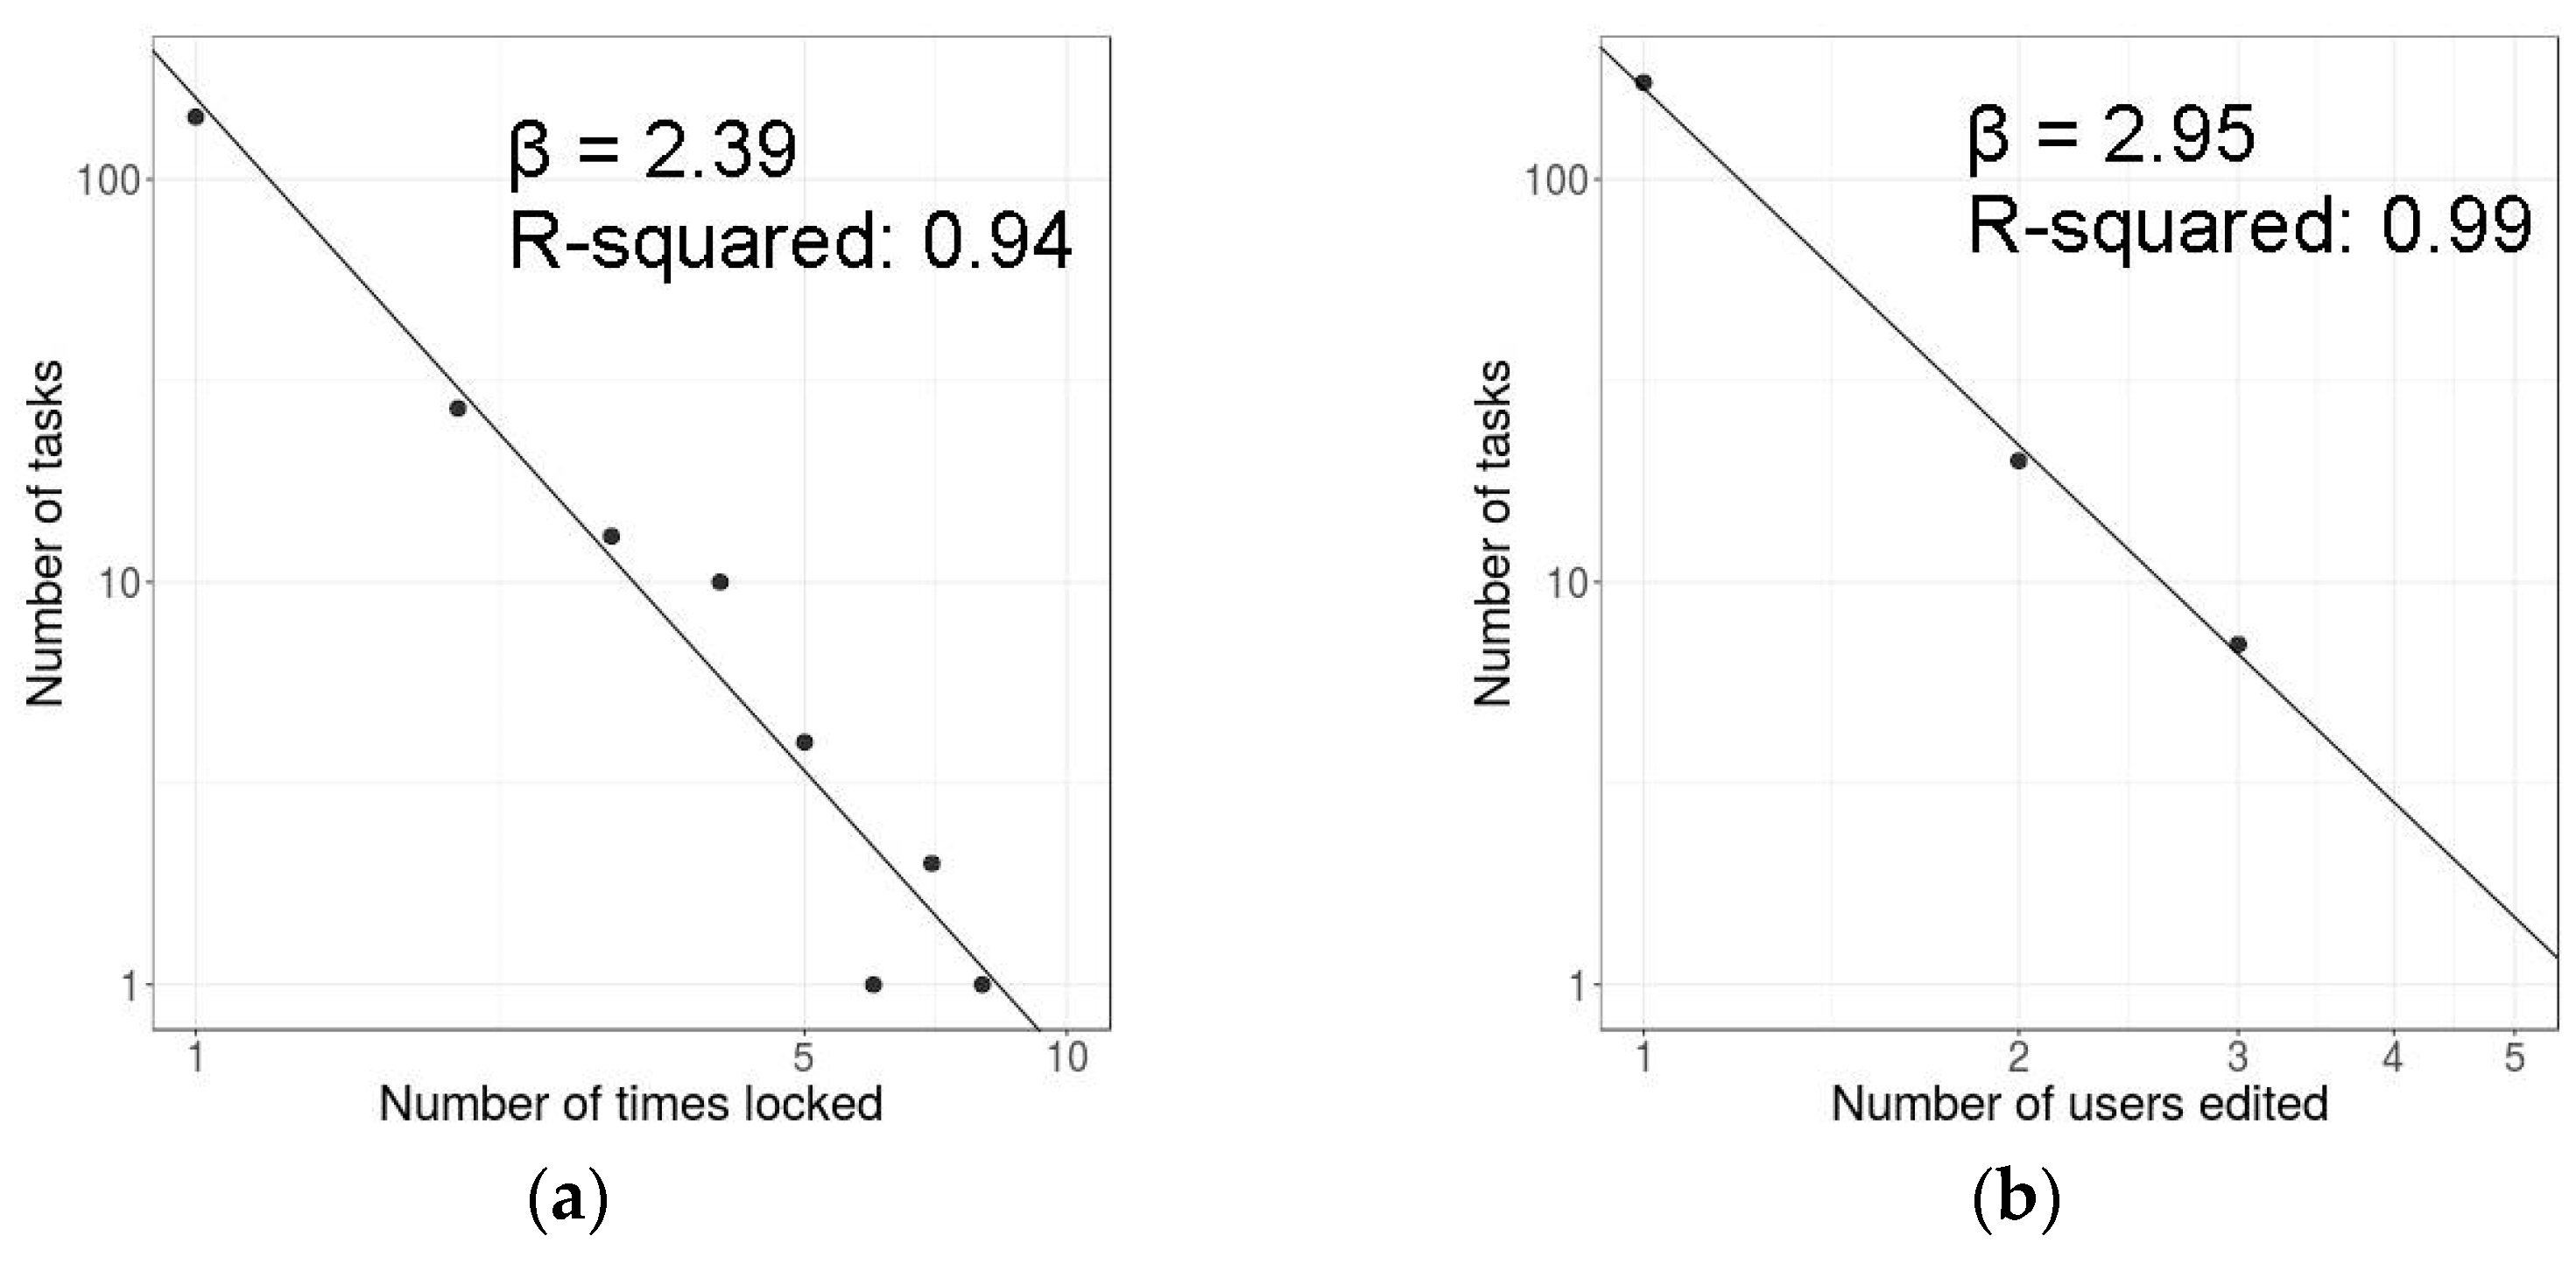
3.2.3. Other OSM User Activities

Since OSM users were not limited to the import task analyzing user contributions outside Miami-Dade County provides further information about user characteristics and typical contribution behavior. Figure 8 shows the worldwide spatial distribution of changesets submitted by community users (blue areas) and graduate students (red triangles indicating centroids of changesets) between May 2016 and October 2017. The commitment of existing community members from the OSM community is reflected in Figure 8 through their changesets (blue areas) that cover significantly larger areas than the changesets of students (red triangles) and new community members (not visible due to small size and low volume). The majority of changesets submitted by existing community users can be found in the US, suggesting that these users are mostly US residents. Their interest in the entire country is also reflected through mapping activities in Hawaii and Puerto Rico, which are not part of the contiguous United States. A clear divide in contribution patterns along the US-Canadian border suggests that the interest of a user group can be influenced by administrative boundaries and cultural aspects. This can be explained by the pride of place concept [33,34]. National borders were also found to shape the spatial extent of mapping activities of individual users in other studies, for example when editing OSM based on Mapillary street level photos [26]. The extensive mapping of Columbia in South America by existing community users is a result of one user who divides his or her mapping efforts between Columbia and South Florida. The spatial distribution of student OSM activities is concentrated in Miami-Dade County, with only one student contributing outside the county. This student added several buildings in Bangladesh from aerial imagery and added also building names to existing features in that region. According to the class introduction, this student is originally from Bangladesh and most probably has personal knowledge and ties to the mapped area. Similarly, contributions of new community members are mainly found in South Florida (even outside Miami-Dade County) and in the Caribbean, suggesting that new users focus their editing activity on smaller areas than already established users.
Besides geographic coverage another distinct pattern between students and community users is the higher mapping activity associated with humanitarian projects (HOT) of the latter group. Since May 2016, 15 community users (11 existing and 4 new) submitted over 6200 changesets with #hotosm and #missingmaps hashtags. These changesets were mainly located in Haiti after Hurricane Matthew in 2016, in Africa (as part of Missing Maps (http://www.missingmaps.org/) projects in Tanzania, Nigeria, or Congo) and in Sri Lanka. An OSM data import project is similar to a humanitarian project in the sense that users work towards a specific goal while following centralized instructions. This explains that some community users contributed both to HOT and data import activities, in some instances within the project area (see also Section 3.2.1).

4. Summary and Conclusions

This study analyzed if and how a local building import task can help to engage students and targeted community groups in OSM participation and retention. One of our observations related to the organizational aspects of such data imports, is that the amount of information provided to participants can overwhelm prospective new users who are otherwise unfamiliar with collaborative mapping, and that only individual or small group tutoring on related tasks leads to the continuous engagement of a new community member. We also found that checking the early edits of new contributors and providing feedback are effective methods for ensuring high quality contributions later on.
Our results show that the type of engagement technique used to recruit users has a significant effect on the import activity. Students who were recruited as part of an extra credit assignment imported more buildings on average than users who were recruited at community meetings or through social media activity. The level of contribution activity is ultimately related to different motivations of users. In that regard, our results suggest that extrinsic motivation (i.e., students receiving extra credit) triggers more activity than the intrinsic motivation of community users, at least in the short run.
However, our experiment proved to be unsuccessful in retaining new users in the long run, regardless of their motivation. 23 new OSM members started mapping through the import project. The activity of students (15 individuals) closely followed academic deadlines, but no continuation of long-term activities could be observed. As previous research has already shown [5], mapping parties fail to retain newcomers almost completely, with no retention in the long term. This study expanded related research to the academic environment and found the same problem with extra credit activities among GIS students. Although participating students did contribute more data than required for the assignment, the import exercise did not retain the students as permanent OSM contributors. One possible approach to mitigate the latter problem could be to request continued OSM editing as part of project assignments so that students get used to a regular (e.g., weekly) OSM editing schedule. The remaining eight new users were recruited at community events, or through online outreach. The activity pattern of these users also corresponds to specific events, such as community events, social media posts or other related mapping activities in the study area. However, similarly to students, none of these new users became long-time contributors. Our experiments did not include follow up surveys or conversations with new users about their reasons for not continuing to contribute to the import task, which could be included in future import projects.
Though the study suggests that no long-term contributions can be expected from newly recruited mappers motivated by short-term extrinsic factors, it also shows the dedication of existing community members who demonstrated sustained editing activity levels throughout the study time frame. In addition, imports reach beyond those edits stemming from the direct import since these data also trigger long-term editing activities (e.g., adding attributes, fixing geometry errors) submitted by other, already engaged OSM user contributors. The study showed also that already established mappers do not change their contribution behavior through community events. Instead, they are active before and after the event, contributing to OSM on a regular basis. This is also in line with previous findings from OSM mapping parties [5]. The presented study also provides evidence of other users, who are otherwise unrelated to the project, to interact with the building import. More specifically, two distinct instances of this activity were one individual mapper adding more information to buildings (i.e., building levels) and another one with an increased editing activity due to an organized hurricane relief event by HOT.
To keep an active user base in OSM that will also ensure regular data updates and quality enhancement in the future, new ways of user recruitment and retention are necessary. While the presented study showed that extra credit assignments increase short-term engagement of students, highlighting fun aspects could be another potential component to retain new mappers in OSM on the longer term, as this was also found to be a major driver for other collaborative projects, such as Wikipedia [37]. For example, geo-gaming and gamification has been shown to be an attractive and incentivizing way of engaging a different audience in land cover validation [38] and the collection of crowd-sourced Points of Interest [39]. While there is no best recipe for how to integrate fun components into OSM mapping and import tasks, considering ideas from other platforms could provide some guidance and ideas, including the provision of reward diversity [40], or the interaction between participants, e.g., by responses to video recordings [41]. Future work will aim to integrate such components into mapping events and recruitment efforts and evaluate their efficacy. Based on experiences gained in the presented experiment, we recommend that similar projects put extra effort in interacting with prospective users who lack prior OSM experience. Providing a welcoming, personalized experience that addresses the special needs of these users might be a promising way to engage new users more effectively.

Acknowledgments

The authors would like to thank past and present organizers of Maptime Miami (Matthew Toro, Daniela Waltersdorfer, Nohely Alvarez, Adam Old and Ernie Hsiung) for keeping the small OSM community in South Florida alive. We are also thankful for OSM members who provided feedback on various channels, and finally, we thank all OSM users, community members and students who participated in the import. Publication of this article was supported by the University of Florida Open Access Publishing Fund.

Author Contributions

L.J. was the technical lead on the OSM import project and is a co-organizer of Maptime Miami. H.H.H. teaches both courses mentioned in the paper at the University of Florida. L.J. designed the experiments and analyzed the data. L.J. and H.H.H. both contributed to the writing of this manuscript.

Conflicts of Interest

L.J. is one of the current co-organizers of Maptime Miami and also contributed to this project by importing building data.

References

  1. Goodchild, M.F. Citizens as Voluntary Sensors: Spatial Data Infrastructure in the World of Web 2.0 (Editorial). Int. J. Spat. Data Infrastruct. Res. 2007, 2, 24–32. [Google Scholar]
  2. Haklay, M. Citizen Science and Volunteered Geographic Information: Overview and Typology of Participation. In Crowdsourcing Geographic Knowledge; Sui, D., Elwood, S., Goodchild, M., Eds.; Springer: Berlin, Germany, 2013; pp. 105–122. [Google Scholar]
  3. Goodchild, M.F.; Li, L. Assuring the quality of volunteered geographic information. Spat. Stat. 2012, 1, 110–120. [Google Scholar] [CrossRef]
  4. Haklay, M.; Weber, P. OpenStreetMap: User-Generated Street Maps. IEEE Pervas. Comput. 2008, 7, 12–18. [Google Scholar] [CrossRef]
  5. Hristova, D.; Quattrone, G.; Mashhadi, A.J.; Capra, L. The Life of the Party: Impact of Social Mapping in OpenStreetMap. In Proceedings of the Seventh International AAAI Conference on Weblogs and Social Media, Cambridge, MA, USA, 8–11 July 2013; pp. 234–243. [Google Scholar]
  6. Bryant, S.L.; Forte, A.; Bruckman, A. Becoming Wikipedian: Transformation of Participation in a Collaborative Online Encyclopedia. In Proceedings of the GROUP: International Conference on Supporting Group Work, Sanibel Island, FL, USA, 6–9 November 2005; pp. 1–10. [Google Scholar]
  7. Mooney, P.; Minghini, M.; Stanley-Jones, F. Observations on an OpenStreetMap mapping party organised as a social event during an open source GIS conference. Int. J. Spat. Data Infrastruct. Res. 2015, 10, 138–150. [Google Scholar]
  8. Mashhadi, A.; Quattrone, G.; Capra, L. The Impact of Society on Volunteered Geographic Information: The Case of OpenStreetMap. In OpenStreetMap in GIScience (Lecture Notes in Geoinformation and Cartography); Jokar Arsanjani, J., Zipf, A., Mooney, P., Helbich, M., Eds.; Springer: Berlin, Germany, 2015; pp. 125–141. [Google Scholar]
  9. Bégin, D.; Devillers, R.; Roche, S. Contributors’ Withdrawal from Online Collaborative Communities: The Case of OpenStreetMap. ISPRS Int. J. Geo-Inf. 2017, 6, 340. [Google Scholar] [CrossRef]
  10. Soden, R.; Palen, L. From crowdsourced mapping to community mapping: The post-earthquake work of OpenStreetMap Haiti. In Proceedings of the COOP 2014-Proceedings of the 11th International Conference on the Design of Cooperative Systems, Nice, France, 27–30 May 2014; pp. 311–326. [Google Scholar]
  11. Mooney, P.; Minghini, M. A Review of OpenStreetMap Data. In Mapping and the Citizen Sensor; Foody, G., See, L., Fritz, S., Mooney, P., Olteanu-Raimond, A.-M., Fonte, C.C., Antoniou, V., Eds.; Ubiquity Press: London, UK, 2017; pp. 37–59. [Google Scholar]
  12. OSM Wiki: Import Catalog. Available online: http://wiki.openstreetmap.org/wiki/Import/Catalogue (accessed on 20 January 2018).
  13. Zielstra, D.; Hochmair, H.H.; Neis, P. Assessing the effect of data imports on the completeness of OpenStreetMap—A United States case study. Trans. GIS 2013, 17, 315–334. [Google Scholar] [CrossRef]
  14. Mooney, P.; Corcoran, P. The annotation process in OpenStreetMap. Trans. GIS 2012, 16, 561–579. [Google Scholar] [CrossRef]
  15. Touya, G.; Brando-Escobar, C. Detecting level-of-detail inconsistencies in volunteered geographic information data sets. Cartographica 2013, 48, 134–143. [Google Scholar] [CrossRef]
  16. Beaulieu, A.; Bégin, D.; Genest, D. Community mapping and government mapping: Potential collaboration? In Proceedings of the Symposium of ISPRS Commission I, Calgary, AB, Canada, 15–18 June 2010; pp. 16–18. [Google Scholar]
  17. Fritz, S.; Linda, S.; Brovelli, M. Motivating and Sustaining Participation in VGI. In Mapping and the Citizen Sensor; Foody, G., See, L., Fritz, S., Mooney, P., Olteanu-Raimond, A.-M., Fonte, C.C., Antoniou, V., Eds.; Ubiquity Press: London, UK, 2017; pp. 93–117. [Google Scholar]
  18. Budhathoki, N.R.; Haythornthwaite, C. Motivation for open collaboration crowd and community models and the case of OpenStreetMap. Am. Behav. Sci. 2013, 57, 548–575. [Google Scholar] [CrossRef]
  19. Hecht, R.; Kunze, C.; Hahmann, S. Measuring completeness of building footprints in OpenStreetMap over space and time. ISPRS Int. J. Geo-Inf. 2013, 2, 1066–1091. [Google Scholar] [CrossRef]
  20. Fram, C.; Chistopoulou, K.; Ellul, C. Assessing the quality of OpenStreetMap building data and searching for a proxy variable to estimate OSM building data completeness. In Proceedings of the GIS Research UK (GISRUK) 2015 Proceedings, Leeds, UK, 15–17 April 2015; pp. 195–205. [Google Scholar]
  21. Brovelli, M.; Minghini, M.; Molinari, M.; Zamboni, G. Positional accuracy assessment of the OpenStreetMap buildings layer through automatic homologous pairs detection: The method and a case study. Int. Arch. Photogramm. Remote Sens. Spat. Inf. Sci. 2016, 41, 615. [Google Scholar] [CrossRef]
  22. Törnros, T.; Dorn, H.; Hahmann, S.; Zipf, A. Uncertainties of completeness measures in OpenStreetMap—A case study for buildings in a medium-sized German city. ISPRS Ann. Photogramm. Remote Sens. Spat. Inf. Sci. 2015, 2, 353–357. [Google Scholar] [CrossRef]
  23. Fan, H.; Zipf, A.; Fu, Q.; Neis, P. Quality assessment for building footprints data on OpenStreetMap. Int. J. Geogr. Inf. Sci. 2014, 28, 700–719. [Google Scholar] [CrossRef]
  24. Barron, C.; Neis, P.; Zipf, A. A comprehensive framework for intrinsic OpenStreetMap quality analysis. Trans. GIS 2014, 18, 877–895. [Google Scholar] [CrossRef]
  25. Juhász, L.; Hochmair, H.H. How do volunteer mappers use crowdsourced Mapillary street level images to enrich OpenStreetMap? In Proceedings of the 20th AGILE Conference on Geo-Information Science, Wageningen, The Netherlands, 18–21 Septermber 2017. [Google Scholar]
  26. Juhász, L.; Hochmair, H.H. Cross-Linkage Between Mapillary Street Level Photos and OSM Edits. In Geospatial Data in a Changing World: Selected papers of the 19th AGILE Conference on Geographic Information Science (Lecture Notes in Geoinformation and Cartography); Sarjakoski, T., Santos, M.Y., Sarjakoski, L.T., Eds.; Springer: Berlin, Germany, 2016; pp. 141–156. [Google Scholar]
  27. Elicker, J.D.; McConnell, N.L.; Hall, R.J. Research Participation for Course Credit in Introduction to Psychology: Why Don’t People Participate? Teach. Psychol. 2010, 37, 183–185. [Google Scholar] [CrossRef]
  28. Padilla-Walker, L.M.; Thompson, R.A.; Zamboanga, B.L.; Schmersal, L.A. Extra credit as incentive for voluntary research participation. Teach. Psychol. 2005, 32, 150–153. [Google Scholar] [CrossRef]
  29. Stephens, M. Gender and the GeoWeb: Divisions in the production of user-generated cartographic information. GeoJournal 2013, 78, 981–996. [Google Scholar] [CrossRef]
  30. Schmidt, M.; Klettner, S. Gender and experience-related motivators for contributing to openstreetmap. In Proceedings of the Action and Interaction in Volunteered Geographic Information (ACTIVITY) Workshop at AGILE 2013, Leuven, Belgium, 5 may 2013; pp. 13–18. [Google Scholar]
  31. Mooney, P.; Corcoran, P. Understanding the Roles of Communities in Volunteered Geographic Information Projects. In Progress in Location-Based Services (Lecture Notes in Geoinformation and Cartography); Krisp, J., Ed.; Springer: Berlin, Germany, 2013; pp. 357–371. [Google Scholar]
  32. Bégin, D.; Devillers, R.; Roche, S. Contributors’ enrollment in collaborative online communities: The case of OpenStreetMap. Geo-Spat. Inf. Sci. 2017, 20, 282–295. [Google Scholar] [CrossRef]
  33. Coleman, D.J.; Georgiadou, Y.; Labonte, J. Volunteered Geographic Information: The nature and motivation of produsers. Int. J. Spat. Data Infrastruct. Res. 2009, 4, 332–358. [Google Scholar]
  34. Napolitano, M.; Mooney, P. MVP OSM: A tool to identify areas of high quality contributor activity in OpenStreetMap. Bull. Soc. Cartogr. 2012, 45, 10–18. [Google Scholar]
  35. Burchfield, C.M.; Sappington, J. Compliance with required reading assignments. Teach. Psychol. 2000, 27, 59–60. [Google Scholar]
  36. Fernald, P.S. The Monte Carlo quiz: Encouraging punctual completion and deep processing of assigned readings. Coll. Teach. 2004, 52, 95–99. [Google Scholar]
  37. Nov, O. What motivates wikipedians? Commun. ACM 2007, 50, 60–64. [Google Scholar] [CrossRef]
  38. See, L.; Fritz, S.; Perger, C.; Schill, C.; McCallum, I.; Schepaschenko, D.; Duerauer, M.; Sturn, T.; Karner, M.; Kraxner, F. Harnessing the power of volunteers, the internet and Google Earth to collect and validate global spatial information using Geo-Wiki. Technol. Forecast. Soc. Chang. 2015, 98, 324–335. [Google Scholar] [CrossRef] [Green Version]
  39. Juhász, L.; Hochmair, H.H. Where to catch ‘em all?—A geographic analysis of Pokémon Go locations. Geo-Spat. Inf. Sci. 2017, 30, 241–251. [Google Scholar] [CrossRef]
  40. Choi, J.; Choi, H.; So, W.; Lee, J.; You, J. A Study about Designing Reward for Gamified Crowdsourcing System. In Design, User Experience, and Usability. User Experience Design for Diverse Interaction Platforms and Environments. DUXU 2014 (Lecture Notes in Computer Science, Vol. 8518); Marcus, A., Ed.; Springer: Cham, Switzerlands, 2014; pp. 678–687. [Google Scholar]
  41. Spiro, I. Motion chain: A webcam game for crowdsourcing gesture collection. In CHI’12 Extended Abstracts on Human Factors in Computing Systems; ACM: Austin, TX, USA, 2012; pp. 1345–1350. [Google Scholar]
Figure 1. Import buildings (automatically uploaded—green, for manual review—red) in Miami-Dade County (a); excerpt from the import tutorial (b); and interface of the Tasking Manager (TM) instance (c).
Ijgi 07 00113 g001
Figure 2. OSM changesets between March 2016 and August 2016 in Miami-Dade County (red outline) (a) and a Maptime Miami Meetup held on 26 September 2016 (b).
Ijgi 07 00113 g002
Figure 3. Histograms of sign up dates for different user groups. For students, assignment due dates (solid vertical lines) and first introduction to the project (dashed vertical line) are shown. Note that the horizontal time axes cover different date ranges for the user groups in (ac).
Ijgi 07 00113 g003
Figure 4. Import related activity levels over time for different user groups. Dashed vertical lines show community events, while solid vertical lines represent assignment deadlines for students.
Ijgi 07 00113 g004
Figure 5. Cumulative number of times individual tasks from the Tasking Manager were accessed throughout September 2016 (a); December 2016 (b); March 2017 (c); June 2017 (d); and September 2017 (e).
Ijgi 07 00113 g005aIjgi 07 00113 g005b
Figure 6. Finished tasks (green), tasks that have been worked on (red), and tasks that have not been worked on (blue).
Ijgi 07 00113 g006
Figure 7. Fitted power law functions on task lock (a) and user (b) distributions (log-log plots).
Ijgi 07 00113 g007
Figure 8. Spatial distribution of OSM changesets submitted by participating users between May 2016 and October 2017.
Ijgi 07 00113 g008
Table 1. Descriptive statistics of imported buildings by user groups.
Students(New)Community Users
(New)(Existing)Total
N1581523
Total # of buildings15546914781547
Average # of buildings per user103.68.798.567.2
Median # of buildings per user87.03.524.016.0
SD of # of buildings per user59.311.8159.9135.0
Table 2. Description of events related to the import project.
EventEvent typeEvent DescriptionDate
1CCommunityTechnical discussion of software tools, general information on the import, intro messages sent out 1 August 2016
2CCommunityPresentation of automatic import results, hands-on mapping session26 September 2016
3CCommunityHands on mapping session dedicated to the import17 November 2016
1SStudentGIS Programming course bonus assignment due 2 December 2016
4CCommunityHands on mapping session dedicated to the import15 December 2016
2SStudentGIS Analysis course bonus assignment due 9 March 2017

