Article

Progressive Amalgamation of Building Clusters for Map Generalization Based on Scaling Subgroups

1
School of Geography and Planning, Sun Yat-Sen University, Guangzhou 510275, China
2
School of Geographical Science, Guangzhou University, Guangzhou 510275, China
3
Guangdong Key Laboratory for Urbanization and Geo-simulation, Guangzhou 510275, China
*
Author to whom correspondence should be addressed.
ISPRS Int. J. Geo-Inf. 2018, 7(3), 116; https://doi.org/10.3390/ijgi7030116
Submission received: 7 January 2018 / Revised: 23 February 2018 / Accepted: 13 March 2018 / Published: 15 March 2018

Abstract

:
Map generalization utilizes transformation operations to derive smaller-scale maps from larger-scale maps, and is a key procedure for the modelling and understanding of geographic space. Studies to date have largely applied a fixed tolerance to aggregate clustered buildings into a single object, resulting in the loss of details that meet cartographic constraints and may be of importance for users. This study aims to develop a method that amalgamates clustered buildings gradually without significant modification of geometry, while preserving the map details as much as possible under cartographic constraints. The amalgamation process consists of three key steps. First, individual buildings are grouped into distinct clusters by using the graph-based spatial clustering application with random forest (GSCARF) method. Second, building clusters are decomposed into scaling subgroups according to homogeneity with regard to the mean distance of subgroups. Thus, hierarchies of building clusters can be derived based on scaling subgroups. Finally, an amalgamation operation is progressively performed from the bottom-level subgroups to the top-level subgroups using the maximum distance of each subgroup as the amalgamating tolerance instead of using a fixed tolerance. As a consequence of this step, generalized intermediate scaling results are available, which can form the multi-scale representation of buildings. The experimental results show that the proposed method can generate amalgams with correct details, statistical area balance and orthogonal shape while satisfying cartographic constraints (e.g., minimum distance and minimum area).

1. Introduction

Map generalization is a procedure that utilizes transformation operations such as elimination, amalgamation, displacement, and simplification to solve spatial conflicts and derive smaller-scale maps from larger-scale maps [1]. Map generalization is an important means of modelling and understanding geographical phenomena [2]. When updating multi-representation databases, we often implement map generalization in order to propagate updates from the source scale to high-level scales [3,4]. The process of map generalization can be decomposed into model generalization and cartographic generalization [5,6]. Model generalization aims to derive higher-level abstractions from a primary geographic database without considering the artistry for visualization, which can be viewed as a preprocessing step prior to visualization via cartographic generalization. Amalgamation that fuses buildings within a cluster into a single object for the next higher-level representation is an essential operation of model generalization for map production [7], and attracts scientific interest from cartographic researchers [8,9,10].
The process of amalgamation is challenging for urban environments where buildings with complex spatial distribution need to merge. Specifically, proper amalgamation needs to address the issues of both the identification of building clusters (i.e., the grouping of individual buildings into distinct clusters by analyzing the spatial relations between buildings) [8,11] and cartographic constraint requirements (e.g., maintain position accuracy, retain balance of the whole area, square shapes, and avoid short gap distance) [10]. Nevertheless, a variety of methods have been developed for specific sub-problems of amalgamation. For building patterns recognition, significant achievements have already been made [12,13,14,15,16,17].
Previous research on the amalgamation of building clusters can be categorized into two types according to the processing data structure. The first is developed for raster data (if the source data is vector data, it is converted to raster data), including the method using morphologic operators (i.e., expansion and erosion) [18,19,20], and the method using scanning on raster data in two vertical directions to fill gaps between buildings in order to implement amalgamation [10,21]. These methods are difficult to fully control, as the solutions are designed for all scenarios without local tuning [14], and are inappropriate for other generalization operations (e.g., simplification and rectangularity). In addition, they would result in the loss of position accuracy during the conversion between raster and vector data. The other types of amalgamation methods are developed for vector data, which have been extensively studied. Strategies employed by these methods can be categorized into four types, including aggregation by displacing, aggregation by flooding, aggregation by sampling, and aggregation by connecting objects [11]. In this paper we explore the last of these strategies, which uses the triangles connecting objects as connectors to merge objects, which is by far the most commonly used methodology [22]. Triangles from the Delaunay triangulation can provide explicit spatial relationships between features, and can used be to guide the amalgamation process [3,7,8,9,23]. When applying the Delaunay triangulation to aggregate buildings within clusters, it is critical to determine which triangle is to be removed or maintained. The measured parameters include the position, angle, and height of a triangle and the mean length of its three edges [7,24]. As a result, these methods often involve considerable empirical thresholds for comparison. Moreover, such methods prefer to employ a global and fixed amalgamating distance to aggregate buildings within a cluster, which would result in some details of amalgams being lost, although these details meet cartographic constraints and are important to users.
In this paper, we present a progressive strategy for the amalgamation of building clusters based on the assumption that a building cluster recognized at the target scale may contain different levels of homogeneous subgroups according to certain variable conditions (e.g., mean distance) and that a hierarchy of that cluster can be derived. Thus, by decomposing a building cluster into scaled homogeneous subgroups (i.e., father clusters represent a coarse-scale grouping result, while their subgroups correspond to a fine-scale grouping result) to construct a hierarchy and progressively amalgamating subgroups from the bottom level to the highest level of the hierarchy, it is possible to obtain an amalgam with better preserved details that satisfy cartographic constraints and may be of importance for users. Moreover, it can avoid the necessity of employing considerable empirical parameters. To obtain such amalgams, the following requirements need to be considered: (1) as a prerequisite of amalgamation, an appropriate grouping method to detect building clusters must be found; (2) it must be determined which criteria define the homogeneity of subgroups for decomposing the building clusters; and (3) building subgroups must be amalgamated progressively without significant modification of geometry.

2. Methodology

Figure 1 illustrates the proposed framework for the amalgamation of building clusters, which consists of three major parts with details to be explained in the following sections.

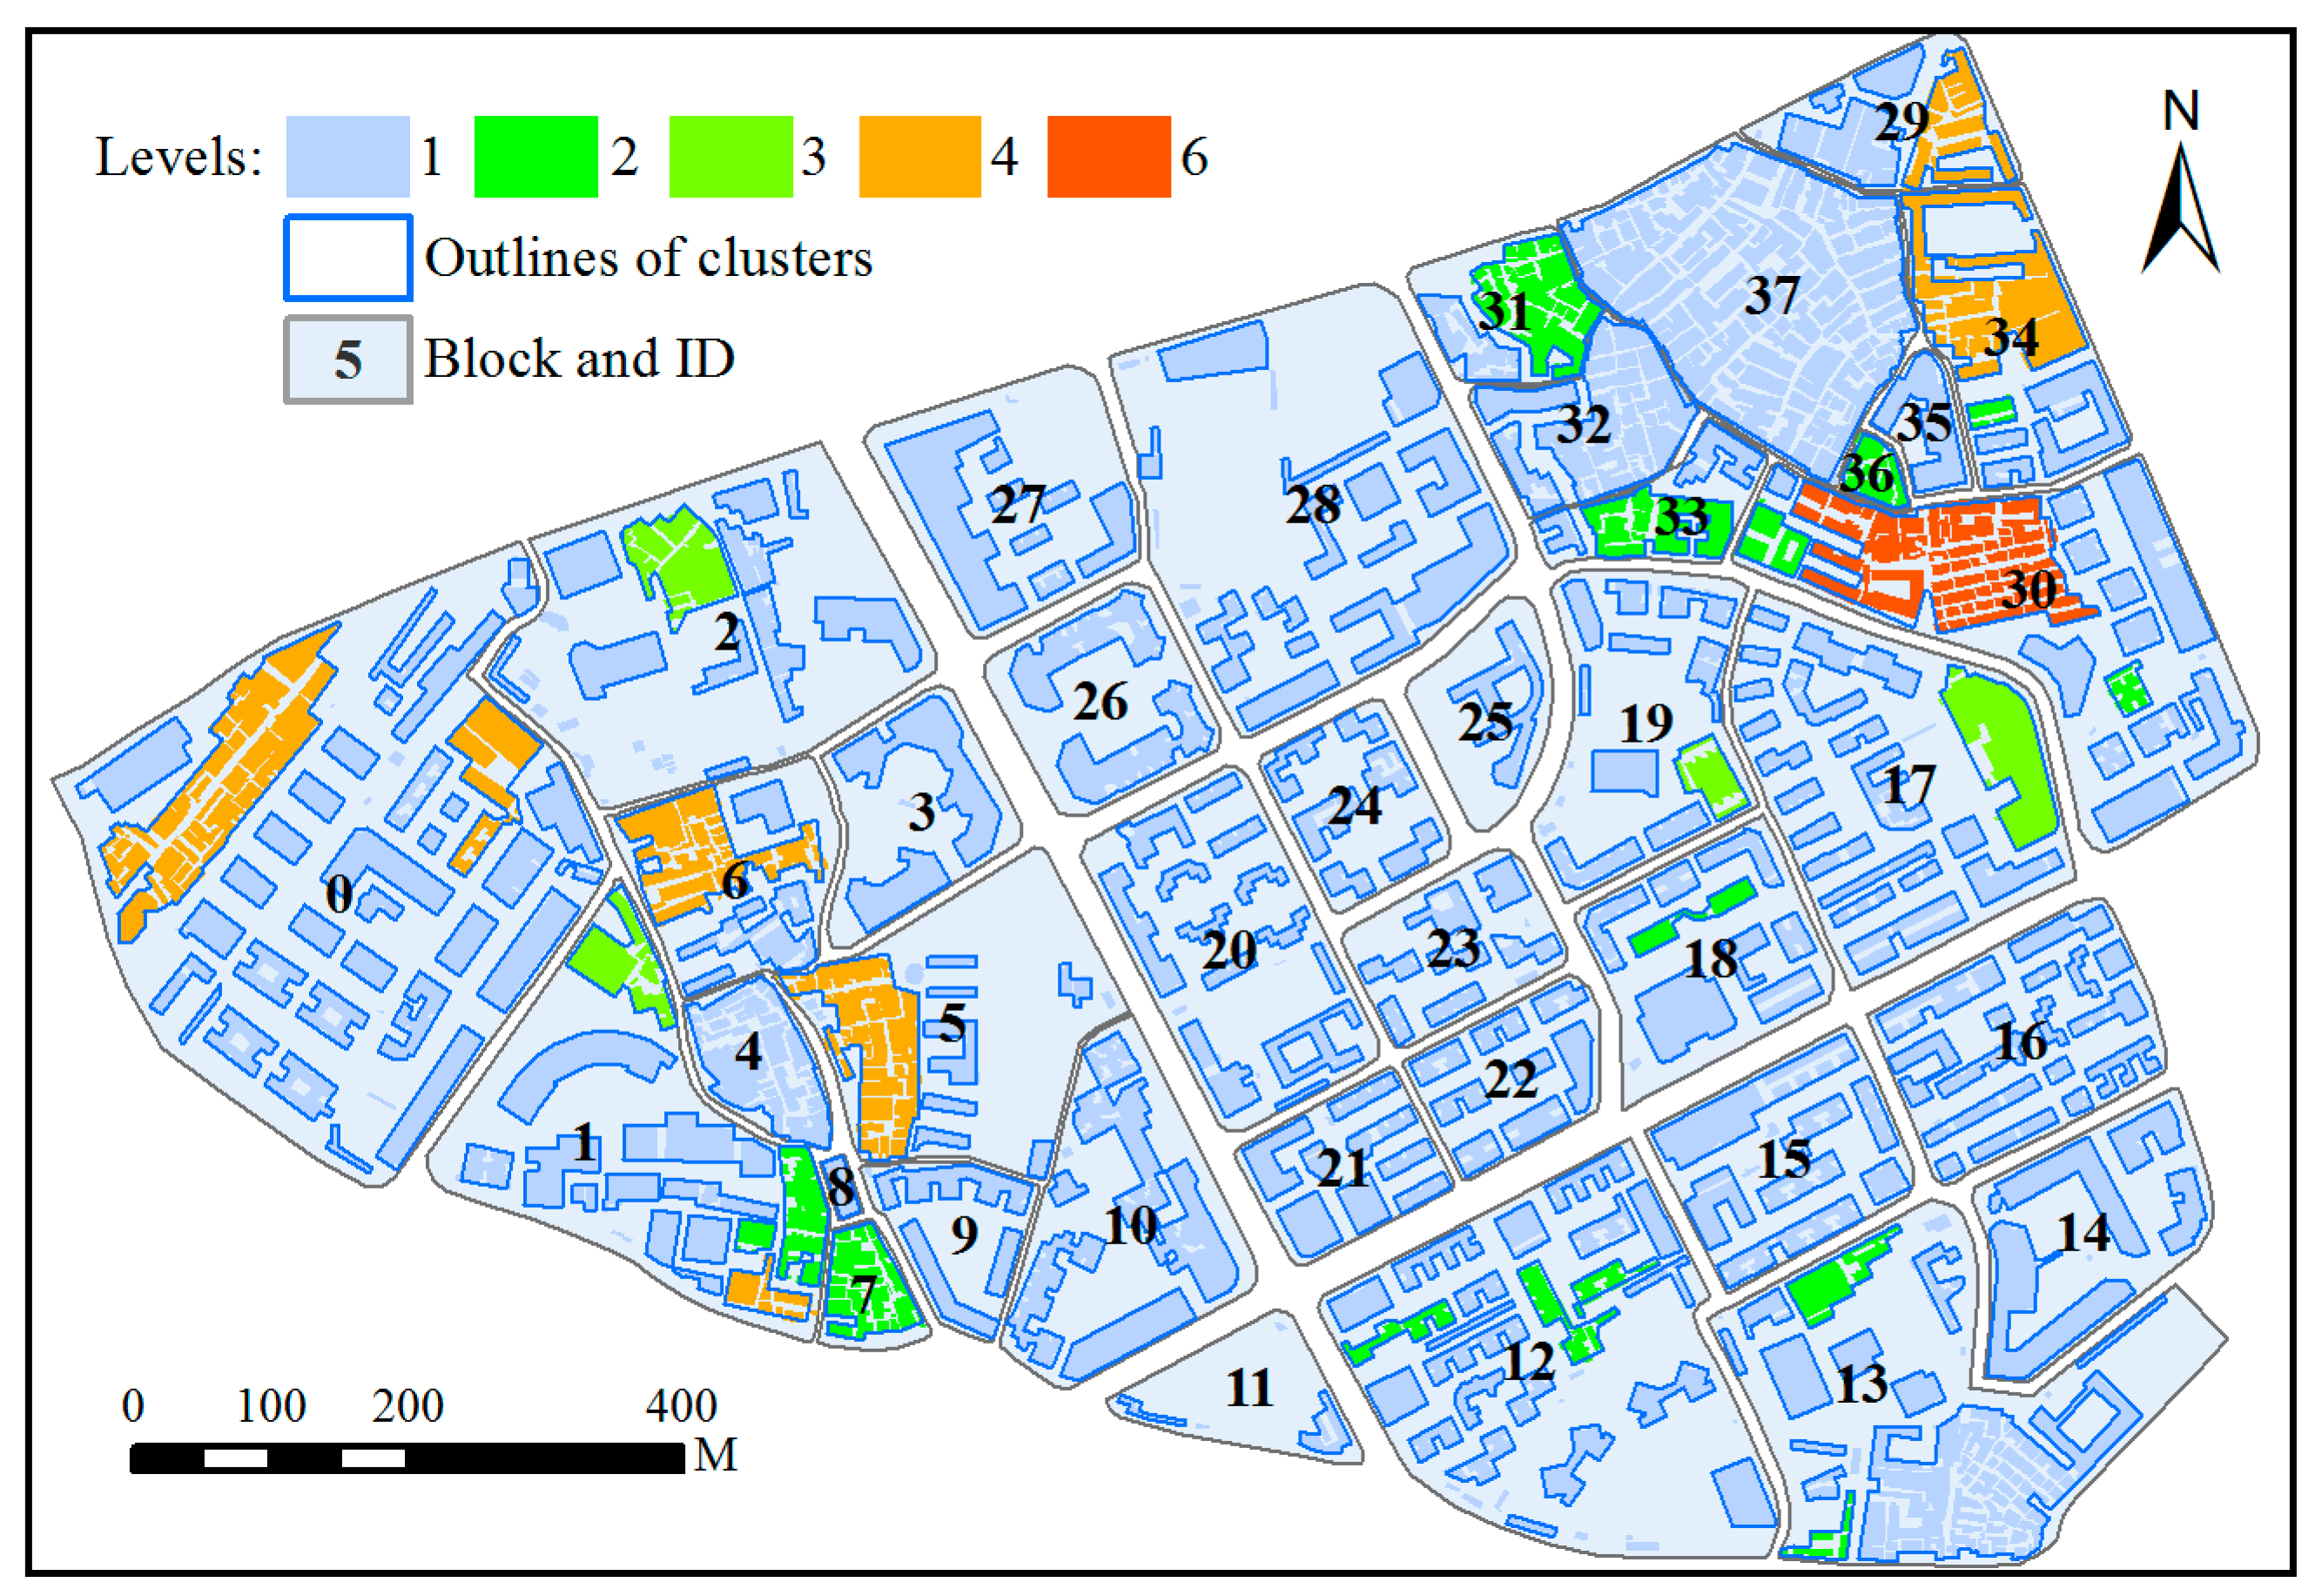
2.1. Grouping Individual Buildings into Clusters

Some grouping methods only consider the proximity of buildings and obtain building clusters based on the buffering analysis [23,25,26,27]. Though this is a prerequisite step of the amalgamation, it alone is insufficient when dealing with a complex distribution of buildings. In this paper, building grouping is implemented by using the graph-based spatial clustering application with random forest (GSCARF) [17], which consists of a multilevel graph partitioning algorithm and a binary classifier with a random forest algorithm. Before grouping, the spatial dataset of buildings is first partitioned into a series of building blocks in order to improve the efficiency of processing, and thus each of the blocks is an individual treatment unit in the subsequent analysis. During grouping, the method first identifies building group patterns from potential building clusters based on the binary classifier, and further partitions those building clusters with no recognized patterns based on the graph partitioning method. The scale of building group patterns recognized with GSCARF is determined by the input sample data. These sample data are building patterns that are manually recognized at a certain scale which are used to build the binary classifier. In this study, a sample of building patterns recognized at the scale of 1:10,000 was selected to build the classifier. Compared with other grouping methods [14,15,28], this grouping approach is well suited for the model generalization of maps, as it is capable of identifying a variety of building clusters in an unsupervised way [13]. Further details regarding the GSCARF can be found in the literature [17].

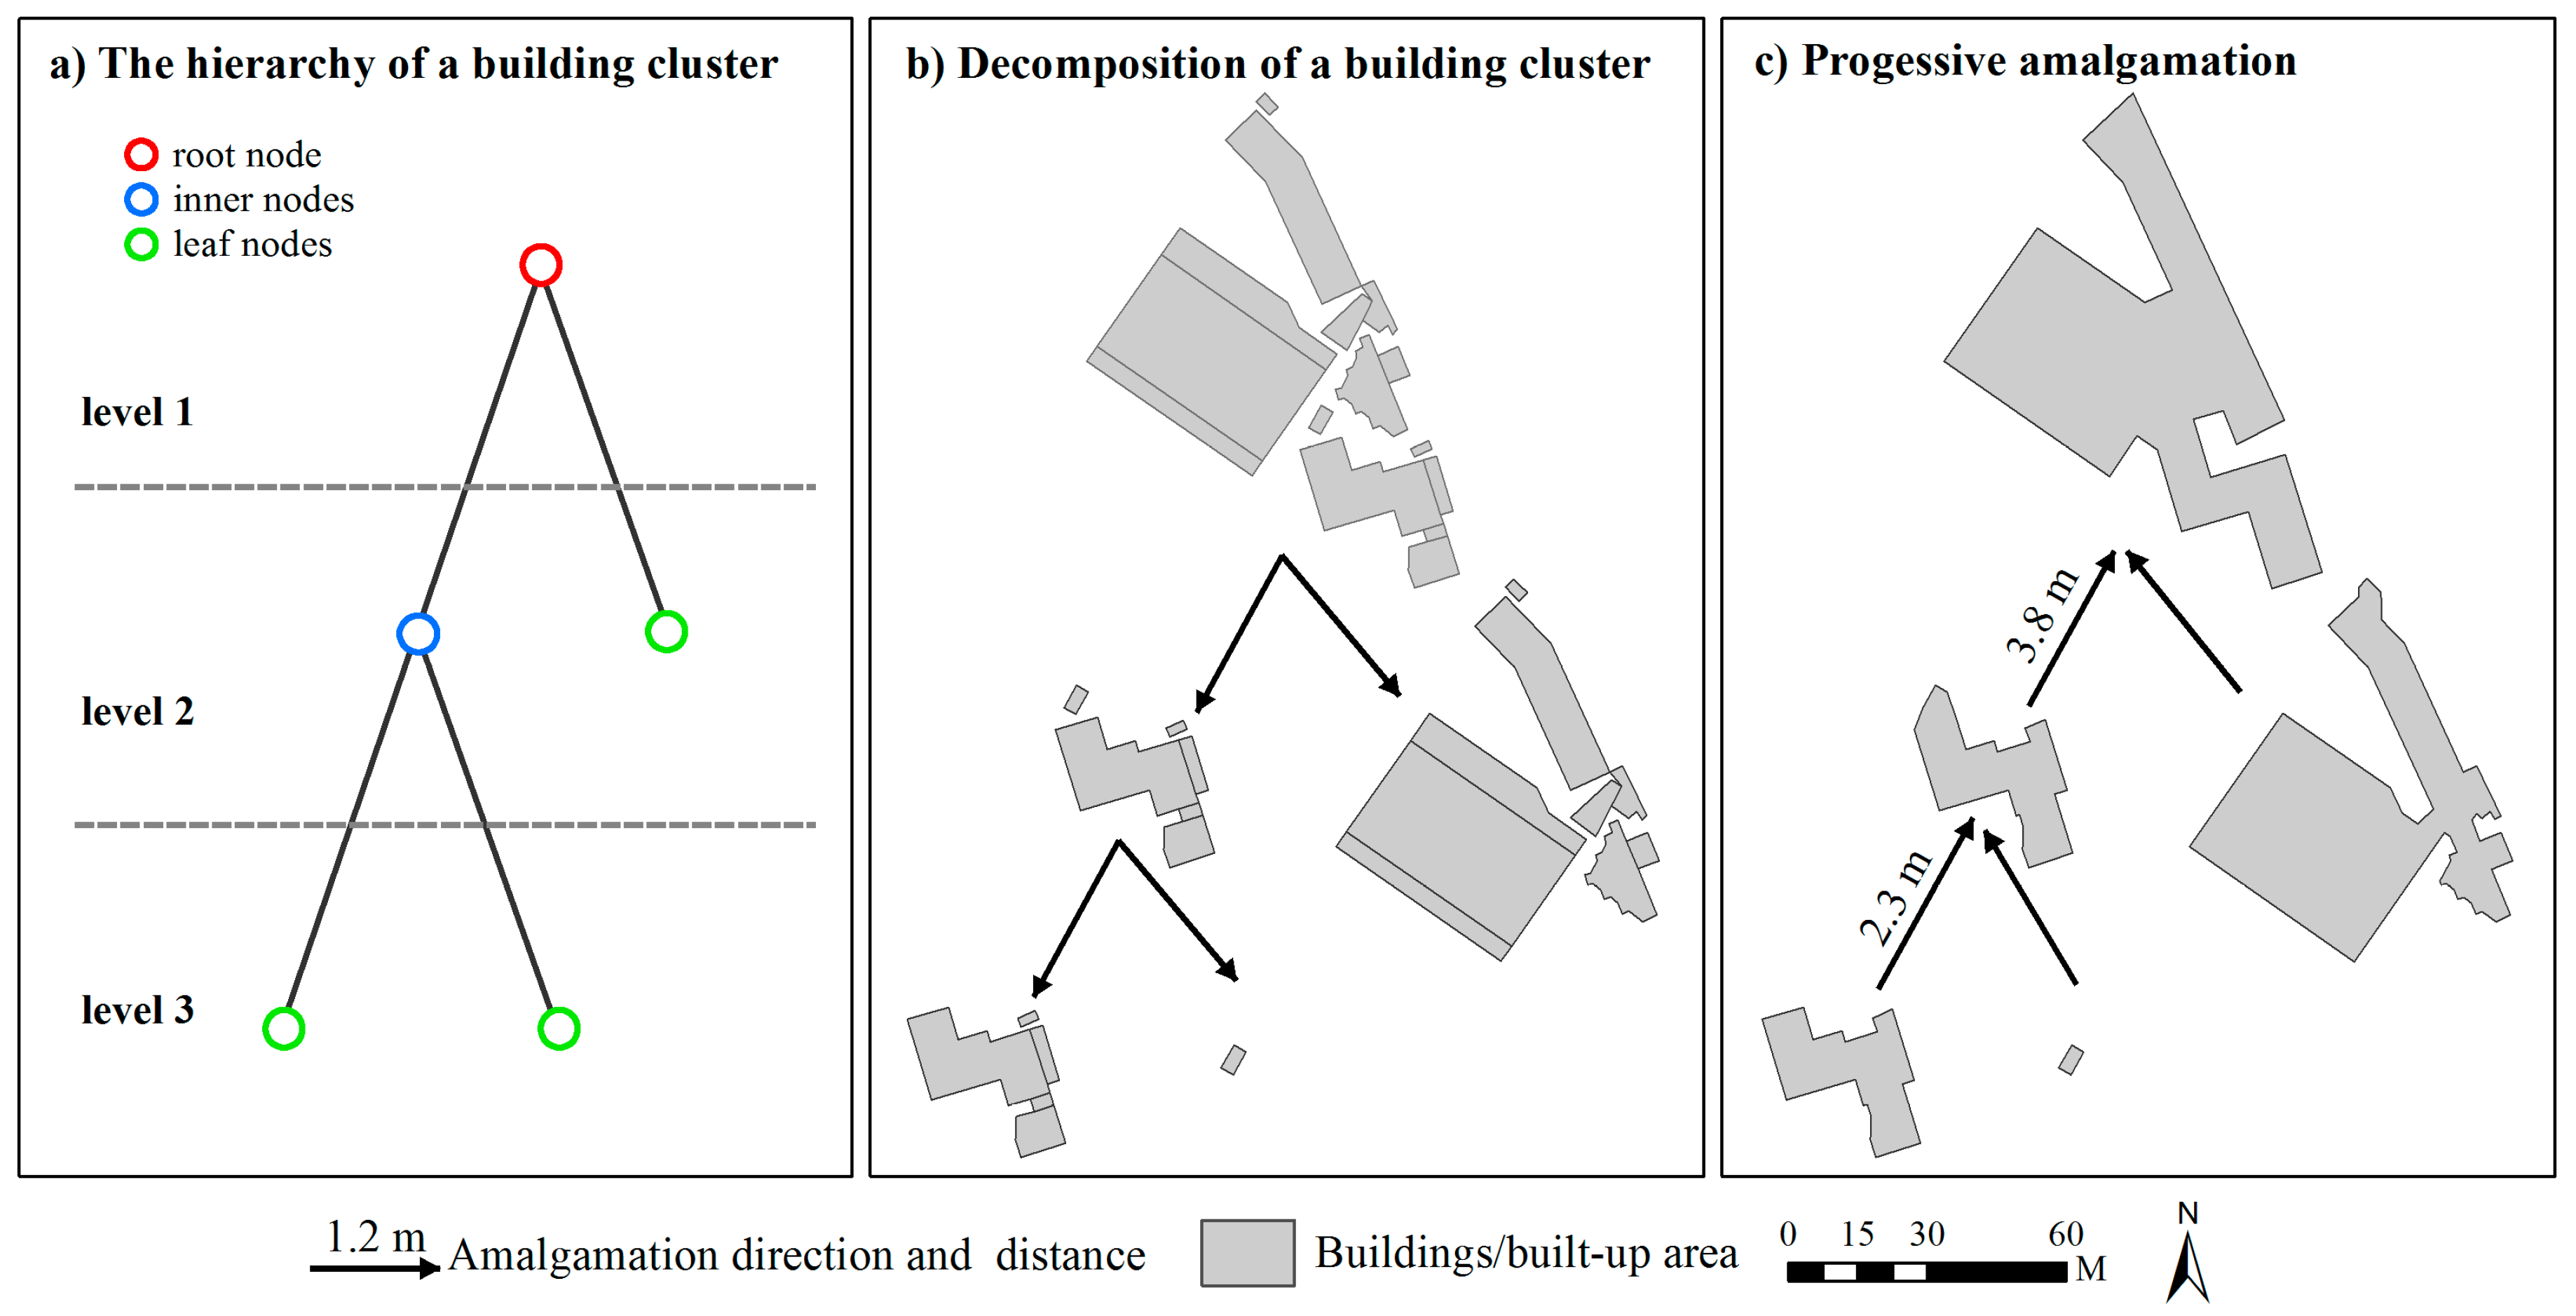
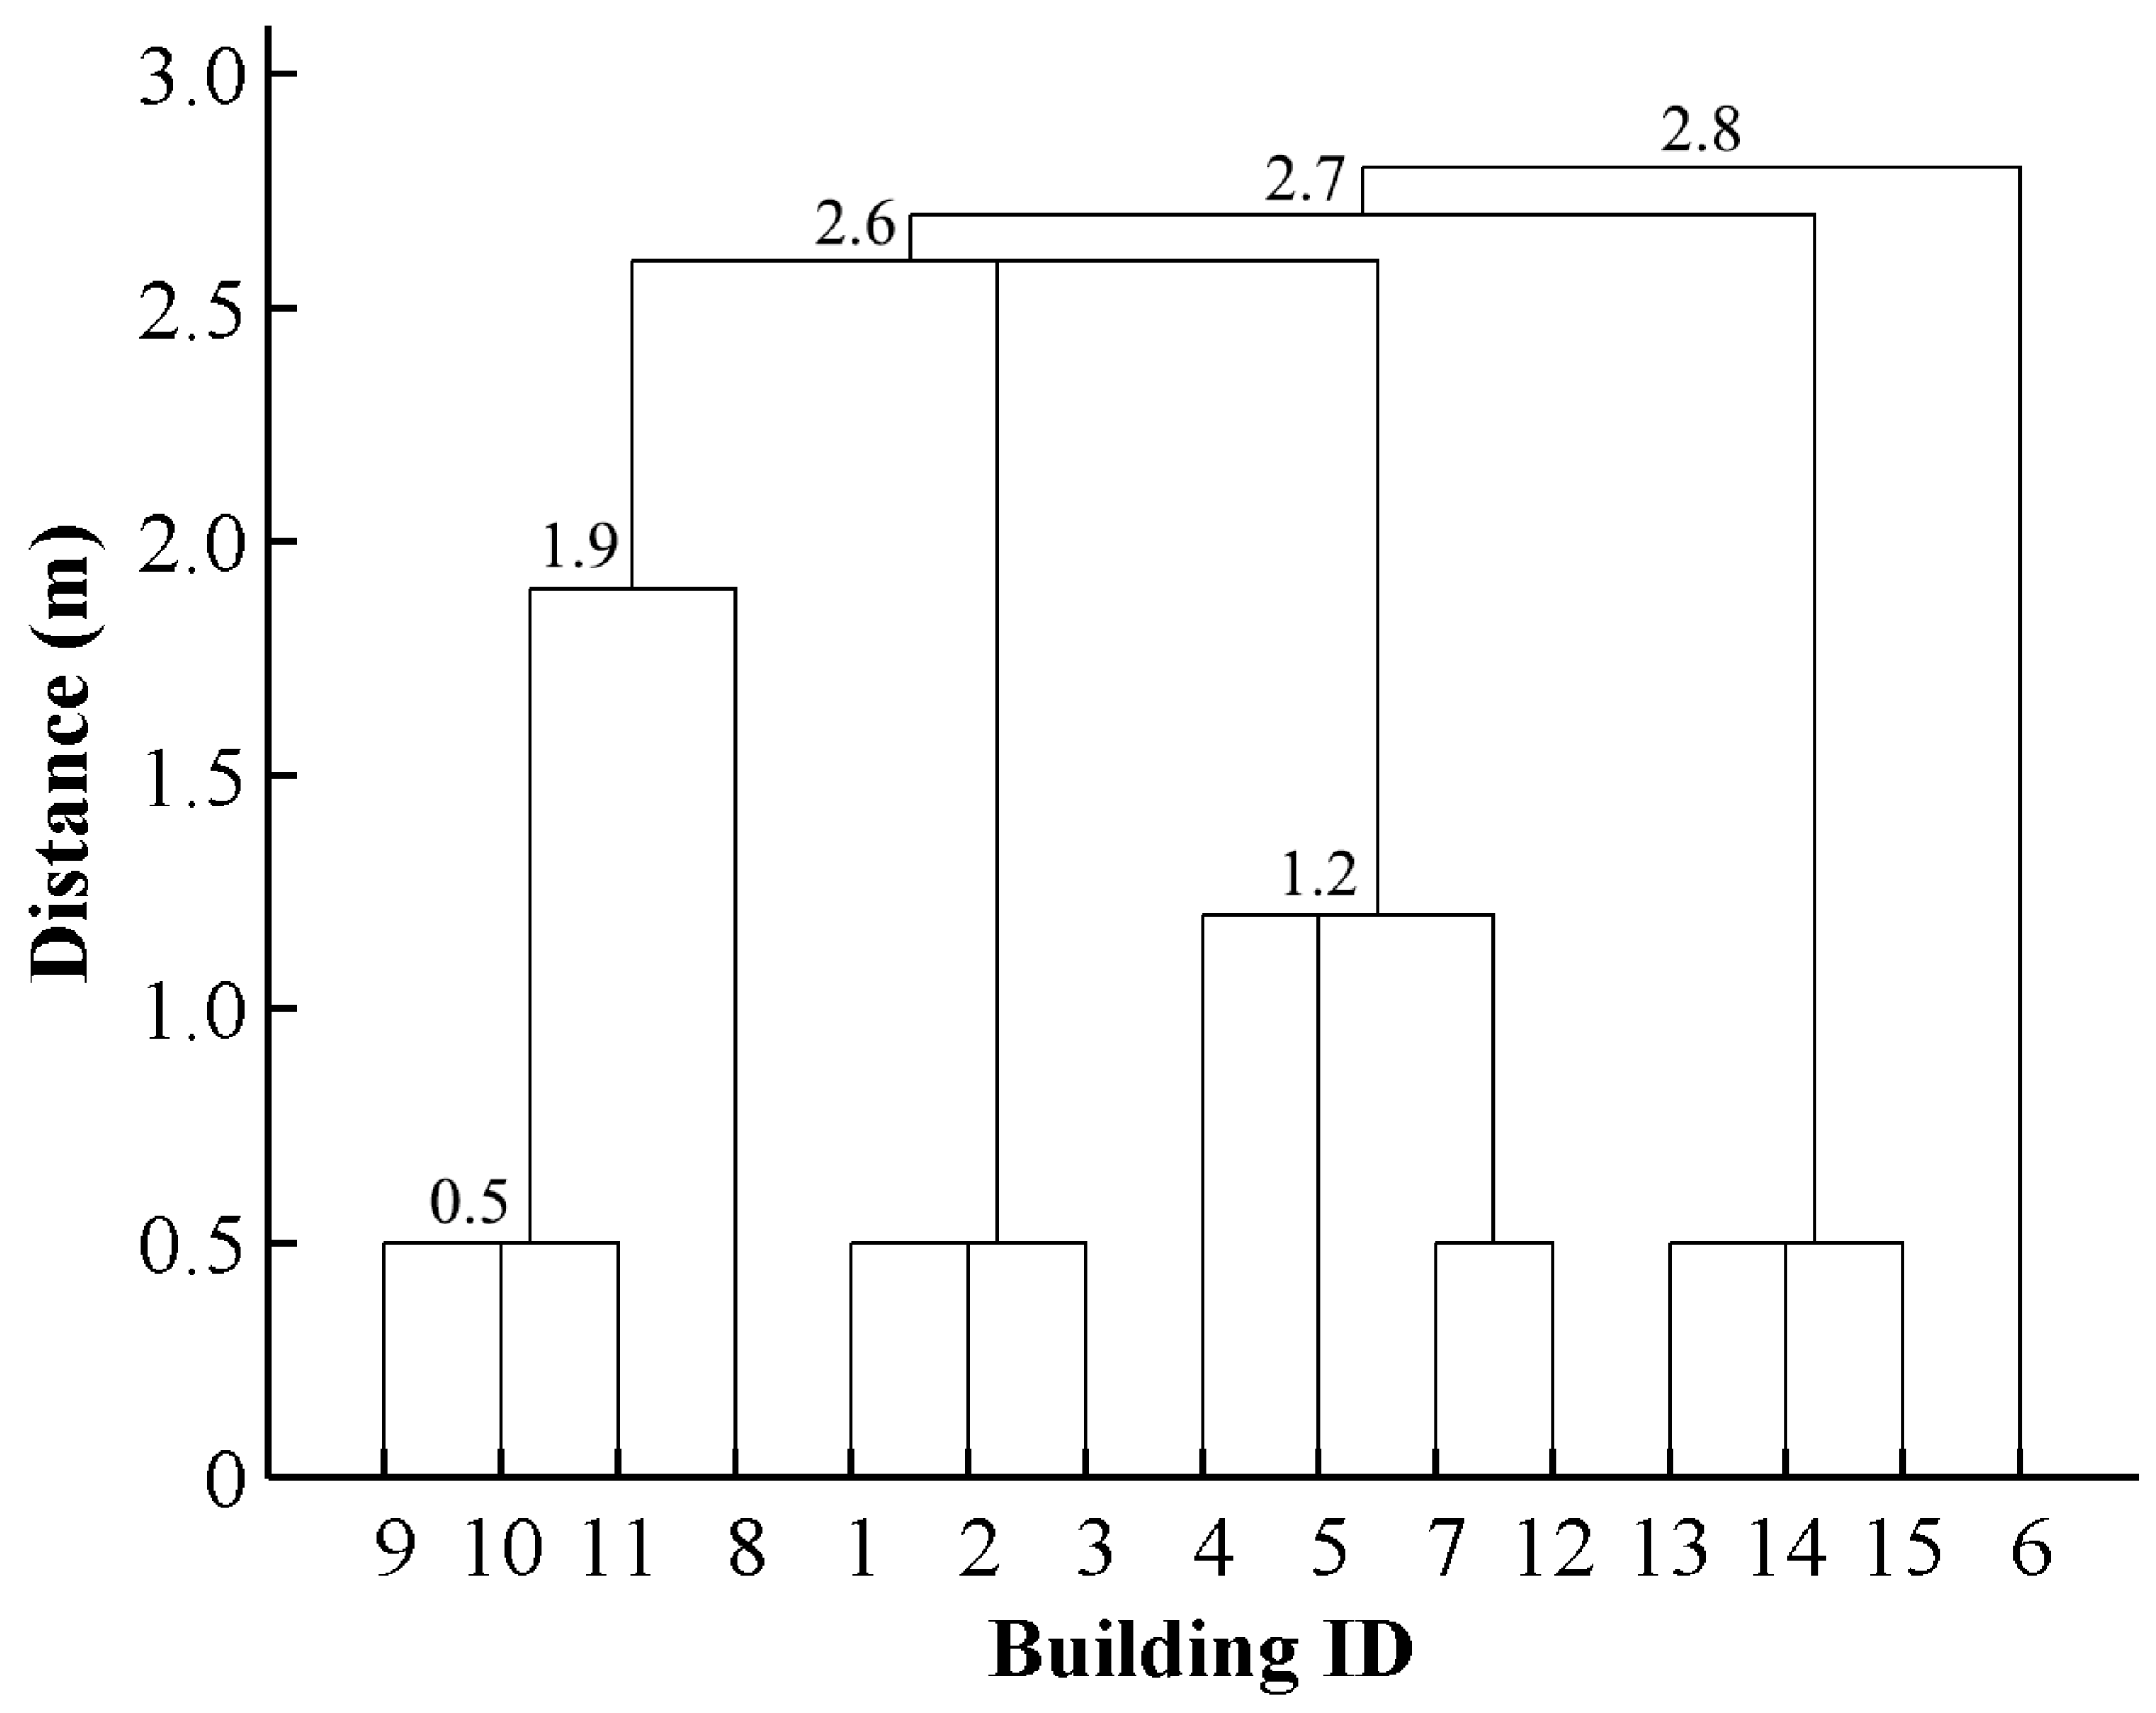
2.2. Deriving Hierarchies by Segmenting Building Clusters

In this study, we suppose that building clusters can be segmented into scaling subgroups based on certain homogeneous criteria, which leads to vertical relationships among subgroups, and thus a hierarchy of each cluster can be derived (Figure 2a). Such subgroups are obtained by using the aforementioned graph partitioning process, whereas the stop condition is determined by the standard deviation of distances instead of the classifier. That is, if the standard deviation of mean distances (Equation (1)) of a building cluster is higher than a given value, the cluster is further partitioned into multiple subgroups; otherwise, the cluster is not. The distance criterion is employed because the elimination of triangles within Delaunay triangulation during the amalgamation process is based on distance tolerance. This process is continued until all subgroups satisfy the condition. A tree data structure is developed to store the hierarchy of a building cluster (Figure 2a). Three kinds of nodes are recognized in the tree of a building cluster: the root node (the top node), inner nodes, and leaf nodes. The root node corresponds to the initial building cluster. An inner node denotes a subgroup that can be decomposed into multiple smaller subgroups. A leaf node denotes a subgroup that requires no further partitioning, inner nodes belong to unique parent nodes and have several children, while leaf nodes have no children. Note that building subgroups represented by nodes at the same level may represent different scaling grouping results. For example, all leaf nodes can represent a grouping result at a given scale, whereas the nodes at level two can also form another scaling grouping result. As a consequence, it is possible to obtain various scaling grouping results from the tree, which is a prerequisite for generating the whole continuous spectrum of levels of detail (LODs).
The mean distance of adjacent buildings is derived as follows:
d = d i , j = h i , j , k × l i , j , k l i , j , k   ,
where h i , j , k denotes the height of the triangle k with the base that falls in either adjacent building polygon, l i , j , k denotes the distance between the two middle points of the sides of a triangle k that links two adjacent buildings.

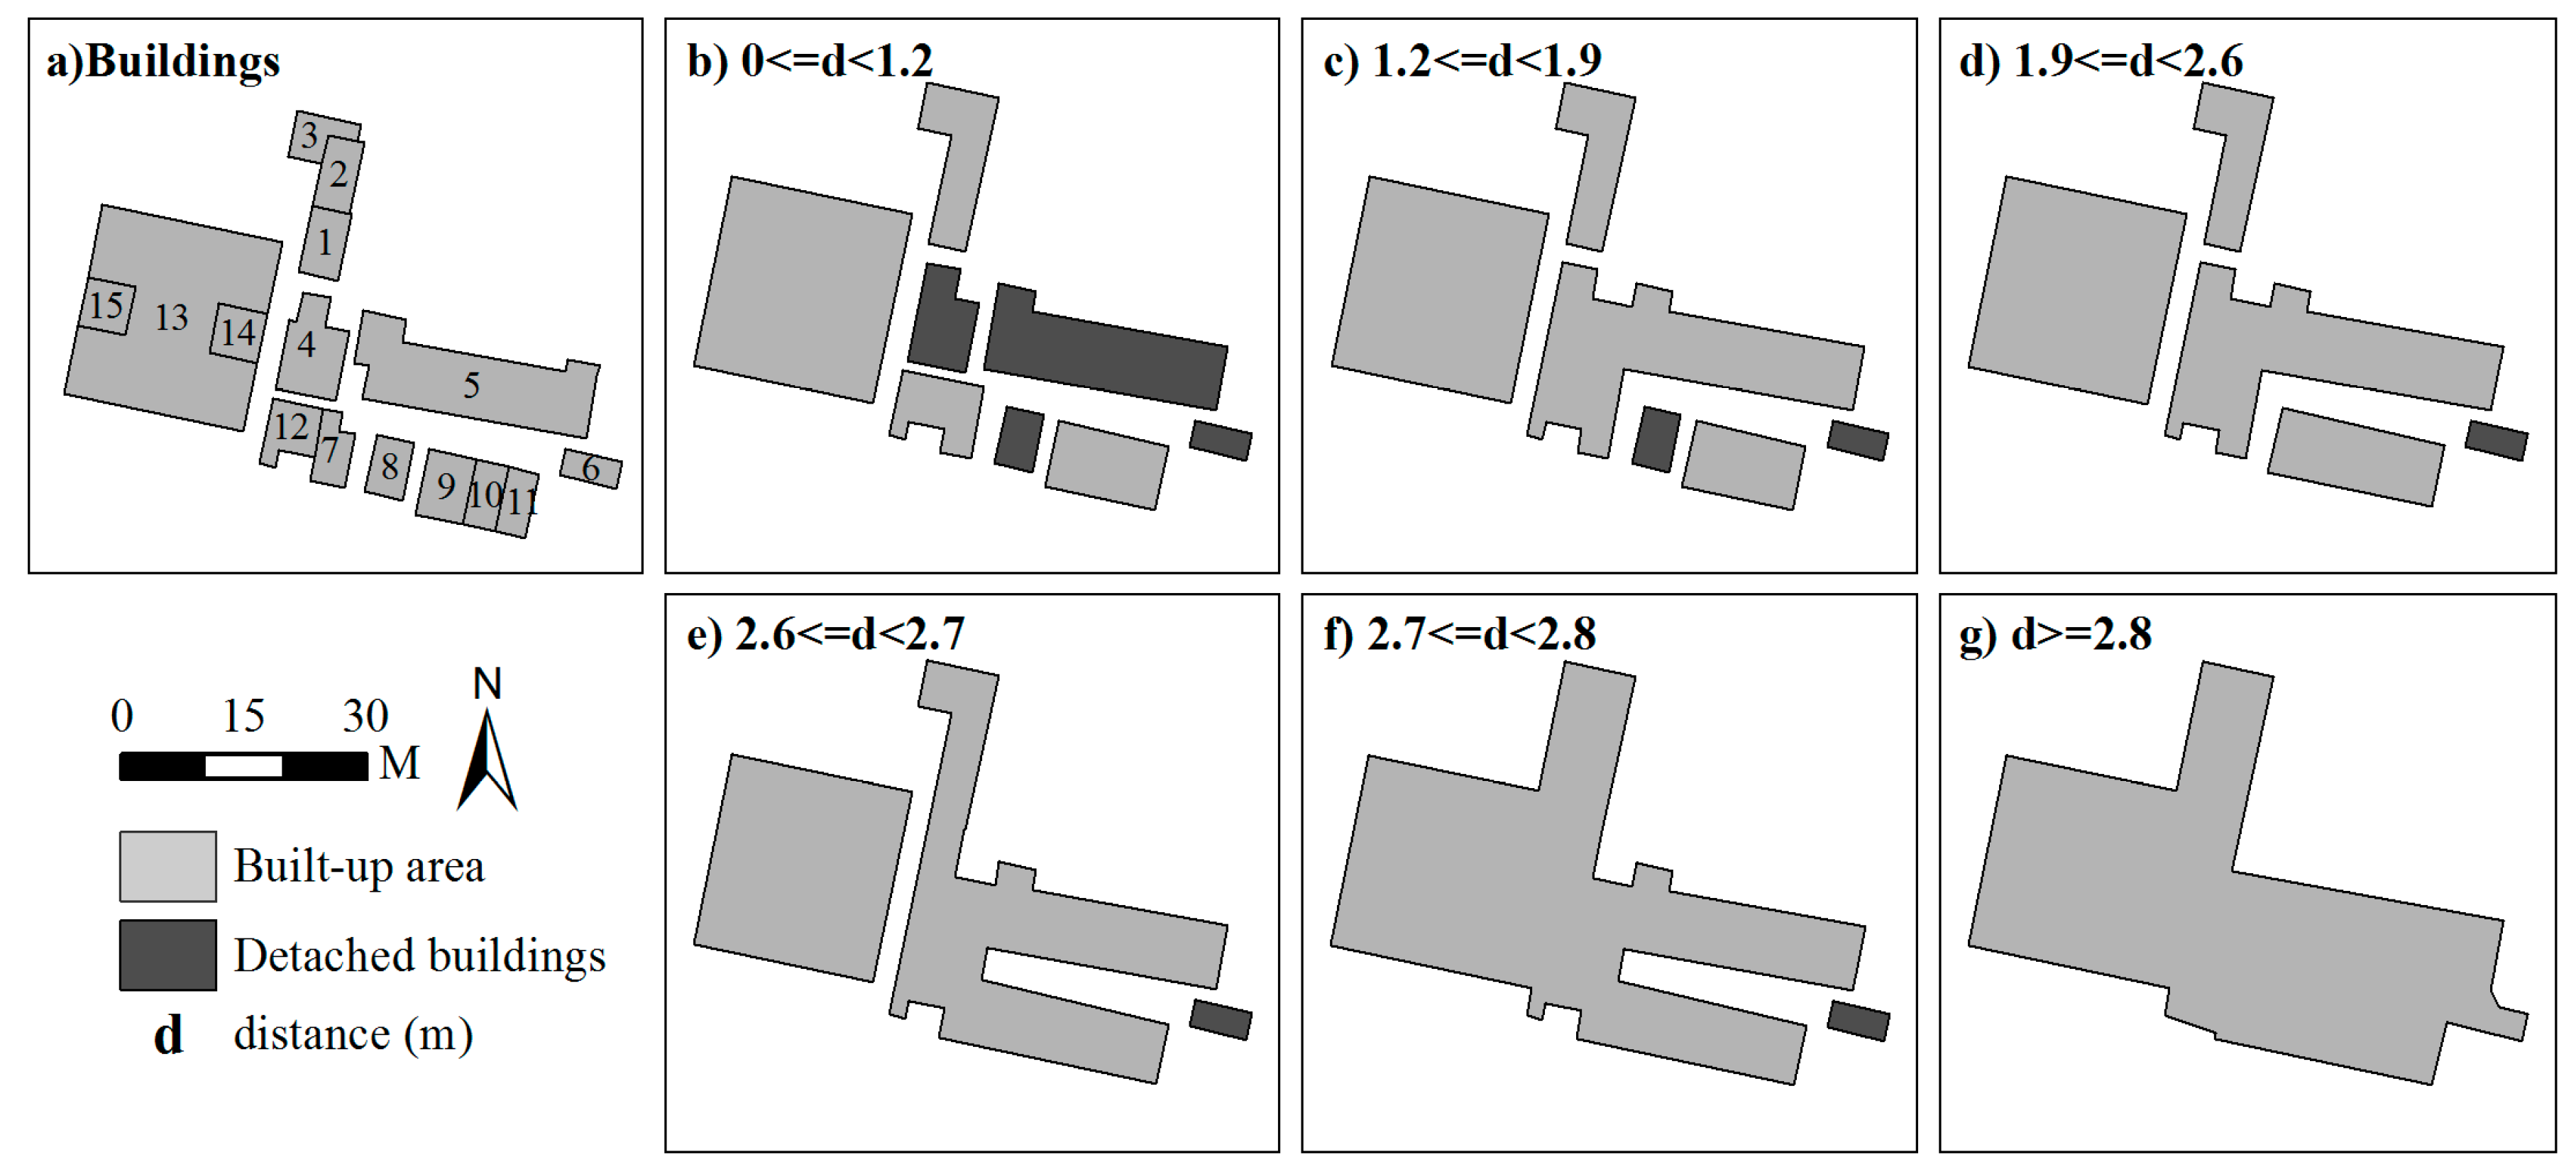
2.3. Progressive Amalgamation Based on Hierarchies of Building Groups

Since hierarchies of building clusters are composed of scaling subgroups, it is intuitive that the amalgamation of a building cluster would be performed in a bottom-up fashion. That is, buildings within the bottom-level subgroups are amalgamated into objects first, then they form the next-level objects that require amalgamation. This procedure is iteratively executed until no unprocessed subgroup remains. Thus, the amalgamation of building groups is performed in a progressive fashion (Figure 2c). In this process, the aggregating distance is a critical parameter that could influence the generalization results and computational efficiency. The aggregating distance determines whether a triangle that connects two adjacent buildings is to be deleted or not. The remaining triangles will be merged with their connecting buildings into an object. These remaining triangles will influence the shape and the area of a merged object. If the distance is set too large, some significant details of the contour of a building cluster would be lost during amalgamation, which would result in a simpler amalgamated object whose whole area is out-of-balance in comparison with the original buildings. Conversely, if the threshold is set too low, some redundant details are retained, possibly even resulting in some single buildings that are not aggregated into the amalgam. To overcome such deficiencies, a dynamically computed threshold would be more appropriate. More specifically, the aggregating distance is to be set to the maximum distance between adjacent buildings within a homogeneous subgroup in every iterative fusing process. To get the maximum distance, a minimum spanning tree (MST) [12,29] is constructed for each building subgroup. In each MST, nodes represent buildings, and edges between nodes denote the nearest-proximity relationships between objects (buildings) based on distances between buildings (Figure 3c).
The procedure for amalgamating a homogeneous building group consists of three key steps: (1) A constrained Delaunay triangulation (CDT) [30,31] is constructed for all buildings within each individual block (Figure 3a). Before creating the CDT, it is necessary to add some points on the line segments of buildings and roads at an interval to avoid producing narrow triangles [10]. However, not all triangles are useful for amalgamating building clusters such as those only connecting one building, and those connecting buildings and roads simultaneously. Thus, after removing the above triangles, the revised CDT can be obtained (Figure 3b). (2) Triangles connecting buildings within the same group are filtered based on the maximum edge of the MST (Figure 3c). That is, if the height of a triangle is over the maximum distance of the group, this triangle is removed. (3) Remaining triangles are used to fuse the buildings within a group into an object (Figure 3d). In this way, the contour, the whole area, and the position accuracy of amalgamated objects are well maintained during fusing, as some distinct concavities are not filled in (Figure 3d).
Since the amalgamation algorithm generates amalgams with very granular geometries, two operations are required to modify them such that they satisfy cartographical constraints. A simplification operation is first carried out on the resulting amalgams, which make complex shapes simpler and smoother by filling in small concave corners while preserving the characteristics of features [23]. As rectangularity is an important characteristic of buildings, a rectangularity operator is applied to the post-simplification objects to convert near-rectangular interior angles to right angles. This operator is implemented by drawing a line perpendicular to the longer edge from the corresponding vertex connecting to the shorter edge and regenerating the shape of the polygon [3].

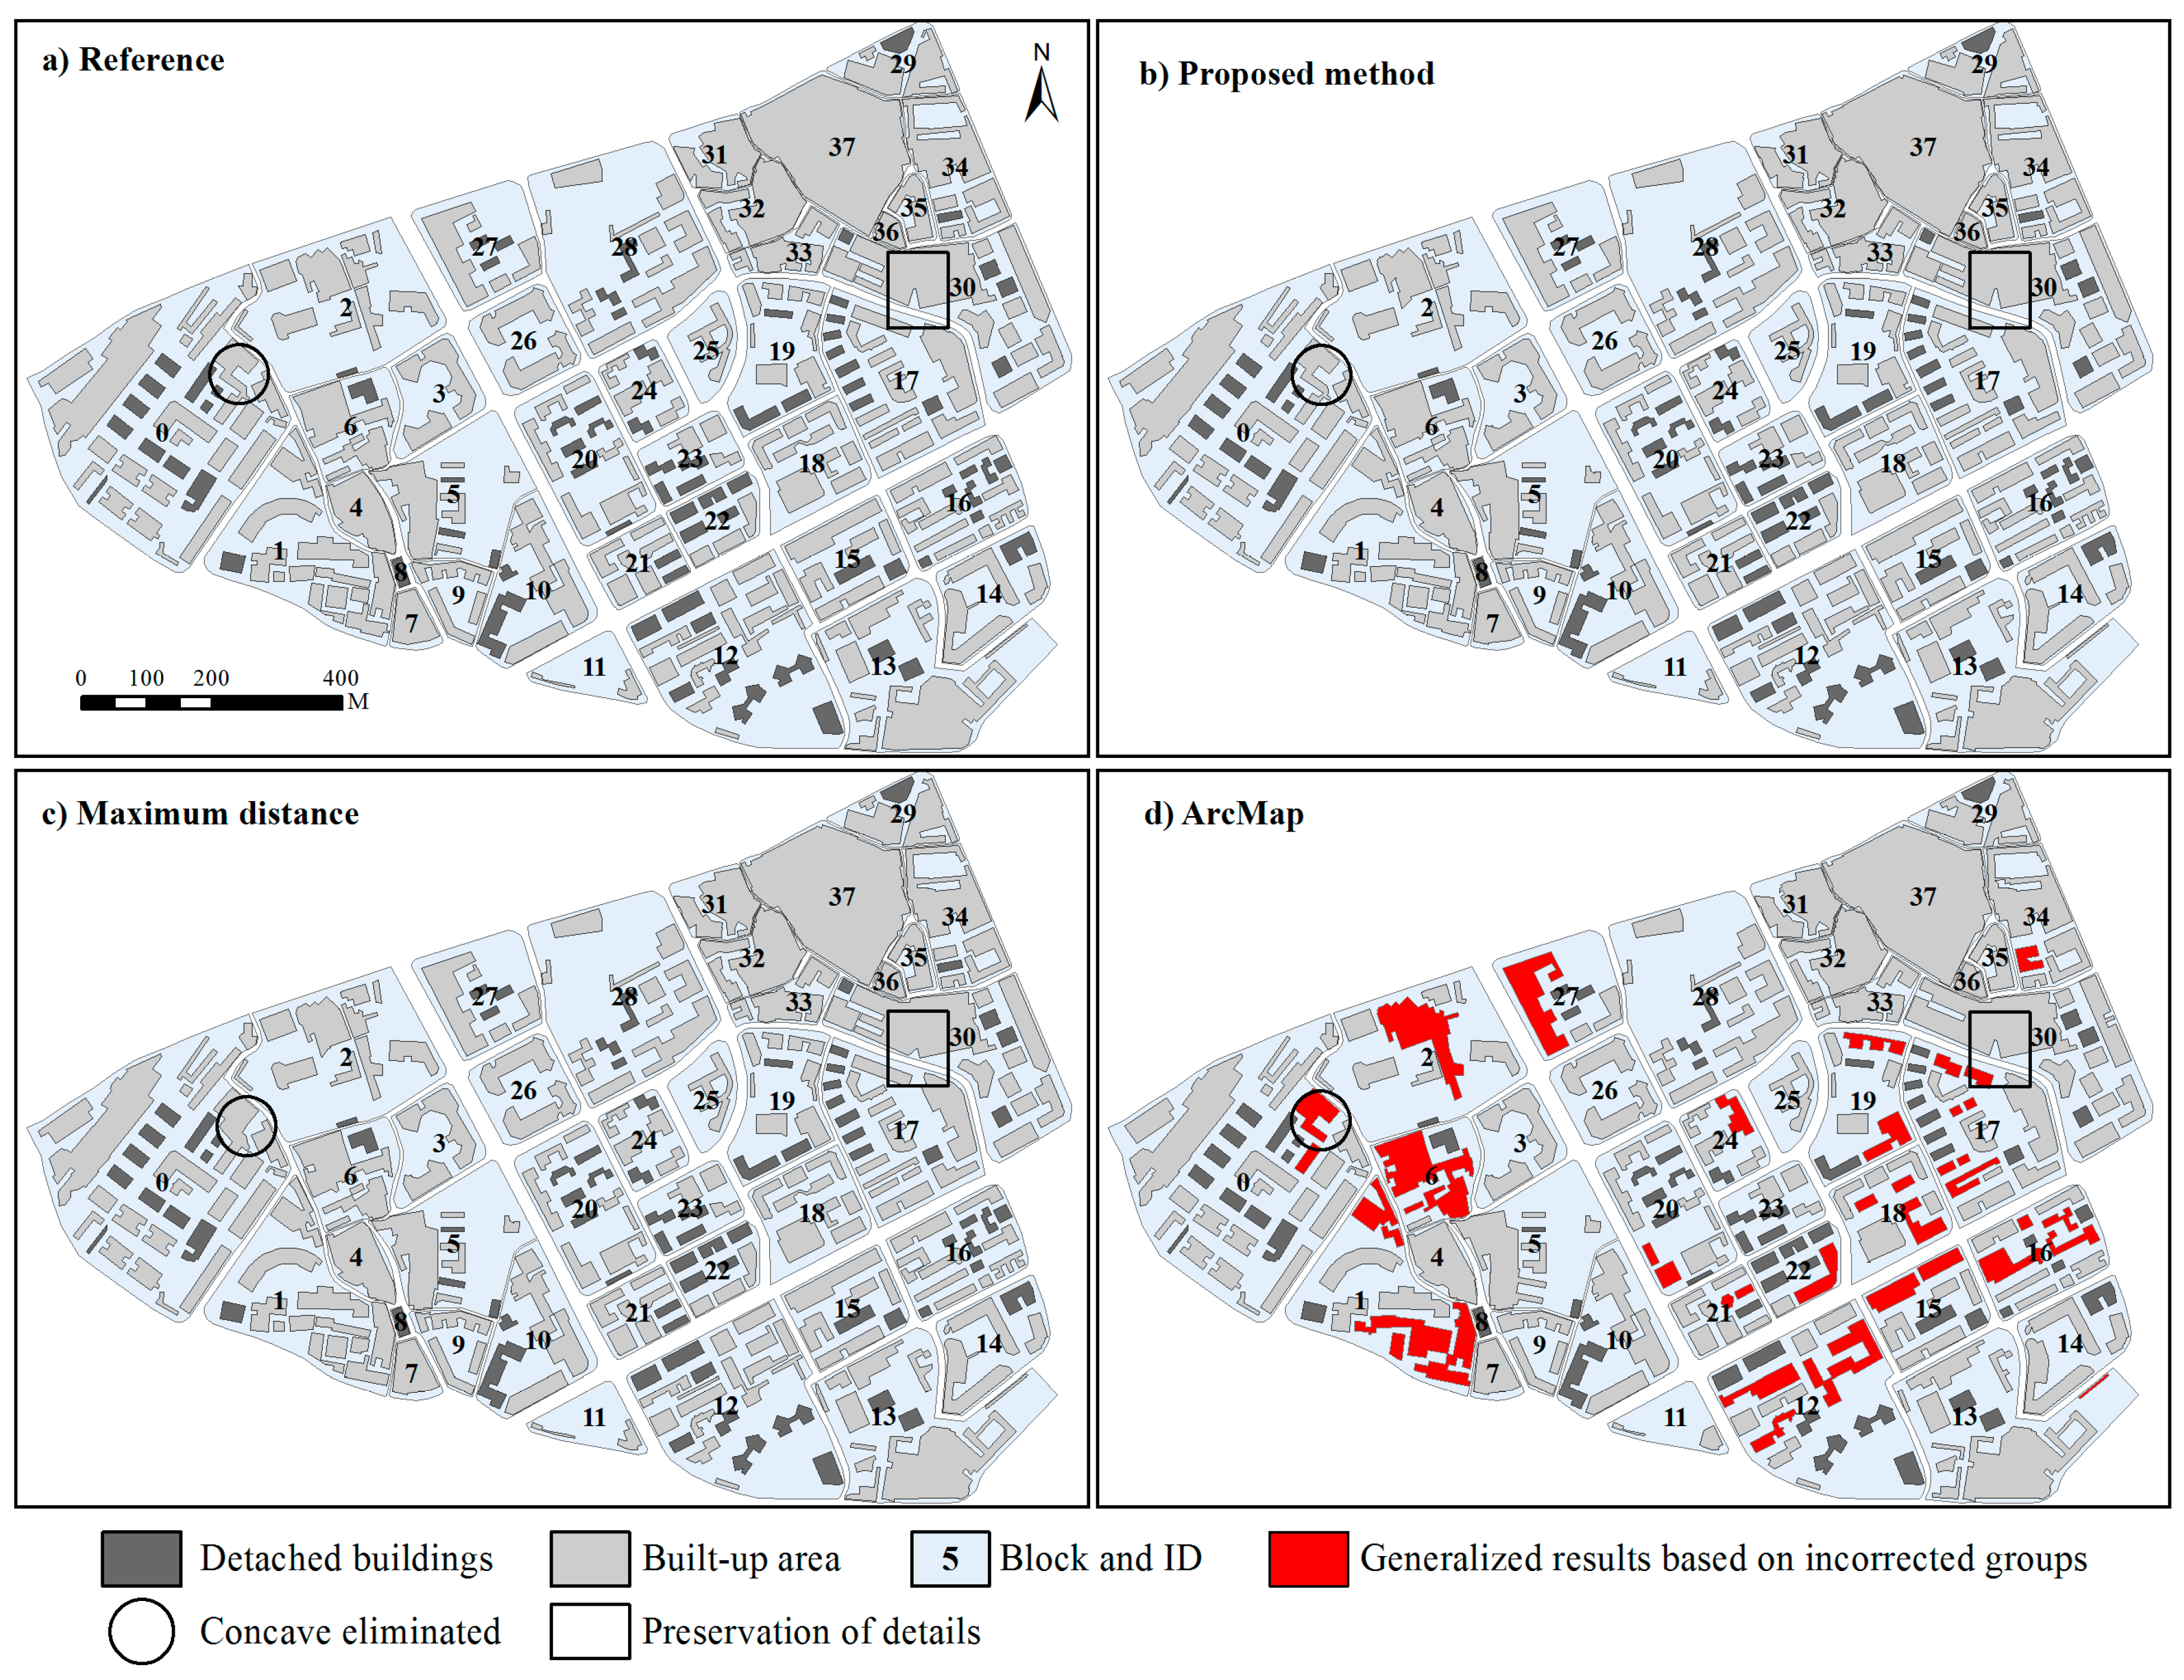
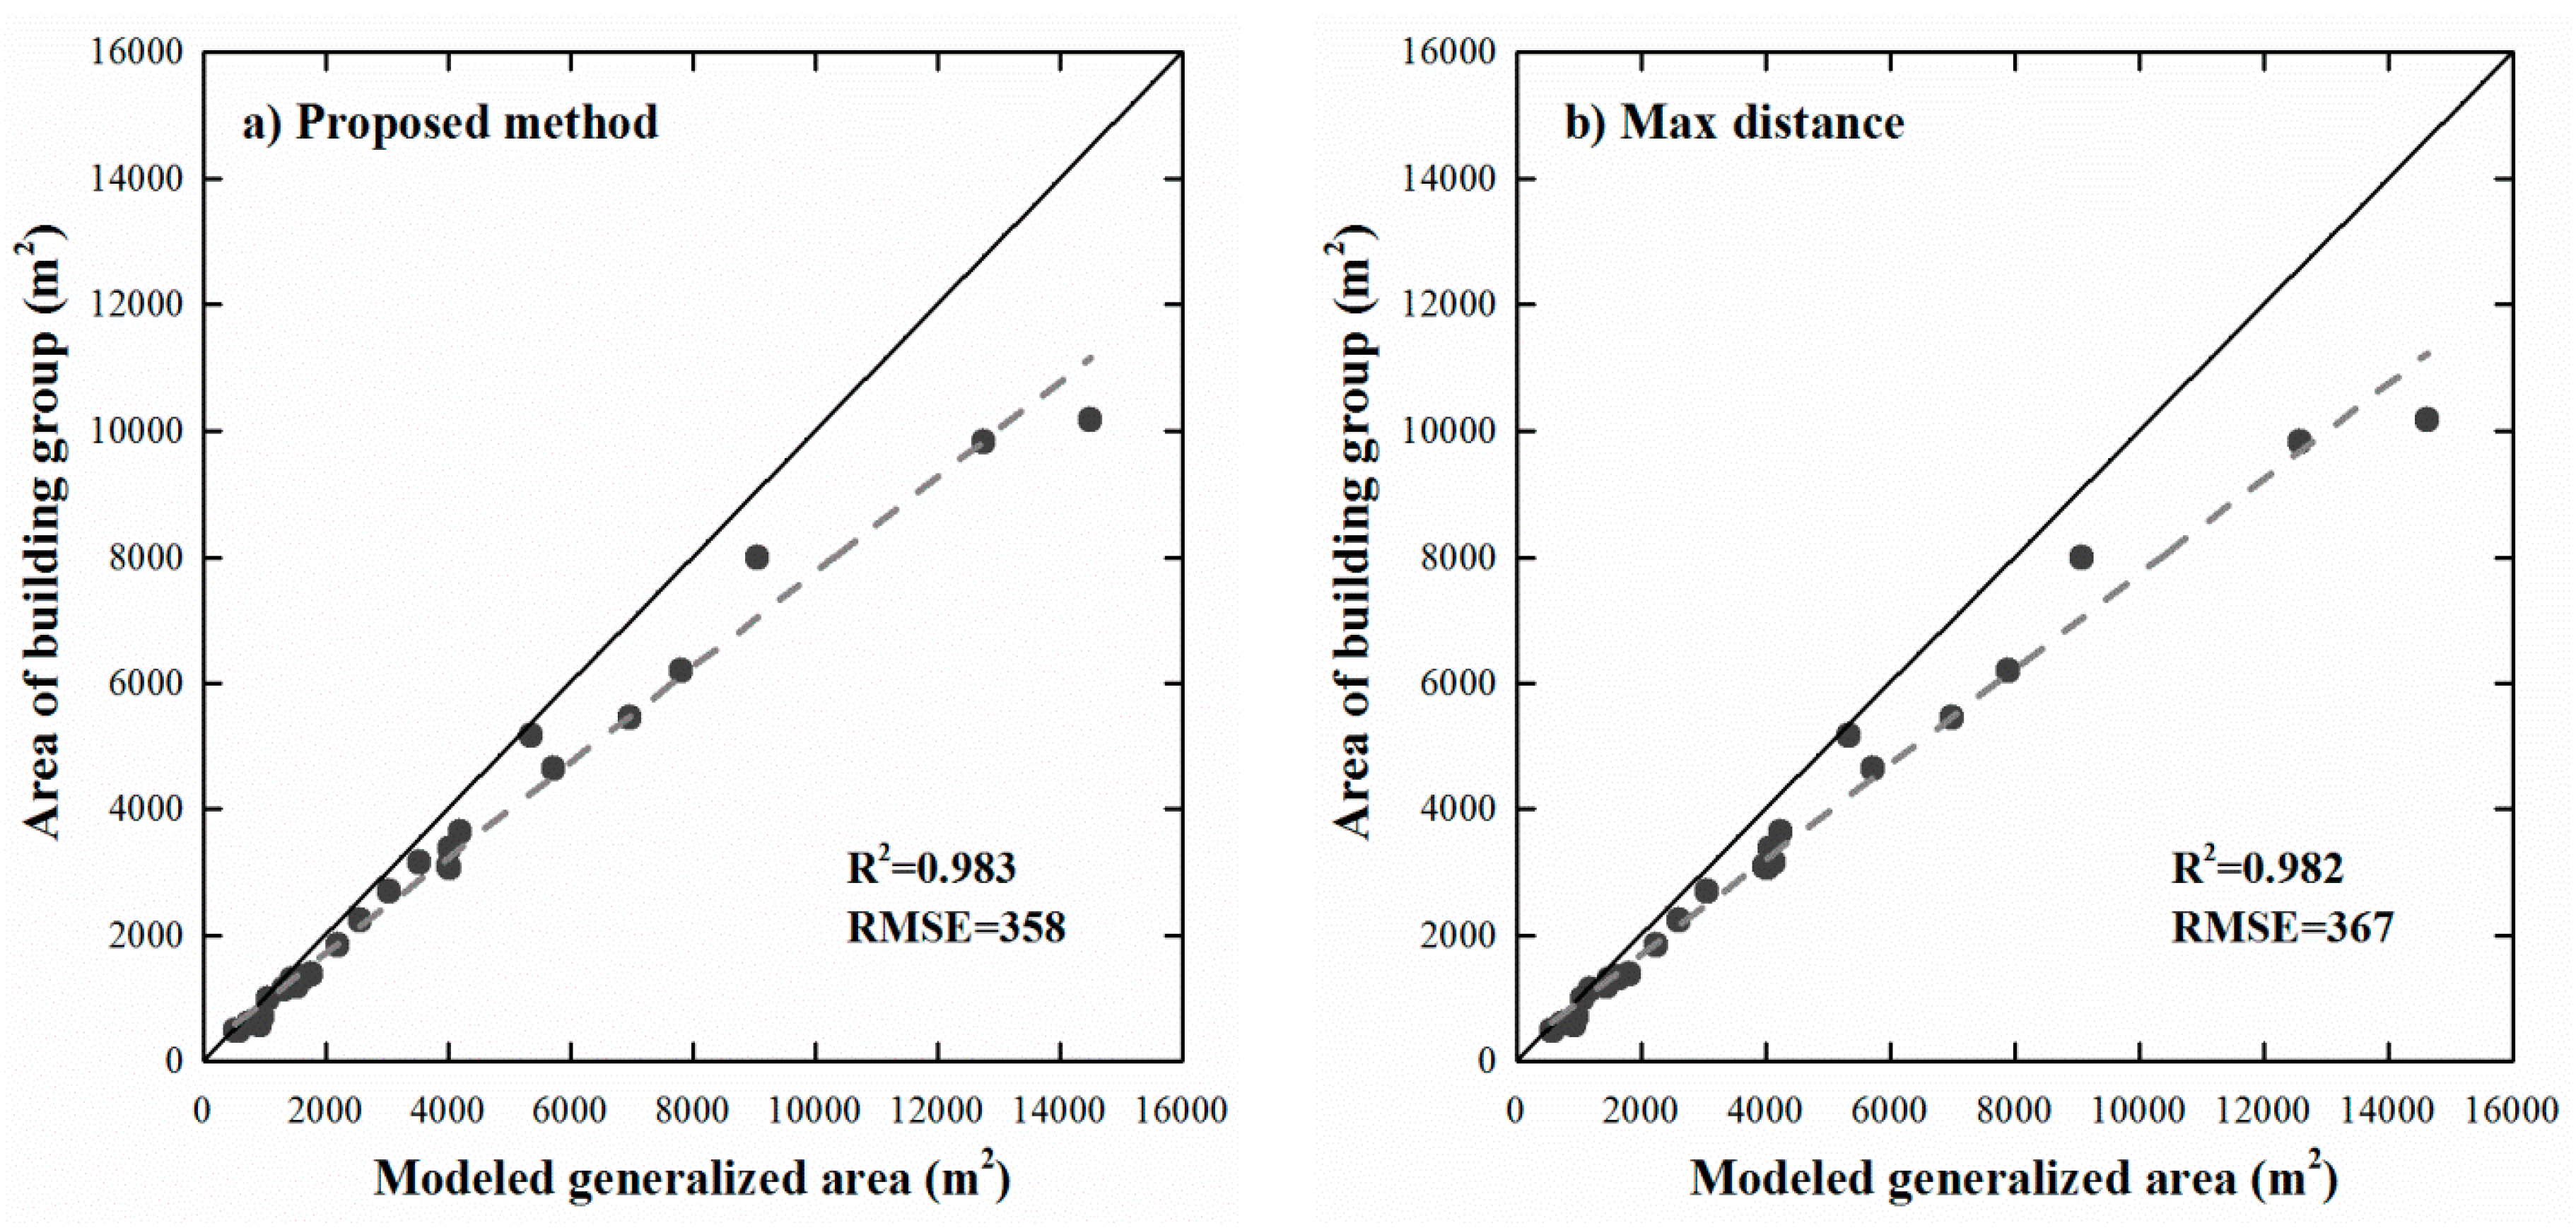
2.4. Method Comparisons and Assessment

To understand the robustness of the proposed method based on comparative studies, the results derived by the same aggregation algorithm, but with its aggregating distance set to be the maximum distance of each building cluster (Max distance), the results generalized by ArcMap Aggregate Polygons tool (ArcMap) and the manual generalization map (Reference) are taken into account. The maximum distance of each building cluster is set to be the aggregating distance in order to ensure that all buildings can be merged into one object, which is commonly followed in previous studies [23]. Aggregate Polygons is one of the cartography tools in the ArcMap software, which is developed by an international supplier of geographic information systems (GIS), the Environmental Systems Research Institute (ESRI, Redlands, CA, USA). Although it is without building grouping, the ArcMap Aggregate Polygons tool is widely used in daily cartography as well other vector processing. When implementing this function, we need to input features—specify an aggregating distance greater than zero—and set the output file. Aggregation will only happen where two polygon boundaries are within the specified aggregation distance to each other. Further details regarding this tool can be found in its help file [32].
Since the amalgamation process mainly consists of building grouping and amalgamation execution, the assessment in this study includes two aspects of accuracy assessment for pattern extraction and quality assessment for amalgamated results. Building patterns visually recognized by humans and manually generalized results are used as corresponding reference data for evaluating the effects of the proposal method. The accuracy assessment is based on the ratio of corrected groups recognized by the proposed method to referenced groups, which is commonly followed in the assessment of building pattern recognition [33]. Assessment of the amalgamation results involves evaluating the avoidance of short gap distance, the balance of the whole area, and the preservation of distribution Gestalt principles and square shapes [10]. This stage essentially assesses geometric quality and integrity based on certain constraints for a given scale. Considering the technical specifications adopted and published by the Standards Press of China [34] and previous studies on map generalization, the assessment of amalgamation results are focused on legibility constraints and the constraints for the preservation of appearance. Specifically, for representation at the scale of 1:10,000, the area of a feature should be not smaller than 200 m2 on the ground, the minimum distance between objects should be more than 2 m, the minimum area of a hole inside a polygon should be more than 600 m2, and the length of the shortest edge that can be represented on a building is 3 m. For preservation constraints, the constraint with regard to shape preservation is considered. The assessment of shape preservation is based on the rationale that the shape of a fitted polygon is determined by its outline (edges). This is accomplished by buffering each point of building features using different buffer distances and calculating the percentage of points whose buffers intersect the buildings within corresponding clusters. For representation at the scale of 1:10,000, the percentage of points must be higher than 90% under the buffer distance of no more than 2.3 m [35].

3. Test Data

For this research, an area located in the middle of downtown Guangzhou, Guangdong, was selected (Figure 4). The spatial dataset at the scale of 1:2000 was provided by the Guangzhou Urban Planning and Design Survey Research Institute in the Guangdong province in China. The provided spatial dataset includes buildings and a road network in vector format. There are 38 building blocks and 3017 buildings in the study area. Visually, the distribution of buildings is complex, and various patterns are recognizable. For example, unstructured group patterns with high density are easily recognized by narrow roads across blocks (e.g., Block 29, Block 31, and Block 32) from “urban villages” (a unique phenomenon in Chinese urbanization processes wherein villages exist in the core areas of well-developed large cities). In addition, building group patterns such as linear patterns and L-shaped patterns can be identified from the blocks with urban landscapes that were well designed (e.g., Block 17, Block 18, and Block 19). Accordingly, this dataset provides an ideal study case that is representative of the complex urban environment in southern China.

4. Results and Discussion

All experiments were performed on a personal computer with an Intel(R) Core(TM) i5-4460 CPU (central processing unit) and a memory of 8 GB. All algorithms proposed in Section 2 were realized using C# on Microsoft Windows 7 (×64). Component libraries and tool libraries of ArcGIS Engine 10.1 were applied to developed related algorithms.
Figure 5 presents four 1:10,000 generalized results derived by using different methods. Compared to manual generalization results (Figure 5a), some difference can be identified from the generalized results derived by automatic methods (Figure 5b–d). For example, discernible details of the generalized results derived by the proposed method were maintained as much as possible, whereas those of the results generalized by group maximum distance were eliminated (built-up area marked with black rectangles in Figure 5c). These details make the contours of generalized objects more similar to the outlines of the corresponding building clusters. In addition, some open spaces connecting to roads are preserved in the generalized results derived by using the proposed method, while the method using group maximum distance would fill these open spaces during the amalgamation (built-up area marked with black circles in Figure 5c). Since it is without building grouping, the ArcMap tool would cause the buildings within multiple distinct clusters to be merged into one big object (built-up area colored red in Figure 5d), demonstrating that building grouping is essential to the amalgamation of building clusters. Accordingly, the subsequent analysis mainly centers on the generalization results derived by using the other two automatic methods.
Table 1 provides a brief summary of generalized objects derived by the different methods. The number of generalized objects are the same, except for that of the results generalized by using the ArcMap tool which often results in distinct building clusters being merged into a large one (e.g., the objects remarked red in block 1 of Figure 5d). Moreover, the minimum distance between neighboring objects derived by the ArcMap tool is too small (0.36 m) to distinguish them at the target scale. Almost all the smallest objects derived by the different methods satisfy the smallest area constraint of not less than 200 m2 on the ground. The results derived by the proposed method are much better than those of max distance in terms of root mean squared errors (RMSEs).
Figure 6 displays the number of levels within the hierarchy of each building cluster. To facilitate this discussion, a cluster might be viewed as its hierarchy. Visually, a higher level leads to fewer corresponding building clusters. Moreover, most building clusters recognized at the target scale only have one level (i.e., they require no further partitioning and have no subgroup). At first glance, the outlines of building clusters with more than one level are more complex than those of building clusters with only one level. However, upon careful examination we can find that the generalized results (Figure 5) derived from the building clusters with one level are almost the same, even though they were amalgamated by different methods. Accordingly, if there is a difference among the generalized results derived by different methods, it could result from the building clusters whose hierarchies include more than one level. For example, the two generalized objects (Figure 5b,c) generated from the same building cluster with four levels in block 0 (Figure 6) are different in detail. This will be analyzed further in the sections that follow.
Figure 7 plots the mean difference (i.e., the difference between all total building areas and the total area of generalized objects, normalized by the total building area) with each level number, which further explains the differences between generalized results that were generated by using the different methods. Overall, the mean difference becomes greater when increasing the number of levels for both methods. For building clusters with one level, the mean differences of generalized objects for the two methods are the same and are at their lowest, demonstrating that the gaps between the two results lie in those building clusters that have more than one level. When building clusters are complex (i.e., have multiple levels), the gap between the two methods widens, indicating that the areas of generalized results derived by using the Max distance method are more prone to being out of balance in comparison to the original buildings. However, during the generalization of building clusters, it is necessary to retain the balance of building representation areas between scales [10]. Accordingly, we should pay more attention to the complex clusters with multiple levels, and may amalgamate them progressively when generalizing maps.
Figure 8 is a plot of the areas of generalized objects against the areas of the corresponding buildings within clusters. Note that only the building clusters with more than one level are taken into account. Overall, the regressions between the areas of generalized objects and the areas of corresponding clusters agree well, with coefficients of determination (R²) of 0.983 and 0.982 for the proposed and max distance methods, respectively. Their root mean squared errors (RMSEs) are 358 and 367 square meters, respectively, which are less than the minimum whole area of 600 m2, demonstrating that the proposed method is better than the method employing Max distance, and that the strategy of progressive amalgamation is appropriate for map generalization.
Parts of map objects should have a minimal size to be clearly legible, which is an important legibility constraint in map generalization [36]. Figure 9 plots the percentage of each length of polygon line segments. There is a small portion of line segments shorter than three meters, indicating that both methods need improvement. These defects of generalized objects may result from the rectangularity operator that is performed on post-simplification objects. However, it is apparent that the presented method still performed better than the max distance method. In addition, from Figure 8 we can see that polygons derived by the proposed method have a lower deviation of the area of generalized objects from that of the original buildings. Normally, if the area of a fitted polygon must be close to that of a cluster, the more short line segments the polygon has, the better the generated polygon will fit the cluster. Thus, from the two figures we can reasonably infer that the Max distance method may result in more short edges which deviate from the outlines of building clusters. This may be because some large V-shaped concave corners of building clusters are almost filled (buildings marked with rectangles in Figure 5c) by the maximum distance method. These line segments can be regarded as the “false” edges of fitting objects.
During the amalgamation of building clusters, the outlines of fitted polygons should be similar to the initial states of clusters. The more points of a fitted polygon that are close to the outline of a cluster, the better the fitted polygon is. Figure 10 displays the percentage of points whose buffers intersect the buildings within corresponding clusters. Both methods achieved good results, as the percentage of points under the given buffer distance (no more than 2.3 m) is far higher than 90%. Moreover, from this figure we can infer that polygons derived by the proposed method present a higher compactness. This corollary is consistent with the above analysis that polygons derived by proposed method have a lower RMSE in area comparison (Figure 8).
As a preprocessing step prior to amalgamation, building grouping is essential to the effectiveness of the proposed method. Figure 11 shows the grouping results detected at the scale of 1:10,000 for the tested data. Buildings marked in sky blue with red outlines were grouped to the same clusters, whereas erroneous building clusters are marked in green with blue outlines. Visually, most buildings were correctly grouped in terms of patterns (e.g., linear pattern, L-shaped pattern, and high-density pattern), providing good preparation for the amalgamation of building clusters and demonstrating that the grouping method is effective in recognizing different building group patterns. Overall, the grouping method is able to detect 96.88% of the building group patterns correctly.
Since building clusters were decomposed into various scaling subgroups and progressive generalization was carried out throughout the whole continuous spectrum of subgroups, a side effect of this process is that intermediate generalized results are available. These results can form the continuous scale representations of buildings. They are called continuous scale representations because they were generated by continuous generalization [37], which leads to the representations of two adjacent scales without other intermediate generalized results. For continuous representation, it is critical to quantify the scale parameter. Here the maximal distance of each subgroup is used to quantify the scale parameter. When a value of this parameter is given, we can obtain a level detail of buildings (a generalized result) from the clusters whose maximal distances are no more than this value. Thus, the links among building clusters, generalized objects, and scale parameter values can be stored intrinsically; these links are often missing in multi-scale representations [38]. Figure 12 and Figure 13 present an example of how these links are derived. Note that they only give an impression of contents at different map scales without corresponding to correct user impression when zooming in on the map. In order to display the relationship between subgroups clearly, 0.5 m is set as the max distance of those subgroups whose buildings touch each other. Obviously, there are only six scaling representations for this set of buildings. The finest scaling grouping results consist of eight building subgroups with the scale parameter value (Max distance) of less than 0.5 m, whereas that of the coarsest scaling grouping results composed of only the largest group is 2.8 m. In addition, the scale of each level of detail is not fixed, but changes in a certain range—namely, the scale interval (Figure 13). In other words, the level of detail will not change in a scale interval.

5. Conclusions

This study set out to amalgamate building clusters gradually without a significant modification of geometry while preserving the details of generalized objects as much as possible under cartographic constraints. To accomplish this goal, this study proposed a progressive strategy of amalgamation based on scaling subgroups, which consists of a building grouping method, a method for deriving hierarchies of building clusters, and a progressive amalgamation algorithm.
We validated our approach on a vector dataset together with some quantitative measurements. Comparative studies first revealed that building grouping is essential to the amalgamation of building clusters. This is because the methods without building grouping would often cause the buildings within multiple distinct clusters to be merged into one large object. The research also showed that the generalized objects derived from simple building clusters that only have one level are almost the same, even though they were generalized by different methods. However, for the complex clusters that have multiple levels, the outlines of fitted polygons derived by the proposed method are more similar to those of clusters. The reason is that the proposed method progressively aggregates buildings within subgroups from the bottom level to the highest level and uses the maximum distance of each subgroup as the amalgamating tolerance in every iterative fusing process. Thus, significant modification of geometry is avoided while the details of generalized objects are preserved as much as possible during the amalgamation process. Taken together, these results suggest that we should pay more attention to the complex clusters with multiple levels and may amalgamate them in a progressive fashion when generating maps. In addition, the proposed method will prove useful in multi-scale representations, as it can generate continuous representations and provide links among building clusters, generalized objects, and scale parameter values.
Further tests are needed to improve the proposed method (e.g., testing it with more spatial datasets from different scales), and more generalization operators (e.g., displacement and typification) should be integrated in the process. More work is also needed to automatically calibrate parameters (e.g., homogeneous criteria and scale index) used in the presented strategy.

Acknowledgments

We would like to thank the anonymous reviewers for their constructive comments. This research was supported by the National Natural Science Foundation of China (Grant No. 41431178), the Natural Science Foundation of Guangdong Province in China (Grant No. 2016A030311016), and the National Administration of Surveying, Mapping and Geoinformation of China (Grant No. GZIT2016-A5-147).

Author Contributions

X.Z. and X.H. conceived and designed the experiments and wrote the paper; J.Y. helped with the experiments.

Conflicts of Interest

The authors declare no conflict of interest.

References

  1. McMaster, R.B.; Shea, K.S. Generalization in Digital Cartography; Association of American Geographers: Washington, DC, USA, 1992; pp. 17–69. [Google Scholar]
  2. Mackaness, W.; Burghardt, D.; Cécile, D. Map generalisation: Fundamental to the modelling and understanding of geographic space. In Abstracting Geographic Information in a Data Rich World; Springer: Berlin, Germany, 2014; pp. 1–15. [Google Scholar]
  3. Zhang, X.; Guo, T.; Huang, J.; Xin, Q. Propagating updates of residential areas in multi-representation databases using constrained Delaunay triangulations. ISPRS Int. J. Geo-Inf. 2016, 5, 80. [Google Scholar] [CrossRef]
  4. Zhang, X.; Ai, T.; Stoter, J.; Zhao, X. Data matching of building polygons at multiple map scales improved by contextual information and relaxation. ISPRS J. Photogramm. Remote Sens. 2014, 92, 147–163. [Google Scholar] [CrossRef]
  5. Brassel, K.E.; Weibel, R. A review and conceptual framework of automated map generalization. Int. J. Geogr. Inform. Sci. 1988, 2, 229–244. [Google Scholar] [CrossRef]
  6. Sarjakoski, L.T. Conceptual models of generalisation and multiple representation. In Generalisation of Geographic Information: Cartographic Modelling and Applications; Elsevier: Oxford, UK, 2007; pp. 11–35. [Google Scholar]
  7. Ware, J.M.; Jones, C.B.; Bundy, G.L. A triangulated spatial model for cartographic generalisation of areal objects. In Proceedings of the International Conference on Spatial Information Theory, Semmering, Austria, 21–23 September 1995; Springer: Berlin, Germany, 1995; pp. 173–192. [Google Scholar]
  8. Allouche, M.K.; Moulin, B. Amalgamation in cartographic generalization using Kohonen’s feature nets. Int. J. Geogr. Inform. Sci. 2005, 19, 899–914. [Google Scholar] [CrossRef]
  9. Guercke, R.; Götzelmann, T.; Brenner, C.; Sester, M. Aggregation of LoD 1 building models as an optimization problem. ISPRS J. Photogramm. Remote Sens. 2011, 66, 209–222. [Google Scholar] [CrossRef]
  10. Ai, T.; Zhang, X. The Aggregation of urban building clusters based on the skeleton partitioning of gap space. In The European Information Society; Springer: Berlin, Germany, 2007; pp. 153–170. [Google Scholar]
  11. Regnauld, N. Algorithms for the amalgamation of topographic data. In Proceedings of the 21st International Cartographic Conference, Durban, South Africa, 10–16 August 2003; pp. 222–234. [Google Scholar]
  12. Regnauld, N. Contextual building typification in automated map generalization. Algorithmica 2001, 30, 312–333. [Google Scholar] [CrossRef]
  13. Anders, K.H. A hierarchical graph-clustering approach to find groups of objects. In Proceedings of the 5th Workshop on Progress in Automated Map Generalization, Paris, France, 28–30 April 2003; Citeseer: Princeton, NJ, USA, 2003; pp. 1–8. [Google Scholar]
  14. Zhang, X.; Ai, T.; Stoter, J.; Kraak, M.; Molenaar, M. Building pattern recognition in topographic data: Examples on collinear and curvilinear alignments. GeoInformatica 2013, 17, 1–33. [Google Scholar] [CrossRef]
  15. Du, S.; Luo, L.; Cao, K.; Shu, M. Extracting building patterns with multilevel graph partition and building grouping. ISPRS J. Photogramm. Remote Sens. 2016, 122, 81–96. [Google Scholar] [CrossRef]
  16. Ai, T.; Guo, R. Polygon cluster pattern mining based on Gestalt principles. Acta Geod. Cartogr. Sin. 2007, 36, 302–308. [Google Scholar]
  17. He, X.; Zhang, X.; Xin, Q. Recognition of building group patterns in topographic maps based on graph partitioning and random forest. ISPRS J. Photogramm. Remote Sens. 2018, 136, 26–40. [Google Scholar] [CrossRef]
  18. Schylberg, L. Cartographic amalgamation of area objects. ISPRS J. Photogramm. Remote Sens. 1993, 29, 135. [Google Scholar]
  19. Su, B.; Li, Z.; Lodwick, G.; Muller, J.C. Algebraic models for the aggregation of area features based upon morphological operators. Int. J. Geogr. Inform. Sci. 1997, 11, 233–246. [Google Scholar] [CrossRef]
  20. Cámara, M.; López, F. Mathematical morphology applied to raster generalization of urban city block maps. Cartographica 2000, 1, 33–48. [Google Scholar] [CrossRef]
  21. Cheng, B.; Liu, Q.; Li, X. Local perception-based intelligent building outline aggregation approach with back propagation neural network. Neural Process Lett. 2015, 41, 273–292. [Google Scholar] [CrossRef]
  22. Corcoran, P.; Mooney, P.; Bertolotto, M. Spatial relations using high level concepts. ISPRS Int. J. Geo-Inf. 2012, 1, 333–350. [Google Scholar] [CrossRef]
  23. Regnauld, N.; Revell, P. Automatic amalgamation of buildings for producing ordnance survey 1:50000 scale maps. Cartogr. J. 2007, 44, 239–250. [Google Scholar] [CrossRef]
  24. Guo, P.; Li, C.; Yin, Y. Classification and filtering of constrained Delaunay triangulation for automated building aggregation. Acta Geod. Cartogr. Sin. 2016, 45, 1001–1007. [Google Scholar]
  25. Lee, D. Geographic and cartographic contexts in generalization. In Proceedings of the ICA Workshop on Generalisation and Multiple Representation, Leicester, UK, 20–21 August 2004. [Google Scholar]
  26. Basaraner, M.; Selcuk, M. A structure recognition technique in contextual generalisation of buildings and built-up areas. Cartogr. J. 2008, 45, 274–285. [Google Scholar] [CrossRef]
  27. Cetinkaya, S.; Basaraner, M.; Burghardt, D. Proximity-based grouping of buildings in urban blocks: A comparison of four algorithms. Geocarto Int. 2015, 30, 618–632. [Google Scholar] [CrossRef]
  28. Anders, K.H. Grid typification. In Progress in Spatial Data Handling; Springer: Berlin, Germany, 2006; pp. 633–642. [Google Scholar]
  29. Zahn, C.T. Graph-theoretical methods for detecting and describing gestalt clusters. IEEE Trans. Comput. 1971, 100, 68–86. [Google Scholar] [CrossRef]
  30. Jones, C.B.; Bundy, G.L.; Ware, M.J. Map generalization with a triangulated data structure. Cartogr. Geogr. Inf. Sci. 1995, 22, 317–331. [Google Scholar]
  31. Bader, M.; Barrault, M.; Weibel, R. Building displacement over a ductile truss. Int. J. Geogr. Inform. Sci. 2005, 19, 915–936. [Google Scholar] [CrossRef]
  32. Environmental Systems Research Institute (ESRI). ArcGIS for Desktop. Available online: http://desktop.arcgis.com/en/arcmap/latest/tools/cartography-toolbox/aggregate-polygons.htm (accessed on 9 February 2018).
  33. Zhang, X.; Stoter, J.; Ai, T.; Kraak, M.; Molenaar, M. Automated evaluation of building alignments in generalized maps. Int. J. Geogr. Inform. Sci. 2013, 27, 1550–1571. [Google Scholar] [CrossRef]
  34. Standardization Administration of the People’s Republic of China (SAC). Cartographic Symbols for National Fundamental Scale Maps-Part 2: Specifications for Cartographic Symbols 1:5000 & 1:10000 Topographic Maps; Standards Press of China: Beijing, China, 2006; pp. 1–19. [Google Scholar]
  35. Instituto Geográfico Português (IGP). Cartografia e Ortofotocartografia à Escala 1:10,000; Normas Técnicas de Produção e Reprodução; Instituto Geográfico Português: Lisboa, Portugal, 2005. [Google Scholar]
  36. Burghardt, D.; Schmid, S. Constraint-Based Evaluation of Automated and Manual Generalised Topographic Maps; Cartography in Central and Eastern Europe; Springer: Berlin, Germany, 2009; pp. 147–162. [Google Scholar]
  37. Li, J.; Ai, T.; Liu, P.; Yang, M. Continuous scale transformations of linear features using simulated annealing-based morphing. ISPRS Int. J. Geo-Inf. 2017, 6, 242. [Google Scholar] [CrossRef]
  38. Šuba, R.; Meijers, M.; Oosterom, P. Continuous road network generalization throughout all scales. ISPRS Int. J. Geo-Inf. 2016, 5, 145. [Google Scholar] [CrossRef]
Figure 1. The overall framework for the progressive amalgamation of building clusters. GSCARF: graph-based spatial clustering application with random forest.
Ijgi 07 00116 g001
Figure 2. Examples for decomposing a building cluster and progressive amalgamation are shown for (a) the hierarchy of a building cluster; (b) corresponding building subgroups in the hierarchy; (c) generalized results based on (b).
Ijgi 07 00116 g002
Figure 3. An example of the amalgamation process for (a) a constrained Delaunay triangulation (CDT) is constructed for all buildings within a block; (b) the revised constrained Delaunay triangulation; (c) the minimum spanning tree (MST) is constructed for a building group; (d) the amalgamated result; (e) the post-simplification object; and (f) the rectangularity object.
Ijgi 07 00116 g003
Figure 4. Study area in the city of Guangzhou and a 1:2000 building and road network dataset.
Ijgi 07 00116 g004
Figure 5. The same as Figure 4 with ID block, but generalized results are shown for (a) the proposed method; (b) Reference; (c) Max distance; and (d) ArcMap. Note that the displacement operation has been excluded from the experiment.
Ijgi 07 00116 g005
Figure 6. The same as Figure 4 with ID block, but the result shows for the number of levels within the hierarchy of each building cluster. Buildings outlined in blue form a building cluster.
Ijgi 07 00116 g006
Figure 7. Mean difference of generalized results versus number of levels. Mean difference is the absolute difference between total building area and the total area of generalized objects, normalized by the total building area.
Ijgi 07 00116 g007
Figure 8. Regressions between the areas of building clusters and the areas of modelled generalized objects that were derived from (a) the proposed method; and (b) the method by using the maximum distance of each building cluster.
Ijgi 07 00116 g008
Figure 9. Cumulative percentage of line segments of polygons.
Ijgi 07 00116 g009
Figure 10. Percentages of points versus different buffer distances.
Ijgi 07 00116 g010
Figure 11. The same as Figure 4 with ID block but grouping results of the tested data are shown for (a) the proposed method; and (b) an enlarged version of incorrect groups. Buildings marked in green with blue edges are incorrect groups.
Ijgi 07 00116 g011
Figure 12. The hierarchy of a building cluster inside Block 1. The maximal distance of each subgroup is used to quantify the scale parameter. Those subgroups with a distance value less than a given threshold form a scaling grouping result. In the hierarchy, nodes denote building subgroups, and the connected lines between nodes represent their hierarchical relationships.
Ijgi 07 00116 g012
Figure 13. Multi-scale representations of buildings created with the proposed method. The level of detail will not change in a scale interval. The lower limit of a scale interval denotes the moment when a level detail of buildings come into being, whereas the upper limit indicates that the representation of buildings will disappear under this given value. Note that all objects are displayed at the same scale in order to clearly show the effects of the amalgamation process.
Ijgi 07 00116 g013
Table 1. Brief summary of generalized objects obtained by the different methods.
MethodNo. of ObjectsMin Distance (m)Area (m2)
MinMaxMeanRMSE *
Proposed method2802.03212.6737,439.731597.8844.47
Max distance2802.03212.6737,439.731600.79135.26
ArcMap2600.36193.3137,320.841726.28
Reference2801.98208.0537,738.601589.37
* denotes that the generalized results are compared to the reference map. RMSE: root mean squared error.

