1. Introduction
The physical indoor location of a user has become an important context variable because it is fundamental information that is needed to increase the capabilities of other systems to offer location-based services (LBSs) and improve the user’s situation [
1]. Therefore, the research topic of indoor location systems (ILSs) has been constantly improved, especially with the availability of mobile devices such as smartphones, which include sensors that can be used to develop indoor location estimator (ILE) systems with different technologies [
2].
Several approaches have been proposed to develop ILEs, depending on the availability of technological devices and/or indoor location conditions. For instance, the use of radio waves that include technologies such as Bluetooth, radio frequency identification (RFID), ultrasonic sensors, and Zigbee, among others [
3,
4,
5], which uses available radio signals generated by other devices in the environment [
6]. These approaches have also been combined to develop robust ILS, taking advantage of devices that include more than one sensor (e.g., smartphones, as mentioned in [
7,
8]). The combination of these technologies has also been considered [
7,
8]. These technologies have allowed the development of well-accepted proposals based on these technologies, such as Active Badge [
9], Active bat [
10], Cricket [
11], LANDMARC [
12], Bluepos [
13], LOSNUS [
14], and CLIPS [
15]. However, these approaches require a dedicated infrastructure, and in most of them the position of the devices is used to calculate the final indoor location. Thus, they are impractical for deployment in the real world. Additionally, the lack of scalability is another disadvantage, because the dedicated infrastructure requires devices to be added in order to increase the coverage of these systems.
To solve this issue, other approaches make use of signals that are naturally in the environment [
6]. These natural signals (e.g., sound, light, geomagnetic, etc.) can be used without deploying dedicated infrastructure or ILSs. One example is geomagnetic signal, which can be detected by smartphones using the built-in magnetometer sensor [
16,
17]. Haverinen et al. [
18] propose that the position should be identified using the Monte Carlo localization approach. For this dynamic localization in an indoor environment (corridors in a building), magnetic field observations from an unknown position, the comparison between the magnetic field variations, and the known patterns are used. Gozick et al. [
19] propose another approach using the variations in the geomagnetic field caused by structural steel building elements. These variations can be modeled to estimate the user location. Other approaches use light as an information source to estimate the location of the user. Randall et al. [
20] proposed the use of solar cells, and recorded the patterns as a fingerprint to recognize the location of the user. The deployment of this proposal needs no infrastructure changes; however, location estimation is calculated as a trajectory and not as a punctual location, and standard solar cells are used to register luminosity (intensity of light) as well as their typical use to collect energy. Finally, environmental sound is proposed as another information source in several works. One well-known example of this is presented by Vildjiounaite [
21], who proposed the use of 10 s of the environmental sound and using this as a “fingerprint”. Then, they calculate the spectrum for each fingerprint and use some spectral frequencies features. Delgado-Contreras et al. [
22] presented an approach for location classification that does not need to have an explicit information about locations to be identified. Instead, they propose the use of 62 audio features grouped in temporal, frequency, and statistical features to describe the signal. They obtained 91.42% accuracy using a support vector machine (SVM) algorithm to estimate the location.
Other approaches propose the merge of signals with contextual information; for instance, Chun Zu et al. [
23] proposed an approach to indoor human daily activity recognition which combines motion data and location information, where location is a context information and an accelerometer provides raw data from the user movements using Bayes’ theorem to fuse the context and accelerometer data. In their work, Avgoustinos Filippoupolitis et al. [
24] designed and evaluated an activity recognition system composed of a smart watch, enhanced by contextual location information acquired from Bluetooth Low Energy (BLE) beacons. They claimed a classification accuracy ranging from 92% to 100%. An interesting work aimed at indoor location using contextual information was put forth by Sheng Guo et al. [
25]; they proposed location estimation combining pedestrian dead reckoning, human activity recognition (HAR), and landmarks to acquire accurate indoor localization information. Xiaomu Luo et al. [
26] proposed an indoor tracking and activity recognition using a wireless sensor network (WSN), where the sensor nodes within the WSN consist of pyroelectric infrared (PIR) sensor arrays. The approach uses a two-layer random forest (RF) classifier to identify the user movements and activity. They claimed an error of about 0.85 meters and a 92% HAR. Nevertheless, these approaches keep the main constraint that depends on dedicated infrastructure (for instance BLE beacons) and/or specific proposed devices to track the user movements (accelerometers, pyroelectric sensors, and smart watch among others), which implies that they cannot be deployed in many environments.
There are approaches that instead of measuring distance in terms of coordinates in a plane
, they propose the use of labels to identify certain rooms; for instance, Ghourchian et al. [
27] proposed an approach that utilizes WiFi-enabled devices inside of different rooms to describe it on the basis of these WiFi devices such as laptops, smartphones, smart TV, and others. In their scenario, they labeled the rooms with a consecutive number, i.e., “Room 1”, “Room 2”, and so on; however, several devices can be moved easily to modify the WiFi description of a room. Crespo et al. [
28] proposed a semantic navigation in indoor environments, describing rooms as “places” that have particular objects or tasks that will help to identify each room; this proposal uses two main elements: an ontology proposed and environment information included in a relational database. Room semantics identification using acoustic monitoring Mel-frequency cepstral coefficients (MFCCs) to model the environmental sound is presented by Ahmed Shah et al. [
29], who propose the use of support vector machines (SVMs) to classify the MFCCs that describe room semantics; nevertheless, a Fourier depending feature such as MFCC combined with an SVM algorithm can lead to a high computational cost. These approaches identify rooms to offer indoor location systems; however, current user activity is not relevant to these proposals. Therefore, in this paper, we propose a context information ILS which relies on the human activity recognition (HAR) process and how it can describe the location with environmental sound as information source, based on contextual information to estimate the user’s location in an indoor environment. In this approach, the main goal is to find the user’s location in terms of descriptive location “labels” (e.g., “kitchen”), and not a particular point in a coordinate system. However, this location description is enough to provide location based services (LBSs). Therefore, instead of measuring the error in distance from the current location and the estimated one, this is measured as in a classification problem—estimated room against the actual room (true positives and true negatives). This allows the performance of the ILS to be expressed in several numerical metrics, such as sensitivity, specificity, and recall. A confusion matrix can be calculated and other visualization figures can be developed, such as a receiver operating characteristic (ROC) curve.
There are two important goals in our study: to provide evidence that human activity as context information can describe the location of the user in an indoor environment, and secondly, to find statistical features that explain the behavior of the signals to develop an indoor location system based on context information about the activity that is performed, with low computational cost that allows us to implement our system in portable devices such as smartphones without the need of adding infrastructure to the environment. This ILS must be a general model (i.e., a model that does not depend on a particular user [
30,
31], device, or specific characteristics of the signal that feeds the model), with the aim of avoiding a costly training phase in order to be an easily-implemented development.
In order to perform the context information extraction, using HAR with sound as information source, statistical features presented by Galván-Tejada et al. [
32] were used. In our proposal, we construct a context sound fingerprint with 10 s of HAR that is carried out in an indoor environment. With this context, the sound fingerprint can be inferred in the indoor room where a certain activity is performed. This approach allows us to be independent of the constraints occurring in other approaches using other natural signals as mentioned before.
The main contribution of this work is the use of contextual information extracted from human activity recognition to estimate the user’s location in an indoor environment, without the need of adding devices to the user or to the environment. This approach uses sound data to estimate the location, which is present in any indoor environment and thus there is no need to generate or modify infrastructure.
This paper is organized as follows: after this introduction, in
Section 2 the environmental sound data set is described in detail, as well as methods used to develop the ILS. In
Section 3, the experiment using sound data from human activities and results from the experiment are shown. In
Section 4, discussion and conclusions about this work are presented, and finally in
Section 5 the future work is briefly described.
2. Materials and Methods
In this section, the environmental sounds that comprise the data set of human activities and their locations is described in detail, and then the methods applied to develop the indoor location estimation (ILE) model are presented next.
2.1. Data Set Description
The human activity sounds data set is comprised of ten activities and several sounds from environmental noises tagged as non-activity. These activities are commonly performed in a residential home. Brewing coffee, cooking meat, boiling eggs, dish washing, and using the microwave oven are performed at kitchen; taking a shower, hand washing, and teeth brushing occur in the bathroom; chewing food in dining room; and finally, reading a book and sounds not related to the mentioned activities, tagged as no activity in the room for resting. A brief description of the activities and the residential rooms are shown in
Table 1. It is worth mentioning that kitchen and bathroom have four activities, where running water has similar background sound, adding complexity to the ILE problem. All environmental audio recordings tagged by activity and location are available on the AmiDaMi research group page (
http://ingsoftware.reduaz.mx/amidami).
2.2. Recording Devices
Sounds were recorded using several smartphones, with the aim of covering different specifications and recording qualities depending on the microphones embedded in these. Smartphone model, system-on-chip (SoC), and operating system (OS) are shown in
Table 2; these features of hardware and software had an impact on the sound recording capabilities and process of each device.
2.3. Spatial Environments
Sounds were recorded in different residential home environments in the four selected rooms: kitchen, bathroom, dining room, and room for resting, meaning different sound reflections, construction materials, background sounds, and home appliances—especially in the kitchen (in the activities of brewing coffee, cooking meat, frying eggs, and microwave oven).
2.4. Meta-Data
Sounds sampling rates from 8 kHz to 44.1 kHz, with mono and stereo recordings were considered in this data set to create a representative sample of mobile phones’ capabilities in the market. Additionally, it allowed the inclusion of future sounds to expand the data set with new activities in different locations.
Table 3 shows the summary of meta-data for each performed activity in this dataset.
2.5. Data Preparation
No processing was performed on the sound files in order to keep the variations of the original sounds in the experiment [
22,
33]. The selected activities are normally done within 10 s to several minutes (taking a shower); therefore, activities’ sounds were trimmed into 10 s clips, allowing the ILS to estimate the location based on the activity every 10 s.
2.6. Feature Extraction
To acquire data that can potentially summarize the sound of a given activity being performed in a certain room (i.e., kitchen, bathroom, dining room, and room for resting), a feature extraction approach was performed. Each 10 s clip was converted into an integer array, where each integer represented the magnitude of the sound wave at a given time. Even though all clips had the same duration, the length of the arrays that represented them varied from 80,000 to 441,000 samples, depending on the sample rate of the original recording. In the stereo recordings, features were extracted only from the left channel, and in mono recordings features were extracted from the raw signal.
From our experience [
32,
34], first- and second-order statistical features can summarize the behavior of different types of natural signals [
6] that can be used to develop ILE systems; additionally, other types of problems with several approaches have been tackled with statistical features [
35,
36,
37]. Therefore, the 16 statistical features listed in
Table 4 were extracted from each sample of the human activities done in each selected room.
2.7. Feature Validation
To validate the extracted features to describe the behavior of this type of signal and be useful in the indoor location problem, a genetic algorithm approach was applied to generate a genetic rank of features to visualize the performance of each feature in the final model. This process allows the evaluation of the feature’s (genes) relevance in terms of sensitivity and specificity. Based on features evaluation, an ILS model (chromosome) was developed to explore the capability of each one to explain the sound behavior, and to describe the location where the activity was done. The process of evaluating features with a genetic algorithm approach starts with a random selection of features that comprises a subset called a chromosome. Each chromosome represents a model that can predict the dependent variable with a certain level of fitness. This chromosome mutates along generations to include new genes (features) randomly and evaluate the change in terms of fitness, allowing the behavior of each feature to be evaluated. Finally, after a defined number of random evolutions of different chromosomes, a gene rank is developed which depends on the fitness achieved in the mutation process, making it possible to know the behavior and importance of each feature to model the phenomena [
38].
2.8. Model Generation with Random Forest
In the work of Breiman et al. [
39], the RF classification technique was proposed, which is a machine learning algorithm created for the solution of classification problems. This technique is based on bagging and random feature selection, and it has been commonly used in different areas (i.e., medical approaches for feature extraction and breast tumor classification) [
40].
RF is based on a set of decision trees composed by randomly-selected features; each tree is conformed by split nodes and leaf nodes. The split nodes are the parts where these trees grow according to the evaluation of the values obtained in their random feature vector and the incoming samples, and the evaluation of the features, deciding the left or the right side of the node. The statistic of the new samples is stored in the leaf nodes in order to be used for future prediction.
The RF process has two main stages: the first stage consists of training and the second of testing. The training stage is based on the construction of multiple decision trees with the complete set of features.
Initially, these trees are constructed through the evaluation of the entire dataset; then, in the ith tree (where i is selected depending on the quantity of subjects), RF selects a subset of data for the training stage. This subset is randomly sampled with a replacement from the entire dataset. Using this subset of data, each node in the tree is recursively trained, starting from the root node, which is the node in the top. In the jth node (where j is selected depending on the quantity of subjects) is generated a function to divide the data into left and right child nodes. This process step also includes the improvement of randomness in the trees of the forest based on the selection of features by random sampling.
The training stage is repeated until the criteria point is reached, which is established before the algorithm starts and represents the maximum of the tree depth or a statistical value.
Finally, in the testing stage, the process is very similar to the training stage. The remaining subset of data—reserved for testing—is submitted to the forest in the root node of each tree, being classified into the left or the right child node until arriving at a leaf node, according to the learned function from the training stage. From the forest, each tree presents a prediction result based on the statistic of the training values that were initially reserved in each leaf node. The final result of the algorithm is calculated by averaging the results obtained from the prediction of each tree [
41].
To validate the results, RF uses the out-of-bag (OOB) error, which is an unbiased estimate of the true prediction error that consists of testing each tree on the samples not used in the building trees stage. According to Breiman et al. [
39], it was demonstrated that calculating the OOB error produces the same results in the error estimation using training and testing sets of the same size [
39].
RF results will differ each time that the algorithm is performed because of the randomness set in the tree building process; nevertheless, this randomness can be specified to be always the same, obtaining specific purpose forests for certain problems [
42].
This classifier is a widely used machine learning algorithm due to the simplicity in the approach of the global interpretation of the logical relation between features, values, and classes [
38].
2.9. Random Forest Model Validation
Even when RF estimated the final model error using the OOB approach, model validation was done with a blind test, splitting the data set into two balanced partial data sets: training set and test set. From this blind test, ROCs were calculated for each room. The ROC allows the performance of a classifier to be evaluated in terms of sensitivity and specificity, revealing the ability of the model to recognize true positives (TPs, observations that actually belong to the class in which were classified) and false positives (FPs, observations that belong to another class but were classified as the current evaluated class).
A well-known metric to evaluate the performance of a classifier using a ROC is the area under the curve (AUC), which explains the general performance of the model using sensitivity and specificity data.
3. Experiments and Results
The activities sound data set is comprised of 64 recordings with 1201 10 s human activity sound descriptors.
Table 5 details the number of recordings and 10 s instances per room obtained from the activities.
The final data set had 1201 observations from all the locations, with 16 statistical features each.
To validate that all features are relevant to explain the behavior of the audio signal to describe an indoor location with the current human activity, a genetic algorithm was used to explore these features’ potential. To apply the GA approach, the Galgo package was used [
38]. This package implements a generic genetic algorithm approach primarily used for variable (genes) selection in random subsets (chromosomes). Galgo is a generic R software package that uses a genetic algorithms approach in order to optimize problems by a selection of features (genes) subsets (chromosomes) in partially isolated niches (environments) that warrant a non-biased genes analysis.
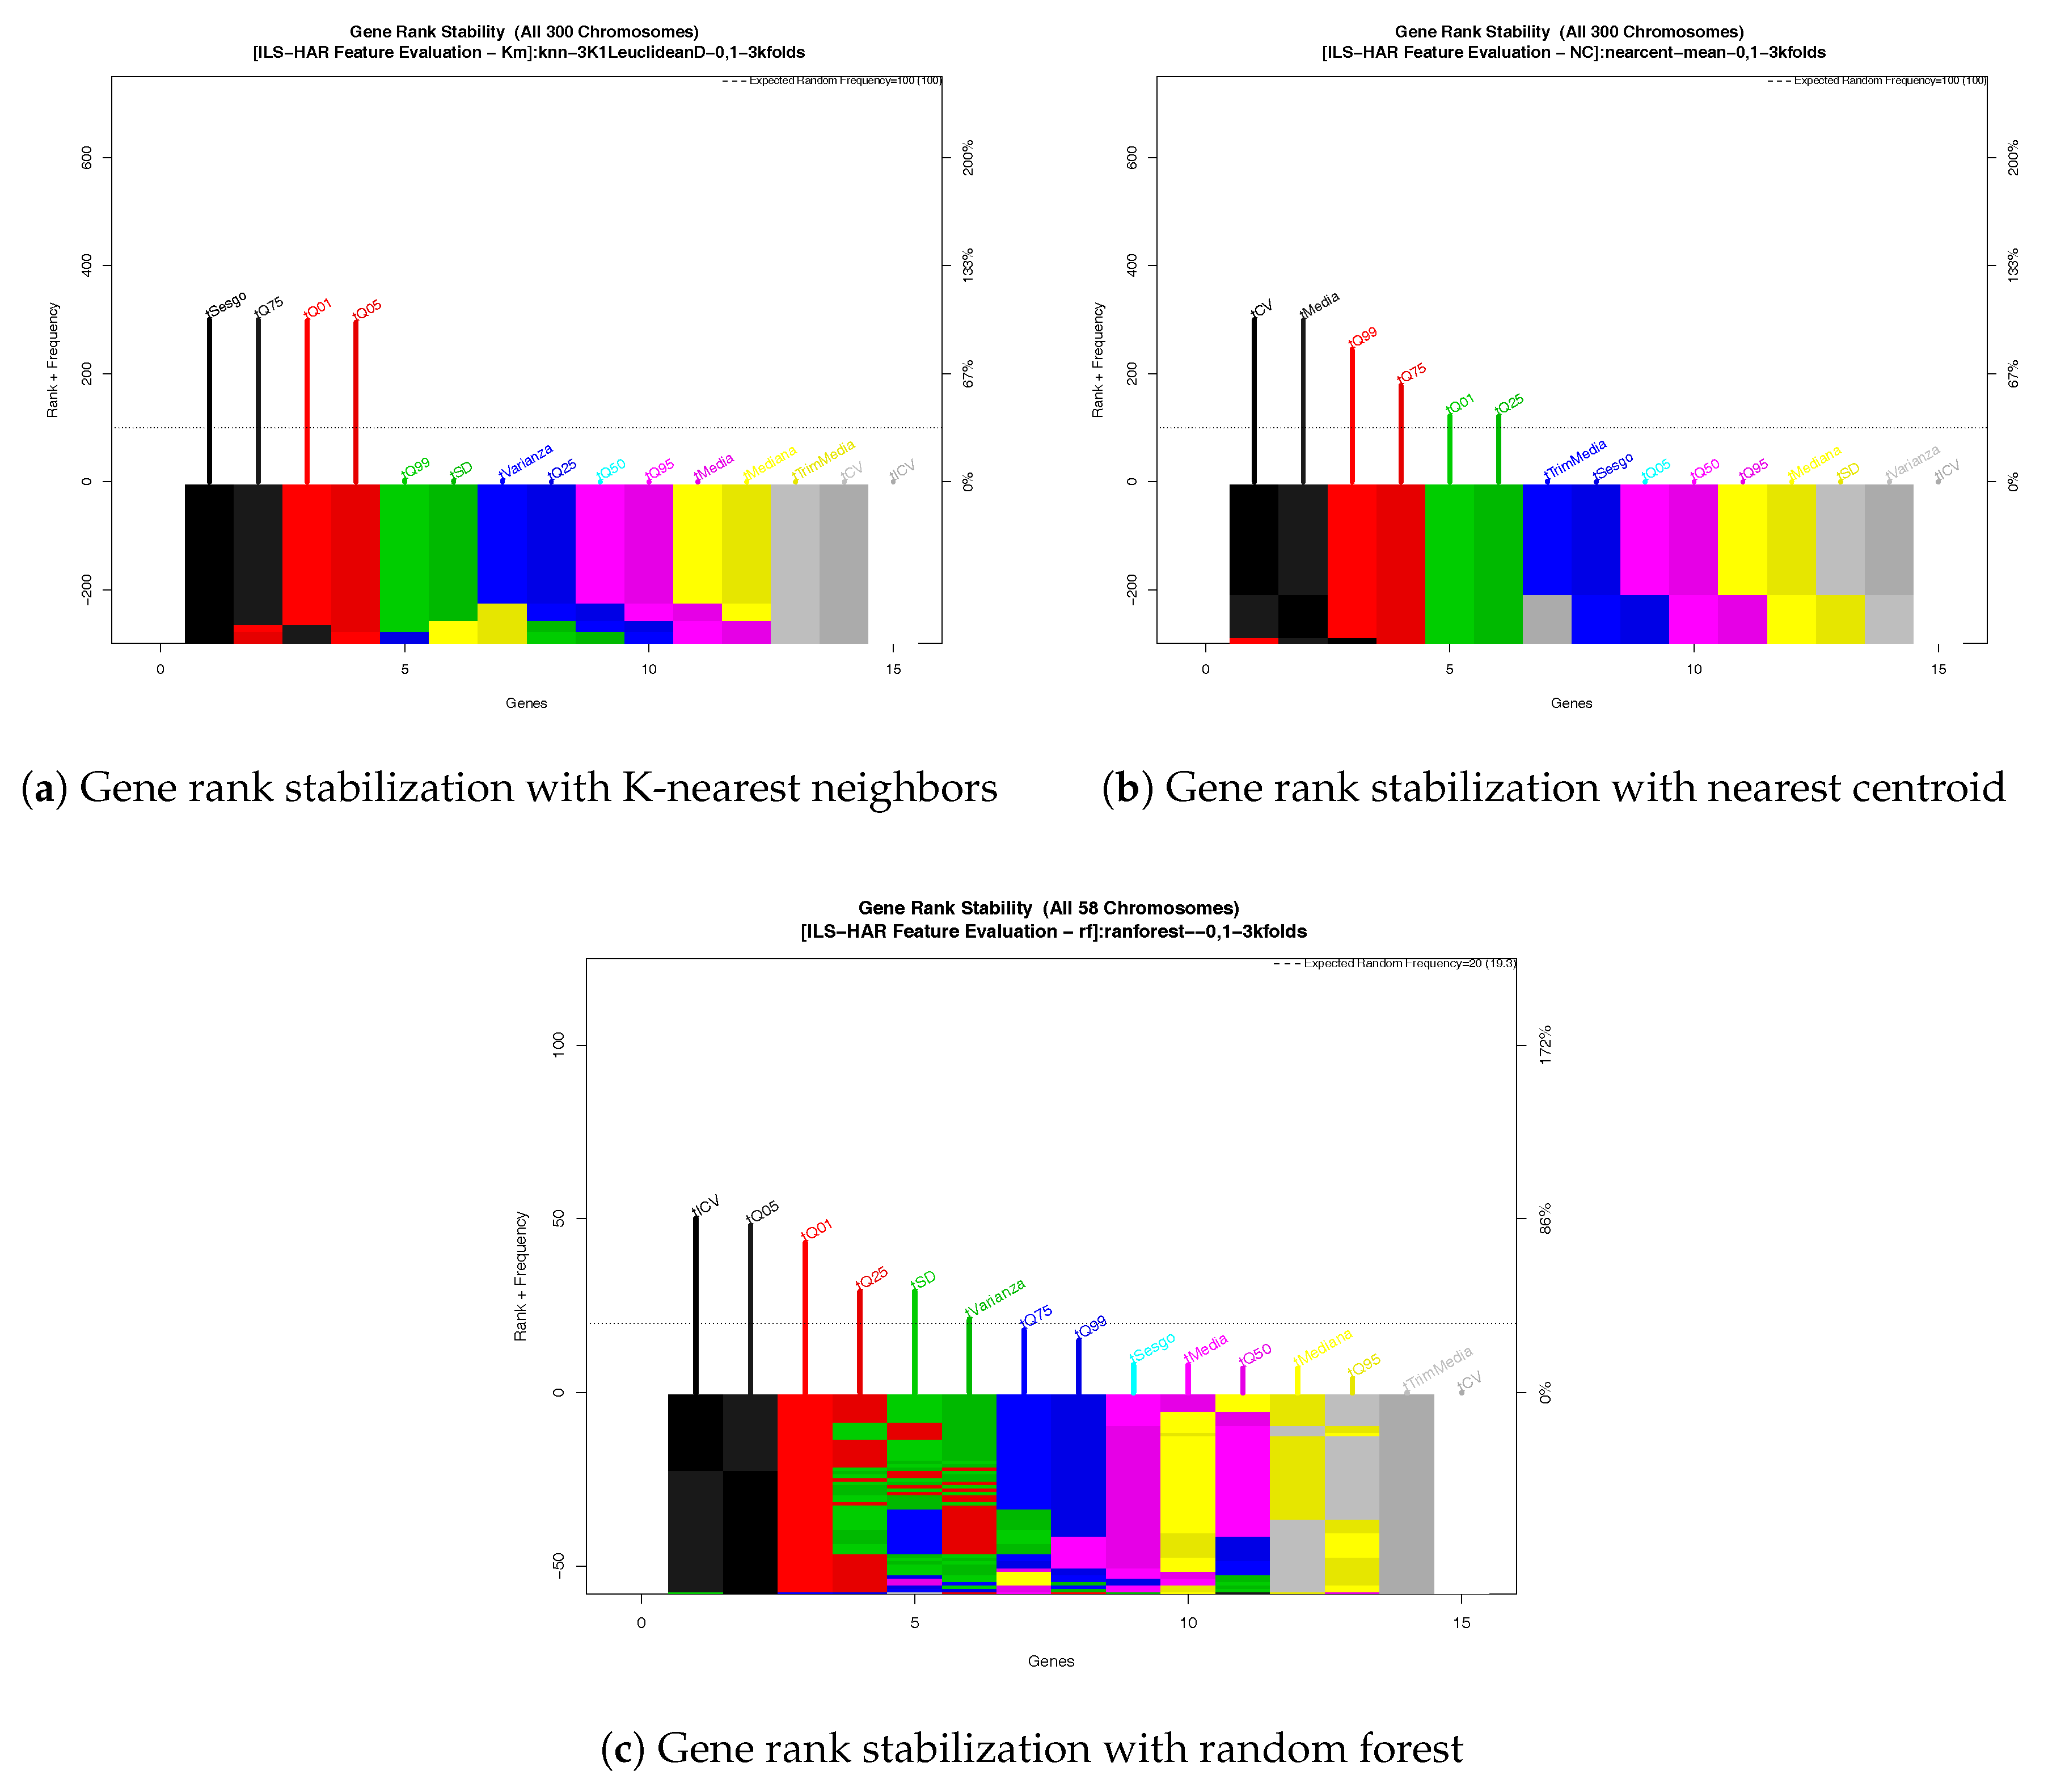
Settings were set to generate five genes (features) chromosomes (models); these genes represent the 16 previously-extracted features. There were 300 evolving generations, using three different algorithms as function cost: K-nearest neighbors, nearest centroid, and RF. This was done with the aim of corroborating parametric and non-parametric classification algorithms’ behavior. These parameters are recommended in the literature [
38,
43,
44] to achieve a statistically significant and non-biased process.
Figure 1 presents gene rank acquired after genetic algorithm process using the three proposed algorithms, in which it is shown that independently of the algorithm, time evolution quantile features are dominant features.
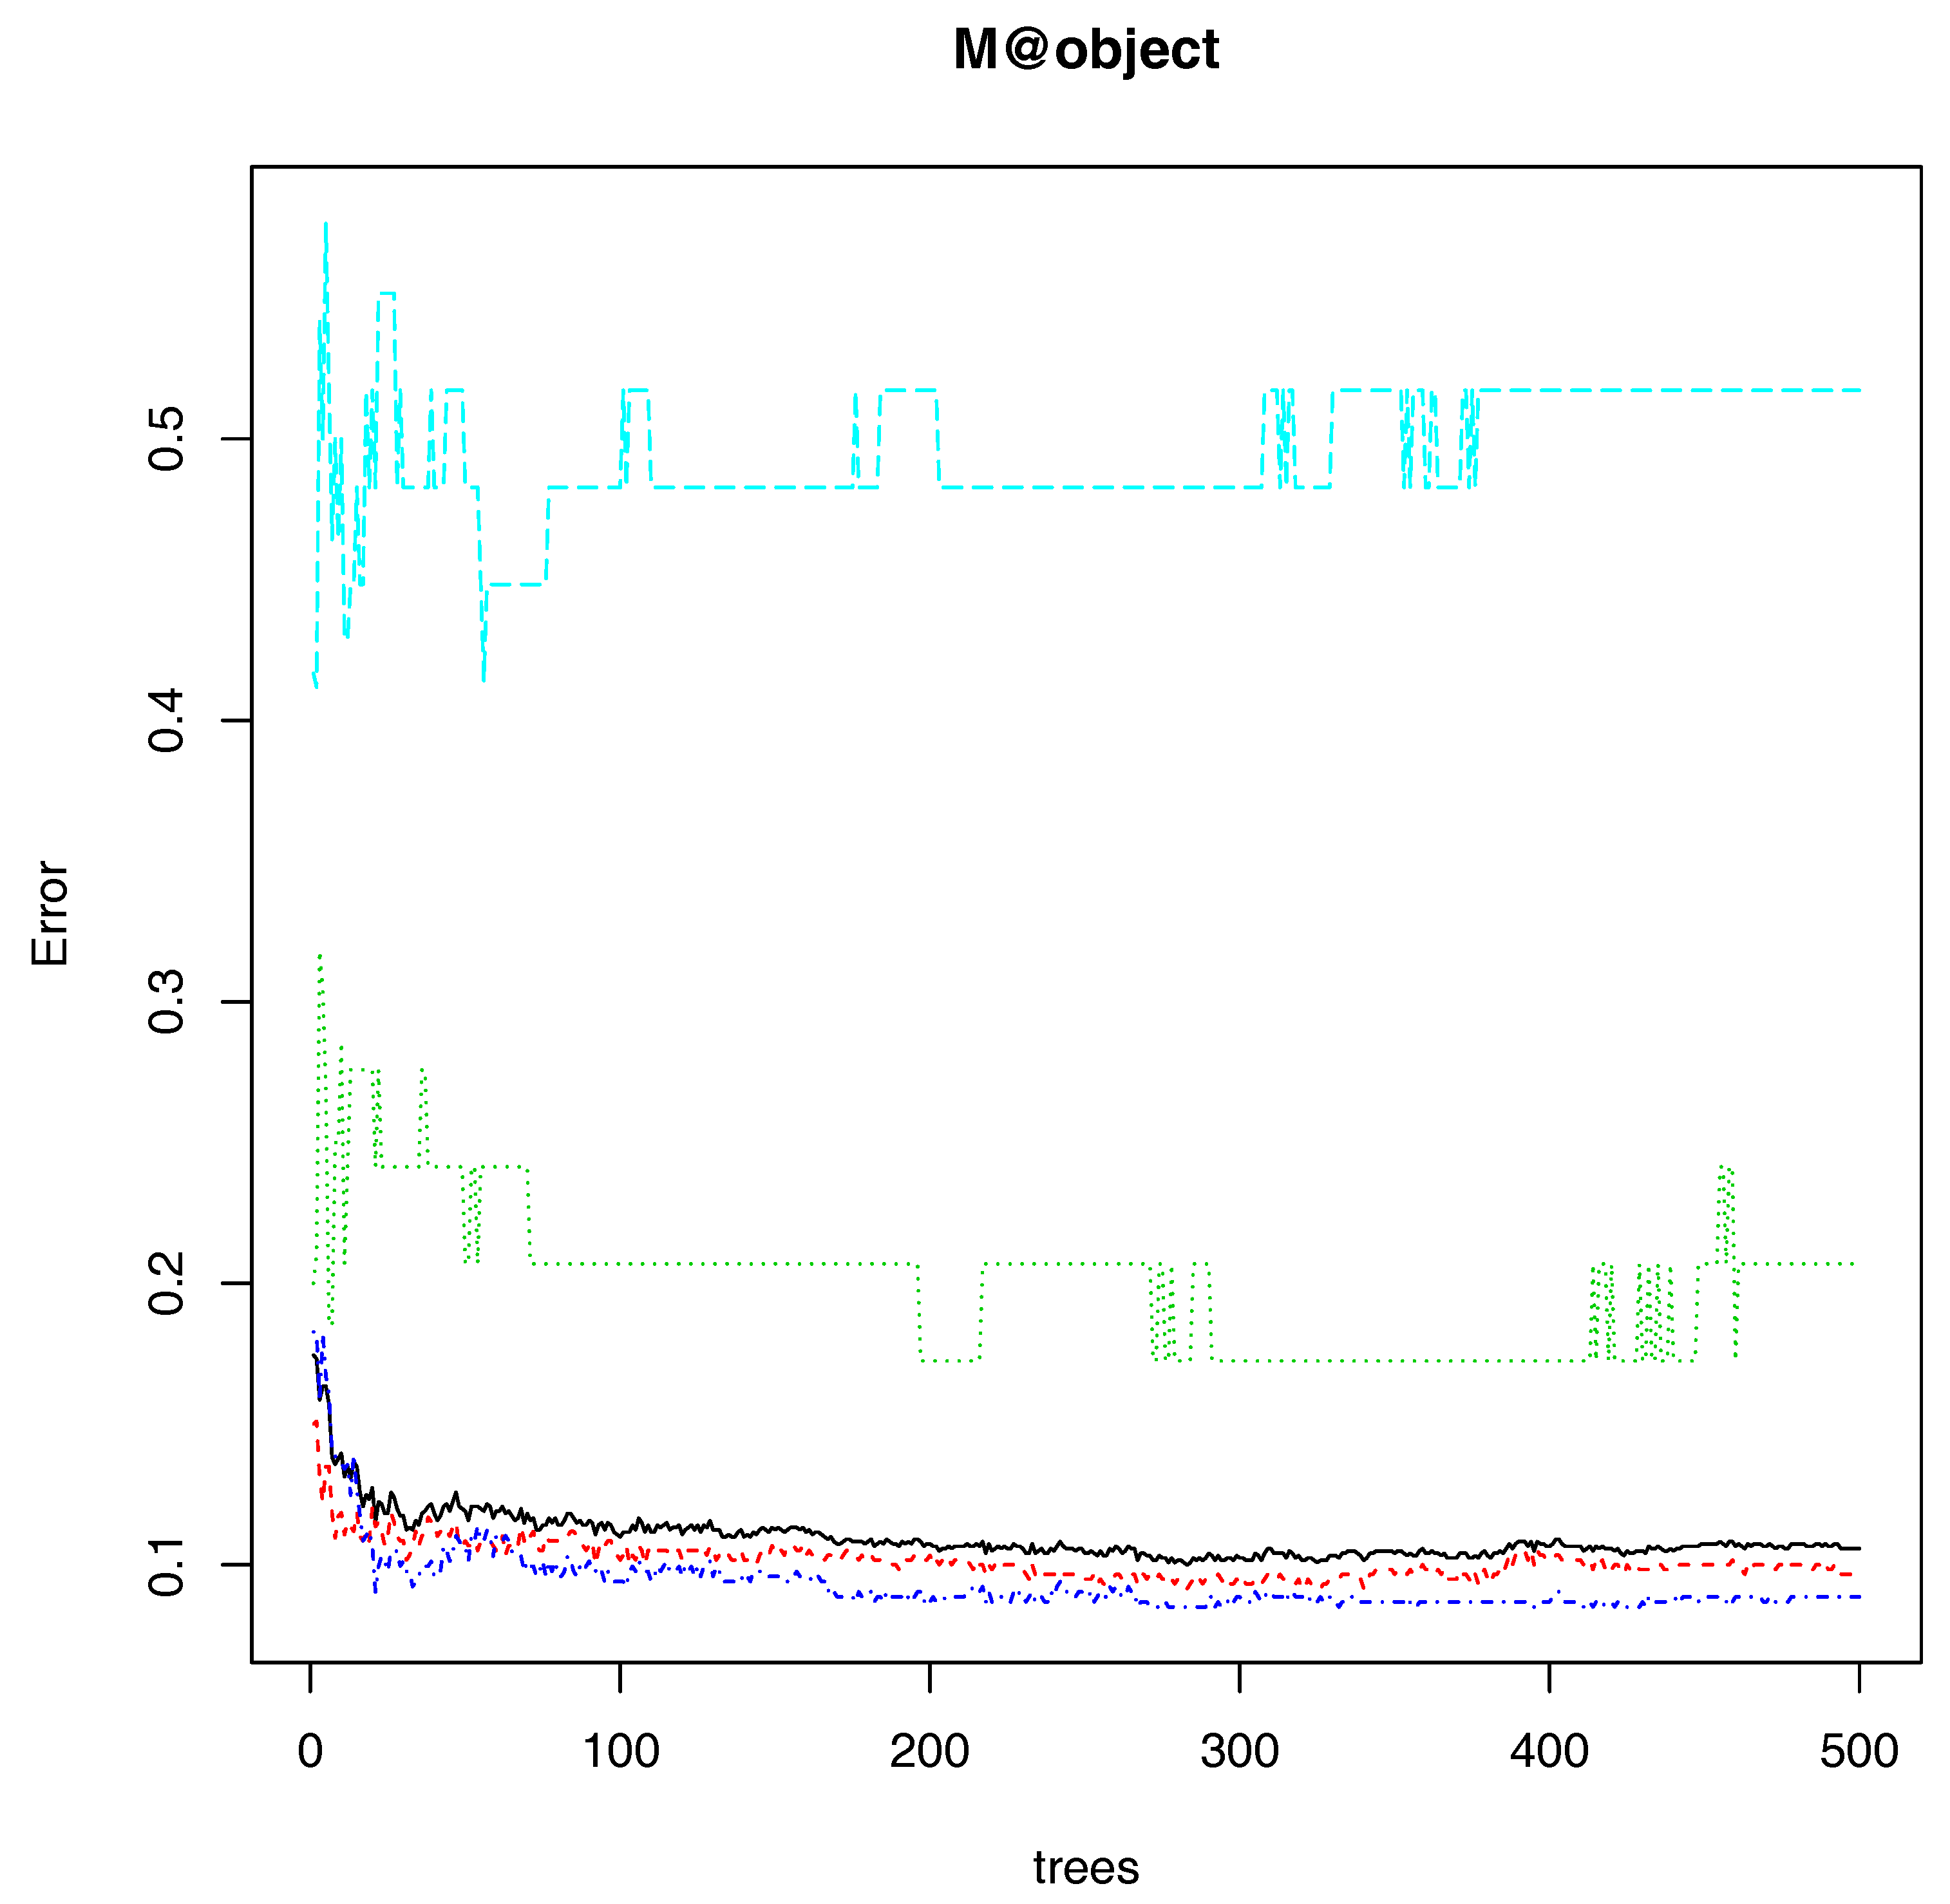
Once the data set pre-processing and feature evaluation was done, a RF with 500 trees and classification mode was trained, using all the features as a result of the gene rank stabilization from the three algorithms to develop an ILS. The variation of the forest tended to zero when 500 trees were reached, as can be appreciated in
Figure 2, meaning that the local optima of the forest was achieved and the location estimation had the minimum error.
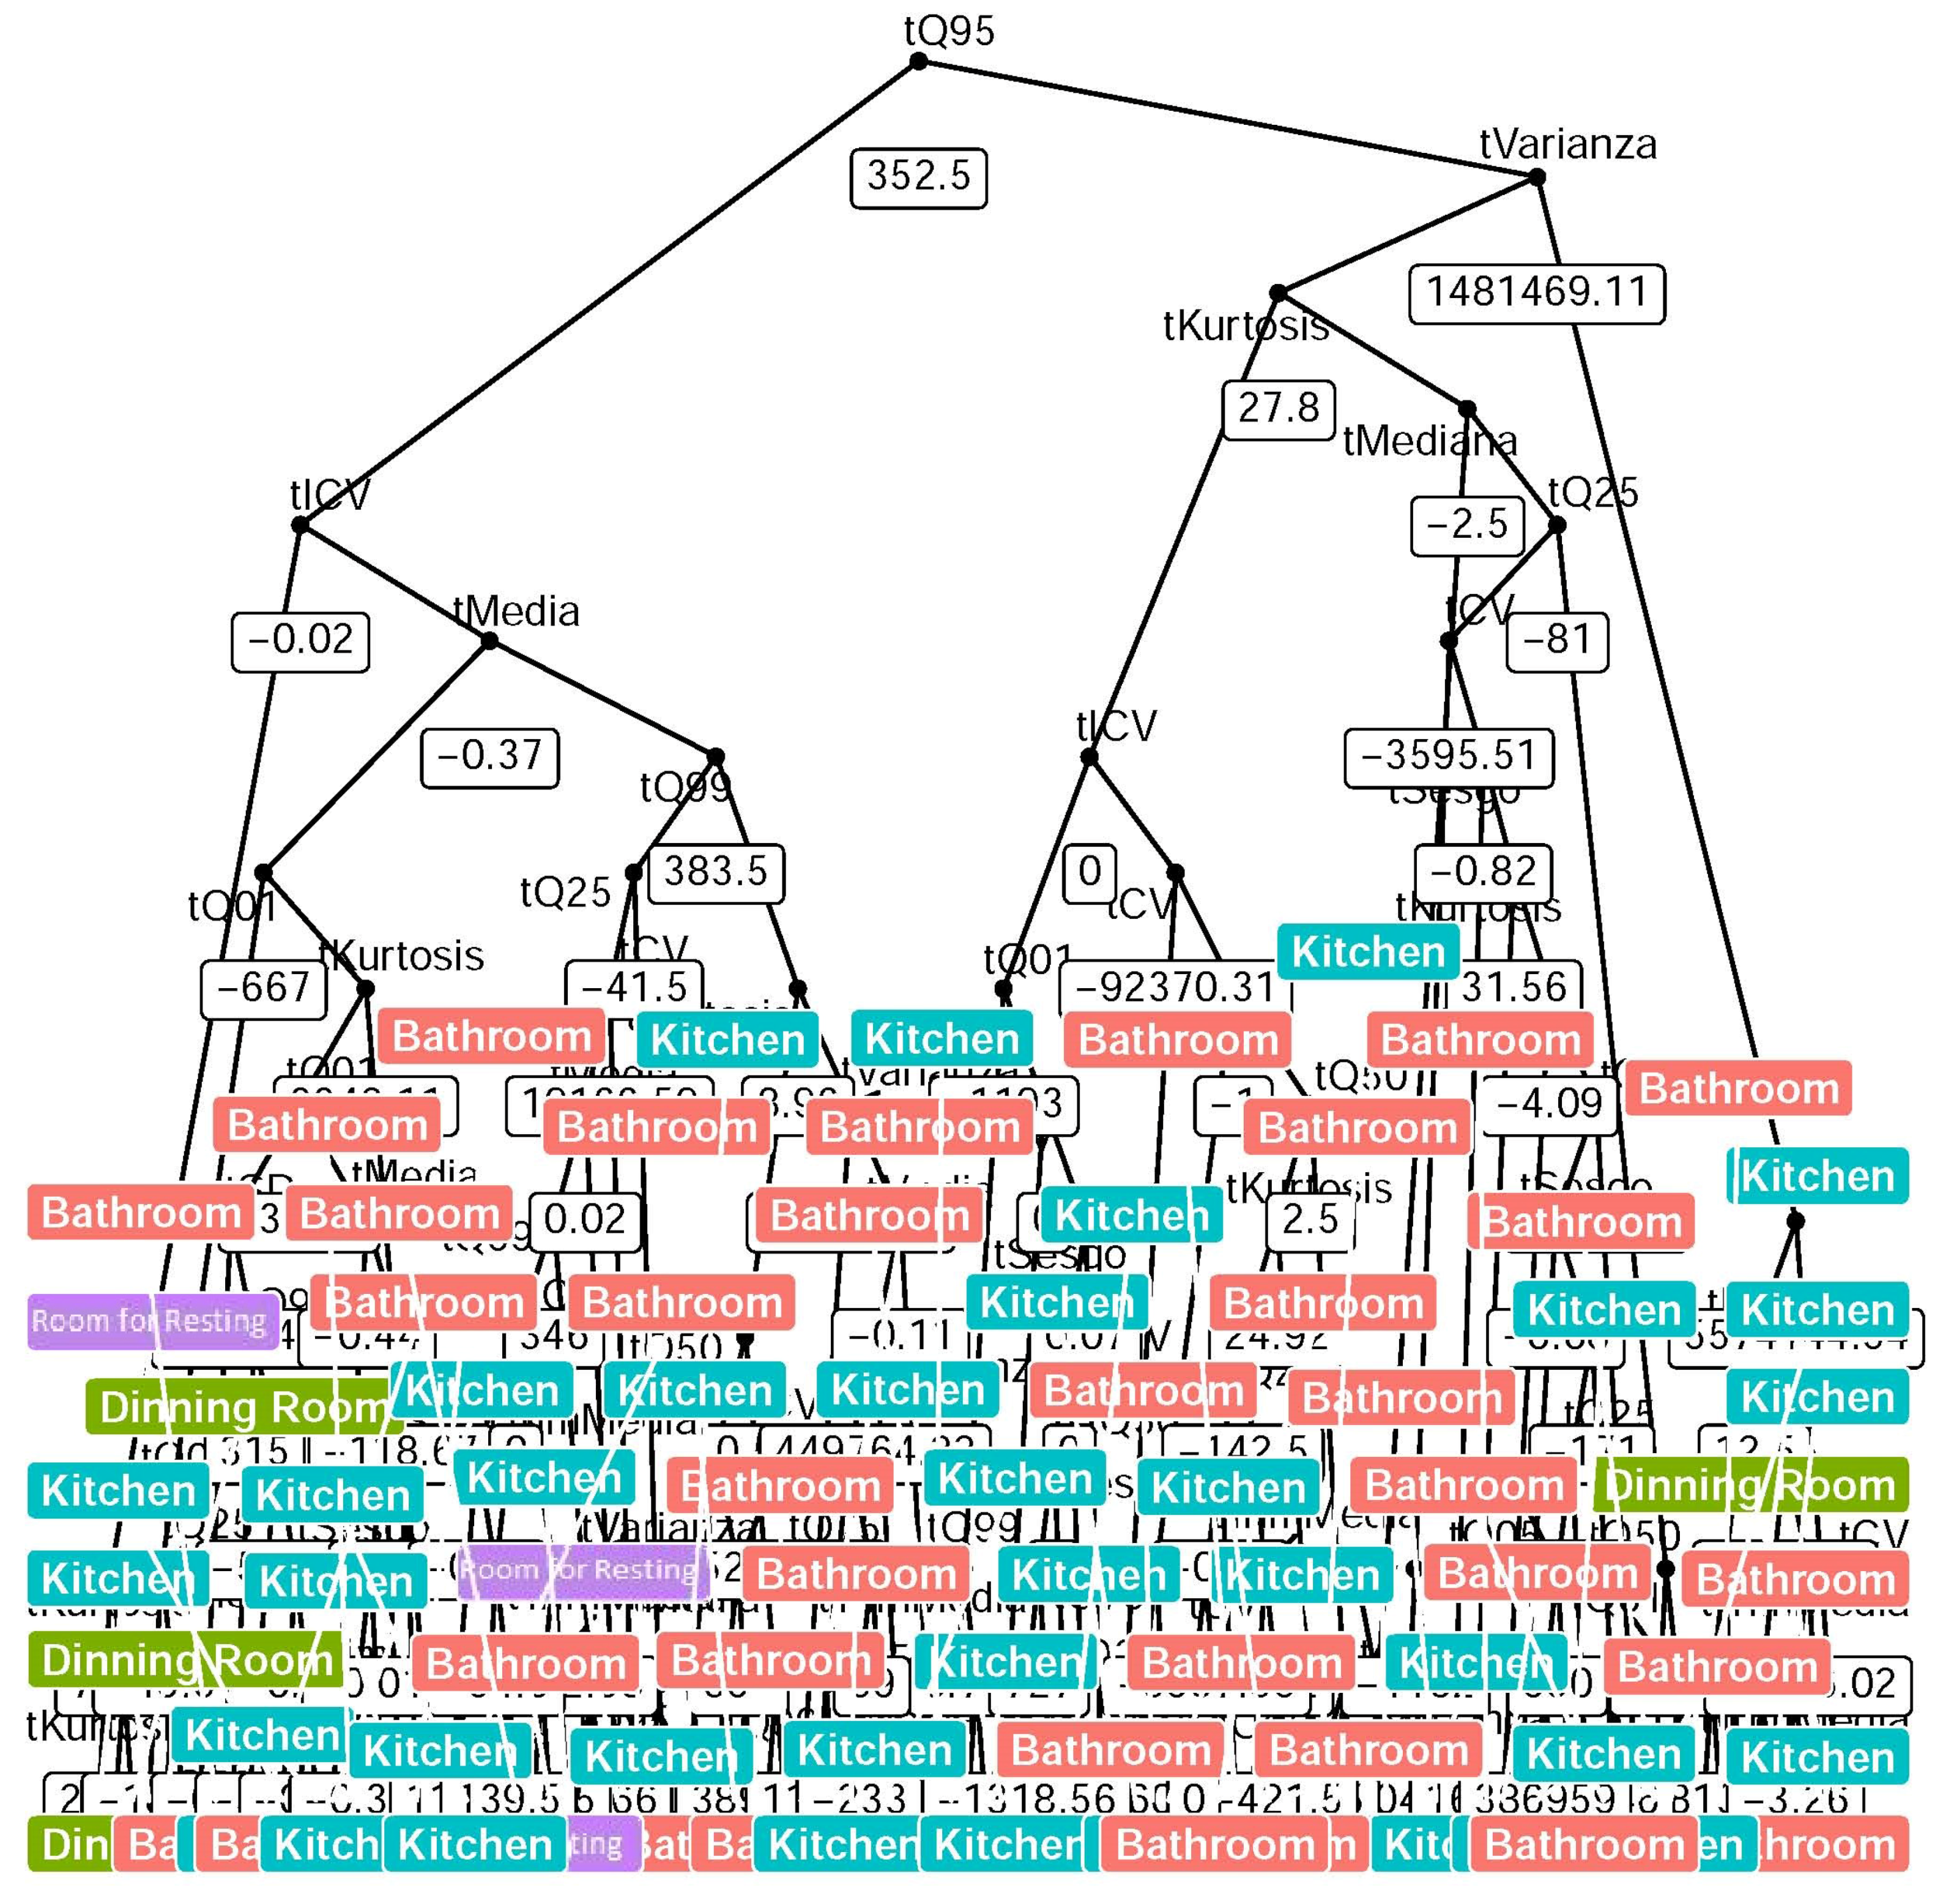
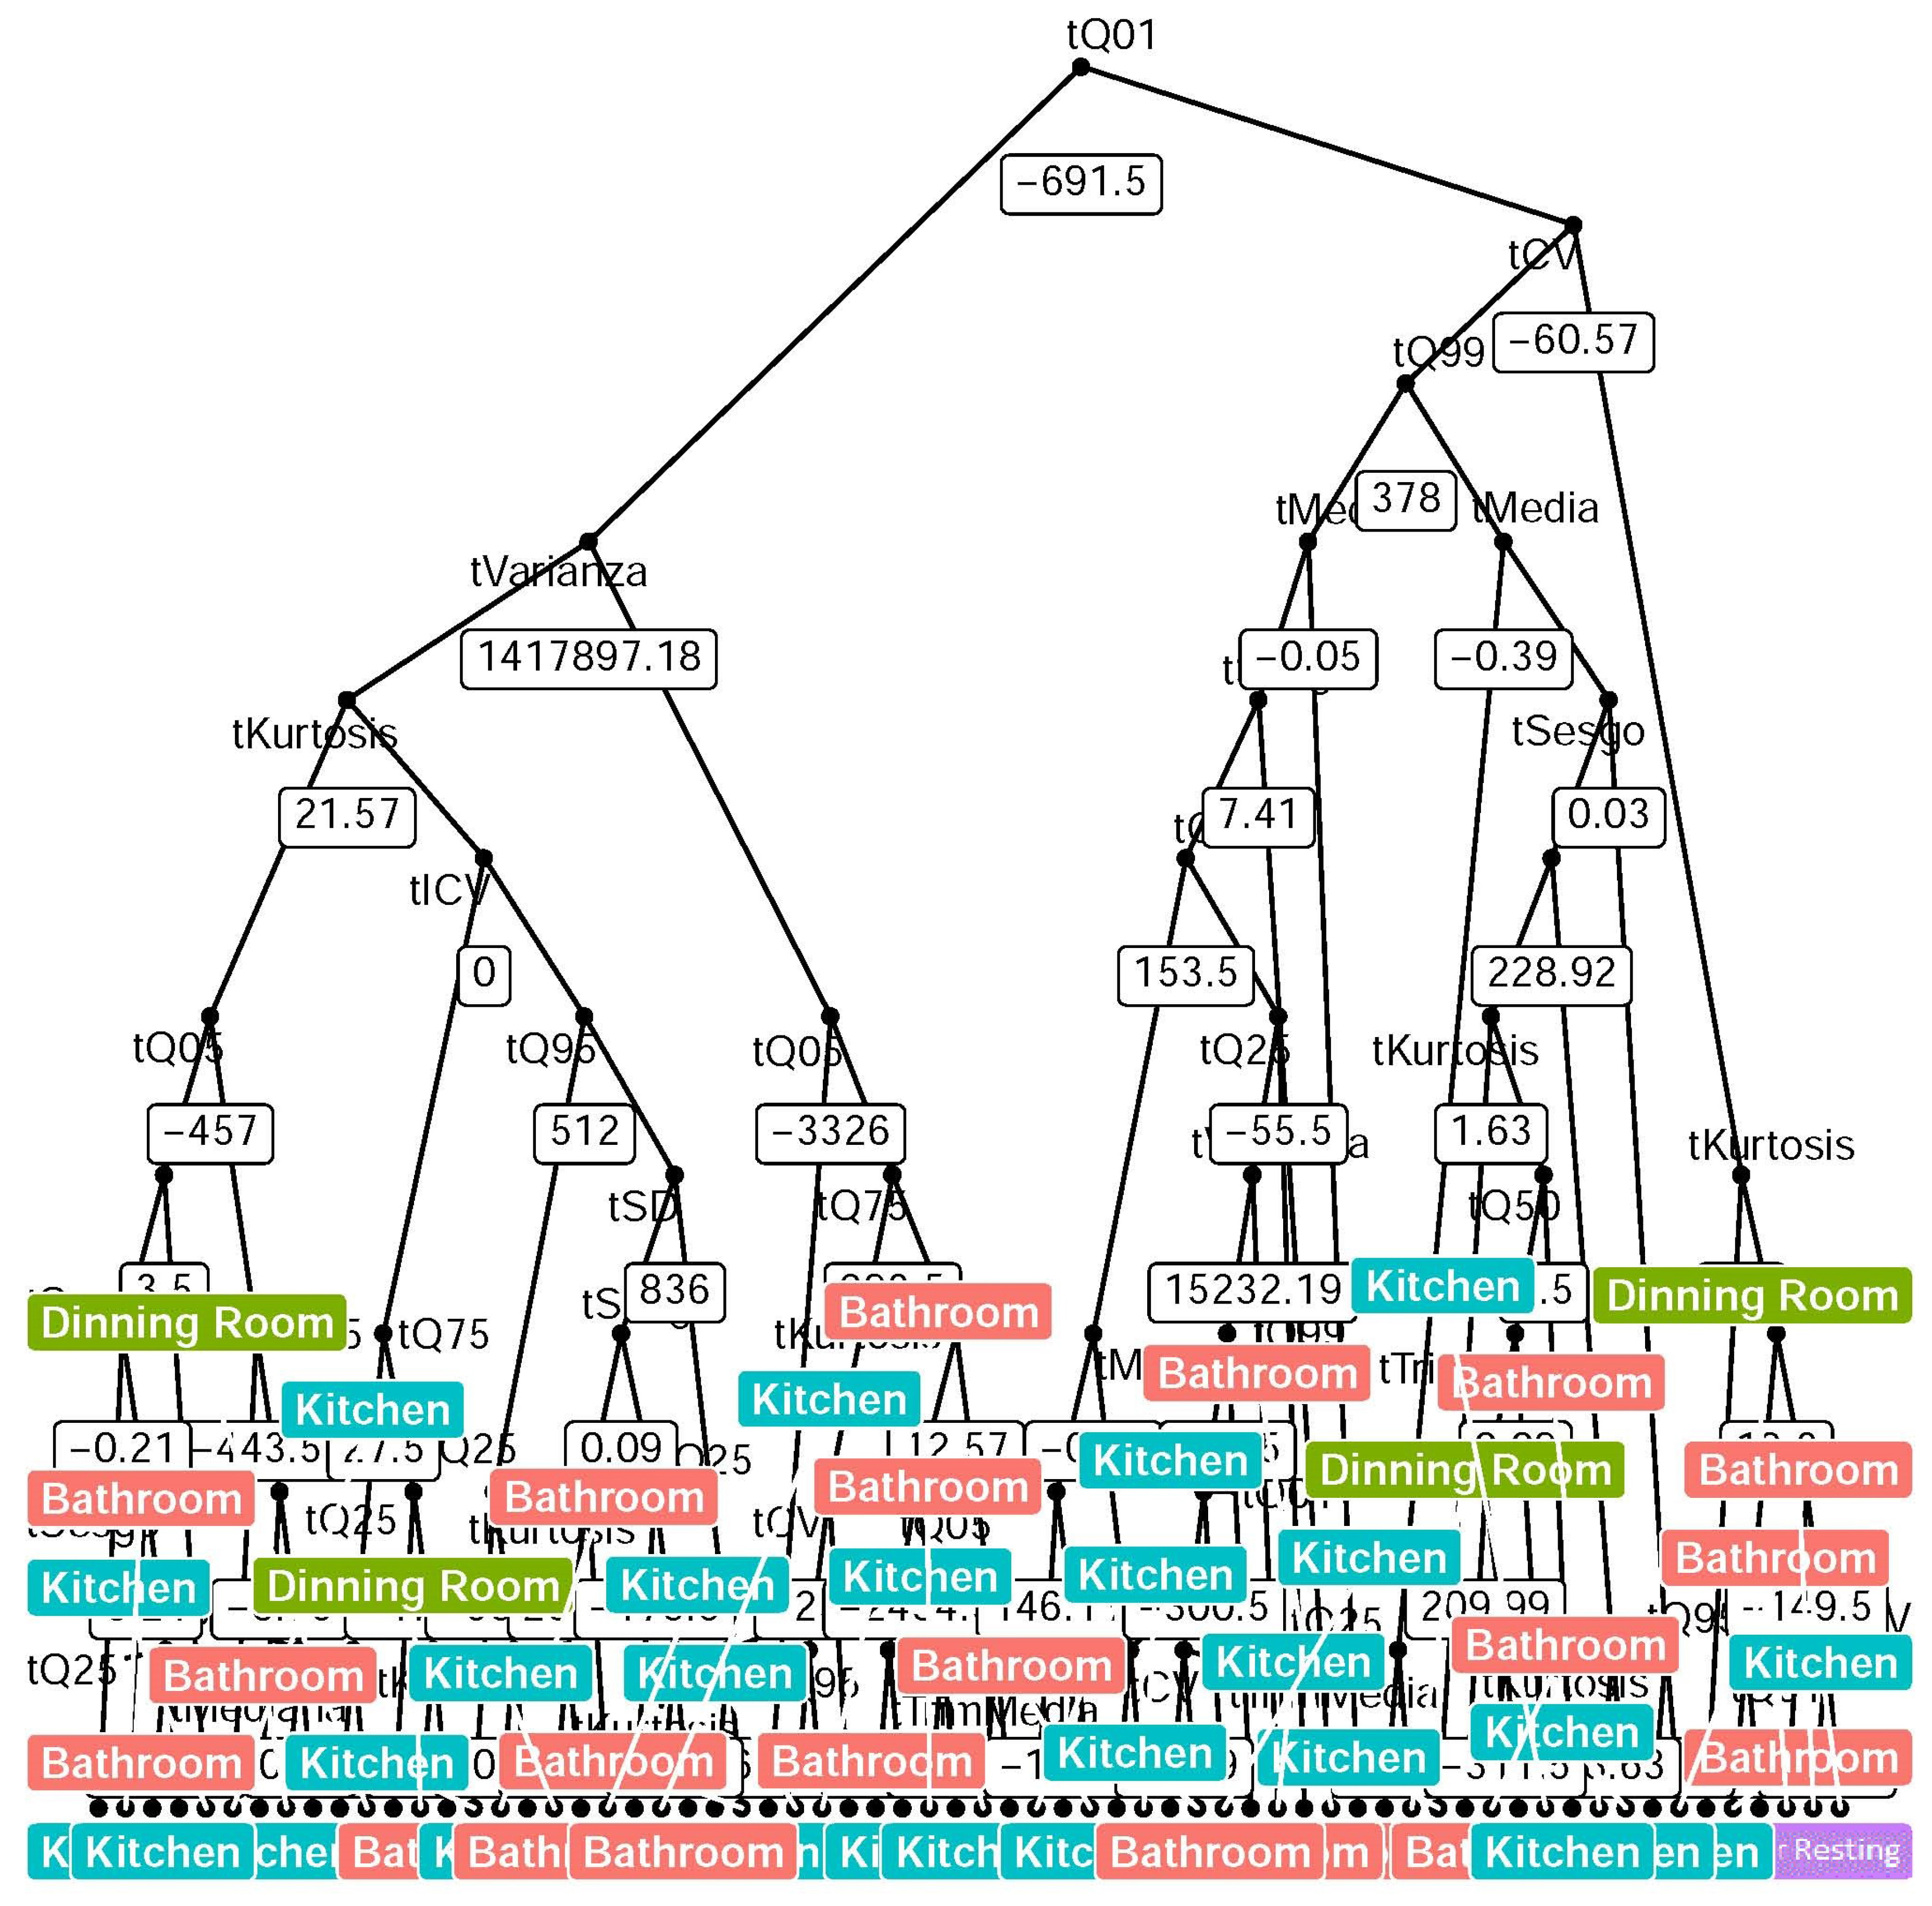
After this processing is done, it is possible to visualize the two principal trees and evaluate the performance and description of the model. Maximum nodes tree and minimal nodes tree are used to represent the behavior of the RF.
Figure 3 shows that the final minimum error tree, after the RF creation process with the maximum number of nodes, quartiles, and percentiles features, had more weight than other statistical features, based on the potential to resume the behavior of a signal in evolutionary time form, which is consistent with the gene rank acquired by the GA approach. In addition, the minimal tree from the RF process can be seen in
Figure 4; however, percentile features are still present in the root and first level branches of the tree. The meaning of this is that quantile features—which are time-independent—include relevant data to explain indoor location with the activities’ sound.
The confusion matrix acquired by the RF model is given in
Table 6. The indoor location estimation model using human activity showed 8.3% percentage of error, with 92.4% sensitivity and 95.6% specificity.
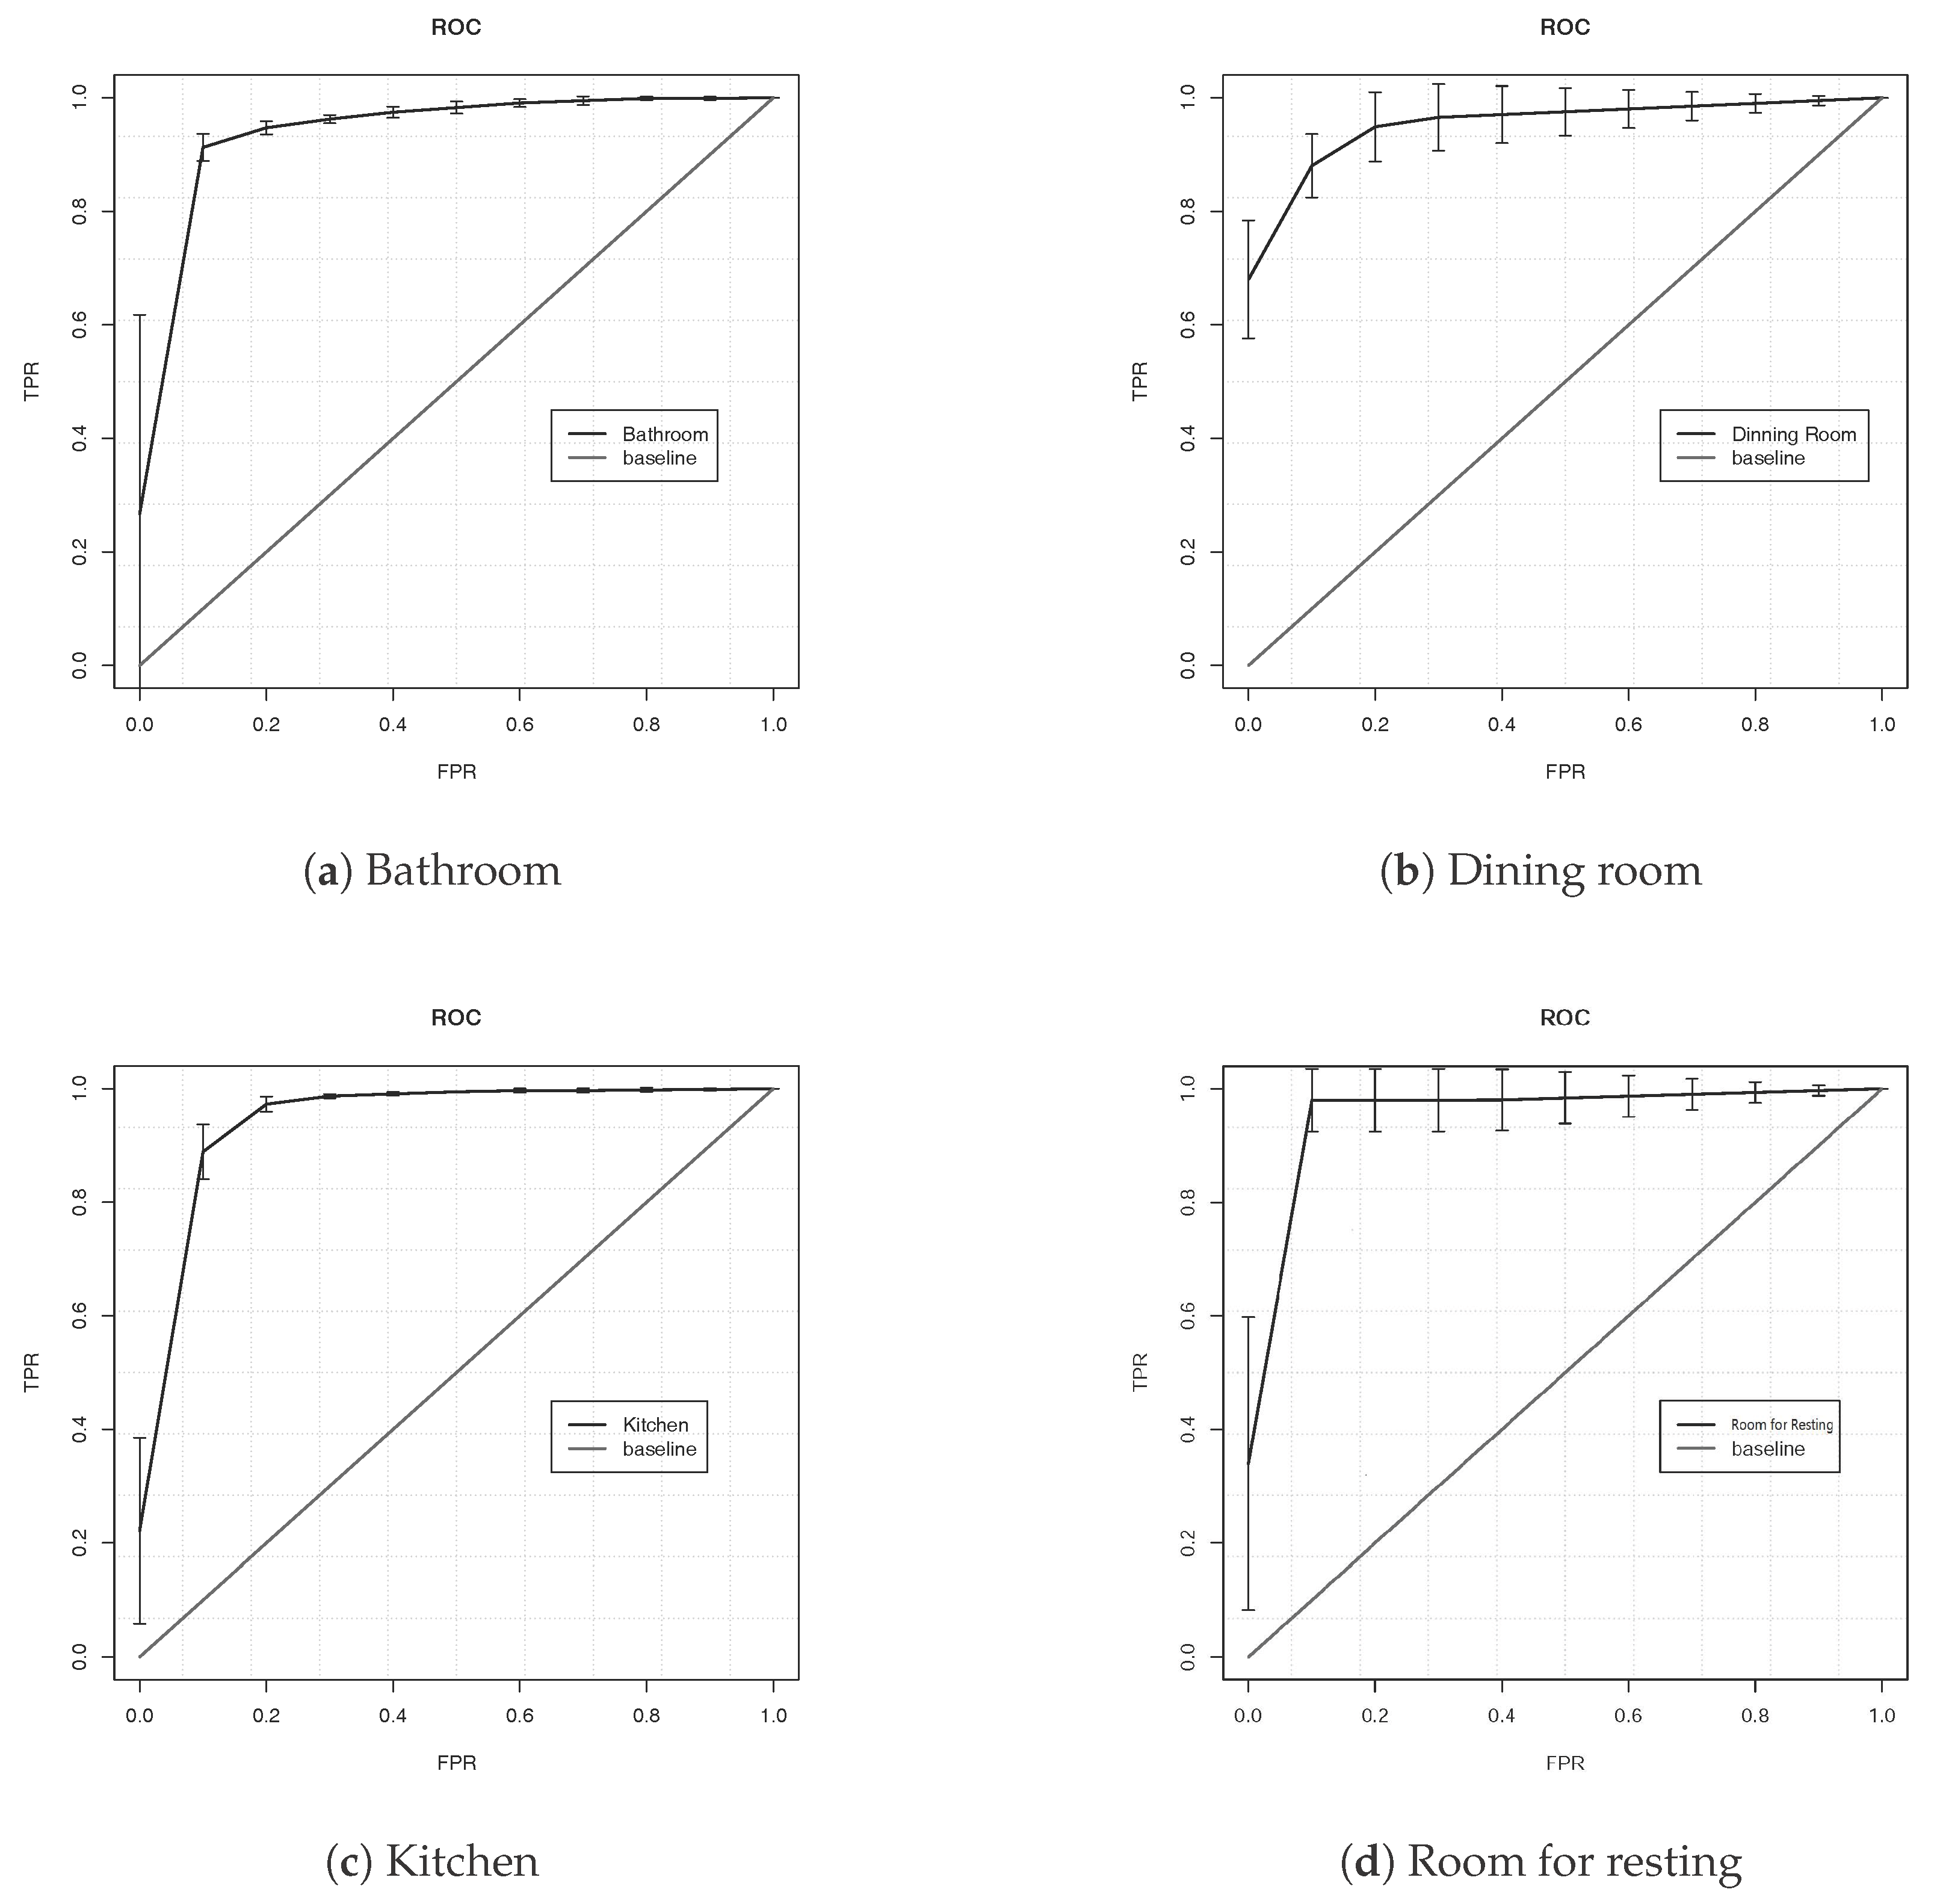
The ROC curves displayed in
Figure 5 are acquired from a blind test (66% for training and 34% for blind test), as is recommended in literature [
38]; this figure shows a true positive rate (TPR) and a false positive rate (FPR) for each location, with an average AUC of 0.951, which is consistent with the 0.956 from the OOB error of the RF model training.
4. Discussion and Conclusions
The aim of this research was to develop an indoor location estimator model using human activity recognition through activities’ sound in indoor locations (i.e., kitchen, bathroom, room for resting, and dining room). The method uses feature extraction and a well-known machine learning technique (RF) that can be implemented in several platforms and deployed in different types of devices (e.g., mobile devices) to provide context information. The results presented in
Section 3 allowed us to identify the following aspects to answer questions presented in
Section 1:
Human activity sound can correctly describe an indoor location: Human activity sounds have enough data that they can be used to describe indoor environments. Therefore, an indoor location estimation can be developed using human activity recognition context information with environmental sound as data source.
Quantile statistic features correctly describe the behavior of the signal: Statistical features that are independent of time (i.e., ordered features as quantiles) can describe the behavior of the signal to estimate the location based on the human activity. Minimal and maximum trees from the RF has as root a quantile n feature; meanwhile, descriptive statistics features tend to appear near to the final nodes (final classification).
Context information can be used to provide LBS: Providing a system with contextual information—such as location and activity—can be useful to provide services to the user; in this case, location can be recognized with human activity that is done in a certain room in an indoor environment.
One of the most interesting points presented in this work is the use of raw data to describe contextual information (human activity) to feed an RF for indoor location estimation. This well-known classification algorithm allows us to estimate the location in 10 s. Additionally, it can be trained with new data to describe new locations.
However, even though in this paper it is demonstrated that human activity can describe indoor locations, several activities could lead to reduce the fitness of the ILS estimation; for instance, activities that can be done in more than one room (chewing food or reading a book). This problem must be studied with a robust ILS in terms of time dependence and/or a specific activities room description based on an ontology.
Further, gene rank allows us to see that, even when all features contribute to generate the classification model, to achieve a higher AUC, a deeper analysis of features is needed, and complemented by other techniques of context or temporal inclusion.

 ,
, 


