Obstacles and Opportunities of Using a Mobile App for Marine Mammal Research

1
College of Earth Ocean and Atmospheric Science, Oregon State University, 104 CEOAS Administration Building, Corvallis, OR 97333, USA
2
Department of Biology, University of Redlands, 1200 E. Colton Ave., Redlands, CA 92373, USA
3
Alaska Whale Foundation, PO Box 1927, Petersburg, AK 99833, USA
4
Department of Fisheries and Wildlife, Marine Mammal Institute, Oregon State University, 2030 SE Marine Science Drive, Newport, OR 97365, USA
*
Author to whom correspondence should be addressed.
ISPRS Int. J. Geo-Inf. 2018, 7(5), 169; https://doi.org/10.3390/ijgi7050169
Submission received: 30 March 2018
/
Revised: 24 April 2018
/
Accepted: 28 April 2018
/
Published: 3 May 2018
(This article belongs to the Special Issue Geoinformatics in Citizen Science)
Abstract
:This study investigates the use of a mobile application, Whale mAPP, as a citizen science tool for collecting marine mammal sighting data. In just over three months, 1261 marine mammal sightings were observed and recorded by 39 citizen scientists in Southeast Alaska. The resulting data, along with a preliminary and post-Whale mAPP questionnaires, were used to evaluate the tool’s scientific, educational, and engagement feasibility. A comparison of Whale mAPP Steller sea lion distribution data to a scientific dataset were comparable (91% overlap) given a high enough sample size (n = 73) and dense spatial coverage. In addition, after using Whale mAPP for two weeks, citizen scientists improved their marine mammal identification skills and self-initiated further learning, representing preliminary steps in developing an engaging citizen science project. While the app experienced high initial enthusiasm, maintaining prolonged commitment represents one of the fundamental challenges for this project. Increasing participation with targeted recruitment and sustained communication will help combat the limitations of sample size and spatial coverage. Overall, this study emphasizes the importance of early evaluation of the educational and scientific outcomes of a citizen science project, so that limitations are recognized and reduced.
Keywords:
citizen science; marine mammal; opportunistic data; Alaska; spatial bias; sample size; volunteer; education; recruitment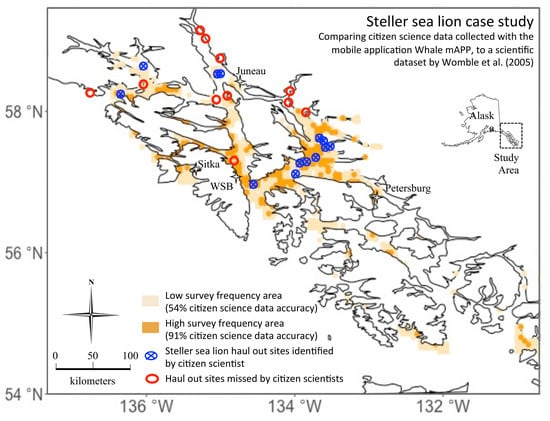
1. Introduction
An estimated 37% of marine mammals are at risk of extinction [1] due to long-term, broad-scale, and adverse geopolitical issues including pollution, habitat loss, shipping, and global climate change [2,3]. Monitoring the impacts of these pressures on the distribution patterns of wide-ranging marine mammals requires data across large temporal and spatial scales [4,5]. Current monitoring efforts lack the spatial extent and frequency required to detect abrupt and fast marine mammal declines [6], and therefore limit efforts to manage and protect marine mammals from various pressures. Furthermore, many applied and basic ecological questions are left unanswered as they occur at large geographic and temporal scales beyond the reach of traditional research methods [7].
One approach to combat the scarcity of such data is to embrace citizen science, a non-standardized alternative method of data collection [8]. Citizen science projects are often focused on collecting multi-year and regional-scale data [9,10] primarily to estimate species distributions [9,11,12,13]. Citizen science volunteered geographic information projects gather a diverse set of data on both website and mobile application platforms [14,15,16] to accomplish various tasks, ranging from mapping wheel chair accessibility locations [17] to monitoring environmental health in a city [18]. Further, citizen science research represents a low cost approach for gathering large spatial scale data, enabling more data collection than what could feasibly be accomplished by a scientist with equivalent monetary and time budgets [9,11,13]. In addition, these projects often provide educational benefits including increased content knowledge and perspective on science [12,19,20]. One such example is the avian citizen science project eBird that contributed to over 150 peer-reviewed articles to date, increased scientific understanding of avian migration ecology, informed conservation policy, and provided an invaluable educational tool for users [21]. Similarly, these methods can be applied to marine mammal research as well. Examples of marine mammal citizen science research include: the American Cetacean Society surveys [22,23] annual volunteer cetacean counts in Hawaii [24], specific species projects [25,26], and analyses of historical whaling records [5,27,28,29,30].
While citizen science projects can provide a vast array of scientific and educational benefits, the methods and data should be properly evaluated and interpreted with caution. Limitations including data fragmentation, uncertainty regarding data accuracy, and limited applicability for research, must be overcome to have a successful project [19,31]. In addition, unlike traditional scientific studies that use standardized transects and survey methods, citizen science projects often do not regulate the “survey area” or range covered by an individual data collector. This discrepancy can be seen in studies that show data over-reported in high use areas [32] and for uncommon species [33]. Sampling error can also occur when observers differ in their ability to detect, identify and quantify species or events [32], leading to variation in data accuracy [10,34,35]. Sample size, coupled with species’ ecological and detection differences can alter the performance of distribution models [36]. Consequently, inadequate evaluation of these biases associated with citizen science data will lead to false results that fail to accurately describe the species distribution.
This study examined some of the opportunities and obstacles faced when using the citizen science Android-based mobile application (app) called Whale mAPP (www.whalemapp.org) to record opportunistic marine mammal sighting data in Southeast Alaska. In sum, the Whale mAPP project aims to apply tailored citizen science methods to monitoring marine mammals within the study area of Southeast Alaska. Overall, Southeast Alaska offers a potentially ideal location for collecting these data due to a high summer ship-based tourism [37] and marine mammal abundance [3,38,39]. Concurrently, long-term studies describing marine mammal distributions are resource intensive and therefore limited [38,39,40,41], making robust and reliable marine mammal data in this region valuable.
To test how well Whale mAPP could generate such a dataset, citizen scientists were recruited to use the app in the summer of 2014. Objectives included evaluating the potential educational and scientific benefits and limitations of Whale mAPP for the purpose of improving this and future citizen science projects. To achieve the educational objectives, citizen scientists completed a questionnaire before and after using the mobile app to assess participants’ motivations, general experience, and educational outcomes of using the app. Technological glitches and participant retention added additional insight.
To evaluate data quality, spatial, user, and sample size biases were measured. A Steller sea lion case study was used to measure the robustness of the resulting species data by comparing the Whale mAPP data to data collected using traditional survey methods [41]. By examining the Whale mAPP citizen science project through both a scientific and educational lens, this study emphasizes the importance of evaluating all components of a citizen science project.
Overall, Whale mAPP is used as a case study to demonstrate the value of project assessment for improving citizen science recruitment, retention, and data quality. This study also describes common citizen science data limitations including user retention, spatial bias, sample size, and technology errors. Thus, evaluating these restrictions and designing a project to reduce biases is key for supporting a successful citizen science project.
2. Materials and Methods
Citizen scientists used Whale mAPP, a mobile app designed for collecting opportunistic marine mammal data [42], in Southeast Alaska from 20 June to 30 September 2014. The app was tailored to this region, limiting possible species selection to those commonly found in the area: mysticetes (humpback whale Megaptera novaeangliae, minke whale Balaenoptera acutorostrata, fin whale Balaenoptera physalus, gray whale Eschrichtius robustus), odontocetes (killer whale Orcinus orca, Dall’s porpoise Phocoenoides dalli, harbor porpoise Phocoena phocoena, Pacific white-sided dolphin Lagenorhynchus obliquidens), pinnipeds (Steller sea lion Eumetopias jubatus, harbor seal Phoca vitulina, California sea lion Zalophus californianus), and other (sea otter Enhydra lutris) [3,39].
Once activated, Whale mAPP automatically recorded the user’s location every 30 s, resulting in a record of the survey track line (Figure 1). Upon sighting a marine mammal, users selected the binocular icon (Figure 1) and were asked to identify the species using a drop-down menu. Additionally, users were asked to record the number of individuals (categorical options: 1, 2, 3, … to 10, then 11–15, 16–20, 21–30, etc.), distance and direction to the animal(s) (categorical options: N, NE, E, SE, S, SW, W, NW, and 0–500 m, 500 m–1 km, 1–2 km, 2–5 km, 5+ km), the animal’s behavior (categorical options: feeding, logging, milling, socializing, thermal regulation, travelling, other, unknown behavior), weather conditions (cloud cover and wind), and a single five star confidence rating scoring the user’s confidence in the accuracy of the data entered for each sighting (1 star being the lowest confidence, 5 stars being the highest confidence) (Figure 1). Because volunteers could, but were not required to take a photo of the marine mammal, their species identification accuracy was assessed based on their confidence ranking. The assumption was made that a higher confidence rating coincided with greater accuracy. Upon completion, a recorded sighting was noted on the map with an icon on top of the black track line (Figure 1). Since many areas of Southeast Alaska do not support cellular reception, Whale mAPP stored data locally on a base map of Southeast Alaska that was accessible offline. Once cellular reception was available, the data were automatically transmitted to a geodatabase.
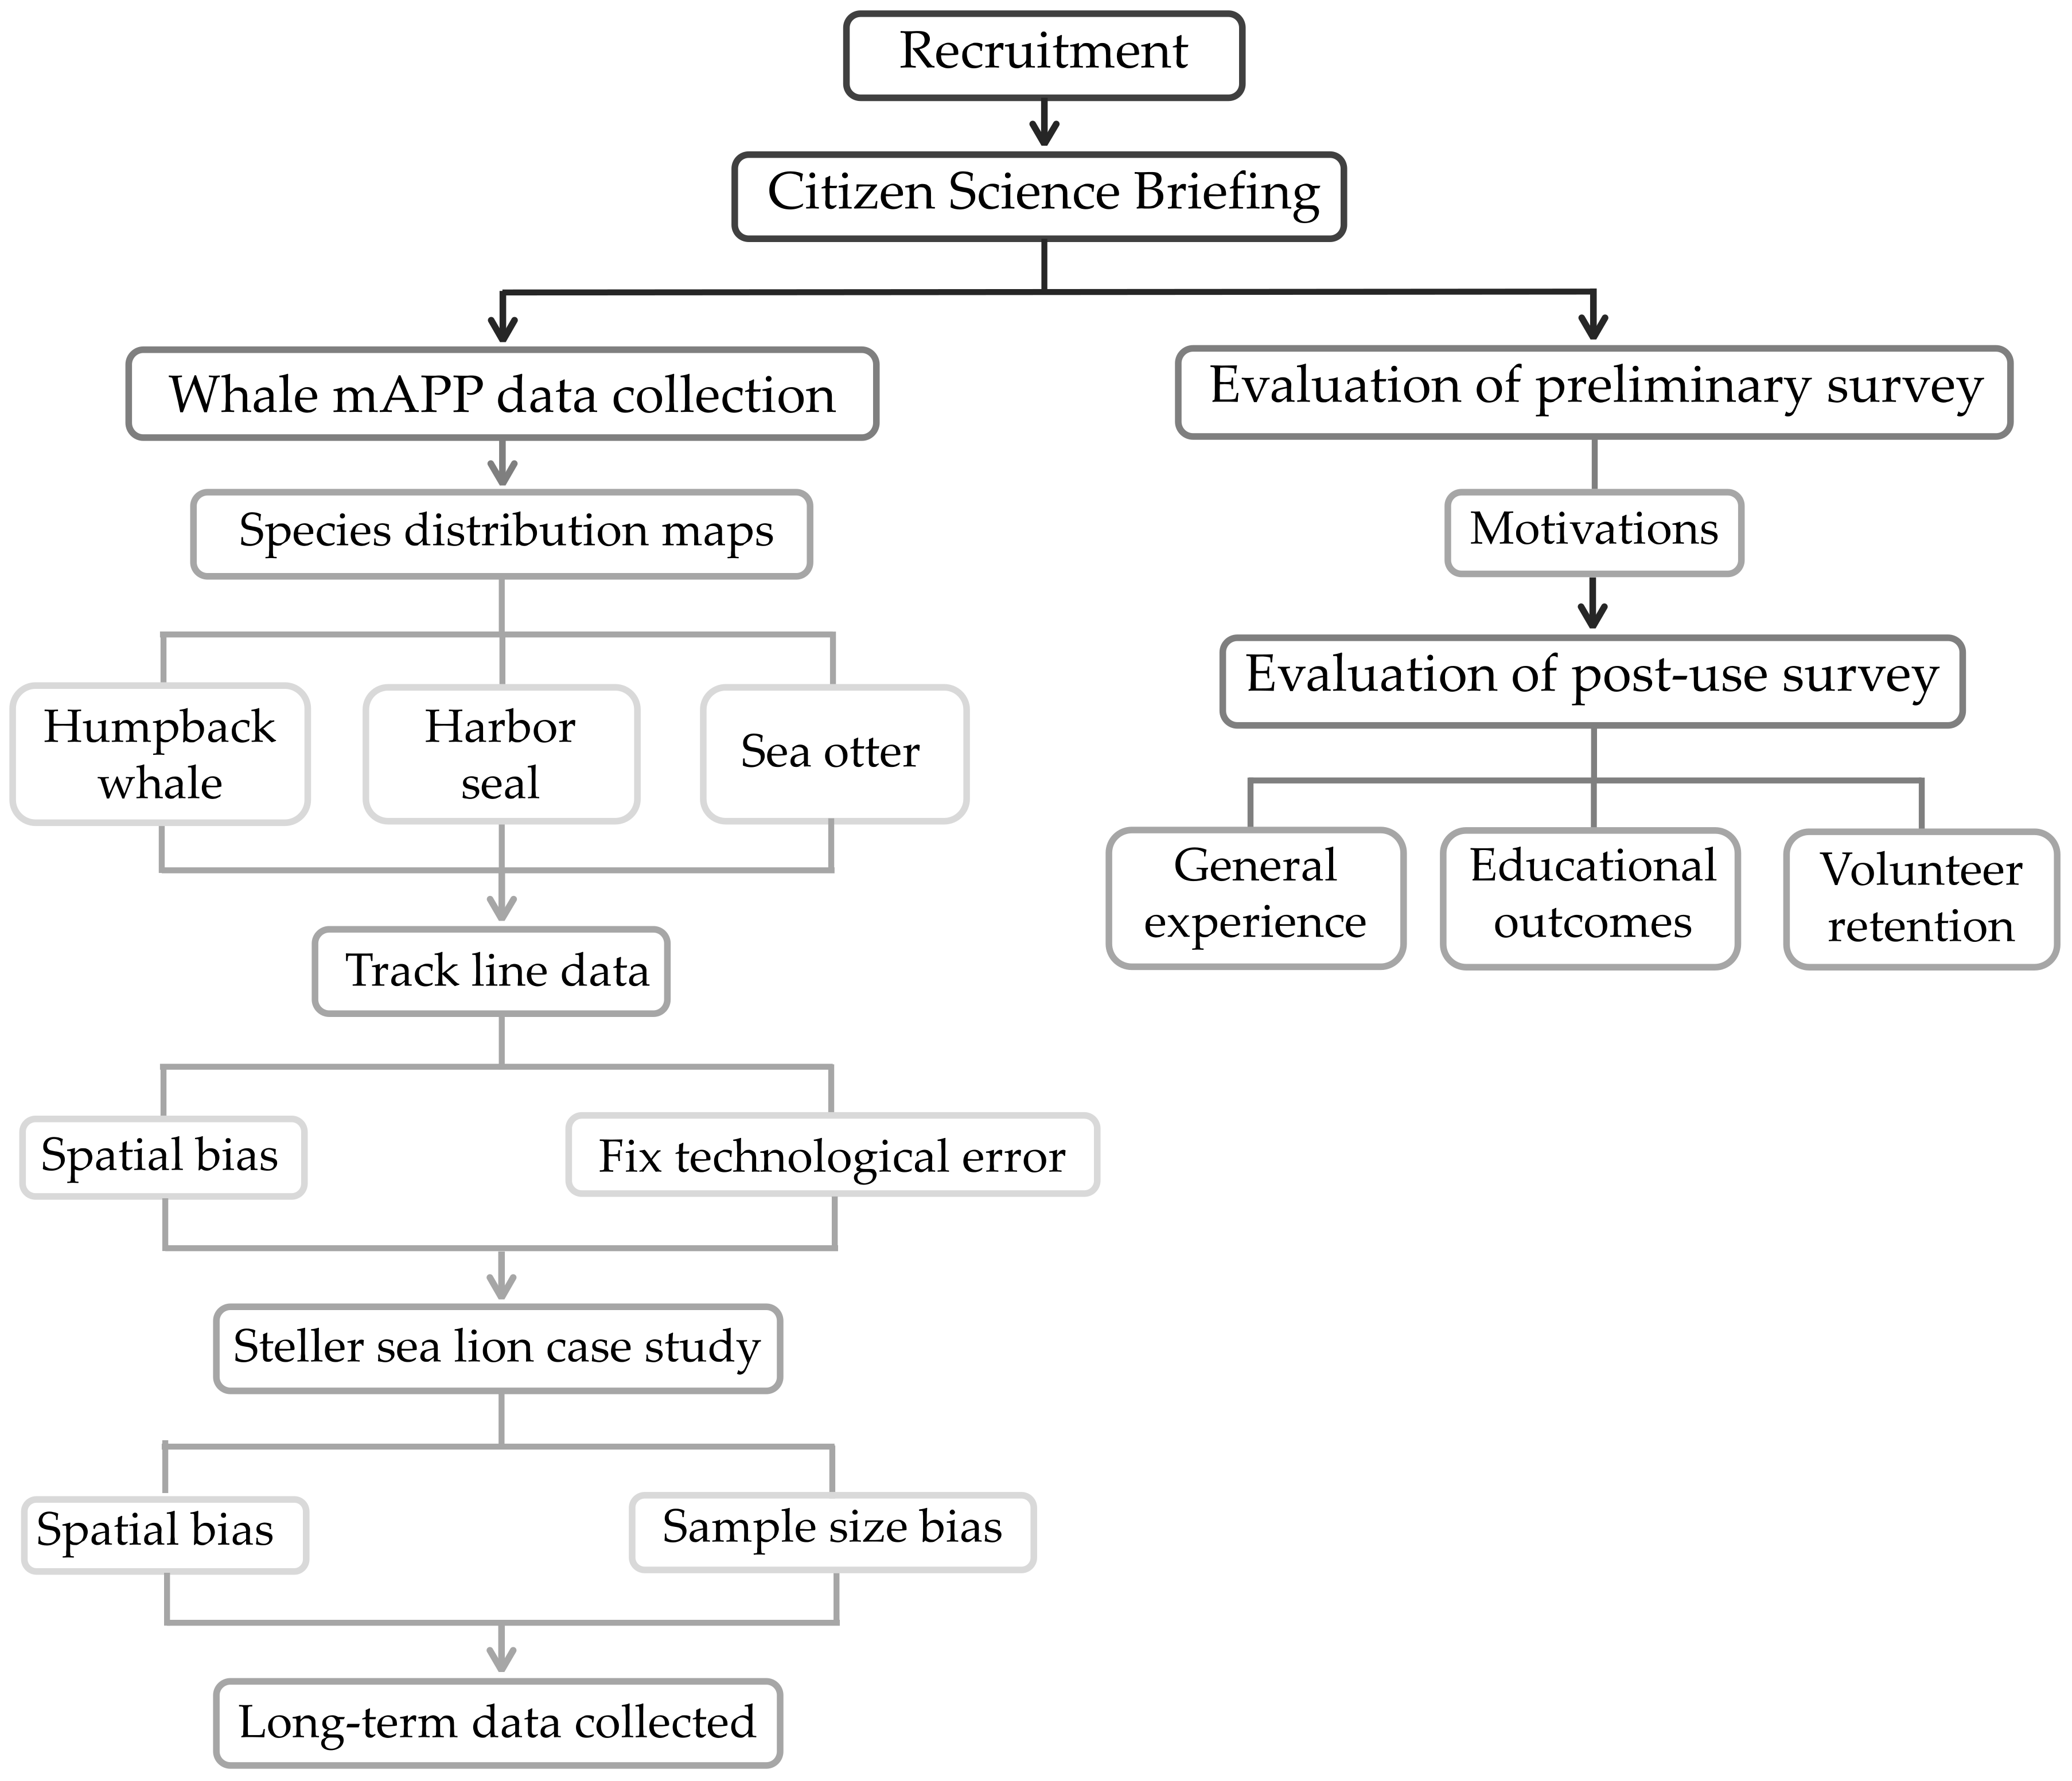
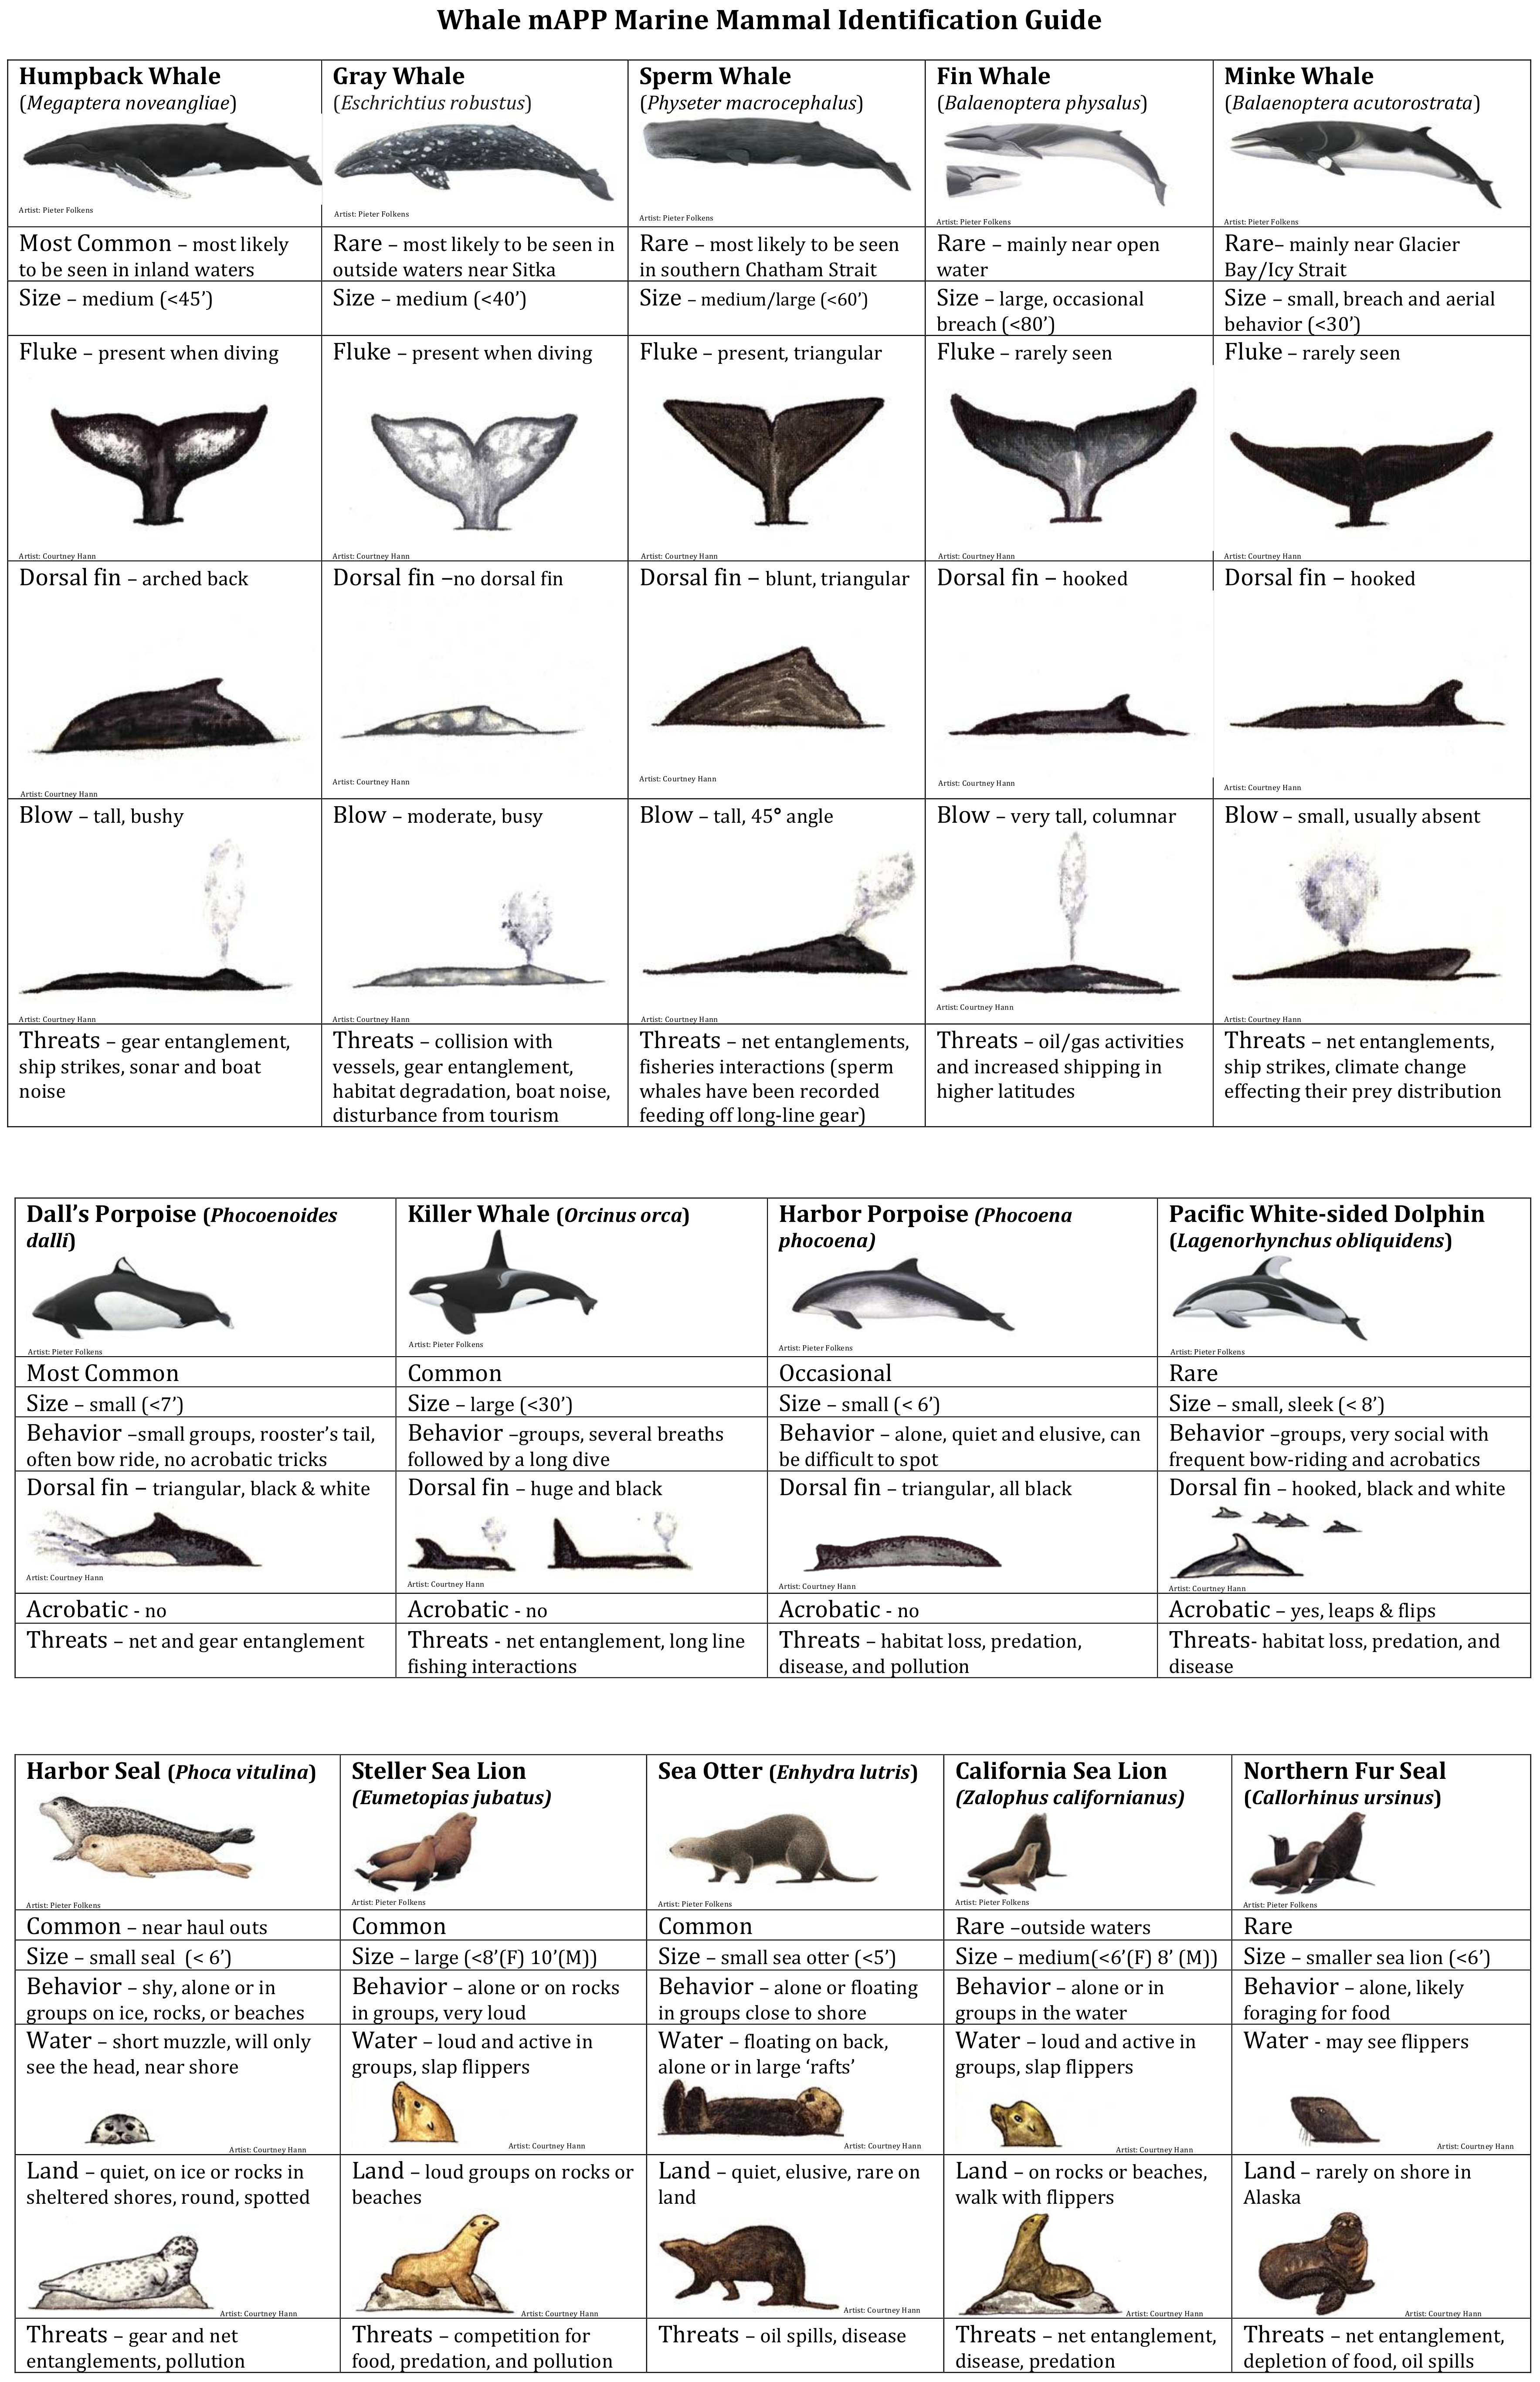
A summary of the processes and topics evaluated in this study are provided as a flowchart (Figure 2). Citizen scientists were recruited at the Alaska Whale Foundation’s Center for Coastal Conservation in Warm Springs Bay, Southeast Alaska (57.09° N, −134.84° W). Every person who entered the center was told about the project, marine mammals in the area, and asked if they were interested in using Whale mAPP. Potential participants included guests and crew aboard nature tourism cruises, private vessel operators, and commercial fishermen. All participants were provided with a user manual and marine mammal identification guide with illustrations completed by Pieter Folken (full body drawings) and Courtney Hann (all other illustrations) (Figure 3). While all participants were offered additional training, the length and duration varied based on their available time and interest. Additional training walked the citizen scientist through a mock scenario of how to use Whale mAPP, discussed scientific technique and rationale, and clarified data collection methods. Outside of this study, Whale mAPP citizen scientists rarely receive in-person training and instead rely on online instructions for using the app. Therefore, the in-person training was not required for participants in this study. To maximize user participation, citizen scientists were allowed to collect data following their preferred routes of travel [9,11]. A simple data entry platform with clear data protocols [43] and a standardized method [44] were implemented to minimize error and ensure the public could collect and submit accurate data.
2.1. Participant Surveys
Participant motivations, general experience, and educational outcomes were evaluated using two questionnaires: one completed prior to using Whale mAPP and the second completed after using the app for more than two weeks. Questions included marine mammal identification test, ranking knowledge of various topics, selecting why they chose to use Whale mAPP and why/if they stopped, noting the percent of time spent doing various activities while using Whale mAPP, noting actions taken outside of using Whale mAPP to learn about marine mammals, and ranking various statements regarding their experience using Whale mAPP. Questionnaires were designed using Qualitrics software and distributed in person and by email. All statistical analyses were performed with Microsoft Excel 14.2.0 and R [45]. Permission to collect data on volunteers over the age of 18 was granted by the Oregon State University 5234 Institutional Review Board, study number 6273.
Two informal learning goals were also considered in conjunction with this study: (1) participants’ developing interest in science; and (2) participants’ understanding of science knowledge [46]. The first goal, interpreting participants’ developing interest in science, was assessed by identifying user interests and any actions they took to learn more about marine mammals. Consequently, to evaluate user motivation, participants responded to questions on why they chose to participate in the project, if they would continue to use Whale mAPP, and their enjoyment level from participating. From this, user attention and variability was determined by recording the time spent scanning the water and looking for marine mammals compared to focusing on other activities.
The second goal, evaluating participants’ understanding of science knowledge, focused on interpreting the user’s growth in marine mammal content knowledge. To assess content knowledge, participants responded to questions regarding marine mammal identification and knowledge. Then, responses from the post-use survey were compared to those of the preliminary survey to identify improvement in identification skills and content knowledge. Since the data were not normally distributed, paired Wilcoxon rank sum tests using the R package ‘coin’ were used to determine significance change between the preliminary and post questionnaire responses [47].
2.2. Mapping and Evaluating Whale mAPP Data
Marine mammal distribution maps were produced using a lattice-based density estimator [48]. Given the irregular boundaries and abundance of islands in Southeast Alaska, a lattice-based density estimator was used to generate estimates of core- (25% density), intermediate- (50% density), and broad-use (95% density) areas of species distribution. Similar methods were used to estimate marine species distributions in other areas with complex shorelines and islands [49,50]. The probability that the random walk stayed in the same location, M, was set in accordance with previous studies to be 0.5 [48,49]. The estimation of the optimal smoothing parameter, k, was determined using cross-validation in the package ‘latticeDensity’ for each species [51]. Node spacing of 50 m was used because it was sufficient for delineating the coastlines while still allowing computer computation of the complex study area. All analyses were conducted in R [45].
To demonstrate a potential use of Whale mAPP data for marine mammal research, the collected data on Steller sea lions was compared to results from Womble et al.’s (2005) standardized survey of haul out locations in Southeast Alaska. Haul out sites are areas where pinnipeds, in this case Steller sea lions, temporarily leave the water and ‘haul out’ on land. These are generally established locations and commonly used to describe Steller sea lion distribution [41]. To minimize inter-annual variation, we aggregated the scientifically collected data from March through May 2001 and 2002 [41] for comparison to Whale mAPP data between June and September 2014. This dataset and species were chosen as the case study because the dataset represents the most comprehensive published dataset that surveyed all of Southeast Alaska for Steller sea lions [41]. In addition, haul out sites are easily identifiable and comparable between datasets.
Whale mAPP Steller sea lion data accuracy were measured by counting the number of scientifically collected haul out locations [41] recorded by Whale mAPP users. To determine how sample size influenced the accuracy of Whale mAPP data, a discovery curve was generated that plots the percent of scientifically collected haul out sites [41] recorded by Whale mAPP users with every 5-unit sighting increase in Whale mAPP sample size. For each five-unit sample size increase, ten random Whale mAPP sub-samples were generated.
For the Steller sea lion case study, ‘high survey effort’ was differentiated to quantify how spatial bias affected the quality of citizen science data. To accomplish this, track line data of Whale mAPP user paths were mapped to examine spatial biases. Because 90% of total track line data were represented in the 75% lattice-based density contour of survey effort, the 75% lattice-based density contour was used to define ‘high track line effort’. The ‘high Steller sea lion sighting effort’ was defined by the 50% lattice-based contour because these data included more than 90% of all Steller sea lion data. The final ‘high survey effort’ was the compilation of the ‘high track line effort’ and ‘high Steller sea lion sighting effort’ spatial layers. While, minimum survey effort was determined by combining all track line data with all Whale mAPP sighting data. Ultimately, this process created one layer representing all locations that Whale mAPP users traveled to at least once.
3. Results and Evaluations
Of the 216 people encountered at the recruitment center during the summer, 73.5% were interested in using Whale mAPP; however, of those only 44.7% possessed an Android device to download the app. Of the resulting 39 participants who followed through in using the app, 18 were private vessel owners, 18 were involved with nature tourism cruises, and three were commercial fishermen. From 20 June to 30 September 2014, these participants logged over 800 h to record 1261 marine mammal sightings and 10,892 km of track line data from the northern portion of Southeast Alaska to Seattle, Washington. In sum, 52.9% of sightings were of humpback whale (n = 665), 11.5% were sea otters (n = 146), 11.3% were harbor seals (n = 143), 9.2% were Steller sea lions (n = 117), 6.0% were killer whales (n = 76), 3.9% were Dall’s porpoises (n = 50), 3.3% were harbor porpoises (n = 43), 1.0% were Pacific white-sided dolphins (n = 12), and <1% were California sea lions (n = 5), minke whales (n = 2), elephant seals (n = 2), fin whale (n = 1), and gray whales (n = 1).
3.1. Questionnaire Results
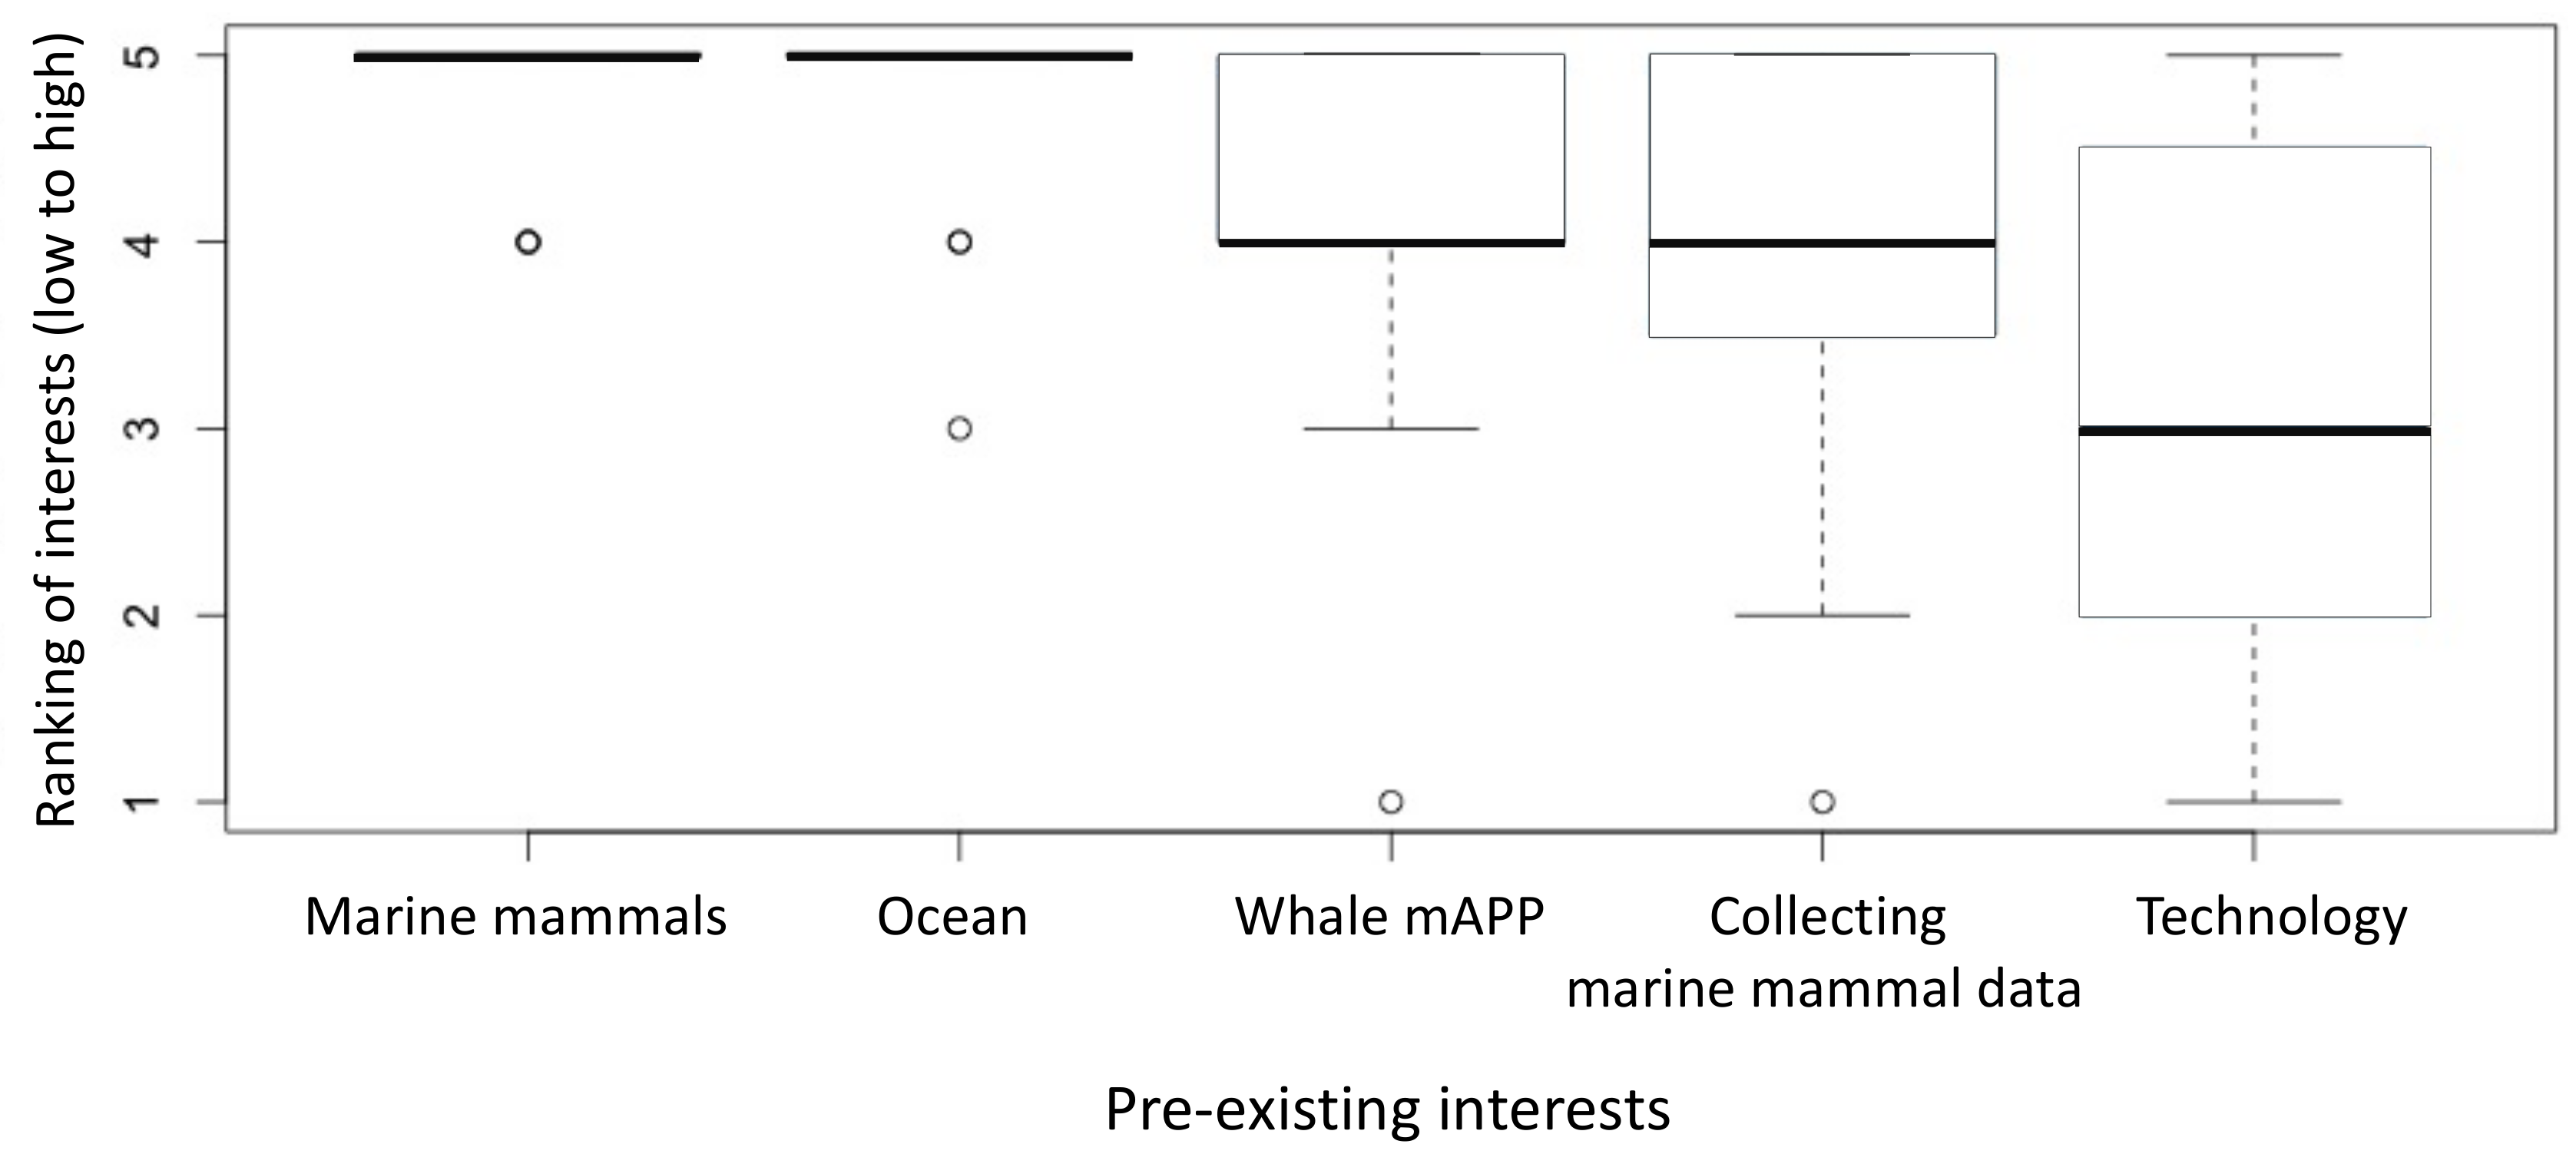
In sum, 29 (74%) Whale mAPP users completed the pre-use questionnaire, and of those, 24 (83%) followed up with the post-use questionnaire. A majority of volunteers, 78.3% reported they enjoyed using Whale mAPP, 73.9% found it easy to use and 82.6% would recommend it. When asked about their interests prior to using Whale mAPP, citizen scientists reported pre-existing interests in marine mammals, the ocean, using Whale mAPP, collecting marine mammal data, and to a lesser degree technology (Figure 4). When asked whether they took any self-initiated actions to learn about marine mammals as a result of using the app, 56.5% reported talking to a peer, 47.8% read a book, 34.8% talked to a scientist, and 8.7% reported going on a wildlife tour, talking to family, or going to a museum.
Volunteers were primarily motivated to use Whale mAPP due to their interest in marine mammals (n = 17), collecting data (n = 13), science (n = 13), citizen science (n = 11), their tourist company’s association with Whale mAPP (n = 6), technology (n = 3), and/or for another reason (n = 2).
Marine mammal identification skills significantly improved after using Whale mAPP (Wilcoxon rank sum test, Z = 1.83, p-value = 0.035), with an increase in average test score rising from 76.3% ± 20.4% to 86.1% ± 19.3%. Yet, citizen scientists’ content knowledge of marine mammal conservation topics did not change after using Whale mAPP for at least two weeks.
When the study ended in September 2014, 27.3% noted they were still using Whale mAPP. Of these, 83.3% were involved with tourism cruises as either a captain or naturalist staff. The remaining 16.7% were private vessel owners. Furthermore, all of these volunteers possessed very strong pre-existing interests for the ocean and marine mammals, and very strong to strong pre-existing interest in monitoring marine mammals and Whale mAPP.
The remaining 72.7% of citizen scientists reported that they stopped using the app because they either left Southeast Alaska (68.4%), felt it was too time consuming (15.8%), encountered technology problems (10.5%), and/or for another reason (5.3%). Of those that stopped using the app because they left Southeast Alaska, 64.3% were private vessel owners and 35.7% were involved with nature tourism cruises. Furthermore, around 26.1% of volunteers thought the app required too much data entry. Long-term commitment to data collection was limited as the number of Whale mAPP sightings from Southeast Alaska to Seattle dropped from 1256 in 2014 to nine in 2015, 38 in 2016, and none in 2017. One naturalist originally recruited in 2014 also collected data in 2016. All other data collected in 2015 and 2016 were by citizen scientists not recruited during the 2014 field season.
User effort also differed between individuals as the top five recorders collected 16.6%, 14.7%, 11%, 9.2%, and 6.6% of sighting data. The other 34 participants recorded the remaining 41.9% approximately evenly. In addition, nine users collected ~73% of track line data, a value that may be due to user choice or app malfunctions as only 30% of track line data were correctly saved (participants did not know if their track line data was correctly uploaded or not). Around half of participants (52.2%) did not purposefully go out to use Whale mAPP; rather they used it when already travelling to a destination.
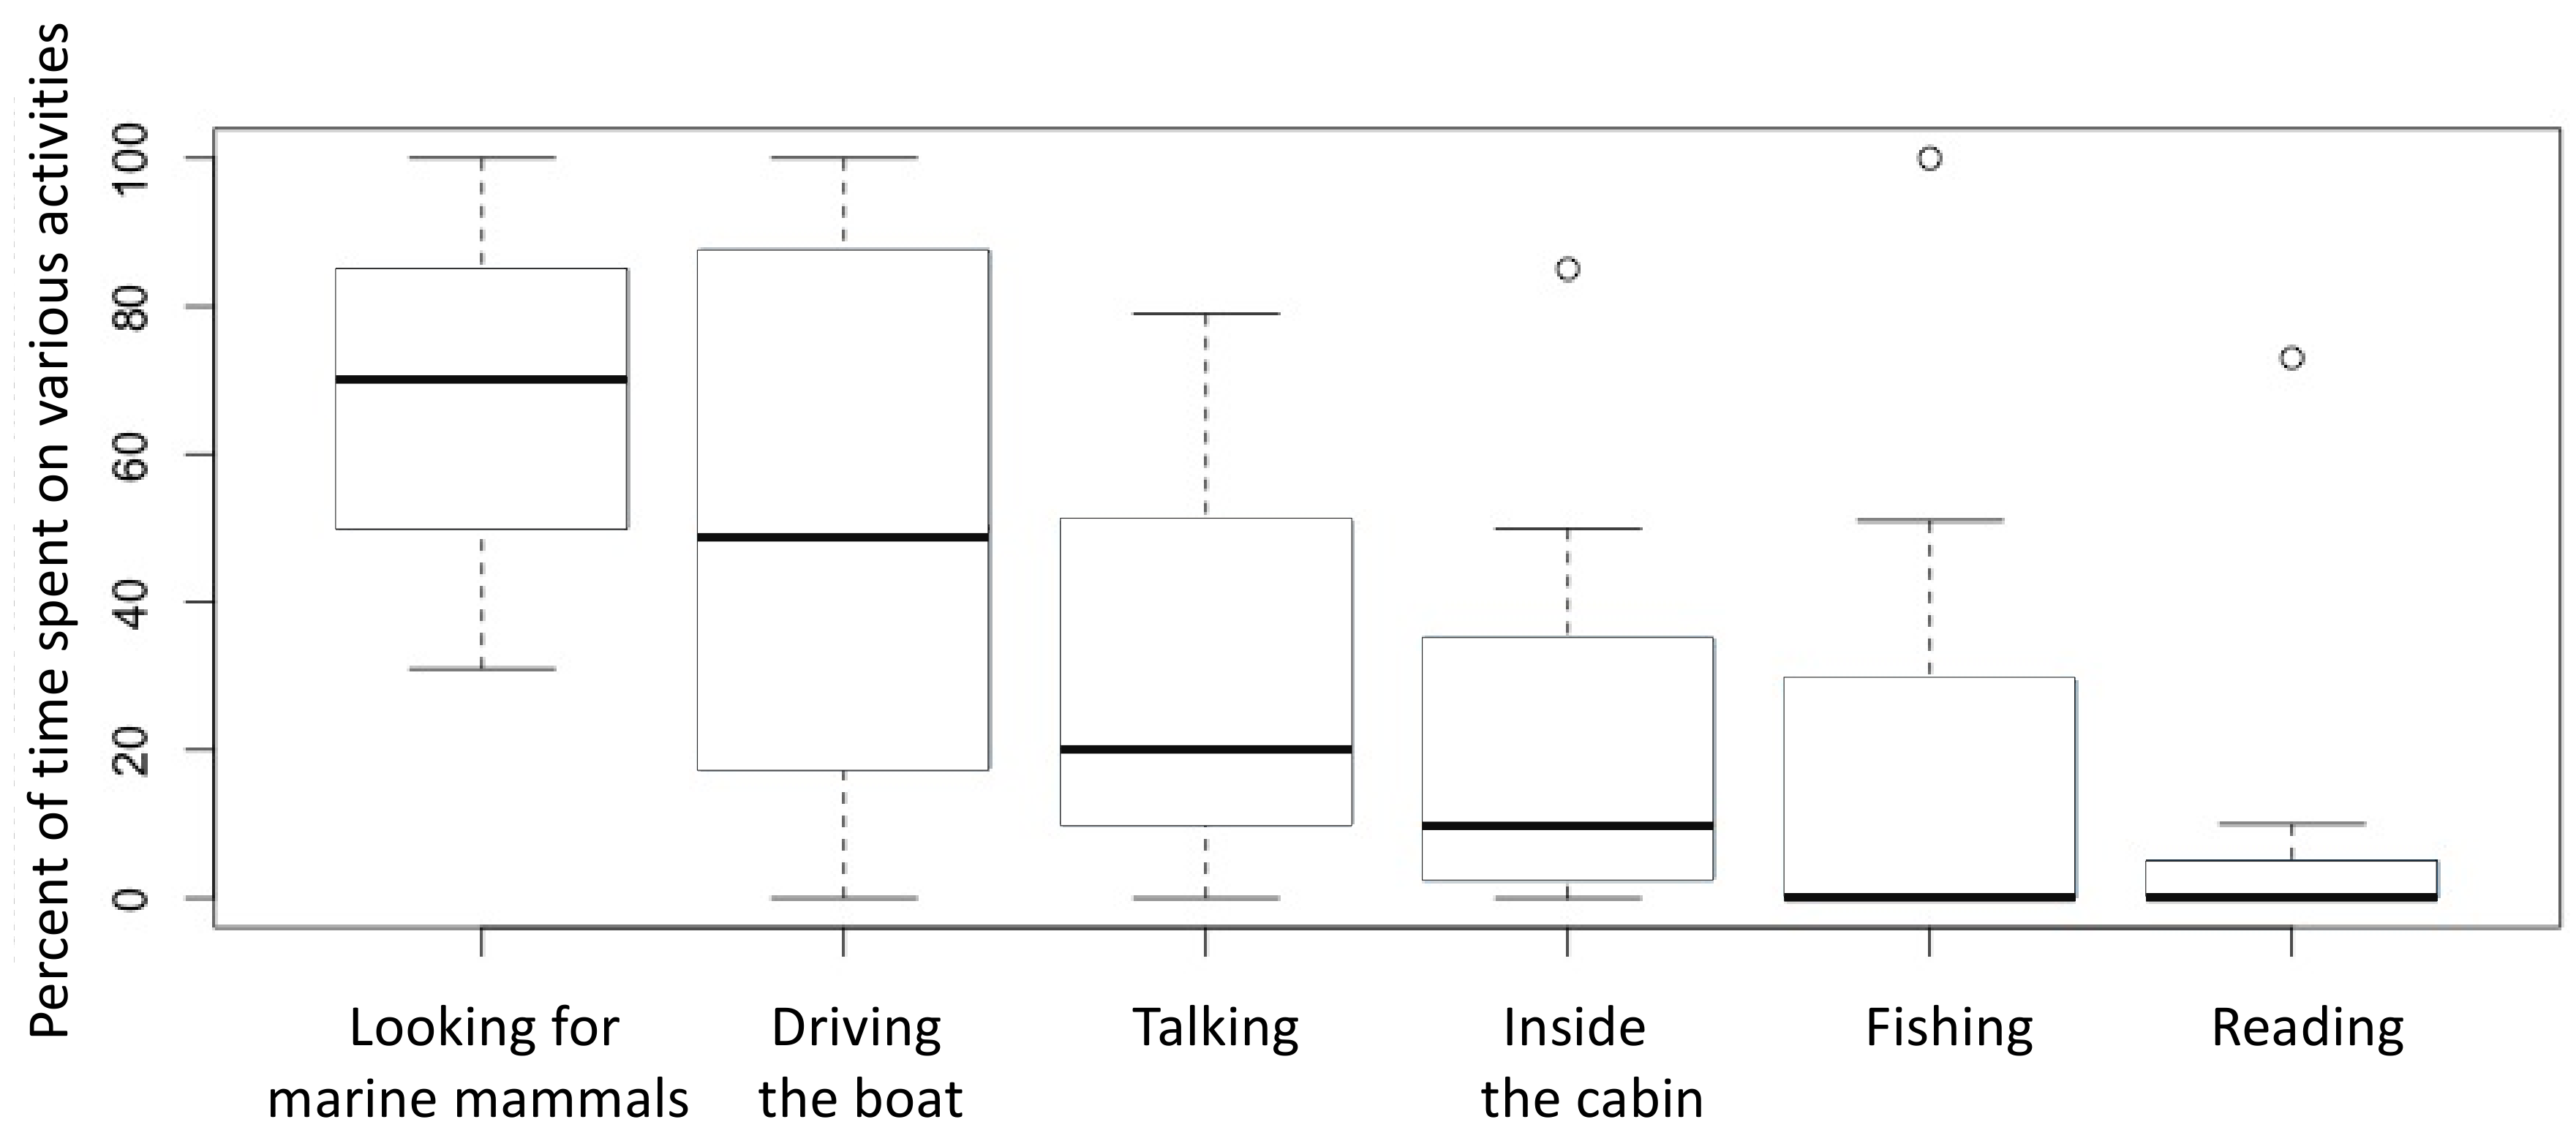
All participants spent the majority of their time scanning the water for marine mammals while using the app; however, users also reported simultaneously driving a vessel and talking for more than a third of the time (Figure 5).
3.2. Applicability to Marine Mammal Research
For the lattice-based density method, the total water area used to estimate home ranges was 15,630 km2, with each node located 0.05 km apart. Only sightings north of latitude 54°, where a majority (91.6%) of the sightings were located, were analyzed. Due to the structure of Whale mAPP, only presence data were recorded. It cannot be assumed that all marine mammals encountered on each track line were recorded. This is true for all marine mammal surveys, as even trained observers miss animals due to weather conditions, animal diving, or change. Data removed from the analysis included duplicate track line data (n = 10), data with unidentifiable users, data noted as a “mistake” by the recorder, and sightings that were revisions to previous recordings (n = 7). Additionally, due to low confidence rating (less than 3 rating) and poor visibility (<3 mile visibility), 47 sightings were removed, primarily for humpback whales (n = 22), but proportionally more for cryptic harbor (n = 4) and Dall’s (n = 4) porpoises. An average of 77.4 ± 11.5% of removed sighting were due to poor visibility. Data with confidence ratings lower than a three were removed because this ranking indicated that citizen scientists had lower than 75% confidence in the accuracy of those data. Data with visibility of less than three miles were removed because Southeast Alaska can have sudden, thick fog that significantly reduces visibility to a few hundred meters. Therefore, visibility can greatly impact the number of marine mammals a citizen scientist can spot from a boat.
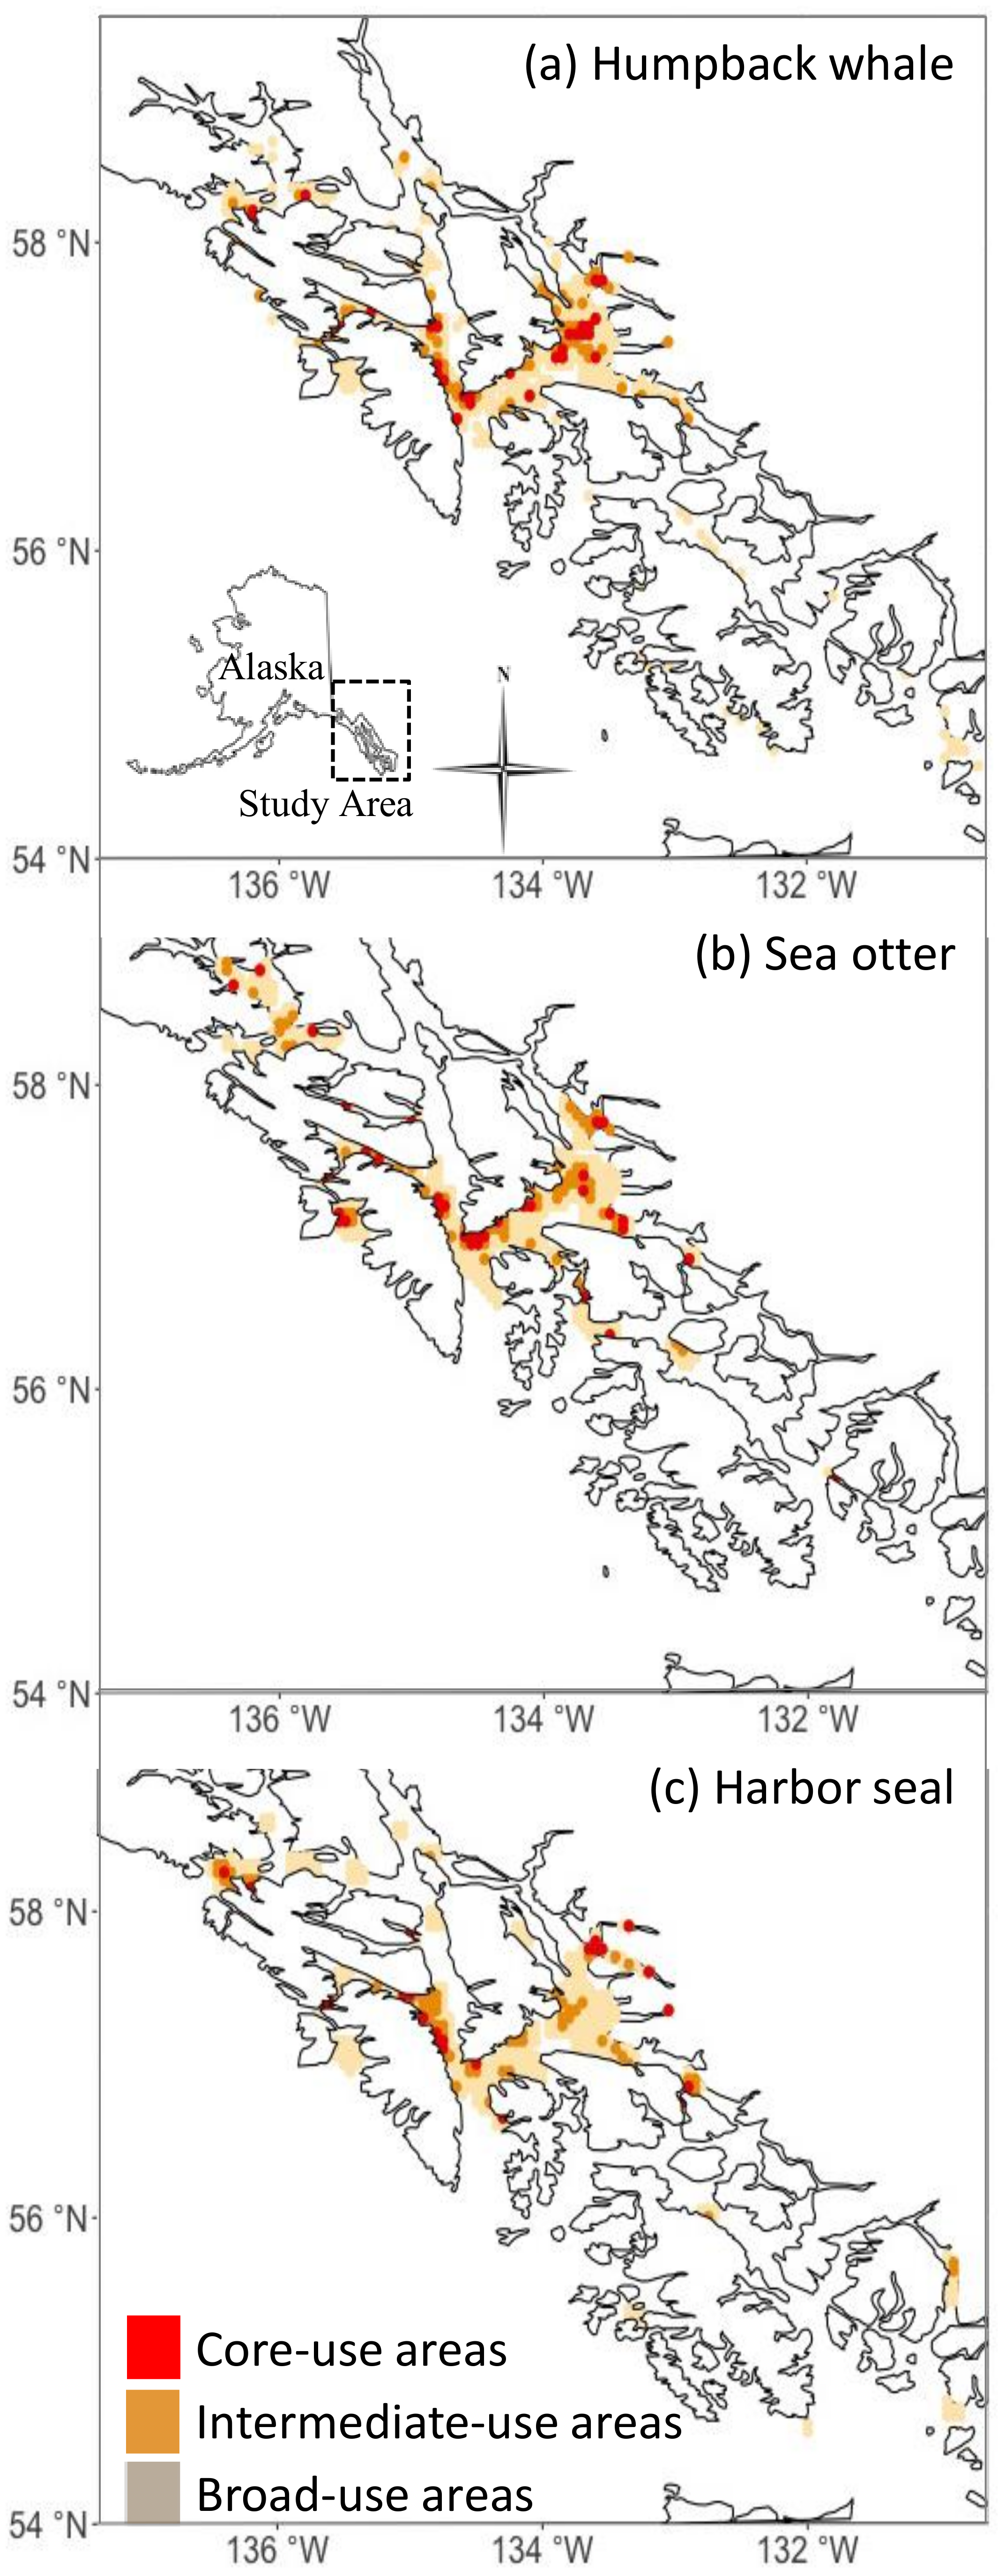
To illustrate the potential of Whale mAPP data to inform marine mammal distribution patterns, three lattice-based density maps were created for humpback whales (n = 665, k = 1), sea otters (n = 146, k = 3) and harbor seals (n = 143, k = 3) (Figure 6). Humpback whale distributions were comparable to other scientific datasets along common travel routes, but data gaps were present in the southern part of Southeast Alaska (south of 56.5° N) and the more remote northern sections of Glacier Bay and Icy Strait [38,39]. Comparison of Whale mAPP results regarding sea otter distribution to previous work [52] suggests their range has expanded from the outer western edges to throughout Southeast Alaska since early 1990. Harbor seal distribution was difficult to compare to other studies, because no detailed published studies were found outside of Glacier Bay or specific Southeast Alaskan inlets [53,54,55]. Thus, this lack of pre-existing data highlights the added value of citizen science data.
3.2.1. Steller Sea Lion Case Study
Altogether, Whale mAPP users recorded 54.2% of Steller sea lion haul out sites identified by the scientifically collected data [41], which improved to 72.2% accuracy when the comparison was limited to the areas surveyed at least once by Whale mAPP users (Figure 7). Accuracy increased further to 90.9% when the comparison was focused on high Whale mAPP survey effort areas, a common measurement of spatial bias (orange areas in Figure 7).
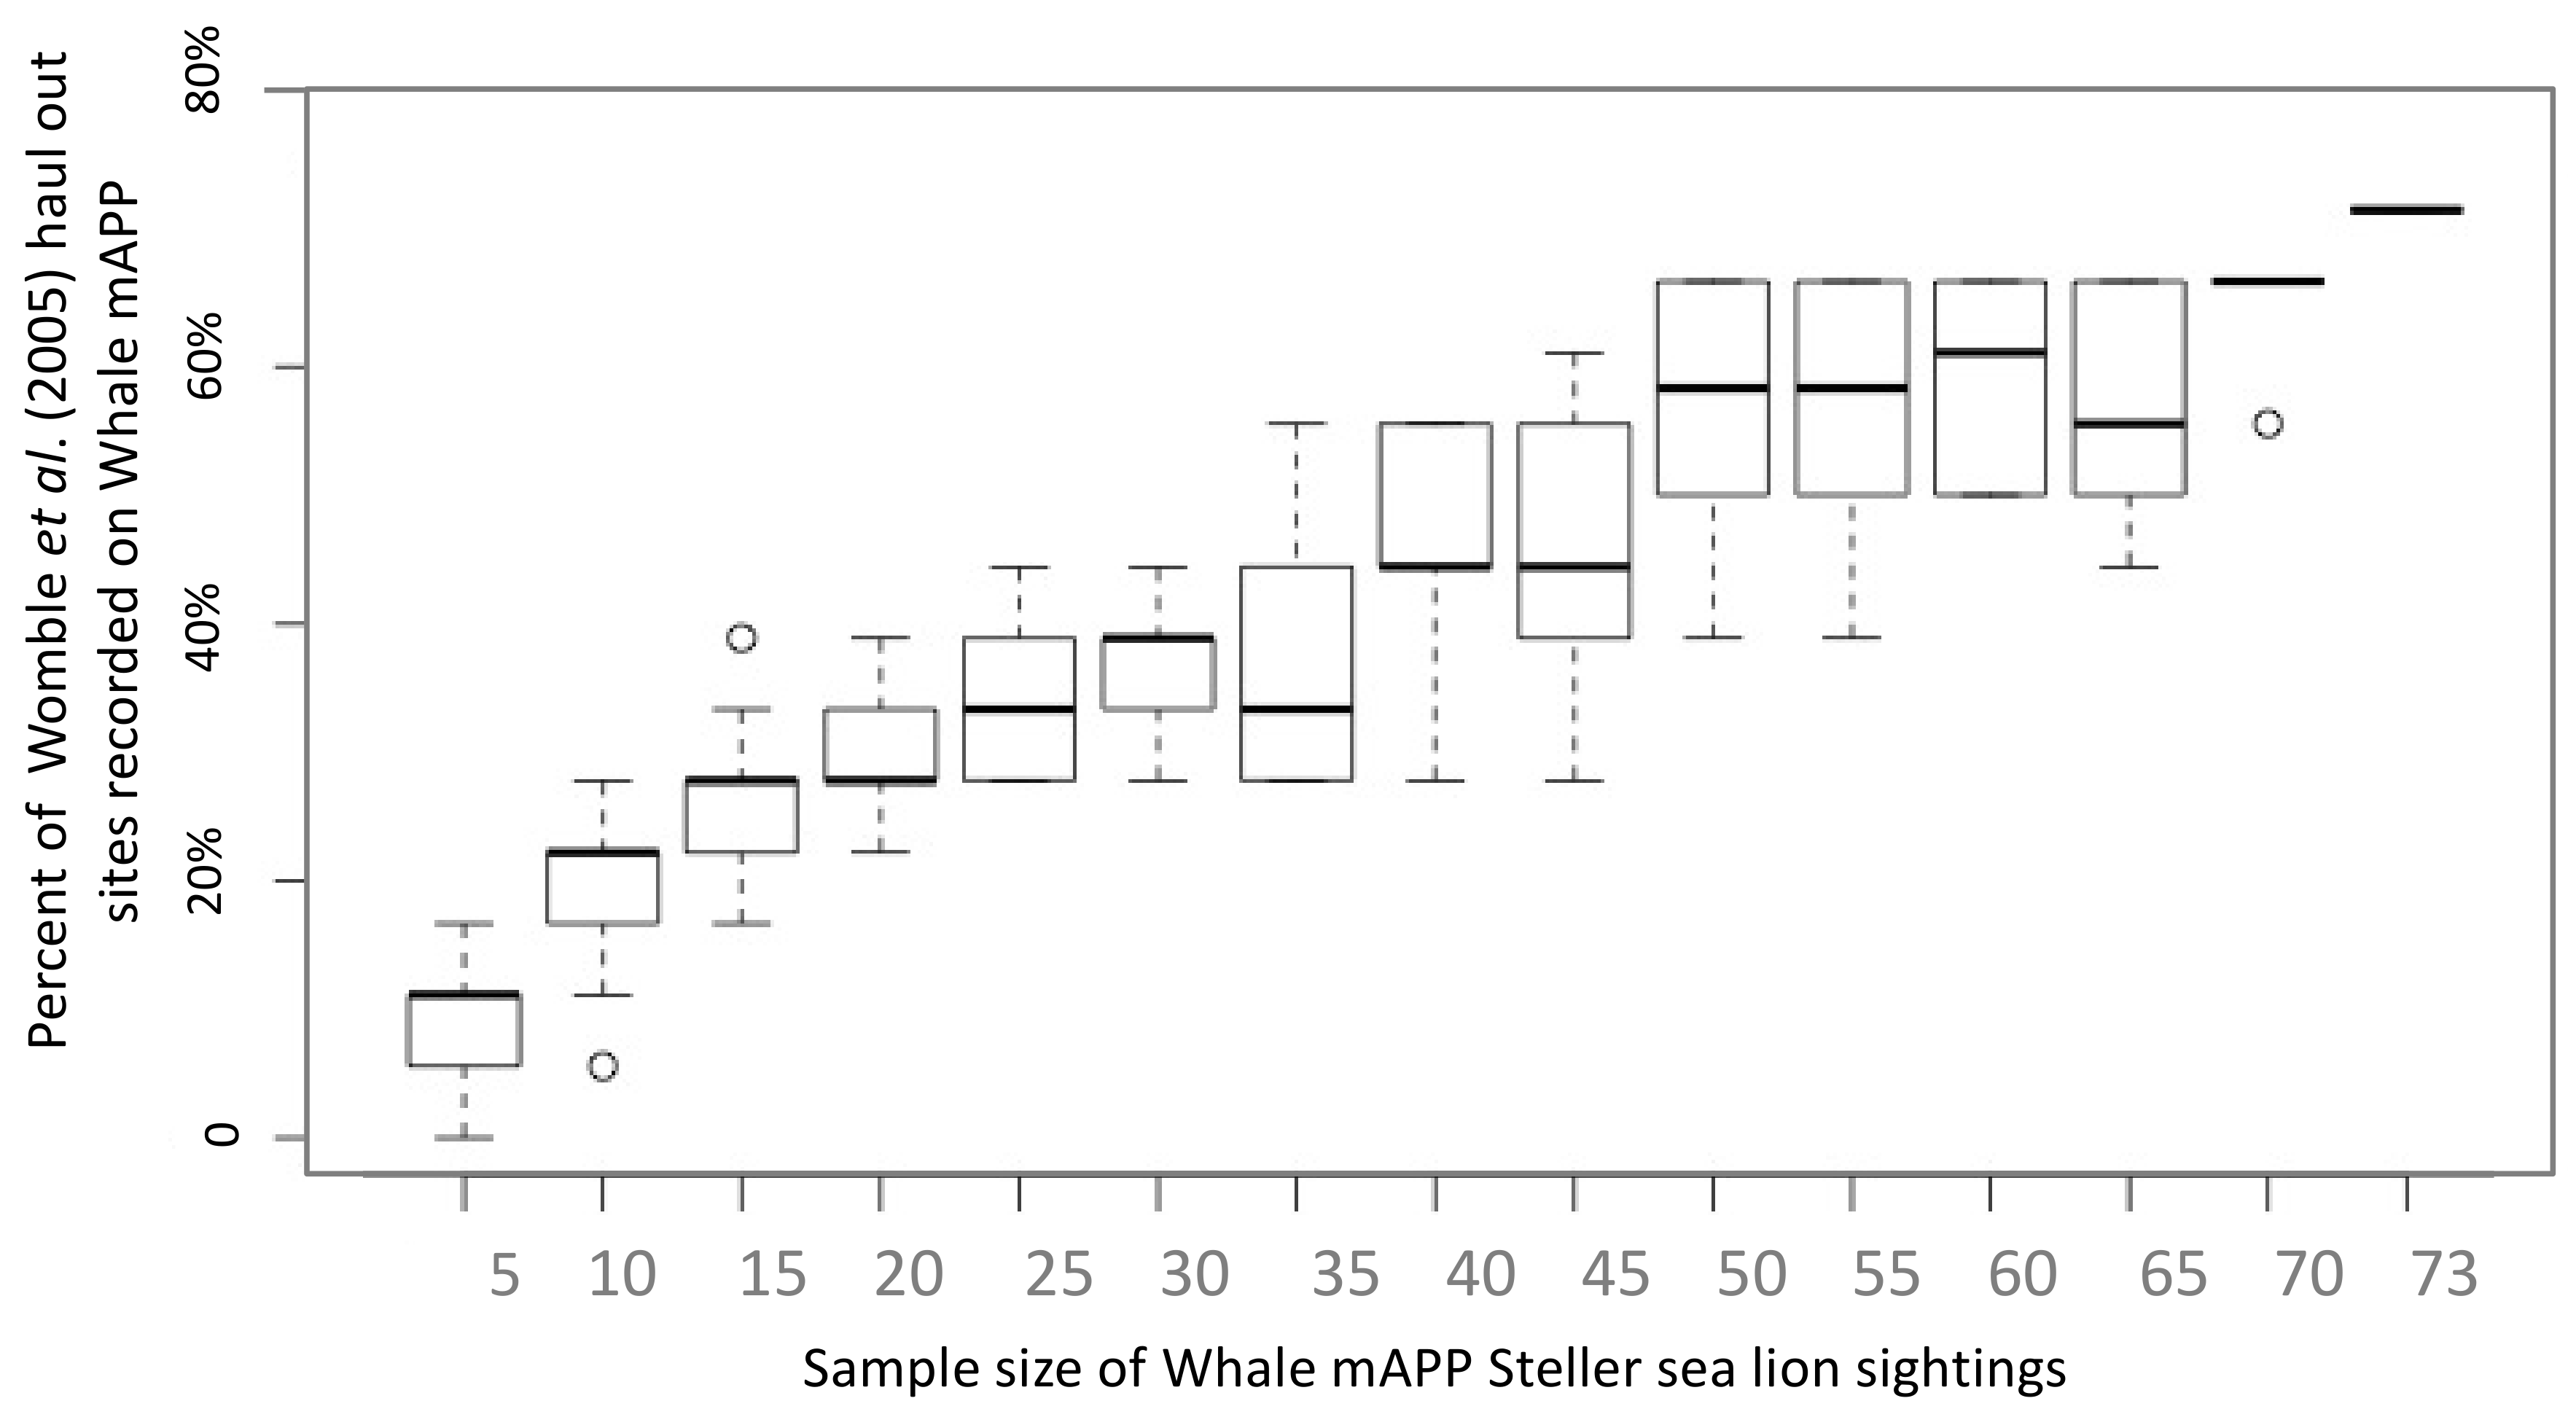
Furthermore, the discovery curve shows a linear increase in the percent of scientifically collected haul out sites [41] identified by Whale mAPP users with an increase in sample size of Whale mAPP Steller sea lion sightings (Figure 8). This data demonstrates how sample size can impact citizen science data accuracy and needs to be considered when interpreting results.
3.2.2. Spatial Bias
Approximately 70% of the track line data collected by 11 citizen scientists were not recorded due to a technological glitch in which the track line data were not uploaded to the cloud geodatabase. The remaining 30% (n = 120 track lines) were used to estimate areas of high and low survey effort. Twenty-eight, or ~71.8% of participants, contributed to the vessel track line data. On average, each user travelled 80 km and recorded 3.5 ± 4.0 marine mammal sightings per track line. Technological errors that led to the loss of track line data have subsequently been fixed in Whale mAPP, as these data are essential for interpreting spatial bias.
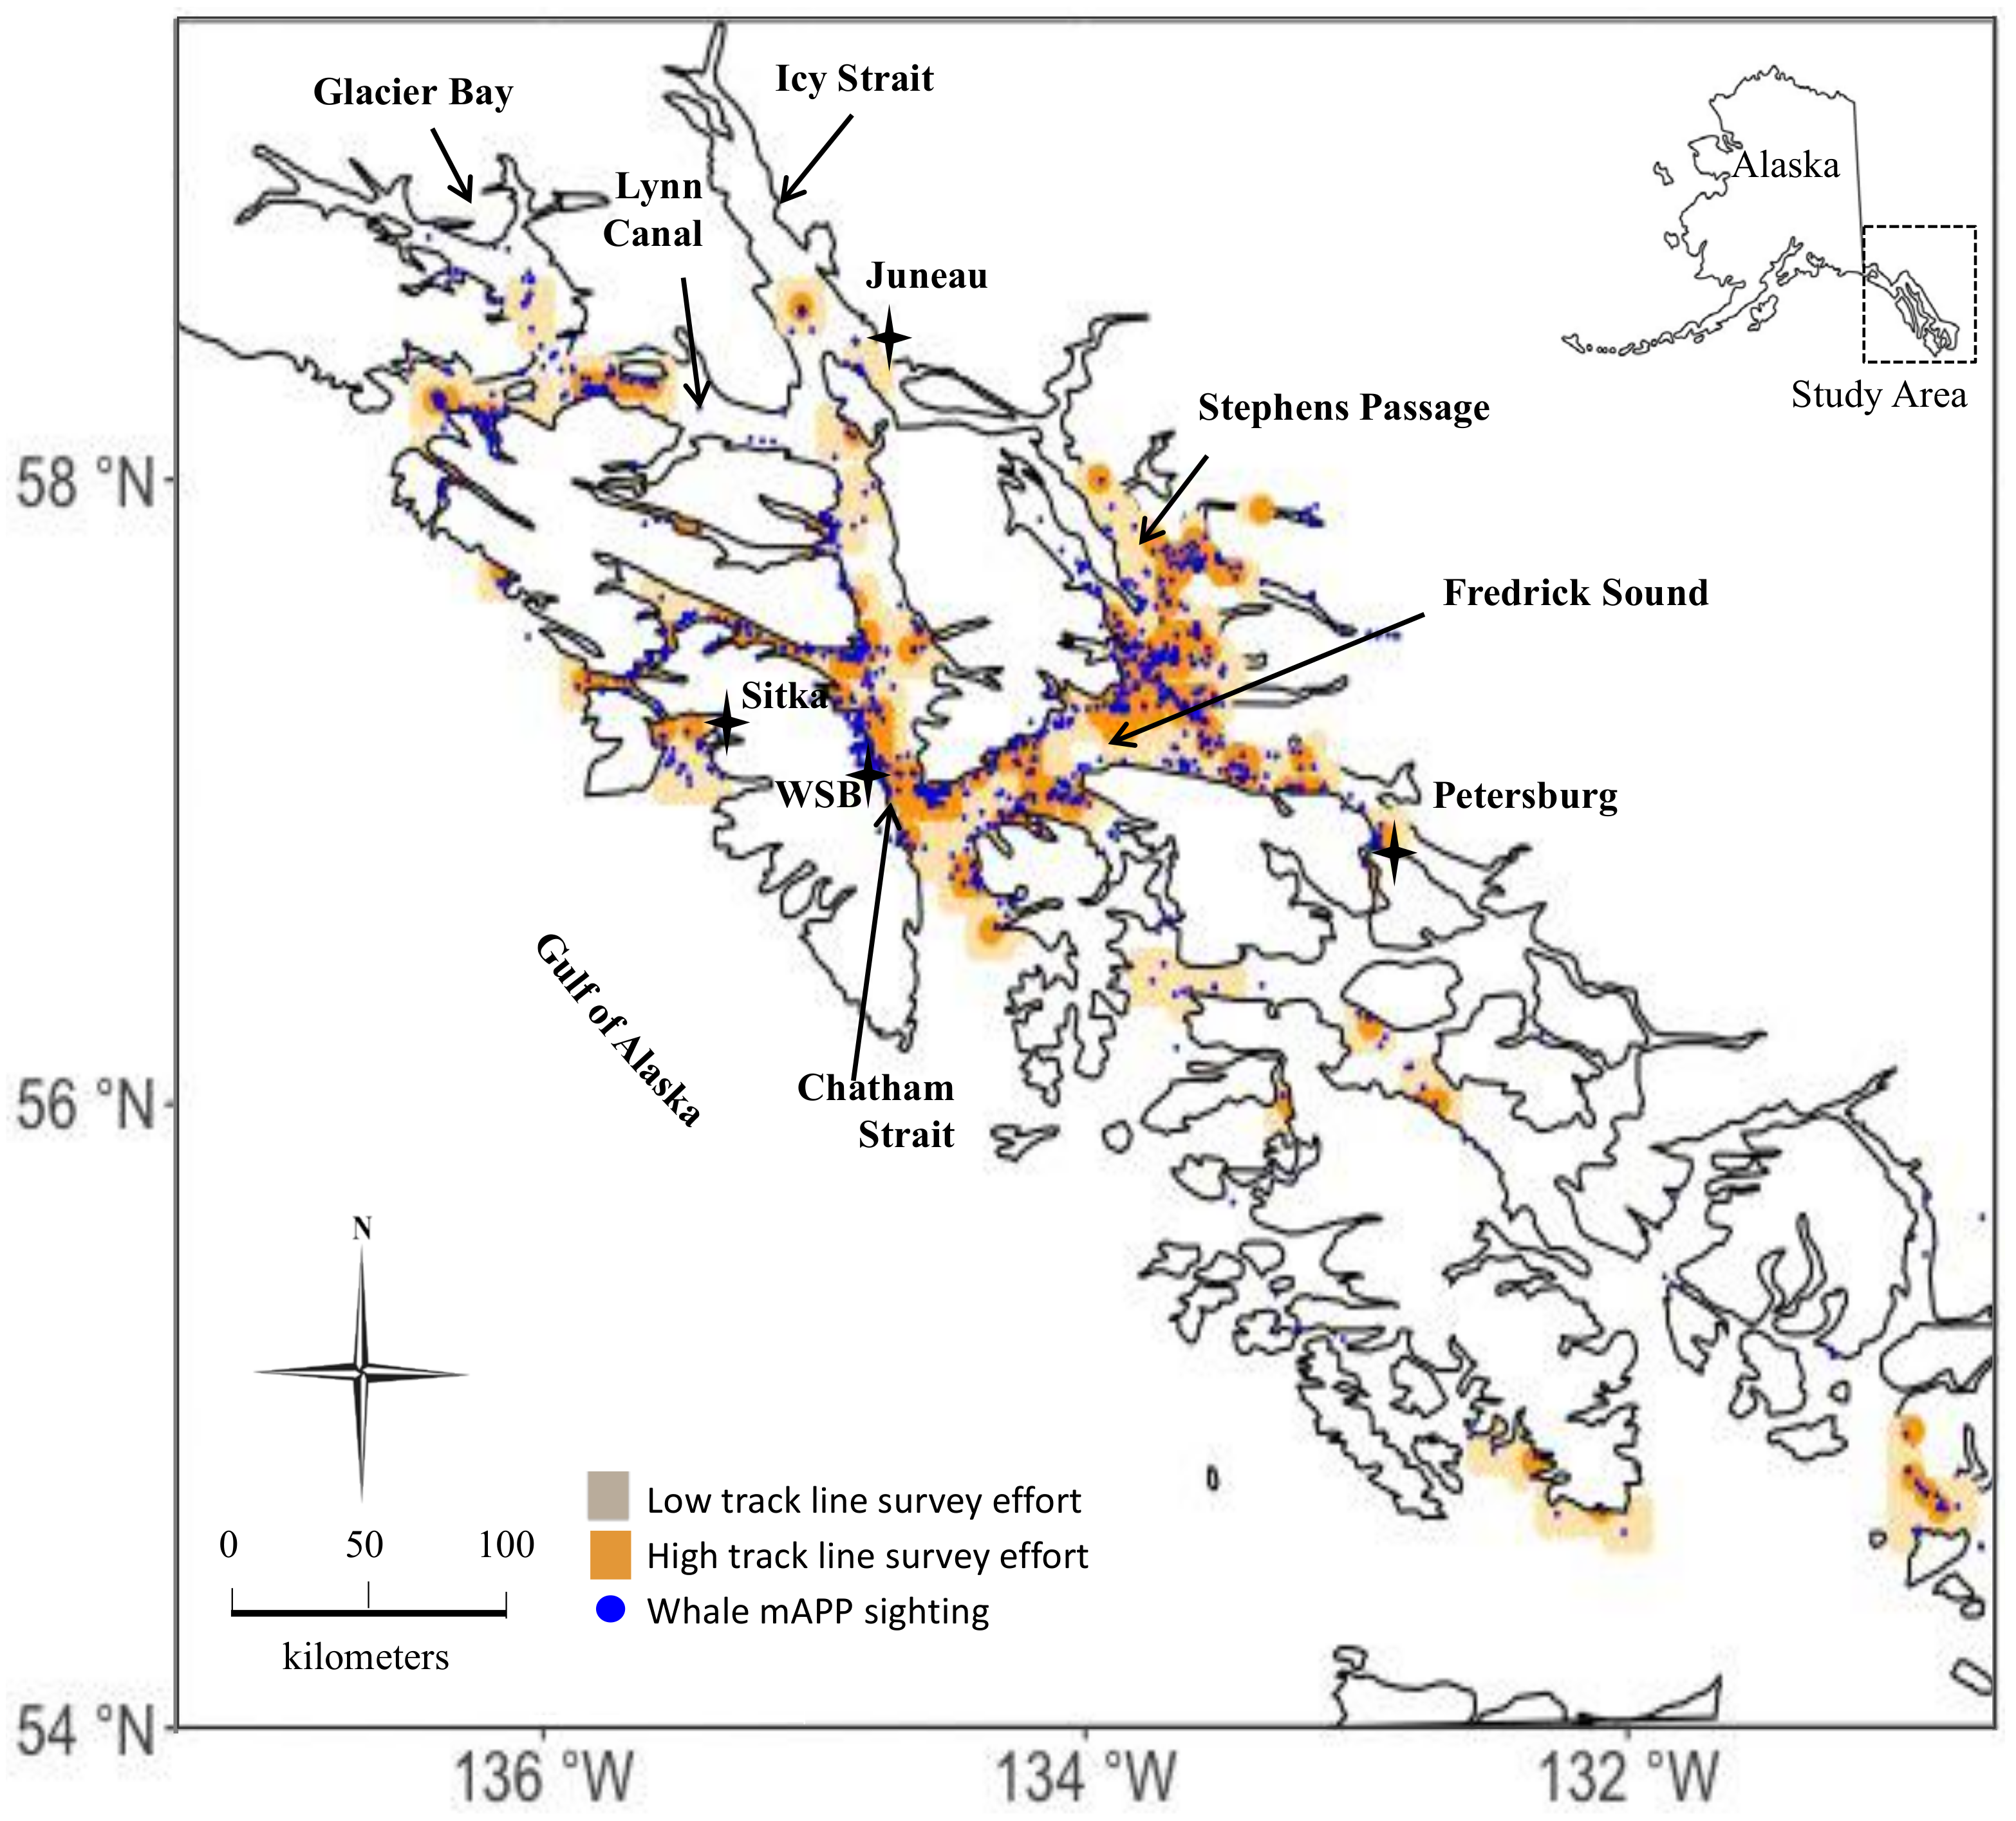
Higher survey effort (within the 75% density contour) occurred near the recruitment center (Warm Springs Bay), other towns, and along common travel routes such as Chatham Strait, Peril Strait, Fredrick Sound, and Stephens Passage (Figure 9). Reduced coverage occurred in remote areas, waterways far from the recruitment center, and/or restricted access areas, such as along offshore facing coastlines, Lynn Canal, Glacier Bay, and south by Wrangell. Variation in survey effort makes the data difficult to extrapolate for all of Southeast Alaska. Therefore, this caveat needs to be considered when determining Whale mAPP data quality and interpreting the results.
4. Discussion
With an increasing need for monitoring marine mammal populations in the face of broad scale environmental changes, citizen science research presents a low-cost solution to collect the vast spatial and temporal data required for robust regional scale population monitoring. This citizen science study cost less than $10,000 for the mobile application revisions, field work equipment, and graduate student time; and it covered a spatial area that had only been surveyed several times in Southeast Alaska, yet had never been surveyed for all cetaceans, pinnipeds, and sea otter species [38,39,40,41]. While the Whale mAPP citizen science project received immense positive feedback and can provide inexpensive and potentially useful scientific data, it still has biases and constraints. Thus, this study emphasizes the importance of acknowledging and measuring the limitations of each citizen science project, so that data collection methods and structure can adapt for improved education and scientific benefits.
This initial review demonstrates the potential of a marine mammal citizen science app to support both scientific and education objectives. For instance, Whale mAPP data identified 90.9% of Steller sea lion haul out sites identified by previous scientific surveys [41] in areas of high survey coverage. In addition, short-term educational benefits, such as improved marine mammal identification skills and self-initiated learning, represent an added benefits of the application.
Citizen scientists’ engagement level and retention play a vital role in the success of any citizen science project. Mobile application citizen science projects often receive funding for the initial app development and recruitment phase [15], but may find it challenging to acquire the long term funds to support continued app management, volunteer recruitment, and volunteer communication. This study stands testament to the effects of supplying resources for one field season, only to have the data collection cease without persistent recruitment and retention efforts. While, the initial excitement and data collection of Whale mAPP was promising, long-term participation beyond two weeks was limited to 27.3% of the citizen scientists. The remaining 72.7% of volunteers stopped using Whale mAPP because they left the area, believed the app required too much time, or encountered technological problems. This indicates that perhaps volunteers did not realize Whale mAPP works globally, were only interested in recording data for the Southeast Alaska project, or no longer had an opportunity to use the mobile app because they were no longer on the water. Furthermore, an even sharper decline in the number of marine mammal records in the years after recruitment indicate that perhaps this transient area is not an ideal location to recruit returning volunteers or that more effort is required to maintain communication and create a stimulating Whale mAPP community. Since the goal of many citizen science projects is to be self-sustaining, this study clearly demonstrated that this goal could not be accomplished with only one season of recruitment effort. For Whale mAPP, only one naturalist working on a nature tourism boat continued to use the mobile app two years after the initial recruitment summer. After three years, no originally recruited volunteers continued to use the app. Thus, to support and develop a long-term successful citizen science project, continual effort needs to be directed into recruiting and retaining volunteers, communicating with those volunteers, updating the mobile application, fixing technological problems, and funding the project so that resources are retained after one field season.
Targeted recruitment may also represent a viable option. Many crowdsourcing volunteers are actually not amateurs, but rather self-selected professionals and experts who elect to participate [56]. The five citizen scientists who contributed over 58% of the data likely represent these self-selecting experts. This trend is not uncommon, as there are often just a few citizen scientists who contribute a majority of the data [33]. Thus, finding these knowledgeable candidates will be key to collecting high quality data and retaining dedicated citizen science volunteers. Results from this study suggest Whale mAPP recruitment should focus on captain or naturalist staff on nature tourism vessels, especially those who express interest in marine mammals and the project. Since 83.3% of citizen scientists who continued using Whale mAPP were involved with nature tourism cruises and expressed very strong pre-existing interests in the ocean and marine mammals, and to a slightly lesser degree monitoring marine mammals and Whale mAPP, targeting this same audience would likely yield better results. This more specialized approach will likely connect to even more interested and dedicated citizen scientists with a stronger pre-existing interests [12,20,30,31] than recruiting volunteers from a nature outreach center, which likely resulted in a broadly targeted audience. Furthermore, if staff working on nature tourism vessels are targeted, the resulting participants would likely follow set travel routes, facilitating easier temporal data comparison. While a more standardized travel route might aid in data analyses, it may also lead to data gaps in narrow channels, marine protected areas, or locations not travelled by these vessels (Figure 9).
Previous citizen science studies also emphasize the importance of creating a community of volunteers who enjoy working together and identify with the projects’ goals. This community can also play a role in driving the future direction and modifications of the citizen science project [30,57]. Putting more energy into the citizen scientists’ experience through the Whale mAPP website, forum, or email notification may also help improve sustained volunteer commitment. Additionally, increasing data collection masks inevitable errors and improves data quality [7], a common concern for citizen science projects [10]. Like many things in life, having a supportive community can motivate people to continue contributing to a mutual project.
Another strategy to increase volunteer recruitment would be to provide an iOS version of Whale mAPP. Around half of the people encountered at the recruitment center did not own an Android, and therefore could not participate. By either creating an iOS version of Whale mAPP or providing Android tablets for dedicated volunteers, the project could reach this still untapped audience.
While still cheaper than running an entire field season to collect comparable data, this effort is not cost-free. Promoting Whale mAPP to the general public and target audiences, developing an iOS version, and providing tablets to dedicated users requires staff time and resources. Furthermore, sustaining new volunteers demands long-term communication, collaboration, and commitment. Securing long-term funding for such a project, although challenging, will likely by the only means to continue the quality of the citizen science project that collects this inclusive marine mammal data.
Results suggest this project is worth investing in because Whale mAPP provides an opportunity to learn more about many marine mammals by contributing to sustained marine mammal research and outreach. This outcome was one of the motivating reasons for why people chose to use Whale mAPP. Moreover, as a result of using Whale mAPP, participants, on average, improved their marine mammal identification skills, a positive learning outcome for many citizen science projects [12]. A more challenging, and often long-term, educational benefit is inspiring volunteers to engage in further learning outside of the citizen science project [19]. Few citizen science projects have reportedly accomplished this task [12]. The first steps to this goal are seen in the Whale mAPP volunteers who took action to learn more about marine mammals by talking to peers, reading about marine mammals, and talking to scientists. There are many methods for bolstering the educational components of a citizen science project. However, methods need to address various user types, from teaching marine mammal identification, to novice users to providing a more stimulating learning environment for the self-initiated participants with previous knowledge. Perhaps one way to address this gap could be for Whale mAPP to enhance citizen scientists’ engagement in the scientific process and education on marine mammals by developing interactive maps that focus on connecting spatiotemporal processes (i.e., current, depth, time of year, etc.) with marine mammal distributions. Overall, providing more enhanced services via the application or website, or actively through ann onsite Whale mAPP steward, would likely enhance the reach of the project and prolong interests of Whale mAPP citizen scientists.
In addition to increasing science literacy and knowledge, citizen science projects also need to consider how researchers can use the data and what caveats are associated with the dataset. One common data limitation is spatial bias. Variability in citizen science survey effort is not uncommon, as a majority of the effort is often focused around common, human populated areas [11,58,59,60]. This spatial bias toward populated areas is not necessarily a drawback, as urban areas frequently require regular monitoring because they can be more impacted by anthropogenic stressors [61,62]. Based on available track line data, these same trends of high survey effort near towns and common travel routes were present in the Whale mAPP data as well. Because citizen scientists often inadvertently collect more data in these regions, Whale mAPP could provide a unique and useful method to examine the impacts of anthropogenic stressors on marine mammals. An alternative method to combat spatial bias may be to highlight areas of low effort in the app’s map display and encourage volunteers to travel to those low survey areas. Either way, survey effort and bias need to be considered when interpreting the citizen science data.
Results from comparing Steller sea lion citizen science data to traditionally collected data illustrate the importance of spatial coverage and sample size. For Steller sea lions, Whale mAPP data accuracy in co-locating the haul out sites identified by a previous scientific study [41] improved from ~72% to 91% when the comparison was limited to high survey effort areas (Figure 7). Data quality also improved with an increased sample size (Figure 8). A Steller sea lion citizen science sample size of 73 recordings was adequate to predicting 72.2% of haul out sites identified with traditional research methods [41], an accuracy value higher than results comparing eBird and iNaturalist bird lists to National Park Service records [14]. These two results demonstrate that increased sample size and spatial coverage is crucial for scientific usefulness of data. Sample size is important for all research methods, including assessments of species distributions where low sample size effects both citizen science [14,35] and traditional scientific studies [63]. In sum, a large enough Whale mAPP data sample size and spatial coverage enable this citizen science method to become scientifically valuable for gathering broad scale and marine mammal data.
User training can also contribute to data quality. Sufficient training and accurate protocols are required to reinforce data consistency and accuracy [15]. Future work should specifically test the effectiveness of the Whale mAPP protocol and marine mammal identification guide by shadowing Whale mAPP citizen scientists while they use the app and associated materials, noting where error and/or frustration occur while simultaneously using Whale mAPP to compare the data recorded by the citizen scientists to that of a scientist. This study would provide a more thorough evaluation of the current Whale mAPP protocols, supporting future improvements to the user guidelines and the resulting data quality.
5. Conclusions
Overall, Whale mAPP received positive user feedback and produced valuable scientific data for the Steller sea lion case study. Whale mAPP data quality, like many citizen science data, improved with a larger sample size [21,33] and spatial coverage [64]. This will most likely be achieved by recruiting self-selecting experts, such as naturalists and captains working on nature tourism cruises, and developing the educational and engagement components of Whale mAPP beyond the level of improved marine mammal identification, and into something more beneficial for expert volunteers. Committing future funding to Whale mAPP user recruitment, especially of nature tourism staff, and building a Whale mAPP citizen science learning and networking community would contribute substantially to the success of the project. Subsequently, more consistent data could be collected, improving spatial coverage and sample size, thereby reducing limitations with the resulting Whale mAPP data. With these efforts, citizen scientists equipped with Whale mAPP could provide the broad scale, long term and continuous marine mammal monitoring data needed to identify at risk populations and fill many data gaps currently present in marine mammal conservation and management research.
Author Contributions
C.H.H., L.L.S., and A.S. conceived the experiments; C.H.H. designed the experiments; C.H.H. performed the experiments; C.H.H. and L.G.T. analyzed the data; A.S. contributed field material and the recruitment center; C.H.H. led manuscript preparation, and all authors contributed to writing.
Acknowledgments
This study was made possible due to the generous contribution of 39 citizen scientists who collected the marine mammal data. The Alaska Whale Foundation provided financial assistance and use of the Center for Coastal Conservation as a recruitment center during the 2014 field season. The Mamie Markham Research Award provided financial support for data analysis and writing of the manuscript. Funding for the development of Whale mAPP was generously provided by a grant from the California Coastal Commission’s Whale Tail License Plate Fund. The project was initiated with the support of Lei Lani Stelle through a LENS fellowship funded by the Keck Foundation, Melodi King of Smallmelo Geographic Information Services, and Crown Chimp Design & Development. Special thank you to Josef Tecumseh Stitts for his immense support and assistance throughout the process.
Conflicts of Interest
Andrew Szabo works for the Alaska Whale Foundation, one of the funding sponsors. Neither the Alaska Whale Foundation nor the Mamie Markham Research Award had a role in the design of the study; in the collection, analyses, or interpretation of data; in the writing of the manuscript, and in the decision to publish the results.
References
- Davidson, A.D.; Boyer, A.G.; Kim, H.; Pompa-Mansilla, S.; Hamilton, M.J.; Costa, D.P.; Ceballos, G.; Brown, J.H. Drivers and hotspots of extinction risk in marine mammals. Proc. Natl. Acad. Sci. USA 2012, 109, 3395–3400. [Google Scholar] [CrossRef] [PubMed]
- Hazen, E.L.; Jorgensen, S.; Rykaczewski, R.R.; Bograd, S.J.; Foley, D.G.; Jonsen, I.D.; Shaffer, S.A.; Dunne, J.P.; Costa, D.P.; Crowder, L.B.; et al. Predicted habitat shifts of Pacific top predators in a changing climate. Nat. Clim. Chang. 2013, 3, 234–238. [Google Scholar] [CrossRef]
- Allen, B.M.; Angliss, R.P. Alaska Marine Mammal Stock Assessments, 2014; Agencies and Staff of the US Department of Commerce: Seattle, WA, USA, 2015; p. 11.
- Magurran, A.E.; Baillie, S.R.; Buckland, S.T.; Dick, J.M.; Elston, D.A.; Scott, E.M.; Smith, R.I.; Somerfield, P.J.; Watt, A.D. Long-term datasets in biodiversity research and monitoring: Assessing change in ecological communities through time. Trends Ecol. Evol. 2010, 25, 574–582. [Google Scholar] [CrossRef] [PubMed]
- Torres, L.G.; Smith, T.D.; Sutton, P.; MacDiarmid, A.; Bannister, J.; Miyashita, T. From exploitation to conservation: Habitat models using whaling data predict distribution patterns and threat exposure of an endangered whale. Divers. Distrib. 2013, 19, 1138–1152. [Google Scholar] [CrossRef]
- Taylor, B.L.; Martinez, M.; Gerrodette, J.; Barlow, J. Lessons from monitoring trends in abundance of marine mammals. Mar. Mammal Sci. 2007, 23, 157–175. [Google Scholar] [CrossRef]
- Dickinson, J.L.; Zuckerberg, B.; Bonter, D.N. Citizen science as an ecological research tool: Challenges and benefits. Annu. Rev. Ecol. Evol. Syst. 2010, 41, 149–172. [Google Scholar] [CrossRef]
- Parsons, E.; Baulch, S.; Bechshoft, T.; Bellazzi, G.; Bouchet, P.; Cosentino, A.; Godard-Codding, C.; Gulland, F.; Hoffmann-Kuhnt, M.; Hoyt, E.; et al. Key research questions of global importance for cetacean conservation. Endanger. Species Res. 2015, 27, 113–118. [Google Scholar] [CrossRef]
- Kelling, S.; Gerbracht, J.; Fink, D.; Lagoze, C.; Wong, W.K.; Yu, J.; Damoulas, T.; Gomes, C. A human/computer learning network to improve biodiversity conservation and research. AI Mag. 2012, 34, 10. [Google Scholar] [CrossRef]
- Thiel, M.; Penna-Díaz, M.A.; Luna-Jorquera, G.; Salas, S.; Sellanes, J.; Stotz, W. Citizen scientists and marine research: Volunteer participants, their contributions, and projection for the future. Oceanogr. Mar. Biol. Annu. Rev. 2014, 52, 257–314. [Google Scholar]
- Goffredo, S.; Pensa, F.; Neri, P.; Orlandi, A.; Gagliardi, M.S.; Velardi, A.; Piccinetti, C.; Zaccanti, F. Unite research with what citizens do for fun: “recreational monitoring” of marine biodiversity. Ecol. Appl. 2010, 20, 2170–2187. [Google Scholar] [CrossRef] [PubMed]
- Crall, A.W.; Jordan, R.; Holfelder, K.; Newman, G.J.; Graham, J.; Waller, D.M. The impacts of an invasive species citizen science training program on participant attitudes, behavior, and science literacy. Public Underst. Sci. 2013, 22, 745–764. [Google Scholar] [CrossRef] [PubMed]
- Hochachka, W.M.; Fink, D.; Hutchinson, R.A.; Sheldon, D.; Wong, W.K.; Kelling, S. Data-intensive science applied to broad-scale citizen science. Trends Ecol. Evol. 2012, 27, 130–137. [Google Scholar] [CrossRef] [PubMed]
- Clemens, J.; Jacobs, Z.A.; Zipf, A. Completeness of citizen science biodiversity data from a volunteered geographic information perspective. Geo-Spat. Inf. Sci. 2017, 20, 3–13. [Google Scholar] [CrossRef]
- Ferster, C.J.; Coops, N.C. Assessing the quality of forest fuel loading data collected using public participation methods and smartphones. Int. J. Wildland Fire 2014, 23, 585–590. [Google Scholar] [CrossRef]
- Fritz, S.; Fonte, C.C.; See, L. The role of citizen science in earth observation. Multidiscip. Digit. Publ. Inst. 2017, 9, 357. [Google Scholar] [CrossRef]
- Mobasheri, A.; Deister, J.; Dieterich, H. Wheelmap: The wheelchair accessibility crowdsourcing platform. Open Geospat. Data Softw. Stand. 2017, 2, 27. [Google Scholar] [CrossRef]
- Castell, N.; Kobernus, M.; Liu, H.Y.; Schneider, P.; Lahoz, W.; Berre, A.J.; Noll, J. Mobile technologies and services for environmental monitoring: The Citi-Sense-MOB approach. Urban Clim. 2014, 14, 370–382. [Google Scholar] [CrossRef]
- Conrad, C.C.; Hilchey, K.G. A review of citizen science and community-based environmental monitoring: Issues and opportunities. Environ. Monit. Assess. 2011, 176, 273–291. [Google Scholar] [CrossRef] [PubMed]
- Raddick, M.J.; Bracey, G.; Gay, P.L.; Lintott, C.J.; Murray, P.; Schawinski, K.; Szalay, A.S.; Vandenberg, J. Galaxy zoo: Exploring the motivations of citizen science volunteers. Astron. Educ. Rev. 2010, 9, 010103. [Google Scholar] [CrossRef]
- Sullivan, B.L.; Aycrigg, J.L.; Barry, J.H.; Bonney, R.E.; Bruns, N.; Cooper, C.B.; Damoulas, T.; Dhondt, A.A.; Dietterich, T.; Farnsworth, A.; et al. The eBird enterprise: An integrated approach to development and application of citizen science. Biol. Conserv. 2014, 169, 31–40. [Google Scholar] [CrossRef]
- Rugh, D.J.; Shelden, K.E.; Schulman-Janiger, A. Timing of the gray whale southbound migration. J. Cetacean Res. Manag. 2001, 3, 31–40. [Google Scholar]
- Shelden, K.E.; Rugh, D.J.; Schulman-Janiger, A. Gray whales born north of Mexico: Indicator of recovery or consequence of regime shift? Ecol. Appl. 2004, 14, 1789–1805. [Google Scholar] [CrossRef]
- Tonachella, N.; Nastasi, A.; Kaufman, G.; Maldini, D.; Rankin, R.W. Predicting trends in humpback whale (Megaptera novaeangliae) abundance using citizen science. Pac. Conserv. Biol. 2012, 18, 297–309. [Google Scholar] [CrossRef]
- Bruce, E.; Albright, L.; Sheehan, L.; Blewitt, M. Distribution patterns of migrating humpback whales (Megaptera novaeangliae) in Jervis Bay, Australia: A spatial analysis using geographical citizen science data. Appl. Geogr. 2014, 54, 83–95. [Google Scholar] [CrossRef]
- Carlson, B.S.; Sims, C.; Brunner, S. Cook Inlet Beluga Whale, Delphinapterus leucas, observations near Anchorage, Alaska between 2008 and 2011: Results from a citizen scientist project. Mar. Fish. Rev. 2015, 77, 115–130. [Google Scholar] [CrossRef]
- Gregr, E.J. Insights into North Pacific right whale Eubalaena japonica habitat from historic whaling records. Endanger. Species Res. 2011, 15, 223–239. [Google Scholar] [CrossRef]
- Smith, T.D.; Reeves, R.R.; Josephson, E.A.; Lund, J.N. Spatial and seasonal distribution of American whaling and whales in the age of sail. PLoS ONE 2012, 7, e34905. [Google Scholar] [CrossRef] [PubMed]
- Hann, C.H.; Smith, T.D.; Torres, L.G. A sperm whale’s perspective: The importance of seasonality and seamount depth. Mar. Mammal Sci. 2016, 32, 1470–1481. [Google Scholar] [CrossRef]
- Nov, O.; Arazy, O.; Anderson, D. Dusting for science: Motivation and participation of digital citizen science volunteers. In Proceedings of the 2011 iConference, Seattle, WA, USA, 8–11 February 2011; ACM: New York, NY, USA, 2011; pp. 68–74. [Google Scholar]
- Koss, R.S.; Miller, K.; Wescott, G.; Bellgrove, A.; Boxshall, A.; McBurnie, J.; Bunce, A.; Gilmour, P.; Ierodiaconou, D. An evaluation of Sea Search as a citizen science programme in Marine Protected Areas. Pac. Conserv. Biol. 2009, 15, 116–127. [Google Scholar] [CrossRef]
- Bird, T.J.; Bates, A.E.; Lefcheck, J.S.; Hill, N.A.; Thomson, R.J.; Edgar, G.J.; Stuart-Smith, R.D.; Wotherspoon, S.; Krkosek, M.; Stuart-Smith, J.F.; et al. Statistical solutions for error and bias in global citizen science datasets. Biol. Conserv. 2014, 173, 144–154. [Google Scholar] [CrossRef]
- Paul, K.; Quinn, M.S.; Huijser, M.P.; Graham, J.; Broberg, L. An evaluation of a citizen science data collection program for recording wildlife observations along a highway. J. Environ. Manag. 2014, 139, 180–187. [Google Scholar] [CrossRef] [PubMed]
- Bray, G.S.; Schramm, H.L. Evaluation of a statewide volunteer angler diary program for use as a fishery assessment tool. N. Am. J. Fish. Manag. 2011, 21, 606–615. [Google Scholar] [CrossRef]
- Galloway, A.W.; Tudor, M.T.; HAEGEN, W.M.V. The reliability of citizen science: A case study of Oregon white oak stand surveys. Wildl. Soc. Bull. 2006, 34, 1425–1429. [Google Scholar] [CrossRef]
- Reese, G.C.; Wilson, W.R.; Hoeting, J.H.; Flather, C.H. Factors affecting species distribution predictions: A simulation modeling experiment. Ecol. Appl. 2005, 15, 554–564. [Google Scholar] [CrossRef]
- Walter, B.; Hladick, C.; Cioni-Haywood, B. Commercial Passenger Vessel Excise Tax: Community Needs, Priorities, Shared Revenue, and Expenditures (Fiscal Years 2007 to 2016); Alaska Department of Commerce, Community, and Economic Development: Seattle, WA, USA, 2017. Available online: https://www.commerce.alaska.gov/web/Portals/6/pub/TourismResearch/00%20FULL%20CPV%20RPT%2016%202017.pdf?ver=2017-03-23-160339-903 (accessed on 12 April 2018).
- Calambokidis, J.; Falcone, E.A.; Quinn, T.J.; Burdin, A.M.; Clapham, P.J.; Ford, J.K.B.; Gabriele, C.M.; LeDuc, R.; Mattila, D.; Rojas-Bracho, L.; et al. SPLASH: Structure of Populations, Levels of Abundance and Status of Humpback Whales in the North Pacific; Cascadia Research Collective to USDOC: Seattle, WA, USA, 2009. [Google Scholar]
- Dahlheim, M.E.; White, P.A.; Waite, J.M. Cetaceans of Southeast Alaska: Distribution and seasonal occurrence. J. Biogeogr. 2009, 36, 410–426. [Google Scholar] [CrossRef]
- Dahlheim, M.E.; Zerbini, A.N.; Waite, J.M.; Kennedy, A.S. Temporal changes in abundance of harbor porpoise (Phocoena phocoena) inhabiting the inland waters of Southeast Alaska. Fish. Bull. 2015, 113, 242–256. [Google Scholar] [CrossRef]
- Womble, J.N.; Willson, M.F.; Sigler, M.F.; Kelly, B.P.; VanBlaricom, G.R. Distribution of Steller sea lions Eumetopias jubatus in relation to spring-spawning fish in SE Alaska. Mar. Ecol. Prog. Ser. 2005, 294, 271–282. [Google Scholar] [CrossRef]
- Stelle, L.L.; King, M.; Hann, C.H. Chapter 8 Whale mAPP: Engaging Citizen Scientists to Contribute and Map Marine Mammal Sightings. In Ocean Solutions, Earth Solutions; White, D.J., Ed.; Esri Press: Redland, MD, USA, 2016; pp. 151–170. [Google Scholar]
- Couvet, D.; Jiguet, F.; Julliard, R.; Levrel, H.; Teyssedre, A. Enhancing citizen contributions to biodiversity science and public policy. Interdiscip. Sci. Rev. 2008, 33, 95–103. [Google Scholar] [CrossRef]
- Silvertown, J. A new dawn for citizen science. Trends Ecol. Evol. 2009, 24, 467–471. [Google Scholar] [CrossRef] [PubMed]
- R Core Team. R: A Language and Environment for Statistical Computing; R Foundation for 343 Statistical Computing; R Core Team: Vienna, Austria, 2015; Available online: http://www.R-project.org/ (accessed on 2 May 2018).
- Bell, P.; Lewenstein, B.; Shouse, A.W.; Feder, M.A. Learning Science in Informal Environments: People, Places, and Pursuits in Report of the National Research Council of the National Academies; The National Academic Press: Washington, DC, USA, 2009. [Google Scholar]
- Hothorn, T.; Hornik, K.; Mark, A.; van de Wiel, A.Z. Implementing a Class of Permutation Tests: The coin Package. J. Stat. Softw. 2008, 28, 1–23. [Google Scholar] [CrossRef]
- Barry, R.P.; McIntyre, J. Estimating animal densities and home range in regions with irregular boundaries and holes: A lattice-based alternative to the kernel density estimator. Ecol. Model. 2011, 222, 1666–1672. [Google Scholar] [CrossRef]
- Citta, J.J.; Quakenbush, L.T.; Okkonen, S.R.; Druckenmiller, M.L.; Maslowski, W.; Clement-Kinney, J.; George, J.C.; Brower, H.; Small, R.J.; Ashjian, C.J.; et al. Ecological characteristics of core-use areas used by Bering–Chukchi–Beaufort (BCB) bowhead whales, 2006–2012. Prog. Oceanogr. 2015, 136, 201–222. [Google Scholar] [CrossRef]
- Legare, B.; Kneebone, J.; DeAngelis, B.; Skomal, G. The spatiotemporal dynamics of habitat use by blacktip (Carcharhinus limbatus) and lemon (Negaprion brevirostris) sharks in nurseries of St. John, United States Virgin Islands. Mar. Boil. 2015, 162, 699–716. [Google Scholar] [CrossRef]
- Barry, R. latticeDensity: Density Estimation and Nonparametric Regression on Irregular Regions. R Package Version 1.0.7 2012. Available online: http://CRAN.R-project.org/package=latticeDensity (accessed on 2 May 2018).
- Kvitek, R.G.; Bowlby, C.E.; Staedler, M. Diet and foraging behavior of sea otters in southeast Alaska. Mar. Mammal Sci. 1993, 9, 168–181. [Google Scholar] [CrossRef]
- Calambokidis, J.; Taylor, B.L.; Carter, S.D.; Steiger, G.H.; Dawson, P.K.; Antrim, L.D. Distribution and haul-out behavior of harbor seals in Glacier Bay, Alaska. Can. J. Zool. 1987, 65, 1391–1396. [Google Scholar] [CrossRef]
- Mathews, E.A.; Pendleton, G.W. Declines in harbor seal (Phoca vitulina) numbers in Glacier Bay national park, Alaska, 1992–2002. Mar. Mammal Sci. 2006, 22, 167–189. [Google Scholar] [CrossRef]
- Karpovich, S.A.; Skinner, J.P.; Mondragon, J.E.; Blundell, G.M. Combined physiological and behavioral observations to assess the influence of vessel encounters on harbor seals in glacial fjords of southeast Alaska. J. Exp. Mar. Boil. Ecol. 2015, 473, 110–120. [Google Scholar] [CrossRef]
- Brabham, D.C. The myth of amateur crowds: A critical discourse analysis of crowdsourcing coverage. Inf. Commun. Soc. 2012, 15, 394–410. [Google Scholar] [CrossRef]
- Cooper, S.; Khatib, F.; Treuille, A.; Barbero, J.; Lee, J.; Beenen, M.; Leaver-Fay, A.; Baker, D.; Popović, Z. Predicting protein structures with a multiplayer online game. Nature 2010, 466, 756. [Google Scholar] [CrossRef] [PubMed]
- Bart, J.; Hofschen, M.; Peterjohn, B.G. Reliability of the breeding bird survey: Effects of restricting surveys to roads. Auk 1995, 112, 758–761. [Google Scholar]
- Lawler, J.J.; O’Connor, R.J. How well do consistently monitored breeding bird survey routes represent the environments of the conterminous United States? Condor 2004, 106, 801–814. [Google Scholar] [CrossRef]
- Niemuth, N.D.; Dahl, A.L.; Estey, M.E.; Loesch, C.R. Representation of landcover along breeding bird survey routes in the Northern Plains. J. Wildl. Manag. 2007, 71, 2258–2265. [Google Scholar] [CrossRef]
- Halpern, B.S.; Walbridge, S.; Selkoe, K.A.; Kappel, C.V.; Micheli, F.; D’agrosa, C.; Bruno, J.F.; Casey, K.S.; Ebert, C.; Fox, H.E.; et al. A global map of human impact on marine ecosystems. Science 2008, 319, 948–952. [Google Scholar] [CrossRef] [PubMed]
- Gilarranz, L.J.; Mora, C.; Bascompte, J. Anthropogenic effects are associated with a lower persistence of marine food webs. Nat. Commun. 2016, 7, 10737. [Google Scholar] [CrossRef] [PubMed]
- Fitzpatrick, M.C.; Preisser, E.L.; Ellison, A.M.; Elkinton, J.S. Observer bias and the detection of low-density populations. Ecol. Appl. 2009, 19, 1673–1679. [Google Scholar] [CrossRef] [PubMed]
- Jackson, M.M.; Gergel, S.E.; Martin, K. Citizen science and field survey observations provide comparable results for mapping Vancouver Island White-tailed Ptarmigan (Lagopus leucura sazatilis) distributions. Biol. Conserv. 2015, 181, 162–172. [Google Scholar] [CrossRef]
Figure 1.
(a) Whale mAPP map display showing the map, track line, and sighting record icon; (b) Whale mAPP display for recording a marine mammal sighting.
Figure 1.
(a) Whale mAPP map display showing the map, track line, and sighting record icon; (b) Whale mAPP display for recording a marine mammal sighting.

Figure 2.
Flowchart of methods with the left hand column showing how the Whale mAPP data were used and the right hand column describing how the questionnaire survey data were used.
Figure 2.
Flowchart of methods with the left hand column showing how the Whale mAPP data were used and the right hand column describing how the questionnaire survey data were used.

Figure 3.
Marine mammal identification guide for common marine mammals in Southeast Alaska.

Figure 4.
Boxplot of volunteer rankings of pre-existing interest on a scale of 1 (low) to 5 (high).

Figure 5.
Percent of time citizen scientists spent doing various activities while using Whale mAPP.

Figure 6.
(a) Humpback whale; (b) sea otter; and (c) harbor seal distribution maps.

Figure 7.
Map showing scientifically collected haul out sites [41] identified with Whale mAPP data in low and high survey effort areas.
Figure 7.
Map showing scientifically collected haul out sites [41] identified with Whale mAPP data in low and high survey effort areas.

Figure 8.
Steller sea lion discovery curve showing an increase in the percent of scientifically collected haul out sites [41] recorded through Whale mAPP with every five-unit increase in Whale mAPP Steller sea lion sighting sample size.
Figure 8.
Steller sea lion discovery curve showing an increase in the percent of scientifically collected haul out sites [41] recorded through Whale mAPP with every five-unit increase in Whale mAPP Steller sea lion sighting sample size.

Figure 9.
Map showing low and high track line survey effort and Whale mAPP-sighting data.

© 2018 by the authors. Licensee MDPI, Basel, Switzerland. This article is an open access article distributed under the terms and conditions of the Creative Commons Attribution (CC BY) license (http://creativecommons.org/licenses/by/4.0/).
Share and Cite
MDPI and ACS Style
Hann, C.H.; Stelle, L.L.; Szabo, A.; Torres, L.G. Obstacles and Opportunities of Using a Mobile App for Marine Mammal Research. ISPRS Int. J. Geo-Inf. 2018, 7, 169. https://doi.org/10.3390/ijgi7050169
AMA Style
Hann CH, Stelle LL, Szabo A, Torres LG. Obstacles and Opportunities of Using a Mobile App for Marine Mammal Research. ISPRS International Journal of Geo-Information. 2018; 7(5):169. https://doi.org/10.3390/ijgi7050169
Chicago/Turabian StyleHann, Courtney H., Lei Lani Stelle, Andrew Szabo, and Leigh G. Torres. 2018. "Obstacles and Opportunities of Using a Mobile App for Marine Mammal Research" ISPRS International Journal of Geo-Information 7, no. 5: 169. https://doi.org/10.3390/ijgi7050169
Note that from the first issue of 2016, this journal uses article numbers instead of page numbers. See further details here.