Article

Modeling Urban Collaborative Growth Dynamics Using a Multiscale Simulation Model for the Wuhan Urban Agglomeration Area, China

1
School of Resource and Environment Engineering, Wuhan University of Technology, 122 Luoshi Road, Wuhan 430070, China
2
School of Resources and Environment Science, Wuhan University, 129 Luoyu Road, Wuhan 430079, China
3
Key Laboratory of Geographic Information System, Ministry of Education, Wuhan University, 129 Luoyu Road, Wuhan 430079, China
4
Center for Applied Geographic Information Science, Department of Geography and Earth Sciences, University of North Carolina at Charlotte, 9201 University City Blvd., Charlotte, NC 28223, USA
*
Author to whom correspondence should be addressed.
ISPRS Int. J. Geo-Inf. 2018, 7(5), 176; https://doi.org/10.3390/ijgi7050176
Submission received: 3 April 2018 / Revised: 30 April 2018 / Accepted: 7 May 2018 / Published: 8 May 2018

Abstract

:
Urban agglomeration has become the predominant form of urbanization in China. In this process, spatial interaction evidently played a significant role in promoting the collaborative development of these correlated cities. The traditional urban model’s focus on individual cities should be transformed to an urban system model. In this study, a multi-scale simulation model has been proposed to simulate the agglomeration development process of the Wuhan urban agglomeration area by embedding the multi-scale spatial interaction into the transition rule system of cellular automata (CA). A system dynamic model was used to predict the demand for new urban land at an aggregated urban agglomeration area scale. A data field approach was adopted to measuring the interaction of intercity at city scale. Neighborhood interaction was interpreted with a logistic regression method at the land parcel scale. Land use data from 1995, 2005, and 2015 were used to calibrate and evaluate the model. The simulation results show that there has been continuing urban growth in the Wuhan urban agglomeration area from 1995 to 2020. Although extension-sprawl was the predominant pattern of urban spatial expansion, the trend of extensive growth to intensive growth is clear during the entire period. The spatial interaction among these cities has been reinforced, which guided the collaborative development and formed the regional urban system network.

1. Introduction

Chinese economic reform and opening has stimulated unprecedented urbanization since the 1980s. The fact that more than 50 percent of the total population lives in cities marks the beginning of a new urban era. The urban agglomerations arising have been important for urbanization and the national economic development of contemporary China [1,2]. According to the statistics available in 2015, nearly one-quarter of China’s total population and two-fifths of the total gross domestic production were in three major urban agglomeration areas, the Yangtze River Delta, Pearl River Delta, and Beijing–Tianjin–Tangshan region, although these areas only occupied 5.2 percent of national territory [3]. Urban agglomeration will become the primary engine of China’s rapid economic growth [4], and will be a strong and lasting driving force to boost China’s economic growth in the future.
However, urban agglomeration is still in the early stages, especially in the majority of the middle and western regions of China. Under the long-term planned economy system, strict jurisdiction makes development difficult if a city tried to expand beyond its administrative boundaries or merge with another. An understanding and exploration of the urban system dynamics will serve as a good model for nurturing urban agglomerations in the middle and western regions [5]. Simulation of the co-evolution dynamic of urban system is an important tool for better understanding and planning the urban future [6,7].
Urbanization is one of the most complicated human-induced conversions from nature to human habitation. It is difficult to predict the future of urban growth [8,9]. Urban growth dynamics is a complex process caused by the interaction between natural and social systems at different spatial scales and levels [10,11,12,13]. There are three scales of interactions in an urban agglomeration expansion process: at a macro-scale, the whole–part interaction between the urban agglomeration and its single city; at a meso-scale, the intercity interaction; and at the micro-scale, the land parcels with their neighboring interaction. Traditional studies focused on three aspects, mathematical/statistical approaches, spatially explicit models, and intelligent computation algorithms of urban land conversion. Multilevel modeling is one of the statistical tools capable of integrating multi-scale processes and including interactions between these scales, which allows for exploring complex causal relationships originating from the hierarchical system [14,15,16]. Nevertheless, these statistical approaches are mostly limited to capturing causal relations between explanatory and dependent variables in a quantitative way, and make it difficult to reflect the changing relationships in a space. Cellular automata as a spatial explicit approach has been used widely to simulate the processes of urban growth dynamics [17,18,19,20,21,22,23,24]. However, CA presents the growth dynamic by assuming that the change of cell states is based on the micro-scale local neighboring interaction to emerging global spatial pattern, neglecting the macro-scale driving forces [24,25,26]. From the aspect of intelligent computation, urban land use conversion is considered a spatial optimization problem by establishing a mapping relationship between computing space and geographic space, then the probability of land conversion can be calculated by a serial intelligent computation algorithms such as a multi-agent system or artificial immune systems [27,28]. Recently, linking other models to the CA framework as a promising solution has been investigated [23,24,27,29,30]. These integrated models have incorporated macro-scale driving forces successfully into the CA model, but the spatial interactions of intercity at the meso-scale are neglected, which is important in modeling urban agglomeration collaborative growth dynamics.
We propose a multi-scale simulation model of the collaborative expansion dynamic of urban agglomeration in this study. We explicitly address: (i) macro-scale urban development potential for new urban land use; (ii) meso-scale intercity interaction; (iii) micro-scale land use conversion process; and (iv) incorporating multiscale interactions into the CA framework, which previously have not been combined jointly in urban growth dynamic models. The remainder of this article is organized in the following manner. In the methods Section 2, we present a multi-scale simulation of urban agglomeration growth by focusing on designing an integrated model, depicting the multiscale spatial interaction. The study area and associated data are discussed in their respective Section 3. Model implementation and results section demonstrate a case study by applying the model to simulate the urban spatial expansion dynamics in the Wuhan agglomeration area of China from 1995 to 2020 in Section 4. In discussion Section 5, we show the results of experiments and present discussion. We conclude the study in the last Section 6.

2. Multiscale Simulation Model of the Urban Agglomeration Growth Dynamic

Our simulation model of coevolving growth dynamics of urban agglomeration is based on the CA framework that includes three sub-models at different scales: a potential model of new urban land use at the aggregated urban agglomeration scale, the intercity interaction model at the city scale, and the neighboring interaction model at the cellular scale, which is illustrated as Figure 1. In this model, we assume the spatial expansion is a three-scale coordinated process. At the macro-scale, urban expansion is driven by general characteristics of the urban agglomeration area, such as the economics scale, population size, and environmental conditions. These factors reflect the attractiveness of an urban aggregated system for new urban land uses that are usually kept stable over a certain period. This causal relationship usually can be interpreted with a system dynamic approach. At the meso-scale, with the highly developed transportation and information networks, the different cities in the urban agglomeration area connect with each other intensively, generating intensive interactions on the space. Therefore, intercity interaction has become an important driving force of urban expansion dynamics. The urban flow model (UFM) widely has been applied in the research of spatial interaction [31,32], which is a powerful tool for measuring intercity interaction. At the micro-scale, CA model’s ability to simulate the land use conversion process with neighboring interactions has been investigated widely [32,33,34]. In this study, an integrated model will be constructed by linking multiple regression UFM with CA.

2.1. Macro-Scale Potential Sub-Model

A macro-scale model is utilized to predict the demand of new urban land use in the city i. The system dynamics (SD) approach is a competent tool to represent the cause–effect relationships among the land use system, which can be used to simulate the dynamics of land use change [35]. The following formula can be used to compute the PA to reflect the potential of other land use types converted into urban:
P A = A c / A t × 100 ,
where PA is the conversion probability of other land use types into construction land; A c is the demand of new urban land use, which can be obtained from the SD approach; and At is the total area of the region.

2.2. Meso-Scale Intercity Sub-Model

The spatial interaction of the intercity is an important driving force not only for determining the demand of new urban land, but also for spatial expansion direction and location, such as how the new urban land use usually prefers to locate along the intercity road. Since the intensity of intercity interaction decreases over the distance from the city center, the urban data field model can be used to quantify the influence of spatial interaction as formulated as Equation (2) [36]:
P I = Z k / L ( k , i ) a · λ k ,
where PI is the spatial interaction influence of city k at point i, which is the field intensity (radiative intensity) in the field; L(k,i) is the travel distance between city k and city i; and a is the friction coefficient of accessibility. In general, a is defined as 1, and λk is the impact weight of city k, which is determined based on the influence potential of the city. Zk is the influence potential of city k, which can be calculated with Equation (3):
Z k = i = 1 m ( A i . j n C i j . X k j / L k , i a . λ k ) ,
where Zk is the influence potential of city k; m is the number of factors determining the influence potential; Ai contributes the major components i to the influence potential of the city; n is the number of indexes; Cij is the contribution of index j to the major components i; and X k j is the standardized value of index j in city k.

2.3. Micro-Scale Cellular Sub-Mode

At the micro-scale, urban land use conversion is considered the result of interactions among biophysical, socioeconomic and its surrounding at a cellular level. There are preconditions of urban land conversion that the land patch must be suitable for the urban land use, denoted as P L . Here, three variables, including cell-level neighborhood effect, suitability, and accessibility, are used to determine the development potential, which can be formalized as the following equation:
P L = f ( Ω i , S i , A i ) ,
where S i is the suitability for urban land use of cell i , which is a function of elevation, slope, hydrology, and geology, denoted as s 1 , s 2 , s 3 , s 4 , respectively. A i is the accessibility of cell i to the service network or centers such as the road network, railway, main centers and sub-centers, denoted as a 1 , a 2 , a 3 , a 4 . Ω i is the neighborhood effect, which can be defined as the ratio of the number of urban land use cell to the total of neighboring cell.
Logistic regression is considered to be competent for constructing the function of f in Equation (5) [8,9]. Here, Equation (6) can be used to determine the probability of a cell being converted to urban land use:
P L = 1 / ( 1 + exp ( ( D 0 + m D m X m ) ) ) Ω i ,
where D 0 is a constant and D m is the weight of the mth driving factor Xm.

2.4. Multi-Scale Linking Model

A linking model is constructed by incorporating the above three sub-models into the CA framework. The demand sub-model is adopted as the termination condition of the iteration of CA. The intensification of intercity interaction P I calculated from the intercity sub-model and the potential of land conversion P L defined at the cellular sub-model are integrated into the transition rule system of CA, which can be depicted as in Equation (6):
P = P A P I P L = 100 A c / A t × i = 1 m ( A i . j n C i j . X k j / L k , i a . λ k ) × 1 / ( 1 + exp ( ( D 0 + m D m X m ) ) ) Ω i .

3. Study Area and Data
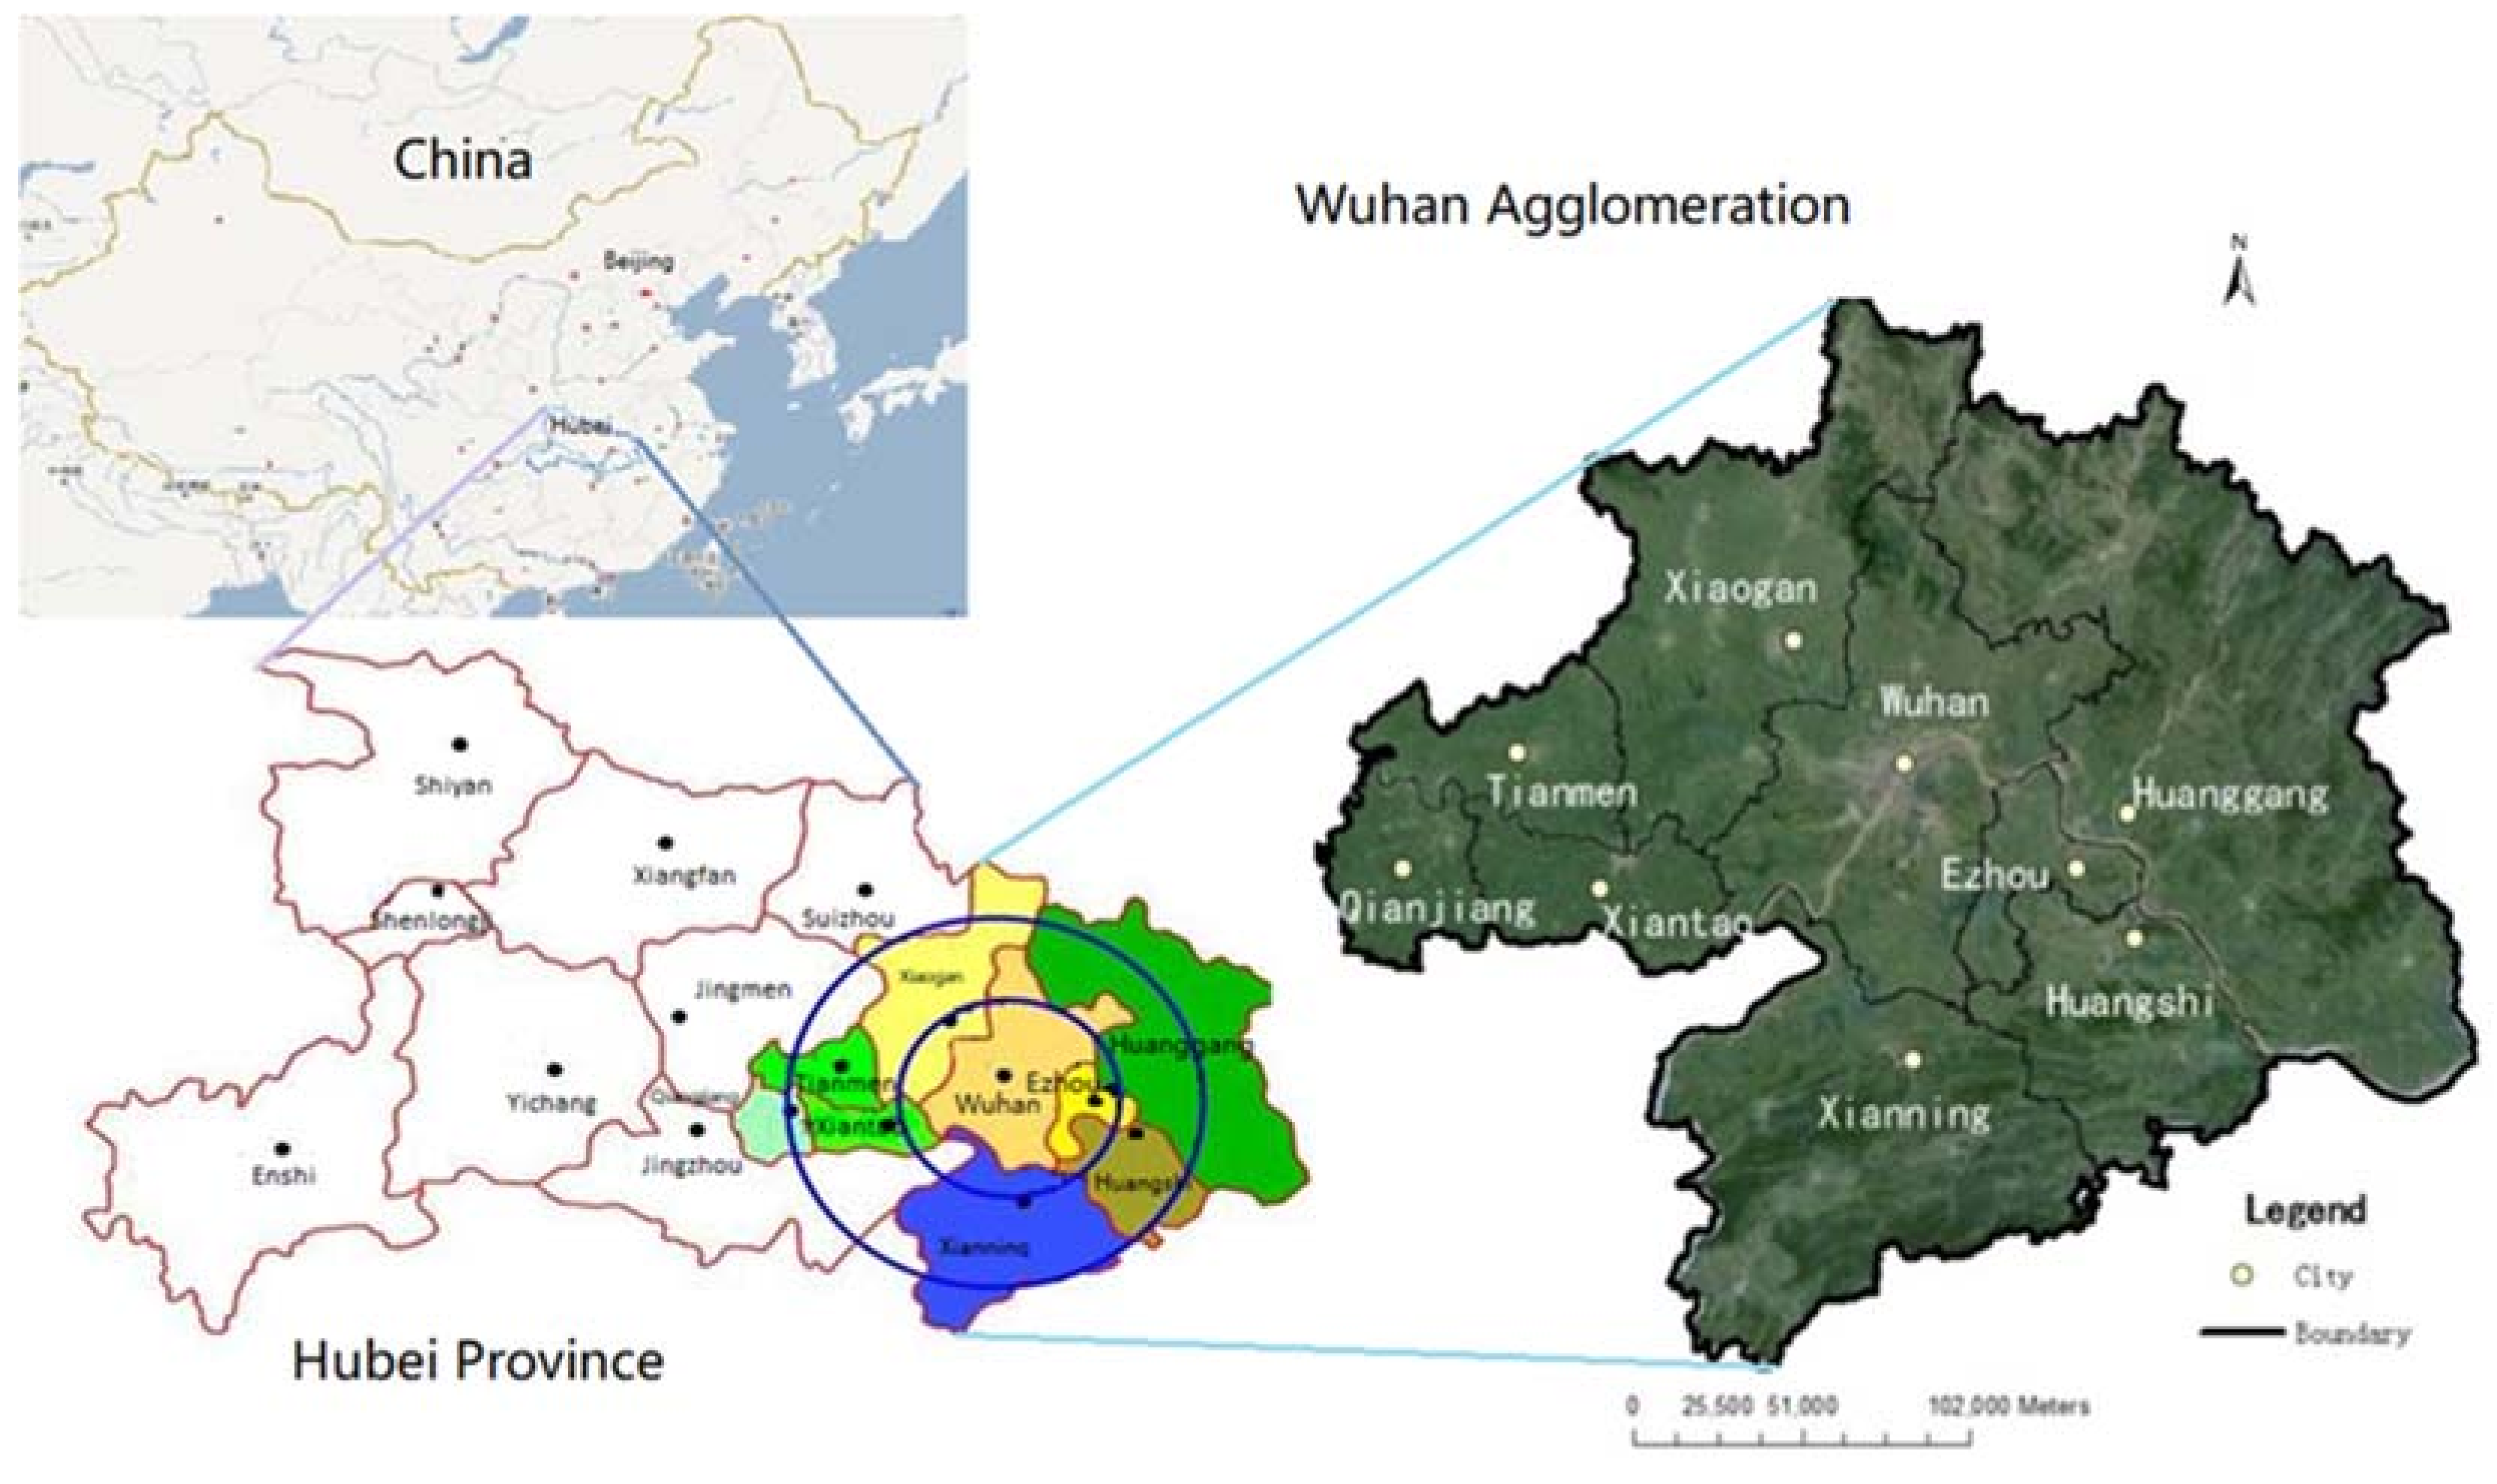
3.1. Study Area

The Wuhan urban agglomeration area (WUA) is the regional urban system that includes Wuhan City and eight other prefecture-level cities. WUA has an area of 57,800 square kilometers, a population of 38 million, and a GDP of 1879 billion Chinese in 2016. Wuhan City is the hub of this area, and is the capital of Hubei province (Figure 2). The city is the largest inland rail and road transportation hub in China. The longest river of China, the Yangtze, runs from west to the east; and the busiest railway of China, Jingjiu railway, runs from north to south and intersects in Wuhan. In addition, many of China’s national highways, such as the Beijing–Hong Kong–Macau expressway, the Shanghai–Chengdu expressway, G316, G318, and G107, also intersect in Wuhan. Thus, the WUA is a crucial area that links all parts of China. The urban population and GDP of the WUA in Wuhan were more than 10 million and 1191 billion Chinese Yuan, respectively. Since China implemented its New Type Urbanization strategy in 2014, WUA has been viewed as the top of the central urban agglomeration at the national level. The WUA plays a significant role as the national strategic fulcrum and is the leading dynamic growth pole in the development of central China.

3.2. Data

Data for this study were obtained from three sources and processed as follows: (1) Landsat Thematic Mapper image data (acquired in 1995, 2005 and 2015; resolution 30 m) for the Wuhan urban agglomeration area was obtained and processed by geometric correction and radiometric correction. Land use classification information was extracted from the data by human-computer interactive operations using ArcGIS with rasterized images as the background. The images were classified into six types of land use: arable land, grass land, forest land, urban land, water, and unused land (see Figure 3). The test of classification accuracy is implemented by sampling and on-site surveys. The overall accuracy is 86.53%. (2) Statistical data were obtained from the Hubei Statistical Yearbook, the China Statistical Yearbook for Regional Economy and the China City Statistical Yearbook. SPSS 21.0 was employed to standardize the original data to eliminate the deviation influence from magnitudes and dimension of indexes. (3) A great deal of thematic geographical data describing and suitability and transportation accessibility are derived from the land use plan and transportation network database. All of the spatial layers for statistical analysis were converted into raster format with a spatial resolution of 150 m × 150 m using an ArcGIS spatial analyst module.

4. Results and Analysis

4.1. Result of New Urban Land Demand

Land use dynamic is a complex process under the influence of socioeconomic factors and regional biophysical characters interactions. These interactions can be expressed as the causality diagram by using the SD approach [35]. The software Vensim was used to construct the causality diagram. The historical data of the land use dynamic from 1995 to 2015 were used to calibrate the coefficients of SD, based on the calibrated model to simulate the land use scenario. The simulation results are listed in Table 1.

4.2. Result of Interaction

A hierarchical indicator system of urban influence potential is constructed from three aspects: economy (including financial revenue, total sales of wholesale and retail, GDP, percentage share of secondary sector in GDP, percentage share of tertiary sector in GDP, total investment in fixed assets, actually utilized foreign investment, and disposable annual income of urban households per capita), society (including non-agricultural population, budgetary expenditure of local government on education, number of hospital beds per thousand people, and area of paved roads per capita) and environment (including park and green space per capita, area of construction land, power consumption per capita, and SO2 emissions intensity per unit of GDP), which is used to reflect the comprehensive radiation ability affecting other cities [35].
Therefore, based on the urban influence potential and the travel distance from the city to each grid in the field, we can obtain the interaction field of a single city that expresses the urban spatial interaction from the given city to the peripheral area. The total interaction then needs to be acquired to integrate the interaction influence of the entire cities. Figure 4 explicitly demonstrated the results of interaction PI among different cities in WUA.
The core city, Wuhan, interacts considerably more strongly with other cities. At the same time, the eastern spatial interaction situation is stronger than in the west in the WUA. The spatial patterns of “one nuclear and multitude weak” and “East is stronger than West” are demonstrated in the interaction network of WUA.

4.3. Simulation Result

4.3.1. Model Calibration

Parameters of the model need to be calibrated before applying our model to interpret urban growth dynamics in WUA. These parameters include the regression coefficients in equation 5. Stepwise logistic regression was used to select factors and quantify the relationship between driving factors and land use conversion [7,8]. The 1995 and 2005 land use maps were used to generate a sampling dataset for regression. The results of the regression coefficient and p-value for different land use types are reported in Table 2.

4.3.2. Evaluation the Goodness-of-Fit

The kappa index can be applied to assess goodness-of-fit between simulation results and observed land use patterns [37]. A drawback of using the kappa index for comparing model results is that slight displacements of a simulated land use type, compared to the observed types, are classified as incorrect, whereas these simulated results with slight displacements can be considered almost correct from the perspective of a modeler. Therefore, a fuzzy kappa index, where a linear distance-decayed function accounts for slightly displaced pixels/cells is used to measure goodness-of-fit. The results were obtained (see Table 3) by using the tool of MCK 3.2.2 (Netherlands Environmental Assessment Agency; http://www.riks.nl/mck/) to compare the simulated urban agglomeration growth pattern in 2015 with the real scenario of 2015. The results show that the precision of the model is acceptable for simulating the urban growth dynamic of WUA.

4.3.3. Simulation Results

The time duration of the simulation model is 1995–2020. The environment is represented using a rasterized landscape with a spatial resolution of 150 m × 150 m. A 3 × 3 Moore neighborhood rule was used for representing neighborhood interactions. The conversion of each cell is determined by transition rules defined with Equation (6). The simulation results in the spatial allocation of land use types into cells, depicting the scenario of urban spatial growth for the year 2020. The CA iteration algorithm was implemented in the C# programming language. ArcEngine of ArcGIS 10.2 was integrated for spatial analysis and mapping. Using the calibrated model to simulate the scenario of WUA urban growth in 2020, we obtained the results illustrated as Figure 5.

5. Discussions

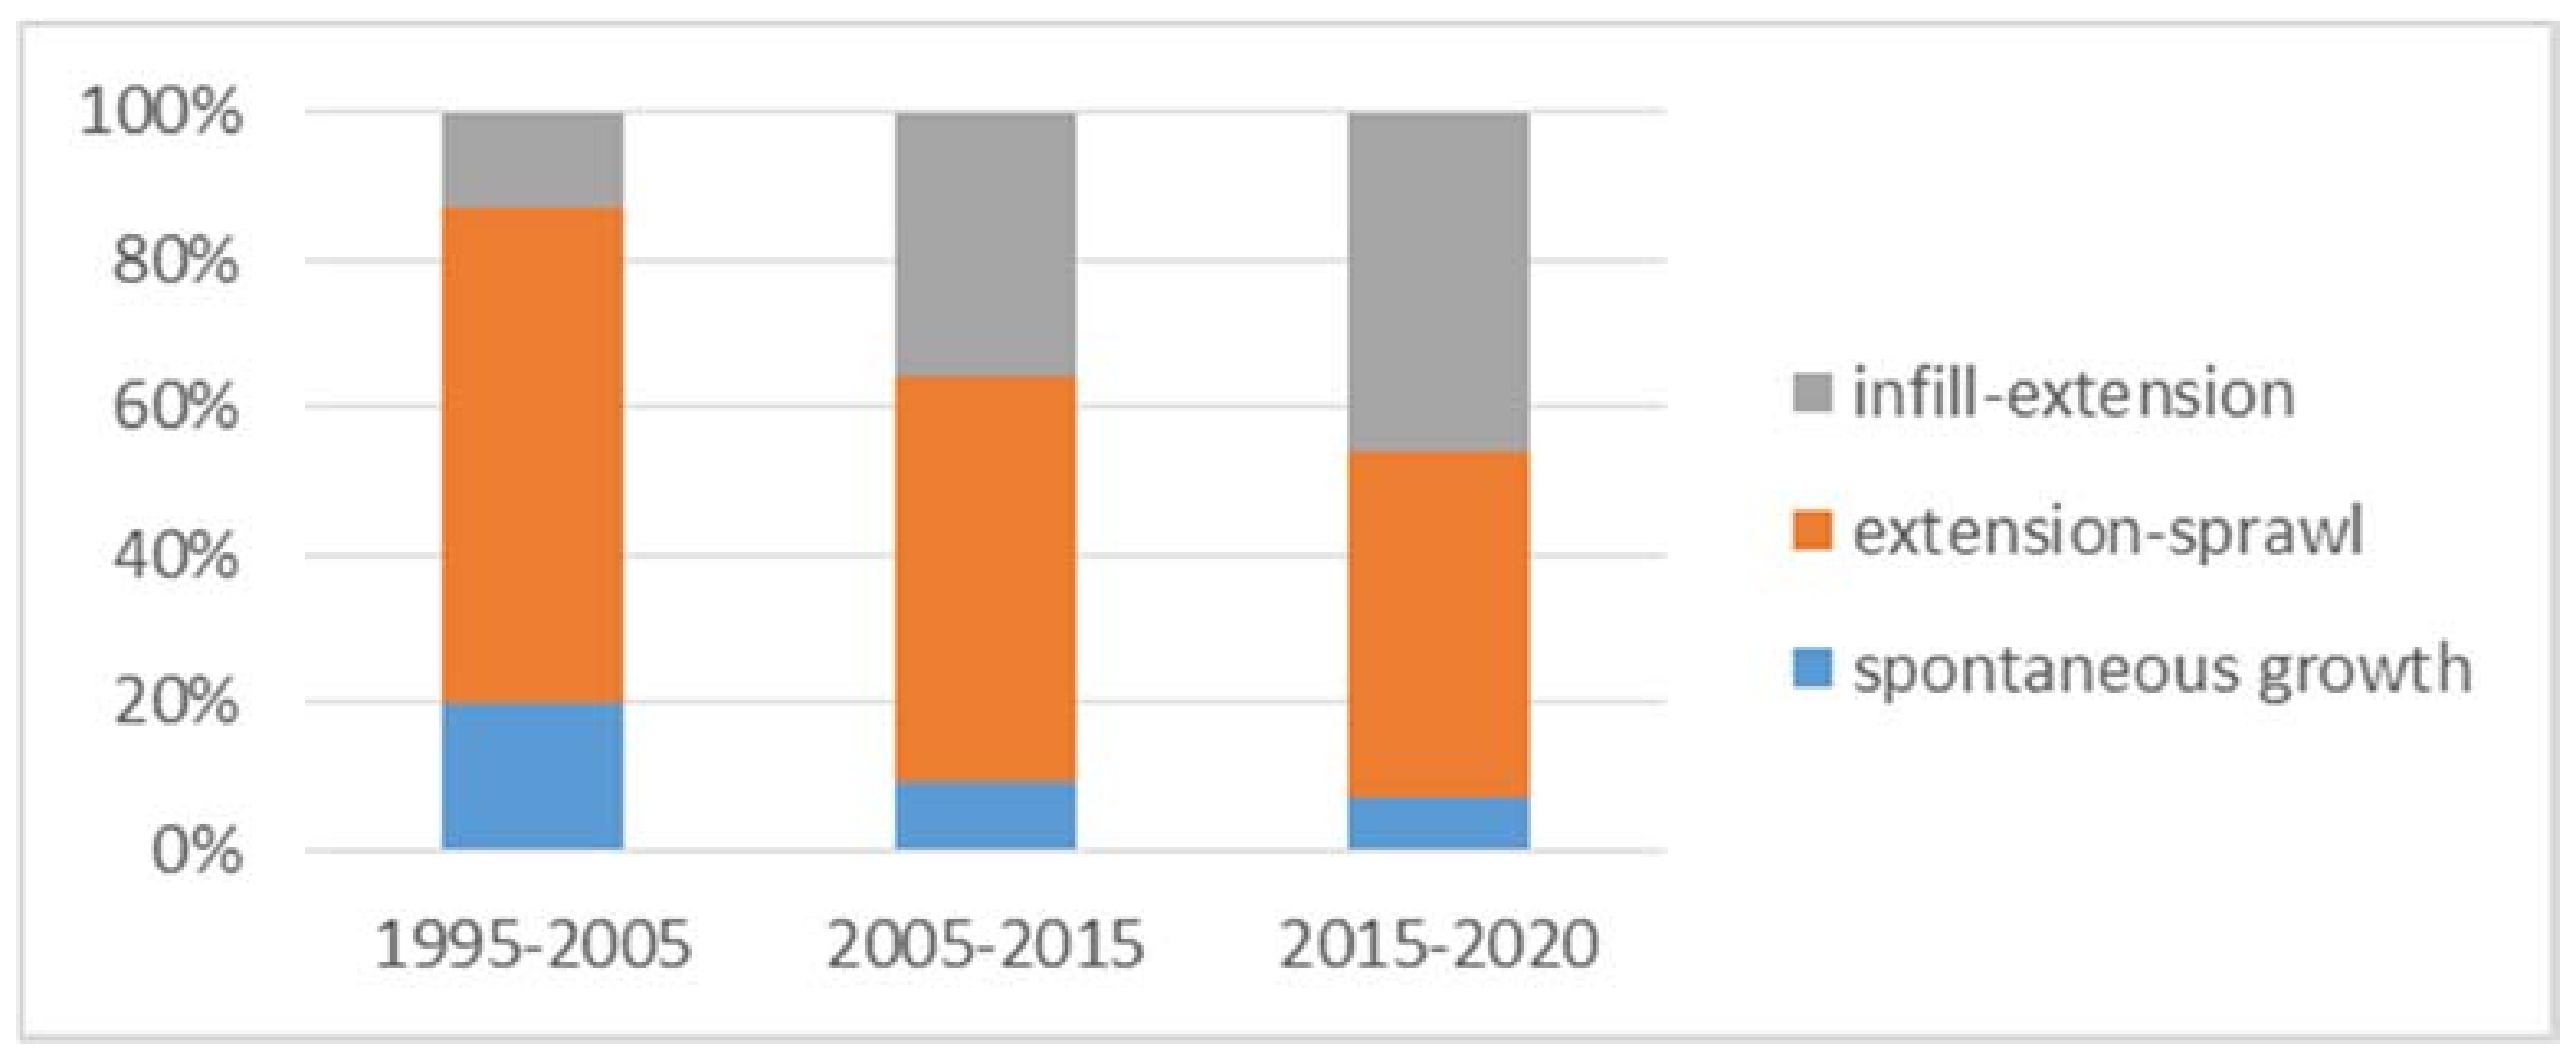
5.1. Urban Spatial Growth Transits from Sprawl to Compact Expansion

There are different patterns of the process of urban expansion in WUA based on the classification of urban growth [8].The spatiotemporal pattern of urban expansion can be divided into three types according to landscape metrics and the different intensity of urban expansion at different times: a pattern of spontaneous growth that meant the new urban patches were formed and had no direct spatial connection with the existing urban patches; an extension-sprawl pattern that expanded gradually from the central city to other suburbs; and an infill-extension pattern that is characterized by situations where the urban land growth occurs through the infilling of free spaces remaining within the existing urban area.
The three urban growth types were identified and the contribution of each in the three periods was presented in Figure 6. Throughout the three periods, the extension-sprawl type growth was the primary type of the urban land growth in WUA. This growth type’s proportions of three periods were 65.6%, 54.7% and 48.2%, presenting a descending trend, while the proportion of the infill-extension type growth was in a rising trend. The infill-extension type growth provided almost 13.1% of the total newly increased urban area in the first period (1995–2005), while the extension-sprawl type occupied 65.6%, and the spontaneous growth type accounted for a proportion of 21.3%. This results indicates the rapid and disorder urbanization phenomenon in this period. In the second period (2005–2015), the extension-sprawl type growth decreased to 54.7%, and the infill-extension type growth increased to 35.7%. In contrast, the spontaneous growth dropped to 9.6%. These results are in line with the Chinese central government’s policies of strictly controlling urban land. In the last period (2015–2020), the percentage of the infill-extension type growth increased to nearly 44.1%, very close to the extension-sprawl type growth (48.2%), and the spontaneous growth type stabilized a small proportion at 7.7%. These analyses show that the urban spatial growth has experienced a transition from sprawl to compact expansion in the WUA. To illustrate this trend spatial explicitly, we abstracted the map of urban land change dynamic of Wuhan City at three time points of 1995, 1995–2005, and 2005–2020, as demonstrated in Figure 7. From the map, we can see the scattered spot is the predominant pattern of urban land distribution (see the enlarged Map A) before 1995. During the period of 1995–2005, the urban land extended from the fringe of the existing urban area (see the enlarged Map B). These blank areas gradually had been filled during the period 2005–2020.

5.2. Intercity Interaction Promotes Urban Collaborative Expansion

In 2004, based on the “rise of central China” strategy, the government of Hubei Province launched the construction of Wuhan Urban Agglomeration. With the development of the integration in WUA, all cities develop themselves based on the following principles: the integration of infrastructure, industrial layout, regional market and urban construction. Promoted concepts include restructuring the layout of the key industry and pillar industry, developing the advantageous agricultural belts, constructing the integrated facilities of traffic, electricity, information and water conservancy and regional balanced development. As a result, spatial interaction increased continuously during 1995–2015. Meanwhile, there was a turning point in 2005; the strength of interaction increased rapidly during 2005–2015 (see Figure 8).
Meanwhile, these peripheral cities have an obvious trend to expand adjacent to the core city of Wuhan after 2005. Ezhou City and Xiaogan City, close to Wuhan, are the most obvious. Comparing the urban expansion maps from 2005 to 2020, we can see that the centers of urban spatial growth have been moving forward to Wuhan City along with the main traffic routes. For Xiaogan City, the pattern of urban growth has transformed from north–south axial linear expansion to southward and eastward with a two-wing extension to Wuhan City. Similarly, most of the new urban land of Ezhou City was in the vicinity of Gedian, which borders Wuhan during 2005–2020 (see Figure 9). From these data, we can see that the spatial interaction has been strengthened in the WUA. Consequently, the regional urban system has gradually been generated; meanwhile, its spatial structure has been reconstructed from scattering individual circles to the multicenter urban spatial network.

6. Conclusions

Urban agglomeration has become the predominant form of urbanization in China. In this process, the spatial interaction evidently played a significant role in promoting the coordinated development of these correlated cities. The Wuhan agglomeration area consists of one megacity, Wuhan, and eight peripheral medium cities (called 1 + 8 urban cluster) have experienced a rapid aggregated and integrated process. It is the need for planning the 1 + 8 urban system to simulate the collaborative growth dynamic. A multi-scale simulation model has been proposed to simulate the agglomeration development process of the Wuhan agglomeration area by embedding the multi-scale spatial interaction into the transition rule system of CA. The multi-scale interaction has been separately measured by a system dynamic demand predicting model of new urban land at the aggregated urban agglomeration scale, intercity data field interaction model at the city scale and the neighborhood interaction model at land use parcel scale. The results of the urban agglomeration spatial growth revealed that there has been a continuing urban growth in the Wuhan agglomeration area from 1995 to 2020. The spatial growth pattern mixed with three patterns: spontaneous growth, extension-sprawl, and infilled extension. Although extension-sprawl was the predominant type, the trend of extensive growth to intensive growth is obvious during the whole period. The spatial interaction among these cities has been reinforced since the strategy of Construction of Wuhan Urban Agglomeration in 2004, which guided the collaborative development and formed the regional urban system network.
From these results, we can outline several policy implications for WUA sustainable development. Urban problems should be faced in the urban system instead of the individual city; therefore, a general spatial plan of WUA should be made to resolve difficult problems such as division labor and collaboration, regional specialization and comprehensive development between the megacity and the other eight peripheral cities. Integrated regional development, welfare policies, and sharing infrastructures should be constructed to improve the integration of these cities.
This multi-scale simulation model provides support for simulation urban collaborative spatial expansion in urban agglomeration area. The case study has demonstrated the applicability of the model, which not only enriched the methodological system of urban modeling, but also provided a new perspective for the study of urban spatial growth at urban agglomeration level. This model can be applied to province, interprovince, national area, or any other urban agglomeration area, not just a specific region. How to accurately quantify intercity interaction is a key issue when creating simulations of the co-evolutionary dynamics of an urban system. With the rapid development of big data acquiring and analysis technologies, it will be our future work to use population migration and information flow big data to measure the interaction between cities.

Author Contributions

Y.Y. and J.H. participated in all phases and contributed equally to this work. W.T. participated in designing the framework and English editing. C.L. performed part of the experimental data procession and paper revision. All authors read and approved the final manuscript.

Acknowledgments

This work was supported by the National Natural Science Foundation of China (No. 41471339, 41571514)).

Conflicts of Interest

The authors declare no conflict of interest.

References

  1. Huang, H.; Wei, Y.D. Intra-metropolitan location of foreign direct investment in Wuhan, China: Institution, urban structure, and accessibility. Appl. Geogr. 2014, 47, 78–88. [Google Scholar] [CrossRef]
  2. Lu, L.L.; Guo, H.D.; Wang, C.Z.; Pesaresi, M.; Ehrlich, D. Monitoring bidecadal development of urban agglomeration with remote sensing images in the Jing-Jin-Tang area, China. J. Appl. Remote Sens. 2014, 8, 084592. [Google Scholar] [CrossRef]
  3. UNDP in China. China National Human Development Report 2016. Available online: http://www.cn.undp.org/content/china/en/home/library/human_development/china-human-development-report-2016.html (accessed on 21 August 2018).
  4. Zhu, Z.; Zheng, B.H. Study on spatial structure of Yangtze River Delta urban agglomeration and its effects on urban and rural regions. J. Urban Plan. Dev. 2012, 138, 78–89. [Google Scholar]
  5. Xie, Y.C.; Fan, S.Y. Multi-city sustainable regional urban growth simulation-MSRUGS: A case study along the mid-section of Silk Road of China. Stoch. Environ. Res. Risk Assess 2014, 28, 829–841. [Google Scholar] [CrossRef]
  6. Hosseinali, F.; Alesheikh, A.A.; Nourian, F. Agent-based modeling of urban land-use development, case study: Simulating future scenarios of Qazvin city. Cities 2013, 31, 105–113. [Google Scholar] [CrossRef]
  7. Liu, X.P.; Ma, L.; Li, X.; Ai, B.; Li, S.Y.; He, Z.J. Simulating urban growth by integrating landscape expansion index (LEI) and cellular automata. Int. J. Geogr. Inf. Sci. 2014, 28, 148–163. [Google Scholar] [CrossRef]
  8. Clarke, K.C.; Hoppen, S.; Gaydos, J. A self-modifying cellular automatonmodel of historical urbanization in the San Francisco Bay Area. Environ. Plan. B 1997, 24, 247–261. [Google Scholar] [CrossRef]
  9. De Kok, J.L.; Engelen, G.; White, R.; Wind, H.G. Modeling land-use change in a decision-support system for coastal-zone management. Environ. Model. Assess. 2001, 6, 123–132. [Google Scholar] [CrossRef]
  10. Fang, S.; Gertner, G.Z.; Sun, Z.; Anderson, A.A. The impact of interactions in spatial simulation of the dynamics of urban sprawl. Landsc. Urban Plan. 2005, 73, 294–306. [Google Scholar] [CrossRef]
  11. Meentemeyer, R.K.; Tang, W.W.; Dorning, M.A.; Vogler, J.B.; Cunniffe, N.J.; Shoemaker, D.A. FUTURES: Multilevel simulations of emerging urban-rural landscape structure using a stochastic patch-growing algorithm. Ann. Assoc. Am. Geogr. 2013, 103, 785–807. [Google Scholar] [CrossRef]
  12. Soranno, P.A.; Cheruvelil, K.S.; Bissell, E.G.; Bremigan, M.T.; Downing, J.A.; Fergus, C.E.; Filstrup, C.T.; Henry, E.N.; Lottig, N.R.; Stanley, E.H.; et al. Cross-scale interactions: Quantifying multi-scaled cause–effect relationships in macrosystems. Front. Ecol. Environ. 2014, 12, 65–73. [Google Scholar] [CrossRef]
  13. Liu, X.J.; Derudder, B.; Wang, M. Polycentric urban development in China: A multi-scale analysis. Environ. Plan. B 2017. [Google Scholar] [CrossRef]
  14. Jiang, L.; Deng, X.Z.; Seto, K.C. Multi-level modeling of urban expansion and cultivated land conversion for urban hotspot counties in China. Landsc. Urban Plan. 2012, 108, 131–139. [Google Scholar] [CrossRef]
  15. Overmars, K.P.; Verburg, P.H. Multilevel modelling of land use from field to village level in the Philippines. Agric. Syst. 2006, 89, 435–456. [Google Scholar] [CrossRef]
  16. Tang, W.; Malanson, G.P.; Entwisle, B. Simulated village locations in Thailand: A multi-scale model including a neural network approach. Landsc. Ecol. 2009, 24, 557–575. [Google Scholar] [CrossRef] [PubMed]
  17. Chaudhuri, G.; Clarke, K.C. Temporal accuracy in urban growth forecasting: A study using the SLEUTH model. Trans. GIS 2014, 18, 302–320. [Google Scholar] [CrossRef]
  18. Feng, Y.J.; Liu, Y. A heuristic cellular automata approach for modelling urban land-use change based on simulated annealing. Int. J. Geogr. Inf. Sci. 2013, 27, 449–466. [Google Scholar] [CrossRef]
  19. Feng, Y.J.; Liu, Y.; Tong, X.H.; Liu, M.L.; Deng, S.S. Modeling dynamic urban growth using cellular automata and particle swarm optimization rules. Landsc. Urban Plan. 2011, 102, 188–196. [Google Scholar] [CrossRef]
  20. Liu, X.J. Exploring the joint dynamics of intercity internet and corporate networks: A stochastic actor-based modelling approach. Glob. Netw. 2014, 14, 167–187. [Google Scholar] [CrossRef]
  21. Rimal, B.; Zhang, L.F.; Keshtkar, H.; Barry, N.; Sushila, R.; Zhang, P. Land use/Land cover dynamics and modeling of urban land expansion by the integration of cellular automata and markov chain. ISPRS Int. J. Geo-Inf. 2018, 7, 154. [Google Scholar] [CrossRef]
  22. Yao, Y.; Li, J.; Zhang, X.; Duan, P.; Li, S.; Xu, Q. Investigation on the expansion of urban construction land use based on the CART-CA model. ISPRS Int. J. Geo-Inf. 2017, 6, 149. [Google Scholar] [CrossRef]
  23. He, C.Y.; Zhao, Y.Y.; Tian, J.; Shi, P.J. Modeling the urban landscape dynamics in a megalopolitan cluster area by incorporating a gravitational field model with cellular automata. Landsc. Urban Plan. 2013, 113, 78–89. [Google Scholar] [CrossRef]
  24. Lagarias, A. Urban sprawl simulation linking macro-scale processes to micro-dynamics through cellular automata, an application in Thessaloniki, Greece. Appl. Geogr. 2012, 34, 146–160. [Google Scholar] [CrossRef]
  25. Li, X. Emergence of bottom-up models as a tool for landscape simulation and planning. Landsc. Urban Plan. 2011, 100, 393–395. [Google Scholar] [CrossRef]
  26. Zeng, C.; Zhang, M.D.; Cui, J.X.; He, S.W. Monitoring and modeling urban expansion—A spatially explicit and multi-scale perspective. Cities 2015, 43, 92–103. [Google Scholar] [CrossRef]
  27. Tan, R.H.; Liu, Y.L.; Zhou, K.H.; Tang, W. A game-theory based agent-cellular model for use in urban growth simulation: A case study of the rapidly urbanizing Wuhan area of central China. Comput. Environ. Urban Syst. 2015, 49, 15–29. [Google Scholar] [CrossRef]
  28. Zhao, X.; Liu, Y.L.; Liu, D.F.; Ma, X.Y. AITSO: A tool for spatial optimization based on artificial immune systems. Comput. Intell. Neurosci. 2015, 2015, 13. [Google Scholar] [CrossRef] [PubMed]
  29. Liu, X.P.; Hu, G.; Ai, B.; Li, X.; Tian, G.; Chen, Y.M.; Li, S.S. Simulating urban dynamics in China using a gradient cellular automata model based on S-shaped curve evolution characteristics. Int. J. Geogr. Inf. Sci. 2018, 32, 73–101. [Google Scholar] [CrossRef]
  30. Verburg, P.H.; de Koning, G.H.J.; Kok, K.; Veldkamp, A.; Bouma, J. A spatial explicit allocation procedure for modelling the pattern of land use change based upon actual land use. Ecol. Model. 1999, 116, 45–61. [Google Scholar] [CrossRef]
  31. Wu, W.J.; Zhang, W.Z.; Jin, F.J.; Deng, Y. Spatio-temporal Analysis of Urban Spatial Interaction in Globalizing China—A Case Study of Beijing-Shanghai Corridor. Chin. Geogr. Sci. 2009, 19, 126–134. [Google Scholar] [CrossRef]
  32. Xu, C.; Liu, M.S.; Zhang, C.; An, S.Q.; Yu, W.; Chen, J.M. The spatiotemporal dynamics of rapid urban growth in the Nanjing metropolitan region of China. Landsc. Ecol. 2007, 22, 925–937. [Google Scholar] [CrossRef]
  33. Li, X.; Yeh, A.G. Neural-network-based cellular automata for simulating multiple land use changes using GIS. Int. J. Geogr. Inf. Sci. 2002, 16, 323–343. [Google Scholar] [CrossRef]
  34. Wu, F.; Webster, C.J. Simulation of natural land use zoning under free-market and incremental development control regimes. Comput. Environ. Urban Syst. 1998, 22, 241–256. [Google Scholar] [CrossRef]
  35. He, J.H.; Wang, X.J.; Du, C.; Li, C.; Shi, X. Land use simulation and driving forces analysis of Wuhan urban agglomeration. Yangtz River Res. Environ. 2015, 24, 1270–1278. (In Chinese) [Google Scholar]
  36. He, J.H.; Li, C.; Yu, Y.; Liu, Y.L.; Huang, J.L. Measuring urban spatial interaction in Wuhan urban agglomeration, central China: A spatial explicitly approach. Sustain. Cities Soc. 2017, 32, 569–583. [Google Scholar] [CrossRef]
  37. Wu, F.L. Calibration of stochastic cellular automata: The application to rural-urban land conversions. Int. J. Geogr. Inf. Sci. 2002, 16, 795–818. [Google Scholar] [CrossRef]
Figure 1. Framework of the multi-scale model of the urban agglomeration growth dynamic.
Ijgi 07 00176 g001
Figure 2. Map of study area: Wuhan urban agglomeration area, Hubei province, China.
Ijgi 07 00176 g002
Figure 3. Actual land use map from (a) 1995, (b) 2005, and (c) 2015.
Ijgi 07 00176 g003
Figure 4. Interactions among different cities of WUA in different years: (a) 1995, (b) 2005, and (c) 2015.
Ijgi 07 00176 g004
Figure 5. Simulation results of the WUA urban growth scenario in 2020.
Ijgi 07 00176 g005
Figure 6. Urban expansion pattern during 1995–2020.
Ijgi 07 00176 g006
Figure 7. Urban land change dynamic of Wuhan City in three different periods.
Ijgi 07 00176 g007
Figure 8. Strength of interaction changes during three periods.
Ijgi 07 00176 g008
Figure 9. Urban spatial growth of Xiaogan City and Ezhou City extends to Wuhan City.
Ijgi 07 00176 g009
Table 1. Results of urban land demand and PD of different cities in WUA.
WuhanHuangshiHuanggangXiaoganXianning TianmenEzhouQianjiangXiantao
Urban land (Km2)602.5264.37172.12131.6699.0249.9759.8656.6762.40
PD7.031.410.991.481.021.913.752.852.48
Table 2. Regression coefficients and their p-values.
Arable LandGrass LandForest LandUrban LandWaterUnused Land
βpβpβpβpβpβp
Soil0.0410.00120.0300.00120.0050.001300000.0370.0081
Elevation−0.0060.00270.0110.00210.0150.0024−0.0520.00030.0040.02620.0520.0052
Slope−0.0390.00160.0040.00160.0090.0061−0.1710.00250.0070.03530.0710.0102
Hydrology−0.0190.0038−0.0120.0009000.0060.00450.0130.01850.0110.0317
Geology000.0020.0023000.3590.00870.0020.04230.0070.0052
Distance to main center−0.0950.0016−0.0190.00470.0170.0057−0.6210.01390.0060.0313−0.0120.0009
Distance to sub-center−0.0470.0029−0.0080.00500.0220.0012−0.2710.00610.0030.0227−0.0140.0014
Distance to road−0.0520.0028−0.0150.00670.0100.0006−0.4210.00630.0110.0165−0.0260.0007
Distance to railway00000.0050.001−0.0520.02160.0040.02920.0120.0102
Constant0.2730.04670.6250.0132−0.3850.04320.3290.01160.7210.03120.5320.0391
All regression coefficients are significant based on a conventional level of 5%; β: coefficients; p: p-values.
Table 3. Results of evaluation goodness-of-fit with a fuzzy kappa index.
ArableGrass LandForestConstructiveWaterUnused
Kappa index0.810.890.860.820.910.79

