Article

Spatial Variability of Local Rural Landscape Change under Rapid Urbanization in Eastern China

1
School of Geographical Sciences, Southwest University, Chongqing 400715, China
2
Chongqing Geomatics Center, Chongqing 401121, China
3
College of Resources and Environmental Sciences, China Agricultural University, Beijing 100193, China
4
College of Landscape and Ecological Engineering, Hebei University of Engineering, Handan 056021, China
5
School of Architecture, Tianjin University, Tianjin 300072, China
6
China National Engineering Research Center for Human Settlements, Beijing 100044, China
*
Author to whom correspondence should be addressed.
ISPRS Int. J. Geo-Inf. 2018, 7(6), 231; https://doi.org/10.3390/ijgi7060231
Submission received: 2 May 2018 / Revised: 31 May 2018 / Accepted: 18 June 2018 / Published: 20 June 2018

Abstract

:
Understanding the characteristics of rural landscape change during the urbanization process is crucial to developing more elaborate rural landscape management plans for sustainable development. However, there is little information revealing how rural landscapes change at a local scale and limited evidence addressing how to improve the practicability of these management approaches. This paper aims to investigate local rural landscape compositions and patterns and to identify the spatial variability of local rural landscape change under rapid urbanization in eastern China to provide detail approaches to practicable and efficient local landscape management. The land use composition and landscape pattern from 2009 to 2012 were analyzed in three rural areas, namely, Daxing (DX) in Beijing, Quzhou (QZ) in Hebei Province and Changshu (CS) in Jiangsu Province. The results showed that the three rural areas varied in landscape pattern and land use composition change, even in the short term. Local farmland decreased slightly, demonstrating the effectiveness of the national farmland protection policy. Compared to the other two rural areas, CS was more diverse, fragmented and complex, and it had the greatest change rate between 2009 and 2012. In this rural area, semi-natural land dramatically increased, from 9.15% to 39.85%, and settlement construction unexpectedly decreased. QZ was characterized by a highly homogenous landscape dominated by farmland, which accounted for more than 80% of the total area, and it showed a slow decrease in farmland with weak increases in semi-natural land and construction. DX was characterized by a simple and homogenous landscape and had a median change rate of 9.32%, presenting a common land use change trend of a fast expansion in construction but decreases in farmland and semi-natural land. During decreases in highly valuable natural land, semi-natural land was important for nature conservation in rural areas at a local scale, but that process needs further improvement, especially in DX and QZ. Generally, local rural landscapes became more disaggregated and diverse during landscape change. Land use switches among farmland, orchards, nurseries, and other production lands were the major driving force for local change. Considering differential characteristics of landscape change among rural areas, we suggest that efficient landscape management requires the development of strategies that account for the spatial variability of urbanization effects. Subsidies for the management of semi-natural land with high natural value are meaningful for local natural conservation.

1. Introduction

Urbanization will last for decades in major regions of the world, as it was estimated that the urban population will increase from 2010 to 2100 [1]. Associated with this process, a series of environmental problems, including rural landscape fragmentation, water quality degradation, soil pollution and erosion, and biodiversity loss [2,3,4,5,6,7,8], have arisen. With the help of modern remote sensing techniques [9,10,11,12], monitoring landscape change, including land use change and landscape pattern change, is an efficient way to assess the effects of urbanization.
Many studies have investigated landscape changes under urbanization on a regional scale, especially when analyzing the tendencies of land use change [11,13], mapping changes [12,14,15,16], urban-rural gradient [17], and exploring driving forces [10,18,19,20]. A general land use change trend of construction expanding with farmland and a decrease in natural land is widely observed [11,12,13,14,15,16], with the main driving forces being population, policy, and economy [19,21]. Furthermore, landscape pattern changes are usually analyzed and compared using landscape metrics [22,23,24]. These metrics indicate that urbanization results in a more heterogeneous and fragmented landscape [25] and more evenly distributed landscape patches [15]. Then, landscape management for sustainable development according to these crucial characteristics generally focuses on construction control, habitat protection and responses to fragmentation [26,27,28]. Due to the difficulty of obtaining data, few studies have shown land use change characteristics at a local scale, such as linear vegetation plantation leading to vegetation growth [29] and local specific landscape contributing management in European [30], and these studies play a key role in revealing different land use change characteristics at a regional scale [31].
China is a rapidly developing country that is facing rapid urbanization [32,33,34], and construction expansion has caused a dramatic decrease in farmland and natural land at a regional scale [3,19,35,36]. Figuring out land use and landscape change at a local scale is an important complement to regional studies in China [37] and provides evidence to improve land use management policies for sustainable development. When further discussing the practicability of these policies or how to practicably improve rural landscapes, research needs to go down to the local scale. However, few studies could provide these experiences, and a few studies could even show local rural landscape composition and change characters under urbanization. However, this information is crucial for efficient rural landscape management policies responding to urbanization processes and practicability improvement.
This paper focused on local rural landscape characteristics. A field survey was used to obtain reliable and precise data. Land use composition, landscape pattern, and their changes were evaluated to reveal the basic characteristics of local rural landscapes under urbanization. Then, case studies were conducted in three areas to show the spatial variations in rural landscape changes and to provide more evidence regarding local rural areas. Finally, landscape management suggestions regarding the local rural landscape were discussed.

2. Study Areas and Methods
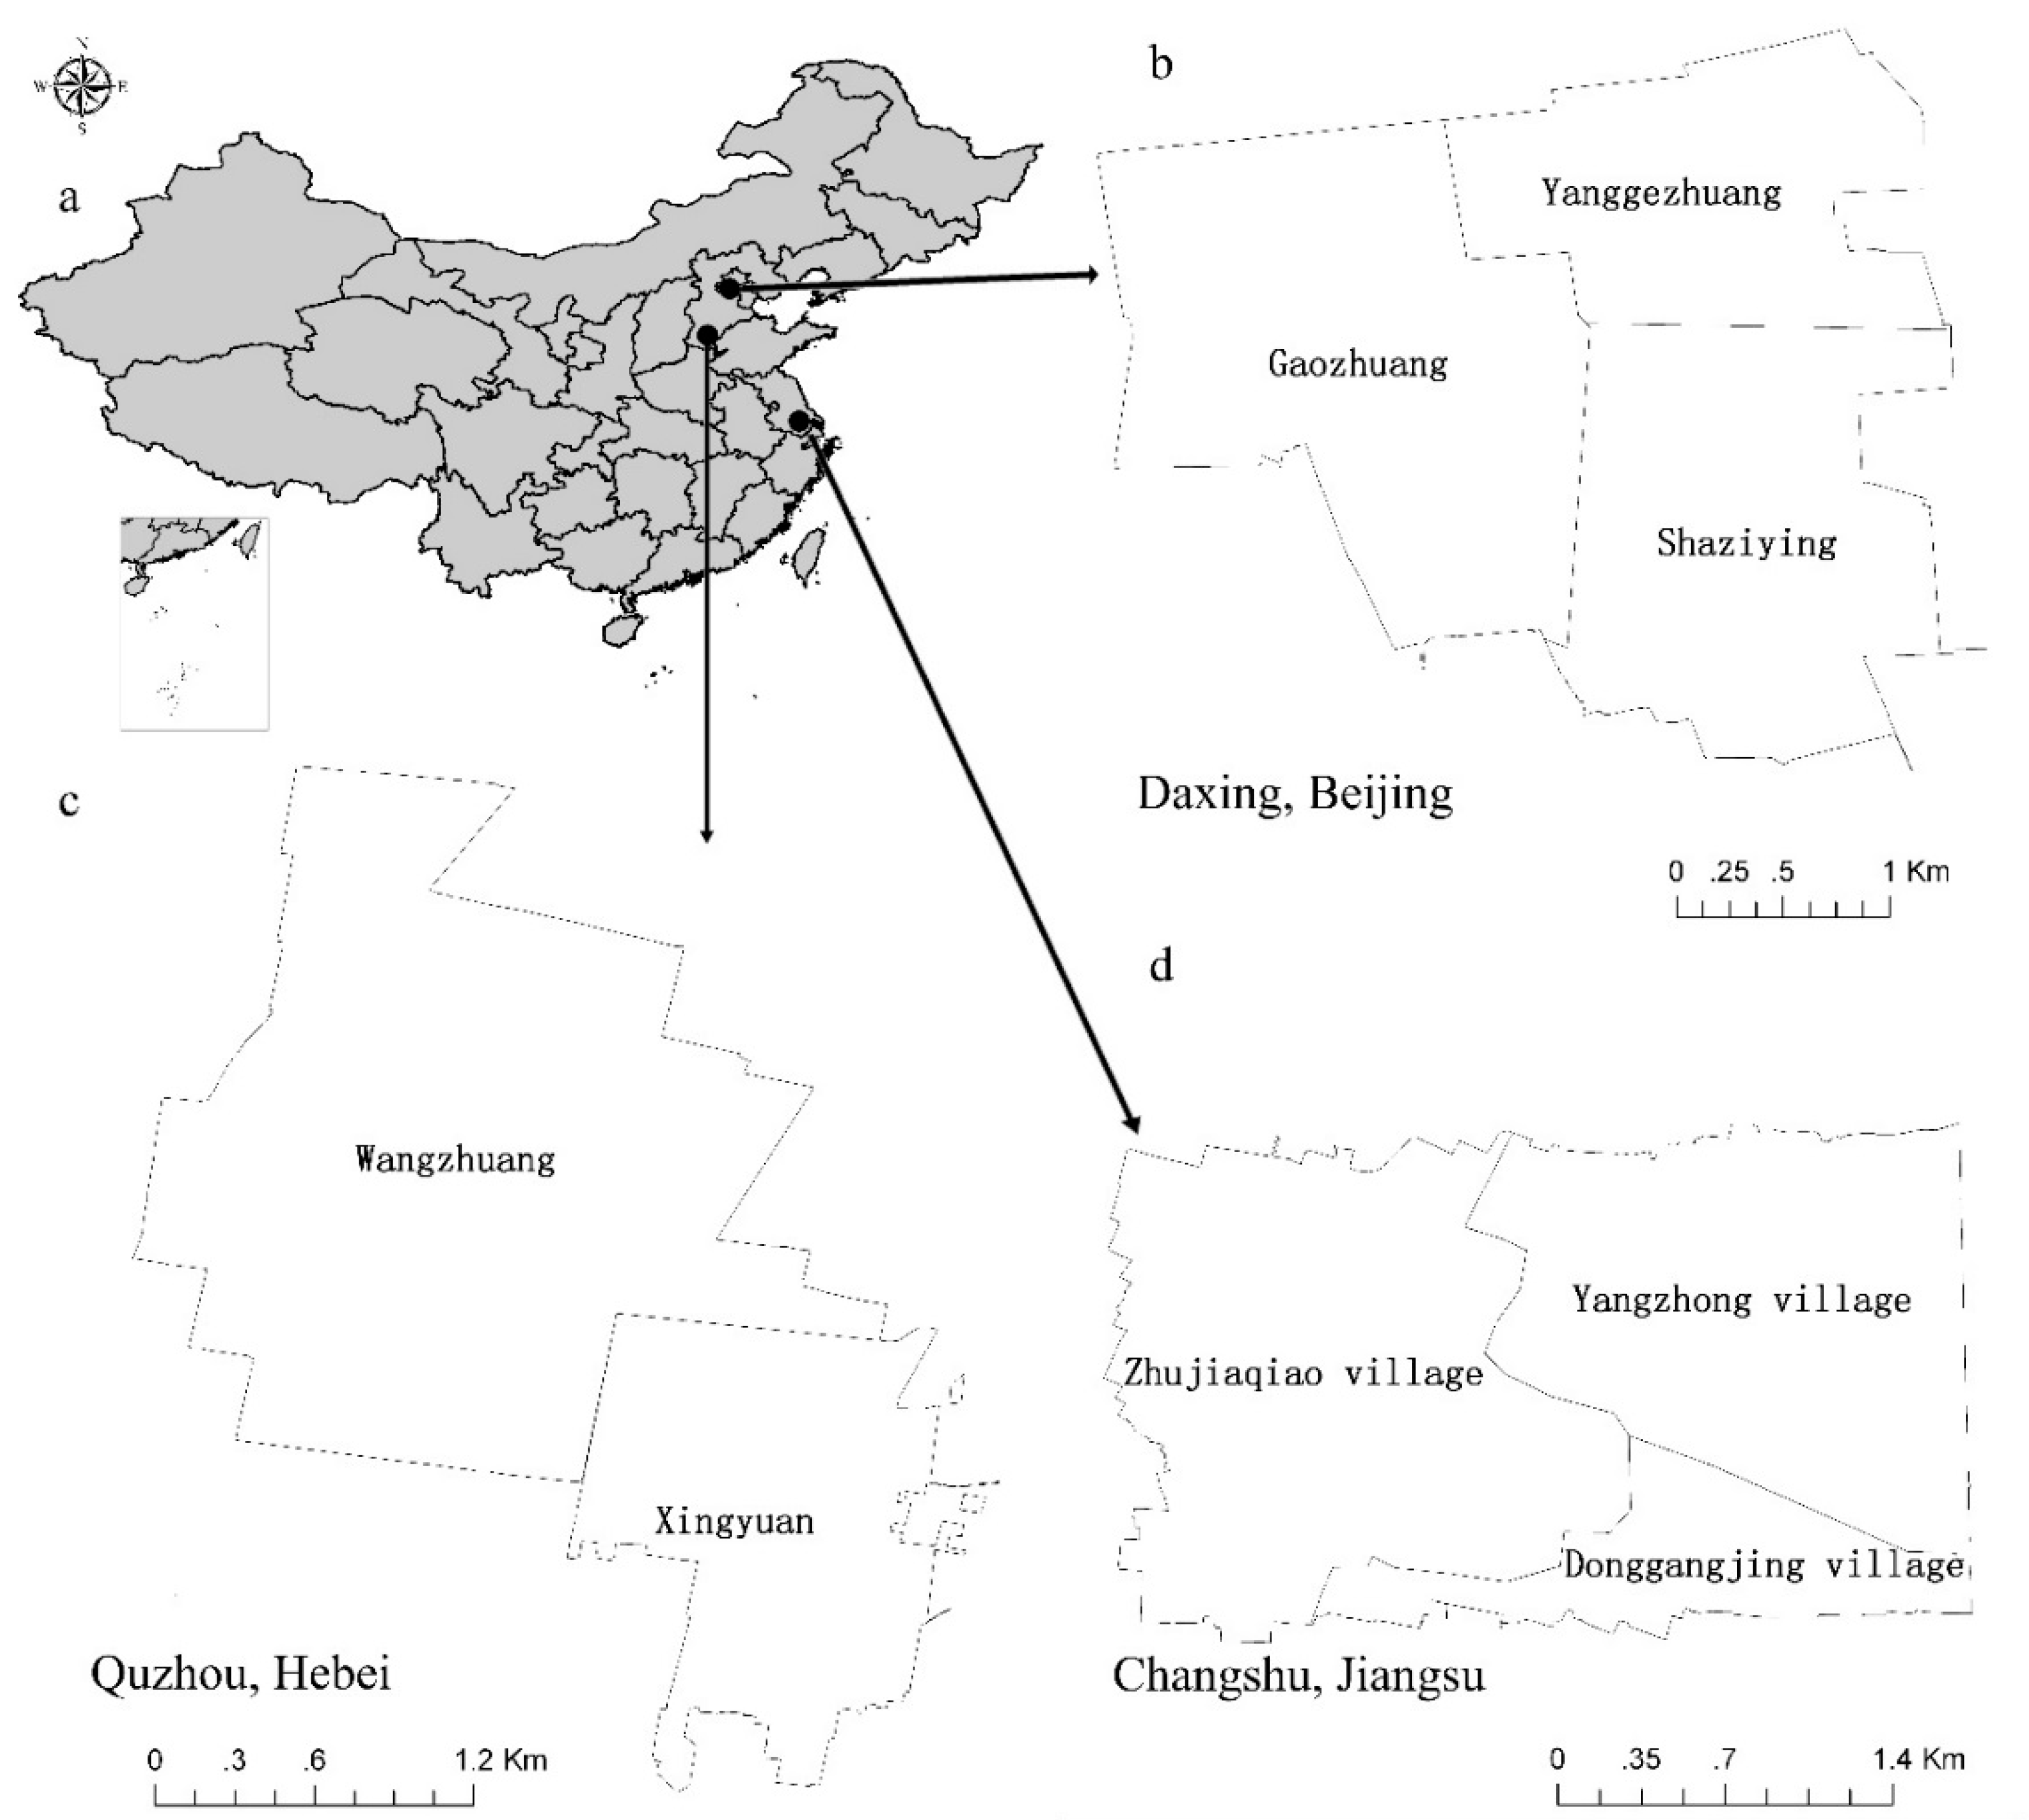
2.1. Study Area

Eastern China has been experiencing rapid urbanization in the recent several decades. This region is also a leader in innovation in Chinese urbanization development, and its development experience therefore provides critical examples for other regions. Considering that eastern China covers a large area, study areas in different regions helped to identify various landscape change characteristics at a local scale and have provided evidence for efficient management policy making. Villages located in rural areas of three provinces were selected (Figure 1): (1) The villages of Yanggezhuang, Gaozhuang and Shaziying are located in Daxing (DX), Beijing. Because of the effects of metropolitan development, these areas have greater financial and technical investments that provide more job opportunities and stronger economic development in the local community. That draws local farmers migrating from nearby provinces, causing high land use pressure; (2) The villages of Wangzhuang and Xingyuan in Quzhou (QZ), Hebei Province, are traditional agricultural production areas in the North China Plain. Production of food and economic crops still plays a dominant role in the local economy. Fields are mainly managed by local households. The local community shows a gradual and slow development of both the society and economy; (3) The villages of Zhujiaqiao, Yangzhong and Donggangjing are in Changshu (CS), Jiangsu Province, where the weather conditions differ from those in the other two areas, including more rain, and there is strong private economic development and a high level of urbanization in this part of eastern China. In these areas, family workshops are much more developed, and agricultural land is intensively cultivated by agricultural businesses and professional farmers who rent the lands from local farmers.

2.2. Methods

Landscape change generally consists of two aspects, land use change and landscape pattern change. A local rural landscape survey was conducted to classify land use to obtain reliable data, and landscape pattern indicators were used to identify the pattern change.

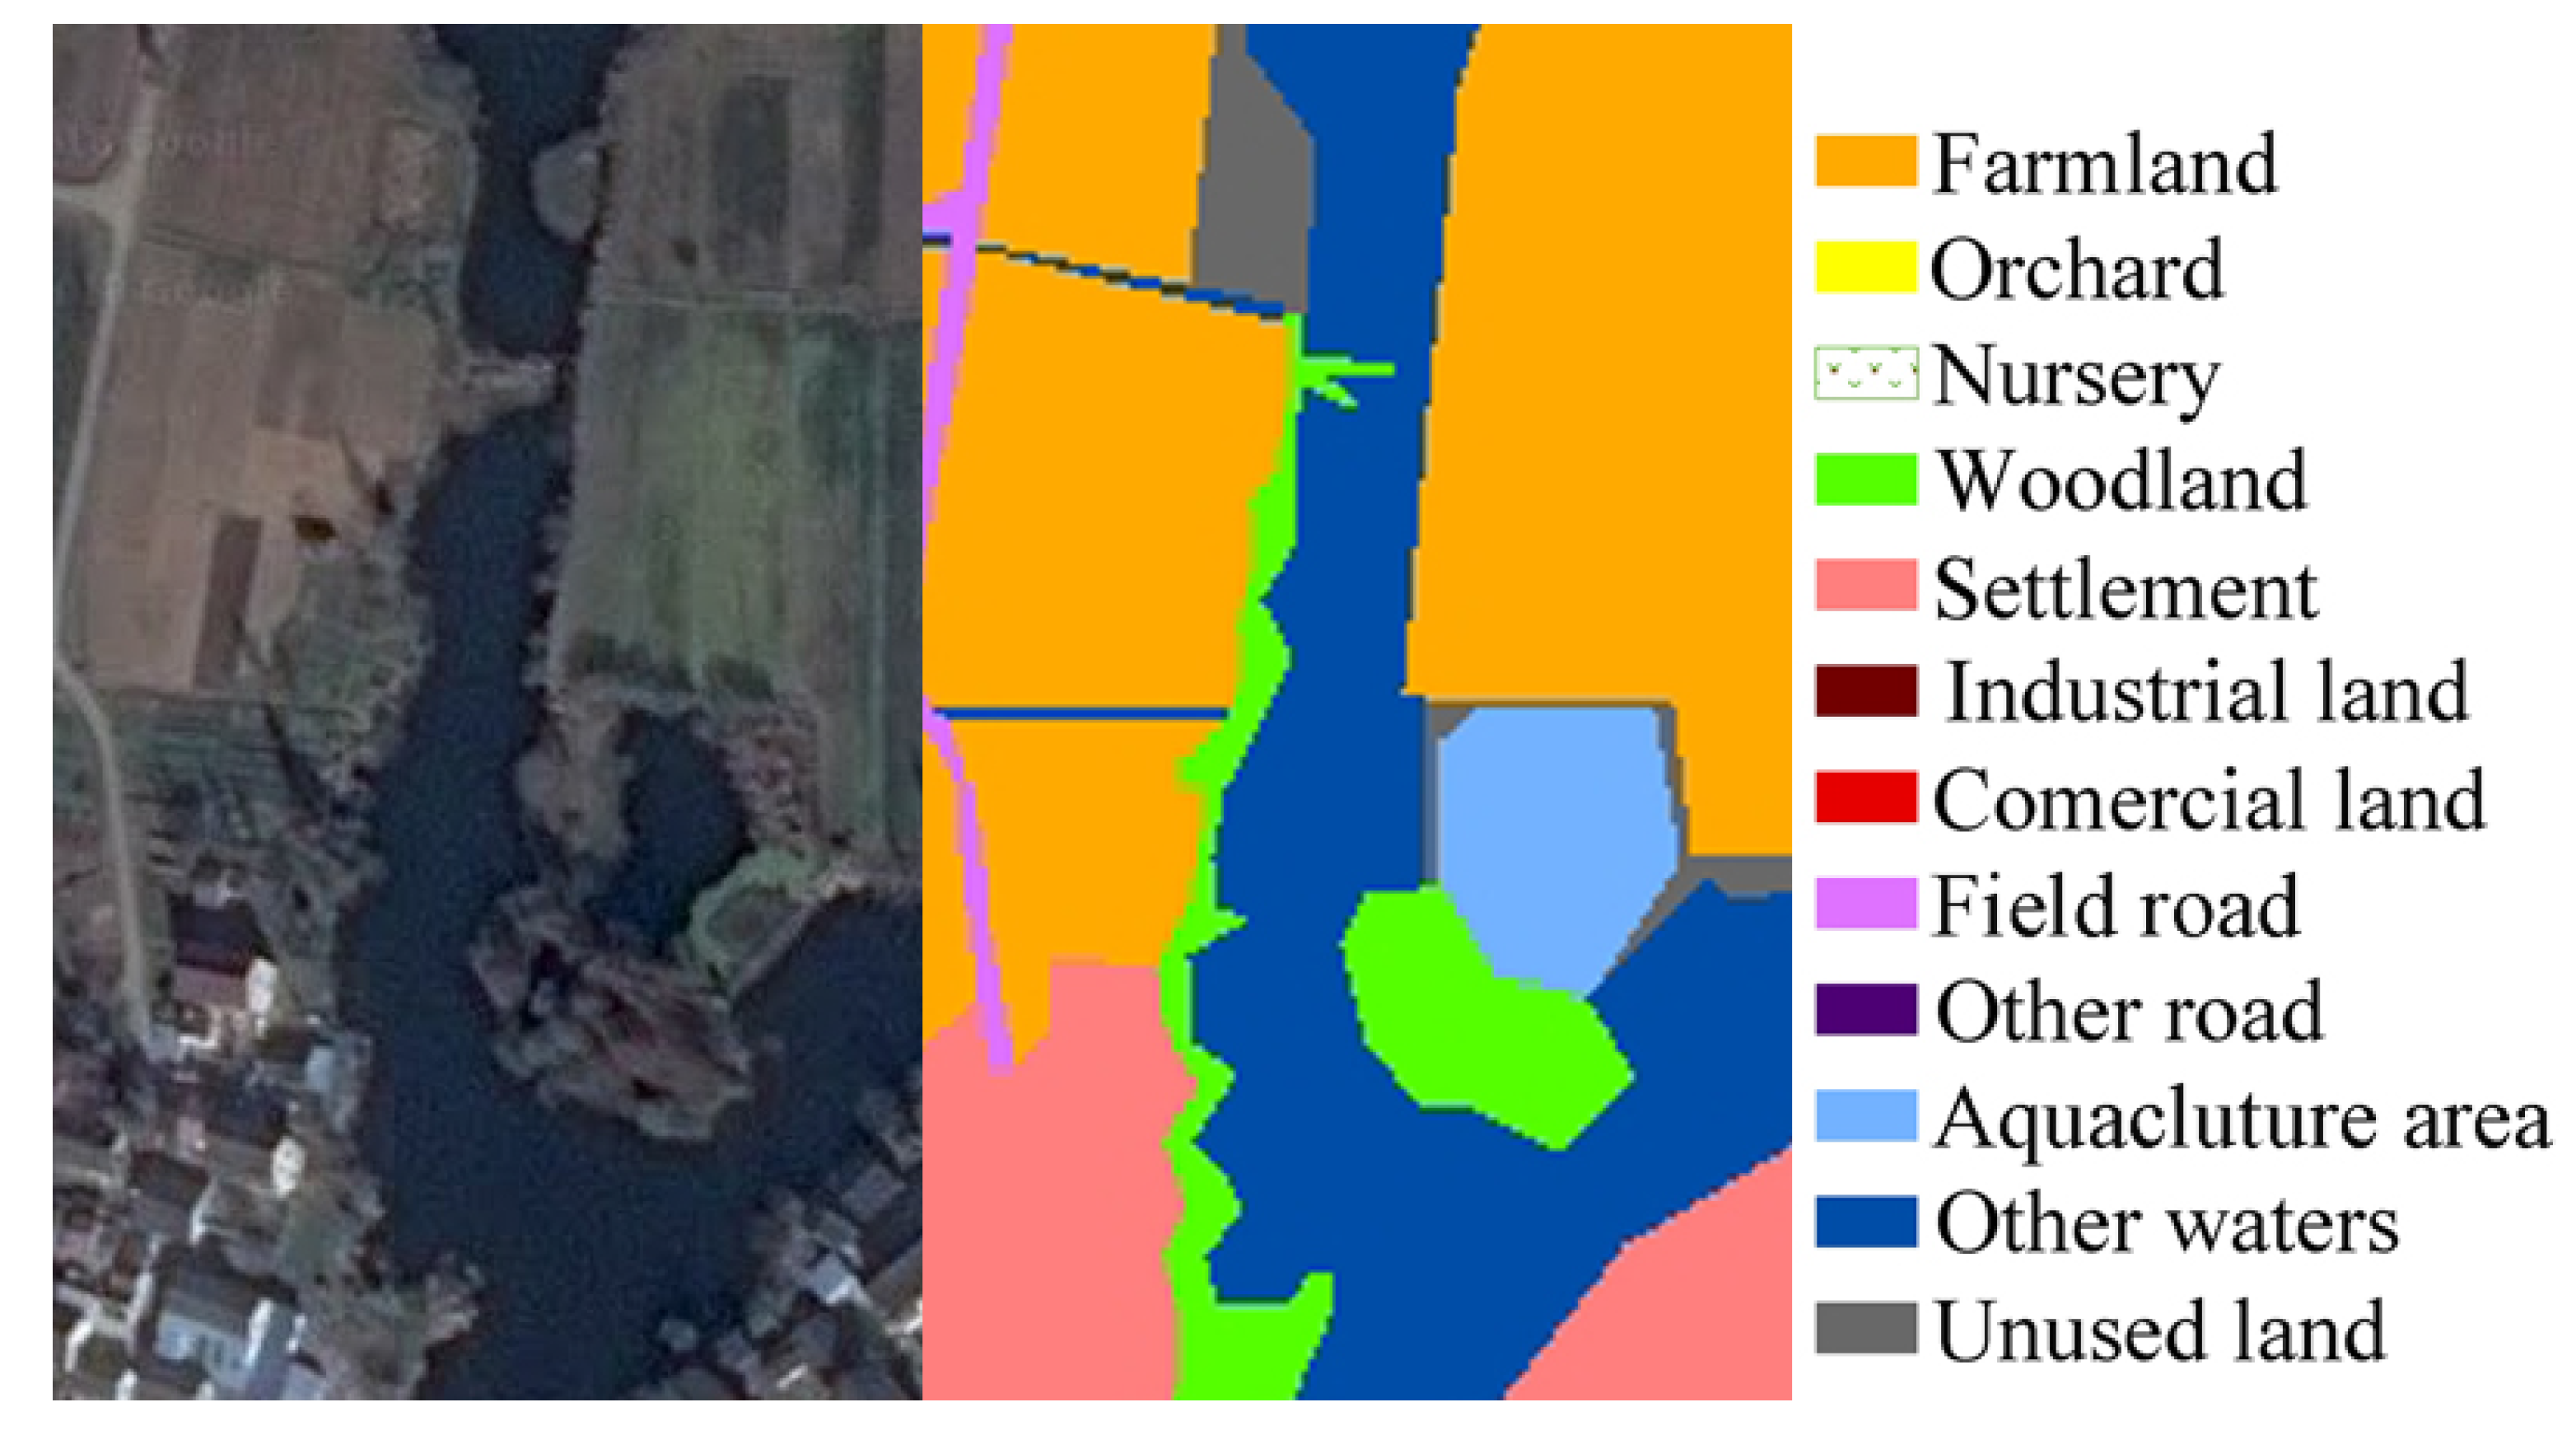
2.2.1. Local Landscape Survey

To obtain accurate local land use data, field surveys in both 2009 and 2012 were carried out in the three study areas. High-resolution remote sensing images (IKONOS in Beijing and QuickBird in the other two regions) were used as the base maps. The boundaries and attributes of each landscape patch were recorded on this map. All the data were digitalized by ArcGIS 9.2 after the field survey [38] (Figure 2). Through local rural landscape surveys, landscapes were classified into three land use types including farmland, semi-natural land and constructions, and further classified into twelve land use subtypes (Table 1). Farmland is cultivated by local farmers for agricultural production. Semi-natural land is a key element between farmland and natural land providing better condition for biodiversity conservation than farm land [39,40]. The local field survey provided exact boundaries between patches and real land use types and produced reliable local landscape data.

2.2.2. Landscape Pattern Analysis

Three landscape metrics widely applied to identify the main change characters of landscape pattern [23,41,42], including Shannon’s Diversity Index (SHDI), Contagion (CONTAG), and Landscape Shape Index (LSI), were used to evaluate pattern change and were calculated by FRAGSTATS [43]. SHDI is a popular index for measuring landscape diversity; it has a minimum value of 0, and its value increases with increasing diversity without limit. CONTAG is an indicator of landscape fragmentation with a range from 0 to 100; a value of 0 represents the maximal fragmentation state; and a value of 100 represents the reverse. LSI is useful for evaluating landscape aggregation and has a minimum value of 1, with increasing values as the landscape becomes more disaggregated.

2.2.3. Landscape Change Analysis

Landscape change is evaluated by two parameters. One is the total change rate (R), assessing land use change degree and is defined as:
R = A 1 A 0 × 100 %
where R is the total land use change rate of the study area. A1 is the area of patches where land use changed, and A0 is the total area of the study area.
The other parameter is the net percentage of land use change (Ri), which is used to evaluate the change tendency of each land use:
R i = A i 1 A i 0 A i 0 × 100 %
where Ri is the net percentage of land use change i, Ai1 is the area of land use type i at present, and Ai0 is the starting area of land use type i.

2.2.4. Land Use Transformation

Land use transformation aims to analyze the area transformation between different land use types. It was evaluated by a parameter of Rij showing transition trend and transitional probability between different land use types.
R i j = A i j A × 100 %
where Rij is the percentage of changed land use from i to j in total change land use. It presents the contribution of transformation from land use i to j in total changed land use. Aij is the area of changed land use from type i to j, and A is the changed land use area.

3. Results

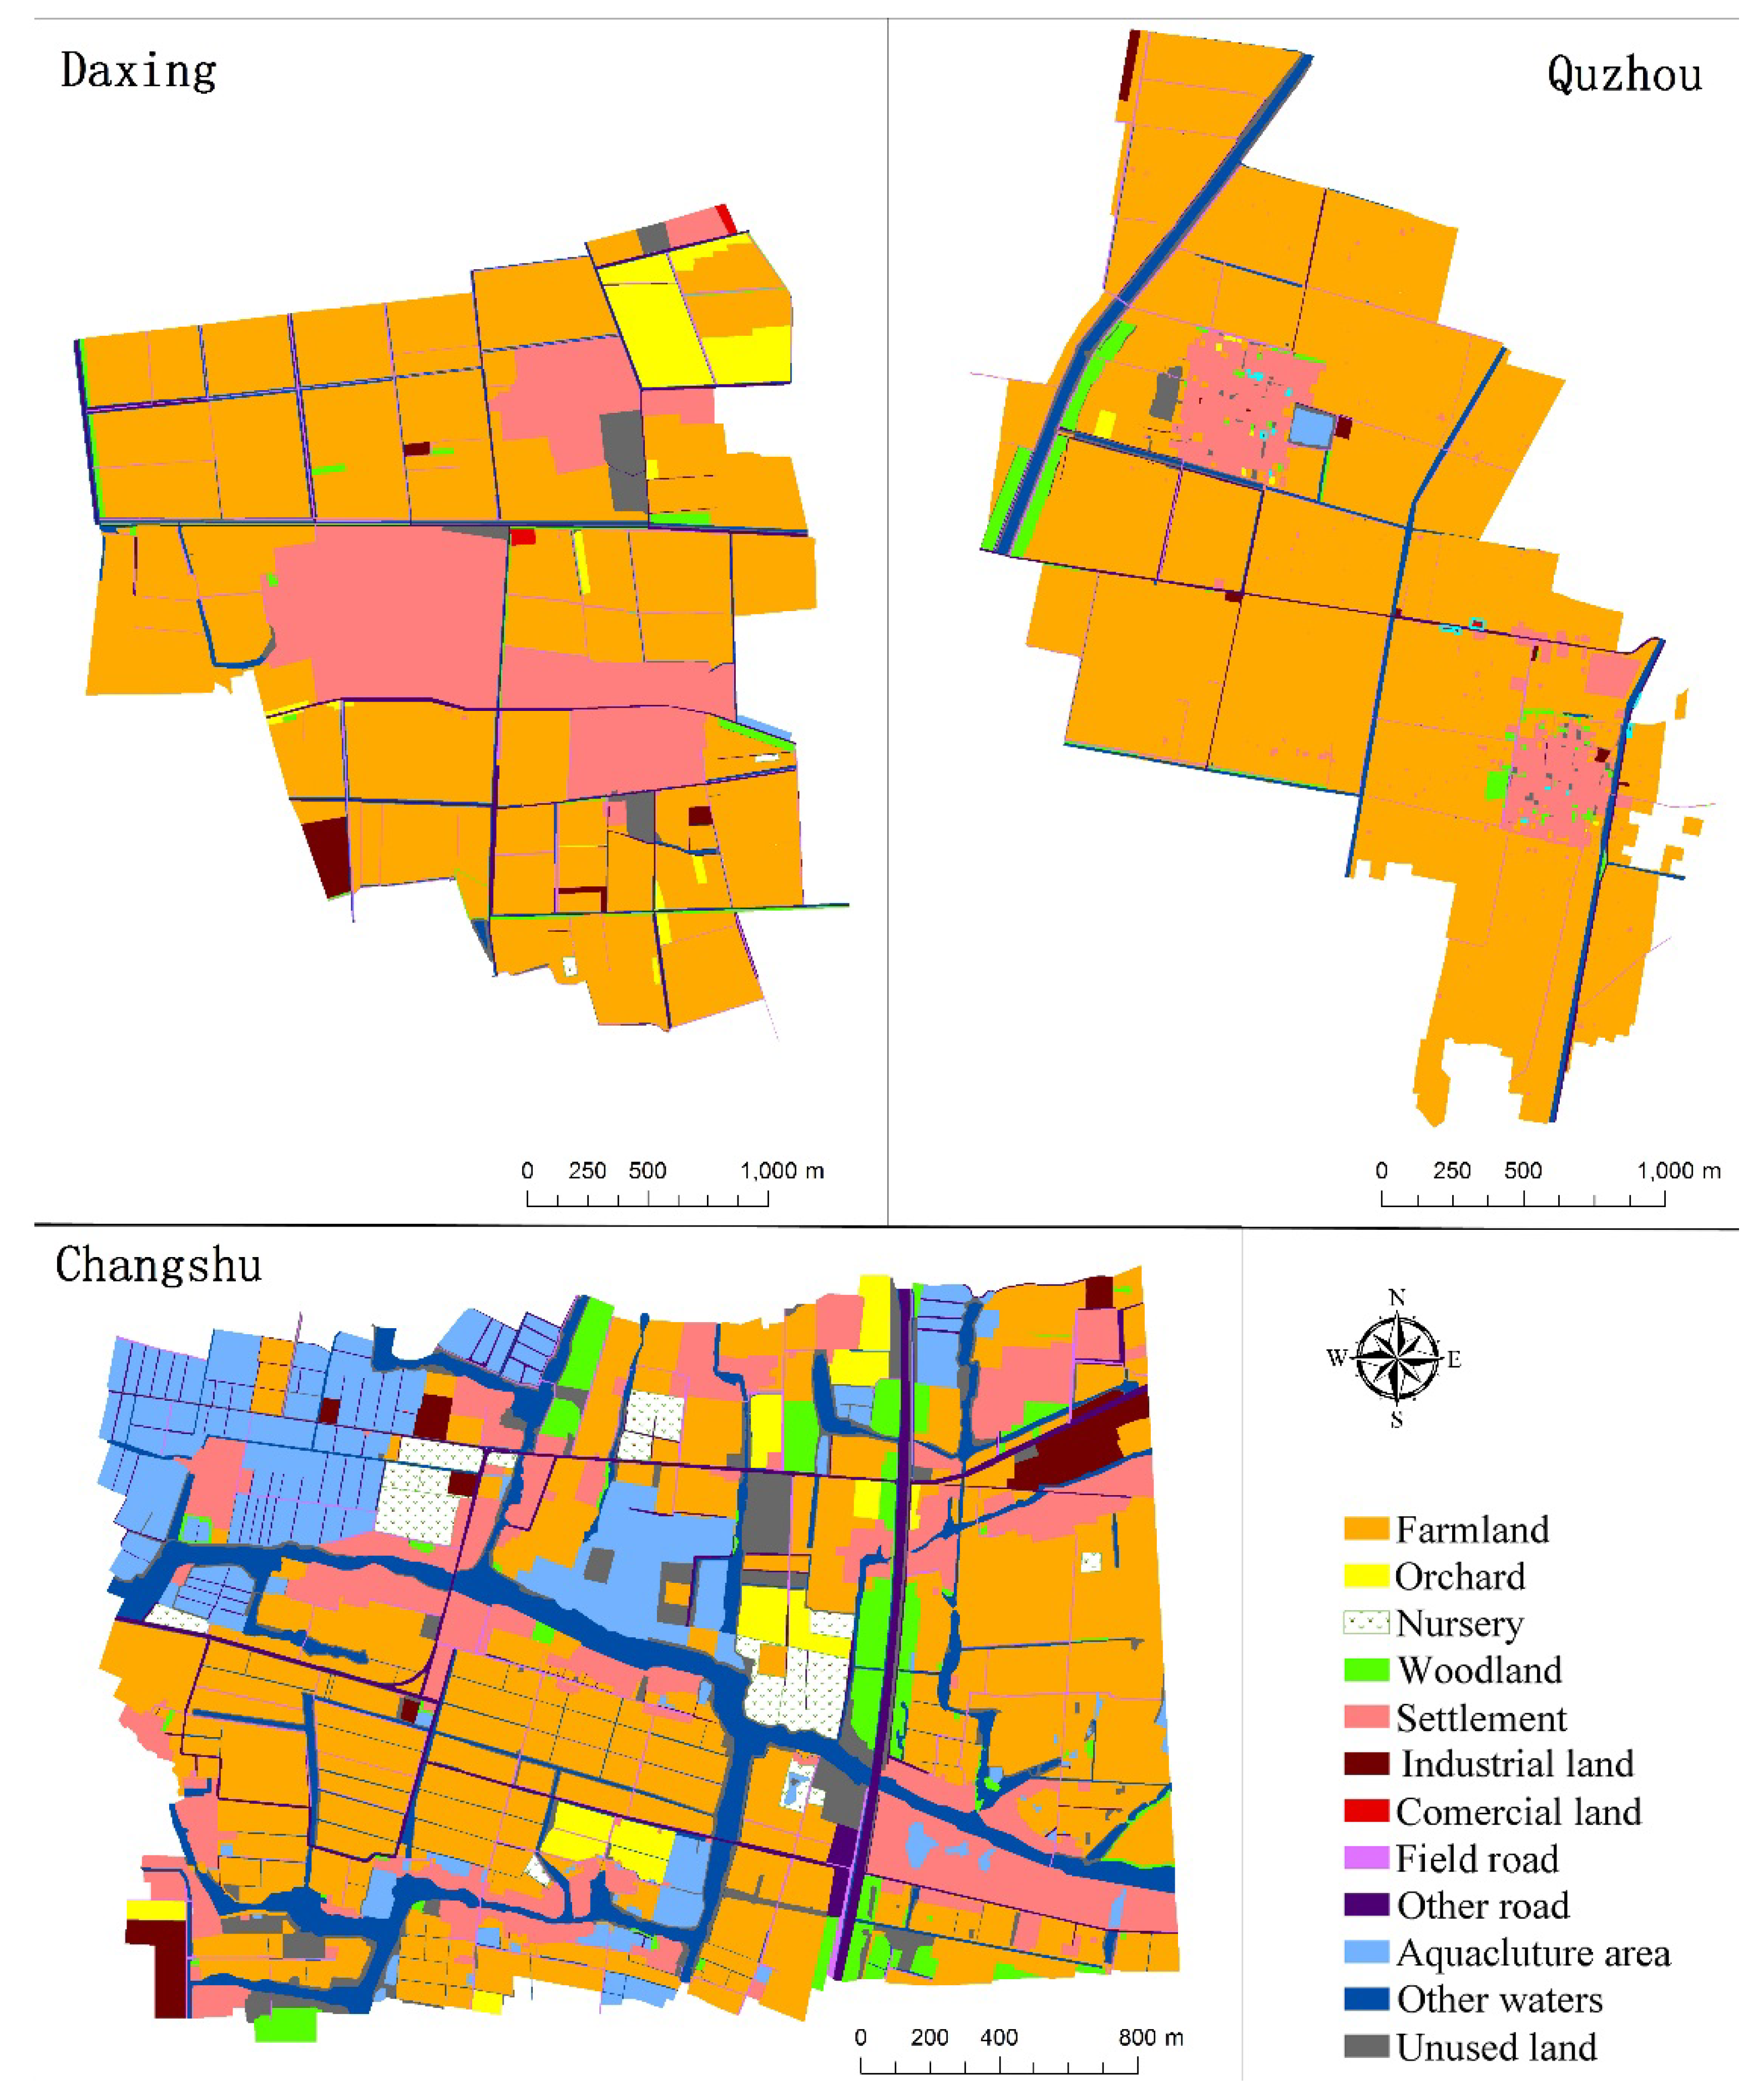
3.1. Different Landscape Compositions and Patterns in Three Rural Areas

Agricultural production is the major function of rural landscapes. However, different areas showed a variety of agricultural production land use compositions (Table 1). Farmland was a major land use component (40.26%) in CS, and aquaculture areas represented an important local production type (13.47%) that could not exist in QZ and was only a small part of DX (0.04%). In addition, nurseries (3.18%) and orchards (2.78%) were also observed in CS, while orchards (4.07%) and small areas of nurseries (0.10%) were observed in DX, and QZ contained no nurseries and only small areas of orchards (0.20%). Compared to the complex agricultural production land use in CS, QZ, and DX seemed quite simple in agricultural land use, with the dominant composition being farmland, especially in QZ.
In the context of farmland and construction land expansion, little natural land existed in rural landscapes, and semi-natural land played a key role in natural conservation [44,45]. Vast differences in semi-natural land implied differing pressures on local natural conservation. CS had a significant amount of natural land, 39.85%, which was the largest proportion among the three areas. Semi-natural land in CS mainly consisted of aquaculture areas and other waters, including rivers, wetlands, and ditches surrounded by vegetation buffers, and four other land use types. The other two study areas showed lower proportions of semi-natural land: DX had 10.04%, and QZ had merely 4.52%. Due to the vast differences in composition, CS had the best conditions for local rural nature conservation, while DX and QZ faced serious problems with small areas supporting conservation, especially in QZ.
Constructions presenting artificial interruption had negative effects on local rural ecology. DX and CS had construction compositions that were obviously different from that in QZ, mainly because of the differences in settlement area. DX and CS had approximately twice as much land in construction and three times as much in settlement compared to QZ.
In addition to the distinctive land use composition, local rural landscape patterns showed different characteristics. Based directly on the land use map in 2012 (Figure 3), CS was much more complex than the other two areas. Different land uses had complicated interactions that were clear in CS (Table 1), leading to nearly 1.7 times the LSI observed in DX and QZ, which illustrated that CS had a more disaggregated local rural landscape. Small patches resulted in the lowest CONTAG value and the most pronounced fragmentation in CS. The highest SHDI value in CS, nearly 1.6 times that of DX and 2.3 times that of QZ, indicates that it has the greatest landscape diversity (Table 2).

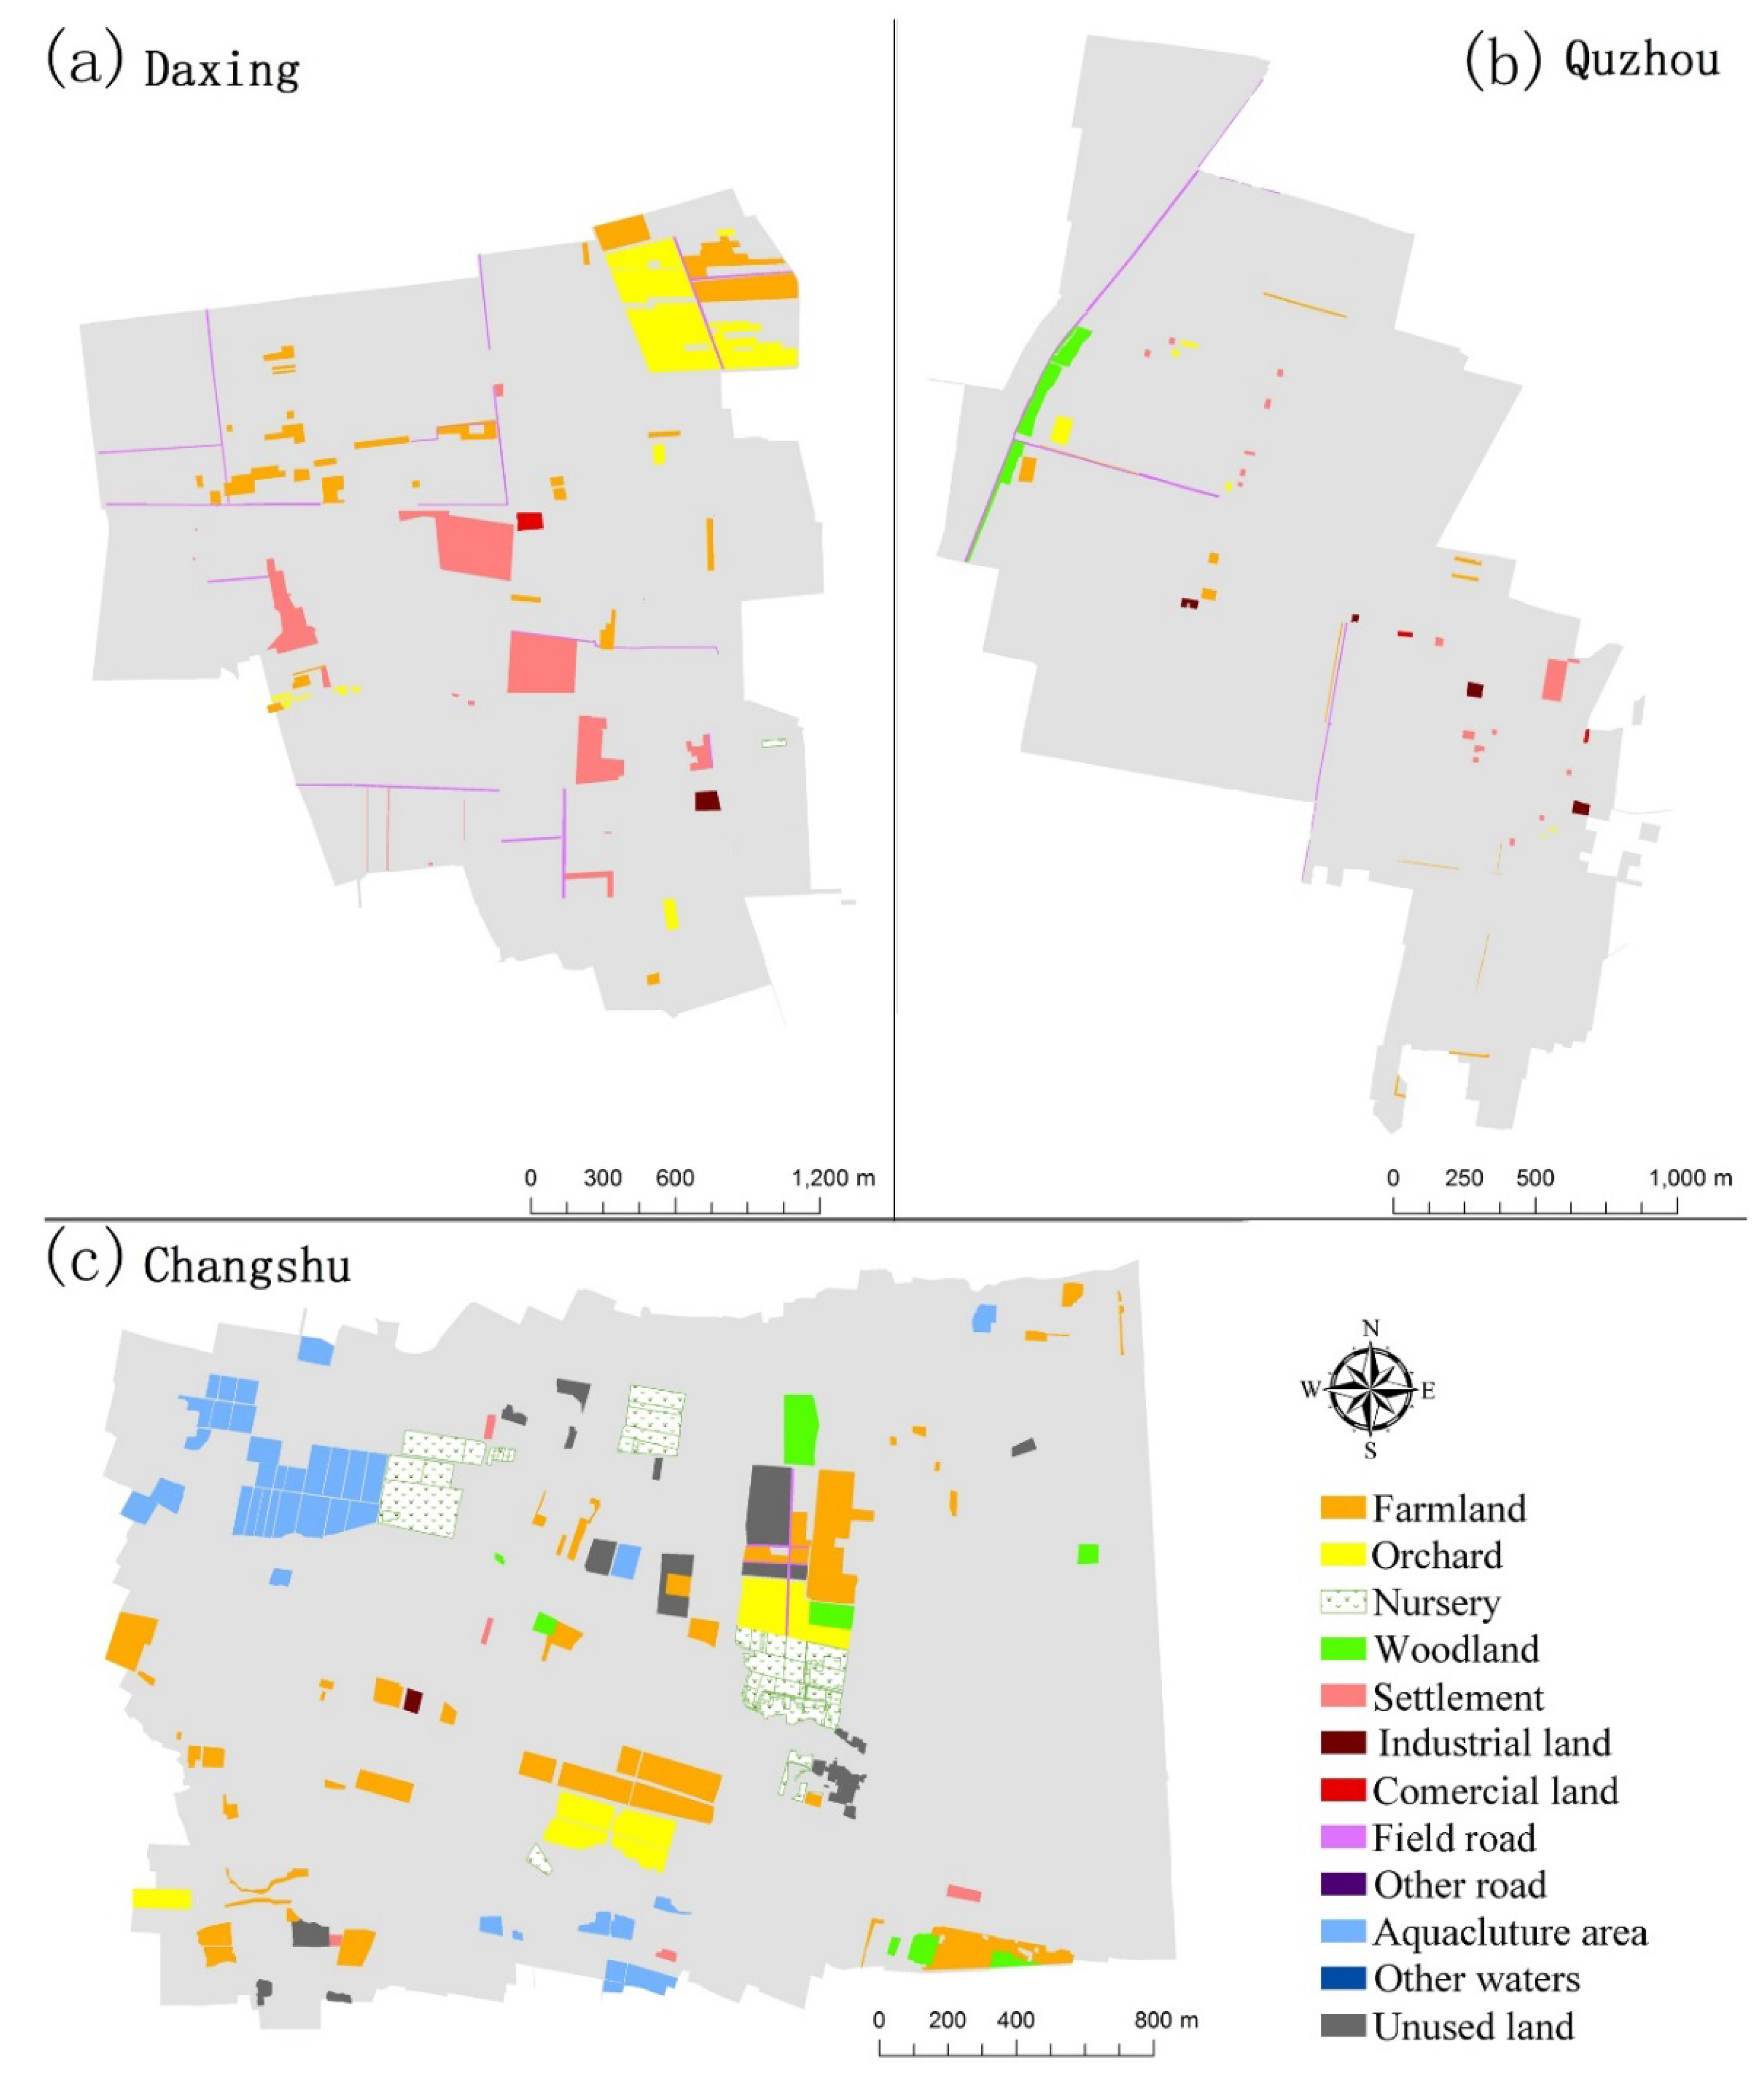
3.2. Landscape Change Characteristics in Different Rural Areas

Different areas faced different change pressures during the urbanization process. Based on direct evidence from the maps of changed land use (Figure 4), CS had the largest number of changed plots and faced the highest pressure, and QZ showed many fewer changes and faced the weakest pressure. Overall, CS had the highest total change rate, at 14.29% (Table 2). These changed plots were separately distributed over the areas and occurred in both farmland and semi-natural land, while constructions showed a weak change, a loss of 0.12%. Changed plots in DX, mainly related to settlements, farmland, and orchard, took 9.32% of the total area. Only 2.11% of the area changed in QZ, mostly in small patches and showing a separated distribution pattern. Basically, this implied that agricultural production change was the main reason for land use change in CS, and construction expansion contributed to the changes in DX, while QZ remained stable.
All three areas showed decreases in farmland. CS had the greatest loss of farmland (7.57%), and farmland in QZ dropped by only 1.29%. In contrast to farmland loss, good news came from a higher rate of increase in semi-natural land in CS and QZ, primarily due to nurseries, orchards, and woodlands. DX was the only area to show decreases in both farmland and semi-natural land, indicating strong pressure on local natural conservation. Orchard growth was the only improvement in semi-natural land in DX, where the other land use subtypes decreased.
At the local scale, construction did not show a general growth in the three areas. DX, near metropolitan Beijing, had a significant increase (15.61%) in construction, with the major source being settlements. Because of the small amounts in 2009, small increases in commercial land and industrial land produced significant growth rates in 2012. Considering the small area in 2009, which caused higher change rates in commercial land and industrial land, settlement and field road growth were the major sources of construction increases in QZ. Because agricultural production plays a major role in QZ, the finding that the fastest increase rate was for field roads was evidence of efforts concentrating on production improvement and the effectiveness of that approach. CS showed an unforeseen decrease in settlement and construction, implying that construction expansion might not be the only trend in local rural areas.
Based on decreases in the LSI, disaggregation became more serious from 2009 to 2012 in DX and CS. Farmland became predominant in local land use, its growth increased LSI value and led to local landscape aggregation in QZ. Decreased fragmentation could be observed in all areas, and DX had the weakest deterioration, with CONTAG slowly declining by 0.8%. Landscape diversity continued to increase in all areas, as shown by the SHDI growth implying a landscape of more mixed land use.

3.3. Most Common Land Use Changes

Although farmland decreased at a low rate, it showed a complicated transformation process with other land use types in all three rural areas. Farmland was a major source for increases in other land use types, while a large amount of land from other land use types also became farmland from 2009 to 2012 (Table 3). Concentrating on the lost farmland, it was more likely to become semi-natural land than construction sites. Changes from farmland into orchards, nurseries, and woodlands were a general trend in all three areas, resulting in a common increase in semi-natural land. Meanwhile, orchards, aquaculture areas, and unused land were the main sources of land that became farmland. The complex transforming interactions among these land use types showed a strong effect of changing agricultural production on the local landscape.
Unused land, the land with the highest natural value at a local scale, was a major land use type for transfer into other types with very little land becoming unused. The decrease in unused land negatively affected local natural conservation, especially when the unused land with high natural value was turned into construction sites. At the same time, the increases in semi-natural land were mainly derived from farmland and unused land, providing good conditions for natural conservation. That could be used as a measure to weaken the effects of the loss of unused land on local conservation.
Construction sites were mainly developed from farmland and unused land and weakly transformed into farmland. Although construction turning into unused land was observed in CS, this happened only in one patch and could be considered a special case. Generally, the relationship between farmland and construction needs to be focused on construction land management.

4. Discussion

4.1. Semi-Natural Land for Local Natural Conservation

Under the urbanization process, very little land with natural value survived in the local rural landscape in our three study areas, which were distributed from north to south in eastern China. The areas of unused land with the greatest natural value were small and discrete, which was ineffective for local natural conservation. As semi-natural land is important for providing multiple ecological services, such as connecting corridors, sustaining biodiversity, biological control, soil conservation, and culture services [46,47,48,49,50], it plays a key role in local natural conservation when little natural land remains. Because the optimal total surface of natural or semi-natural areas to maintain an adequate diversity of species in an agricultural landscape is suggested to be 15% [51], more natural or semi-natural land should be encouraged in DX and QZ in order to improve ecological services in these regions. Local conservation pressure also came from the decrease in semi-natural land, especially the decrease in unused land observed in all three areas and reduction in total semi-natural land in DX. The increases in semi-natural land in QZ and CS were a good sign for ecological restoration, as they provided valuable facilitation for ecological conservation to counteract the dramatic decrease in natural habitat area associated with the urbanization process [52]. Considering the semi-natural land composition and the change trend, CS had the best conditions and the weakest pressure for local conservation, DX had the highest pressure for local conservation, and QZ had the worst conditions for local conservation.

4.2. Rural Landscape Change at a Local Scale

Studies show a general trend of decreases in farmland during urbanization in various regions around the world [9,21,53,54,55,56]. A similar trend of changes in farmland and semi-natural lands was also observed in China at the regional scale [29,57,58,59,60]. At a local scale, our study showed the same trend of decreasing farmland, but at different speeds: CS showed a decline of 7.57% and QZ a decline of 1.29%. Compared to studies of long-term change [37,61,62], our study provides evidence of the effectiveness of national prime land protection policy, which aimed to protect farmland by imposing restrictions on regional total arable land area [63]. Due to this protection policy, the slow decrease in farmland might last in the future.
At a regional scale, semi-natural land shows a decreasing trend, mainly due to agricultural development [64,65,66]. Our study showed gentle growth of semi-natural land in QZ and CS and a weekly decrease in DX at a local scale. These changes mainly occurred between farmland and semi-natural land and faced the major driving force of changing agricultural production. QZ and CS showed changes from farmland to semi-natural land, which was mainly driven by pursuing more economic income from semi-natural orchards or wood plantations. Similarly, economic factors, rather than policy and population, play more important roles in driving local rural landscape change [60,67].
Although construction expansion is a common trend during the urbanization process [8,15,37], it showed various characteristics at a local scale. Construction grew in DX and QZ but decreased very slowly in CS. Although the construction decrease was just one case and could not present a general trend, it still proved that that type of change occurred. Considering that CS is located in a traditional fast urbanization region, the decrease in construction revealed that this type of situation existed in rural landscapes and might develop in other rural areas. In contrast to significant growth trends, which are generally at the county level in previous studies [7,68,69], responding to construction contraction at the local scale requires attention and study as preparation for urbanization effects in rural areas.

4.3. Rural Landscape Management

Considering strong differences in landscape characteristics and landscape changes during the urbanization process among different rural areas, particularly those results differentiated from general results and larger scales, as discussed above, policies for sustainable landscape management in rural landscapes should be reinforced from two perspectives.
Considering the spatial variability of rural landscape characteristics and pattern changes at a local scale, differentiated land use management policies should be developed in addition to a common management policy at the national or regional level. In rural areas around metropolitan areas, such as DX, policy should address restrictions on the extension of construction areas and on the conservation of remaining semi-natural land. In traditional agricultural rural areas, such as QZ, policy should focus on improving agricultural production. Those rural areas around highly urbanized regions, such as CS, need to focus on stimulating eco-services of semi-natural land.
Under conditions in which little natural land remains, attention needs to be paid to improving the natural value of semi-natural land, which efficiently conserves biodiversity [48,49,70]. Special rural landscape management stewardship [50] and subsidy schedules, such as the Common Agricultural Policy of Europe [71], are excellent lessons and experiences for further management of natural value improvement. In particular, developing stewardship for agricultural production, which has strong effects on rural landscape change at a local scale, can meaningfully improve the natural value.

5. Conclusions

The local rural landscape in eastern China has obvious differences both in landscape composition and pattern. Various development backgrounds have led to different landscape change trends at the local scale. Rural areas facing strong urbanization pressure showed fast land use change, and traditional agricultural production areas presented a stable character, especially in weak expansion of construction land. Generally, fragmented and heterogeneous areas existed in eastern China, while disaggregation and diversity increased, leading to mixed land use in local rural areas. Farmland showed a slow decrease, indicating the efficient function of farmland protection policy. Interestingly, semi-natural land increased owing to orchard and nursery extension. As valuable natural land continued to decrease in rural areas, semi-natural land was the key for natural conservation. Changing agricultural production was the major driving force for changes in the local rural landscape, and it promoted semi-natural land growth. Land use composition and landscape patterns had various change characteristics in different rural areas at a local scale. CS, located in an urbanized region, had the fastest rural landscape change and the most semi-natural land for conservation. DX, near a metropolitan area, presented significant construction expansion and strong local conservation pressure due to loss of semi-natural land. QZ, in a traditional agricultural production region, showed weak rural landscape change and remained stable in the urbanization process. Considering landscape change variability, rural landscape management policies need to be developed to respond to local scale characteristics, particularly semi-natural land improvement.

Author Contributions

Conceptualization, H.X. and Z.Y.; Data curation, Y.L. and X.Z.; Formal analysis, H.X.; Funding acquisition, Z.Y.; Investigation, H.X. and L.L.; Writing—original draft, H.X.

Funding

This research was funded by the National Key Technology R&D Program of China grant number 2012BAJ24B05, the Chongqing Postdoctoral Fund grant number Xm2017144 and Rc201515, and Chongqing Technology Innovation and Application Demonstration (Key Research of Social Livelihoods) grant number cstc2018jscx-mszd0442.

Acknowledgments

Thanks the data analyzing support from Chongqing Engineering Laboratory of Spatio-temporal Big Data Technology Research and Application.

Conflicts of Interest

The authors declare no conflicts of interest. The funding sponsors had no role in the design of the study; in the collection, analyses, or interpretation of data; in the writing of the manuscript; or in the decision to publish the results.

References

  1. United Nations. World Urbanization Prospects; The 2011 Revision; Department of Economic and Social Affairs, Population Division: Washington, DC, USA, 2012. [Google Scholar]
  2. Chen, J. Rapid urbanization in China: A real challenge to soil protection and food security. CATENA 2007, 69, 1–15. [Google Scholar] [CrossRef]
  3. Lu, H.F.; Campbell, D.E. Ecological and economic dynamics of the Shunde agricultural system under China’s small city development strategy. J. Environ. Manag. 2009, 90, 2589–2600. [Google Scholar] [CrossRef] [PubMed]
  4. Liu, S.D.; Xia, X.H.; Yang, L.Y.; Shen, M.H.; Liu, R.M. Polycyclic aromatic hydrocarbons in urban soils of different land uses in Beijing, China: Distribution, sources and their correlation with the city’s urbanization history. J. Hazard. Mater. 2010, 177, 1085–1092. [Google Scholar] [CrossRef] [PubMed]
  5. Tu, J. Spatially varying relationships between land use and water quality across an urbanization gradient explored by geographically weighted regression. Appl. Geogr. 2011, 31, 376–392. [Google Scholar] [CrossRef]
  6. Wu, Y.Z.; Zhang, X.L.; Shen, L.Y. The impact of urbanization policy on land use change: A scenario analysis. Cities 2011, 28, 147–159. [Google Scholar] [CrossRef]
  7. Shrestha, M.K.; York, A.M.; Boone, C.G.; Zhang, S.N. Land fragmentation due to rapid urbanization in the Phoenix Metropolitan Area: Analyzing the spatiotemporal patterns and drivers. Appl. Geogr. 2012, 32, 522–531. [Google Scholar] [CrossRef]
  8. Vimal, R.; Geniaux, G.; Pluvinet, P.; Napoleone, C.; Lepart, J. Detecting threatened biodiversity by urbanization at regional and local scales using an urban sprawl simulation approach: Application on the French Mediterranean region. Landsc. Urban Plan. 2012, 104, 343–355. [Google Scholar] [CrossRef]
  9. Alphan, H. Land-use Change and Urbanization of Adana, Turkey. Land Degrad. Dev. 2003, 14, 575–586. [Google Scholar] [CrossRef]
  10. Dewan, A.M.; Yamaguchi, Y. Land use and land cover change in Greater Dhaka, Bangladesh: Using remote sensing to promote sustainable urbanization. Appl. Geogr. 2009, 29, 390–401. [Google Scholar] [CrossRef]
  11. Bakr, N.; Weindorf, D.C.; Bahnassy, M.H.; Marei, S.M.; El-Badawi, M.M. Monitoring land cover changes in a newly reclaimed area of Egypt using multi-temporal Landsat data. Appl. Geogr. 2010, 30, 592–605. [Google Scholar] [CrossRef]
  12. Du, P.J.; LI Xingli Cao, W.; Luo, Y.; Zhang, H.P. Monitoring urban land cover and vegetation change by multi-temporal remote sensing information. Min. Sci. Technol. 2010, 20, 922–932. [Google Scholar] [CrossRef]
  13. Qasim, M.; Hubacek, K.; Termansen, M. Underlying and proximate driving causes of land use change in district Swat, Pakistan. Land Use Policy 2013, 34, 146–157. [Google Scholar] [CrossRef]
  14. Lopez, E.; Bocco, G.; Mendoza, M.; Duhau, E. Predicting land cover and land use change in the urban fringe a case in Morelia City, Mexico. Landsc. Urban Plan. 2001, 55, 271–285. [Google Scholar] [CrossRef]
  15. Deng, J.S.; Wang, K.; Hong, Y.; Qi, J.G. Spatio-temporal dynamics and evolution of land use change and landscape pattern in response to rapid urbanization. Landsc. Urban Plan. 2009, 92, 187–198. [Google Scholar] [CrossRef]
  16. Farley, K.A.; Ojeda-Revah, L.; Atkinson, E.E.; Eaton-González, R.B. Changes in land use, land tenure, and landscape fragmentation in the Tijuana River Watershed following reform of the ejido sector. Land Use Policy 2012, 29, 187–197. [Google Scholar] [CrossRef]
  17. Antrop, M. Landscape change and the urbanization process in Europe. Landsc. Urban Plan. 2004, 67, 9–26. [Google Scholar]
  18. Long, H.L.; Tang, G.P.; Li, X.B.; Heilig, G.K. Socio-economic driving forces of land-use change in Kunshan, the Yangtze River Delta economic area of China. J. Environ. Manag. 2007, 83, 351–364. [Google Scholar] [CrossRef] [PubMed]
  19. Schneeberger, N.; Bürgi, M.; Hersperger, A.M.; Ewald, K.C. Driving forces and rates of landscape change as a promising combination for landscape change research—An application on the northern fringe of the Swiss Alps. Land Use Policy 2007, 24, 349–361. [Google Scholar] [CrossRef]
  20. Lieskovský, J.; Kanka, R.; Bezák, P.; Štefunková, D.; Petrovič, F.; Dobrovodská, M. Driving forces behind vineyard abandonment in Slovakia following the move to a market-oriented economy. Land Use Policy 2013, 32, 356–365. [Google Scholar] [CrossRef]
  21. Wang, X.H.; Zheng, D.; She, Y.C. Land use change and its driving forces on the Tibetan Plateau during 1990–2000. CATENA 2008, 72, 56–66. [Google Scholar] [CrossRef]
  22. Wu, J.G.; Jenerette, G.D.; Buyantuyev, A.; Redman, C.L. Quantifying spatiotemporal patterns of urbanization: The case of the two fastest growing metropolitan regions in the United States. Ecol. Complex. 2011, 8, 1–8. [Google Scholar] [CrossRef]
  23. Parcerisas, L.; Marull, J.; Pino, J.; Tello, E.; Coll, F.; Basnou, C. Land use changes, landscape ecology and their socioeconomic driving forces in the Spanish Mediterranean coast (El Maresme County, 1850–2005). Environ. Sci. Policy 2012, 23, 120–132. [Google Scholar] [CrossRef]
  24. Wu, X.Q.; Cai, Y.L.; Zhou, T. Effects of Land Use/Land Cover Changes on Rocky Desertification-A Case Study of a Small Karst Catchment in Southwestern China. Energy Procedia 2011, 5, 1–5. [Google Scholar]
  25. Forton, O.T.; Manga, V.E.; Tening, A.S.; Asaah, A.V. Land contamination risk management in Cameroon: A critical review of the existing policy framework. Land Use Policy 2012, 29, 750–760. [Google Scholar] [CrossRef]
  26. Fürst, C.; Helming, K.; Lorz, C.; Müller, F.; Verburg, P.H. Integrated land use and regional resource management—A cross-disciplinary dialogue on future perspectives for a sustainable development of regional resources. J. Environ. Manag. 2013, 127, S1–S5. [Google Scholar] [CrossRef] [PubMed]
  27. Lindsay, C.S.; Dougill, A.J. Channelling science into policy: Enabling best practices from research on land degradation and sustainable land management in dryland Africa. J. Environ. Manag. 2013, 114, 328–335. [Google Scholar]
  28. Ellis, E.C.; Neerchal, N.; Peng, K.; Xiao, H.S.; Wang, H.Q.; Zhuang, Y.; Li, S.C.; Wu, J.X.; Jiao, J.G.; Ouyang, H.; et al. Estimating Long-Term Changes in China’s Village Landscapes. Ecosystems 2009, 12, 279–297. [Google Scholar] [CrossRef] [Green Version]
  29. Zhang, K.H.; Song, S.F. Rural–urban migration and urbanization in China: Evidence from time-series and cross-section analyses. China Econ. Rev. 2003, 14, 386–400. [Google Scholar] [CrossRef]
  30. Chang, G.H.; Brada, J.C. The paradox of China’s growing under-urbanization. Econ. Syst. 2006, 30, 24–40. [Google Scholar] [CrossRef]
  31. Gu, C.L.; Wu, L.; Cook, I. Progress in research on Chinese urbanization. Front. Archit. Res. 2012, 1, 101–149. [Google Scholar]
  32. Gao, J.; Liu, Y.S.; Chen, Y.F. Land cover changes during agrarian restructuring in Northeast China. Appl. Geogr. 2006, 26, 312–322. [Google Scholar] [CrossRef]
  33. Long, H.L.; Heilig, G.K.; Li, X.B.; Zhang, M. Socio-economic development and land-use change: Analysis of rural housing land transition in the Transect of the Yangtse River, China. Land Use Policy 2007, 24, 141–153. [Google Scholar] [CrossRef]
  34. Wu, J.X.; Cheng, X.; Xiao, H.S.; Wang, H.Q.; Yang, L.-Z.; Ellis, E.C. Agricultural landscape change in China’s Yangtze Delta, 1942–2002: A case study. Agric. Ecosyst. Environ. 2009, 129, 523–533. [Google Scholar] [CrossRef]
  35. McGarigal, K.; Tagil, S.; Cushman, S.A. Surface metrics: An alternative to patch metrics for the quantification of landscape structure. Landsc. Ecol. 2009, 24, 433–450. [Google Scholar] [CrossRef]
  36. Sojneková, M.; Chytrý, M. From arable land to species-rich semi-natural grasslands: Succession in abandoned fields in a dry region of central Europe. Ecol. Eng. 2015, 77, 373–381. [Google Scholar] [CrossRef]
  37. Wehn, S.; Burton, R.; Riley, M.; Johansen, L.; Hovstad, K.A.; Rønningen, K. Adaptive biodiversity management of semi-natural hay meadows: The case of West-Norway. Land Use Policy 2018, 72, 259–269. [Google Scholar] [CrossRef]
  38. Stein, T.V.; Anderson, D.H.; Kelly, T. Using stakeholders’ values to apply ecosystem management in an upper Midwest landscape. Environ. Manag. 1999, 24, 399–413. [Google Scholar] [CrossRef]
  39. Norderhaug, A.; Ihse, M.; Pedersen, O. Biotope patterns and abundance of meadow plant species in a Norwegian rural landscape. Landsc. Ecol. 2000, 15, 201–218. [Google Scholar] [CrossRef]
  40. Lindborg, R.; Bengtsson, J.; Berg, Å.; Cousins, S.A.O.; Eriksson, O.; Gustafsson, T.; Hasund, K.P.; Lenoir, L.; Pihlgren, A.; Sjödin, E.; et al. A landscape perspective on conservation of semi-natural grasslands. Agric. Ecosyst. Environ. 2008, 125, 213–222. [Google Scholar] [CrossRef]
  41. Janišová, M.; Michalcová, D.; Bacaro, G.; Ghisla, A. Landscape Effects on Diversity of Semi-natural Grasslands. Agric. Ecosyst. Environ. 2014, 182, 47–58. [Google Scholar] [CrossRef]
  42. Liu, Y.H.; Duan, M.C.; Yu, Z.R. Agricultural landscapes and biodiversity in China. Agric. Ecosyst. Environ. 2013, 166, 46–54. [Google Scholar] [CrossRef]
  43. Boller, P.F. Presidential Campaigns: From George Washington to George W. Bush; Oxford University Press: Oxford, UK, 2004. [Google Scholar]
  44. Matsushita, B.; Xu, M.; Fukushima, T. Characterizing the changes in landscape structure in the Lake Kasumigaura Basin, Japan using a high-quality GIS dataset. Landsc. Urban Plan. 2006, 78, 241–250. [Google Scholar] [CrossRef]
  45. Rounsevell, M.D.A.; Reay, D.S. Land use and climate change in the UK. Land Use Policy 2009, 26S, S160–S169. [Google Scholar] [CrossRef]
  46. Alcantara, C.; Kuemmerle, T.; Prishchepov, A.V.; Radeloff, V.C. Mapping abandoned agriculture with multi-temporal MODIS satellite data. Remote Sens. Environ. 2012, 124, 334–347. [Google Scholar] [CrossRef]
  47. Renwick, A.; Jansson, T.; Verburg, P.H.; Revoredo-Giha, C.; Britz, W.; Gocht, A.; McCracken, D. Policy reform and agricultural land abandonment in the EU. Land Use Policy 2013, 30, 446–457. [Google Scholar] [CrossRef]
  48. Johansson, L.J.; Hall, K.; Prentice, H.C.; Ihse Mc Reitalu, T.; Sykes, M.T.; Kindström, M. Semi-natural grassland continuity, long-term land-use change and plant species richness in an agricultural landscape on Öland, Sweden. Landsc. Urban Plan. 2008, 84, 200–211. [Google Scholar] [CrossRef]
  49. Feranec, J.; Jaffrain, G.; Soukup, T.; Hazeu, G. Determining changes and flows in European landscapes 1990–2000 using CORINE land cover data. Appl. Geogr. 2010, 30, 19–35. [Google Scholar] [CrossRef]
  50. Hooftman, D.A.P.; Bullock, J.M. Mapping to Inform Conservation: A Case Study of Changes in Semi-natural Habitats and Their Connectivity Over 70 Years. Biol. Conserv. 2012, 145, 30–38. [Google Scholar] [CrossRef]
  51. Liu, J.Y.; Liu, M.L.; Zhuang, D.F.; Zhang, Z.X.; Deng, X.Z. Spatial Pattern Analysis of Recent Land Use Change in China. Sci. China Ser. D 2002, 32, 1031–1040. (In Chinese) [Google Scholar]
  52. Ren, W.W.; Zhong, Y.; Meligrana, J.; Anderson, B.; Watt, W.E.; Chen, J.K.; Leung, H.L. Urbanization, land use, and water quality in Shanghai 1947–1996. Environ. Int. 2003, 29, 649–659. [Google Scholar] [CrossRef]
  53. Xu, C.; Liu, M.; An, S.; Chen, J.M.; Yan, P. Assessing the impact of urbanization on regional net primary productivity in Jiangyin County, China. J. Environ. Manag. 2007, 85, 597–606. [Google Scholar] [CrossRef] [PubMed]
  54. Lu, Q.S.; Liang, F.Y.; Bi, X.L.; Duffy, R.; Zhao, Z.P. Effects of urbanization and industrialization on agricultural land use in Shandong Peninsula of China. Ecol. Indic. 2011, 11, 1710–1714. [Google Scholar] [CrossRef] [Green Version]
  55. Xu, Y.Q.; Li, X.B. Dynamic Change of Land Use in Hebei Southern Plain Based on GIS. Resour. Sci. 2003, 25, 77–84. (In Chinese) [Google Scholar]
  56. Zhang, Y.P.; Sun, Y.; Wang, X.L.; Cai, Y.P. Study on the Drving Force of Land Use Change at Different Scales-A case Study of the Xinbei District of Changzhou City. Res. Soil Water Conserv. 2012, 19, 111–116. (In Chinese) [Google Scholar]
  57. Ding, C.R. Land policy reform in China: Assessment and prospects. Land Use Policy 2003, 20, 109–120. [Google Scholar] [CrossRef]
  58. Kristensen, S.P. Agricultural land use and landscape changes in Rostrup, Denmark: Processes of intensification and extensification. Landsc. Urban Plan. 1999, 46, 117–123. [Google Scholar] [CrossRef]
  59. Li, M.S.; Huang, C.Q.; Zhu, Z.L.; Shi, H.; Lu, H.; Peng, S.K. Assessing rates of forest change and fragmentation in Alabama, USA, using the vegetation change tracker model. For. Ecol. Manag. 2009, 257, 1480–1488. [Google Scholar] [CrossRef]
  60. Kong, X.B. The Driving Forces, Effects and Sustainable Appraisal of Land Use Change in the High Input Agricultural Region—A Case Study in Quzhou County, the North China Plain. Ph.D. Thesis, China Agricultural University, Beijing, China, 2003. [Google Scholar]
  61. Wu, Z.Z.; Son, G.P.; Wang, X.X.; Cheng, Y.; Zhang, N. On urbanization process and spatial expansion in the urban fringe of Beijing: A case study of Daxing District. Geogr. Res. 2008, 27, 285–294. (In Chinese) [Google Scholar]
  62. Chen, S.; Ju, W.M.; Li, X.F. Effects of Land Use Change on Ecological Service Value in Changshu City. Res. Soil Water Conserv. 2009, 16, 93–97. (In Chinese) [Google Scholar]
  63. Pfiffner, L.; Luka, H. Overwintering of Arthropods in Soils of Arable Fields and Adjacent Semi-natural Habitats. Agric. Ecosyst. Environ. 2000, 78, 215–222. [Google Scholar] [CrossRef]
  64. Reitalu, T.; Sykes, M.T.; Johansson, L.J.; Lönn, M.; Hall, K.; Vandewalle, M.; Prentice, H.C. Small-scale Plant Species Richness and Evenness in Semi-natural Grasslands Respond Differently to Habitat Fragmentation. Biol. Conserv. 2009, 142, 899–908. [Google Scholar] [CrossRef]
  65. Natural England. Entry Level Stewardship: Environmental Stewardship Handbook—Fourth Edition January 2013. Available online: http://publications.naturalengland.org.uk/publication/2798159 (accessed on 20 June 2018).
  66. Sieber, S.; Amjath-Babu, T.S.; Jansson, T.; Müller, K.; Tscherning, K.; Graef, F.; Pohle, D.; Helming, K.; Rudloff, B.; Saravia-Matus, B.S.; et al. Sustainability impact assessment using integrated meta-modelling: Simulating the reduction of direct support under the EU common agricultural policy (CAP). Land Use Policy 2013, 33, 235–245. [Google Scholar] [CrossRef]
  67. Weng, Y. Spatiotemporal changes of landscape pattern in response to urbanization. Landsc. Urban Plan. 2007, 81, 341–353. [Google Scholar] [CrossRef]
  68. Díaz-Palacios-Sisternes, S.; Ayuga, F.; García, A.I. A method for detecting and describing land use transformations: An examination of Madrid’s southern urban–rural gradient between 1990 and 2006. Cities 2014, 40, 99–110. [Google Scholar] [CrossRef]
  69. Mottet, A.; Ladet, S.; Coqué, N.; Gibon, A. Agricultural land-use change and its drivers in mountain landscapes: A case study in the Pyrenees. Agric. Ecosyst. Environ. 2006, 114, 296–310. [Google Scholar] [CrossRef]
  70. Hietala-Koivu, R.; Järvenpää, T.; Helenius, J. Value of semi-natural areas as biodiversity indicators in agricultural landscapes. Agric. Ecosyst. Environ. 2004, 101, 9–19. [Google Scholar] [CrossRef]
  71. Pinto-Correia, T.; Gustavsson, R.; Pirnat, J. Bridging the gap between centrally defined policies and local decisions–Towards more sensitive and creative rural landscape management. Landsc. Ecol. 2006, 21, 333–346. [Google Scholar] [CrossRef]
Figure 1. Map of study areas: (a) Study locations in China; (b) In DX, three villages, Yanggezhuang, Gaozhuang and Shaziying, had a total area of 707.45 ha; (c) The QZ study area comprised the two villages of Wangzhuang and Xingyuan, with a total area of 472.36 ha; (d) CS contained the three villages of Zhujiaqiao, Yangzhong and Donggangjing, with a total area of 588.08 ha.
Ijgi 07 00231 g001
Figure 2. An example of a result from the local field surveys. The left picture is a remote sensing image displaying a base map in a field survey. The right picture is a digitalized map showing local land use. The small woodland patches along the river and around settlements could be accurately identified, and areas of aquaculture could be distinguished from other waters through local field surveys.
Ijgi 07 00231 g002
Figure 3. Land use map of the three study areas in 2012.
Ijgi 07 00231 g003
Figure 4. Maps of plots with changed land use these maps present the shape, distribution, and increased land use of changed patches from 2009 to 2012. Each patch showed land use in 2012. (a) The changed land use patches map of Daxing; (b) the changed land use patches map of Quzhou; (c) the changed land use patches map of Changshu
Ijgi 07 00231 g004
Table 1. Land use composition and landscape metrics in 2012.
Landscape LevelLandscape Metrics in 2012
Landscape metricsDXQZCS
LSI15.7915.5327.13
CONTAG75.1880.6257.9
SHDI1.160.81.86
Land use composition in 2012/%
Land use typeLand use subtype
FarmlandFarmland66.8486.7640.26
Semi-natural land10.044.5239.85
Nursery0.100.003.18
Woodland1.232.063.93
Orchard4.070.202.78
Unused land2.041.925.24
Other water2.570.3411.25
Aquaculture area0.040.0013.47
Constructions23.128.7219.89
Settlement19.025.6914.31
Commercial land0.170.090.00
Industrial land0.930.531.96
Main road1.400.801.93
Field road1.591.611.68
Table 2. Changes in land use and landscape metrics from 2009 to 2012.
Landscape MetricLandscape Metric Change Rate/%
DXQZCS
LSI −5.320.96−4.7
CONTAG −0.8−2.14−3.23
SHDI 3.447.065.97
Land use change rate/%
Total change rate9.322.1114.29
Land use typeLand use subtype
FarmlandFarmland−4.92−1.29−7.57
Semi-natural land−1.487.629.15
Nursery−55.600.001895.07
Woodland−12.3550.0024.81
Orchard29.851131.9344.91
Unused land−26.32−19.31−12.07
Other water0.00−15.86−0.54
Aquaculture area−60.420.00−1.74
Constructions15.619.08−0.12
Settlement20.917.97−1.10
Commercial land129.34−12.120.00
Industrial land12.3729.622.39
Main road0.000.000.00
Field road8.2319.555.62
Table 3. Land use transformation (%).
20092012FarmlandOrchardNurseryWoodlandSettlementCommercial LandIndustrial LandField RoadAquaculture AreaUnused LandTotal Decrease
Farmland%DX-29.900.40-33.06-1.091.28--65.74
QZ-8.07-30.9217.441.275.155.84--68.69
CS-6.0818.232.700.85--0.1020.873.1151.93
Orchard%DX20.03----1.03----21.06
QZ-----------
CS5.20---------5.20
Nursery%DX0.571.10--------1.67
QZ-----------
CS0.56------0.08-1.582.22
Woodland%DX1.84---------1.84
QZ----0.28-----0.28
CS-----------
Settlement%DX1.29---------1.29
QZ-----------
CS0.09-0.14------1.912.14
Commercial land%DX-----------
QZ1.83---------1.83
CS-----------
Industrial land%DX-----------
QZ1.20---------1.20
CS-----------
Field road%DX-----------
QZ4.64---------4.64
CS-----------
Aquaculture area%DX0.68---------0.68
QZ-----------
CS11.973.890.292.20--0.310.43-3.7522.85
Other waters%DX-----------
QZ2.85---------2.85
CS0.19-0.22-------0.41
Unused land%DX4.56---3.17-----7.73
QZ7.50---1.00-1.4510.55--20.51
CS11.471.111.690.420.21---0.35-15.25
Note: This matrix does not include reports for other waters and other roads because they showed no land changes. Total decrease indicates the percentage of land use decrease in the total changed area.

