Article

Design and Implementation of a 4D Web Application for Analytical Visualization of Smart City Applications

by
Syed Monjur Murshed
1,*,
Ayah Mohammad Al-Hyari
2,
Jochen Wendel
1 and
Louise Ansart
3
1
Group of Smart & Sustainable Cities, European Institute for Energy Research, 76131 Karlsruhe, Germany
2
Faculty of Information Management and Media, Karlsruhe University of Applied Sciences, 76133 Karlsruhe, Germany
3
School of Computer Science and Electrical Engineering, CentraleSupélec, 91190 Gif-sur-Yvette, France
*
Author to whom correspondence should be addressed.
ISPRS Int. J. Geo-Inf. 2018, 7(7), 276; https://doi.org/10.3390/ijgi7070276
Submission received: 8 June 2018 / Revised: 28 June 2018 / Accepted: 6 July 2018 / Published: 12 July 2018
(This article belongs to the Special Issue Web and Mobile GIS)

Abstract

:
Contemporary development of computer hardware and software, WebGIS and geo-web services as well as the availability of semantic 3D city models, facilitate flexible and dynamic implementation of web applications. The aim of this paper is to introduce 4D CANVAS, a web-based application for dynamic visualization of 3D geospatial data for improved decision making in smart city applications. It is based on the Cesium Virtual Globe, an open-source JavaScript library developed with HTML5 and WebGL. At first, different data formats such as JSON, GeoJSON, Cesium Markup Language (CZML) and 3D Tiles are evaluated for their suitability in 4D visualization applications. Then, an interactive Graphical User Interface (GUI) is built observing the principle of cartographic standards to view, manage, understand and explore different simulation outputs at multiple spatial (3D surface of buildings) and temporal (hourly, daily, monthly) resolutions. In this regard, multiple tools such as aggregation, data classification, etc. are developed utilizing JavaScript libraries. As a proof of concept, two energy simulations and their outputs of different spatial and temporal resolutions are demonstrated in five Asian and European cities. Finally, the 4D CANVAS is deployed both in desktop and multi-touch screens. The proposed application allows easy integration of any other geospatial simulation results, thereby helps the users from different sectors to explore them interactively in 4D.

1. Introduction

Recent years have seen an immense increase in the appearance of smart city information and communication technologies (ICT) that include the development of software services, sensor systems and data standards. A large topic in smart city related research lies in the field of energy, environment and sustainability that requires explorative analysis and visualization of multidimensional (2D, 2.5D, 3D and 4D) data. Such applications require granular visualization resolutions and are usually aggregated and illustrated at the building, building surface or building object levels (e.g., points or raster grids). The most common topics in urban energy research include for example the assessment of solar irradiance, the modelling of photovoltaic (PV) potential, or the simulation of energy demand at the building scale as well as research on the assessment of Urban Heat Islands (UHI) and air quality monitoring at a coarser scale that encompasses whole neighborhoods or cities. Besides spatial resolutions, varying temporal resolutions also play an important role in urban energy analysis. For example, in the case of the modelling of solar energy or PV potential, results could be aggregated at different temporal (hourly, daily, monthly, annual) resolutions. This requires a higher granularity of visualization and therefore 4D becomes a necessity [1,2]. Unfortunately, such ready-to-use applications are not available for explorative visualization and analyses.
3D visualization has been of an increasing interest in many different domains, due to its ample advantages over 2D approaches [3]. In particular, for urban modelling applications 3D becomes a necessity, as the results need to be analyzed and visualized directly at the building object. The inclusion of the temporal scale (4D) is still a very demanding task in terms of providing an interesting and interactive environment. Such spatiotemporal visualizations play an important role in understanding and discovering some predictive patterns from both the space and time dimensions of data, supporting decision-making and better representing the real world. Lately, static visualizations have been deemed tedious against the new technologies that support dynamic and interactive platforms, allowing users to navigate, zoom and even query data in real-time on a web-based application. The advancement of newer technologies such as WebGL [4] different proprietary and open-source software, tools and libraries enable the design and development of such interactive interfaces (Cesium.js [5], Glob3m [6]). On the other hand, although 3D web-based visualization has been a topic of increasing popularity in recent years, the cartographic principles that can be applied to such representations has not been fully investigated and standards have not been established [3,7].
One commonly used data model to store and model building and other relevant objects (terrain surfaces, infrastructure, etc.) in the context of Smart Cities applications is the 3D city model. An explicit XML-based exchange format for 3D city models is CityGML. It supports geometric description of 3D city model components, specifies semantics and topology information as well as stores multi-level of detail (LOD) information at different spatial and temporal scales [8]. Furthermore, object modelling specifications can be shown at different LODs—ranging from simple building block models with flat roofs (LOD1) to detailed building models that include building interiors (LOD4) (Figure 1).
Multiple application domain extensions (ADE) covering various smart city research applications (energy, utility networks, sensor data) have been developed or are currently under development [10,11]. Thereby, the 3D city models act as a container for storing ICT relevant smart city data and multiple software architectures (both open-source and proprietary) have been developed to store and access all this relevant information.
This research describes the design and development of 4D CANVAS, a web-based application for dynamic visualization of 3D geospatial data for improved decision making in smart city applications. In this regard, a detailed literature review and current trends on recent 3D and 4D applications, web services, technologies and standards are performed. A Graphical User Interface (GUI) is developed to allow interaction with 3D spatial and temporal data sets representing multiple energy model outputs. 3D Buildings and their surfaces are introduced as interactive objects and different visual, structural and behavioral primitives are incorporated [12]. This research also investigates cartographic aspects of a 3D web-based interface, and tries to determine what rules and regulations should be followed and applied to such interfaces. In this regard, the cartographic best practices and ISO standards for usability, efficiency and design are respected [13]. In addition to what current interfaces offer in this field, 4D CANVAS permits different analytical functionalities such as aggregation and disaggregation of results, on-the-fly statistical analyses for exploration of the energy model outputs. Furthermore, the capabilities and limitations of using different data formats such as JSON, GeoJSON, Cesium Markup Language (CZML) and 3D Tiles in 4D web applications are evaluated.
In the following section, an overview of the current trend of 3D and 4D web services, their implementation and applications are explained. Section 3 describes the system architecture of the proposed 4D application as well as the required data formats, software and technologies. Section 4 demonstrates the visualization and functional capabilities of the web interface with some energy simulation related case studies. The discussion of results and testing of performance of the application are summarized in Section 5. Finally, a conclusion is drawn by highlighting the limitation and future research issues in Section 6.

2. Related Research and Current Trends

Many 3D interfaces have been developed in the past. However, the development and success of such interfaces is tightly coupled with major breakthroughs in technological advances in hardware and software [14]. During the last two decades, several peaks in the development of such interfaces could be observed. For example, VRML-based [15] applications experienced a short-lived hype but disappeared again over time, as they were not fully accepted by the users. However, the current trend towards native browser-based 3D visualizations that can be used on multiple platforms appears a real breakthrough. For example, the development of WebGL and HTLM5 sparked many developments such as Cesium.js [5], three.js [16], Unity3D [17], Unreal Engine [18]. X3DOM [19], OSG.js [20], O3D [21], WebGL Earth [22], WebGL Globe [23], etc. to visualize 2D/3D features and different geospatial capabilities [24,25]. They gained interest by a wider audience of both the consumer and the scientific community. As a result, several commercial applications and scientific publications on 3D visualization have appeared. In general, these publications can be grouped into several categories ranging from pure visualization based on open-source and proprietary software libraries to semantic 3D and spatiotemporal 4D visualization interfaces. Julin et al. [26] provide a detailed characterization schema of 3D city modelling and visualization projects. They also provided concepts for harmonization and visualization of such models in different use cases in Finland.
3D city models (e.g., CityGML format) are a key in urban energy modelling and several interfaces have been developed. For example, the Energy Atlas Berlin [27], discussed by Kaden et al. ([28,29]), aims to visualize information such as heating energy needs, energy rehabilitation and geothermal energy in the city of Berlin in Germany. Their interface enables the visualization of LOD2 CityGML building data at multiple aggregation scales. Wendel et al. [7] developed an interactive, plug-in free, web-based application that allows the visualization and interaction with semantical 3D geospatial data in the city of Karlsruhe in Germany with no dependencies on proprietary software or tools. It was based on a custom-made three.js JavaScript but was not capable of visualizing spatiotemporal data. The Sunshine project, an early adopter of Cesium implemented a cartographic display for urban services and energy consumption at the urban scale [30]. For the purpose of direct visualization capabilities for semantic 3D city models, Chatuverdi et al. [31] developed a web client based on KML/COLLADA exports from CityGML in an interactive interface for the 3DCityDB [32], a simplified database schema for CityGML in PostgreSQL [33]. Based on that methodology, Kolbe et al. [34] published the whole city model of New York (over 1 million buildings) in CityGML on a Cesium web-based interface that was further enriched by additional 3D city objects.
On the topic of 4D web visualization, Resch et al. [3] implemented a WebGL-based prototype to incorporate marine spatiotemporal data in a native 3D web-based interface. They also discussed the challenges in 4D visualization concept and discussed the lack of standards with temporal geo-data. Evangelidis et al. [24] implemented motion effects for temporal and non-temporal animations on an open geospatial software application prototype. It provides high-level capabilities for dynamically creating user defined virtual geospatial worlds, populated by selected animated and moving 3D models on user specified locations, paths and areas. Zhu et al. [35], developed an interface where spatiotemporal data obtained by sensors was visualized in Cesium by means of OGC SOS services. In the context of big data, Lin et al. [36] implemented a Cesium-based interface for costal environmental monitoring using real-time data. They further described and discussed the handling and storage of data in 3D/4D web-based interfaces. A multimodal interface based on Glob3m, an open-source web globe based on OpenGL and WebGL that can be viewed in multiple visualization modes on mobile devices was presented in Santana et al. [37], where the user could interact with energy model outputs in an immersive manner [38].
In contrast to the research-oriented developments presented in the sections above, there are also several propriety and commercial 3D interfaces that were developed in recent years. Most of these interfaces deal with the topic of smart cities, architectures, urban design, and urban planning. Three main WebGL-based commercial software frameworks are ESRI City Engine web viewer, Unity 3D [17], and Google Earth/Maps 3D [39]. They provide comprehensive Application Programming Interfaces (API) for customized project development. For example, the Smart Dubai project [40] was develop on an ESRI platform that streams real-time 3D data to the public to help them understand places, projects and events around the city. The city of Istanbul deployed Unity 3D to visualize solar potential and energy needs [41].
There are several other projects in the field of native 3D visualization, each implementing a different type of data and representing various information, such as NASA WebWorldWind [42]. In addition to true 3D and 4D interfaces, a recent trend could be observed in the extension of traditional 2D web mapping platforms such as leaflet.js [43] or Mapbox [44] being customized for 2.5D and 3.5D applications, where only 3D perspective views are being provided in applications such as WRLD3D [45] that is based on eego.js [46] and leaflet.js [43].
Many of these early implementations did not focus on the visual appearances and temporal aspects (4D). There is a lack of open-source 4D web applications for smart city related simulation results. Moreover, most of the applications focus on basic functionalities and do not provide customized analytical functionalities for explorative analyses of simulation results. They were implemented in single platform e.g., on desktops and not on multi-touch tablets, which provides easy navigation. Proposed 4D CANVAS overcomes the limitations and demonstrates its applicability in several use cases.

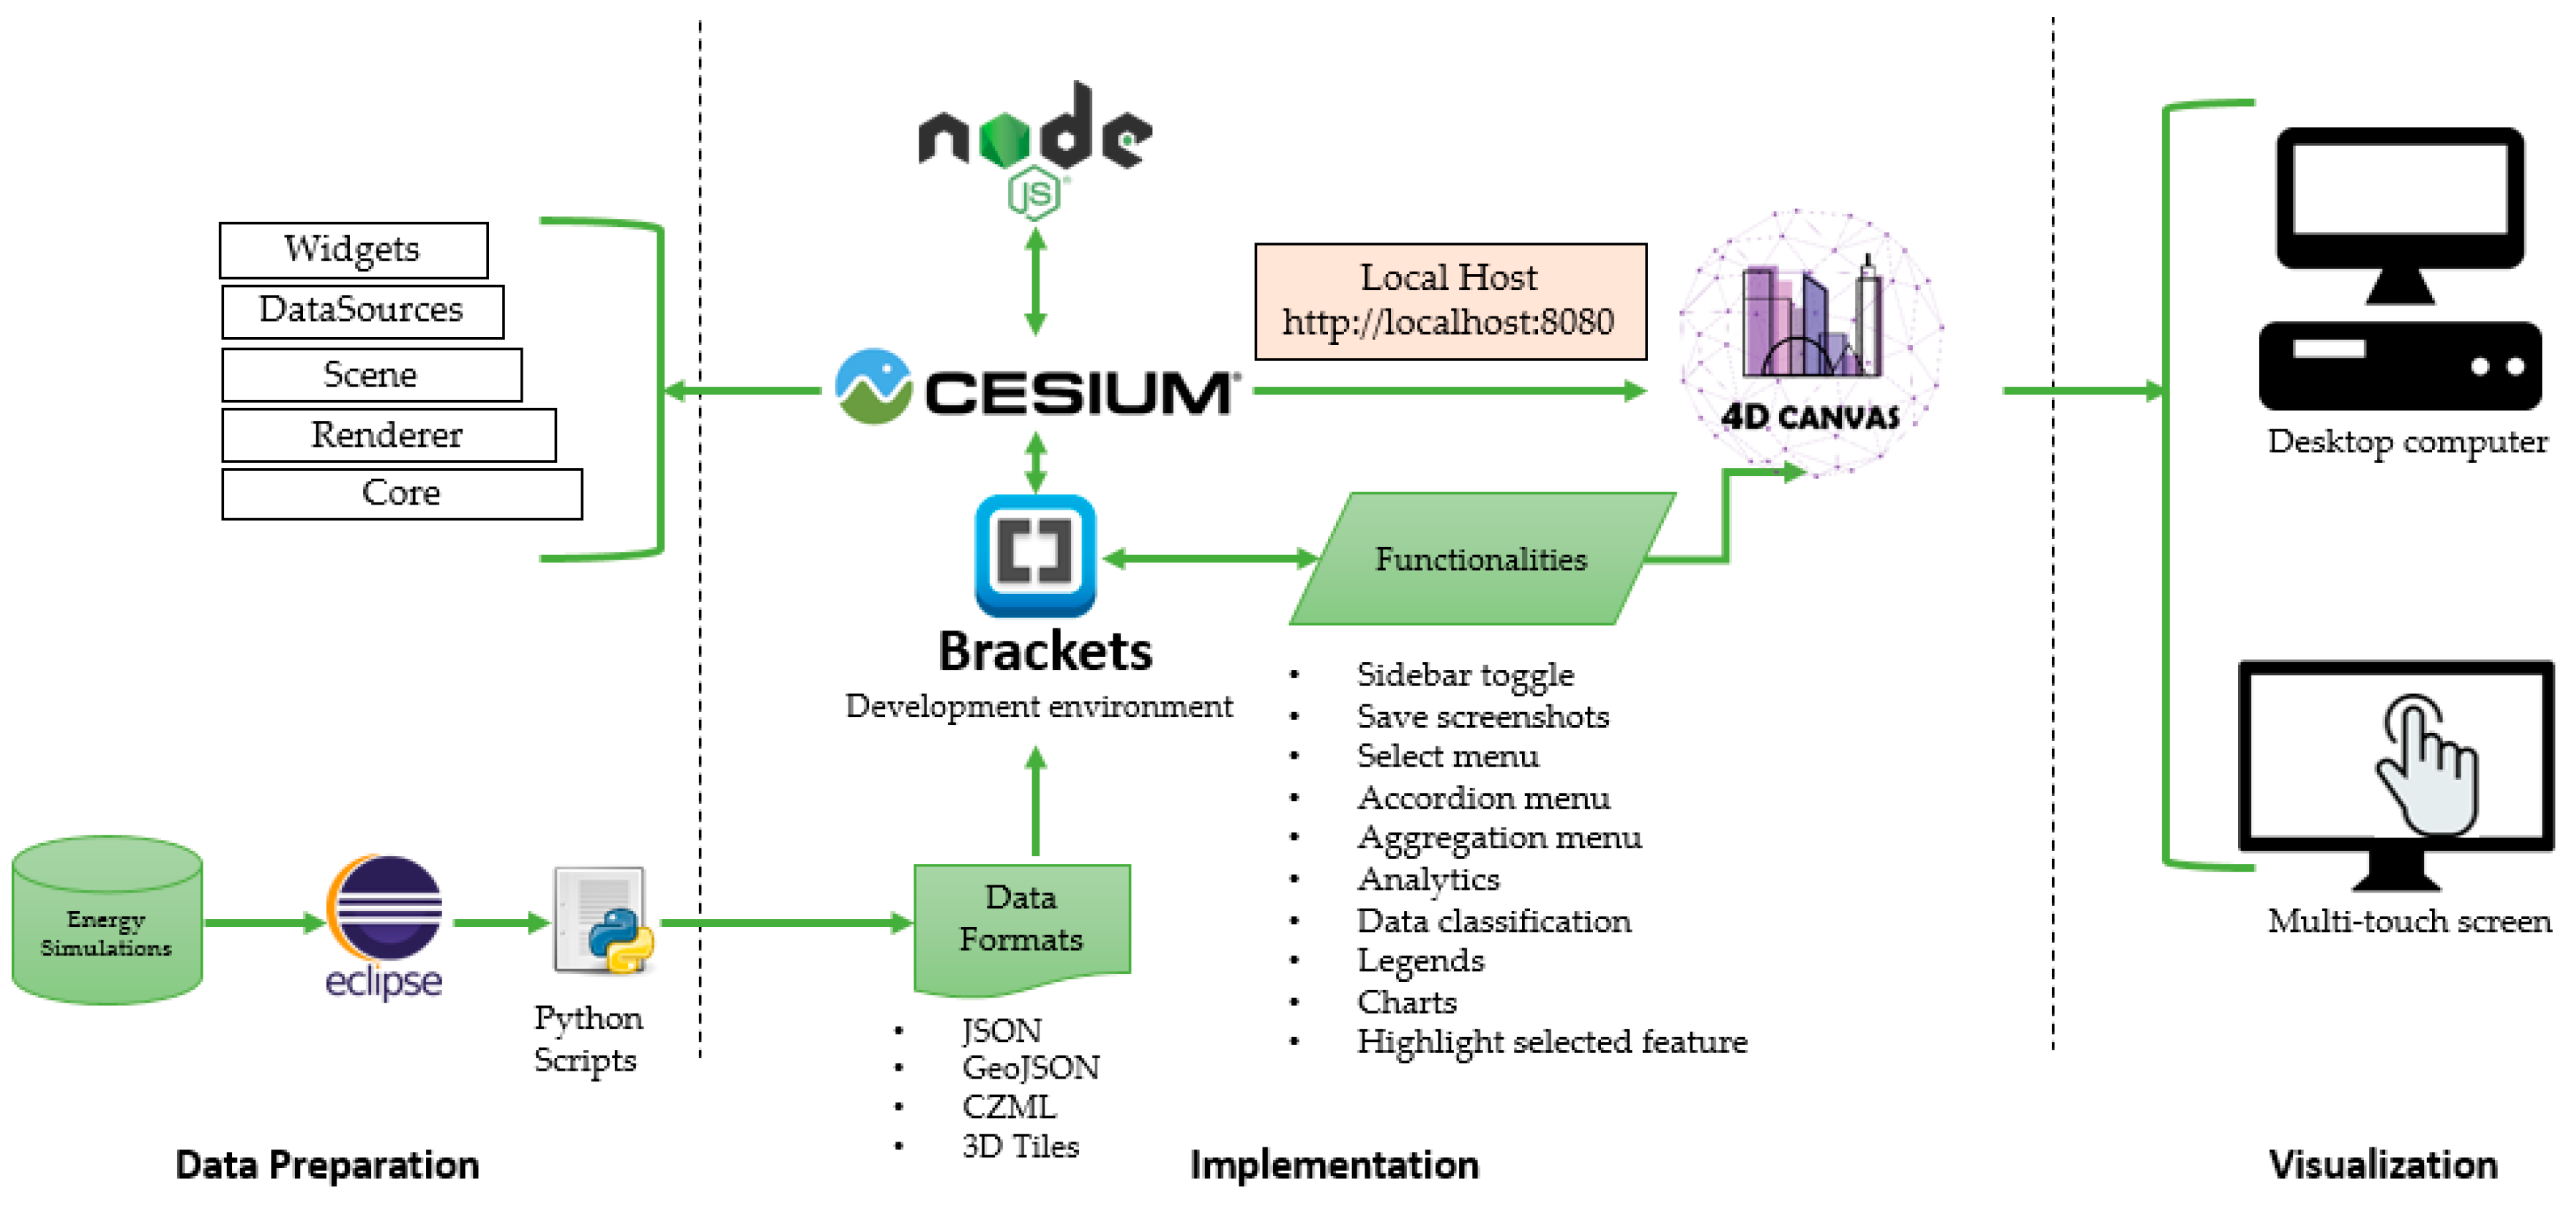
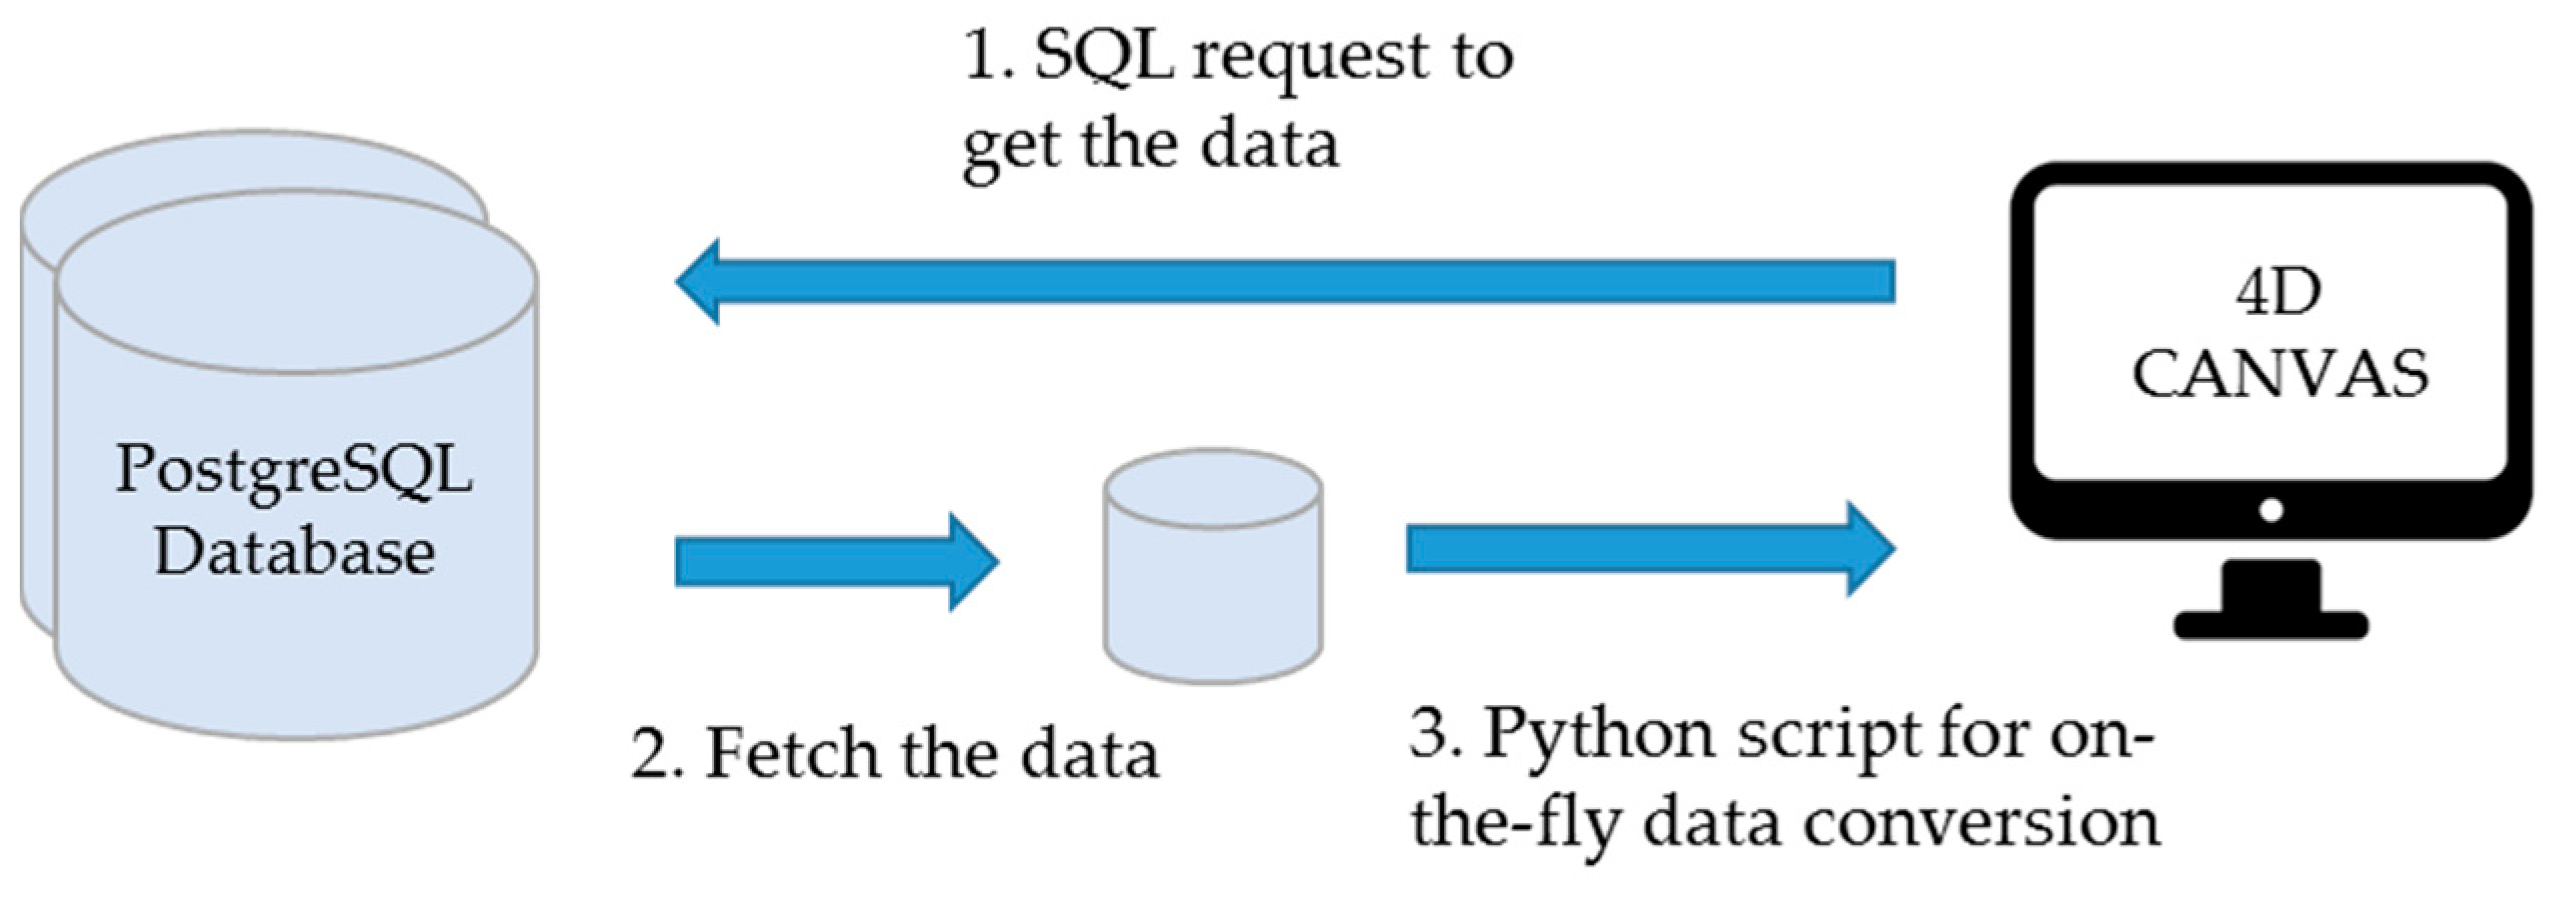
3. Proposed Architecture

Among the available WebGL-based visualization frameworks and libraries, Cesium is most suitable to create virtual globes with time dynamic 3D visualization of geospatial data as it allows native discrete temporal data support. In addition, it includes various geospatial functionalities such as terrain visualization and imagery layers by using geospatial web services and standards. Cesium is an open-source JavaScript package supporting the presentation of 3D contents within the web browser where users can dynamically switch between 3D globe visualization and 2D map projection. It utilizes WebGL to provide hardware acceleration and plugin independence and provides cross-platform and cross-browser functionalities [31].
The architecture of the proposed 4D visualization interface is designed on Cesium’s existing layers [47] (widgets, DataSources, Scene, Renderer and Core) and features (Figure 2). It consists of three main parts: data preparation, implementation and visualization.
Data preparation: The proposed dynamic visualization interface supports different data formats such as CityGML, JSON, GeoJSON, Cesium Markup Language (CZML) and Cesium 3D Tiles. Each of these formats have specific capabilities and therefore the choice of the data format depends on the functionalities/use and the level of details of the original CityGML data. CityGML data (LOD1 and LOD2) is imported into the PostgreSQL databases as tables via 3DCityDatabase Import/Exporter to run energy simulations on them. The energy simulation results are saved in the same database as separate tables [2,48]. To visualize the results in the proposed interface, several Python scripts are written in Eclipse environment in order to convert the database tables into the desired format.
Implementation: Cesium.js (version 1.45) is deployed on a local server to customize and visualize the energy simulation results. Cesium depends on a web server to host maps and files. It does not have any server requirements but Node.js is used for this interface. After setting up the local host connection, a programming development environment is created using Brackets, where the Cesium Viewer is initially added to the JavaScript code to initiate the development of 4D CANVAS. Afterwards, further analytical functionalities and time-dependent visualization are implemented using scripting languages (see Section 3).
Visualization: The proposed interface is then deployed in both personal computers (desktops, laptops) and in multi-touch tablets.
A summary of the functionalities of the different scripting languages (e.g., python, HTML5 [49], CSS, JavaScript), libraries/API (AMCharts, JQuery UI, Geostats), software (3D City Database, pgAdmin, Eclipse, FME), and data formats (CZML, JSON, etc.) are explained in Table 1.

4. Deployment of 4D CANVAS
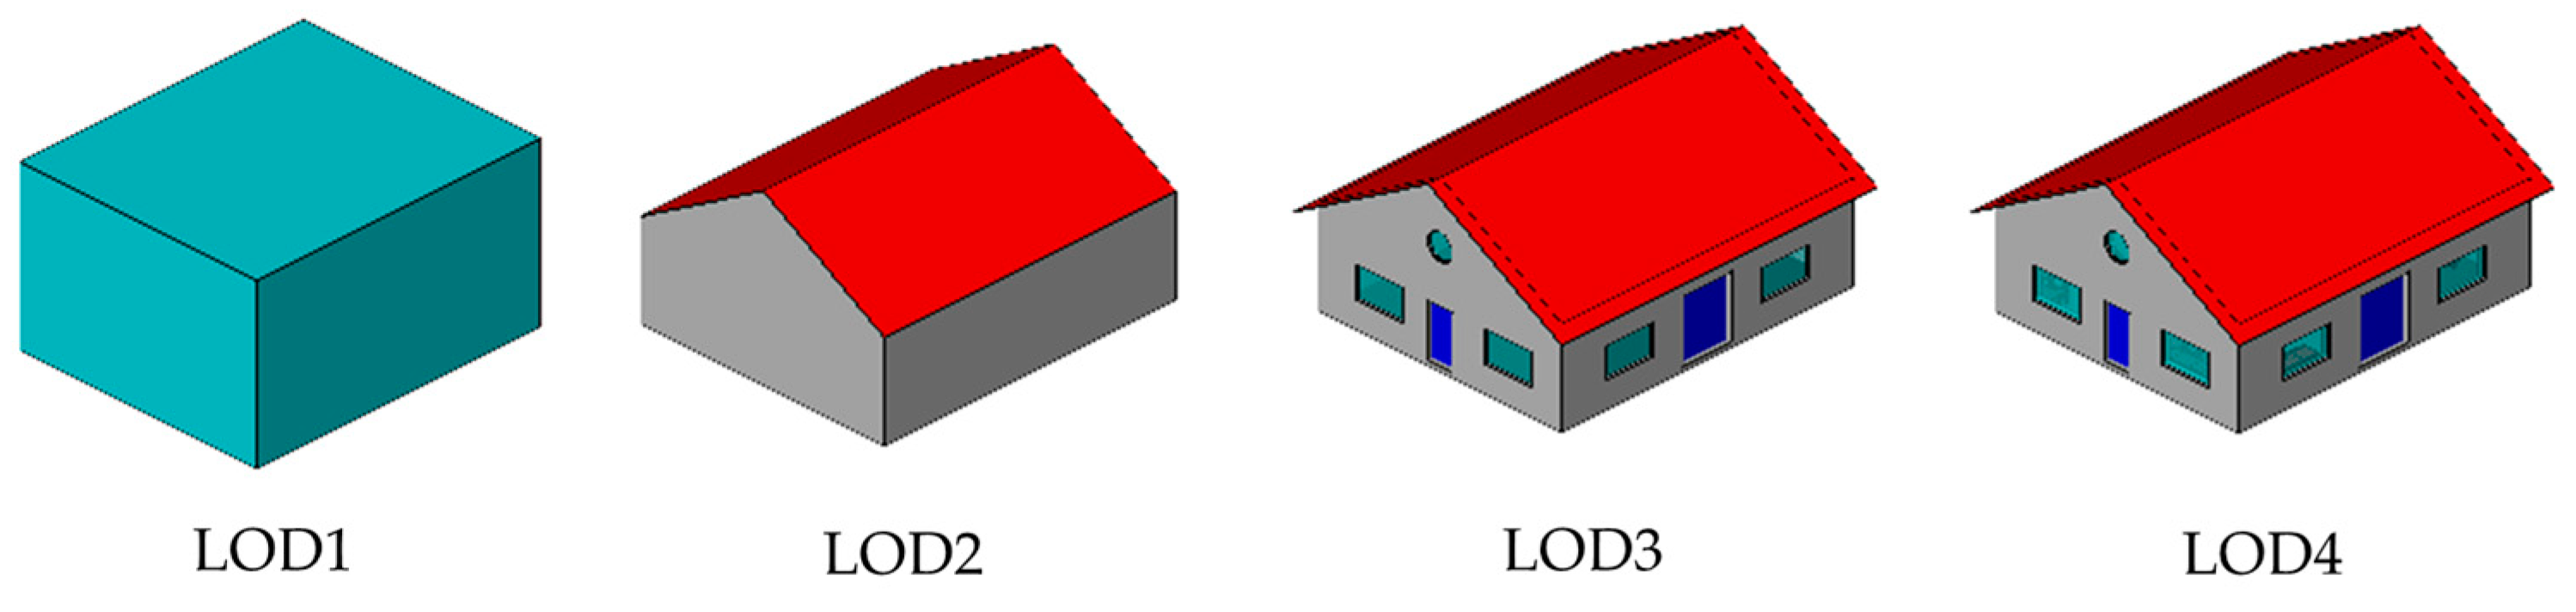
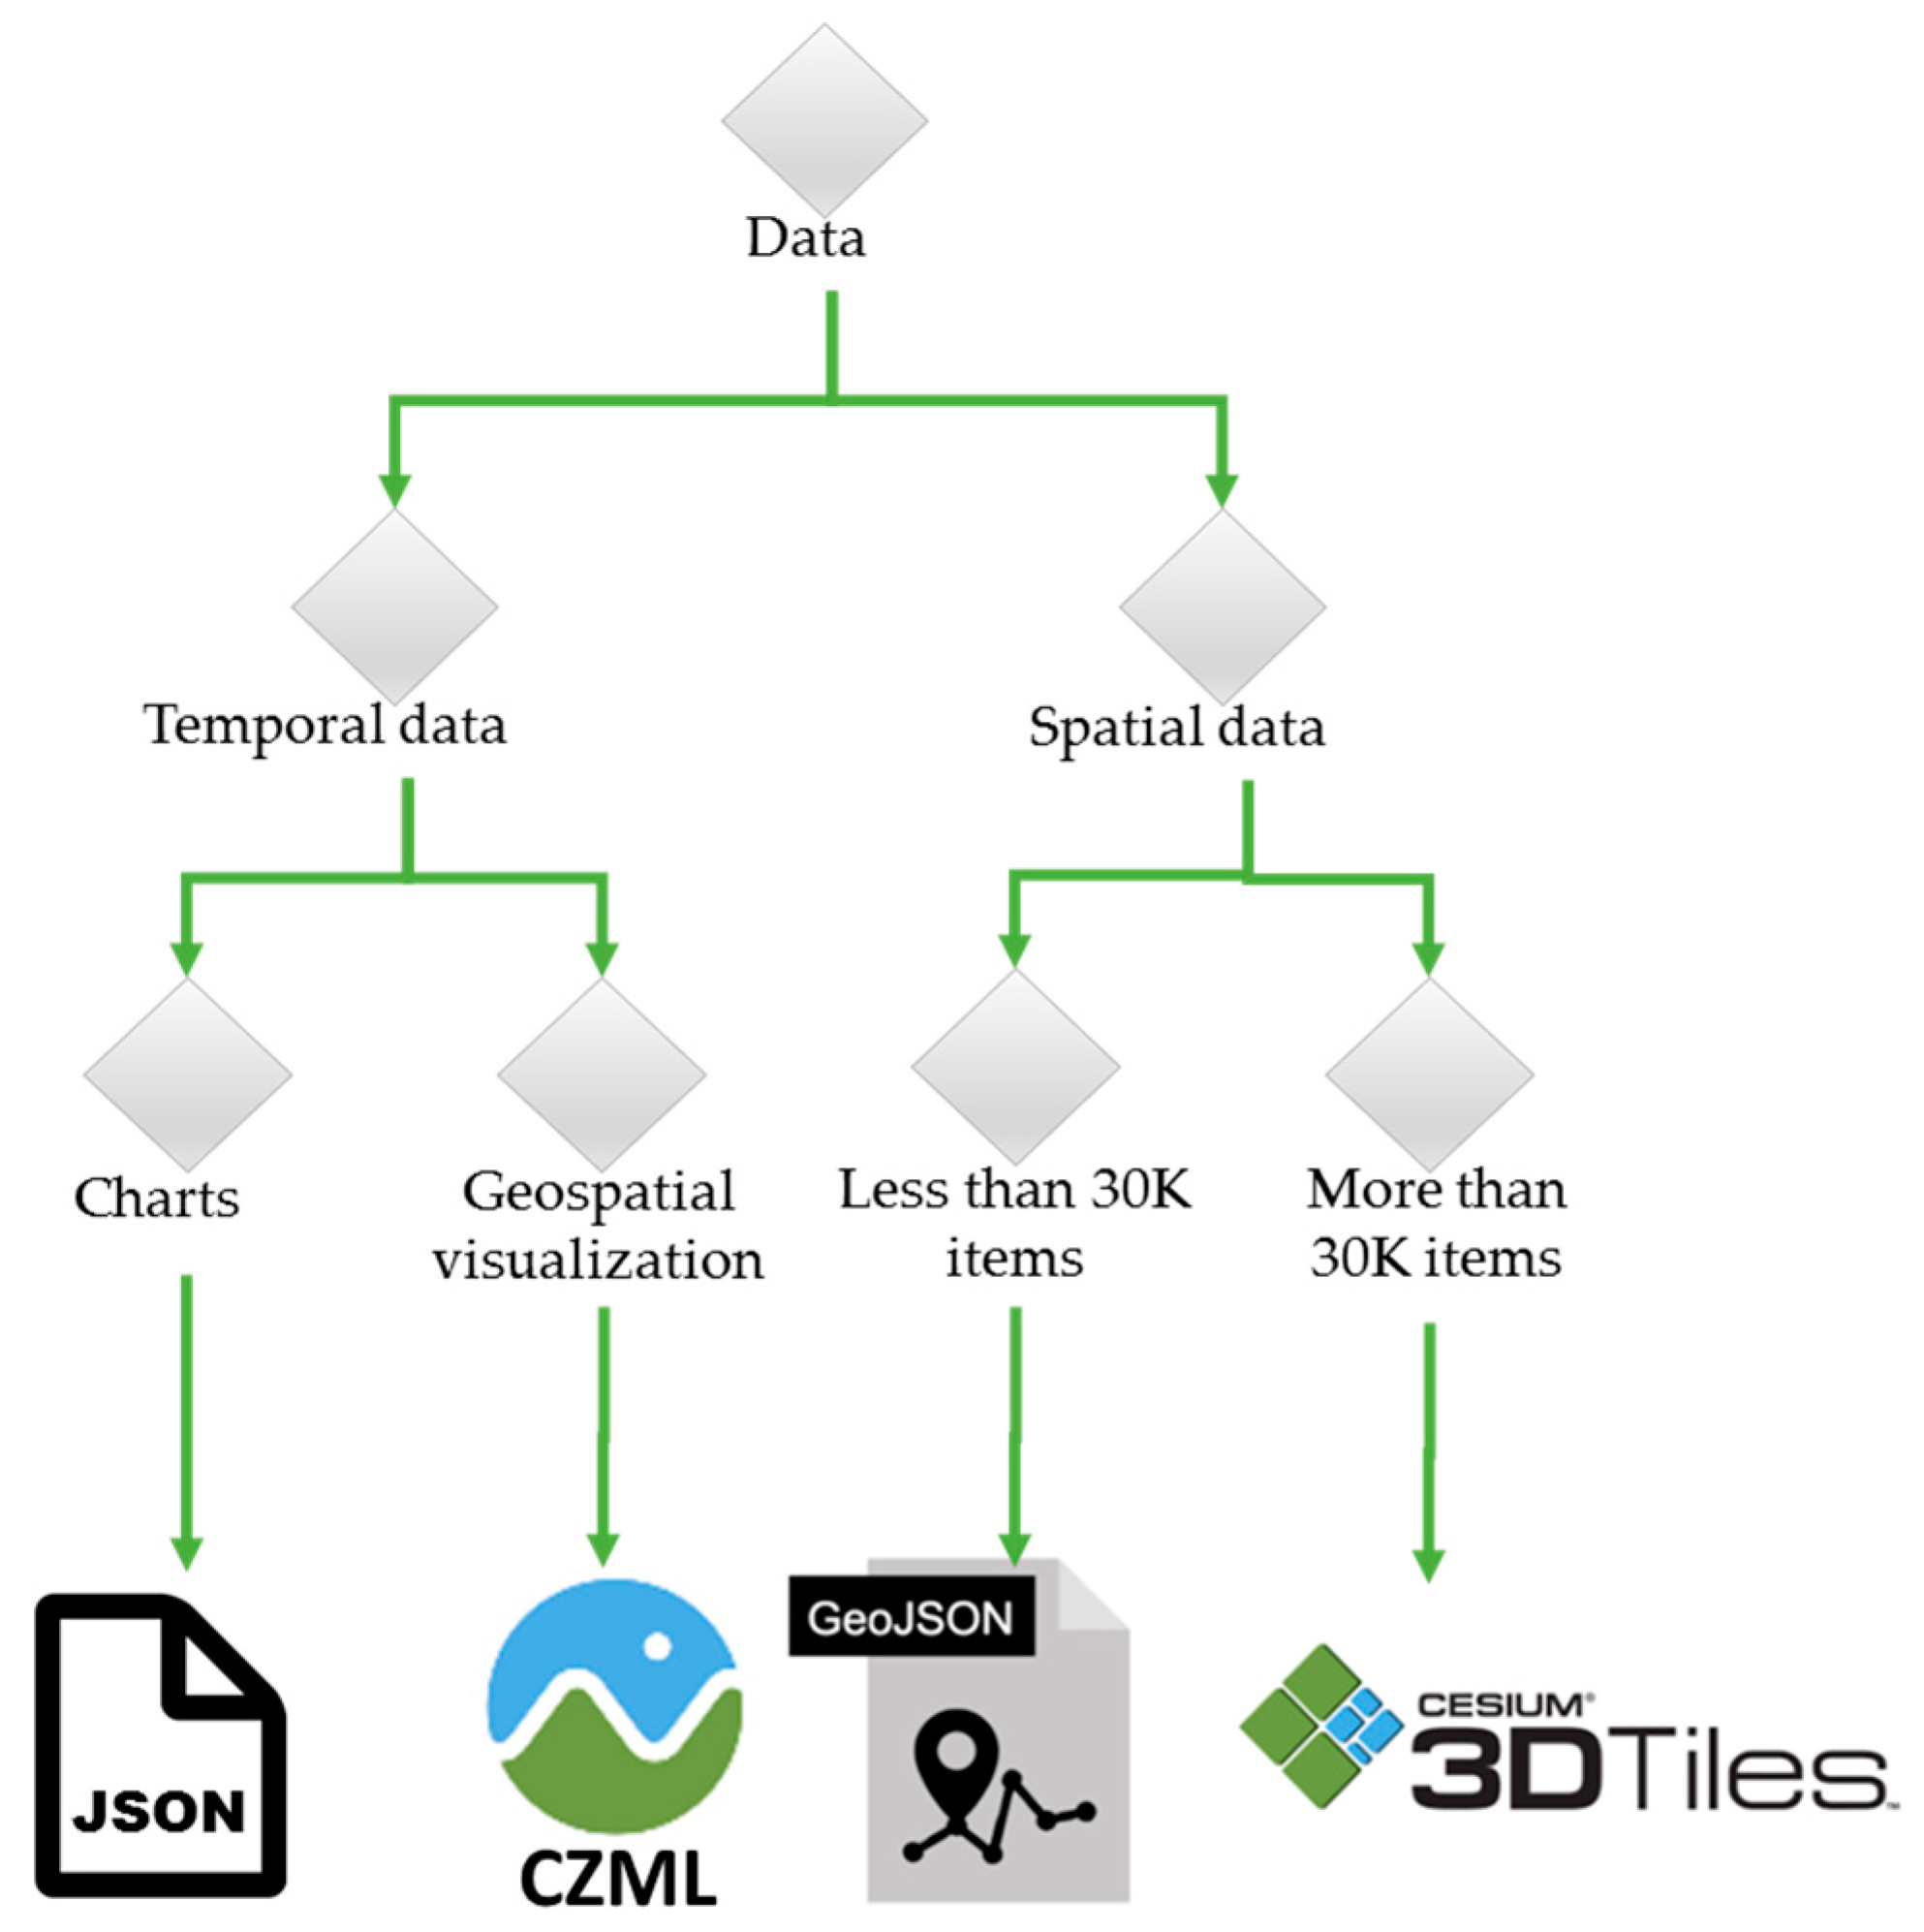
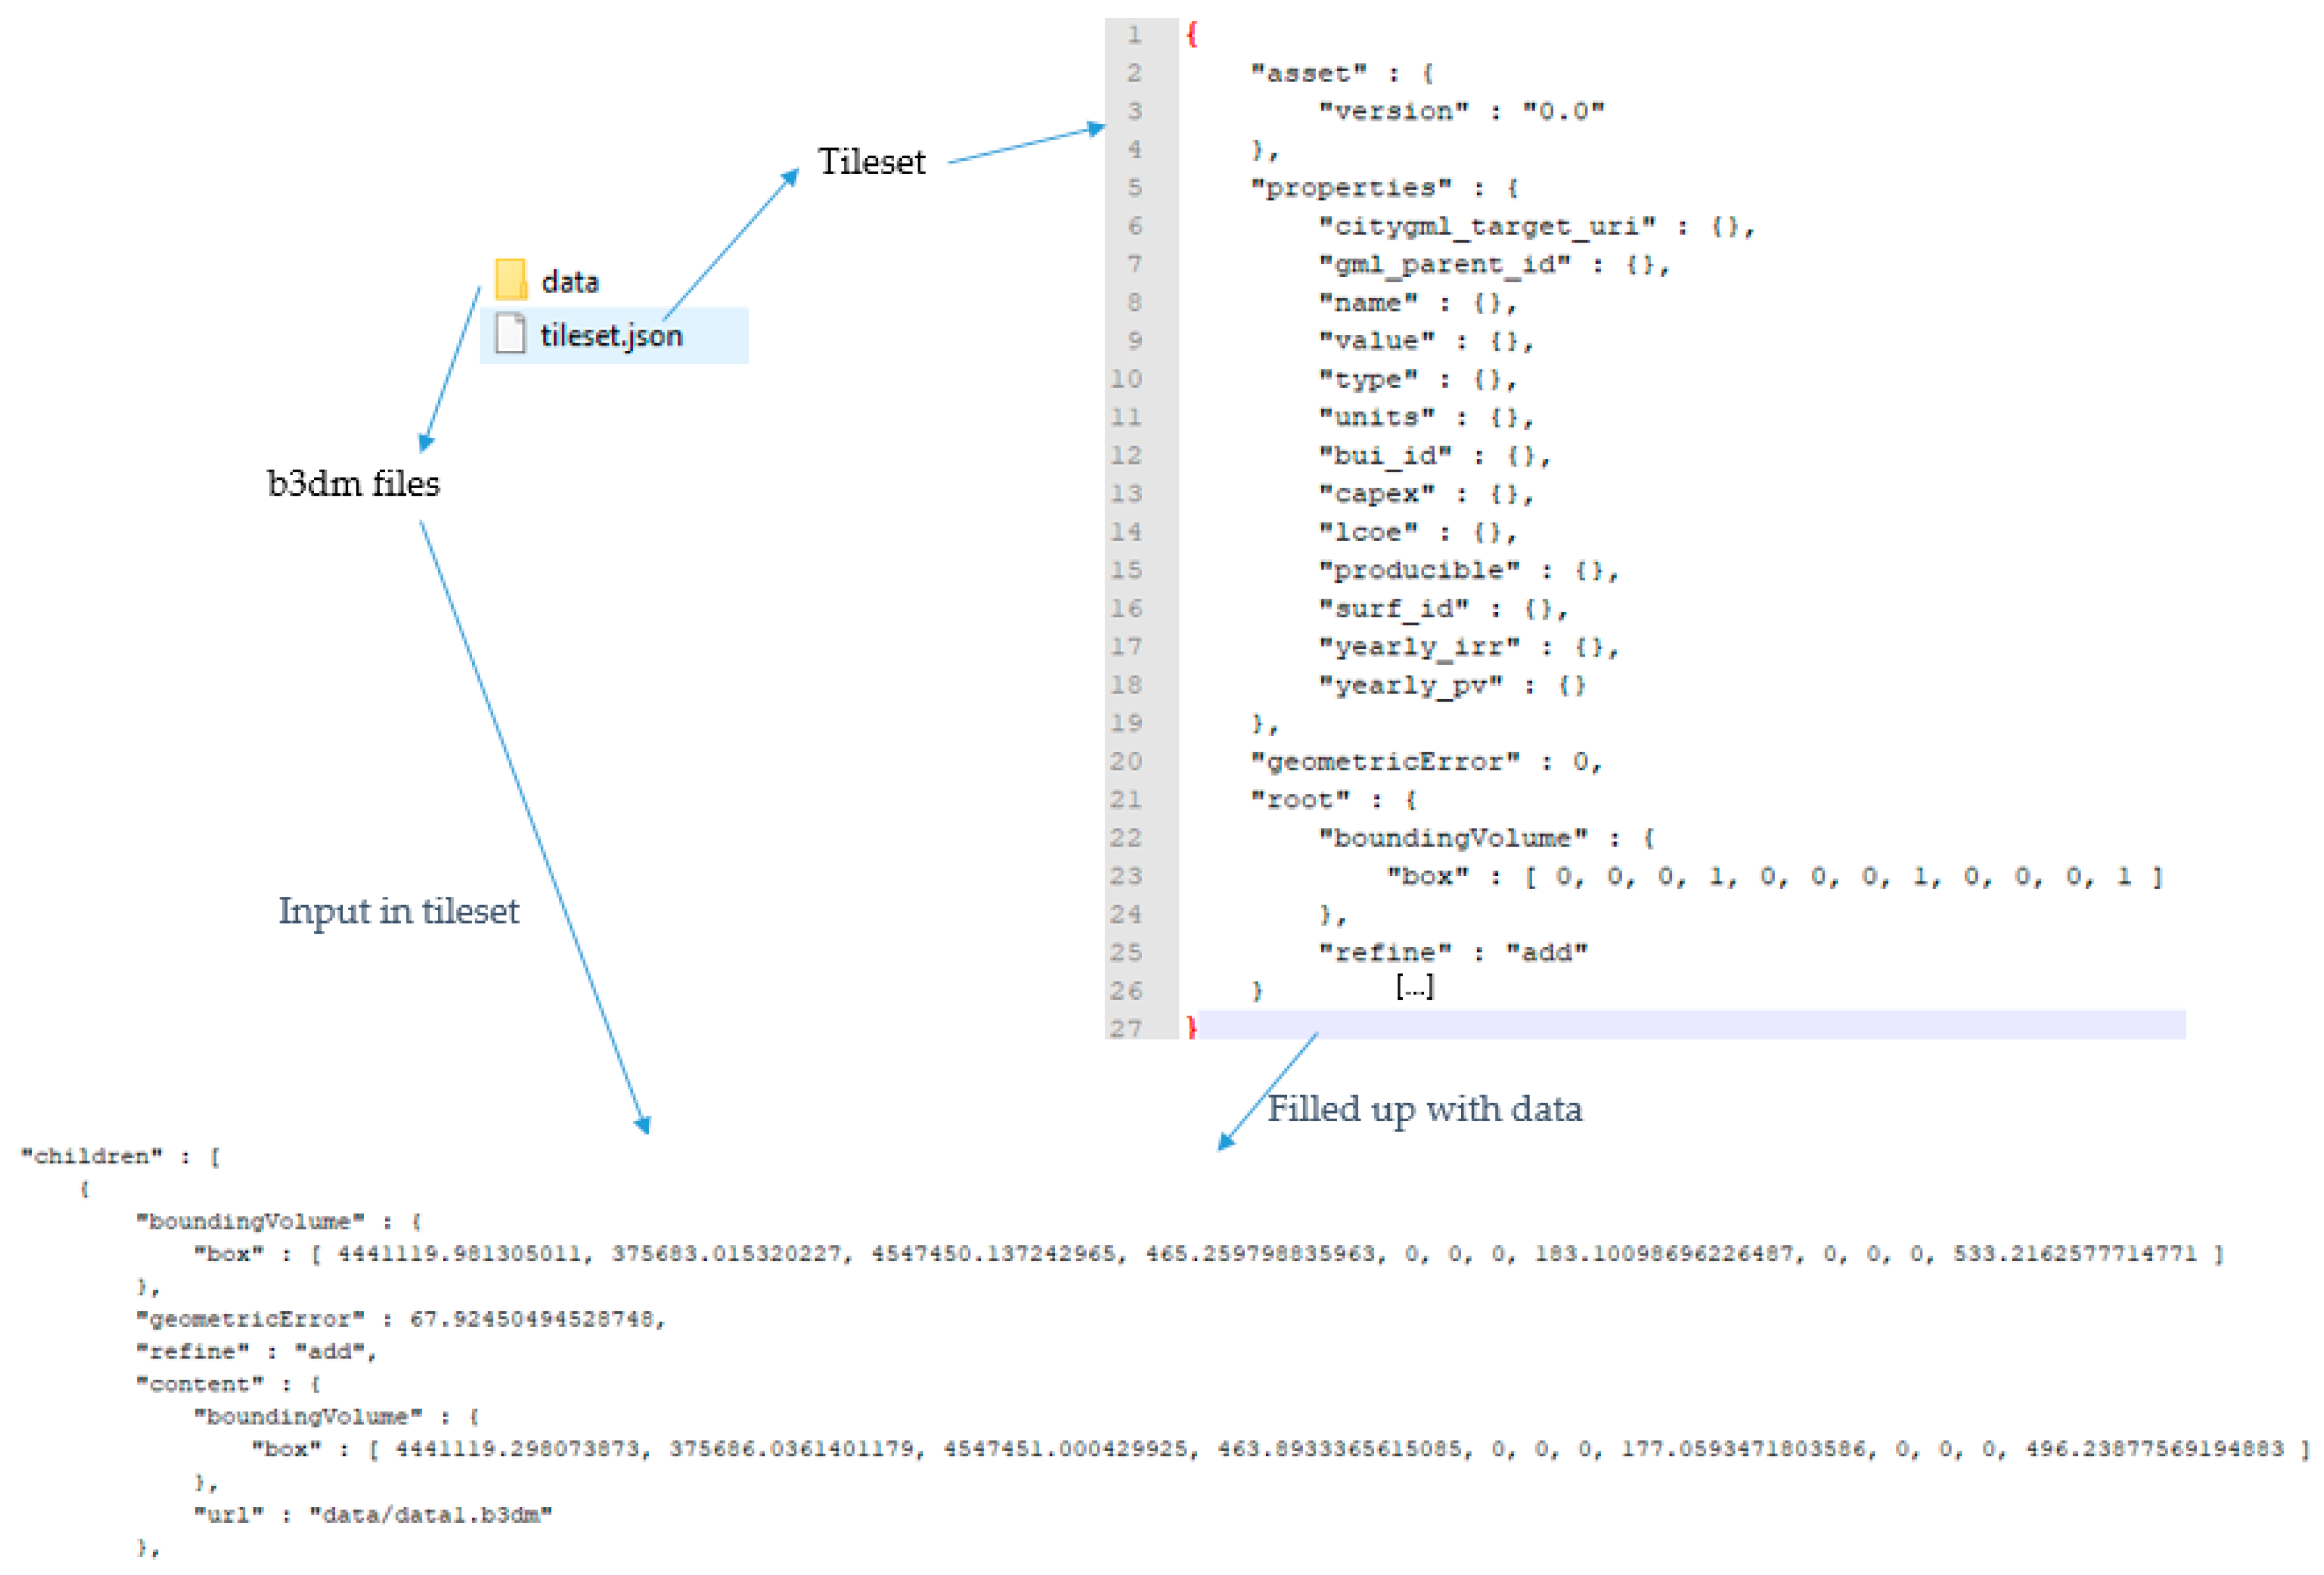
4.1. Data Format

The choice of a particular format depends on the nature (spatial or temporal), volume (several buildings of a district or all buildings of the whole city), visualization options (charts or geospatial visualization), and spatiotemporal resolution (building surfaces or buildings as a whole, hourly or monthly) of data. Therefore, one of the major goals of this research is to review the data formats, identify their suitability and limitations in visualization of energy simulation results and perform the conversion into different formats. Figure 3 gives a recommendation on the selection of the suitable data format and Table 2 highlights the visualization and functional capabilities of different data formats.
CZML and Cesium 3D Tiles formats are associated with core development of the Cesium interface. Both are based on a JSON syntax and are easily understood. CZML is similar to KML format but is adapted to Cesium products. 3D Tiles is an open specification for streaming massive heterogeneous 3D geospatial datasets such as imagery, 3D contents including buildings, trees, point clouds, and vector data [50]. CZML is the only format for visualizing dynamic (i.e., hourly or monthly temporal) data but it has many limitations, especially regarding coarser level of details and the increased data volume. The format is rather complex and raises multiple problems (discussed in Section 5.1). A detailed use of CZML properties to describe time-varying characteristics of geospatial objects, and the use of CZML to support streaming data are explained in Zhu et al. [51], while the relevant applications, academic influences, and future developments of CZML are explored in Zhu et al. [52].
In deploying 4D CANVAS application, JSON format is used to save different energy simulation results (attributes) and connect them with AmCharts to visualize the dynamics in charts. GeoJSON format represents static data at building surface level, whereas CZML displays time-dynamic data without surface-based representation and the 3D Tiles format illustrates large volume of static data in LOD2.

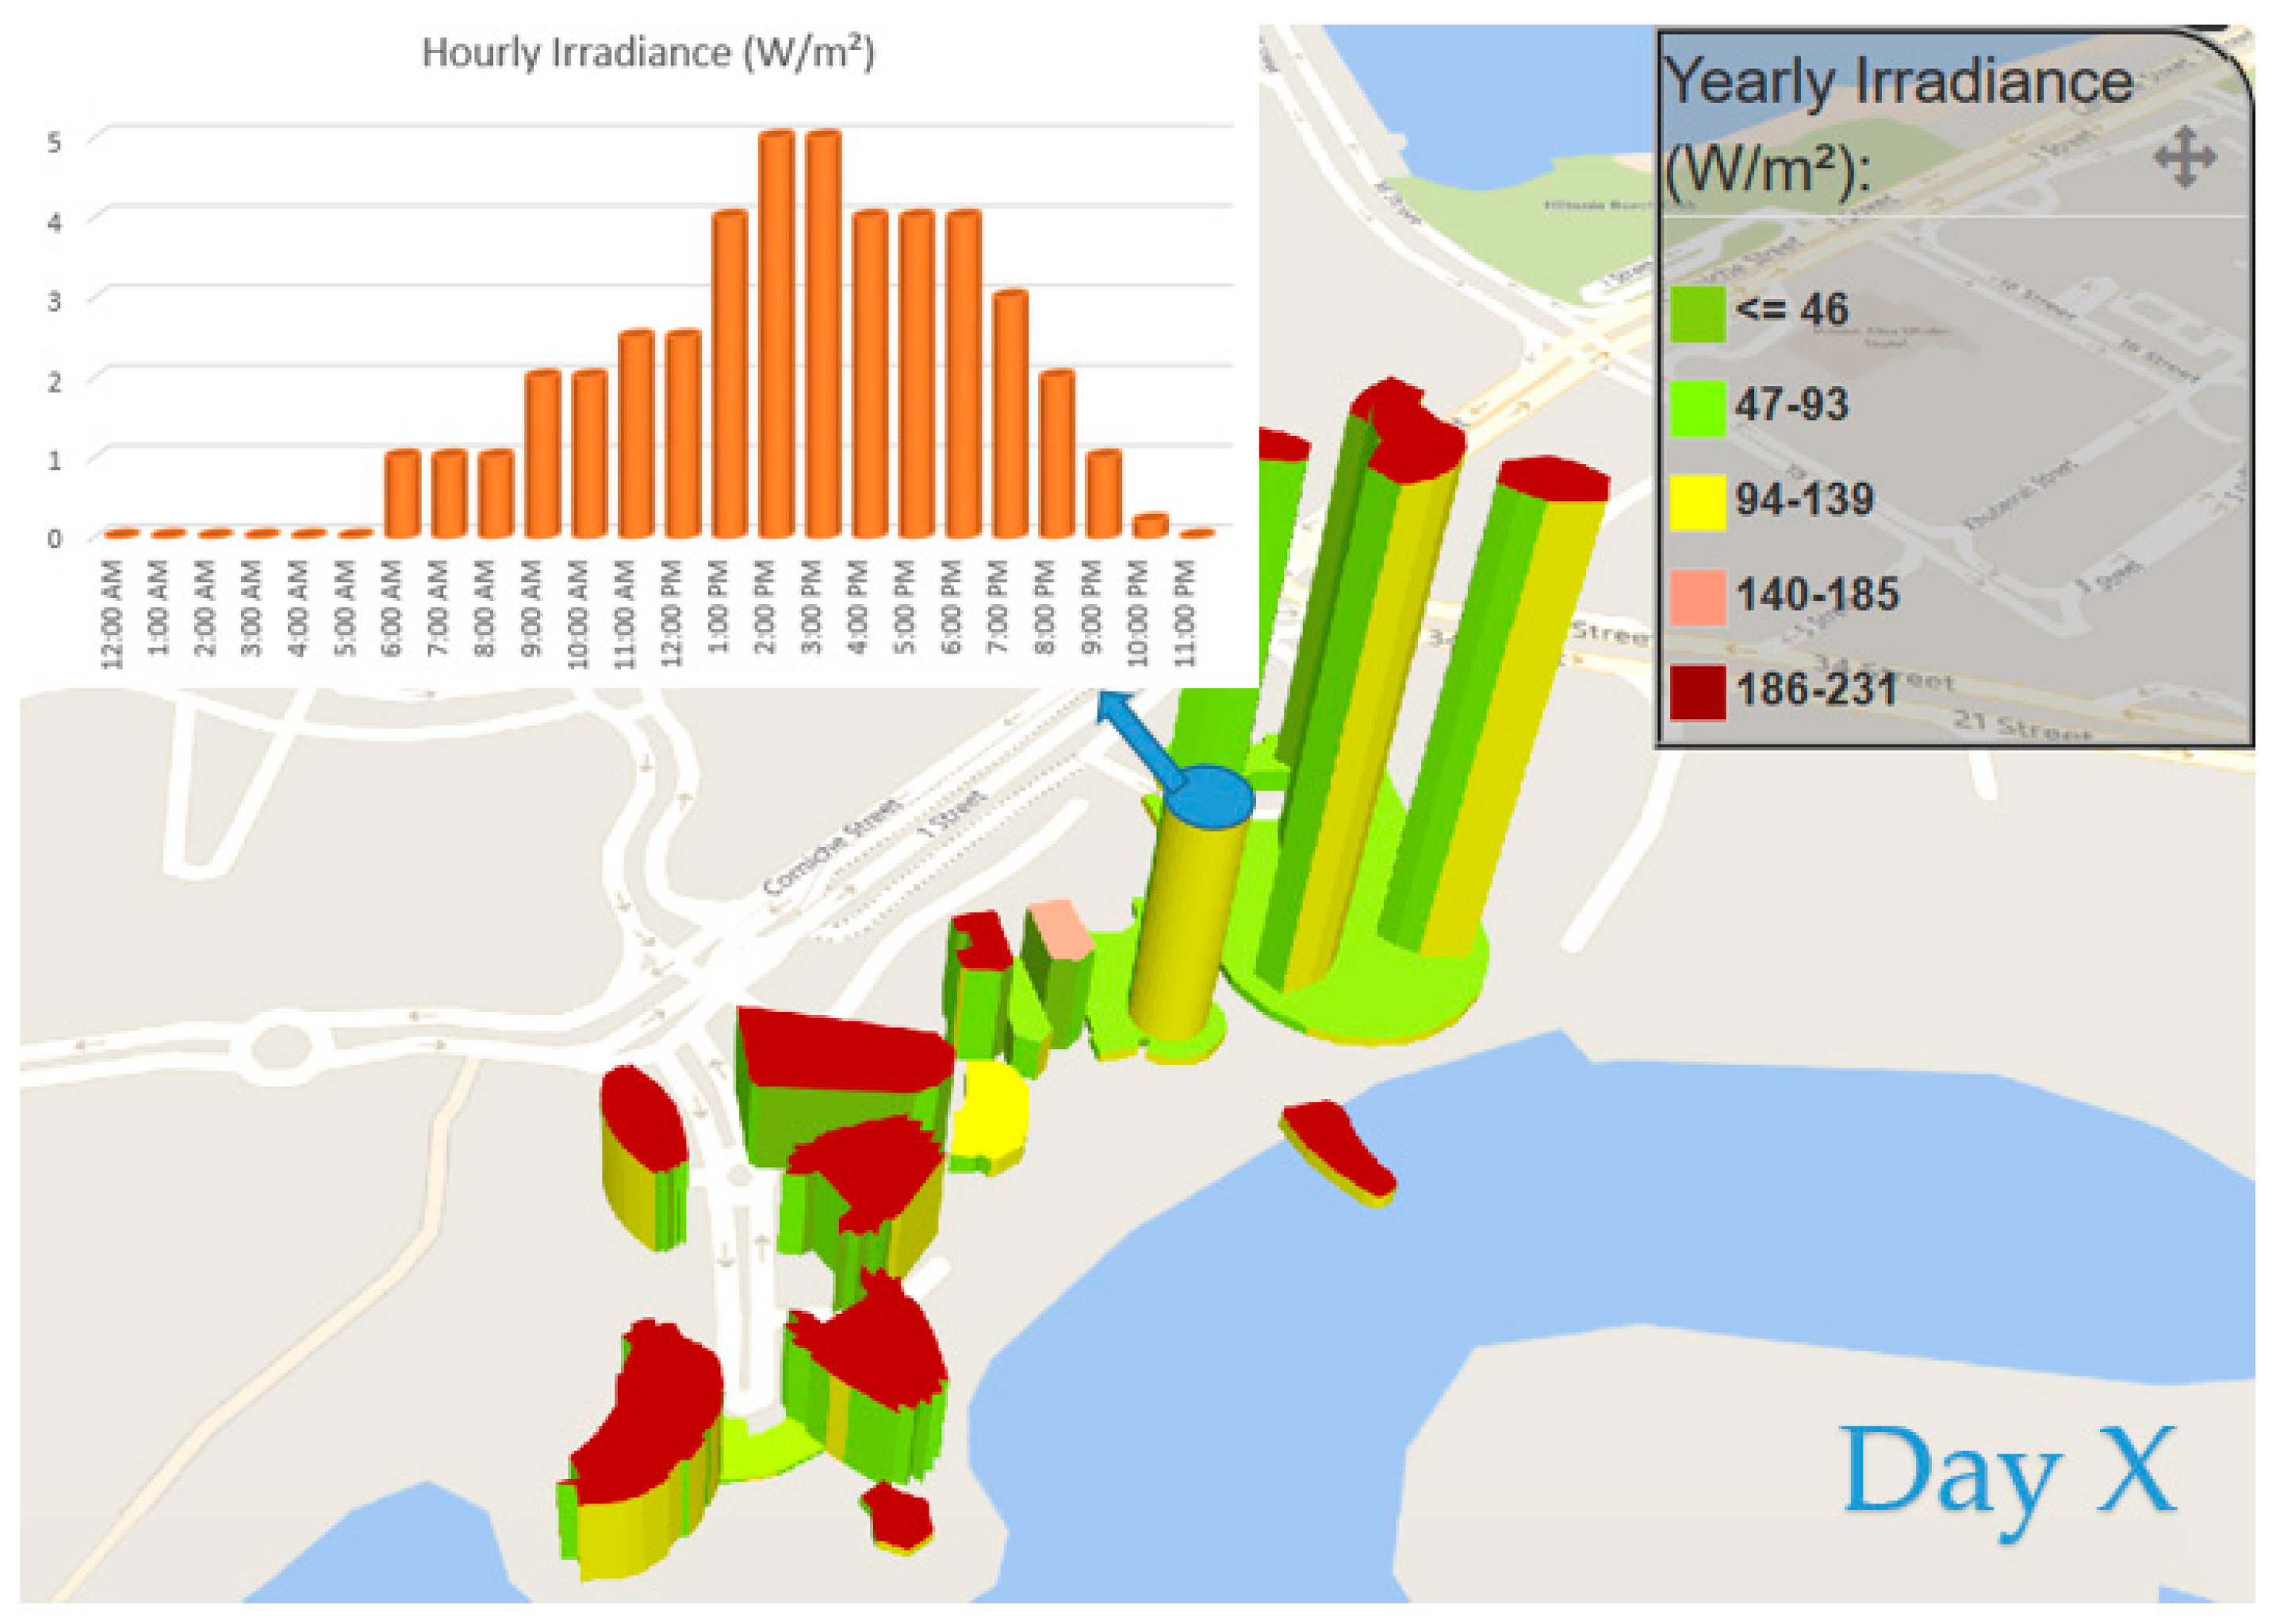
4.2. Energy Simulations Applications in Cities

In the 4D CANVAS web application, two energy simulation model outputs are visualized in five different cities (Kuwait, Abu Dhabi, Hong Kong, Lyon and Karlsruhe)—with different number of building surfaces stored as LOD1 and LOD2 buildings (Table 3).
The first model, PLANTING (Photovoltaic Potential on Three Dimensional Building) calculates solar irradiance and PV energy potential on the roof and wall surfaces of the buildings by considering shading from terrain and neighboring buildings as well as users’ choice on panel installation options [2]. It produces different outputs such as solar irradiance, energy production, installed power, producible, Levelized Cost of Electricity (LCOE), Capital Expenditure (CAPEX) at various temporal scales. The second model, CityBEM (City-wide Building Energy Modelling) calculates monthly energy needs and uses of 3D buildings [48] according to the ISO 13970:2008 standard [53]. The model produces monthly heating and cooling energy needs and uses. Both models are implemented in an open-source software architecture.
In 4D CANVAS, these outputs are visualized as time-static (e.g., annual) and time-dynamic (e.g., hourly, daily or monthly) manners. Hourly solar irradiance or energy production produces 8760 values (each hour throughout the year) for each surface of the building, which makes it difficult to display such data (explained in Section 5) in an interactive way. Therefore, hourly results are aggregated to monthly and annual level or are visualized for limited number of surface objects. For annual data, GeoJSON is used when total number of building surfaces is less than thirty thousand, otherwise, 3D Tiles is used for its faster rendering service. They are shown in a static manner with thematic mapping/color schemes on the building surfaces. The monthly results of the dynamic data are visualized as thematic surfaces in CZML format and as bar charts in JSON format by connecting them to the JavaScript Library AmCharts.

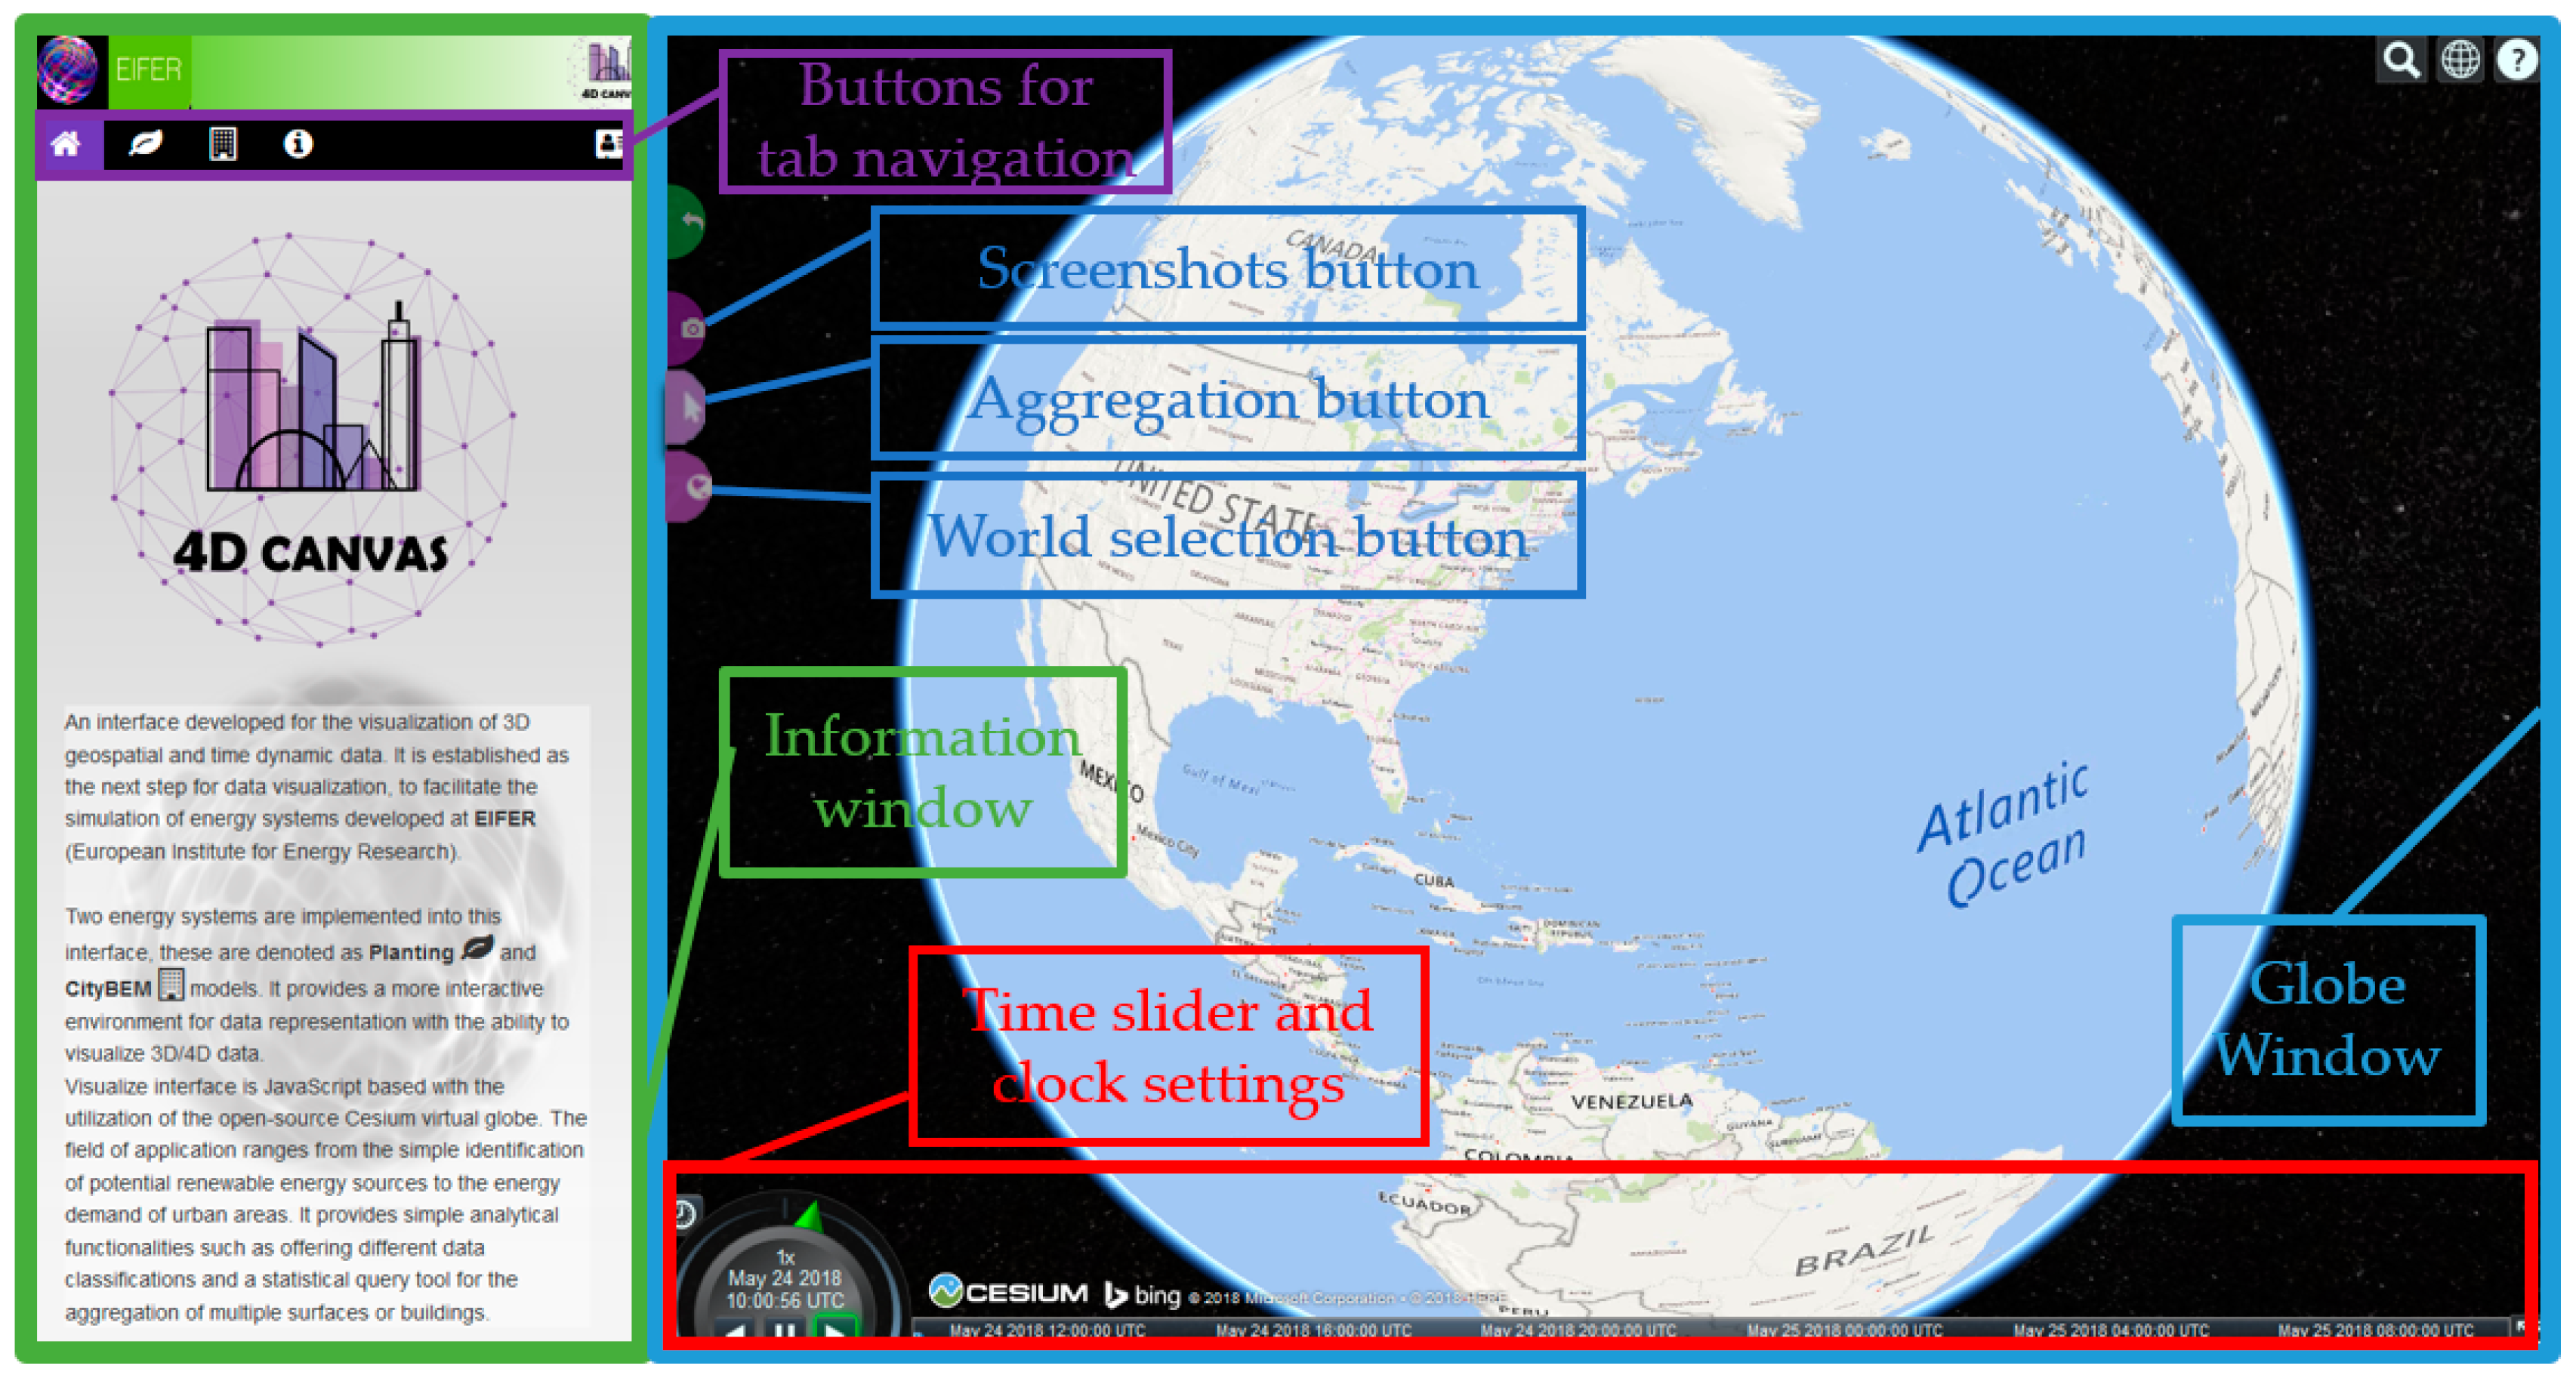
4.3. Description of the Interface and Functionnalities

Interface description: The 4D CANVAS aims to not only visualize different energy simulation results of 3D geospatial and time-dynamic data but also allows user to have smooth experience of explorative analyses of the results. For the later, such interactive experiences and actions are implemented after the suggestions made by Jakob [54]. The navigation options (such as panning, zooming) and other basic functionalities (animation, geocoding, base layer selection, etc.) are based on the default Cesium.js library. Figure 4 illustrates the Graphical User Interface (GUI) of the first page of the 4D CANVAS web application. It includes two main windows—information and globe windows, which are separated by a dissolvable sidebar.
After accessing to the application web page, the user is provided with a brief introduction to the application and energy models in the information window. Here the user can select a model, particular output, case study region and an output type to visualize in the display window. Users can choose either PLANTING or CityBEM model, based on which corresponding case study regions are highlighted. In the next step, user selects the type and temporal resolutions of the output that are to be selected from the dropdown menu of the information window. Afterwards, the globe instantly responds to the user’s selection and automatically loads the data and flies to that area of interest to visualize the results in 3D/4D. At the same time, the respective area is centered in the globe. Then the corresponding thematic map is displayed with varying colors assigned to the different features (e.g., buildings, surfaces, points) according to the output selected. A pre-assigned data classification also appears with the colors and the legend. This process is automatized by a JavaScript function.
Functionalities: Several tools and functionalities are implemented in the basic/default Cesium application in order to allow explorative and analytical visualization capabilities. Specific functionalities are allocated depending on the type of energy simulation output selected. The user can select an object (point or building surface) to display the temporal variations in a bar chart or a table with detailed information about the object selected. An aggregation tool is developed to select and aggregate multiple objects to view summary statistics e.g., sum or average values of the selected objects or temporal variations in bar charts. Furthermore, a camera tool is added to the interface to download and save the screenshots of the display window at any given time. The 4D CANVAS interface also allows flexible display options by dragging charts, tables and legends anywhere in the window. Finally, it is also possible to switch between the 3D view, 2D and the Columbus View with the Viewer Type button. Figure 5 demonstrates the annual solar irradiations on different building surfaces in different classes and their detailed information in a table.
Cesium globe consists of a built-in clock, which is implemented through a time slider. The play and pause button on the slider helps to control the dynamic visualization of data. In 4D CANVAS application, the slider is adjusted to run after the energy simulation data loading is completed. It updates the time steps and dynamically visualizes (animates) the temporal variations in thematic 3D buildings and their surfaces. Figure 6 illustrates the daily cooling energy needs in different buildings in Karlsruhe city.
Multi-touch functionalities are also added to be displayed on touch screens. The interrogative button indicates the available movements with mouse or fingers to navigate naturally in the area selected (Figure 7).

5. Discussion

5.1. Discussion of Results

Free and open-source Cesium software: This study tested the capability of utilizing the open-source Cesium.js library in visualizing 4D data of higher spatiotemporal resolutions. The capability of identifying individual building-surfaces of different LODs (as in the CityGML data) and providing their corresponding attributes from tables, was very beneficial to display detailed information about each building object. The use of the CZML format facilitated the dynamic visualization of temporal attributes in the monthly and daily data. Furthermore, the main advantage of Cesium was the easy integrating of different libraries and API, such as AmCharts and Geostats, which allowed further analytical functions to be implemented into the interface.
Data format evaluation: This research has tested and evaluated different data formats relevant to the energy simulation application (Figure 8). GeoJSON and 3D Tiles showed similar capabilities when static geospatial visualization is chosen and the data is not large in volume. Both can visualize the LOD1 and LOD2 datasets. However, GeoJSON does not support tiling, and therefore attempts to load the complete set of data into the viewer at a time. A function was developed to loop through the whole data to perform statistical calculations such as maximum, minimum, variance, mean and standard deviation, which are used for data classifications. Nevertheless, for larger volume of LOD2 datasets, such effort often caused to crush the browser.
In contrast, 3D Tiles is a suitable alternative to efficiently visualize large volume of data due to its tiling property but it restricts the display of detailed statistical information of the individual building surfaces, mainly due to its frequent re-rending. Every time the camera position is changed, the data is reloaded into the viewer and different statistical values are obtained only for the current view. CZML is the only suitable format used to visualize temporal variations in data. It does not support tiling and it can visualize LOD1 buildings only. This format is adequate to represent monthly and daily data. Due to the structure of the file, the hourly representation of data throughout a year (8760 values) for a large number of buildings (as in this application) resulted a massive file size and therefore, found unsuitable to visualize at hourly time step. However, hourly data for a few days could be easily visualized on some buildings.
Integration of popular geodatabase and data formats: Three main types of geodatabases (GDB) supported by both ArcGIS and QGIS are File Geodatabases, Personal Geodatabases and ArcSDE Geodatabases. These popular GDBs cannot be directly integrated into the Cesium application and need to be converted to Cesium 3D Tiles. Besides the proprietary data formats of Cesium (CZML, quantized-mesh, 3DTiles), it also supports some external formats such as gITF, GeoJSON, TopoJSON, Collada, ArcGIS ImageLayer, and google’s KML, etc. [55]. Other popular data formats need to be converted to Cesium supported formats. For example, FME tool supports the conversion of shapefiles, CityGML, GDB and Wavefront OBJ to Cesium 3D Tiles format. The HDF can be displayed as images in Cesium and is demonstrated by NASA [56]. Images (.img), billboards, and icons can easily be added to Cesium. However, the .geotiff, and .dem are not supported by Cesium.
Cartographic standards: Thematic cartographic representations are implemented on the individual 3D surfaces and buildings. Based on the literature review, different websites and maps are reviewed in order to understand the use of color hue properties for representing sequential data for 3D object. In general, multiple hue values are used to represent the change from high values to low and vice versa. Nevertheless, in 4D visualization, this has to be followed with upmost caution, due to the presence of shadow effects on the globe. This effect might create confusion in distinguishing different hue levels. Therefore, sequential color schemas with clear separations in the hue level are selected for the data classifications. Moreover, according to color psychology studies, red and blue are the most common representations used for temperature changes. However, due to issues related to red-blue colorblindness, these color values are used cautiously with distinct and separable variations of hue values. In case of visualization of energy related data, commonly color ranging from green to red is used. In contrast, there are no established standards of color arrangements in representing economic values such as cost of electricity or investment cost.
Data classification: Four different types of data classification methods—Static, Linear, Jenks (natural breaks) and Quantiles—are tested with different sets of data and are implemented in the 4D CANVAS application. Jenks is the most computational intensive, but it provides the optimal classification scheme in most cases for static displays. However, when comparing different spatiotemporal visualizations, it is recommended to use quantiles or standard deviation classification schemes in order to better compare the results across multiple maps [57,58]. In this application, the user can select any of the three methods to classify the data. In most use cases, linear method is adopted because it is simple to make pleasant maps.
Hourly data visualization: Representation of hourly time dynamic visualization of simulation results involves processing of a large amount of data for each object. Animating hourly irradiance data was attempted throughout the year for some building surfaces, but the browser (in a standard laptop) failed to load the data and crashed immediately. This problem was solved by limiting hourly time scale to a few days and/or aggregated them in daily resolution for a year (Figure 9 and Supplementary Material). Charts are also used to dynamically illustrate the daily values for different objects.
The complexities associated with the visualization of hourly dynamic data can be resolved by modifying the JavaScripts and Html files to smoothly animate the hourly results. It is also helpful to know the exact number of features and hourly data points that can be visualized without risking the browser to crash. Moreover, as some energy models produce results at building surface level (e.g., PV energy), the CZML format can be adapted to cope with it.
Automatize data conversion and integration into application: The energy simulation results are saved in the PostgreSQL databases as tables. They are, at first, manually converted using python scripts into required data formats and then integrated/loaded into the web application (see Figure 2). This process can be automatized through on-the-fly data conversion within the web application and thus avoid the data conversion steps (Figure 10).
From a technical point of view, it was investigated whether such process improves the application performance. The primary advantage of processing on-the-fly data conversion within the 4D CANVAS application is the need of less software and python scripts, but this approach has some limitations in terms of long loading-time of the data and thus delayed visualization. This may lead to addition errors as the complexity of such automatic conversions increase. Therefore, the conversion process is performed beforehand.
Visualization of spatiotemporal analysis for smart cities: The analytical visualization capabilities of the application can be enhanced further by allowing various spatiotemporal (4D) data analysis and making data more valuable. Song et al. [59] identified four such analyses categories: description of spatiotemporal characteristics (e.g., time series analyses, clustering, interpolation, etc.), exploration of potential factors and spatiotemporal prediction (e.g., regression analyses), modelling and simulation of spatiotemporal process (e.g., process modelling using cellular automation or agent-based models) and spatiotemporal decision making (e.g., models using multi-criteria decision making). The 4D CANVAS application can be used to visualization the results describing spatiotemporal characteristics and decision making. However, it lacks the mathematical modelling, such as clustering and classification for describing the spatiotemporal characteristics, and geospatial decision making methods for improved decision making. Therefore, many geospatial methods and algorithms can be incorporated into the application to perform robust pattern mining or predictive analyses. This will be particularly helpful in different smart city related applications such as air pollution modelling, crime and epidemic spread analysis, where it is important to discover some predictive patterns from both the space and time dimensions of data. In this regard, additional toolboxes can be integrated into the application to allow model and data-driven spatial and spatiotemporal analyses.

5.2. Performance Testing

The performance of the 4D CANVAS web application and the GUI were tested both desktop screens and a touchscreen tablet. In this regard, some popular web-browsers such as Mozilla Firefox (v60.0.1), Google Chrome (v66.0.3359.181), Microsoft Internet Explorer (v11.1088.15063.0) were considered to observe possible configuration changes in the user interface in terms of UI content scroll performance, UI latency/response time, Finger tracking and UI functionality. In many cases, Chrome had shown faster and smoother response during navigation with the Cesium globe, in comparison to Firefox. Firefox had displayed a more robust performance in loading large volume of data. However, JQuery functionality required some code adjustment to make use of it in the Firefox browsers.
The performance of the 4D CANVAS was also tested on a personal Dell Inspiron Laptop with an IntelCore i5 CPU (Central Processing Unit), 16 GB of RAM (Random Access Memory) and without any GPU (Graphical Processing Unit) power as well as on a Lenovo Horizon tablet with an IntelCore i7 CPU, 8 GB of RAM and Nvidia GeForce GT 620 M GPU. Both the touch tablet and the laptop performed similarly in the Chrome and Firefox browsers.
It was observed that the most important factor in the browsers was their compatibility to handle WebGL. Other factors such as CPU, GPU and RAM of the deployed machines influence the performance enormously. For example, the loading of the terrain with 3D Tiles runs up to 90% of GPU capacity. Another most crucial factor for better performance of the application is the uninterrupted internet connection because the loading and rendering of the Cesium terrain tiles requires internet for a seamless interaction.

6. Conclusions

6.1. Summary

In this research, the 4D CANVAS web application was developed based on the open-source Cesium virtual globe. Multiple energy simulation results such as techno-economic PV potential or energy needs of the 3D buildings are dynamically visualized in the context of different Asian and European cities. Several analytical functionalities are also integrated and a GUI is built to allow user explorative analyses of results. This study demonstrates that with widely available 3D datasets and technological advancements in virtual globe software frameworks, many different smart city applications can be integrated into the application.

6.2. Limitations

Cesium is an open-source project, backed-up by a large user-base and therefore, is under frequent improvements and development. The inclusion of additional functionalities, supporting of more data formats, or improving the existing capabilities of the interface depend on the initiatives of the Cesium core team. For instance, the 3D Tiles format is still in a very early stage of development, and significant improvement can be expected in the near future to visualize the temporal dimension efficiently [60].
In the process of developing the presented interface, several limitations in terms of performances and analytical capabilities in Cesium were observed. Some of them e.g., customized tools for analytical functionality were developed in this study. However, the management of a large volume of data by different data formats is still a major drawback in Cesium. Some of the use cases in this study consist of more than thirty thousand objects (e.g., points, surfaces, buildings), and Cesium showed poor performance in displaying and rendering large amount of GeoJSON that caused out-of-memory issues. Vector tiling of the GeoJSON format can solve this problem and the development efforts are ongoing. In the meantime dividing a large area with around 5000 features can be efficient for 4D visualization.
3D Tiles allows fast rendering and efficient handling of large amount of both vector and raster data. However, (a) it does not support temporal data visualization; and (b) it cannot display attribute info box of a selected object without manual coding in JavaScript; (c) The conversion tool to 3D Tiles is still under development and is not yet publicly available (The original data must be shared with Cesium team to be converted). In this research, FME’s Cesium 3D Tiles Writer [61] was deployed to convert the PostgreSQL tables into 3D tiles. However, it does not permit the user to specify desired configurations (e.g., number of features per tile). Moreover, the generated tiles are built with shaders specification, which could be set by the user in the JavaScript code. The shadow effect caused the surfaces that are opposite to the sun to appear black. For an unexplained reason, some energy simulation outputs could not be classified in 3D Tiles to display in color schemes of the buildings, despite the data has been called and the intervals were created. In this regard, the complex structure of 3D Tiles was investigated (Figure 11). It consists of one data folder and a Tileset.json file. In the data folder, multiple b3dm (Batched 3D Model, [62]) files are saved which include information and values correspond to each object. Tileset refers to all the object/geometry (e.g., surfaces) that are visible at a particular view in the globe. Once the particular tileset is visible on the globe, it fetches the required values from the corresponding b3dm file to be visualized. This way it reduces the loading and displaying large amount of data at a time.
CZML is able to visualize 4D data, but it (a) cannot display tilted roofs of the buildings and degrades them into flat roofs. Moreover; (b) the file size also becomes too large. In case of hourly irradiance of the Karlsruhe Buildings, the size is 3.4 GB, which disabled the browser to respond once the data was added to the Cesium Viewer.
Immutable terrain exaggeration is a problem in Cesium. In cases where original CityGML data had terrain information, the terrain provider is utilized with an exaggeration parameter. However this function is still under development and is currently immutable. It can only be initially set with the first constructor options of the Cesium Viewer. As a result, terrain exaggeration cannot be modified in real-time. It imposes multiple problems when different exaggeration settings need to be set in the viewer. This problem was solved by recreating the viewer for each change required using the TerrainExaggeration parameter.
Cesium is built on new technologies such as HTML5 and WebGL, which are not supported by some older browsers that could still be an issue for stakeholders in the public or commercial sector that are forced by IT restrictions to use a specific (often outdated) version of a web browser. Furthermore, high CPU and GPU capacity are inherent to WebGL application (to visualize high-resolution terrain models efficiently) and to ensure a satisfying user experience for Cesium applications.

6.3. Future Research

In the future, additional statistical analysis tools can be developed. For example, in this current application, the energy simulation results are visualized on 3D buildings and their surfaces. A tool can be developed to help users to aggregate/add/summarize results of particular surface type (e.g., roofs facing south only) and visualize in 4D. A JavaScript function can loop through the data set and highlight all such geometries and returns their statistical information.
3D Tiles can be directly extracted from the PostgreSQL database using the FME translator. In this regard, the feasibility of conversion of 3D Tiles can be investigated by writing a python script, which can connect to PostgreSQL database to get it converted.
The hourly visualization of 3D dataset for a small number of objects is already demonstrated in this paper. In the future, this capability for a large volume of objects (a whole city) can be enhanced by investing more time on JavaScript coding. Current version of the 4D CANVAS demonstrates ten outputs of two energy simulations in five cities. In the future, further applications and simulation results in other cities can be illustrated. Finally, a qualitative analysis of the user experiences on the usability and performance of the application can also be evaluated.

Supplementary Materials

A demo video of the 4D CANVAS is available online: https://youtu.be/ErEje6CL-GE.

Author Contributions

S.M.M. envisioned and wrote the article with a support from A.M.A.-H., J.W. and L.A.; A.M.A.-H. performed the initial coding and visualization of the application, which are later improved by L.A. The article was improved by the contributions of all the co-authors at various stages of the analysis and writing process.

Funding

This research received no external funding.

Acknowledgments

We are grateful to EDF R&D and EIFER for funding this research. Some of the Energy Simulation results were performed in the Modélisation Urbaine Gerland (MUG) and Resource Urbanisms Project. We are grateful to the respective funding agencies and project members. Our heartiest gratitude to the City of Lyon and Laboratoire LIRIS for providing the 3D city model of Lyon. We would like to thank City of Karlsruhe for the permission of using the CityGML data. We also acknowledge Wanji Zhu, Mario Ammann, Francisco Marzabal, Alexander Simons and Monica Feis for their support in application development. Finally, our sincere gratitude extends to the editors and two anonymous referees for their insightful comments, which helped us to improve the manuscript.

Conflicts of Interest

The authors declare no conflict of interest.

References

  1. Nouvel, R.; Zirak, M.; Dastageeri, H.; Coors, V.; Eicker, U. Urban energy analysis based on 3D city model for national scale applications. In Proceedings of the BauSIM 2014: 5th German-Austrian IBPSA Conference, Aachen, Germany, 22–24 September 2014. [Google Scholar]
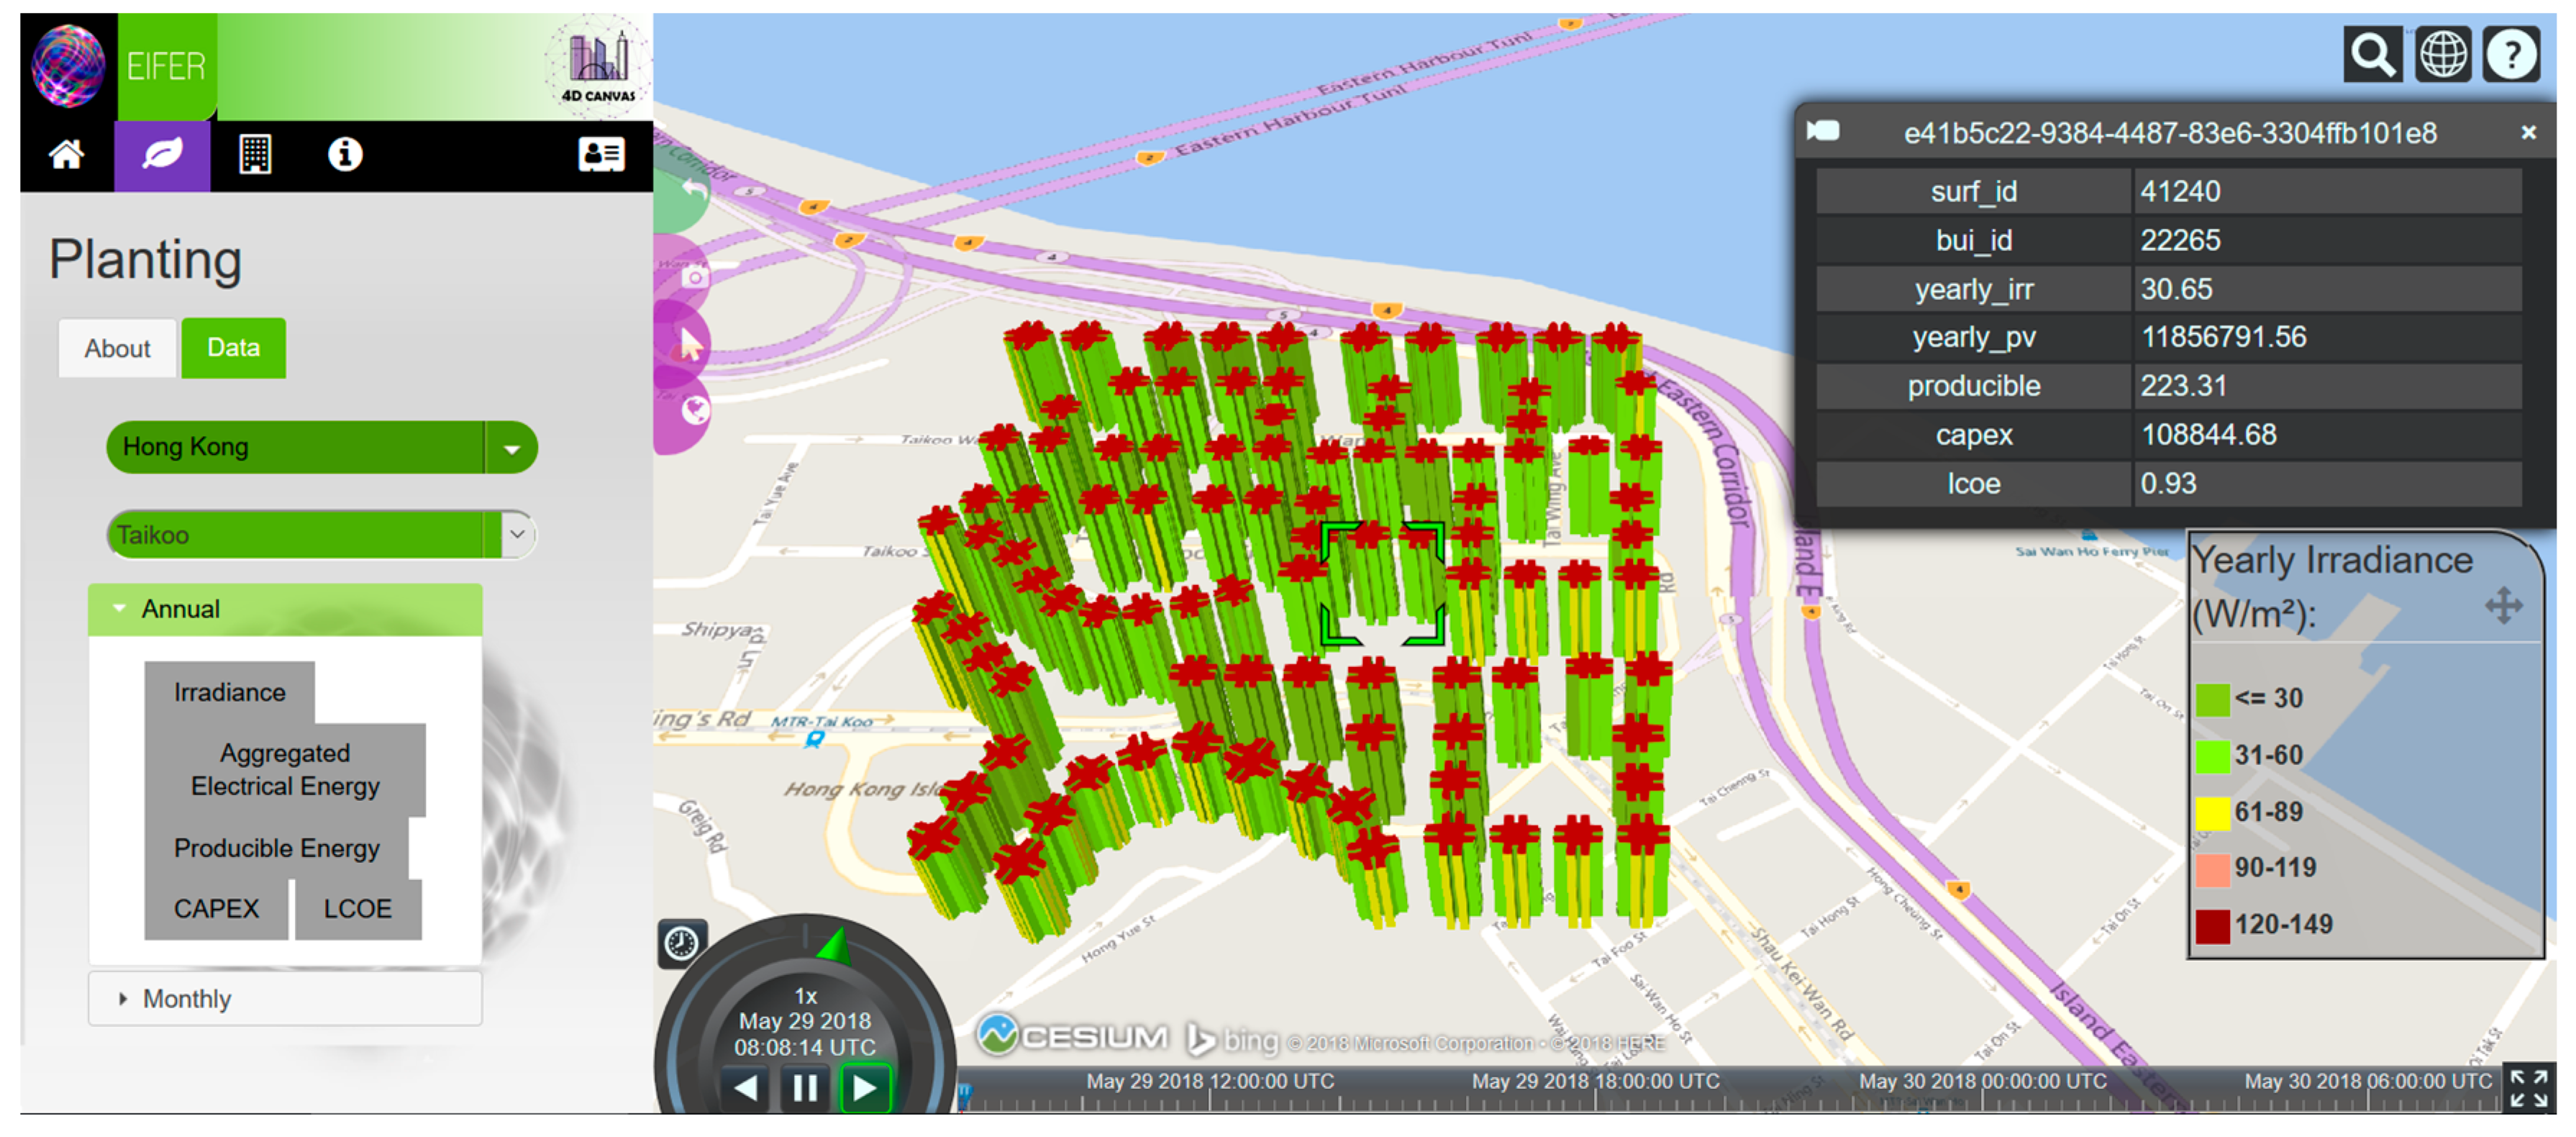
  2. Murshed, S.M.; Lindsay, A.; Picard, S.; Simons, A. PLANTING: Computing High Spatio-temporal Resolutions of Photovoltaic Potential of 3D City Models. In Geospatial Technologies for All. AGILE 2018. Lecture Notes in Geoinformation and Cartography; Mansourian, A., Pilesjö, P., Harrie, L., van Lammeren, R., Eds.; Springer: Cham, Switzerland, 2018; pp. 27–53. [Google Scholar]
  3. Resch, B.; Wohlfahrt, R.; Wosniok, C. Web-based 4D visualization of marine geo-data using WebGL. Cartogr. Geogr. Inf. Sci. 2014, 41, 235–247. [Google Scholar] [CrossRef] [Green Version]
  4. WebGL Overview. Available online: https://www.khronos.org/webgl/ (accessed on 9 July 2018).
  5. Cesium.js. Available online: https://cesiumjs.org (accessed on 28 May 2018).
  6. Glob3m. Available online: http://glob3mobile.com/ (accessed on 4 June 2018).
  7. Wendel, J.; Murshed, S.M.; Sriramulu, A.; Nichersu, A. Development of a Web-Browser Based Interface for 3D Data—A Case Study of a Plug-in Free Approach for Visualizing Energy Modelling Results. In Progress in Cartography; Lecture Notes in Geoinformation and Cartography; Gartner, G., Jobst, M., Huang, H., Eds.; Springer: Cham, Switzerland, 2016; pp. 185–205. [Google Scholar]
  8. Open Geospatial Consortium (OGC). OpenGIS City Geography Markup Language (CityGML) Encoding Standard; Open Geospatial Consortium Inc.: Wayland, MA, USA, 2008; p. 234. [Google Scholar]
  9. CityGML Example FZK-Haus. Available online: http://www.citygmlwiki.org/index.php?title=FZK_Haus (accessed on 22 June 2018).
  10. Nouvel, R.; Kaden, R.; Bahu, J.-M.; Kaempf, J.; Cipriano, P.; Lauster, M.; Benner, J.; Munoz, E.; Tournaire, O.; Casper, E. Genesis of the citygml energy ADE. In Proceedings of the CISBAT 2015 Future Buildings and Districts Sustainability from Nano to Urban Scale, Lausanne, Switzerland, 9–11 September 2015. [Google Scholar]
  11. Becker, T.; Nagel, C.; Kolbe, T.H. Integrated 3D modeling of multi-utility networks and their interdependencies for critical infrastructure analysis. In Advances in 3D Geo-Information Sciences; Lecture Notes in Geoinformation and Cartography; Kolbe, T.H., König, G., Nagel, C., Eds.; Springer: Berlin/Heidelberg, Germany, 2011; pp. 1–20. [Google Scholar]
  12. Döllner, J.; Kersting, O. Dynamic 3D maps as visual interfaces for spatio-temporal data. In Proceedings of the 8th ACM International Symposium on Advances in Geographic Information Systems, Washington, DC, USA, 6–11 November 2000; ACM: New York, NY, USA, 2000. [Google Scholar]
  13. ISO/IEC. Software Engineering—Product Quality—Part 1: Quality Model. International Organization for Standardization; ISO/IEC 9126-1:2001; International Electrotechnical Commission: Geneva, Switzerland, 2001. [Google Scholar]
  14. Manferdini, A.; Remondino, F. A Review of Reality-Based 3D Model Generation, Segmentation and Web-Based Visualization Methods. Int. J. Herit. Digit. Era 2012, 1, 103–123. [Google Scholar] [CrossRef]
  15. VRML Virtual Reality Modeling Language. Available online: https://www.w3.org/MarkUp/VRML/ (accessed on 9 July 2018).
  16. Three.js. Available online: https://threejs.org/ (accessed on 6 June 2018).
  17. Unity 3D. Available online: https://unity3d.com/ (accessed on 6 June 2018).
  18. Unreal Engine. Available online: https://www.unrealengine.com/en-US/blog (accessed on 30 May 2018).
  19. X3dom. Available online: https://www.x3dom.org/ (accessed on 6 June 2018).
  20. OSG.js. Available online: http://osgjs.org (accessed on 6 June 2018).
  21. O3D. Available online: https://code.google.com/archive/p/o3d/ (accessed on 29 May 2018).
  22. WebGLEarth. Available online: https://www.webglearth.com (accessed on 2 July 2018).
  23. WebGL Globe. Available online: https://opensource.google.com/projects/webglglobe (accessed on 2 July 2018).
  24. Evangelidis, K.; Papadopoulos, T.; Papatheodorou, K.; Mastorokostas, P.; Hilas, C. 3D geospatial visualizations: Animation and motion effects on spatial objects. Comput. Geosci. 2018, 111, 200–212. [Google Scholar] [CrossRef]
  25. Brovelli, M.A.; Minghini, M.; Zamboni, G. New Generation Platforms for Exploration of Crowdsourced Geo-Data. In Earth Observation Open Science and Innovation; ISSI Scientific Report Series; Mathieu, P., Aubrecht, C., Eds.; Springer: Cham, Switzerland, 2018; pp. 219–243. [Google Scholar] [Green Version]
  26. Julin, A.; Jaalama, K.; Virtanen, J.-P.; Pouke, M.; Ylipulli, J.; Vaaja, M.; Hyyppä, J.; Hyyppä, H. Characterizing 3D City Modeling Projects: Towards a Harmonized Interoperable System. ISPRS Int. J. Geo-Inf. 2018, 7, 55. [Google Scholar] [CrossRef]
  27. Energy Atlas Berlin. Available online: http://energyatlas.energie.tu-berlin.de/en/ (accessed on 2 July 2018).
  28. Kaden, R.; Kolbe, T.H. City-wide total energy demand estimation of buildings using semantic 3D city models and statistical data. ISPRS Ann. Photogramm. Remote Sens. Spat. Inf. Sci. 2013, II-2/W1, 163–171. [Google Scholar] [CrossRef]
  29. Kaden, R.; Kolbe, T.H. Simulation-Based Total Energy Demand Estimation of Buildings using Semantic 3D City Models. Int. J. 3-D Inf. Model. 2014, 3, 35–53. [Google Scholar] [CrossRef]
  30. Giovannini, L.; Pezzi, S.; Di Staso, U.; Prandi, F.; De Amicis, R. Large-Scale Assessment and Visualization of the Energy Performance of Buildings with Ecomaps. In Proceedings of the 3rd International Conference on Data Management Technologies and Applications (DATA 2014), Vienna, Austria, 29–31 August 2014; SCITEPRESS–Science and Technology Publications, Lda Setúbal: Vienna, Austria, 2014. [Google Scholar]
  31. Chaturvedi, K.; Yao, Z.; Kolbe, T.H. Web-based Exploration of and Interaction with Large and Deeply Structured Semantic 3D City Models using HTML5 and WebGL. In Bridging Scales-Skalenübergreifende Nah-und Fernerkundungsmethoden; 35. Wissenschaftlich-Technische Jahrestagung der DGPF; Deutsche Gesellschaft für Photogrammetrie, Fernerkundung und Geoinformation (DGPF) e.V: Köln, Germany, 2015. [Google Scholar]
  32. 3DCityDB. Available online: https://www.3dcitydb.org/3dcitydb/ (accessed on 2 July 2018).
  33. Kolbe, T.H.; Yao, Z.; Herreruela, J.; Nagel, C.; Kunde, F.; Willkomm, P.; Hudra, G. 3D City Database for CityGML. In Addendum to the 3D City Database Documentation Version; Technical University Berlin: Munich, Germany, 2013. [Google Scholar]
  34. Kolbe, T.H.; Burger, B.; Cantzler, B. CityGML goes to Broadway. In Proceedings of the Photogrammetric Week’15, Stuttgart, Germany, 9–13 September 2015; Wichmann/VDE Verlag: Belin/Offenbach, Germany, 2015. [Google Scholar]
  35. Zhu, W.; Simons, A.; Wursthorn, S.; Nichersu, A. Integration of CityGML and Air Quality Spatio-Temporal Data Series via OGC SOS. In Proceedings of the Geospatial Sensor Webs Conference (GSW), Munster, Germany, 29–31 August 2016. [Google Scholar]
  36. Lin, F.; Chang, W.-Y.; Tsai, W.-F.; Shih, C.-C. Development of 3D Earth Visualization for Taiwan Ocean Environment Demonstration. In Data Mining and Big Data; Tan, Y., Takagi, H., Shi, Y., Eds.; Springer International Publishing: Cham, Switzerland, 2017; pp. 307–313. [Google Scholar]
  37. Santana, J.M.; Wendel, J.; Trujillo, A.; Suárez, J.P.; Simons, A.; Koch, A. Multimodal Location Based Services—Semantic 3D City Data as Virtual and Augmented Reality. In Progress in Location-Based Services 2016. Lecture Notes in Geoinformation and Cartography; Gartner, G., Huang, H., Eds.; Springer: Cham, Switzerland, 2017; pp. 329–353. [Google Scholar]
  38. Trujillo, A.; Suárez, J.P.; de la Calle, M.; Gómez, D.; Pedriza, A.; Santana, J.M. Glob3 Mobile: An Open Source Framework for Designing Virtual Globes on iOS and Android Mobile Devices. In Progress and New Trends in 3D Geoinformation Sciences; Pouliot, J., Daniel, S., Hubert, F., Zamyadi, A., Eds.; Springer: Berlin/Heidelberg, Germany, 2013; pp. 211–229. [Google Scholar]
  39. Krämer, M.; Gutbell, R. A case study on 3D geospatial applications in theWeb using state-of-the-art WebGL frameworks. In Proceedings of the 20th International Conference on 3D Web Technology (Web3D’15), Heraklion, Greece, 18–21 June 2015; ACM: New York, NY, USA, 2015. [Google Scholar]
  40. Smart Dubai. Available online: https://smartdubai.ae/en/Pages/default.aspx (accessed on 2 July 2018).
  41. Buyuksalih, I.; Bayburt, S.; Buyuksalih, G.; Baskaraca, A.; Karim, H.; Rahman, A.A. 3D Modelling and Visualization based on the Unity Game Engine—Advantages and Challenges. ISPRS Ann. Photogramm. Remote Sens. Spat. Inf. Sci. 2017, IV-4/W4, 161–166. [Google Scholar] [CrossRef]
  42. Pirotti, F.; Brovelli, M.A.; Prestifilippo, G.; Zamboni, G.; Kilsedar, C.E.; Piragnolo, M.; Hogan, P. An open source virtual globe rendering engine for 3D applications: NASA World Wind. Open Geospat. Data Softw. Standards 2017, 2, 4. [Google Scholar] [CrossRef]
  43. Leaflet.js. Available online: https://leafletjs.com/ (accessed on 6 June 2018).
  44. Mapbox. Available online: https://www.mapbox.com (accessed on 4 June 2018).
  45. Wrld3d. Available online: https://www.wrld3d.com (accessed on 29 May 2018).
  46. Eegeo.js. Available online: https://www.sitepoint.com/3d-maps-with-eegeo-and-leaflet/ (accessed on 6 June 2018).
  47. Graphics Tech in Cesium—Renderer Architecture. Available online: https://cesium.com/blog/2015/05/15/graphics-tech-in-cesium-architecture (accessed on 2 July 2018).
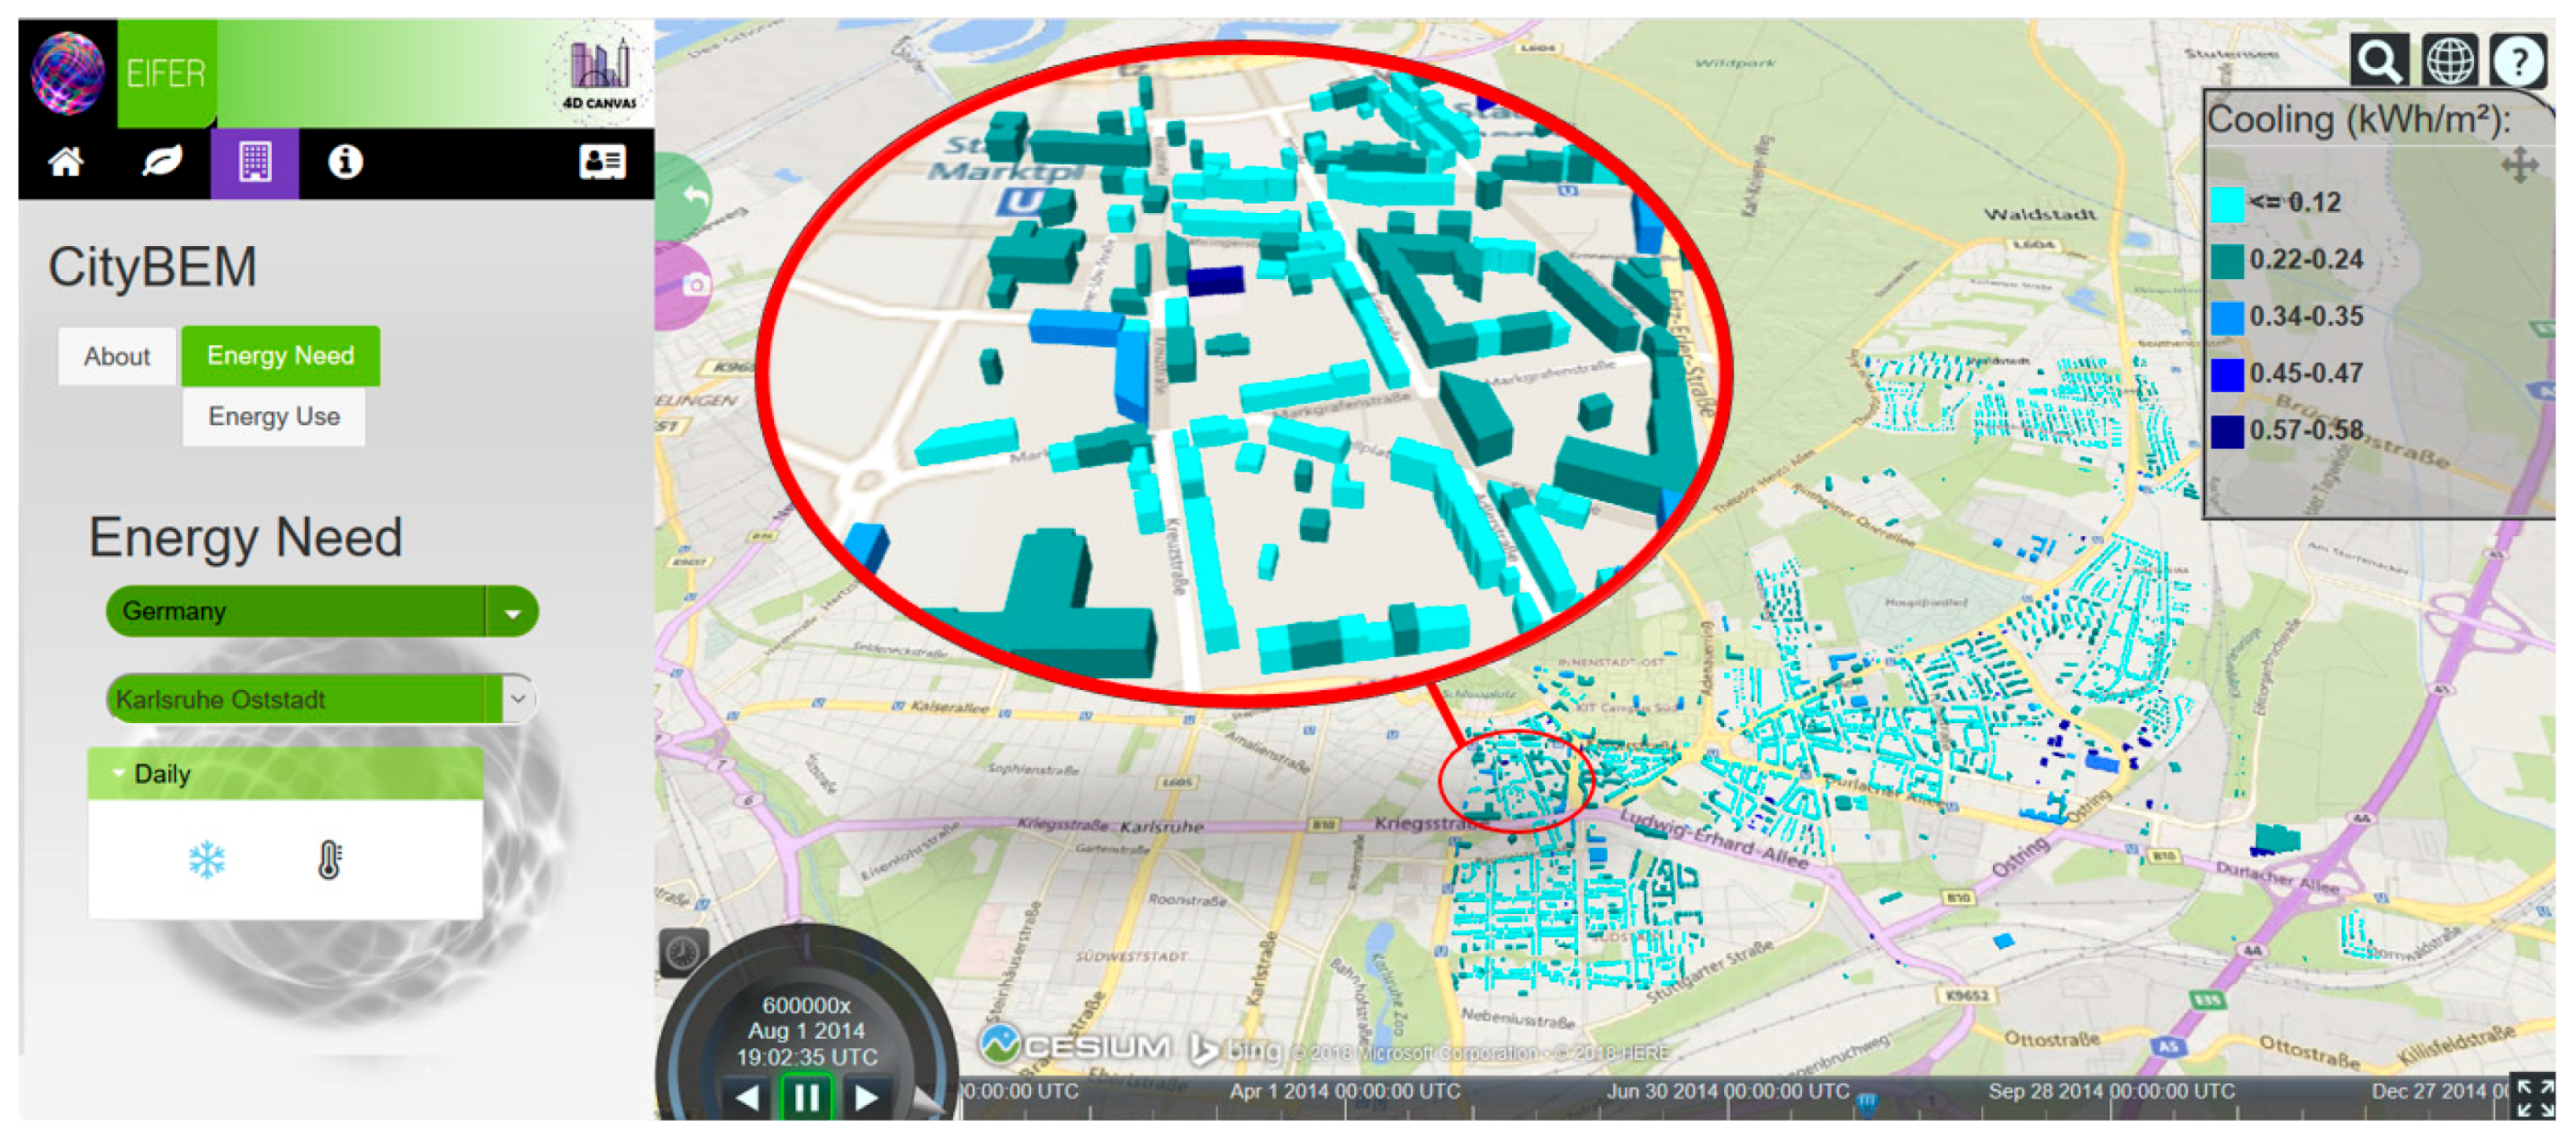
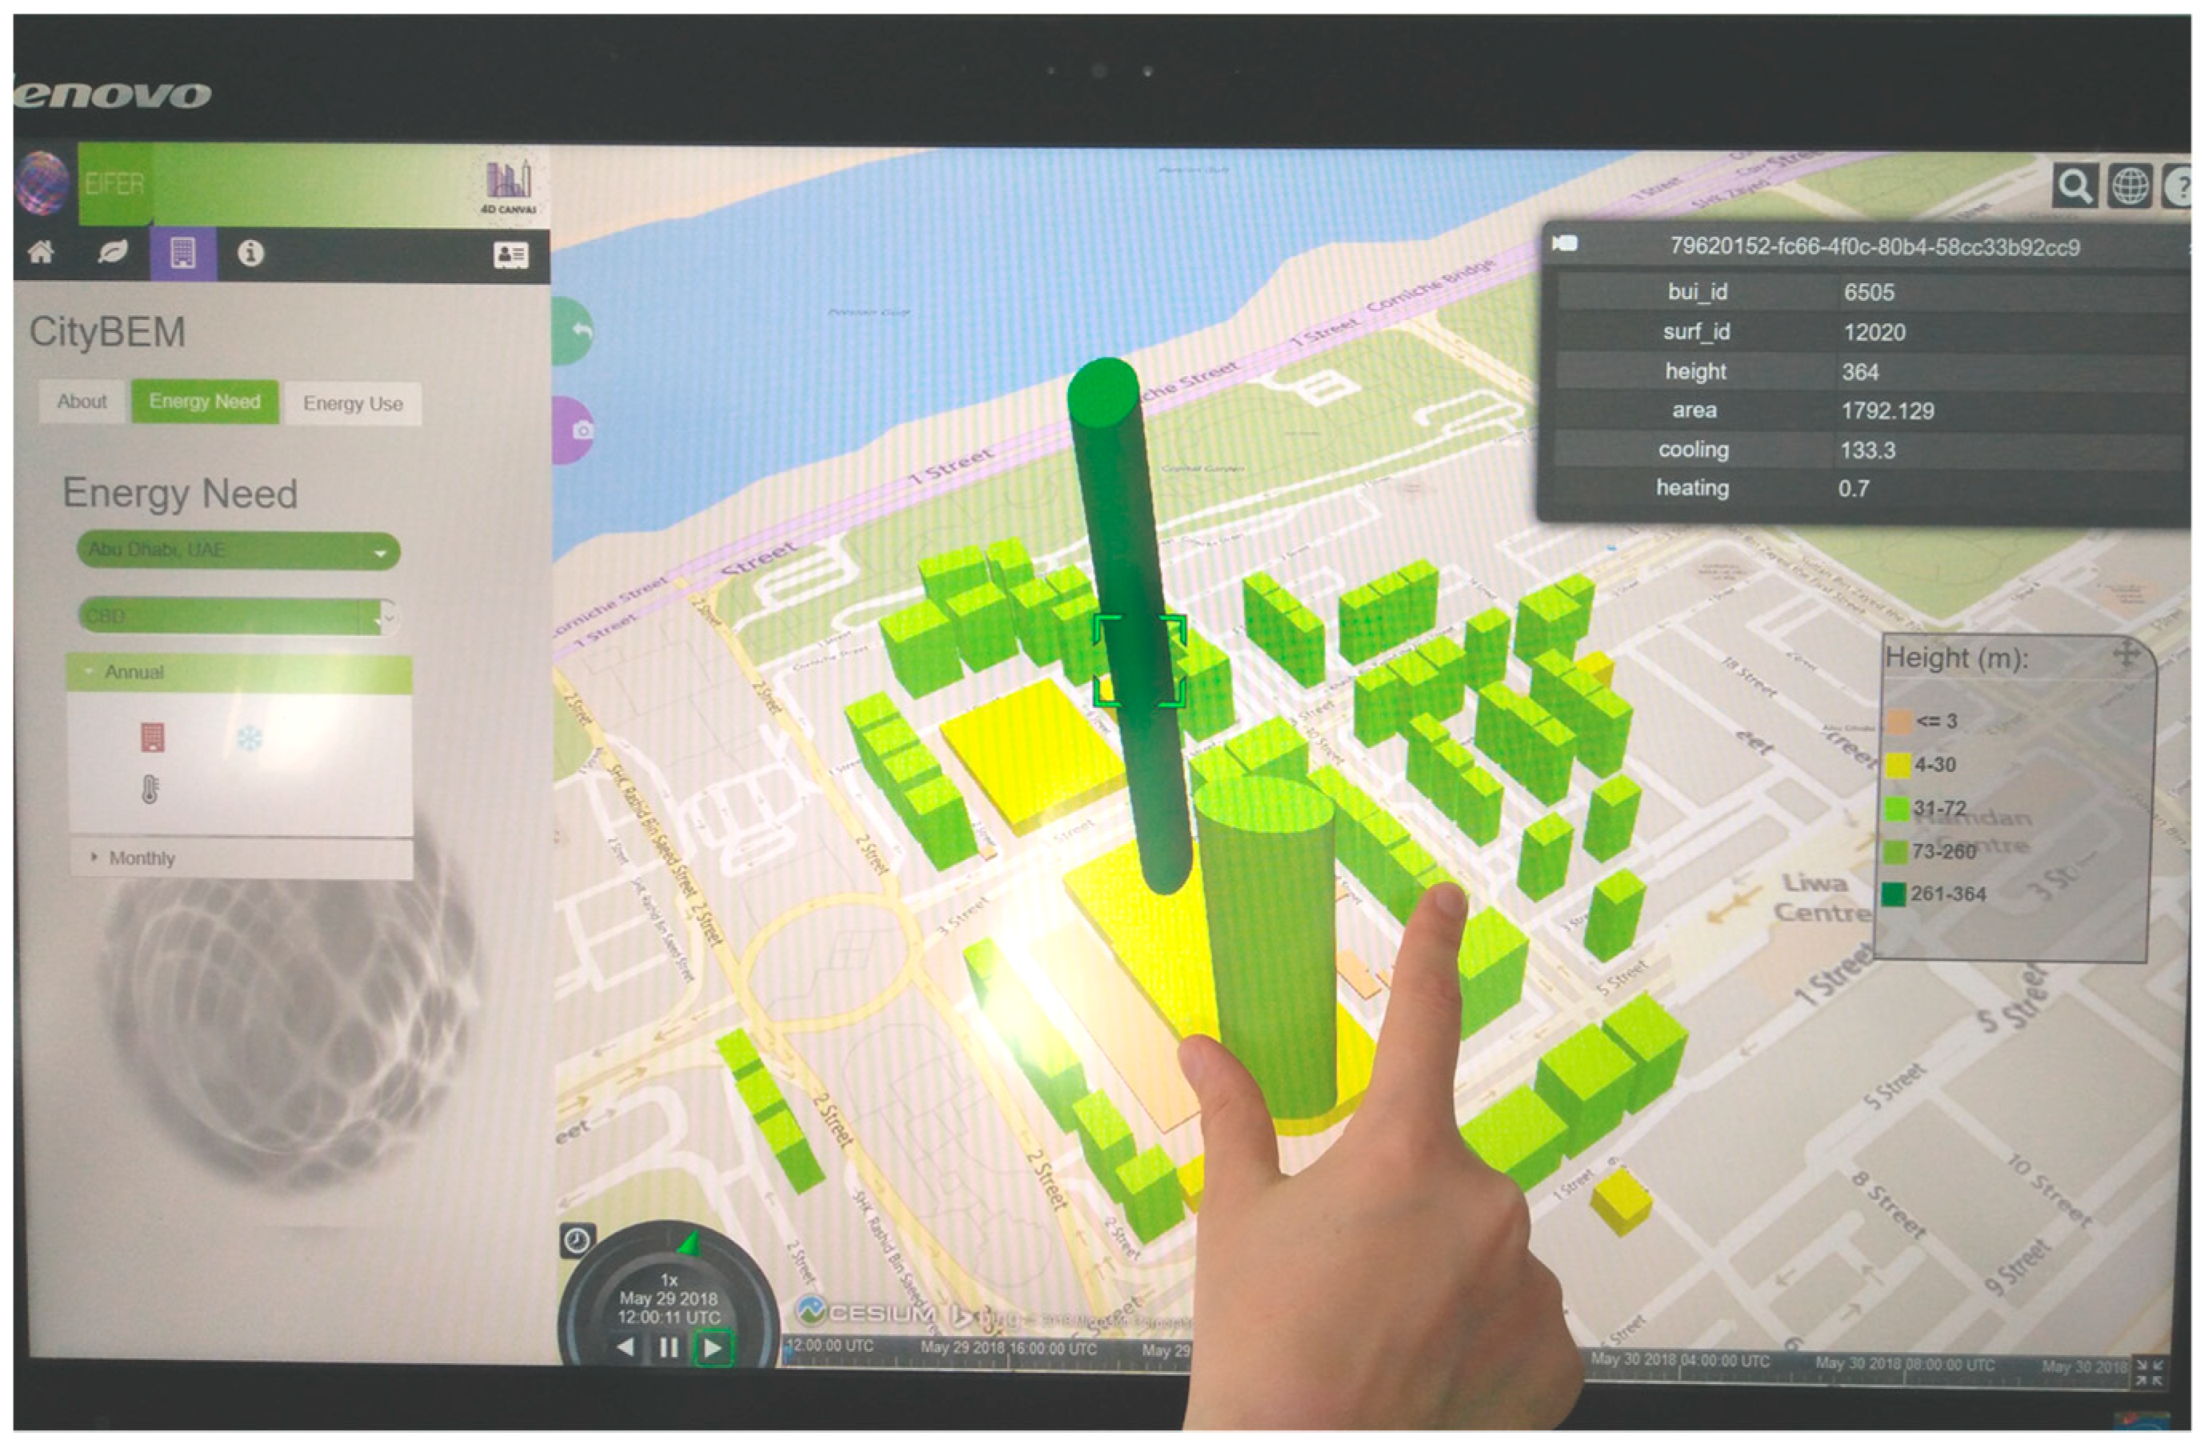
  48. Murshed, S.M.; Picard, S.; Koch, A. CityBEM: An Open Source Implementation and Validation of Monthly heating and cooling energy needs for 3D Buildings in Cities. ISPRS Ann. Photogramm. Remote Sens. Spat. Inf. Sci. 2017, IV-4/W5, 83–90. [Google Scholar] [CrossRef]
  49. HTML5. Available online: https://www.w3.org/TR/html5/ (accessed on 2 July 2018).
  50. Introducing 3D Tiles. Available online: https://cesium.com/blog/2015/08/10/introducing-3d-tiles/ (accessed on 2 July 2018).
  51. Zhu, L.; Wang, Z.; Li, Z. Representing Time-Dynamic Geospatial Objects on Virtual Globes Using CZML—Part I: Overview and Key Issues. ISPRS Int. J. Geo-Inf. 2018, 7, 21. [Google Scholar] [CrossRef]
  52. Zhu, L.; Li, Z.; Wang, Z. Representing Time-Dynamic Geospatial Objects on Virtual Globes Using CZML—Part II: Impact, Comparison, and Future Developments. ISPRS Int. J. Geo-Inf. 2018, 7, 18. [Google Scholar] [CrossRef]
  53. ISO. Energy Performance of Buildings—Calculation of Energy Use for Space Heating and Cooling; ISO 13970:2008; ISO/TC 163/SC 2 Calculation Methods: Geneva, Switzerland, 2008; p. 162. [Google Scholar]
  54. Mouse vs. Fingers as Input Device. Available online: https://www.nngroup.com/articles/mouse-vs-fingers-input-device/ (accessed on 28 May 2018).
  55. CesiumJS Feature Checklist. Available online: https://cesiumjs.org/features/ (accessed on 20 June 2018).
  56. Data-Curtains. Available online: http://nasa-gibs.github.io/data-curtains/ (accessed on 20 June 2018).
  57. Brewer, C.A.; Pickle, L. Evaluation of methods for classifying epidemiological data on choropleth maps in series. Ann. Assoc. Am. Geogr. 2002, 92, 662–681. [Google Scholar] [CrossRef]
  58. Peterson, M.P. Interactive cartographic animation. Cartogr. Geogr. Inf. Syst. 1993, 20, 40–44. [Google Scholar] [CrossRef]
  59. Song, Y.; Wang, X.; Tan, Y.; Wu, P.; Sutrisna, M.; Cheng, J.C.; Hampson, K. Trends and Opportunities of BIM-GIS Integration in the Architecture, Engineering and Construction Industry: A Review from a Spatio-Temporal Statistical Perspective. ISPRS Int. J. Geo-Inf. 2017, 6, 397. [Google Scholar] [CrossRef]
  60. The Next Generation of 3D Tiles. Available online: https://cesium.com/blog/2017/07/12/the-next-generation-of-3d-tiles/ (accessed on 30 June 2018).
  61. Integrate Cesium 3D Tiles Using FME. Available online: https://www.safe.com/integrate/cesium-3d-tiles (accessed on 30 June 2018).
  62. Batched 3D Model. Available online: https://github.com/AnalyticalGraphicsInc/3d-tiles/tree/master/TileFormats/Batched3DModel (accessed on 3 July 2018).
Figure 1. Four level of details in the CityGML data model [9].
Ijgi 07 00276 g001
Figure 2. Proposed system architecture for the dynamic 4D interface.
Ijgi 07 00276 g002
Figure 3. Use of different data formats for visualizing 3D spatial and temporal data in Cesium.
Ijgi 07 00276 g003
Figure 4. The graphical user interface of the first page of the 4D CANVAS application.
Ijgi 07 00276 g004
Figure 5. The web interface of the 4D CANVAS application displaying annual irradiance on different buildings surfaces and other attributes of a selected building.
Ijgi 07 00276 g005
Figure 6. The web interface of the 4D CANVAS application: displaying daily cooling energy need on different buildings in the City Karlsruhe.
Ijgi 07 00276 g006
Figure 7. Multi-touch capabilities of the 4D CANVAS application demonstrated in a Tablet.
Ijgi 07 00276 g007
Figure 8. Review of geospatial and time dynamic visualization capabilities of GeoJSON, 3D Tiles and CZML formats in LOD1 and LOD2 buildings.
Ijgi 07 00276 g008
Figure 9. Dynamic visualization of hourly data in bar charts.
Ijgi 07 00276 g009
Figure 10. On-the-fly data conversion from the PostgreSQL database to JSON, GeoJSON, CZML and 3D tiles.
Ijgi 07 00276 g010
Figure 11. Example of the complex structure of 3D Tiles data format.
Ijgi 07 00276 g011
Table 1. Technologies, software and data formats deployed in developing the application.
CategorySub-CategoryPurpose of Use
Script languagesPython (interpreter Python 3.3)Used for writing scripts to structure and extract data from the energy database. Python scripts also automatize the data exportation in different formats such as JSON, CZML, etc.
HTML5The markup code for displaying pages on the web browser.
CSSA method used to add styles to the HTML page.
JavaScriptUsed to program how the webpage behaves by adding actions and listening to events.
Libraries/APICesium.js 1.45Cesium is the main library on which the 3D interface is built on.
AmCharts 4Utilized for creating and displaying interactive charts.
JQuery UI 1.12.1Facilitates UI interactions with widgets and functionalities.
JQuery Touch PunchThis library enables JQuery UI to be implemented on multi-touch screens.
GeoStats 1.5.0A JavaScript library that allows data classification using different methods such as natural breaks and equal intervals.
Software3D City Database Importer/ExporterA Java-based front-end that allows importing CityGML data to the database.
pgAdmin IIIUsed for viewing the database tables.
Eclipse Oxygen.2A programming environment used for Python coding with PyDev extension.
Brackets 1.12A programming environment used for HTML, CSS, and JavaScript coding.
FMEUsed to facilitate the conversion from GeoJSON to Cesium 3D Tiles.
Data formatsCityGMLThe data format imported into the database for implementing energy simulations.
JSONThe format used for the graphics created by AmCharts.
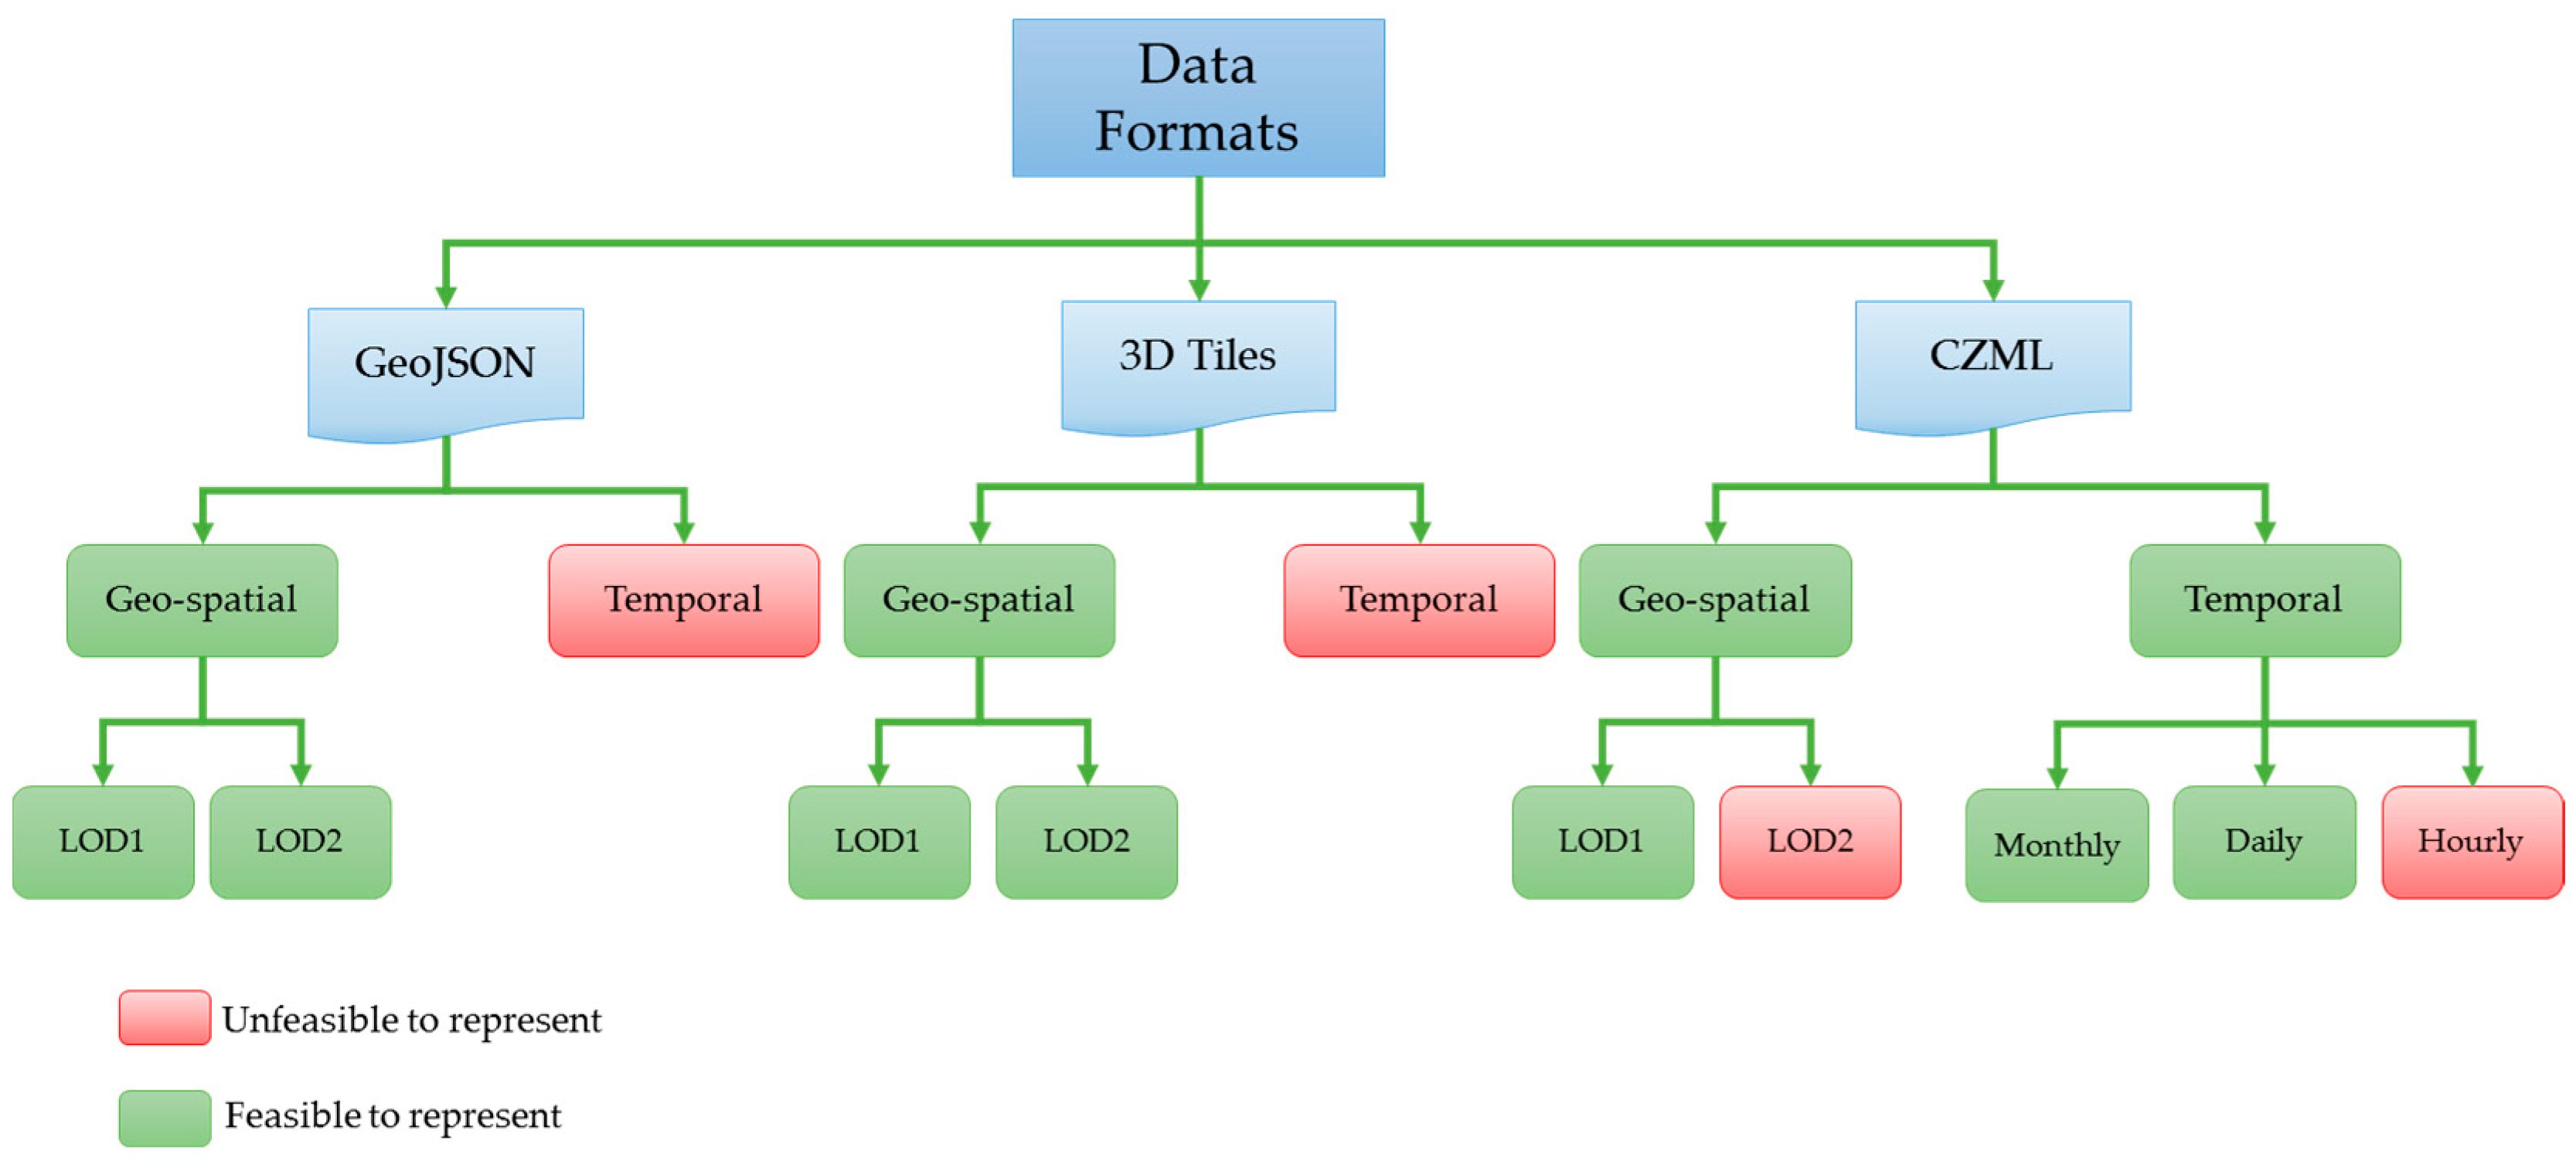
GeoJSONUsed to visualize static geospatial data of LOD1 and LOD2.
CZMLUsed to visualize spatiotemporal data of LOD1.
Cesium 3D TilesUsed to visualize huge geospatial datasets with LOD2.
Table 2. Visualization and functional capabilities of different data formats.
VisualizationFunctional Capabilities
Data FormatsGeospatial (2D/3D)TemporalData RepresentationSuitability in 4D CANVASComplexity LevelLevel of Detail Support
JSONNoNoCharts representing attributesYesSimpleN/A
GeoJSONYesNoThematic building surfacesYesSimpleLOD2
CZMLYesYesThematic building as a wholeYesModerateLOD1
3D TilesYesNoThematic building surfacesYesVery ComplexLOD2
Table 3. Visualization and functional capabilities of different data formats.
City (LODx, Number of Surfaces)PLANTING Outputs and Temporal ResolutionsCityBEM Outputs and Temporal Resolutions
Kuwait (LOD1, 25,364)
  • Solar irradiance
  • Energy production
  • Installed power
  • Producible
  • Levelized Cost of Electricity (LCOE)
  • Capital Expenditure (CAPEX)
Hourly, Daily, Monthly, Annual
  • Heating energy need
  • Heating energy use
  • Cooling energy need
  • Cooling energy use
Hourly, Daily, Monthly, Annual
Abu Dhabi (LOD1, 30,588)
Hong Kong (LOD1, 31,744)
Lyon (LOD2, 53,983)
Karlsruhe (LOD2, 60,000)

