Article

Trends in Citizen-Generated and Collaborative Urban Infrastructure Feedback Data: Toward Citizen-Oriented Infrastructure Management in Japan

by
Toshikazu Seto
1,* and
Yoshihide Sekimoto
2
1
Center for Spatial Information Science, The University of Tokyo, Tokyo 153-8505, Japan
2
Institute of Industrial Science, The University of Tokyo, Tokyo 153-8505, Japan
*
Author to whom correspondence should be addressed.
ISPRS Int. J. Geo-Inf. 2019, 8(3), 115; https://doi.org/10.3390/ijgi8030115
Submission received: 31 December 2018 / Revised: 14 February 2019 / Accepted: 23 February 2019 / Published: 28 February 2019

Abstract

:
Infrastructure management has become a serious problem in many cities. However, the monitoring of daily urban infrastructure requires active feedback, not only by municipal government officers, but also by citizens. In this study, we analyzed Chiba City’s ‘Chiba-repo’ platform to measure citizen feedback and collaboration in urban infrastructure maintenance. We compiled data on over 40,000 citizen-generated reports of infrastructure issues during the period from September 2014 to December 2016 through the Chiba-repo platform and analyzed the geographical distribution and text mining by categorizing the reports. The most frequent report was about road issues, representing 93.8% of the total. As a result, many reports were received from citizens from a time-consuming report like light repairs (average 24.4 days); also, road issues were revealed to be a major town problem. On the other hand, the unsolved issue rate is lower (3.7%) compared with telephone correspondence and counter contact, since posting through the web application allows for a detailed report that includes position information and photographs. The research also predicted that many infrastructure problems would occur on narrow roads and in areas with many elderly people, and that road issue reports are regularly needed in areas that cannot be found or patrolled by administrative staff.

1. Introduction

In recent years, combining various sensors of the ‘Internet of Things’ (IoT), information communication technology (ICT), and the management of energy and living infrastructure has made it possible for governments and organizations to improve citizens’ quality of life, improve the efficiency of urban operations and services, and increase the competitiveness of cities. The model of the ‘smart city’ is drawing attention as a city that satisfies economic, social, and environmental requirements, and realizes efficient management mainly through the use of ICT/IoT technology [1,2,3] to collect and analyze real-time information [4] from both administrators and citizens.
At the same time, the open public data movement has recently attracted worldwide attention from government agencies and international organizations, such as the United Nations, the Organization for Economic Cooperation and Development (OECD), and the World Bank. In June 2013, the United Kingdom Cabinet promulgated the Open Data Charter during the G8 Lough Erne Summit [5], which promotes geospatial and social infrastructure as a high-value dataset, emphasizing the significance of such data in promoting citizen participation and creating an open local government [6,7,8]. Widespread use of public sector data on the Internet indicates that there is a movement toward distributing such datasets for use by the public and private sectors [9,10].
As a background to this current situation, citizen-oriented feedback using maps has also been seen in participatory geographic information systems (PGIS), which have been studied since the 1990s [11]. Schuurman [12] declared criticism of GIS to be organized in three periods; the technology adopted a subtler analysis and expressed a great commitment to geography. Pánek [13] pointed out the progress of Internet technology, where users were able to overcome the technical gap and become “neocartographers” without requiring knowledge of GIS, considering the democratization of maps and geospatial information. By doing so, new possibilities in citizen participation have emerged.
In particular, according to Elwood et al. [14], citizens interacting via geographic information should be discussed as a kind of social practice and social process paradigm. On the other hand, although past PGIS research has been based on case studies, it has been debated that it is also necessary to evaluate it empirically and quantify its effectiveness [15].
Furthermore, geographical information sharing by crowdsourcing has occurred in various social phenomena in recent years; this provides not only a quantitative understanding according to the concept of volunteer geographic information (VGI), but also a geographical context awareness of how data is systematically studied [16,17]. A major feature of VGI activities is that participants actively collect geographical information by crowdsourcing and use it for public benefit. However, it is important to understand the context of the collected data and the interest of the participants [14]. On the other hand, in the field of social practice, ICT-based non-experts and citizens, as well as experts, have collaborated, and mechanisms have been studied concerning methodological solutions for regional problem solving [18].
Regarding the citizen feedback architecture, Lee [19] points out that applications, such as FixMyStreet and SeeClickFix, have taken advantage of these trends, allowing citizens to post from their smartphones and mobile devices worldwide. Open 311, for example, is a standard that includes an open application programming interface (API), and has been introduced in various places around the world including Chicago and New York, but can also be applied to citizens’ reporting applications. Xu et al. [20] revealed the demand forecast by spatiotemporal kernel analysis at the community area level using 311 data. However, as the only method of reporting used was Open 311, analysis by category was excluded. Open 311 accumulates urban issues raised by citizens, and their correspondence histories can be made machine readable. In addition, anyone can use these as data in various applications, ensuring transparency to citizens.
Several studies using Open 311 have also been published. Offenhuber [21] analyzed trends in and geographical distribution of multiple posting applications in Boston, including research specializing in citizen reports, and discussed the design of the feedback system. This paper outlines posting status in various applications in units of zip code and analyzes data according to the type of report and the number of days of response. Offenhuber also compared the design of the feedback system and investigated user motivation. Likewise, Lu and Johnson [22] examined the geographical features and hot spots of 311 services in Edmonton City using about 170,000 records of citizen-reporting data. Based on this statistical data, their paper analyzes the geographical distribution of requests by 1-km grid cell units and the coefficients of the population and the social attributes of the area based on statistical data. However, they did not analyze the spatial distribution of the report content in detail. Furthermore, Zha and Veloso challenged factor analysis and prediction using Open 311 data in New York City, and multiple regional statistical data [23]; however, spatial analysis on the location information of posts has not been done, and the relationship of report content with the geographical context of the area has not been clarified.
Based on the above reviews, it is necessary to clarify the geographical context of feedback by citizens on urban infrastructure problems to understand the responsiveness of municipal staff and to examine the possibility of collaboration with citizens. This study conducted a context-based analysis of "citizen-generated and collaborative urban infrastructure feedback data" to clarify the geographical relevance and trends of participants. It also analyzed citizen-oriented feedback involving a wide range of citizens in the community and several digital collection methods acceptable to them to investigate local government’s contributions to infrastructure management. The next section covers the issues affecting the role of citizen-oriented feedback in infrastructure management and introduces the research project in Chiba. The results of the analysis are reported in Section 3. Following the discussion, we suggest that when there are few citizen submissions concerning a particular issue, citizen participation is clearly encouraged by self-resolution and thematically based positive reports.

2. Research Background

2.1. Contextual Issues

In Japan, many cities are struggling with how to adapt their urban infrastructure management in the age of open data. In addition, the many departments involved in the management of urban infrastructure in Japan further complicate the process. Consequently, the system cannot be handled through web applications alone [24]. When considering how best to incorporate smart technologies into city management, the process must also consider new procedures, such as how to handle posts after they have been accepted. As Japan is experiencing a decline in population, it must also recognize the government’s limited capacity for infrastructure inspection and management. Current information technology (IT) developments have allowed Japan to partially solve this problem by encouraging city residents to participate in monitoring infrastructure and engaging in minor repairs. In this study, we analyzed the citizen feedback and monitoring of urban infrastructure using ‘Chiba-repo’ [25] in Chiba City, Japan (Figure 1).

2.2. Research Area, Data, and Method

Chiba City has a population of approximately 970,000, and is one of the large cities near Tokyo (Figure 2) that is progressively working for ‘open government’ in Japan, a goal that not even the country’s larger cities have pursued. In addition, the culture of citizen collaboration has moderately taken root, and Chiba City is one municipality that has introduced the feedback and reporting system from participating citizens as quickly as possible. The purpose of this research was to measure the impact of such citizen feedback and collaboration on urban infrastructure maintenance.
Based on an analysis of over 40,000 online posts, we determined the content, the time it took to respond to issues, and patterns of usage in order to collect participatory feedback regarding roads, park and minor issues beyond the scope of duty of administrative staff. Our hypothesis is that feedback from citizens gathered from reports made through a smartphone app and website will provide the information that is most essential for maintenance and will contribute to improvements in the efficiency of administrative repairs. Additionally, we expected a geographical effect with many postings around busy railway stations where many people pass through, which will aid administrative staff patrols.
This study examined citizen participation in Chiba City, Japan, specifically through the cooperative Chiba-repo platform, to ascertain its current implementation and determine future improvements to the operation of a cooperative online posting system. The population of geographical distribution of Chiba City from the 2015 population census of Japan [26] is shown in Figure 3a. Chiba Station (green marker) is a terminal station used by approximately 100,000 people per day. This station is also located in Chiba City center, near the peripheral Chiba Station area, which has a high average population density. In addition, the proportion of elderly people aged 65 years or older was about 25.3% in the 2015 census. This number is not as high as in a city such as Tokyo; however, Figure 3b shows that the elderly population is concentrated in the Wakaba and Midori Ward areas, the north of Hanamigawa Ward, and the center of Mihama Ward. This is especially true of Wakaba Ward area and north of Hanamigawa Ward, where elderly residents encounter difficulties in accessing the railway stations.
In 2012, Chiba was one of the first cities in Japan to start using FixMyStreet as part of a Japan Open Government municipality initiative [27]. The citizens of Chiba City are predominantly young people who work in Tokyo who have no problems with accessing the FixMyStreet system via their smartphones. However, the many departments in the administrative system meant that resolving a report was complex and could take several months. In addition, the issue reports were not stored together in a database with information about the person filing the report, making it hard to respond effectively. As responsibility was divided among several municipal departments, there was no mechanism for each section to share information with the others. In addition, correspondence with citizens directly requested by telephone and by counter contact was not necessarily included in the database, and the relationship with the town infrastructure data could not be read from those data.
Due to these flaws, this system could not address infrastructure management solely with the flow of citizen reporting. To fix this problem, Chiba City developed and launched a full-scale operation with the intention of integrating it with a road management customer relationship management (CRM) system. This system could clarify the management of resources using tools such as a correspondence log and staff allocation; it was groundbreaking because administrative operations had not been previously recorded using digital media. Figure 4 shows how a cloud system was used to build this central database, called the ‘Chiba-repo’ platform, and could integrally manage postings from newly developed smartphone applications and a website to monitor process progress. Users of Chiba-repo could download smartphone applications or connect to web pages and grasp a summary of the posts. Users could also make posts from both channels by acquiring a personal account and posting primary information in a combination of text, picture, location information, and posting category. Unlike the Open311 series of existing research, reports posted by citizens are never released immediately after posting. The administrative staff confirms the contents of the report and checks for obvious mistakes, so the reliability of the reporting data is high. Next, administrative staff provides feedback to each report in the webpage; and, depending on the situation, immediately sends the information out to the city officer’s patrol, makes the needed repairs, and updates the result to Chiba-repo. Another major feature of Chiba-repo is that the telephone, counter contact, and paper-based city officer’s patrol information are converted into digital data as much as possible and integrated into the Chiba-repo platform.
Chiba-repo is a cloud-based platform (now supported by Salesforce). It began operation in September 2014 and includes a smartphone application and graphical interface that allows users to make posts both online and through the app, in addition to providing them with direct access to city offices by telephone. Testing for the program was carried out from July to November 2013 and involved the participation of 850 citizens. Full operation commenced in September 2014, when Chiba-repo began functioning as a CRM, integrating information not only from web-based reporting, but also from conventional municipal patrols and citizen telephone and fax reporting. Overall, by the end of December 2016, 4300 citizens had registered with Chiba-repo.
In this study, we analyzed the 41,067 records of citizen report data accumulated from September 2014 to December 2016. We determined their processing history, whether they were open data, and how they were shared between multiple departments and a civil engineering office. In the following sections, we analyze three major points. First, we addressed the overall characteristics of Chiba-repo’s reporting data, including a quantitative analysis of the transition period, posting category, and the time period during which information about the issue was posted. We also analyzed the kernel density estimation analysis and spatial hotspot analysis for 250 m grid cells from the reporting position information of all road issue reports using the Getis-Ord Gi* method. The reason for performing spatial analysis based on 250 m grid cells is for the ease in comparing with population statistical data as represented in Figure 3.
In particular, the Getis-Ord method not only considers feature density, but also some attributes in Gi* statics (Z score), because it is suitable for comprehensively estimating spatial hot spots [28].
Second, we sought to comprehensively complement the spatial features by analyzing the contribution itself qualitatively. For this analysis, we created a co-occurrence network visualization of the relevant data using KH Coder, a free Japanese text mining software [29,30] that is commonly used to analyze open responses in questionnaires and to clarify the relationship between phrases [31]. The advantage of using this method is that we can understand the characteristics of spatially represented citizen feedback in detail from the text data.
Third, we analyze the repair time and road characteristics from the posting of citizen-oriented road issues reporting data. This analysis is necessary to verify whether citizen feedback can be dealt with appropriately by utilizing the local government’s daily resources and workforce. In this research, it is characterized by a citizen’s own problem-solving activity also posted as citizen feedback data, so we analyze these data and discuss the possibilities and challenges of citizen feedback.

3. Characteristics of the Citizen-Oriented Feedback by Chiba-Repo

The breakdown of data is as follows: 41,067 total records of report data, including 6101 from the app and website reporting, 587 through email, 20,071 by telephone, 3182 by counter contact or related organizations’ requests, and 11,126 from municipal patrols. The reporting data, excluding that from the app and website, are paper-based, so municipal staff manually imported the information into Chiba-repo’s database. This data was recorded in Chiba-repo’s database from 1 September 2014 to 31 December 2016. Figure 5 is a histogram of the number of posts by contributors of the age group who used app and website reporting (N = 6101). The number of contributors who posted during the period was 1005 users. The figure clearly shows that the contributors in their 50s (339 users) were the most frequent, followed by those in their 60s (230 users) and 40s (204 users); there were also many posts by the senior (over 50s) generations (696 users). Additionally, since 496 people posted only once and 20 people posted 100 times or more, the total number of contributors was divided into heavy users and light users.
Figure 6 breaks down the report categories: approximately 91% (37,993) concerned roads, and about 3% (1285) concerned minor issues such as park environment and garbage collection. The remaining 5% (1789) were type of ‘citizen collaboration reports’ involved some form of collaboration where citizens worked together to solve regional problems. Among the relatively large cities in Japan, garbage collection also affects the landscape. Therefore, it is thought that the reports concerning garbage collection have few properties because these issues are settled immediately before problems are reported. On the other hand, there are numerous reports on road damage, and in the case of roads that are heavily traveled on a daily basis, the repair of these areas is given preference.
Figure 7 shows how the reporting shifted from the beginning of the operation in September 2014 to December 2016. During these two years, data previously managed by multiple departments, including administrative patrols and requests from local organizations, were unified in the system. For the three months immediately after the introduction of the system, more than 20% of the application was seen. This demonstrates that while the number of postings per month has only increased slightly since 2014, the proportion of app and website posts remained around 20% (the exception is July 2016, where this percentage increased to almost 60%, due in part to a promotion of ‘theme reporting’). This concept of theme reporting was devised by the administration and made it easy to post a report based on a simple theme: to clarify the infrastructure issue to be addressed and to delimit the period in which it was to be carried out. For example, assessment of damage to curved mirrors and checking of light bulbs on street lights. These data, including location information, were not exhaustively used, and the citizen’s check worked effectively. In the citizen feedback system centered on Chiba-repo, unfamiliar citizens were hesitant to use it if they did not know what to post. However, the introduction of theme reporting clarified that setting a simple posting style based on a certain theme lowered participation hurdles.
Figure 8 organizes the data according to the time of day they were posted, and indicates that more posts were made at night. City hall patrols occurred mainly at the same time as citizen contributions: in the morning (6:00–7:00 a.m.) and evening (6:00–7:00 p.m.). This may be because these periods fall outside of working hours for office and city workers. In addition, if citizens noticed something during the day while they were moving around the city for work or school, they were more likely to use the app or web form or fill out a non-emergency report using resources such as Open 311. If people noticed that something was abnormal at night, it was more likely to be considered an urgent case, and they were more likely to make contact via the counter at the relevant department.
As mentioned above, many basic workers posting via Chiba-repo’s web system were office workers in their 40s to 60s. Moreover, although the total number of people using the app and website was small, the reports showed clearly that it covered the commuting time period from afternoon to night. However, it was also revealed that the active use of the web system, which was the core part of Chiba-repo, was the main collaborative event in the early four months of the Chiba-repo activity promotion event in July 2016.

4. Spatial Pattern Analysis Based on Reports of Road Damage Issues

This section analyzes the spatial distribution of posts related to road issues, the most frequently reported issues. Figure 9 illustrates the kernel density of the report locations by report type. Unit indicates the estimated number of reports each posting channel (bandwidth 250 m). The number of app, website, and email reports was particularly large in the central Chiba Station district, especially around the railway station; this area is where many young people live. In contrast, telephone reports were often received from areas with a high population density such as the Chiba City station or along the monorail. In addition, areas where there are many methods used for contacting officials about reports are also common to areas where the aging of Hanamigawa and Mihama Ward is advancing. The five maps in Figure 9 demonstrate that there was also a concentration of reports around Chiba Station. Thus, by utilizing a variety of channels, it is possible to cover a wide geographic area using Chiba-repo. Although there are now effective city patrols in more remote locations, the contribution of citizen-led methods is clear. As a means of showing these features, the spatial correlation for each report method was compared with Moran’s I and z-value (Table 1). According to this, it can be said that ‘App. & Web’ and ‘Patrol’ have the highest spatial correlation.
Each feedback method is biased in terms of the number of the reports, but due to the difference in feedback methods, the spatial features where certain issues were concentrated could be revealed. Figure 10 shows the tendency of the number of reports per 250 m grid cell using the Getis-Ord Gi* statistical method of spatial hotspot analysis [28]. This analysis weights the reported location information and the population within the 250 m grid cells around the reported area to detect statistically dominant hot-spots and cold-spots. By using the Getis-Ord Gi* statistical method, it is possible to spatially understand the characteristics of the report considering the residential population in the regions. This figure indicates a high prevalence of reporting from the railway station in Chiba City within a roughly 1–2 km radius, or within 20 minutes’ walking distance. The two stations, Oyumino and Toke, in Midori Ward are located in the ‘new town’ that has developed since the 1980s. Since this area has been planned for more than 40 years since its inception, and as residents are also aging, infrastructure damage is expected to progressively increase in the future; as a precursor, reports of problems have been made by email and patrols. Likewise, an analysis of the number of posts shows that there about 1100 bus stops in Chiba City, bus stops with many posts were similarly close to Chiba station, Oyumino station, and Toke station area.

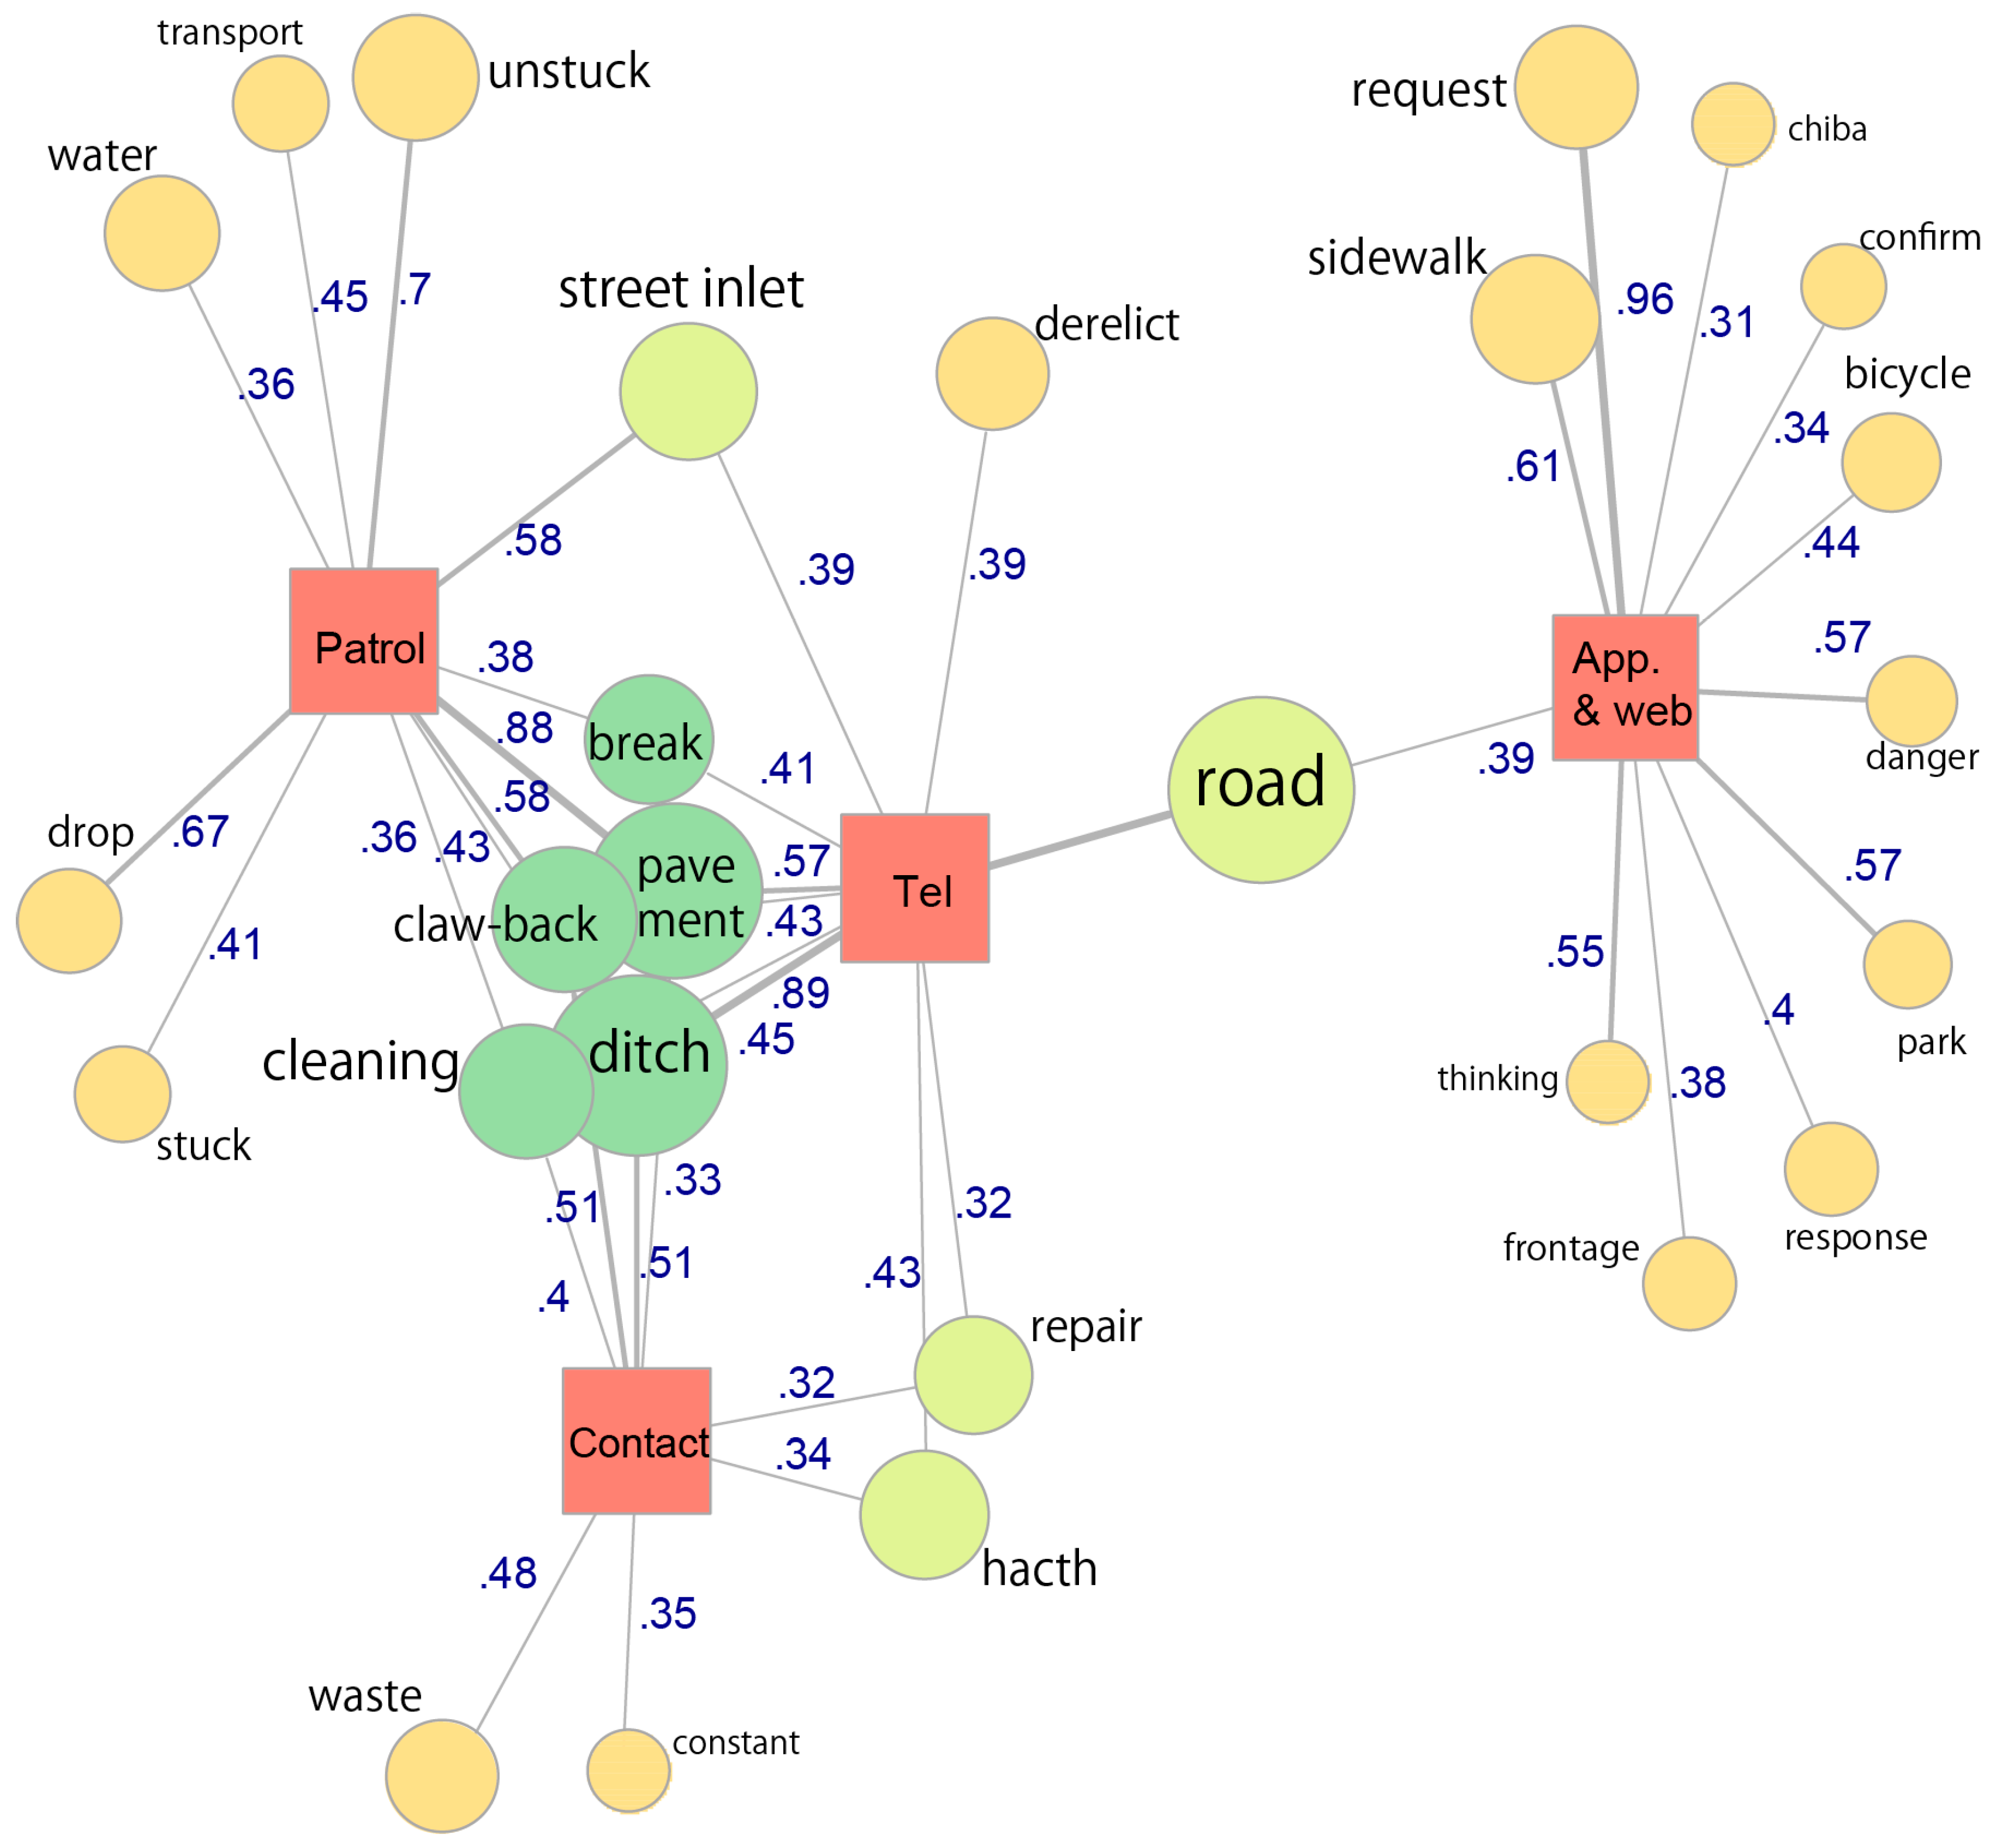
5. Text Mining Analysis using Keywords of Citizen-Generated Reporting Data

It is also important to note that many of the posts regarding the same road differed in terms of the specific complaint. While they all addressed road damage, some pointed out specific issues, such as the condition of side gutters and/or incidental equipment. Therefore, we also used a qualitative analysis approach to analyze road-related posts using KH Coder (Figure 11). The data used here were based on text data with a Japanese morphological analysis engine (MeCab) using issues (N = 41,067) first posted by citizens on Chiba-repo. The total number of words was 491,000; typical nouns constituted about 100,000 words and independent verbs and case particles accounted for about 50,000 words. Figure 11 shows a co-occurrence network as one of the basic functions of KH Coder. The co-occurrence network analysis expresses the appearance frequency of each word for each classification and shows the relationship between words, so that the tendency of the posted sentence can be visually clarified. Since all reports were classified according to the submission method, it was possible to simultaneously consider the linkage with the word relation.
The network diagram shows all reporting data for more than 300 texts with a Jaccard index over 0.3. This index is used to measure the similarity between words in the natural language processing field, and it is thought that there is a strong relationship with 0.3 or more. While road problems were the commonality, the app and website posts presented a different trend when compared to those from the traditional methods of telephone and counter contact. App and website posts focused less on keywords, and the details of the text were not that important. A typical example is a post containing short words, such as "Road tiles are collapsed”. Rather, the most noteworthy features were the location and photographs providing details about the damage. The telephone and counter contact methods, however, relied more on verbal details. These reports took more time and included content not directly related to road damage, indicating that they may not be as useful for improving the efficiency of administrative work.

6. Response to Citizen Feedback by Local Government and Citizen-Based Problem-Solving Process

6.1. Relationship between Citizen Reports and Road Infrastructure Repair by Local Government

We next attempted to determine the time between citizens posting on Chiba-repo and actual repair. Table 2 lists the 10 most frequently reported road issues and aggregates the average number of days from post to repair (N = 37,993 records). The most average time-consuming issue was light repairs (average 24.4 days); this included not only changing bulbs, but also repairing damaged streetlights. As the city was not able to fully comprehend, for example, the state of disrepair or exact position of lighting on a road, it relied on citizens to collect this information using the Chiba-repo platform. The average number of days required for repair tended to be larger for new posting channels, such as the app and website, than for traditional (telephone and counter contact) channels. However, it should be noted that there were a small number of ‘unsolved reports’; there was also a tendency that the response was not considered to be pending by the municipality. Since the issue is beyond the control of the municipality, it is necessary to hand over to the relevant organization.
Next, we compared the reporting methods with road type (Table 3) using OpenStreetMap (OSM) data since that enabled us to define road attributes in detail. We used both the location information of each report and the OSM road data to perform an analysis of the nearest neighbor joining on the GIS and compiled the road type. Reports with the most feedback were residential roads, occupying nearly half of all reports. In addition, it became clear that the average number of repair days was about 9.5. Sidewalks and motorways required more repair days. The former was considered a minor issue, because judgement was necessary to determine whether the issue should be repaired. The latter took more time to repair due to the necessary coordination with other organizations.
Through this data analysis, we were able to correlate the types of roads suitable for the ordinary report to the residential roads. We determined that the most frequently reported roads were secondary roads near municipal roads with two or more lanes. For the total by road type, it seems there was not much difference overall depending on the type of report. Also, we found that repair of sidewalks has a larger mean number of days than that of other road types. The reason for this is that urgency of repair is low because the level of damage is normally minor compared with that to large roads.

6.2. Characteristics of the Citizen-Oriented Problem-Solving Report

However, we also found that citizens may perform their own repairs alone or in cooperation with one another to fix local problems. Table 4 shows how likely citizens were to repair problems themselves. As shown in Figure 6, the number of reports on collaboration rather than on issues was overwhelmingly small when compared to the number of issue reports. The number of citizen contributors per report category was 20–80 people, or about 2–8% of all contributors. In particular, the self-resolution category (total: 374) seems to have 189 reports concerning sidewalks, which is influenced by the ease of cleaning work. Compared to many road issue posts, reports on sidewalks do not constitute a significant portion of the total number of reports; however, since it shows the same tendency as the posts about road issues (especially road type), increased citizen collaboration is expected in the future.
Many of these problems involved curved mirrors or the removal of waste on main city roads or people’s home roads. Although these approaches are not addressed in conventional Open 311 programs, it is essential to address such civil cooperation given the administrative limitations. Such direct problem-solving by citizens, therefore, is one way to address citizen-oriented repair.
This can be done through shortening the repair times in response to the app and website posts; it can also be accomplished through urging citizen participation by encouraging posts in the following categories: ‘Specific Theme’, ‘Self-resolution’, and ‘Collaboration’. The Specific Theme category intensively accepted posts based on concrete themes set by the administration. Residents used the Self-resolution category to share the results when they repaired defects themselves, and the Collaboration category shared results that solved town problems through events such as picking garbage in the park. In this way, citizens could take ownership of caring about their town.
Based on the results from this chapter, the time required for processing after receiving feedback from citizens was relatively high in posting by digital app and website tools and email. However, the report resolution rate was found to be higher for the app and website than for other means. For this reason, posting using the app and website will uncover issues about the city not recognized by traditional patrol and counter contact, and will enable the planning of repairs by digitally archiving location information and local conditions. In addition, as for the areas that the administration cannot repair quickly, it became clear that instances where citizens themselves repair their living roads and sidewalks also started to appear as shown in Section 6.2. This indicates that citizens provide not only feedback on road damage, but also possible road characteristics for collaboration. Although the number of contributors is less than that of issue reports, the types of theme reports have begun to increase since the analysis period after the analysis period of this research; moreover, it is expected that the number of contributors in the future will increase.

7. Conclusions

This research analyzed the transition to the Chiba-repo platform and the spatial characteristics of citizen postings in Chiba City, Japan. Our findings regarding how and why people use Chiba-repo have important implications for Japan’s aging society. This platform involved not only ICT devices, such as a smart phone application, but also traditional channels, such as telephone and counter contact. This makes it possible to understand how citizens have been using this technology both online and through analog means.
While our results offer meaningful findings for understanding citizen engagement in infrastructure monitoring, many of the citizens who participated were office workers who tended to cluster around public transport stations; future studies will need to engage a more diverse population. In addition, we believe that it will be possible geographically to detect areas where patrols are scarce through various feedback methods from citizens. Moreover, we believe that citizen-generated feedback data can be evaluated as a tool to support administrative circulation.
This platform does not specify the priority of each report type. On the other hand, because reports from smartphones and the website allowed for photos and locational information to be posted, even though there is less text, it is relatively easy to check the situation and respond efficiently. Location information and photographs on each problem showing the situation represent information that is hard to obtain by telephone or paper reports, and is most useful for quick situation judgment.
Although the proportion of posts from apps and the website have remained low, Chiba-repo represents the first multi-channel means of integrating digitized material, administrative staff patrols, and correspondence by counter contact, which had been managed on a paper basis thus far; many of these correspondence records have now been integrated into the Chiba-repo platform. The platform aimed to establish a workflow repair system to increase real-time reporting and further reduce response times. This was illustrated by our analysis of the spatial distribution of the posts and the relationship between posting method and road type. The platform can be used to determine the citizens’ average age and social attributes, which are important variables in encouraging their real-time involvement. However, according to the analysis of the current situation, since age bias and spatial bias of the postings can be seen, it is a constraint that a patrol plan considering these conditions is necessary. On the other hand, before the platform existed, the report data were not accumulated with the issue report time on the map; this system plays an important role in determining how the administration operates on citizen-based feedback based on the geographical distribution and condition of each problem.
This research focused on the actual interactions between citizens and administrators concerning the maintenance of infrastructure by ICT in an urban area of Japan. As shown in Figure 4 and Figure 8, in regions where aging is remarkable, there were not many postings based on the app and website, and it is understood that the problem of the digital divide has not been solved. However, there were also a certain number of users who had retired in their 60s or later. Especially given that users in their 60s submit many postings, it may be possible to expect future participation from a citizen-oriented patrol. Future research should focus on the relationship between participating citizens and the characteristics of posts, and on the “last one-mile” problem [32] faced by technocrats, such as the combination of sensors and applications to cooperative workshops for a real-time smart city; this is necessary to explore how to foster relationships between the new administration and citizens. Actually after 2016, the use of the Chiba-repo system has further increased. At the same time, not only citizens but also local businesses participate in self-resolution activities, and the diversity of citizens is expanding.
Issues for further research are as follows: (1) to analyze the differences in reports when compared to the efforts of other municipalities; (2) to integrate asset management analysis of open data reports and other infrastructure data; and (3) to simplify the automatic analytical process flow using textual and image information from the reported data.

Author Contributions

Authorship has been included and strictly limited to researchers who have substantially contributed to the reported work. T.S. wrote the paper, designed the research framework, and conducted the technical analysis for spatial analysis and visualization. Y.S. provided a critical review and suggestions that enhanced the outcome. All authors discussed the results and their implications and approved the submitted manuscript.

Funding

This research was funded by the National Institute of Information and Communications Technology (NICT), grant number 178D02.

Acknowledgments

We would like to express our gratitude to staff of Chiba City Office for their cooperation with our analysis.

Conflicts of Interest

The authors declare no conflict of interest.

References

  1. Ahlgren, B.; Hidell, M.; Ngai, E.C.H. Internet of Things for smart cities: Interoperability and open data. IEEE Internet Comput. 2012, 20, 52–56. [Google Scholar] [CrossRef]
  2. Kitchin, R.; Lauriault, T.P.; McArdle, G. (Eds.) Data and the City; Routledge: London, UK, 2017; ISBN 1-138-22263-1. [Google Scholar]
  3. Townsend, A. Smart Cities: Big Data, Civic Hackers, and the Quest for a New Utopia; W.W. Norton & Co.: New York, NY, USA, 2013; ISBN 0-393-08287-3. [Google Scholar]
  4. Kitchin, R. The real-time city? Big data and smart urbanism. GeoJournal 2014, 79, 1–14. [Google Scholar] [CrossRef]
  5. In United Kingdom Cabinet Office, G8 Open Data Charter and Technical Annex. Available online: https://www.gov.uk/government/publications/open-data-charter/g8-open-data-charter-and-technical-annex (accessed on 30 June 2018).
  6. Bates, J. The strategic importance of information policy for the contemporary neoliberal state: The case of open government data in the United Kingdom. Gov. Inf. Q. 2014, 31, 388–395. [Google Scholar] [CrossRef]
  7. Johnson, P.A.; Sieber, R.E. Motivations driving government adoption of the Geoweb. GeoJournal 2012, 77, 667–680. [Google Scholar] [CrossRef]
  8. Sieber, R.E.; Johnson, P.A. Civic open data at a crossroads: Dominant models and current challenges. Gov. Inf. Q. 2015, 32, 308–315. [Google Scholar] [CrossRef]
  9. Kitchin, R. The Data Revolution: Big Data, Open Data, Data Infrastructures & Their Consequences; SAGE Publications Ltd.: London, UK, 2014; ISBN 1-446-28748-3. [Google Scholar]
  10. Yu, H.; Robinson, D. The new ambiguity of “open government”. 59 UCLA L. Rev. Discourse 2012, 178, 1–31. Available online: https://ssrn.com/abstract=2012489 or http://dx.doi.org/10.2139/ssrn.2012489 (accessed on 30 June 2018). [CrossRef]
  11. Sieber, R. Public participation geographic information systems: A literature review and framework. Ann. Assoc. Am. Geogr. 2006, 96, 491–507. [Google Scholar] [CrossRef]
  12. Schuurman, N. Trouble in the heartland: GIS and its critics in the 1990s. Prog. Hum. Geogr. 2000, 24, 569–590. [Google Scholar] [CrossRef] [Green Version]
  13. Pánek, J. From mental maps to GeoParticipation. Cartogr. J. 2016, 53, 300–307. [Google Scholar] [CrossRef]
  14. Elwood, S.; Goodchild, M.F.; Sui, D.Z. Researching volunteered geographic information: Spatial data, geographic research, and new social practice. Ann. Assoc. Am. Geogr. 2012, 102, 571–590. [Google Scholar] [CrossRef]
  15. Brown, G.; Kytta, M. Key issues and research priorities for public participation GIS (PPGIS): A synthesis based on empirical research. Appl. Geogr. 2014, 46, 122–136. [Google Scholar] [CrossRef]
  16. Sui, D.Z.; Elwood, S.; Goodchild, M.F. (Eds.) Crowdsourcing Geographic Knowledge: Volunteered Geographic Information (VGI) in Theory and Practice; Springer: New York, NY, USA, 2014; ISBN 9-400-79826-1. [Google Scholar]
  17. Goodchild, M.F. Citizens as Sensors: The World of Volunteered Geography. GeoJournal 2007, 69, 211–221. [Google Scholar] [CrossRef]
  18. Goldstein, B.; Dyson, L.; Nemani, A. (Eds.) Beyond Transparency: Open Data and the Future of Civic Innovation; Code for America Press: San Francisco, CA, USA, 2013; ISBN 0-615-88908-5. [Google Scholar]
  19. Lee, M.; Almirall, E.; Wareham, J. Open data and civic apps: First-generation failures, second-generation improvements. Commun. ACM 2016, 59, 82–89. [Google Scholar] [CrossRef]
  20. Xu, L.; Kwan, M.P.; McLafferty, S.; Wang, S. Predicting demand for 311 non-emergency municipal services: An adaptive space-time kernel approach. Appl. Geogr. 2017, 89, 133–141. [Google Scholar] [CrossRef]
  21. Offenhuber, D. Infrastructure legibility: A comparative analysis of Open311-based citizen feedback systems. Camb. J. Reg. Econ. Soc. 2014, 8, 93–112. [Google Scholar] [CrossRef]
  22. Lu, Q.; Johnson, P.A. Characterizing new channels of communication: A case study of municipal 311 requests in Edmonton, Canada. Urban Plan. 2016, 1, 18–31. [Google Scholar] [CrossRef]
  23. Zha, Y.; Veloso, M. Profiling and Prediction of Non-Emergency Calls in New York City. In Proceedings of the AAAI 2014 Workshop on Semantic Cities: Beyond Open Data to Models, Standards and Reasoning, Québec City, QC, Canada, 28 July 2014; pp. 41–47. [Google Scholar]
  24. Seto, T.; Sekimoto, Y. Comparing the distribution of open geospatial information between the cities of Japan and other countries. CUPUM (Comput. Urban Plan. Urban Manag.) Conf. Pap. 2015, 14, 1–14. [Google Scholar]
  25. Chiba-Repo Website. Available online: https://chibarepo.secure.force.com/ (accessed on 8 September 2018).
  26. 2015 Population Census by Statistics Bureau, Ministry of Internal Affairs and Communications of Japan. Available online: http://www.stat.go.jp/english/data/kokusei/index.html (accessed on 8 September 2018).
  27. Matsushima, R. Improvement of regional issues by citizen participation: The case of Chiba-repo. Area Dev. Res. 2017, 620, 45–51. [Google Scholar]
  28. Lu, P.; Casagli, N.; Catani, F.; Tofani, V. Persistent scatterers interferometry hotspot and cluster analysis (PSI-HCA) for detection of extremely slow-moving landslides. Int. J. Remote Sens. 2011, 33, 466–489. [Google Scholar] [CrossRef]
  29. Higuchi, K. A two-step approach to quantitative content analysis: KH coder tutorial using Anne of Green Gables (Part I). Ritsumeikan Soc. Sci. Rev. 2016, 52, 77–91. [Google Scholar]
  30. Higuchi, K. A two-step approach to quantitative content analysis: KH coder tutorial using Anne of Green Gables (Part II). Ritsumeikan Soc. Sci. Rev. 2017, 53, 137–147. [Google Scholar]
  31. Danowski, J.A. Network analysis of message content. In Progress in Communication Sciences; Richards, W.D., Jr., Barnett, G.A., Eds.; ABC-CLIO, LLC.: Santa Barbara, CA, USA, 1993; Volume XII, ISBN 978-1-56750-068-4. [Google Scholar]
  32. Kitchin, R.; Coletta, C.; Evans, L.; Heaphy, L.; MacDonncha, D. Smart cities, urban technocrats, epistemic communities, advocacy coalitions and the ‘last mile’ problem. IT Inf. Technol. 2016, 59, 275–284. [Google Scholar]
Figure 1. The web interface of Chiba-repo. Image source: https://chibarepo.secure.force.com/.
Ijgi 08 00115 g001
Figure 2. Chiba City study area.
Ijgi 08 00115 g002
Figure 3. Chiba City (a) total population density distribution and (b) population density distribution of people over 65 years old, 250 m grid cells.
Ijgi 08 00115 g003
Figure 4. Basic framework of Chiba-repo platform.
Ijgi 08 00115 g004
Figure 5. The generational distribution of contributors to Chiba-repo.
Ijgi 08 00115 g005
Figure 6. The reporting types of the Chiba-repo platform (N = 41,067 reports).
Ijgi 08 00115 g006
Figure 7. Shifts in Chiba-repo reporting methods over time.
Ijgi 08 00115 g007
Figure 8. Hourly distribution of Chiba-repo reports.
Ijgi 08 00115 g008
Figure 9. Spatial kernel density distribution of reports from (a) the app and web, (b) email, (c) telephone, (d) counter contact, and (e) patrols (kernel density radius = 250 m, cell size = 50 m).
Ijgi 08 00115 g009
Figure 10. Spatial hotspot analysis (Getis-Ord Gi* method) of reporting positions in 250 m grid cells.
Ijgi 08 00115 g010
Figure 11. Text mining of reports using the KH Coder co-occurrence network.
Ijgi 08 00115 g011
Table 1. Comparison of spatial correlation by report method.
MethodGlobal Moran’s Iz-Valuep
App. & Web0.244161.02**
E-mail0.0127.07**
Tel0.197134.80**
Contact0.05739.37**
Patrol0.255178.43**
**: p < 0.01.
Table 2. Top 10 reported road issues and average repair periods (N = 37,993).
Incident TypeApp & WebEmailTelContactPatrolTotal (%)Avg. Repair Days 1
Road surface29151165126714343694 (9.7)26.8
Drainage9042197525812293594 (9.5)27.5
Safety infrastructure251166651474231502 (4.0)24.1
Illegally parked bike82912105221328 (3.5)11.4
Plants9617637912091050 (2.8)15.9
Falling object222278176921011 (2.7)1.6
Light repair4061014829117710 (1.9)29.6
Road structures2521181895258 (0.7)25.3
Bridge311262057135 (0.4)19.8
Occupation1522173580 (0.2)6.9
Others163636911,2972137616321,602 (56.9)15.9
Total (%)2945 (7.8)521 (1.4)18,026 (47.4)2996 (7.9)10,476 (27.6)34,964 (92.0)18.3
Avg. Repair Days34.714.521.323.17.618.3
Unsolved Reports (%)169 (0.4)58 (0.2%)1979 (5.2%)185 (0.5%)638 (1.7%)3029 (8.0)
1 The average number of days from reporting date to work finished date.
Table 3. Average number of days needed to process road issues (N = 37,993).
OSM Road TypeApp & WebE-mailTelContactPatrolTotalAvg. Repair Days 1
Secondary road152027598911575627819,539 (51.4)17.6
Residential road575150558786820719251 (24.3)19.8
Sidewalk476429382456802381 (6.3)22.5
Primary road8618723956461568 (4.1)16.6
Living street103142821075041010 (2.7)10.2
Trunk road124529251145617 (1.6)22.8
Motorway95751030129 (0.3)22.9
Others521223845122469 (1.2)12.8
Total (%)2945 (7.8)521 (1.4)18,026 (47.4)2996 (7.9)10,476 (27.6)34,964 (92.0)18.3
Avg. Repair Days 134.714.521.323.17.618.3
Unsolved Reports (%)169 (0.4)58 (0.2)1979 (5.2)185 (0.5)638 (1.7)3029 (8.0)
1 The average number of days from reporting date to work finished date.
Table 4. Comparing citizen collaboration to fix road issues.
Road Type/CategorySpecific ThemeSelf-ResolutionCollaborationTotal (%)
Secondary road6279818743 (41.5)
Residential road569656640 (35.8)
Sidewalk1121895306 (17.1)
Living street2313036 (2.0)
Primary road270027 (1.5)
Trunk road157224 (1.3)
Others112013 (0.7)
Total1384374311789
Contributors (N = 1005)558121131

