Abstract
This article proposes the use of a multiscale and multisensor approach to collect and model three-dimensional (3D) data concerning wide and complex areas to obtain a variety of metric information in the same 3D archive, which is based on a single coordinate system. The employment of these 3D georeferenced products is multifaceted and the fusion or integration among different sensors’ data, scales, and resolutions is promising, and it could be useful in the generation of a model that could be defined as a hybrid. The correct geometry, accuracy, radiometry, and weight of the data models are hereby evaluated when comparing integrated processes and results from Terrestrial Laser Scanner (TLS), Mobile Mapping System (MMS), Unmanned Aerial Vehicle (UAV), and terrestrial photogrammetry, while using Total Station (TS) and Global Navigation Satellite System (GNSS) for topographic surveys. The entire analysis underlines the potentiality of the integration and fusion of different solutions and it is a crucial part of the ‘Torino 1911’ project whose main purpose is mapping and virtually reconstructing the 1911 Great Exhibition settled in the Valentino Park in Turin (Italy).
Keywords:
3D models; multisensor; multiscale; SLAM; MMS; LiDAR; UAV; data integration; data fusion; cultural heritage 1. Introduction
The creation of a three-dimensional (3D) model, with the aim of documenting extensive complexes, is a great challenge where the geomatics techniques and methodology could play a key role. A 3D model, which relies on an accurate metric survey, could provide a useful base on which other analyses can be carried out, especially in the cultural heritage domain where highly detailed information that is connected to models and descriptive model data that provide a more general view of the studied object are necessary. An important aspect, which is related to the wealth of the available data after multisensor acquisition, is connected to the optimization phase, where it is important to follow a predefined pipeline to optimize the model, not only in terms of file dimension, but also according to the detail of the recorded object. High resolution of digital models must be harmonized to high accuracy and density of information, but, in contrast, this compromises the capability of visualization, requiring more efficient hardware or a simplification of the model is necessary [1]. The creation of an accurate (level of detail depends on its final use) 3D model is the first step. The management of a useful 3D model requires the creation of an ad hoc digital surface; this implies a series of reflections and choices referring to time and requirements both in acquisition and processing phases, geometric, and radiometric aspects of final products, according to resolution and quality needs, but also the size and interoperability of files.
Nowadays, digital 3D documentation of the built heritage presents a useful tool in the analysis and interpretation of the historical site. The employed sensors and methodologies for capturing reality could be different and they are mainly divided into image-based or range-based techniques. Because each of the aforementioned techniques is connected with pro and cons, it is well affirmed that the right way to carry out a correct survey, which could be considered to be an important research issue, is the ‘hybridization’ of the approach, in the sense of a combination or fusion of data to obtain a complete, usable, and users-driven 3D digital model.
Starting from the work that is reported in [2], where the main issues connected to the use of a Simultaneous Localization and Mapping (SLAM)-based system for surveying complex built heritage were discussed, the objective of the research that is presented in the next sections is to extend and evaluate the contribution of the multisensor approach; mostly referring to the connected techniques for carrying out suitable 3D models for the documentation of extensive built heritage complexes. The different techniques that are employed for data acquisition and processing will be discussed and the adopted strategy, with the accompanying advantages and disadvantages, will be addressed to define a good strategy for obtaining a complete 3D digital model. Furthermore, in the second part of the paper, the usability of the achieved models and the descriptive characteristics will be reported. The idea, following the actual development for 3D real-time visualization, is connected to the improvement of the use of this new digital support for enhancing the knowledge that is connected to the documented built heritage. These instruments can recreate an interactive, virtual-reality experience that is usable by students, researchers, and other users to explore the site’s buildings and the related artefacts.
State of the Art and Related Works
Architectural heritage, or more generally the complex built heritage, is a very interesting test field for 3D documentation purpose. The characteristics of those objects allow for experimenting with new sensors, methodologies, and techniques, which are parallel to more consolidated ones, to evaluate the pros and cons of each followed approach. Moreover, nowadays it is generally agreed that the combination of the different techniques is the proper way to obtain a metric product that respects all of the requirements of a correct survey in terms of accuracy, completeness, and reliability.
Nowadays, the well-consolidated techniques that are able to produce a 3D recording of the built heritage can be divided into two main categories, namely image-based and range-based techniques [3,4]. The image-based techniques are related to the use of photogrammetric acquisitions, primarily close-range or Unmanned Aerial Vehicle (UAV). Nowadays, this methodology is probably one of the most used in the architectural survey field, according to the significant developments of the last decade in terms of sensors and algorithms, even more, based on a computer vision approach—the well-known Structure from Motion (SfM). Because it could be considered to be low-cost, easy to use, flexible (multiresolution and multiscale), and, thanks to the massive use of UAV, photogrammetry allows for moving the point of view from the terrain to the air. As a consequence, in every work related to the survey of a complex site, starting from the archaeological areas [5,6], up to the built heritage complex site [7,8,9,10], the use of photogrammetric techniques are used with the aim of extracting 3D point clouds, 3D models, or simple orthoprojections. Further developments in this field are connected to the use of different sensors, such as multispectral, hyperspectral, thermal or mobile devices [11,12], and in the employment in terrestrial or UAV applications of the new generation of panoramic /spherical cameras [13,14]. The range-based techniques (i.e., LiDAR, Light Detection and Ranging), dating back to the early ‘80s, have recently developed different strategies for data management and processing [15,16], along with several workflows and a lot of device improvements, to produce high-performance point clouds in terms of accuracy (short-range vs long-range scanners), speed of data acquisition (Time of Phase vs Phase Shift), and radiometric quality (embedded or external camera). Starting from the reliability of the LiDAR in connection with the evolution of the computer vision algorithms and the improvement of the inertial systems in mobile platforms, an emerging methodology that is even more frequently used for survey purpose is the SLAM approach. These techniques could be considered to be a Mobile Mapping System (MMS), where a moving head is equipped with a ranging measurement laser capturing two-dimensional (2D) point profiles, an inertial measurement unit with triaxial gyros, accelerometers, and three-axis magnetometers. Over the last year, different tests and applications have been carried out through the use of this system [17,18,19] and, according to the achieved results, it could be considered to be more than suitable for architectural scale purposes, also in articulated and compound environments [20], even indoor areas. The problems of RGB data and (geo)positioning issues are currently not completely solved.
Nowadays, it is clear that the main issues driving the research test and validation are addressed to the data processing and management in terms of data and procedures optimization. The different techniques allow for extracting or collecting 3D point clouds and the fusion of the different achieved results is an accepted methodology [21,22,23]; these products constitute the starting point for different following steps that could drive the surveyors to carry out a traditional drawing, an orthophoto, a 3D textured model, or to define the geometry behind an Heritage Building Information Modelling (HBIM). The next sections are dedicated to reporting the experiences of our research group, which aimed at obtaining a final hybrid model, i.e., derived from a combination of fusion and the integration of multisensor data.
2. The ‘Torino 1911’ Project: Focuses and Aims
1911 is a symbolic year in Italian history; in that year, Italy celebrated the 50th anniversary of national unity with the so-called ‘Fabulous Exposition’ that settled in the Valentino Park of Turin. The International Exhibition displayed the major works of technology and science from the entire civilized world. The spectacular architectures that were realized for this purpose were the mirror of society at that time: ephemeral elements characterized an overabundance of eclectic styles to overwhelm seven-million visitors [2,24]. The Torino 1911 exposition celebrated the industrial fervour in the western part of Italy with its robust and explosive production of ‘goods, science and technology, national boundary and Capital’ [25]. The architects created a fantastic city on both banks of the Po River, a city of dazzling whiteness, with staircases, pediments, steeples, and colonnades overburdened with friezes. The decoration was done with superfluous capitals like no one had ever seen before, with fountains, waterfalls, and tapis roulant, fastigiums, porticos, statues of Victories with rustling veils, eagles with outstretched wings, and angels playing trumpets.
The overall project Torino 1911 aspires to virtually recreate the world that was revealed in 1911 and to facilitate constructive encounters between the old world’s fair technologies and new digital technologies. Today, the monumental Valentino Park preserves its historic structure with avenues and ancient trees [26], while most of the temporary buildings are no longer present. In contrast, there are some monumental complexes, which, although not built for the occasion in 1911, constituted an integral and important part.
It is from this point that we started and that constitutes the main objective of this work. How should models of complex buildings be generated, organized, and characterized that must be subjected to many different objectives at the same time? Being not only navigated, but also investigated to know the intrinsic characteristics and the insertion in a scenario that has to be rebuilt?
Case Study
The selected case studies are those that are most directly connected with the themes of survey and model generation from real-based methods, that is, the existing building complexes. Subsequently, the analysis focuses on two castles settled in the Valentino Park of Turin: the Rocca (Figure 1) and the Valentino Castle (Figure 2), this last mainly referring to the noble floor.
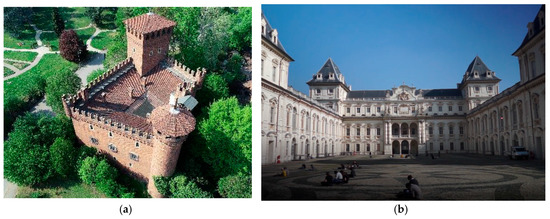
Figure 1.
Test area: (a) The Rocca in the ‘Borgo Medievale’ and (b) The Valentino Castle.
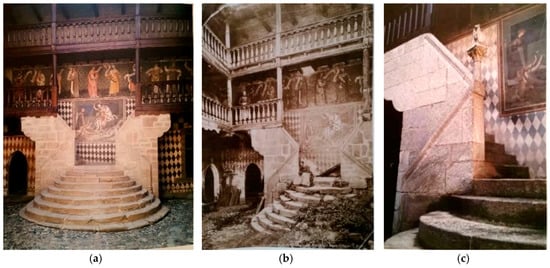
Figure 2.
The main staircase in the courtyard of (a) the Fenis Castle (AO) in 2004 and (b) back to 1884 [29]. (c) The same scene in the courtyard of the Medieval Rocca in Turin.
The first one is part of a suggested reconstruction of a medieval hamlet (Borgo Medievale), which was conceived for the 1884 Italian Exhibition. The latter is one of the Savoy Royal Residences (all inscribed on the World Heritage List for their outstanding value from 1997), built by Cristina of France in the XVIIth century as the actual configuration, and now hosting the Faculty of Architecture of the Polytechnic of Turin. The Borgo Medievale and the related Rocca were designed by Alfredo d’Andrade to symbolize the medieval Italian styles and be materialized in architecture, furnishing, flourishes, utensils, and works [27]. Enclosed by an enceinte and protected by a tower with a drawbridge, the Borgo is composed of a church, some houses, workshops, a garden, and the Rocca, the innermost keep; all of these structures are a revisit of some real medieval architectures that are spread in two Italian regions, Piedmont and Valle d’Aosta. The Rocca is articulated in four levels and two towers, one circular and one square. All of the rooms revolve around the inner courtyard, a double height open space with two levels of wooden balconies, and partially covered by a roof, which very similar to the Fenis one also for the mural paintings figuring Saint George over the stone staircase and philosophers, saints, and heroes all around the balconies. Each local has an irregular plan, depicted walls and brick vault, or wooden beam ceilings [28]; moreover, furnishing and usual accoutrements are designed to represent medieval life.
The second case study refers to another type of castle; developed from a XVth century suburban palace and settled alongside the river Po, the Valentino Castle [30] was transformed into a royal residence during the XVIIth century for the Savoy family. During the XVIIIth century, the Castle was involved in urban planning, in which it was the central focus for the design of the Valentino Park [31], an urban public space of 42 hectares, and a place of a series of national and international exhibitions, which dated between the end of the XIXth century and the beginning of the XXth century. The Castle began the headquarters of the Royal School of Engineers in the mid-XIXth century and subsequently of the Politecnico di Torino. Nowadays, the noble floor is the most representative part of the building, which is also open to the public as a museum on predefined days. The present research investigates some chambers of the Castle, in detail, the Great Salon, the Fleur-de-lis, and the Roses Chambers in the south apartment of the main floor. With its double height, the favoured view of the river Po, mural paintings with never-ending scene spreads in the walls, and sculpture masked in the corners, the Salon is the Honour chamber represents the Savoy family. The Savoy’s military feats are celebrated in the Salon, whose decoration was carried out by various artists during the XVIIth century and restored in the XIXth and XXIst centuries. The Honour Salon is the core of the whole castle, facing the ancient access from the river, and the newest from the courtyard towards the city. Carlo and his son Amedeo of Castellamonte, followed the architectural works of the Valentino Castle were followed by, who transformed the Palace into a ‘Pavillon’ Castle with French style. Isidoro Bianchi supervised the Cristina’s apartment decorations between 1633 and 1642. The restoration of the entire noble floor of the castle, in addition to the ones affecting the artistic heritage, has concerned the structures, especially the vaulted systems, which have suffered damage and water infiltration. The vaults are so-called ‘fake vault’ and they are realized with plaster that is applied on reed mats, which are hanging on a rib wood frame. In addition to the historical restoration that was carried out by D’Andrade in the late nineteenth century, some consolidations of the vaults—made after the second world war to recover the damage of the bombings and another in 1978—have already been studied to determine the safe conditions [32].
3. The 3D Documentation Project: Multisensor Data Acquisition
In these types of scenarios, many operative solutions are commonly deployed by endorsed workflows, as introduced, to overcome multiscale and multiresolution issues in outdoor and indoor spaces and some innovative mapping solutions have already been tested [2]. Surely, the multisensors approaches should be validated from a partial to a global viewpoint, to optimize the effectiveness of each sensor data contribution to their integration, finalized to overcome their singular applicability limits and that are aimed at making an experimental workflow effective. The test areas present a variety of characteristics and restrictions that influenced the choice of which sensor was the best solution to perform a complete and continuous 3D metric survey. Therefore, both image- and range-based sensors were used during the acquisition phase and a general overview of the raw data is presented in Table 1.

Table 1.
Sensors employed in the acquisition phase and general overview of the amount of collected data for the entire project.
Hereby, only the main results from some of them are later referred to in detail. Moreover, another crucial aspect to be considered is that the acquisition campaigns, due to operative needs of the project, were organized at different moments, while employing various groups of surveyors to cover the entire area and to achieve different levels of detail.
3.1. Multisensors Approach for Multiscale Data
In detail, the investigated approaches are a Terrestrial Laser Scanner (TLS), an MMS, Digital Single Lens Reflex (DSLR) cameras, various UAVs, and some image-based low-cost and portable sensors, as steady cameras and action cams. Moreover, a geo-reference system was established, thanks to the integration of a principal network that was acquired with a Global Navigation Satellite System (GNSS) system and a huge amount of materialized codified contrast markers and natural points from the scene, well distributed in the test area, acquired by a Total Station (TS), in order to obtain a reliable network of control and check-points.
According to the complexity and the extension of the test areas, the phase shift laser FARO® Focus (Figure 3) was chosen as the TLS system, S120, and the superior range X330; the characteristics of which are tested in these cases of wide distance in outdoor scenes.
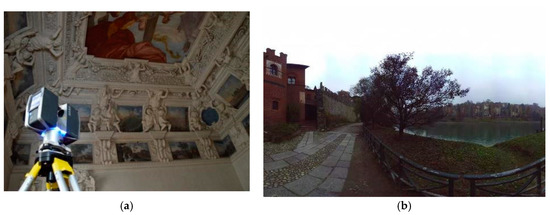
Figure 3.
Terrestrial Laser Scanner (TLS) by FARO®: (a) The FARO® Focus 120 during the acquisition and (b) planimetric view of an outdoor coverage range of an X330 scanner.
Another type of laser-based sensor is the ZEB Revo Real Time (RT) by GeoSLAM (Figure 4); contrary to the motionless TLS system, it is a portable MMS working with a Hokuyo UTM-30LX-F scanner technology and using the SLAM algorithm and an Inertial Measurement Unit (IMU) [33]. This type of sensor is promising because of its ‘go-anywhere’ definition and that it is currently already quite investigated in the literature [2,17,34,35,36,37,38,39,40,41,42].
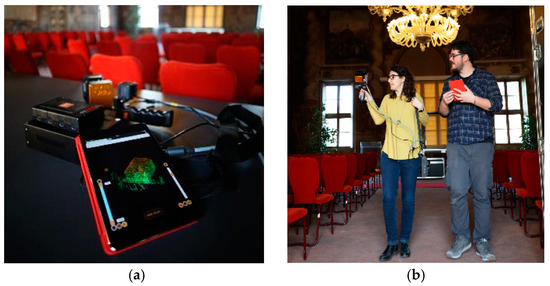
Figure 4.
The ZEB Revo Real Time Mobile Mapping System (RT MMS) by Geo Simultaneous Localization and Mapping (GeoSLAM): (a) The data logger, the rotating head and the Go Pro mounted above and the IPad Pro employed for the real-time view during the acquisition phase; and; (b) Operators scanning the Great Salon with the instrument.
In fact, lightness, handheld solution, and manoeuvrability characteristics allow for rapid acquisition of a vast number of points, especially in an articulated, multilevel, narrow, and extended area—such as the interiors of furnished museums, offices, and underground spaces—where other sensors cannot be employed or would be very time-consuming. Furthermore, the tested sensor mounted a ZEB Cam, which is a commercial off-the-shelf (COTS) GoPro HERO4 Session.
The scanner works with a tablet through a specific Wi-Fi connection, allowing for the real-time view during the acquisition; these two implementations increase the potentiality of the whole system when compared with the previous versions, the first Zebedee [43], and the following ZEB1 [37] and ZEB Revo [44]. The scanner works in pair with a tablet through a specific Wi-Fi connection, allowing for the real-time view during the acquisition; these two implementations increase the potentiality of the whole system as compared with the previous versions, the first Zebedee [43] and the following ZEB1 [37] and ZEB Revo [44].
According to the aim of the work that is connected to multisensor and multiresolution data acquisition and processing, in the analysed areas, different UAVs have been employed (Figure 5) accurately to document the built heritage from different points of view.
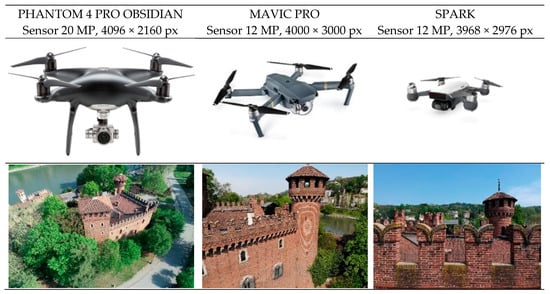
Figure 5.
Different Unmanned Aerial Vehicle (UAV) platforms by DJI company and related sensors with captured images.
The flights were performed using a standard approach according to the different characteristics of the used platforms (automatically for the Phantom and Mavic and manually for the Spark). In the next sections, only the data that was acquired by the Phantom will be described because the highest resolution of the images acquired by that platform allows for better integration and/or fusion of the achieved results with the ones that were acquired by the other sensors. Furthermore, to complete the multisensor survey, a photogrammetric close-range acquisition was carried out to test different low-cost sensors and consolidated DSLR blocks and also acquire different qualities of radiometric data.
3.2. Data Acquisition Strategy and Data Preprocessing
The strategies that have been put in action are addressed, as introduced, to the problem of data acquisition protocols’ optimization, especially if coming from different technologies use and the issues that are related to multiscale and multisensor models’ creation and validation. Certainly, in such compound environments featured to a large extent in interior and exterior spaces, the variables of space-to-be-covered and time-to-be-spent in composite operations workflows require deep analysis. Therefore, different sensors and integrated strategies were tested for indoor and outdoor acquisitions. Certainly, the castle royal rooms and medieval Rocca apartments have been challenging environments, because furnishings indoor and trees outdoors forced the consideration of some aspects:
- Flight plan, overlap, resolution, and UAV camera axes in oblique acquisitions: the moment of the year in which the survey is performed will be influenced by the presence of the trees’ foliage.
- Number, position, and resolution of TLS scans required obtaining a continuous surface with homogeneity of recovering without horizontal and vertical shadings: if they need to be increased, consequently, the acquisition and processing time are also time-consuming.
- SLAM-based trajectories in the case of MMS, deployment should be adapted to these types of locations: certainly, they will be successful in terms of time-saving, but they would bring with it an increase in the already known problems of noise errors affecting the point clouds and the drift errors that affect the trajectory.
3.2.1. The UAV Flight on the Medieval Rocca
Over the analysed area, a complete UAV survey was planned and performed using the aforementioned platforms to accurately describe the external part of the castle. Despite the use of different platforms, hereafter only the Phantom data will be considered as a general example for using the UAV for data acquisition and extracting 3D information from above. Complying with the consolidated trends in UAV image acquisition [45,46], the flights over the Rocca were planned with the aim of acquiring nadir and oblique images. According to a limited extension of the surveyed object; first, a double grid acquisition with the nadir camera axes was performed (Figure 6b). This first flight was made with a longitudinal overlapping of 80% and a lateral overlapping of 70%. Furthermore, a circular flight with the camera axes at 45° was carried out, in this case, the angle between the adjacent images was 5° with the camera being oriented to the centre of the circle. The Rocca was covered with 137 images with two different flights at an average flight height of 50 m (the height of the Rocca is about 32 m). The Pix4DCapture application was used for planning (Figure 6a) and performing the different flights to obtain a complete reconstruction of the Rocca (Figure 6b).
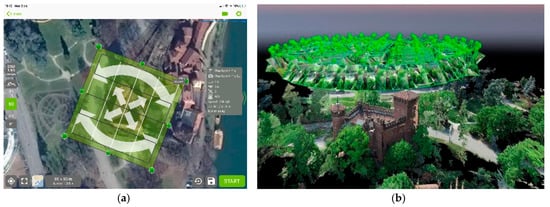
Figure 6.
(a) The flights performed by Phantom 4 PRO (b) oriented UAV images block on the Rocca.
The advantage of using an ad hoc application for the image acquisition phase is surely connected to the full automation of the process, but the radiometric quality is not fully guaranteed, in fact, a recurrent drawback is the overexposure of images. During the different performed tests, especially in sunny conditions, the automatic procedure that was implemented in Pix4DCapture in most cases delivers moderately overexposed images. In the case of the Rocca, fortunately, the performed flights were carried out during a cloudy day with a perfect diffuse illumination, which allowed for us to acquire the images in the best light conditions. Another problem that was connected to the automatic acquisition using the aforementioned application is related to the fixed altitude of the flight. In other words, with Pix4DCapture, it is not possible to change the height of UAV during the flight according to the slope of the terrain. In difficult areas (with large height gaps), as a result, this limit could cause the acquisition of images with uneven Ground Sample Distance (GSD). In the present research, according to the shape of the area/object, the flights were set up to obtain a GSD value (~2.5 cm/px)—suitable for an architectural scale (1:100–1:200)—that measured 20 Ground Control Points (GCPs) and eight Check-Points (CPs), as reported in Table 2.
Table 2.
UAV acquisition specifications.
Currently, the only way to solve the two reported drawbacks is to perform manual flight. However, that does not allow for following predetermined flight lines or circular acquisitions; therefore, according to the underlined problems, actually, where the environmental conditions allow for flight without any particular problem (high sunlight, obstacles, or other significant issues) the automatic strategy is preferred.
3.2.2. Close-Range Photogrammetric Acquisitions
To test other image-based sensors, in addition to the UAV data, different terrestrial acquisitions were carried out to document the analysed areas. The followed approach is the one that is well consolidated in the community that require large image overlapping using parallel and convergent images [47], when considering all the above internal/external light conditions.
In the Valentino Castle, low-cost platforms, such as DJI Osmo, GoPro Fusion 360, and high-resolution digital cameras (Sony ILCE-7RM2), were employed for recording the indoor and outdoor data. Using the Osmo and the GoPro, several videos were recorded, and moreover, the frames were extracted for performing the photogrammetric process, as reported in [48]. The acquisitions performed with Sony ILCE-7RM2, which, in our case, was equipped with a 12 mm focal length, were carried out according to the common practice. Normal and convergent images with large overlapping (more than 80%) were collected to perform the photogrammetric process that was based on SfM techniques. In the Rocca, the same low-cost sensors were employed, while the DSLR acquisition was performed using a Canon EOS 5DS R with a 24 mm lens. The strategies were the same used for the Valentino Castle. In the next sections, only the data that was obtained using the images that were acquired by the DSLR cameras will be analysed.
3.2.3. The Terrestrial LiDAR Scans Projects
According to the consolidated practice of traditional TLS acquisition [49,50] and scans registration, a huge number of scans data were obtained to cover all of the architectural contexts. As usual, the scans acquisition was supported by control points topographic measurements and distribution guaranteed the suitable surfaces coverage with adequate overlapping.
First of all, a large number of scans is connected to the complex shape of the Rocca, which is composed of narrow rooms that are connected to each other. Moreover, the furniture located in the surveyed areas was another important aspect that has increased the number of acquired scans. The scan resolution was set up at ⅕ (that means one point every 7.74 mm at 10 m), with a quality of 4× (that means that each point is measured four times). As usual, after the point clouds acquisition, the images were also captured to colour the point clouds. The high number of planned scans is also due to the prefiguration of accelerating the registration procedures, ensuring a high overlap between all of the scans that is necessary for assuring an easy registration of the different acquisitions in line with the cloud-to-cloud approach, based on the well-known Iterative Closest Point (ICP) algorithms. To speed up the scans’ registration, the work was divided floor by floor, and subsequently all the data were connected, as shown in Figure 7. In the Medieval Rocca, the survey planning has gone along the complex distribution of the apartments, as summarized in Table 3 and the process is evaluated through values of mean for ICP phase and standard deviation (st. dev.) with Root Mean Square Error (RMSE) for the georeferencing one. A mean of seven scans per room was collected, with a sum of 93 scans, on a total surface of about 1000 m2. Furthermore, as mentioned, the survey was also operated in the Castle, specifically, on the main floor of the building. This is composed of 11 main rooms with plaster decorations and frescoes, as reported before, and four ancillary rooms (two bathrooms and two corridors). The TLS acquisitions were carried out with the same Rocca’s strategy. For each main room, at least five different scans were achieved (usually in the four corners and in the centre) to cover the complete shape of the area with the decorations as well. In total, 82 scans were recorded, a mean of five per room, on a total volume of decorated spaces of around 900 m2.
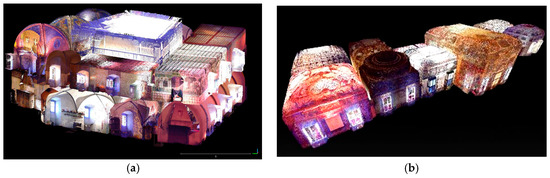
Figure 7.
A view of the registered scans from (a) Rocca (n. 93) and (b) Castle (n. 82).
Table 3.
Light Detection and Ranging (LiDAR) acquisition specifications.
3.2.4. Experimenting with 3D Mobile Mapping
According to the location characteristics, a test on the use of a portable mapping system was performed for evaluating the MMS strategy and the achievable products. As is commonly reported in several pieces of research, SLAM-based devices are almost the best solution for enclosed ambient rich in-features, because the SLAM algorithm also exploits the geometry to estimate 3D reconstruction of surveyed places. The optimal trajectories [2,19,41] require closed loops and roundtrips, rather than one-way mode (Figure 8a,b and Figure 9a) during the operator’s rooms mapping.
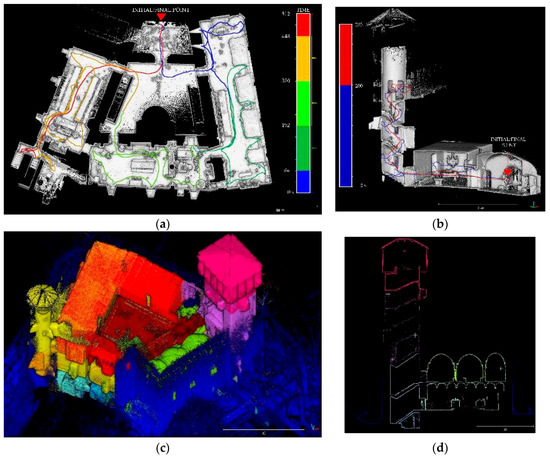
Figure 8.
Example of SLAM-trajectory in the Rocca colourized by time: (a) Close loop with some roundtrip parts; (b) Roundtrip on the tower: going (blue) and return (red). (c) All of the reprocessed ZEB point clouds after the merge process, each colour corresponds to one scan, in blue the external one and (d) vertical section of the point cloud.
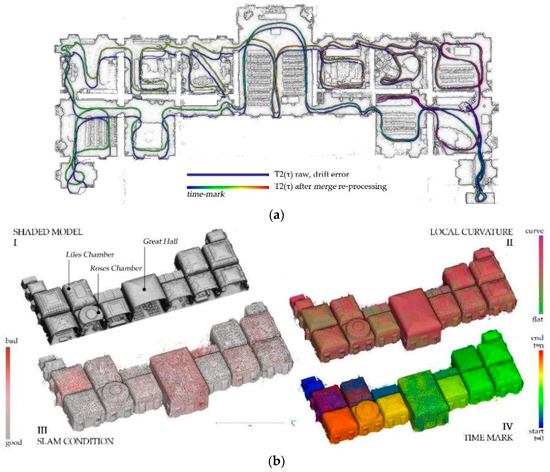
Figure 9.
The ZEB survey in the Valentino Castle: (a) The plan view with the closed loop T2(τ), performed, before (blue) and after (range colours) the SLAM reprocessing by merge function correction; (b) the attributes related to ZEB-based point cloud processing, inside the GeoSLAM Hub platform. Along with an axonometric representation of the main floor in shaded view (I), there are normal mapping (II); SLAM quality condition during the scan (III); time-stamp information (IV). Each thematic result is associated with its own trajectory data as well.
One of the main matters affecting the ZEB Revo point cloud, in parallel to the accuracy of the points model, is the lack of positioning data. The origin of the reference system for each scan is the starting point and the orientation of axes XYZ is related to the rotating head: in fact, the X reference axis is normal to the scanner’s back plate. In this way, it is possible, if initialized vertically, to rotate the X-axis to the East and to then perform the survey at least roughly following the North–South reference system, as investigated in [39]. Furthermore, the relative positions between multiple scans of the same survey set are also not assured to be aligned, due to the possible change of position of the rotating head at the initialization moment. Therefore, to manage all the scans in the same relative reference system, the simple single roto-translation and mutual ICP fitting applied on each ZEB scan can be now effectively avoided by the application of the “Merge” algorithm function (Figure 10), as implemented in the last desktop release of GeoSLAM Hub software for the scans processing [19].
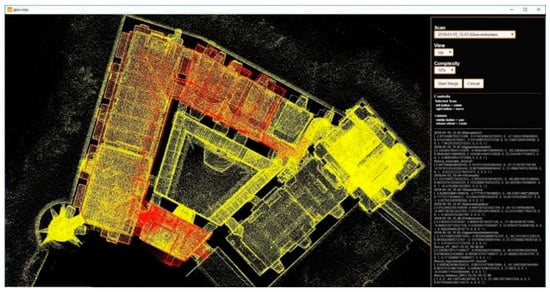
Figure 10.
The desktop interface of the merge function in the GeoSLAM Hub software: in red, a single scan that is manually aligned, one at a time, to others, yellow. In the black box bottom right, the roto-translation matrix of each merged scan.
In the first step, the single scan is manually aligned one at a time to others to prepare the second step, which is the recomputation of the SLAM data; the implemented algorithm—based on joint SLAM+IMU data—combines 3D data derived from the overlapping parts between the scans and finally estimates a more accurate point cloud that is based on an improved trajectory.
In [2], the effectiveness of the “merge” and “reprocessing” functions are analysed and compared with the raw output data. Instead, to approach the solution of the problem of absolute positioning, this last software implementation plans to recognize and identify, along the trajectory, just those specific points in which the operator stopped for at least about five seconds. Concerning these so-called ‘reference points’, the processing algorithm extracts XYZ coordinates on each measured point, retrieving a set of points in a *.txt output file. This is currently under research, but it is possible to say that this solution allows for obtaining a set of local coordinates of some vertices that are related to a topographic network, as measured by traditional TS and GNSS techniques. Subsequently, a roto-translation will enable conversion of the ZEB point cloud from the local system to the global positioning.
The collected ZEB-scans in the Castle and in the Rocca are thus processed in GeoSLAM Hub, where the reprocessing and the merge algorithms are applied to the two scans sets. Table 4 reports the two sets of acquisitions and an average value of the amount of data that is collected by the MMS.
Table 4.
ZEB acquisition specifications.
The output point clouds consists of a set of different available formats (*.las; *.ply; *.E57; *.asc) and very useful information can be calculated on the points surface, in the format of attributes that are associated with points (Figure 9b): i.e., normal, SLAM quality, time, elevation, etc. Section 4 contains discussion regarding these aspects. The selected area of the Rocca meets the ZEB requirements; in fact, it contains both indoor articulated places and open enclosed spaces, as previously described (Figure 8c,d). In the case of one-way blind tracks, as in the towers of the Rocca, the roundtrip trajectory was the only solution, to obtain good results. For this kind of environment, the employment of the ZEB Revo represents a useful solution thanks to its manoeuvrability and time speed, which allows for the operator to move freely in narrow spaces.
Contemporary SLAM-based acquisition was carried out in the Castle main floor as well the adopted strategies were similar to the ones that were performed in the Rocca area. The rooms of the main floor were surveyed testing two different strategies, with aimed to evaluate and validate the best approach for such large-range mapping in quite complex volumes, geometrically characterized objects, and scenes rich in furnishings. As reported in [2], the first T1(τ) (almost 6 min along 110 m, 0.3 m/s speed), was shorter and more simple, being performed with the best practices execution—a roundtrip—travelling along the corridor and mapping two rooms and the extreme sides of the scans. It has been processed with the “merge” function to help in the rigidity of the second T2(τ) (almost 12 min along 350 m, 0.5 m/s speed), the complete trajectory across all of the rooms on the floor coverage with a closing loop, to optimize the final alignment of the acquired data. In Figure 9a, the T2(τ) is shown in the original trend after the acquisition and in scale colours after using the merge tool, which is the reprocessing of the SLAM algorithm with the contribution of T1(τ).
4. Methods and Strategies for Complex Environments and Advanced 3D Modelling
The optimization-driven approach, which underlies the data integration strategy and the experimental process of fusion, tries to tackle, in the most all-encompassing way, but certainly not exhaustively, certain aspects typical of 3D digitization, downstream of the research experience conducted, and the methodological innovation tested in recent years.
The attempt, as introduced, is to balance a role for cutting-edge techniques, alongside those more consolidated approaches, to compare them and to obtain different deliverables that are useful to user-oriented scopes. Special attention is given, in this paragraph, to the 3D mapping via ZEB Revo MMS to investigate, in such kind of applications, how far it can be self-contained and where it needs supporting integration, or better, in which way its potential, in terms of speediness and manoeuvrability, can be a worthy basis for reasoning on potential data fusion processes.
Thus, the open issues, faced in these tests and clarified hereafter, mainly referred to the multisensor problem in the case of ZEB single data or a combined use within the mapping of complex scenarios, are tackled with experimental integration- or fusion-based approaches and are proposed for:
- the management of the reference system (Section 4.1): relative alignment and absolute (geo)positioning;
- the geometric reconstruction aptitude (Section 4.2), relating to decorative and morphological aspects; and,
- the examination of a fusion-based pipeline solution for the geometric/radiometric attributes enrichment in point clouds and surfaces (Section 4.3).
4.1. Positioning Issues for Complex and Extensive Indoor–Outdoor Environments
As introduced, the positioning question that is related to the ZEB point cloud could be currently solved by a roto-translation and ICP procedure with another positioned point cloud that was used as a reference (i.e., TLS model). This evidently requires a LiDAR survey (topographically based) to be performed in parallel to the MMS survey.
The research testing tries to split the problem matter and to lead a differential evaluation of ZEB performance in relation to a 3D model ground-truth: this is due for the possibility to consider the SLAM-based point clouds result in a “local” or “global” perspective. In fact, the operation of SLAM-based algorithms during the processing should simultaneously meet the needs of geometry (locally) and trajectory (globally), i.e., balancing of the influence of SLAM and IMU data in the trajectory estimation. This is the reason why ZEB mapping usually suffers from some drift errors in trajectory reconstruction (planimetric and altimetric drifts), even if the local reconstruction of a single space returns very positive values of deviation from the reference surface that employs Cloud-to-Cloud (C2C) analysis by CloudCompare software.
The configurations that are considered for the analysis are:
- I.
- Local result, indoor, single enclosed area
- II.
- Global result, indoor, single-level floor, evaluation of planimetric drift error
- III.
- Global result, indoor, multilevel floor, evaluation of planimetric and Z drift error
- IV.
- Global result, outdoor scenario with UAV data
- I.
- Indeed, if we consider a single room, e.g., the Rocca’s Throne Chamber (around 6 m × 13 m × 4 m dimensions) and the two point clouds, ZEB 2 mln points and TLS 16.6 mln points, their comparisons demonstrate very good results of ZEB technology in local 3D reconstruction. In particular, the dimensional comparison of main dimensions and areas estimation, as reported in Table 5, shows very accurate results, as modest residual deviation errors from the reference dimensions (LiDAR) exist. The computation of the C2C algorithm, in the second part of Table 5, considers the downsampling of the data by a filtering approach to the ZEB point cloud due to the noise errors that are typical of these SLAM-based acquisitions. In fact, the compared mean and the st. dev. results considered before and after the procedure, which are represented in Figure 11b,c, reach almost 1 centimetre (±2 st. dev.) and then less than 1 centimetre. It is also visible in the variation in the statistical distribution of points after the filtering process.
Table 5. Results of (I.) Dimensional and C2C comparison of ZEB and LiDAR point clouds on the Throne Chamber.
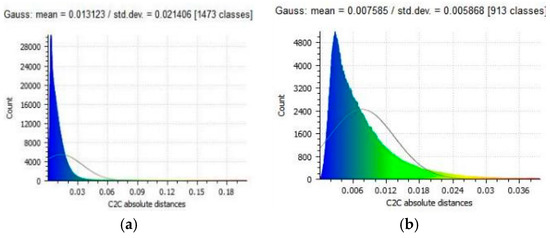 Figure 11. Statistical graphics of C2C comparison of ZEB and LiDAR point clouds on the Throne Chamber: mean and st. dev. distribution (a) before and (b) after noise filtering applied to ZEB data (C1-C2 cases).
 - II. & III.
- If we consider now the global results of a ZEB set of mapping data in a typical indoor scene, it is possible to summarize that, in the case of both single floor and multilevel environments, a residual drift error in extensive and articulated trajectories is inevitable, but it is also possible to control and limit it. The test cases have been the honour floor in the Valentino Caste and the apartments of the Medieval Rocca. The execution of partially repeated and overlapping trajectories, for example, in the spaces that are designated for horizontal and vertical distribution (corridors, stairway blocks), together with the recomputation of SLAM algorithm with the “merge” reprocess, significantly improves the ZEB results according to a comparison with a LiDAR ground-truth surface, as is reported in [2].
- IV.
- If we lastly consider the evaluation of the SLAM-based mapping into a global perspective in the outdoor scenario, another question that is connected with the ZEB data is the scale and the coverage of the point cloud. If the data is collected as usual by a walking operator in a close-range framework, the results will return a point cloud that is characterized by range distance proportional to the outdoor laser extension, declared as 15 m.
In Figure 12, the research direction has considered, as recently investigated in different types of large-scale scenarios, the integration between these two assimilable strategies of rapid mapping and the expected comparable final scale: the terrestrial SLAM-based mapping with the contribution of high-scale aerial data coming from the UAV photogrammetric data.
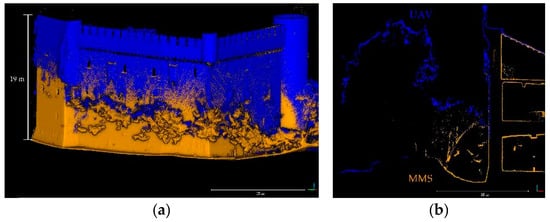
Figure 12.
Extension of point clouds, UAV data coloured in blue, ZEB data in orange: (a) angular view of the external walls with the presence of vegetation and (b) vertical section of the Rocca.
As previously described, the Medieval Rocca is a great example of a complex architecture, where the performance of UAV, LiDAR, and MMS systems are proved, but the presence of vegetation hinders the ground level and covers a portion of the walls. The UAV point cloud Digital Surface Model (DSM) enables obtaining the external geometry of the surroundings and the Rocca, especially with its roofs and with the upper parts of its curtain walls and towers. Thanks to the easy manoeuvrability of ZEB Revo, it is possible to overcome this lack. Moreover, the employment of a handheld solution for the inner apartments also speeds up the acquisition and the processing phase. For these reasons, the integration of these two systems could be the best solution to be faced up. In fact, a surfaces’ comparison that is proposed in Figure 12, and their C2C distance computation (Figure 13) show the potentialities of the enriched 3D descriptive capabilities of both integrated digitization of the Rocca. In Figure 12b, a noteworthy section of the integrated model and a critical point is the trees that lean against the curtain wall. Wherever the mapping operator managed to pass near the walls, the reconstruction was continuous, with a maximum displacement of distances, in the upper part of about 9 cm, and a minimum in the lower part of about 1.5 cm.
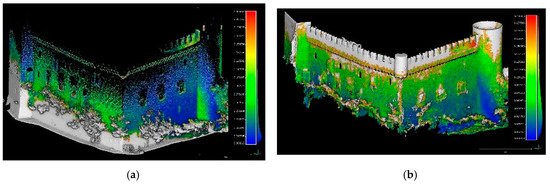
Figure 13.
Complementary representation of C2C points distances between the two point clouds: (a) ZEB distances on UAV data (min. 1.33 cm, Max. 9.27 cm) and (b) vice-versa projection and values in Table 6.
4.2. SLAM-Based 3D Modelling: Testing Descriptive Capabilities in Digitalizing Complex Surfaces
Hereafter, in this second analytical step, we will consider the problem that concerns the geometric and radiometric featuring of sensors’ models in comparison with the ZEB surface, applying the validation strategies that are presented in [48]. In particular, a benchmarking analysis focuses on some examples of richly featured surface of frescoes and 3D details of decorative apparatus of the Valentino Castle, as previously described as a great example of complex architecture with completely decorated indoor spaces, that are, for distinctive reasons (Figure 9b above left): the Great Salon and the Fleur-de-lis Chamber with pavilion vaults and the particularly terraced Roses Chamber vault.
The surface models of typically decorated stucco’s vaults, as extracted from the point cloud, are the ones in Figure 14 and Figure 15. The problem of digitization of the emphasized 3D decorations is proposed in Figure 14, where the risk of vertical shadings is visible: the lack of information in the undercut areas corresponding to the stucco frames appeared as a drawback mostly in (b), caused by the fixed position of the scanner and moderately in (a) and (c). In Table 7, the quality values of the point clouds are only related to the vault parts: the close-range photogrammetric dense cloud can be compared with the massively rich LiDAR point cloud, only just after a 1:3 filtering ratio. Conversely, for the ZEB point cloud, the density ratio turns out to be 1:20. In Figure 15, the deviation distances map between LiDAR ground-truth and ZEB mapping is presented on the vaults of the Roses Chamber, the only great terraced vaulted structure of the honour floor. The values of C2C comparison imply average values of accuracy between 5 and 20 mm (blue to green).
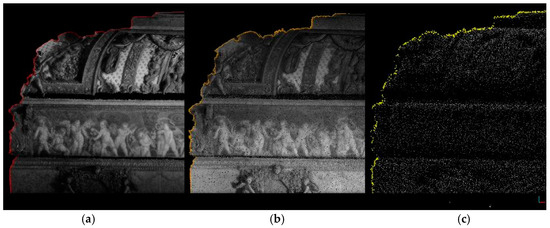
Figure 14.
The benchmarking analysis on multisensors’ data of Fleur-de-lis Chamber in the Valentino Castle. (a) SfM points cloud; (b) LiDAR points cloud; and (c) ZEB points cloud.
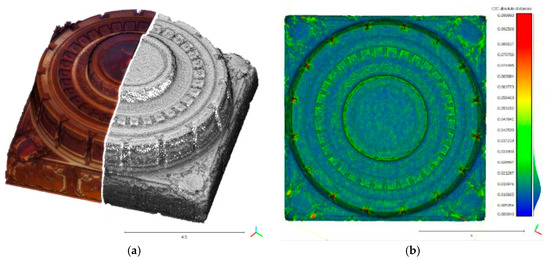
Figure 15.
(a) The Roses Chamber vault and the (b) C2C distances analysis between LiDAR and ZEB.
Table 7.
Comparison of point density related to the close-range photogrammetric model, LiDAR scan, and ZEB scan of the Fleur-de-lis Chamber. Similarities between (*) and between (#).
In Figure 16, the density distribution of the Roses Chamber vault is presented in a colour range map, according to a density that is computed in the number of neighbours in a sphere with r = 0.05 m (CloudCompare density analysis implementation). The thematic map not only shows noticeably the difference of precision of the two sensors in the surface 3D digitalization, but it also makes the interpretation of statistical values of density in the left graphs possible.
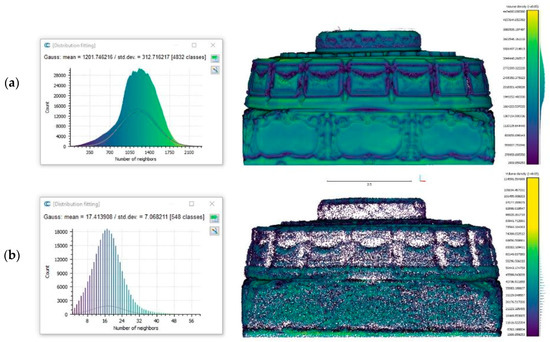
Figure 16.
The two density analysis maps on the Roses Chamber in (a) LiDAR and (b) ZEB models.
In fact, from the distribution values and the curve trend, it is clearly visible that the ZEB data does not admit the accurate description of the detail’s geometry in the recorded objects, as a TLS.
Specifically, when studying the ZEB descriptive aptitudes in surfaces’ reconstruction, it should be considered that a single scan, travelling the whole honour floor in almost 30 min, and collecting almost 35 mln points, manages to model some interesting morphological aspects of the architectural surfaces, i.e., anomalies from the generative geometries behind the wall’s course or vault’s curvature.
In Figure 17b, the optimization of DSM of the Great Salon pavilion vault is thematized by height values, already investigated by the LiDAR-based approach finalized to the structural analysis of the restored wooden structures in [51]; in white, the extraction of isolines from LiDAR DSM and in black the ones that were extracted by ZEB-based DSM. The ZEB-based DSM scale detail certainly could not support high accuracy analysis for structural purposes, but these two examples support the hypothesis that ZEB Revo MMS allows, through a rapid mapping, a dense point cloud and the potentially advantageous collection of medium- to high-scale information, especially for the morphological analysis of internal settings. Figure 17a shows a displacement map of T2–T1, between two ZEB acquisitions at time T1 and T2 and identifies a localized anomaly on the central part of the Fleur-de-lis Chamber vault, which has undergone restoration works and bedding phase for the wooden structures: it has been detected by MMS acquisition and further confirmed by a LiDAR scan.
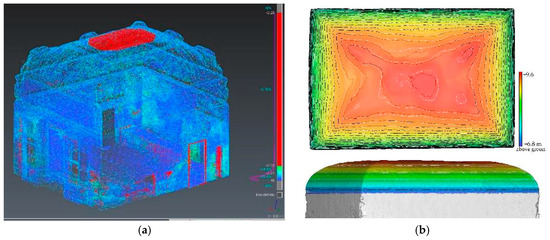
Figure 17.
Morphological anomalies detected by the ZEB sensor: (a) the central part of the Fleur-de-lis Chamber vault in displacement map of T2–T1 and (b) in the Great Salon vault, with the comparison of isolines from the LiDAR DSM (white) and ZEB (black).
4.3. Fusion-Based Strategies Towards Geometric and Radiometric Enrichment and Self-Supporting
The fusion-based strategies are commonly developed where Cultural Heritage documentation projects are based on extensive and heterogeneous starting data, from passive and active sensors, for efficiency and optimization purposes in multiscale and multiresolution 3D models. As previously proposed in research [52,53], the concepts of fusion and integration methods are often the subject of crucial arguments regarding definitions and usages. First of all, the fusion needs arise from the purposes of 3D data features enrichment, i.e., the aim of overcoming the sensor’s own limits (image-based and range-based). Moreover, the levels of processing steps on which the data are managed in the fusion can be the raw data or the processed ones or more post-processed ones. Lastly, the types of information behind the interchange and effective provision between approaches.
Hereafter, a set of these topics are discussed from the perspective of a fusion-driven approach based on data and methods fusion—mainly the photogrammetric approach with the range-based method being recognized as both the innovative MMSs point clouds and the contribution of more accurate terrestrial LiDAR data. The data fusion is aimed in a way oriented towards the optimization and validation of geometrically and radiometrically enriched MMS SLAM-based surfaces:
- Fusion in data processing
- Fusion in meshing model generation
- Fusion of geometric and radiometric data
Thus, this simplified workflow tries to answer some open-ended questions, such as the ones hereafter reported. Is it possible to constitute a schematic pipeline in which sensors’ contributions are optimized? Is it conceivable to have a self-supporting use of the ZEB SLAM-based survey for a kind of extensive and building-scale mapping, even admitting as introduced, a forthcoming autonomy in the georeferencing issues? Hence, how accurate could be a photogrammetric blocks alignment, quickened by the non-involvement of topographic work, using alternatively geometric GCP that is extracted from georeferenced SLAM-based 3D models? Instead, what about the use of TLS-extracted GCPs? After a fusion-based Bundle Block Adjustment (BBA), what would happen if, simply, the block of oriented images was enough to interfacing with a ZEB point cloud properly georeferenced, evading the photogrammetric densification phase? In this case, is it promising to fuse the photogrammetric images, exploiting the oriented block tie points, with dense ZEB clouds in a typical Graphic User Interface (GUI) SfM platform, to perform the geometric and radiometric enrichment of point cloud and triangulated mesh surface in a unique space workflow?
4.3.1. ZEB-Based Photogrammetric Block-Orientation (o Images Block-Orientation): A Hybrid Model
The photogrammetric approach commonly requires a set of coordinates—involved as control points (geometric features as well as contrast markers) in the BBA and in the accuracy check phase—that are generally acquired during time-consuming topographical operations in a different survey moment than the images shooting phase. The availability of a geometrically rich 3D point cloud that is derived from an MMS as the ZEB Revo survey meets some remarkable requirements, together with time savings, practicality, and manageability.
For example, in this case, the ZEB point cloud would like to offer an experimental solution as a source of points coordinates to be exploited in the photogrammetric process of BBA, avoiding topographic measures. This method could be a useful solution in the case of a photogrammetric acquisition without measured targets or with data that is acquired at different times. This proposed data fusion solution to orient a set of photogrammetric images is hereby proven. The considered example is a dataset of 263 photos that were captured by Sony ILCE in the inner courtyard of the Rocca.
The images are aligned with coordinates that were obtained extracting a selection of n°20 points well distributed in the entire space. It has been chosen to compare the alignment with RMSE results, Table 8, using the manually extracted GCPs from the ZEB point cloud, with another two types of reference values:
Table 8.
The precision of coordinates derived from the test of the manual pick-point selection, statistically repeated five times on 20 points and applied on TLS and ZEB point cloud.
- images BBA RMSE results using the same n°20 manually extracted points from the TLS point cloud, and
- images BBA RMSE results using n°20 topographic GCPs with typical contrast markers.
The main difficulties refer to the identification and manual extraction of the point in point clouds because of their lack of direct radiometric accurate data. In fact, RGB information is not currently available in ZEB point clouds, so it is not possible to exploit colour recognition (for instance, contrast markers, as in the case of LiDAR usual pipeline), but it is necessary to pinpoint the geometric features (for instance, architectural ones as corners, windows, edges, 3D decorative elements, or 3D targets), as visible in Figure 18. To reduce the operator imprecision in the manual collimation phase, each point has been selected and extracted n°5 times, by picking-points selection (as implemented in CloudCompare software), and then the arithmetic mean and st. dev. were calculated to estimate the precision of manual point extraction and the effectiveness of the proposed method. The st. dev. related to TLS-extracted coordinates varies from 0.11 cm to 1.47 cm; meanwhile, the ZEB ones vary from 0.44 cm to 9.42 cm, as reported in Table 8.
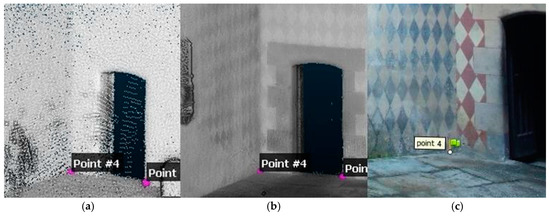
Figure 18.
The n°4 points selected in (a) ZEB and in (b) TLS point cloud for coordinates’ extraction and finally the point was detected and placed on the (c) Digital Single Lens Reflex (DSLR) photo, for the images block-orientation.
Finally, the mean X, Y, and Z values of each point selections were employed as GCPs coordinates to orient the photogrammetric block. To evaluate the effectiveness of these methods, the results of BBA are compared on CPs errors with the ones that were calculated with more accurate coordinates obtained when measuring targets by TS and GNSS surveys. Table 9 presents the results. It is tested that decorative corners are less recognizable in ZEB and LiDAR point clouds and affects the result.
Table 9.
Results of the photogrammetric block adjustment using differently accurate set points: the topographic reference measurements on target points, the Ground Control Points (GCPs) extracted from the LiDAR point surface and the ones from the ZEB point cloud.
4.3.2. Fusion-Based Mesh Triangulation Oriented to High-Scale 3D Digitization and Optimization
The second experimental pipeline within the proposed workflow aims at exploiting the best of descriptive capabilities of each employed method in a kind of multisensor and multiscale survey approach. The chance of creating a multiresolution model, for example, in extensive and compound areas, as in [54], offers a solution towards data selection, segmentation, integration, and addressing to the appropriate level of detail wherever necessary to be increased and concretely approached.
It is based on a triangulated high-quality textured surface that is computed by an optimized multisensor points cloud. The starting data conveyed in the integration test process are:
- ZEB Revo point clouds based on portable rapid-mapping techniques;
- Photogrammetrically Oriented image block; and,
- LiDAR point cloud from TLS acquisition.
The efficient integration in the same pipeline of the LiDAR data and photogrammetric dense cloud has been partially investigated by low-cost 3DVEM–Register GEO tool in [23], but the processing was not yet in the same platform as the SfM workflow. Here, Photoscan Pro by Agisoft GUI (today, Metashape, https://www.agisoft.com) performed the photogrammetric-based workflow for data fusion. The recently released interface can efficiently solve the problem of interoperability in point clouds data import/export from other sensors as well (it is possible to import in *.las, *.e57, *.ply, *.asc formats). For example, the same image-based point cloud could be externally processed (filtered, segmented, or optimized), or a laser point cloud can be imported with or without its radiometric attributes. Moreover, in the GUI it is also possible to merge a photogrammetric image block (Figure 19a), oriented using the MMS-extracted GCPs coordinates, as reported before with ZEB data. As a result, the colourization phase is applied both to the MMS point cloud and to the fusion-driven built mesh, using as primary data the oriented photogrammetric image block. The test has focused on the Fleur-de-lis Chamber and it consisted of the use of different point cloud surfaces, as related to the Table 7 analysis: the photogrammetric-based one (almost 70 mln points); the LiDAR (original not considered, 5 mm filtering, 25.5 mln points, and 1 cm filtering, 3.6 mln points); ZEB SLAM-based point cloud (1.4 mln points). The normal vectors calculation of the input point clouds should be accurately controlled for a uniform distribution and orientation, if a finalization to the triangulated surface calculation (mesh), is foreseen. Although photogrammetric surface normals are correctly computed embedded in the SfM process and dense reconstruction, a range-based data should generally be subjected to normals data recomputation or finalizing.
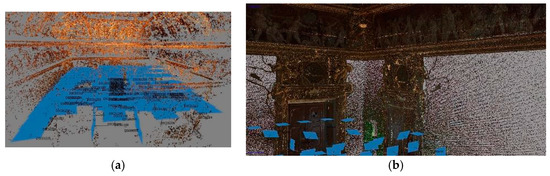
Figure 19.
(a) The oriented images block in the Fleur-de-lis Chamber; (b) The Photoscan Pro Graphic User Interface (GUI) allows for importing external integrated point cloud for the fusion-based mesh triangulation.
A noticeable aspect in the GeoSLAM Hub processing platform is the managing of the shape attribute in output files, as previously reported (Figure 9b, III): this effectively concerns the computation of suitable embedded normal values data associated to the ZEB point cloud output, but the formats that are required for the export exclude *.las, as incompatible with normal data.
The CloudCompare workspace offers an implemented Normal Computation algorithm, working on the octree strategy and using the setting of a point neighbours’ radius area to simplify or improve the computing. Accordingly, the ZEB surface that was used for the meshing processing has been exploited in the original format, as exported from raw processing and with recomputed normals in CloudCompare, with a neighbour’s radius of 5 mm and 15 mm. After the mesh triangulation process as compared in Table 10, simplified surfaces have been reconstructed, as shown in Figure 20a,b. Finally, as has been reported before, the oriented images that were acquired by Sony ILCE 7RM2 were used to associate the radiometric attribute with the ‘colorize’ function, as presented in Figure 20c.
Table 10.
Results of mesh triangulation process, based on different sensors point clouds.
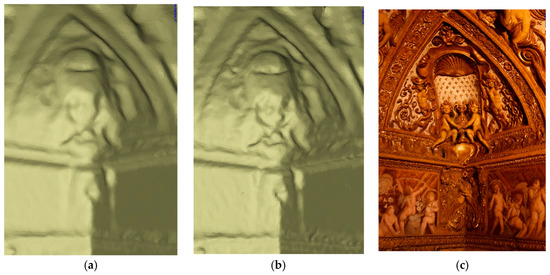
Figure 20.
The ZEB-based surface reconstruction: (a) mesh processed with normal data computed with 15 mm radius and (b) computed with 5 mm; and, (c) with an HQ texture map applied on the (b) surface.
5. Discussion
When geomatics techniques encounter the difficulties in workflows that are arranged for surveying, modelling, organizing, and sharing large cultural heritage, as Valentino Castle and Borgo Medievale, some challenges must be considered, and various solutions must be critically analysed. Interesting solutions that are derived from sensor integration and data fusion are promising, such as sensors and software development to speed up recording and processing time, in operational workflows. This should be addressed to the best possible interoperability of multidimensional data with emerging Information and Communications Technology (ICT) innovations: digital devices and virtualization of models in the real scenarios are a useful implementation for the cultural heritage fields’ users, allowing for digitally exploring ‘immersive’ 3D models and related information. It has been validated that geomatics increasingly provides strategies to deal with specific needs and favouring a multidisciplinary approach, also encouraging wide dissemination of digital culture. However, the 3D documentation phase of an extensive built complex still proves to be a difficult challenge nowadays. It implies various technical aspects concerning data acquisitions, their interoperable management of data, and their finalization to all user-oriented aims.
The present research tries to underline most of these aspects; in particular, advantages and disadvantages of the achieved results are summarized below, mostly focusing on the creation of hybrid 3D models (Section 5.1) and their usability and potentialities (Section 5.2).
5.1. Multisensor Data Complexity: Hybrid 3D Models
In recent decades, with the exponential increase of technological solutions based on sensor improvements and fusion, the Geomatic community proposed many ad hoc solutions of multiscale and multisensor methods, but little about the guidelines and practices to execute them, especially in the built heritage domain.
The generation of a hybridization-driven 3D model could surely return positive effects in the whole workflow, not only in data acquisition and processing phases, but also in terms of data modelling, editing, and optimization for user-oriented purposes. The main idea is constantly to change the perspective on the digitization approach and to preselect and pre-orient ex ante the data content to the request level of detail, instead of ex-post customary lightening, simplification, or drastic filtering. In this paper, the problems regarding the preservation of the descriptive abilities in 3D models are mainly addressed, both in terms of geometrical accuracy and in the integration of radiometric contents, which is such important in the projects that must satisfy future immersive enjoyments.
Thus, the combination of sensors is exploited according to their specific abilities in terms of resolutions, characteristics, and behaviour in certain operational fields, also in critical ones, both indoor and outdoor scenarios. A sensor that works effectively in all conditions does not exist; as well, a single-sensor approach represents a limited approach, although it is often the most used one. After the series of extensive testing, it is possible to summarize some consideration and evaluation, as reported in Figure 21. Obviously, the strategies for achieving multisensor and multiscale models are those chosen to face this challenge, maintaining high attention, as seen above in Section 3 and Section 4, on models that were created by recent rapid-mapping systems, which offer leaner and handy points models, less heavy in terms of file weight as compared with those that were derived from the more traditional LiDAR technology.
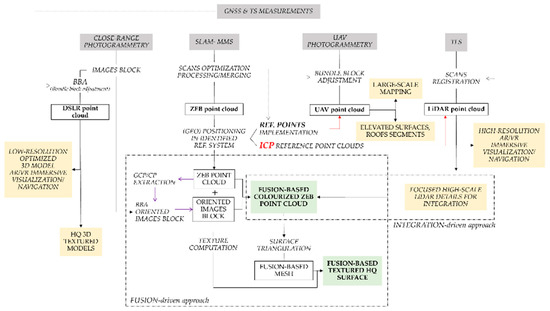
Figure 21.
Graphic workflow of the hybridization of 3D models, deriving from integrated methods and fusion-based approaches. In grey, the acquisition methods, in green the achieved products with the possible connections. In the dashed box the fused and integrated results.
The advantages and disadvantages of each sensor combined with a critical environment suggest undertaking a mixed approach of techniques to obtain a hybrid model. Integrated- and fusion-based approaches could be winning solutions, customizable according to specific needs, in terms of time, costs, and sensors that are finalized to obtain predetermined final products with specific levels of detail, as shown in Figure 21. Following general procedural steps (planning, survey, processing, analysis, and communication), different considerations can be stressed.
Furthermore, the possibility to integrate data that was acquired with different sensors and at different times underlines the ability of sensors to record geometrical differences and suggest further interesting analyses. In the planning phase, it is necessary to consider setting conditions. Spaces like the ones studied in this paper provide some challenging examples of where to perform a survey, because of building sizes, multilevel and articulated spaces, light conditions, presence of movable elements, little details, and fragile elements, as many cultural heritage assets show the occurrence of occlusions, as furnishing and artworks. In parallel, the presence of standing and leaning outdoor tall trees on the curtain walls influenced the survey very much: in most cases, they cover the architectural structure of the buildings and increase the non-continuity and noise errors of the dense clouds.
Sometimes—as demonstrated in 4.1(IV)—UAV photogrammetry can deliver affordable data comparable to MMS in terms of resolution, allowing for the georeferencing of MMS data and promoting their integration; in this way, a combined use also constitutes a rapid approach in architectural mapping in the case of extreme conditions, such as low overlapping areas. Furthermore, another fast approach can be pursued extracting 3D coordinates from MMS point cloud and using them to align a set of images that were captured with a DSLR. Referring to a deeper level of detail, a products fusion can be pursued exploiting LiDAR data for minute parts—as decorative elements—MMS data for a general overview of the context—such as walls or simple geometries—and close-range photogrammetry for radiometric quality that is derived by an oriented block of images. After the discussed experiences and the reported results, it is possible to assert that both the Rocca Medievale and the Valentino Castle justified such a kind of multisensor approach to obtain a complete 3D model. In Figure 21, a schema of the proposed approach for 3D model’s hybridization is reported.
5.2. Usability and Flexibility Potential of 3D Models: Towards Navigation and Augmented Reality
Once the model is available, after the analysis and validation, an important issue is the use of the achieved products. Without addressing wide-ranging issues, such as the primary ones in the domain of communication of built heritage (four-dimensional (4D) recording, fruition of multidisciplinary information, 3D inventories, user friendly web platform), we intend to discuss the topics of usability potential related to 3D enriched data, with some examples of the most promising and cutting-edge applications that are related to the immersive use and navigability of the 3D data; thereafter, some examples.
It is very important to consider that many tools enabling model navigation (and video recording) are available; they permit overcoming, to a certain extent, the criticality of the difficult management of large amounts of data. The Recap Pro software by Autodesk (https://www.autodesk.com/products/recap), for example, offers navigation within points clouds that is particularly decimated, able to support navigation in real time, while also using smart devices that connect via the server for navigation of the model.
The application shown in Figure 22 was created, starting from the complete LiDAR points cloud, coloured by the automatic process of the FARO® system equipped with the coaxial camera. The total huge size of this registered cloud is equal to 66.4 Gb (in *.E57 standard format), as it is composed of 3268 mln points; once filtered, with 5 mm distance constant value, the point cloud size became around 325 mln (8.3 Gb *.las format and 5.8 Gb *.e57 standard format). Despite the possibility of user interaction, with the 3D model being limited on this platform, the navigation with the subjective point of view that moves all around the space that is represented by the digital model is certainly immersive and suggestive, and it does not suffer from the amount of points data, which are only rendered with the level of detail to be zoomed in. It is undeniable, in fact, that this navigation makes it possible to observe and learn some of the main characteristics regarding the decorative apparatus of the rooms. In the Fleur-de-lis Chamber, a stucco frieze and triangular coves in the corners support the impressive composition of the vault, which is enriched with a dance of putti, ribbons, amphorae, and floral decorations. It is certainly not possible to recognize authors or learn other specialist information, but the communication purpose for general fruition is achieved.
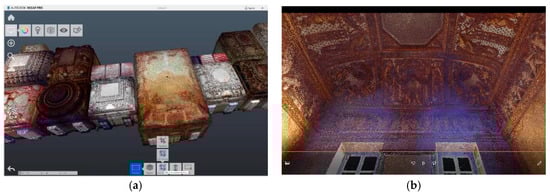
Figure 22.
(a) A screenshot of the LiDAR points model managed in the Recap environment; (b) A screenshot from the video navigation achieved from LiDAR points cloud.
Using optimized models that are based on image or range-based approaches for fruition purposes and augmented reality (AR) or computer-mediated reality, that is a growing interest in the cultural heritage domain. They consist of enriching the human sensory perception through digital information, which would not be perceptible with the senses. Elements that ‘increase’ reality can be added through a mobile device, such as a smartphone, with the use of a PC that is equipped with a webcam or other sensors with vision devices. The new representation techniques (virtual reality (VR) and AR), provide immersive experiences in the virtual heritage field; the digital object can be queried by the user through the same dynamics that are present in the world of digital entertainment, a factor that surely is recognized by a relatively young audience, but intrigues a wider target audience, becoming a means of communication that meets today’s expectations [55].
In the Honour Salon of the Valentino Castle, (Figure 23a), an AR test was performed [56] using the software solution by Metaio (no longer active, since being acquired by Apple). Here, it is possible to view the Honour Salon by simply moving the device, just as if you were inside the scene, and then, thanks to the framing by the camera of the simplified greyscale DSM of the dome, enable the visualization on it of the 3D model. It is a rather interesting shared use of technologies: the 6D Augmented Reality Holodeck technology (named 6D-AR) takes the advantages from SLAM algorithms and from the on-board IMUs motion sensors to attach the virtual environment to the real world, exploiting the camera of smart devices [57]. Moreover, in this case, it is obviously possible to learn the decorative themes of the frescoes, which consist in the exaltation of the Savoy family through the re-enactment of military enterprises. At the same time, it is possible to examine the expertise of the scenic installation that reproduces twisted columns and a balcony that was executed by Isidoro Bianchi who painted with the collaboration of his sons between 1633 and 1642 [31].
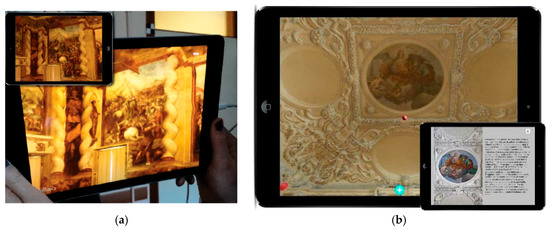
Figure 23.
(a) The SLAM for full six-dimensional virtual reality/augmented reality (6D VR/AR) application running on an iPad; (b) Interactive model of the hall showing typical points enabling to reach additional information.
From an operational point of view, here, a LiDAR model was preferred to the image-based one, because the large hall with openings on the short side is dark and difficult to illuminate, together with the criticality represented huge historic chandelier that has been masked in all of the images used for the photogrammetric matching and the SfM process. As already ascertained, the block of oriented images has been used to texturize the LiDAR model, which is superior and less noisy as far as metric accuracy is concerned. The triangulated continuous model achieved both with the open source MeshLab interface and with the commercial 3Dreshaper software, which had provided completely similar qualitative results, had been texturized and optimized with Blender software, being the most efficient and widespread in the field of simplification and optimization of texturized models: the initial filtered cloud of 10 mln points had been reduced to a polygonal model of about 180k vertices.
In the Hall of Feasts and Splendours, instead, with the richly decorated vault with light stuccos in high relief, the environmental condition allowed generation of the texturized model using DSLR images and SfM algorithms, obtaining a customary accuracy of around 1 cm [58]. The whole process of modelling the triangulated surface (about 5 mln polygons) and its texture were performed using the software Photoscan. The game engine that is selected for application development is Unity 3D, which is widespread and widely used in this sector, because it allows for high interoperability with different devices and platforms (the software is considered to be cross-platform, i.e., able to develop the WebGL project for PC, Android, iOS, and Windows Phone for mobile devices). Additionally, in this case, the final objective has been reached, that is, besides testing the interoperability of instruments and data between different application fields, it was to create a basic communication product composed of a navigable model that is characterized by an interactive system that is capable of providing informative details on the Hall, through the pressure of characteristic points arranged within the model (Figure 23b).
There are still many critical issues in integrating models derived from Geomatic techniques and game design software, mainly consisting in the criticality of using models derived from millions of points in systems designed to manage models of reality that are much more simplified.
6. Conclusions
Nowadays, 3D documentation of extensive built heritage complexes still proves to be a difficult challenge. It implies various aspects regarding acquisition, management of data, their interoperability, and their finalization to all user-oriented purposes (Figure 24).
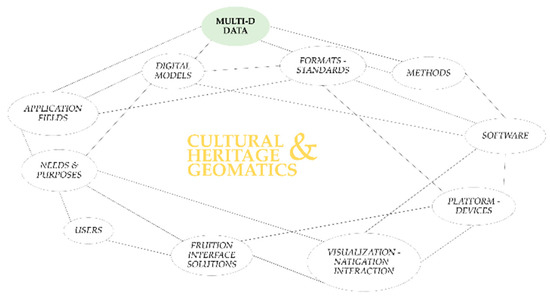
Figure 24.
Relations between many deterministic factors turning around the Geomatics approach working in the cultural heritage domain.
The research proposed here mostly refers to an essential answer to the diffuse increasing spread of innovative input and traditional requests in the Cultural Heritage domain belonging to the digital era: it has to face many domains (disciplines, users, purposes, data, formats, software, supports, type, and mode of visualization) that are connected with each other.
With different depth, this paper has been dedicated to addressing both the evaluation of the effectiveness of the models and the current critical issues related to management tools. Moreover, the themes of data interoperability, operating times in acquisition and processing, and issues that are related to the management of large amounts of data have been discussed. The achieved results connected to technologies’ progress are above presented; nonetheless, to pursue it, some issues remain and must be solved.
It has been demonstrated that geomatics provide strategies to deal with specific needs and purposes, favouring a multidisciplinary approach, while also encouraging the wide dissemination of digital technologies. Geomatics for heritage digitization addresses, in these cases, the entire workflow to manage the concept of complexity behind the building challenges (Figure 21). Once derived from data acquisition and processing, reality-based models offer a wide range of applications, responding to specific needs of costs and purposes, such as documentation, analysis, and sharing. The possibility to integrate other sources—textual and/or graphics—lead to the creation and management of digital georeferenced databases.
Thanks to different supports—PCs, smartphones, tablets, visors—various users can explore these models in online or offline modes; in these visualizations, immersive, interactive, augmented, or virtual realities offer a more and more expanding way to understand and discover.
These aspects require the capability of handling huge amounts of multidimensional data—among others, geometry, time, and radiometry—characterized by digital formats and standards created, managed, and visualized in various software, applications, and platforms. If the future idea is to work in the direction of allowing the user to move freely in the reconstructed scenario, then it is obviously essential to consider the completeness constraints of the model, which constitutes, in addition to the previous, one of the quality parameters for the evaluation of the models of the reality.
Author Contributions
Conceptualization, F.C., An.S., G.S. Al.S.; Data curation, Al.S.; Formal analysis, G.S. and Al.S; Investigation, Al.S; Methodology, G.S. and An.S.; Resources, F.C.; Supervision, F.C. and An.S.; Validation, An.S.; Writing – original draft, G.S. and Al.S; Writing – review & editing, F.C., G.S. and An.S.
Funding
the research presented here is supported by the joint research project ‘Turin 1911’ between Politecnico di Torino and University of California San Diego.
Acknowledgments
a special thanks to the University of California San Diego for the joint research project ‘Turin 1911′: Cristina Della Coletta. The authors thank also L. Teppati Losè, G. Patrucco, E. Colucci, D. Einaudi from the Laboratory of Geomatics for Cultural Heritage (G4CH Lab) of Politecnico di Torino for data acquisition and C. Bonfanti from MESA srl for ZEBRevo RT by GeoSLAM for suggestions and help.
Conflicts of Interest
The authors declare no conflict of interest.
References
- Donadio, E. 3D Photogrammetric Data Modeling and Optimization for Multipurpose Analysis and Representation of Cultural Heritage Assets. Ph.D. Thesis, Politecnico di Torino, Torino, Italy, 2018. [Google Scholar]
- Chiabrando, F.; Della Coletta, C.; Sammartano, G.; Spanò, A.; Spreafico, A. “TORINO 1911” Project: A Contribution of a SLAM-based Survey to Extensive 3D Heritage Modeling. ISPRS Int. Arch. Photogramm. Remote Sens. Spat. Inf. Sci. 2018, 42, 225–234. [Google Scholar] [CrossRef]
- Ramos, M.M.; Remondino, F. Data fusion in Cultural Heritage—A Review. ISPRS Int. Arch. Photogramm. Remote Sens. Spat. Inf. Sci. 2015, 40, 359–363. [Google Scholar] [CrossRef]
- Pierrot-Deseilligny, M.; De Luca, L.; Remondino, F. Automated Image-Based Procedures for Accurate Artifacts 3D Modeling and Orthoimage Generation. Geoinform. FCE CTU 2011, 6, 291–299. [Google Scholar] [CrossRef]
- Guidi, G.; Russo, M.; Ercoli, S.; Remondino, F.; Rizzi, A.; Menna, F. A Multi-Resolution Methodology for the 3D Modeling of Large and Complex Archeological Areas. Int. J. Arch. Comput. 2009, 7, 39–55. [Google Scholar] [CrossRef]
- Remondino, F.; Girardi, S.; Rizzi, A.; Gonzo, L. 3D modeling of complex and detailed cultural heritage using multi-resolution data. J. Comput. Cult. Herit. 2009, 2, 1–20. [Google Scholar] [CrossRef]
- Murtiyoso, A.; Grussenmeyer, P.; Suwardhi, D.; Awalludin, R. Multi-Scale and Multi-Sensor 3D Documentation of Heritage Complexes in Urban Areas. ISPRS Int. J. Geo-Inf. 2018, 7, 483. [Google Scholar] [CrossRef]
- Tucci, G.; Bonora, V.; Conti, A.; Fiorini, L. Digital Workflow for the Acquisition and Elaboration of 3D Data in a Monumental Complex: The Fortress of Saint John the Babtist in Florence. ISPRS Int. Arch. Photogramm. Remote Sens. Spat. Inf. Sci. 2017, 42, 679–686. [Google Scholar] [CrossRef]
- Farella, E.; Menna, F.; Nocerino, E.; Morabito, D.; Remondino, F.; Campi, M. Knowledge and valorization of historical sites through 3D documentation and modeling. Int. Arch. Photogramm. Remote Sens. Spat. Inf. Sci. ISPRS Arch. 2016, 41, 255–262. [Google Scholar] [CrossRef]
- Bitelli, G.; Dellapasqua, M.; Girelli, V.A.; Sanchini, E.; Tini, M.A. 3D Geomatics Techniques for an Integrated Approach to Cultural Heritage Knowledge: The Case of San Michele in Acerboli’s Church in Santarcangelo di Romagna. ISPRS Int. Arch. Photogramm. Remote Sens. Spat. Inf. Sci. 2017, 42, 291–296. [Google Scholar] [CrossRef]
- Kim, J.; Lee, S.; Ahn, H.; Choi, C. Feasibility of employing a smartphone as the payload in a photogrammetric UAV system. ISPRS J. Photogramm. Remote Sens. 2013, 79, 1–18. [Google Scholar] [CrossRef]
- Masiero, A.; Fissore, F.; Piragnolo, M.; Guarnieri, A.; Pirotti, F.; Vettore, A. Initial Evaluation of 3D Reconstruction of Close Objects with Smartphone Stereo Vision. ISPRS Int. Arch. Photogramm. Remote Sens. Spat. Inf. Sci. 2018, 42, 289–293. [Google Scholar] [CrossRef]
- Fangi, G.; Nardinocchi, C. Photogrammetric Processing of Spherical Panoramas. Photogramm. Rec. 2013, 28, 293–311. [Google Scholar] [CrossRef]
- Pérez Ramos, A.; Robleda Prieto, G. Only Image Based for the 3D Metric Survey of Gothic Structures by Using Frame Cameras and Panoramic Cameras. ISPRS Int. Arch. Photogramm. Remote Sens. Spat. Inf. Sci. 2016, 41, 363–370. [Google Scholar] [CrossRef]
- Grussenmeyer, P.; Landes, T.; Voegtle, T.; Ringle, K. Comparison Methods of Terrestrial Laser Scanning, Photogrammetry and Tacheometry Data for Recording of Cultural Heritage Buildings. ISPRS Int. Arch. Photogramm. Remote Sens. Spat. Inf. Sci. 2008, XXXVI, 213–218. [Google Scholar]
- Lerma, J.L.; Navarro, S.; Cabrelles, M.; Villaverde, V. Terrestrial laser scanning and close range photogrammetry for 3D archaeological documentation: The Upper Palaeolithic Cave of Parpalló as a case study. J. Archaeol. Sci. 2010, 37, 499–507. [Google Scholar] [CrossRef]
- Mandelli, A.; Fassi, F.; Perfetti, L.; Polari, C. Testing Different Survey Techniques to Model Architectonic Narrow Spaces. ISPRS Int. Arch. Photogramm. Remote Sens. Spat. Inf. Sci. 2017, XLII-2/W5, 505–511. [Google Scholar] [CrossRef]
- Eyre, M.; Wetherelt, A.; Coggan, J. Evaluation of automated underground mapping solutions for mining and civil engineering applications. J. Appl. Remote Sens. 2016, 10, 046011. [Google Scholar] [CrossRef]
- Sammartano, G.; Spanò, A. Point clouds by SLAM-based mobile mapping systems: Accuracy and geometric content validation in multisensor survey and stand-alone acquisition. Appl. Geomatics 2018, 10, 317–339. [Google Scholar] [CrossRef]
- di Filippo, A.; Sánchez-Aparicio, L.; Barba, S.; Martín-Jiménez, J.; Mora, R.; González Aguilera, D. Use of a Wearable Mobile Laser System in Seamless Indoor 3D Mapping of a Complex Historical Site. Remote Sens. 2018, 10, 1897. [Google Scholar] [CrossRef]
- Rottensteiner, F.; Trinder, J.; Clode, S.; Kubik, K. Building detection by fusion of airborne laser scanner data and multi-spectral images: Performance evaluation and sensitivity analysis. ISPRS J. Photogramm. Remote Sens. 2007, 62, 135–149. [Google Scholar] [CrossRef]
- Fassi, F.; Achille, C.; Fregonese, L. Surveying and modelling the main spire of Milan Cathedral using multiple data sources. Photogramm. Rec. 2011, 26, 462–487. [Google Scholar] [CrossRef]
- Munumer, E.; Lerma, J.L. Fusion of 3D data from different image-based and range-based sources for efficient heritage recording. In Proceedings of the 2015 Digital Heritage, Granada, Spain, 28 September–2 October 2015; pp. 83–86. [Google Scholar]
- Della Coletta, C. World’s Fairs Italian-Style: The Great Exhibitions in Turin and Their Narratives, 1860–1915; University of Toronto Press: Toronto, ON, Canada, 2016; ISBN 9781487520564. [Google Scholar]
- Best, S.; Kellner, D. Postmodern Theory Critical Interrogations; Macmillian: Basingstoke, UK, 1991. [Google Scholar]
- Bianchi, C. Il Valentino (Storia di un parco); Il piccolo editore: Torino, Italy, 1984; ISBN 88-7654-023-7. [Google Scholar]
- AA.VV. Il Borgo Medievale. Nuovi Studi; Pagella, E., Ed.; Edizioni Fondazione Torino Musei: Torino, Italy, 2011; ISBN 978-88-88103-83-9. [Google Scholar]
- Un Borgo Colla Dominante Rocca. Studi Per la Conservazione del Borgo Medievale di Torino; Bartolozzi, C., Ed.; Celid: Torino, Italy, 1995; ISBN 88-7661-212-2. [Google Scholar]
- Donato, G. Omaggio al Quattrocento: Dai Fondi D’Andrade, Brayda, Vacchetta; Borgo Medievale: Torino, Italy, 2006. [Google Scholar]
- Roggero, C.; Dameri, A. The Castello del Valentino; Allemandi & C.: Torino, Italy, 2008; ISBN 978-88-422-1664-3. [Google Scholar]
- Roggero, C.; Scotti, A. Il Castello del Valentino/The Valentino Castle; Politecnico di Torino: Torino, Italy, 1994. [Google Scholar]
- Bertolini-Cestari, C.; Chiabrando, F.; Invernizzi, S.; Marzi, T.; Spanò, A. Terrestrial Laser Scanning and Settled Techniques: A Support to Detect Pathologies and Safety Conditions of Timber Structures. Adv. Mater. Res. 2013, 778, 350–357. [Google Scholar] [CrossRef]
- Nocerino, E.; Menna, F.; Remondino, F.; Toschi, I.; Rodríguez-Gonzálvez, P. Investigation of indoor and outdoor performance of two portable mobile mapping systems. In Proceedings of the SPIE Videometrics, Range Imaging, and Applications XIV, Munich, Germany, 25–29 June 2017; Remondino, F., Shortis, M.R., Eds.; 2017. [Google Scholar]
- Rodríguez-Gonzálvez, P.; Fernández-Palacios, B.J.; Muñoz-Nieto, Á.L.; Arias-Sanchez, P.; Gonzalez-Aguilera, D. Mobile LiDAR system: New possibilities for the documentation and dissemination of large cultural heritage sites. Remote Sens. 2017. [Google Scholar] [CrossRef]
- Lagüela, S.; Dorado, I.; Gesto, M.; Arias, P.; González-Aguilera, D.; Lorenzo, H. Behavior analysis of novel wearable indoor mapping system based on 3d-slam. Sensors 2018, 18, 766. [Google Scholar] [CrossRef] [PubMed]
- Cabo, C.; Del Pozo, S.; Rodríguez-Gonzálvez, P.; Ordóñez, C.; González-Aguilera, D. Comparing Terrestrial Laser Scanning (TLS) and Wearable Laser Scanning (WLS) for Individual Tree Modeling at Plot Level. Remote Sens. 2018, 10, 540. [Google Scholar] [CrossRef]
- Thomson, C.; Apostolopoulos, G.; Backes, D.; Boehm, J. Mobile Laser Scanning for Indoor Modelling. ISPRS Ann. Photogramm. Remote Sens. Spat. Inf. Sci. 2013, 5, 289–293. [Google Scholar] [CrossRef]
- Zlot, R.; Bosse, M.; Greenop, K.; Jarzab, Z.; Juckes, E.; Roberts, J. Efficiently capturing large, complex cultural heritage sites with a handheld mobile 3D laser mapping system. J. Cult. Herit. 2014, 15, 670–678. [Google Scholar] [CrossRef]
- Lehtola, V.V.; Kaartinen, H.; Nüchter, A.; Kaijaluoto, R.; Kukko, A.; Litkey, P.; Honkavaara, E.; Rosnell, T.; Vaaja, M.T.; Virtanen, J.P.; et al. Comparison of the selected state-of-the-art 3D indoor scanning and point cloud generation methods. Remote Sens. 2017, 9, 796. [Google Scholar] [CrossRef]
- Dewez, T.J.B.; Yart, S.; Thuon, Y.; Pannet, P.; Plat, E. Towards cavity-collapse hazard maps with Zeb-Revo handheld laser scanner point clouds. Photogramm. Rec. 2017, 32, 354–376. [Google Scholar] [CrossRef]
- Dewez, T.J.B.; Plat, E.; Degas, M.; Richard, T.; Pannet, P.; Thuon, Y.; Meire, B.; Watelet, J.-M.; Cauvin, L.; Lucas, J. Handheld Mobile Laser Scanners Zeb-1 and Zeb-Revo to map an underground quarry and its above-ground surroundings. In Proceedings of the 2nd Virtual Geosciences Conference, Bergen, Norway, 21–23 September 2016. [Google Scholar]
- Tucci, G.; Visintini, D.; Bonora, V.; Parisi, E. Examination of Indoor Mobile Mapping Systems in a Diversified Internal/External Test Field. Appl. Sci. 2018, 8, 401. [Google Scholar] [CrossRef]
- Bosse, M.; Zlot, R.; Flick, P. Zebedee: Design of a Spring-Mounted 3-D Range Sensor with Application to Mobile Mapping. IEEE Trans. Robot. 2012, 28, 1104–1119. [Google Scholar] [CrossRef]
- Cadge, S. Welcome to the ZEB REVOlution. GEOmedia 2016, 20, 22–26. [Google Scholar]
- Rossi, P.; Mancini, F.; Dubbini, M.; Mazzone, F.; Capra, A. Combining nadir and oblique uav imagery to reconstruct quarry topography: Methodology and feasibility analysis. Eur. J. Remote Sens. 2017. [Google Scholar] [CrossRef]
- Xiao, X.; Guo, B.; Shi, Y.; Gong, W.; Li, J.; Zhang, C. Robust and rapid matching of oblique UAV images of urban area. In Proceedings of the MIPPR 2013: Pattern Recognition and Computer Vision, Wuhan, China, 26–27 October 2013; Cao, Z., Ed.; p. 89190Y. [Google Scholar]
- Aicardi, I.; Chiabrando, F.; Grasso, N.; Lingua, A.; Noardo, F.; Spanò, A.T. UAV Photogrammetry with Oblique Images: First Analysis on Data Acquisition and Processing. ISPRS Int. Arch. Photogramm. Remote Sens. Spat. Inf. Sci. 2016, 41, 835–842. [Google Scholar] [CrossRef]
- Calantropio, A.; Patrucco, G.; Sammartano, G.; Teppati Losè, L. Low-cost sensors for rapid mapping of cultural heritage: First tests using a COTS Steadicamera. Appl. Geomat. 2018, 10, 31–45. [Google Scholar] [CrossRef]
- Luis, J.; Navarro, S.; Cabrelles, M.; Elena, A.; Haddad, N.; Akasheh, T. Integration of Laser Scanning and Imagery for Photorealistic 3D Architectural Documentation. In Laser Scanning, Theory and Applications; InTech: London, UK, 2011; ISBN 978-953-307-205-0. [Google Scholar]
- Zalama, E.; Gómez-García-Bermejo, J.; Llamas, J.; Medina, R. An Effective Texture Mapping Approach for 3D Models Obtained from Laser Scanner Data to Building Documentation. Comput. Civ. Infrastruct. Eng. 2011, 26, 381–392. [Google Scholar] [CrossRef]
- Bertolini-Cestari, C.; Spanò, A.T.; Invernizzi, S.; Donadio, E.; Marzi, T.; Sammartano, G. Historical Earthquake-Resistant Timber Framing in the Mediterranean Area; Cruz, H., Saporiti Machado, J., Campos Costa, A., Xavier Candeias, P., Ruggieri, N., Manuel Catarino, J., Eds.; Lecture Notes in Civil Engineering; Springer International Publishing: Cham, Switzerland, 2016; Volume 1, ISBN 978-3-319-39491-6. [Google Scholar]
- Vosselman, G. Fusion of laser scanning data, maps, and aerial photographs for building reconstruction. In Proceedings of the IEEE International Geoscience and Remote Sensing Symposium, Toronto, ON, Canada, 24–28 June 2002; Volume 1, pp. 85–88. [Google Scholar]
- Dasarathy, B.V. Decision Fusion; IEEE Computer Society Press: Los Alamitos, CA, USA, 1994; ISBN 0818644524. [Google Scholar]
- Guidi, G.; Remondino, F.; Russo, M.; Spinetti, A. Range sensors on marble surfaces: Quantitative evaluation of artifacts. In Proceedings of the SPIE on Videometrics, Range Imaging, and Applications X, San Diego, CA, USA, 2–6 August 2009; Remondino, F., Shortis, M.R., El-Hakim, S.F., Eds.; 2009; Volume 7447, p. 744703. [Google Scholar]
- Martina, A. Virtual Heritage: New Technologies for Edutainment; Politecnico di Torino: Torino, Italy, 2014. [Google Scholar]
- Dalpozzi, M. Modelli 3D e Realtà Aumentata: Un’applicazione sul Salone d’Onore al Castello del Valentino; Politecnico di Torino: Torino, Italy, 2014. [Google Scholar]
- SLAM For Full 6D VR/AR. Available online: https://my.metaio.com/dev/sdk/tutorials/slam-for-full-6d-vrar/index.html (accessed on 1 January 2015).
- Crivellari, G. Nuove Frontiere Delle Tecnologie per la Fruizione dei Beni Culturali: Un’app per la Sala Delle Feste e dei Fasti. Master’s Thesis, Politecnico di Torino, Torino, Italy, 2016. [Google Scholar]
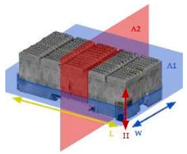
© 2019 by the authors. Licensee MDPI, Basel, Switzerland. This article is an open access article distributed under the terms and conditions of the Creative Commons Attribution (CC BY) license (http://creativecommons.org/licenses/by/4.0/).