Article

PPGIS and Public Use in Protected Areas: A Case Study in the Ebro Delta Natural Park, Spain

by
Amalia Vaneska Palacio Buendía
,
María Yolanda Pérez Albert
and
David Serrano Giné
*
Department of Geography, Universitat Rovira i Virgili, 43480 Vila-Seca, Spain
*
Author to whom correspondence should be addressed.
ISPRS Int. J. Geo-Inf. 2019, 8(6), 244; https://doi.org/10.3390/ijgi8060244
Submission received: 12 March 2019 / Revised: 18 May 2019 / Accepted: 26 May 2019 / Published: 28 May 2019

Abstract

:
This paper analyses public use in the Ebro Delta Natural Park using PPGIS (public participation geographic information system) methodology. An online survey was designed using Google Maps API, HTML, and JAVASCRIPT. Respondents were asked to place and rate thirteen items on an interactive map to characterize and georeference public use with regard to accessibility, facilities and services, signposting, safety and security, and leisure activities. In total we collected 209 valid surveys and mapped 2617 georeferenced opinions. Facilities and services were rated highly by users (72.46% were “very satisfied”). These were followed by accessibility (61%, “very satisfied”) and signposting (60.2%, “satisfied” or “quite satisfied”). Safety and security items were hardly rated perhaps because users do not feel insecure in the area. Respondents’ mapping of opinions and experiences, which are heterogeneous and were well rated, enabled us to visualize areas that might be understood as social hotspots. Our results show that PPGIS is an effective procedure for measuring public use in protected areas and may be a valuable tool for park managers and planners.

Graphical Abstract

1. Introduction

Public use refers to all sorts of human activities that are related to visitation or leisure and can be found in a protected area [1]. The International Union for Conservation of Nature includes public use within generic legislation for protected areas [2,3]. EUROPARC (European Federation of National and Natural Parks), for its part, defines public use as the set of programmes, facilities, activities and types of services that are provided by park managers to enable visitors to enjoy natural and cultural values in a safe and proper fashion [4]. In short, public use encompasses any visitor’s demands in a protected area by considering the characteristics and values of the site itself [5].
A wide range of public use policies are extremely important for protecting natural and cultural resources and ensuring maintenance operations, visitor services, and the management of protected areas as a whole. The aim of most common programmes is to prevent overcrowding, environmental degradation, lack of information, and visitor misbehaviour [2]. Public use therefore embraces all leisure and visitation activities that may be carried out in a protected area and require management or regulation to ensure conservation [1,4]. A wealth of studies has focused on public use in protected areas and produced meaningful management outcomes. Some authors [6] studied intensity of use along trails in a set of protected areas in Norway while also paying attention to litter disposal and the use of informal trails. A study by Reference [7] that evaluated trail usage for horse riding and mountain biking in an Australian protected area indicated conflict locations and noted potential areas of conflict. A study by Reference [8], which focused on visitors’ feelings and analysed crowding perception and satisfaction in a natural park in Spain, provided insights for site managers. In short, public use takes into account what people do in protected areas, as well as where and how they do it in order to understand and manage visitors’ behaviour. Three main strategies help to adjust public use include direct regulation, directive measures, and indirect measures [9]. Direct regulation relies on policing, regulations, and force of law to educate visitors’ behaviour. Directive measures guide visitors in desired directions or attitudes but do not impose or enforce behaviours. Indirect measures use information, interpretation, and other learning opportunities to raise visitor awareness while allowing them the freedom to act. A combination of these three types of measures is usually employed but managers tend to turn to direct regulation when the other two measures fail [9]. Visitors are not usually aware of these measures and do not need to be for them to succeed [5]. However, public use measures help managers to understand visitor behaviour and level of satisfaction and improve visitor experience [2]. Public use should therefore be monitored in order to assess the environmental and social impact of visitors, assess service quality, and evaluate visitors’ needs and experiences [9].
Public use can be monitored on a gradual scheme from simple situations to complex ones. A scheme by Reference [1] pinpoints five levels (from initial to advanced) that can be implemented as needs arise and require a range of effort to (1) collect, (2) summarise, (3) analyse, and (4) interpret data for management action. The public use approach is also summarized in eight programmes: welcoming, quality of facilities, environmental education, task monitoring and evaluation, finance, training, management and administration, public participation, health and safety, and research. Above all, proper public use is key to promoting sustainability and ensuring minimum social and environmental standards [3].
Public use studies provide detailed information about visitor profiles, preferences, motivations, satisfaction and movements within protected areas [5]. Behaviour and behavioural intentions can be sensed and predicted, and specific and collective attitudes recognised. This is extremely important for conservation and management and provides critical information for park managers on items such as social impact, attitudes towards policies [10] and potential damage to the environment [6]. Public use data have implications for planning and management [1,2,3,4,5,6] and have proved to be useful in assessing crowd perception and satisfaction among types of visitors [8].
Public Participatory GIS (PPGIS) is a reference procedure for acquiring georeferenced information from non-expert users [11] and engaging public participation by visitors to protected areas in a spatial dimension [11,12]. It has been used to explore the attitudes of local residents towards protected areas [13], evaluate trade-offs between conservation and land use [14], detect the social acceptance of protected areas [15], and map and weigh landscape values [16], conflicts [17], and user behaviour [18]. The spatial nature of PPGIS enables a wide range of events to be placed into coordinates and mapped [19]. The obvious application is the user’s spatial zoning [20]. Related applications include intensity of use and conflict between different types of visitors [7] as well as spatial patterns and types of behaviour [17].
Public use in protected areas can benefit from PPGIS in many ways. Management practices are an excellent example of this since they are crucial for correct implementation of public use [2,4]. Biodiversity, nature protection, and tourism [9] are linked to public use practices. Everyday activities such as visitor services or maintenance operations are also crucial issues in public use [1]. In general, PPGIS is an excellent tool for consensus-based decision-making [11,12,19] and open-air activities, that is, public use of these spaces, are a perfect way of taking full advantage of these protected areas.
In this paper, we analyse public use in a protected area using PPGIS and surveying both local and non-local users. Our aims are to determine how and where users use public spaces and learn their opinion about them. For our study, we have chosen the Ebro Delta Natural Park (Spain) and use social data and a customized App based on Google Maps as our information source and work procedure.

2. Materials and Methods

We conducted this study using a five-step procedure. First, we selected and formulated the items to evaluate; second, we designed and constructed the PPGIS interface; third, we evaluated a test version; fourth, we distributed the PPGIS survey; and finally, we performed statistical and spatial analysis and qualitative interpretation.

2.1. Item Selection

We evaluated public use by considering five items. Four of these concerned facilities and services and one concerned leisure. Though this list of items is not comprehensive, it is complete and embraces the most common important features regarding public use in protected areas in general [1,2,4] and the area under study in particular [21,22] (Table 1).
The items evaluated are understood in a broad sense. They include not only their presence or absence but also their visibility and conservation and the users’ sensations and general feelings. This is especially important when considering signposting, safety or security since users’ experience relies more on their perception of these items than on their existence [4]. Leisure items include the most common active (e.g., outdoor activities) or passive (e.g., sampling of local cuisine) activities, as well as other activities that are not listed above.

2.2. PPGIS Interface

PPGIS was designed as a spatial online survey [19,23,24,25]. The survey’s base map was taken from Google Maps and is based on its application programming interface (API). The information was collected using Google Forms (a Google Drive application) and edited using Notepad++. Finally, Dropbox and Hostinger were used as the host service platform. The online survey was conceived as a PPGIS product and sought the participation of users on a georeferenced basis [4,19]. The survey was designed as a set of items to be evaluated by rating and placing them on a map. Google Maps API was used for the online mapping, and the respondents’ answers were collected automatically online [24]. As the API runs on Hypertext Markup Language (HTML), it can be embedded into a webpage to achieve interactivity. The survey (English version, only available for consult in the framework of this paper) can be accessed via this link: http://interactivemaps.esy.es/web/index_de_en.html.
The survey is split into two sections and nineteen questions. The first section comprised six socio-demographic questions in order to classify the respondents. Specifically, respondents were asked about their country, place of residence, age, occupation, time since the last visit, and frequency of visitation. The first four questions could be answered using a short text of up to 22 characters, while the last two were multiple choice so as to enable a standardized survey [11].
The second section asked respondents about public use on a spatial basis by using an interactive map [23,24]. They were asked to place and rate items about public space (
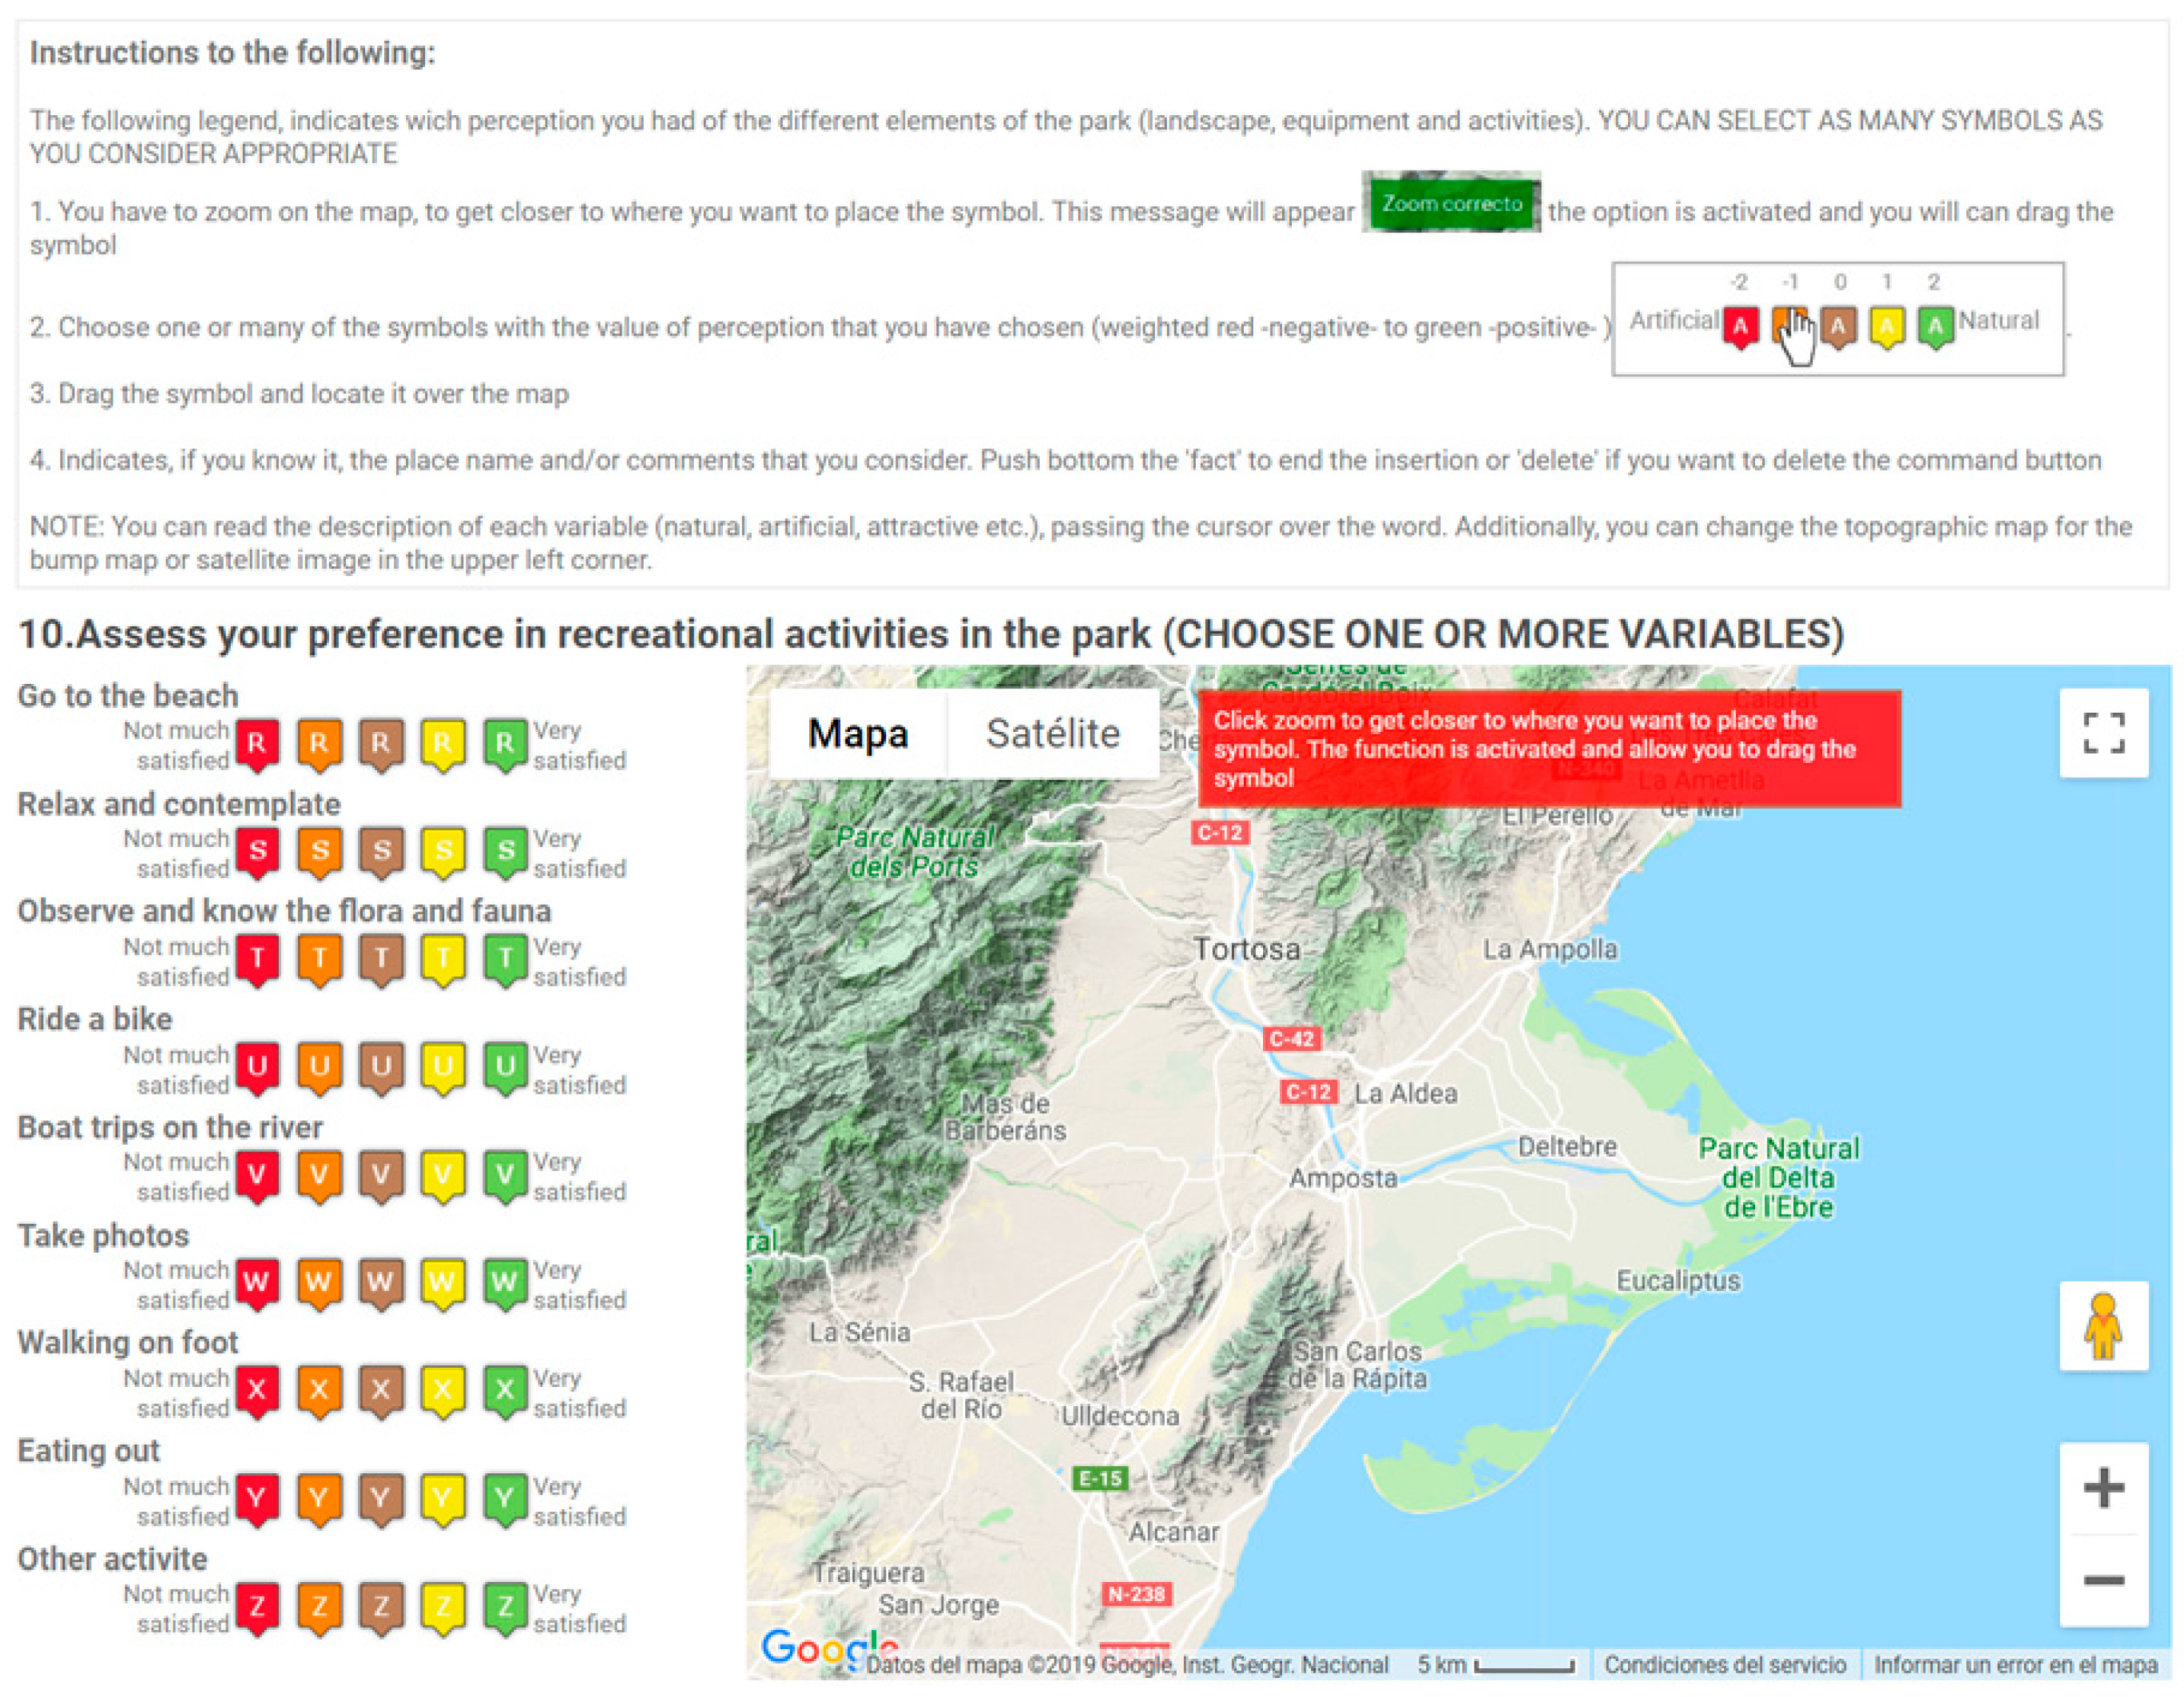
Table 1) on a map. Before expressing their opinion, they read some background information and brief instructions on how to answer the survey. They then selected an item to evaluate and chose a score to rate it. The scores were set in five categories: “very satisfied”, “quite satisfied”, “satisfied”, “quite dissatisfied”, and “very dissatisfied”. To enter the data, they simply dragged the marker corresponding to each item and its score to a location on the map (Figure 1).
The result is a set of dots each of which represents one opinion on or experience of public use. The dots provided four types of information: (1) Position, described by geographic coordinates, (2) socio-demographic information about the respondent, according to the six questions mentioned above, (3) the nature of public use, according to the items shown in Table 1, and (4) the score given by the respondent, from the five categories ranging from “very satisfied” to “very dissatisfied”. Spatial information is usually represented using points, lines or polygons [25], being points and polygons common in PPGIS [23,26,27]. Attributes coded in points tend to be less cognitively complex than those coded in polygons, though they require greater effort from the respondent [23]. Studies on PPGIS using point features [28] point to its ease of use and importance in engaging citizens and making participation more effective. To ensure accuracy, the application was active only when the users zoomed in on the map. If they did not zoom in, a warning popped up. A graphic scale of 1km or more was required to be able to use the API. Items were rated in five categories. Users were asked to place at least one item on the map in a chosen category. They could locate any item more than once (in fact, they were encouraged to do so) with the same or different category, and they did not need to place all of them. When they dragged the icons to place them on the map, a window appeared asking for information about the place name and any additional observation the user would like to report (Figure 2).
Respondents were given short and clear instructions on how to use the map interface and further information appeared when they moved the cursor over the survey. They were able to visualize the map as a topographic layout or as an orthophotomap with or without place name labels. As mentioned earlier, the survey was created on Google Forms and its HTML code was later modified with Notepad++ in order to embed the map using JAVASCRIPT and ensure proper storage of the spatial information (latitude and longitude). The survey was coordinated with an online spreadsheet and the information was automatically classified and stored when sent by the participant.

2.3. Test Version

A first test version of the survey was submitted to a panel of experts. The panel included researchers at the Universitat Rovira i Virgili (Spain) and the Université François Rabelais (France), the Ebro Delta Natural Park, and the Loire-Anjou-Touraine Regional Natural Park. A pilot survey was tested in June and July 2015 with fellows from both universities, employees of the Ebro Delta Natural Park, and volunteers. A copy of the survey, which was distributed by email, achieved a 30% response rate (n = 50).
The results of the first test version were not used for this study but were useful for producing the survey in its final form. Numerous changes were introduced to the first version to make it quicker and easier to answer. Incorrect or outlying responses were particularly useful for detecting and preventing errors. The main changes introduced were to simplify the questions, reduce the time needed to answer them, clarify the instructions, and simplify the items.
To engage the highest number of local and overseas participants, the survey was available in Catalan, Spanish, French, and English.

2.4. Dissemination

Dissemination of the survey was crucial for achieving the highest number of participants [29]. An online link was sent to the email distribution list of the Ebro Delta Natural Park, volunteers, and information points. Local press was also used and posters and leaflets were distributed throughout the area. Travel agencies, tourist information offices, community centres, town councils (five in the area), environmental charities, and university students also participated. Staff and final-year students (17–18 years old) from seven local secondary schools also participated in the survey. Although adults were the intended target of the survey, no restrictions were imposed to limit the participation of those under 18 years of age.
Social media were by far the most effective way to involve participants. Facebook and Twitter were the most useful platforms and Ebro Delta Natural Park accounts were the most fruitful. The link was also distributed via LinkedIn in order to reach several types of users [30].
Survey responses taken over the course of one year were analysed (August 2015–July 2016) and successive calls were made to encourage participation. We decided to raffle a tablet among the respondents to increase their motivation to take part in the study [12]. This participation gift was advertised along with the online survey. At the beginning of the survey, the participants were given basic information about the tablet and the date of the raffle. This was to be before the end of the one-year period during which the online link was available. Respondents were asked to provide their email address only if they wanted to participate in the raffle and be contacted if they won. The raffle was conducted using a webpage [31] that randomly chooses an email address.

2.5. Data Analysis

Data were analysed using statistical and spatial analysis, while a qualitative approach also helped to interpret the results. Excel 2013 was used for statistical data treatment, ArcGIS 10.2 was used for spatial analysis and mapping, and ATLAS.TI8 for text analysis.
Spatial analysis was particularly useful for correlating locations and understanding patterns. Participants’ input was not always evenly distributed and an interpolation procedure was used to infer opinions from areas where feedback was scarce or absent. In the landscape approach, geostatistical tools have rarely been used [27,32,33]. Some works focus on density assessment using techniques such as Kernel which are advisable to measure the intensity of a given phenomenon [27]. Others pay attention to spatial variability using interpolation techniques [32,33]. The main problem these techniques face is related to sample points: Their distribution may be random, their score may not follow a linear pattern, and they may not taper in a progressive or constant way. The Inverse Distance Weighted (IDW) algorithm applies spatial interpolation by weighting sample points according to their spatial position and assuming a decreasing influence as distance increases [25]. This is a multivariate interpolation, where the unknown scores are inferred by considering the weighted average of a set of known scores and the inverse of the distance to each point. This procedure is understood to be accurate on a detailed scale, to be less restrictive than techniques such as Kriging and more flexible than others such as Spline. IDW interpolation has previously been used with landscape data giving successful results [27,32,33].
Due to their nature, some sample points showed a cluster distribution (e.g., opinions on sunbathing clustered along the seashore while opinions on boat trips clustered along the Ebro River). To adapt the interpolation algorithm to each situation, we selected a variable search radius to calculate the interpolation. A default number of 12 sample points was considered. A cell size of 100 m was chosen to ensure accuracy at a final scale of 1:200,000. Finally, to relate the IDW interpolations to each other and create a public use synthesis map, we used a multicriteria evaluation method by weighting factors according to Reference [25]. The weights were agreed by a panel of experts that included managers from the Ebro Delta Natural Park (Table 2).

3. Studied Area

This study was conducted in the Ebro Delta, Spain, which is one of the largest wetlands in the Mediterranean basin (Figure 3). The Ebro Delta, which extends over 330 km2, is largely covered by rice fields, lagoons and marshes, as well as beaches, riverine forests, historic buildings and towns. The area is protected under several designations, including natural park, Natura 2000 network, the Ramsar convention and the Man and Biosphere Programme, and comprises six sites where general access is prohibited or regulated. The area attracts over 150,000 visitors each year [22], who enjoy the distinctive scenery, take part in outdoor activities such as birdwatching and cycling, or sample the local cuisine. In summer, sunbathing is a popular activity [34]. The most common types of users are ecotourists (44.6%) and beach tourists (39.3%) [21]. Park managers have a special interest in promoting the natural and cultural values of the area and conduct numerous management and environmental education programmes [22].

4. Results

We conducted a public use approach by considering a general outlook of respondents, a quantitative and a spatial analysis, and qualitative assessment.

4.1. General Outlook

A total of 276 surveys were received over a one-year period (August 2015-July 2016). A quality filter was applied to assure basic standards for all responses. Criteria for accepting valid surveys were: (1) At least one of the spatial-based questions answered, (2) answers given on the studied area, and (3) spatial coherence (i.e., not reporting misleading or redundant locations; maintaining correspondence between reported items and reported locations). Almost a quarter of all surveys (24.3%) did not satisfy these basic criteria and so were removed from the analysis. The analysis population then resulted in 209 valid surveys, which were decomposed into 2,617 georeferenced opinions, 84.22% of which were from visitors outside the area under study.
Respondents were aged from 15–55 years old, though most were in the 20–25 (57%) or 30–35 (24.88%) age groups. Over three-quarters of the visitors had visited the area in the previous year and about half of them had done so at some point in the previous six months. However, half of the respondents (52.7%) stated that they did not visit the park very often. Over four-fifths of the respondents were not locals, while 15% were from the Ebro Delta region. Most non-locals were Spaniards but there was a high percentage of respondents from the United Kingdom, France, and other European countries.
Almost all the feedback was for the Ebro Delta region and only 2.6% of the answers concerned locations outside the area under study (Figure 4). Most locations reported were from along the coast or Ebro River or fell within protected areas, sites with restricted access, or at information centres or tourist attractions. The number of responses per item was pretty homogeneous (197 was the mean and 192 was the median).

4.2. Quantitative and Spatial Approach

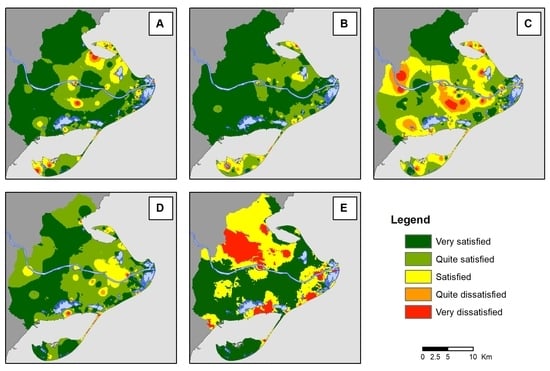
Respondents reported their opinions on public use in a fairly homogeneous way since accessibility, facilities and services, and signposting each accounted for 25–27% of the answers; the item with the least feedback was safety and security (19.7%). Most opinions provided feedback on locations near the beach and the mouth of the Ebro River. Opinions on open spaces were prevalent, while opinions on towns accounted for 5% of all answers.
Accessibility was rated positively (over 60% were very satisfied). Bad scores were residual and collected at specific places such as the Isle of Buda, which are usually restricted to visitors because they are reserves or specially protected sites. Facilities and services were rated very highly (72.46% were very satisfied) throughout the area. The few bad scores appeared in isolated places, reserves or protected sites such as Punta de la Banya. Signposting was mainly rated with middle scores (34.1% were “quite satisfied” while 26.1% were just “satisfied”). Good scores appeared near the coastline and the inland Delta border. However, negative opinions were prevalent and distributed throughout the area under study. Opinions on safety and security reflected medium-to-high satisfaction (48.71% of users were “very satisfied” while 45.34% were just “quite satisfied”). Very good scores were frequent but not prevalent and there were few very bad scores. Leisure activities recorded medium scores, while medium-lower scores were fairly common. However, the scores were highly varied (Figure 5). No significant differences were reported between local and non-local respondents.
The most common leisure activities were taking photographs (17%), chilling out (14.2%), walking (13%), birdwatching (12.3%), sunbathing (12%), sampling the local cuisine (11.2%), cycling (9.8%), and boat trips (6%). Other activities, such as kitesurfing and kayaking, were less recorded (less than 4.5%). Respondents reported a very good level of satisfaction for all leisure activities, though there were numerous extreme values and almost every activity reported a few very bad opinions. Figure 6 shows people’s opinions on the leisure activities. The arrows stretch from “very dissatisfied” to “very satisfied”. The green dots show the average scores, which are always close to “very satisfied”. Chilling out was considered the most pleasing activity, though taking photographs had a similar rating and no negative opinions.

4.3. Comments Assessment

Opinions, thoughts, and other inputs provided further information about users’ perceptions of public use. Most comments (n=154) provided by the respondents were positive (46%) but the feedback was fairly heterogeneous, and some inputs were more effusive than others (Table 3).
Accessibility is one of the best-considered items, with users reporting positive perceptions and making comments such as “perfect access” (l’Aulet beach) or “lots of cycle paths, great” (l’Encanyissada lagoon); some other statements have a hint of negativity: “The road to Poble Nou is too narrow and is sometimes difficult [if you are cycling]” (Poble Nou). Facilities and services report the best opinions, with some users providing very positive feedback. Most opinions refer to vantage points: “There’s a lovely, very high vantage point with amazing views” (l’Alfacada lagoon); “some vantage points could be better maintained” (Migjorn beach). Other opinions reflect the user’s enjoyment: “There’s one vantage point where you can rent a bike and there’s a restaurant... it’s a very complete area for both kids and adults” (la Casa de Fusta information centre). Opinions on signposting reflect some sort of difficulty with directions, with users reporting objections to losing their bearings from the main roads or beaten tracks: “Signposting to get from Sant Jaume to Deltebre and back needs improving” (Sant Jaume d’Enveja); “you don’t know you can’t get in with your car until you get there” (el Trabucador); “the road is a bit confusing but I guess it’s normal considering how many country lanes there are” (Mon Natura information centre); “we weren’t able to get there; we didn’t see any signpost” (el Garxal); “I don’t know whether this place actually exists or not” (els Ullals de Baltasar). Users made very few comments about safety and security and appeared to be quite naive: “It’s a place with facilities and restaurants; I’ve never seen police surveillance in the area” (river cruise pier); “drivers should drive more carefully because the roads are quite narrow” (TV-3406 and TV-4305 road junction). Finally, the opinions on leisure activities are clearly positive: “Amazing beach, full of peace and tranquillity, it’s from another world” (sunbathing, el Fangar beach); “this place is magic, with the sand and the sea” (sunbathing, la Banya); “the photos you can take are really beautiful, awesome” (taking photographs); “walking along the seaside as far as the river mouth: The site is just perfect!” (walking, Ebro River mouth); “lovely paella but too many people” (sampling local cuisine, Riumar).
Wordcount analysis reveals that “vantage point” is the most repeated word (13.7%). Other words include place names, “park”, and “river mouth”. In general, users are quite heterogeneous in their comments and only a few words are repeated consistently. In fact, 22 words account for 73.29% of all words. Almost all the frequent words refer to place name such as “Tancada lagoon” (8.56%), “Olles lagoon” (4.79%), “l’Encanyissada lagoon” (4.45%) and “Fangar peninsula” (3.77%).
If we consider only leisure activities, wordcount analysis shows that “vantage point” is the most repeated item (5.25%), followed by “beach” (4.83%) and a long tail list where place names are quite common (11 out 22).

5. Discussion

The main aim of this study was to analyse public use in the Ebro Delta Natural Park using PPGIS. Key aspects in this approach are the nature of PPGIS data, the constitution and spatial distribution of public use, its role in park management and the public’s perceptions, and opinions of it.

5.1. Nature of PPGIS Data and Mapping Process

Like any volunteered geographic information (VGI) data source, PPGIS uses citizen-initiated information and relies on people’s mapping contribution [24]. The pros and cons of crowdsourced information have been the object of attention [23]. These include motivation, a sense of community, time, bias, and representativeness [4]. VGI is publicly available, free of charge and commitment, and first-hand sourced, which opens up a wide range of possibilities [35,36]. Sample quality includes size and representativeness [11]. However, PPGIS is usually criticised for not providing representative or confident results. In our study, 209 valid answers were collected, while a study by [29] that also worked with Google Maps API as a map reference, collected 71 answers and [15] compared two protected sites, collecting 197 answers for one and 189 for the other. Another study [20] reported 117 participants who mapped at least one item on their PPGIS survey. Web-based PPGIS surveys tend to report an average response rate of roughly 13% [11], while the online rate is usually reported to be lower than that of the on-site rate [22]. Since our sampling was neither probabilistic nor purposive [12] but strictly voluntary, it is difficult to calculate a precise response score [20]. However, we believe that participant engagement was satisfactory and higher than for the test version. We also think that the motivational gift helped to increase participation.
Most participants (82%) were aged 20–35 years old and there was a shortage of participants over 55. A previous study of demand profiles of visitors to the area [21] showed that almost 45% of visitors are aged between 25 and 35 and that 39.3% are aged between 35 and 64. We believe that this difference can be explained by a “technologic gap”, where problems with accessing or understanding geographic information technology make it difficult for some users to get involved. Similar observations have been reported in similar studies [20]. Other studies have stressed notifications and reminders about the survey [37], while others have mentioned sampling procedures [13]. Web-based surveys are sensitive to the population groups that take part in them, so the entire population of users may not be represented. However, we believe that the results and opinions we have collected in this study, even if they are not a clear representation of visitor profile, may be considered a reliable proxy indicator of visitors’ experience on public use [28].
The mapping process is not exempt from shortcomings. As in any visualization based on isopleths, public use is assumed to be evenly distributed throughout the mapped zones. However, this may not be the case in reality. Public use zoning is based on the IDW interpolation which is calculated from sample points kindly given by participants to the survey. We assumed areas without sample points as negative areas and we generated an interpolation surface using the IDW algorithm [32,33]. The distribution of sample points and their score may not follow linear patterns and in some places might not be enough to provide a reliable interpolation. A density analysis such as Kernel may bridge a gap on this point [27]. However, intensity of use (density) is different to spatial distribution (dispersion), and by interpolating scores density may be indirectly inferred [32,33].

5.2. Constitution of Public Use

Understanding public use and public use perceptions is useful for managers of protected areas for monitoring visitor impact, behaviour, needs, and satisfaction rates and for determining the type of visitor to a certain place [2,5]. This study has revealed numerous aspects of public use that help us to better understand visitation and visitor preferences in the Ebro Delta Natural Park and to record in-site movements [18,38].
On average, visitors report a high degree of satisfaction with several public use items. Facilities and services are rated very positively (72.46%), and the spatial distribution of this item shows that opinions are pretty evenly distributed since areas without input coincide with areas without facilities and services. This means that visitors move quite homogeneously around the Delta, are sufficiently self-aware to report their movements on a map, and show good spatial knowledge. This is corroborated by a fairly good knowledge of place names in the area. In fact, wordcount analysis showed that the words most often used were place names (13 out of 22). As this was true for both local and non-local visitors, we hypothesize that non-local visitors take an interest in their trip and read up on it before, during or after their visit, up to a point that they become aware of common features and place names in the area. Facilities and services are one of the most important items to consider when evaluating public use, since visitor experience usually depends on their existence and quality [4]. Almost 14% of participants mentioned the importance of vantage points, which should be regarded as important and useful facilities. Other services which several types of users are interested in include bike renting and hospitality. A study by Reference [20] showed that different users have different interests and values, and this is reflected geographically by distinct spatial patterns and even place-based conflicts [14]. This line of thought is consistent with, for example, Reference [29] and other studies that focused on mapping social hotspots and place-based ecosystem services [16,27].
Respondents also expressed their views on accessibility to the Ebro Delta Natural Park and to sites within the area. Although the satisfaction reported was high (>60%), some respondents reported their disagreement with certain reserves and natural sites whose access is regulated or restricted (Figure 3) since they dislike not being allowed to enter them. Others feel disappointed if their visit is not permitted and blame this on a lack of information about accessibility to these sites. It has been reported that spatial behaviour within protected sites depends on the area’s physical characteristics (e.g., dunes, marshes, woods) but also on the general behaviour and civic-mindedness of each society and type of users [15,23]. It appears that trespassing onto reserves or straying from designated trails is less common in some cultures [39] than in others [38]. A study by [18] noticed that user’s behaviour was related more strongly to the type of user than to their socio-demographic profile. A visitor-tracking study conducted in the Ebro Delta [40] shows deliberated criss-crossing and encroaching onto restricted areas for a small but significant number of users, who sometimes penetrate as far as 15 km into the site even if the site is roped off and trespassing is clearly prohibited [40].
Opinions on safety and security are less frequent than any other public use items (under 20% of the opinions are related to this topic) and related comments are generally naive. We can therefore deduce that safety and security are not perceived as threats or weaknesses since more concerns would have been raised and security issues would have been clearly stated [17]. A study conducted in Australia [7] reported that safety was not only a perception for users but also a source of conflict when different types of users (e.g., mountain bikers and horse riders) were using the same trail. No similar conflicts have been reported in the Ebro Delta and only occasional comments on disputes between cyclists and drivers have been made. A previous study of demand profiles found no conflict between users but fairly homogeneous types of users with different interests [21].This is corroborated by our results for leisure activities and our maps, which show spatial clusters around areas that are more sought after for recreation, such as lagoons, beaches and vantage points. These areas may be regarded as social hotspots [27] and key areas for promoting sustainable public use [3].

5.3. Perceptions and Opinions

People’s opinions can help to implement strategies for managing public use in protected areas [6,9] and to characterise and improve visitor satisfaction [2]. As stated earlier, respondents reported no conflicts with other users [7] or types of user [14]. This should be understood in a positive way, especially considering that the site is a tourist destination [21]. PPGIS has been widely used to detect conflicts between users or purposes such as conservation requirements [11]. It has also been used to assess visitor satisfaction and comfort [8]. Participants in the Ebro Delta did not express annoyance or unease regarding place-based conflicts. We encountered no negative or hostile attitude towards the Park for being a protected area, quite the opposite in fact since the opinions were positive and no meaningful differences were recorded between local and non-local users [13,15].
The best-rated sites were beaches and lagoons with facilities such as information centres or vantage points. However, other places in the area were neither underrated nor disregarded, which can be seen as evidence of general satisfaction and/or a demonstration of good and homogeneous knowledge. Some studies of landscape-based conflicts [17] show areas with higher perceived spatial-based inequalities and mixed feelings. Wordcount analysis shows that the most-repeated items are “vantage point” and “beach”, while opinions analysis indicates good satisfaction levels and positive perceptions. This is also true for the most common leisure activities, such as taking photographs and chilling out. Some respondents enjoy clearly stating their enjoyment and satisfaction, mapping out where they feel more at ease or where they feel their experience is more satisfying. This approach helps to characterise the type of visitor to the area and identify which sites are better perceived by users. A synthesis map weighting public use factors (Figure 7) shows better-considered areas and worse-considered areas, though “satisfied” and “quite satisfied” opinions are clearly prevalent (85.15%). Places with better scores may be understood to be key areas of interest for managers wishing to promote public use since this is how they are perceived by users.

5.4. Management Implications

PPGIS is an excellent procedure for park planning and management [4,23]. This study shows that users’ opinions, including georeferenced opinions, provide useful information for supporting decision-making [24]. This study helps to address management priorities such as conservation and recreation. For example, at some sites (e.g., l’Encanyissada lagoon) public use is so prevalent that it overshadows wildlife conservation, while at others (e.g., la Tancada lagoon) the opposite is true. Managers can correlate areas with greater interest in conservation to areas with greater interest in public use, and prioritise sites according to their management interests.
The spatial nature of PPGIS enables management zones to be zoned and pinpointed, while simple approaches such as reported perceptions and activities (Figure 7) are useful for detecting popular zones with public use. They may also be useful for promoting sustainable practices or even reducing overuse [20]. Advanced assessments include delineation of crowded areas and delimitation of poorly-rated sites. Crowded areas with public use may yield to conflict [8,38] or to the coexistence of different types of users with interests in the same places [14]. Management plans can benefit from all this information and use social hotspots to promote sustainable public use. Other benefits include studying tourist demand [21], identifying areas that are suitable for sustainable tourist activities, and determining local acceptance [15].

6. Conclusions

In this study, we conducted an online PPGIS approach to identify, qualify, and georeference public use in the Ebro Delta Natural Park. Our results help to characterise and map public use and highlight users’ opinions and perceptions. Public use is highly regarded by users on average and facilities and services are particularly praised. Safety and security do not appear to attract people’s attention, so we believe users do not perceive a lack of security in the area. Leisure activities are highly rated and activities such as taking photographs are fairly popular. Users report vantage points positively. A spatial approach shows areas where public use is most popular and detects social hotspots.
This study demonstrates the usefulness of PPGIS and its interest in public use in protected areas. This approach combines non-expert opinions and social data in a decision-making and georeferences people’s opinions. Management plans, sustainability programmes, and consensus-based decision-making may greatly benefit from this approach. An interesting follow-up study should concentrate on feelings and perceptions on public use only in those areas that are more frequented by users. Another interesting study should focus on landscape perception based on PPGIS, which can yield interesting place-based results.

Author Contributions

Conceptualization, Amalia Vaneska Palacio Buendía; Formal analysis, Amalia Vaneska Palacio Buendía and María Yolanda Pérez Albert; Funding acquisition, Amalia Vaneska Palacio Buendía; Investigation, Amalia Vaneska Palacio Buendía; Methodology, Amalia Vaneska Palacio Buendía and María Yolanda Pérez Albert; Supervision, María Yolanda Pérez Albert; Writing (original draft), David Serrano Giné; Writing (review & editing), María Yolanda Pérez Albert and David Serrano Giné.

Funding

This research was funded by the Spanish Ministry of Science, Innovation and Universities (AEI/FEDER, UE) under Grant CHORA (contract number CSO2017-82411-P) and by the GRATET Research Group, which is funded by the Catalan Government under code 2009-SG744.

Conflicts of Interest

The authors declare no conflict of interest. The funders had no role in the design of the study; in the collection, analysis or interpretation of data; in the writing of the manuscript, or in the decision to publish the results.

References

  1. Hornback, K.E.; Eagles, P.F.J. Guidelines for Public Use Measurement and Reporting at Parks and Protected Areas; IUCN: Gland, Switzerland, 1999; p. 90. [Google Scholar]
  2. Lausche, B. Guidelines for Protected Areas Legislation; IUCN: Gland, Switzerland, 2011; p. 370. [Google Scholar]
  3. Leung, Y.-F.; Spenceley, A.; Hynegaard, G.; Buckley, R. Tourism and Visitor Management in Protected Areas: GUIDELINES for Sustainability; Leung, Y.-F., Spenceley, A., Hynegaard, G., Buckley, R., Eds.; Best Practice Protected Area Guidelines Series, 27; IUCN: Gland, Switzerland, 2018; p. 120. [Google Scholar]
  4. EUROPARC. Manual Sobre Conceptos de uso Público en los Espacios Naturales Protegidos; Fundación González Bernáldez: Madrid, Spain, 2005; p. 94. [Google Scholar]
  5. Cabalar, M. Análisis de la demanda de uso Público en Tres Parques Naturales de Galicia. BAGE 2013, 61, 261–284. [Google Scholar]
  6. Kuba, K.; Monz, C.; Bårdsen, B.-J.; Hausner, V.H. Role of site management in influencing visitor use along trails in multiple alpine protected areas in Norway. J. Outdoor Recreat. Tour. 2018, 22, 1–8. [Google Scholar] [CrossRef]
  7. Wolf, I.D.; Brown, G.; Wohlfart, T. Applying public participation GIS (PPGIS) to inform and manage visitor conflict along multi-use trails. J. Sustain. Tour. 2018, 26, 470–495. [Google Scholar] [CrossRef]
  8. Luque-Gil, A.M.; Gómez-Moreno, M.L.; Peláez-Fernández, M.Á. Starting to enjoy nature in Mediterranean mountains: Crowding perception and satisfaction. Tour. Manag. Perspect. 2018, 25, 93–103. [Google Scholar] [CrossRef]
  9. Eagles, P.F.J.; McCool, S.F.; Haynes, C. Sustainable Tourism in Protected Areas: Guidelines for Planning and Management; IUCN: Gland, Switzerland, 2002; p. 183. [Google Scholar]
  10. McNeill, A.; Clifton, J.; Harvey, E.S. Attitudes to a marine protected area are associated with perceived social impacts. Mar. Policy 2018, 94, 106–118. [Google Scholar] [CrossRef] [Green Version]
  11. Brown, G.; Fagerholm, N. Empirical PPGIS/PGIS mapping of ecosystem services: A review and evaluation. Ecosyst. Serv. 2015, 13, 119–133. [Google Scholar] [CrossRef]
  12. Brown, G.; Kyttä, M. Key issues and research priorities for public participation GIS (PPGIS): A synthesis based on empirical research. Appl. Geogr. 2014, 46, 122–136. [Google Scholar] [CrossRef]
  13. Strzelecka, M.; Rechciński, M.; Grodzińska-Jurczak, M. Using PP GIS interviews to understand residents’ perspective of European ecological network Natura 2000. Tour. Geogr. 2017, 19, 848–877. [Google Scholar] [CrossRef]
  14. Moore, S.A.; Brown, G.; Kobryn, H.; Strickland-Munro, J. Identifying conflict potential in a coastal and marine environment using participatory mapping. J. Environ. Econ. Manag. 2017, 197, 706–718. [Google Scholar] [CrossRef] [Green Version]
  15. Engen, S.; Runge, C.; Brown, G.; Fauchald, P.; Nilsen, L.; Hausner, V. Assessing local acceptance of protected area management using public participation GIS (PPGIS). J. Nat. Conserv. 2018, 43, 27–34. [Google Scholar] [CrossRef] [Green Version]
  16. Ernoul, L.; Wardell-Johnson, A.; Willm, L.; Béchet, A.; Boutron, O.; Mathevet, R.; Arnassant, S.; Sandoz, A. Participatory mapping: Exploring landscape values associated with an iconic species. Appl. Geogr. 2018, 95, 71–78. [Google Scholar] [CrossRef]
  17. Garcia, X.; Benages-Albert, M.; Vall-Cases, P. Landscape conflict assessment based on a mixed methods analysis of qualitative PPGIS data. Ecosyst. Serv. 2018, 32, 112–124. [Google Scholar] [CrossRef]
  18. Korpilo, S.; Virtanen, T.; Saukkonen, T.; Lehvävirta, S. Understanding and managing visitor spatial behaviour in urban forests using public participation GIS. J. Environ. Econ. Manag. 2018, 207, 124–133. [Google Scholar] [CrossRef] [PubMed]
  19. Palacio, A.V.; Pérez, M.Y. Propuesta metodológica para la evaluación de la percepción social del potencial turístico del paisaje y del uso público en espacios naturales protegidos. El papel de los sistemas de información geográfica de participación pública. In Proceedings of the XLI International Conference on Regional Science: Innovation and Geographical Spillovers: New Approaches and Evidence, Reus, Spain, 18–20 November 2015; pp. 1–21. [Google Scholar]
  20. Muñoz, L.; Hausner, V.; Brown, G.; Runge, C.; Fauchald, P. Identifying spatial overlap in the values of locals, domestic- and international tourists to protected areas. Tour. Manag. 2019, 71, 259–271. [Google Scholar] [CrossRef]
  21. Anton-Clavé, S.; Nel-lo, M.G.; Orellana, A. Coastal Tourism in Natural Parks. An Analysis of Demand Profiles and Recreational Uses in Coastal Protected Natural Areas. Rev. Tur. Desenvolv. 2007, 7/8, 69–81. [Google Scholar]
  22. Generalitat de Catalunya: Pla de Gestió del Parc Natural del Delta de l’Ebrem. 2017. Available online: http://parcsnaturals.gencat.cat/ca/delta-ebre (accessed on 1 October 2019).
  23. Brown, G.; Weber, D. Public Participation GIS: A new method for national park planning. Landsc. Urban Plan. 2011, 102, 1–15. [Google Scholar] [CrossRef]
  24. Palka, G.; Serrhini, K.; Fuchs, S.; Thibault, S.; Neron, E. Improving Evacuation Maps by integrating Needs and Preferences of End-users in GIS. In Proceedings of the 26th International Cartographic Conference, Dresden, Germany, 25–30 August 2013. [Google Scholar]
  25. Burrough, P.; McDonnell, R. Principles of Geographic Information Systems; Oxford University Press: New York, NY, USA, 1998; p. 333. [Google Scholar]
  26. Brown, G.; Pullar, D. An evaluation of the use of points versus polygons in public participation geographic information systems using quasi-experimental design and Monte Carlo simulation. Int. J. Geogr. Inf. Sci. 2012, 26, 231–246. [Google Scholar] [CrossRef]
  27. Alessa, L.; Kliskey, A.; Brown, G. Social-ecological hotspots mapping: A spatial approach for identifying coupled social-ecological space. Landsc. Urban Plan. 2008, 85, 27–39. [Google Scholar] [CrossRef]
  28. Santé, I.; Fernández-Ríos, A.; Tubío, J.M.; García-Fernández, F.; Farkova, E.; Miranda, D. The Landscape Inventory of Galicia (NW Spain): GIS-web and public participation for landscape planning. Landsc. Res. 2019, 44, 212–240. [Google Scholar] [CrossRef]
  29. Bearman, N.; Appleton, K. Using Google Maps to collect spatial responses in a survey environment. Area 2012, 44, 160–169. [Google Scholar] [CrossRef] [Green Version]
  30. Alexa. 2019. Available online: www.alexa.com (accessed on 1 October 2019).
  31. Augeweb. 2019. Available online: www.augeweb.com/azar/ (accessed on 1 October 2019).
  32. Siniscalchi, J.M.; Pierskalla, C.D.; Selin, S.W.; Palmer, D. Mapping Social Change: A Visualization Method Used in the Monongahela National Forest. Soc. Nat. Resour. 2006, 19, 71–78. [Google Scholar] [CrossRef]
  33. Pierskalla, C.D.; Deng, J.; Siniscalchi, J.M. Examining the product and process of scenic beauty evaluations using moment-to-moment data and GIS: The case of Savannah, GA. Urban For. Urban Green. 2016, 19, 212–222. [Google Scholar] [CrossRef] [Green Version]
  34. Tripadvisor. 2019. Available online: https://www.tripadvisor.com (accessed on 1 October 2019).
  35. Goodchild, M. Citizens as voluntary sensors: Spatial data infrastructure in the world of web 2.0. Int. J. Spat. Data Infrastruct. Res. 2007, 2, 24–32. [Google Scholar]
  36. Kitchin, R. Big Data and human geography: Opportunities, challenges and risks. Dialogues Hum. Geogr. 2013, 3, 262–267. [Google Scholar] [CrossRef]
  37. Kaplowitz, M.D.; Hadlock, T.D.; Levine, R. A comparison on Web and Mail Survey Response Rates. Public Opin. 2004, 68, 94–101. [Google Scholar] [CrossRef]
  38. Santos, T.; Nogueira Mendes, R.; Vasco, A. Recreational activities in urban parks: Spatial interaction among users. J. Outdoor Recreat. Tour. 2016, 15, 1–9. [Google Scholar] [CrossRef]
  39. Meijles, E.; de Bakker, M.; Groote, P.; Barske, R. Analysing hiker movement patterns using GPS data: Implications for park management. Comput. Environ. Urban Syst. 2014, 47, 44–57. [Google Scholar] [CrossRef]
  40. Jurado, J.; Pérez, M.Y.; Serrano, D. Visitor monitoring in protected areas: An approach to Natura 2000 sites using big VGI. Geogr. Tidsskr.-Dan. J. Geogr. 2019, 1–15. [Google Scholar] [CrossRef]
Figure 1. Screenshot composition of the online survey.
Ijgi 08 00244 g001
Figure 2. Screenshot of the online survey. Users had the possibility to record additional information insidea pop-up window.
Ijgi 08 00244 g002
Figure 3. The area studied. Dashed areas show sites where public access is restricted.
Ijgi 08 00244 g003
Figure 4. Spatial distribution of the feedback. Each point (n= 2617) represents one opinion. Dashed areas show sites where public access is restricted.
Ijgi 08 00244 g004
Figure 5. Public use satisfaction: A: Accessibility, B: Facilities and services; C: Signposting; D: Safety and security; E: Leisure.
Ijgi 08 00244 g005
Figure 6. Leisure activities satisfaction.
Ijgi 08 00244 g006
Figure 7. Synthesis map of public use satisfaction.
Ijgi 08 00244 g007
Table 1. Items considered in the evaluation of public use.
ItemDescription
AccessibilityIncludes access roads to the park and access to discovery trails and car parks, etc.
Facilities and servicesIncludes welcoming services, information centres, eco museums, toilet facilities, hides and vantage points, etc.
SignpostingIncludes signposts to the park, discovery trails and sites of interest, as well as maps and information and location panels, etc.
Safe and securityIncludes police, beach lifeguards, and the feeling of security and protection.
LeisureIncludes beaches, chill out areas, vantage points, sunbathing, bird watching, boat trips, photography, walking, hiking, cycling, sampling of local cuisine, etc.
Table 2. Weights considered when synthesizing public use.
Sub-itemWeight (%)ItemWeight (%)
Accessibility12.5
Facilities and services12.5
Signposting12.5
Safety and security12.5
Sunbathing15.0Leisure50.0
Chill out zone and views10.0
Bird watching15.0
Cycling15.0
Boat trips10.0
Taking of photographs5.0
Walking10.0
Sampling of local cuisine15.0
Others5.0
Table 3. The number of comments per public use item.
ItemNumber of Comments
Accessibility24 (8 positive, 5 negative, 11 neutral)
Facilities and services19 (10 positive, 7 negative, 2 neutral)
Signposting24 (6 positive, 14 negative, 4 neutral)
Safe and security13 (0 positive, 9 negative, 4 neutral)
Leisure73 (47 positive, 8 negative, 18 neutral)
Leisure- Sunbathing11 (5 positive, 4 negative, 2 neutral)
Leisure-Chillout zone and views7 (7 positive, 0 negative, 0 neutral)
Leisure- Bird watching3 (0 positive, 0 negative, 3 neutral)
Leisure- Cycling11 (7 positive, 1 negative, 3 neutral)
Leisure- Boat trips9 (3 positive, 1 negative, 5 neutral)
Leisure- Taking of photographs10 (8 positive, 0 negative, 2 neutral)
Leisure- Walking10 (4 positive, 4 negative, 2 neutral)
Leisure- Sampling local cuisine17 (14 positive, 1 negative, 2 neutral)
Leisure- Others6 (4 positive, 1 negative, 1 neutral)

