Modeling Root Exudate Accumulation Gradients to Estimate Net Exudation Rates by Peatland Soil Depth

1
School of the Environment, University of Windsor, 401 Sunset Ave, Windsor, ON N9B 3P4, Canada
2
Department of Geography, Geomatics and Environment, University of Toronto Mississauga, 3359 Mississauga Road, William G. Davis Bldg, Mississauga, ON L5L 1C6, Canada
*
Author to whom correspondence should be addressed.
Plants 2021, 10(1), 106; https://doi.org/10.3390/plants10010106
Submission received: 2 November 2020
/
Revised: 24 December 2020
/
Accepted: 28 December 2020
/
Published: 6 January 2021
(This article belongs to the Special Issue Linking Plant Root Exudation Traits to Rhizosphere Biology)
Abstract
:Root exudates accumulate as a radial gradient around the root, yet little is known about variability at the individual root level. Vertical gradients in soil properties are hypothesized to cause greater accumulation of exudates in deeper soil through hindering diffusion, increasing sorption, and decreasing mineralization. To this end, a single root exudation model coupling concentration specific exudation and depth dependent soil properties was developed. The model was parameterized for a peatland ecosystem to explore deposition to the methanogen community. Numerical experiments indicate that exudates accumulated to a greater extent in deeper soil, albeit the effect was solute specific. Rhizosphere size for glucose doubled between the 10 and 80 cm depths, while the rhizoplane concentration was 1.23 times higher. Root influx of glucose increased from 1.431 to 1.758 nmol cm−1 hr−1, representing a recapture efficiency gain of 15.74% (i.e., 69.06% versus 84.8%). Driven by increased root influx, overall net exudation rates of select sugars and amino acids varied by a factor two. Model sensitivity analysis revealed that soil depth and root influx capability are key determinants of the rhizoplane concentration and subsequently net exudation, which determines whether effluxed compounds escape the root oxic shell and are available to the methanogen community.
1. Introduction
The loss of carbon (C) from roots to soil is an important, but poorly understood process relative to other pathways in the terrestrial C cycle [1,2]. At the rhizoplane, C loss via exudation ranges from 5–10% of net fixed C [3], yet considerable variation in exudate magnitude and composition occurs between species [4] and in relation to soil conditions (e.g., nutrient availability [5], temperature [6], and oxygen concentration [7]). Since root-borne C strongly interacts with the soil microbial community through symbiotic to pathogenic interactions, roots have developed some ability to control their efflux which consists of primary metabolites (i.e., organic acids, amino acids, sugars), secondary metabolites (plant specialized metabolites), and proteins. Although exudation of C is partially unintentional (passive efflux), efflux of secondary metabolites has been linked to microbial chemo-attraction, biological communication, and shaping the soil microbial community [8] and is therefore believed to be plant regulated (active efflux). Albeit the majority of exuded C are primary metabolites [9], concordance between internal root composition and rhizosphere composition is poor [10], suggesting the mechanisms involved in exudation are highly selective.
The assumption that higher internal root concentrations leads to higher exudation rates neglects that exudation is the net release of C compounds with efflux and influx components [11]. Asymmetries between efflux and influx may explain why select C compounds occur in high proportion in root extracts, yet are a minor constituent of exudates [12]. Studies of ryegrass, rape, clover, and alfalfa document that exudation rates and the soil concentration of the amino acids glycine and serine are higher than their internal root concentration suggests [12,13,14]. Wheat roots were highly proficient at recapturing nitrogen (N) compounds effluxed from roots, with influx rates exceeding efflux rates for 21 out of 45 15N-labeled compounds [15]. Net influx may thereby explain the radial depletion zones of amino acids that have been documented in the soil solution of Zea mays grown in rhizoboxes fitted with micro-suction-cups [16].
Root efflux of primary metabolites is regarded as passive leakage to which the plant has little control over. Root permeability that permits uptake subsequently permits diffusion-based efflux [17] based on the concentration gradient between the root cell cytoplasmic concentration (mM concentration) and the rhizosphere (µmol concentration), where low soil concentration is continually maintained via diffusion away from the rhizoplane and microbial mineralization [18]. While roots display little ability to down-regulate their passive C efflux, active exudation involving up-regulating existing diffusion mechanisms [2] can be triggered under non-optimal conditions such as during exposure to metals and strongly charged substances [19], or due to low nutrient availability [20]. Evidence for the active release of organic acid exudates in response to soil conditions has been long documented [21]. Recapturing the organic acids would be energetically unfavorable due to their charge, hence there is little evidence for organic acid recapture [3]. While influx of negatively charged compounds is hindered, the positive charge on the exterior face of the root draws the compounds out of the cell at higher rates [22]. Root recapture of lost compounds may be energetically or nutritionally favorable despite the energy cost of influx, with several studies noting high influx rates for sugars [3] and amino acids [23]. Hence, the charge of the C compound, coupled with its intrinsic value to plant ecophysiology, dictates whether net exudation is regulated by influx or efflux processes.
Net exudation to the soil results in an accumulation gradient around the root with the highest concentration of exudates at the rhizoplane, decreasing radially until they subside at the boundary of the rhizosphere. Extending the radial distribution thereby spreads the exudate pool over a larger soil volume, reducing the concentration at the rhizoplane where concentration dependent efflux and influx processes occur [2]. Although many species display the capacity to take up amino acids at concentrations as low as 2 µmol, uptake rates are considerable greater at higher concentration, with maximum rates often an order of magnitude greater than typical rhizoplane concentrations [24]. Quantifying the rhizoplane concentration is challenging since it is affected by the net exudation rate, radial diffusion rate, transport with water movement, sorption to the solid phase, and decomposition of exudates by microorganisms, all of which vary with soil vertical gradients in physical, chemical, and biological properties.
Relative to surface soil, deep soil has undergone many additional cycles of microbial processing, stripping it of energy-rich C and enriching the microbial-processed C relative to topsoil. In rice paddies, lowered abundance of plant litter reduced the overall microbial biomass in deeper soil, and further selected for species that specialize in the digestion of soil organic matter [25]. Similarly, microbial biomass of a bare cutover peatland varied from 326 to 281 µg C g dwt−1 between the 0–5 cm and 40–45 cm soil depth intervals, while a concordant MicroResp assay documented mineralization rates of isotopically labeled C up to ~2.8 times greater in 0–5 cm than 40–45 cm soil depth intervals [26]. Reduced removal via microbial consumption may enable greater recapture of effluxed compounds, lowering net exudation rates. The effect of topsoil versus subsoil properties on root exudation was investigated using pulse labeled 14C tracers of alfalfa in pots filled with either a topsoil (0–30 cm) or subsoil (45–75 cm) [27]. Their research documented root exudation per root mass was lower in subsoil, while the topsoil had a larger accumulation gradient of labeled 14C exudates in the rhizosphere and rhizoplane, despite increased microbial utilization. Similarly, a trend of decreasing in-situ root exudation with depth from 33–82 mg C root DW g−1 h−1 in the topsoil to an average of 5–33 mg C root DW g−1 h−1 between the 60 and 130 cm depth intervals was noted using a cuvette-based approach [28]. However, empirical observations have many methodological limitations [29].
Replication of soil properties and vertical gradients to empirically investigate the radial distribution of exudates around roots is challenging, necessitating the development of simulation models that differ in approach, complexity, and theoretical underpinnings. Previously, impedance and interfacial resistance terms were used to predict diffusion profiles of non-sorbing and sorbing solutes [30]. Recently, single root exudation models have been developed [31] that include influx-efflux processes [3]. While this model was empirically validated for maize roots grown in solution, the model does not simulate soil property effects on exudation. Conversely, the PARIS-M [32] and Barber–Cushman rhizosphere gradient models [32] focus on soil property influences on accumulation gradients in the rhizosphere with net exudation rate as a constant. Models for the spatiotemporal distribution of secondary metabolites have also been developed, such as the secretion of daidzein from soybean roots [33]. However, there is a paucity of rhizosphere simulation models coupling efflux and influx proportional to the concentration on the rhizoplane with soil property determinants of rhizoplane concentration.
Vertical gradients in the soil properties and their influence on net exudation rates in peatlands is unknown, despite the considerable vertical heterogeneity due to compaction and decomposition. Unlike non-saturated ecosystems, the root systems of peatland plants are partitioned into an oxic and anoxic zone via a fluctuating water table. The ratio of root deposited C mineralized as CO2 versus CH4 thus depends on the water table depth, the root depth distribution, and whether the soil properties of the inundated root fraction affect net exudation sink strength. Exudation into the anoxic zone in peatlands may relieve methanogen substrate limitation, or accumulation of organic acids may suppress methanogenesis [34], despite acetate typically stimulating CH4 production [35]. Methanogenesis operates within a narrow window of environmental and chemical concentration conditions, hence the considerable uncertainty regarding the contribution of root exudates to methane production. Understanding depth variations in net exudate magnitude and the extent of the rhizosphere may offer valuable insights into the development of methanogenesis spatial niches.
The objectives of this paper are to better understand how depth dependent soil properties determine the rhizoplane concentration and influence net exudation of a deep-rooted peatland sedge (Eriophorum vaginatum) under saturated conditions. The model focuses on predicting accumulation gradients of effluxed C compounds around an immutable root segment as a function of radial diffusion and removal via sorption to the solid phase and microbial mineralization. This single root approach significantly simplifies the root system and does not account for all factors influencing the rhizosphere accumulation gradients, such as root age, seasonality, and inter-root competition. However, the cylindrical representation matches the root architecture of E. vaginatum which is branchless, absent of root hairs, and propagates downwards from the central stem. Internal cell concentrations of the simulated root are kept constant regardless of depth, while soil properties alter in response to soil depth in concordance with observations.
2. Results
Simulated soil vertical gradients had considerable variation in bulk density and decreasing porosity and increasing tortuosity with depth (Figure 1), thereby interfering with radial diffusion of exudates. Increased sorption to the denser solid phase further reduced radial diffusion, albeit the sorption retardation factor depended on the type of solute and its concentration. In high binding compounds such as oxalate, the sorption retardation factors influence on diffusion was larger than porosity. In terms of mineralization rates, soils became cooler and featured a smaller microbial biomass with depth, reducing mineralization.
2.1. Rhizosphere Accumulation Gradients by Depth
For all sugars and amino acids, in deeper soil, a greater amount of exudates were retained in the rhizosphere, generally increasing the concentration present, including the rhizoplane (Figure 2). For organic acids, the effect was less pronounced. In deeper soil, the heightened accumulated exudates were radially dispersed amongst a larger soil volume, increasing the rhizosphere size. Defining the rhizosphere at an arbitrary threshold of 0.01 nmol cm−3, the extent of the rhizosphere for glucose increased from 7.16 mm at 10 cm to 14.72 mm at 80 cm depths. Furthermore, concentrations at 10 mm were over 70 times greater at 80 cm depth, albeit the difference in concentration shrank closer to the rhizoplane, which was only ~1.23 times greater.
The higher concentration of exudates in the rhizosphere resulted in increased sorption. Total sorbed pool size for all cylinder increased by an order of magnitude from 0.508 to 3.874 nmol cm−3, or 2.00% and 6.90% of the solute pool size. At the rhizoplane, the sorption pool size increased by a factor of 4.24 times between depths of 10 and 80 cm, and the amount of solute removed via sorption per time step increased considerably on account of the larger solid phase. However, removal by sorption was concentration dependent. At equilibrium, the solute concentration in the cylinders remains constant; hence, removal via sorption was negligible in spite the higher capacity for solute binding in deep soil.
While sorption increased in deeper soil, mineralization for all soil cylinders decreased up to 6 times between 10 and 80 cm depths. Slower mineralization rates permitted a larger accumulation of exudates in the rhizoplane, which were subsequently dispersed and retained for a longer period, producing an egalitarian distribution of exudates, that tampered diffusion between adjacent soil cylinders. At 80 cm depth, the effective diffusion rate was 63.16% that of 10 cm and the amount of solute diffused from the rhizoplane to the adjacent soil cylinder decreased from 0.0203 to 0.0105 nmol s−1 due to the lower diffusion rate in conjunction with the lower solute concentrating difference in the outwards soil cylinder.
Rhizoplane concentrations were higher in deeper soil (e.g., rhizoplane concentration for glucose 1.23 times higher at 80 cm than 10 cm) (Figure 3a). Higher solute concentration on the rhizoplane had downstream implication for exudation efflux and influx. The gradient between the cell cytoplasm (µmol cm−3) and the soil solution (nmol cm−3) was so stark that minor increases in the soil had a negligible impact of efflux. Root exudate loss was 2.07320 versus 2.07314 nmol cm−1 hr−1 between 10 and 80 cm depths. However, roots uptake ability has been estimated as high as ~80% for glucose and ~50% for malate in Maize roots [3]. Influx increased with depth, from 1.431 to 1.758 nmol cm−1 hr−1, which represented a recapture efficiency gain of 15.74% (i.e., 69.06% versus 84.8%). Because the recapture efficiency of exuded labile C was high, net exudation was drastically reduced to less than 50% its rate at 10 cm (Figure 3b). Driven by increased uptake, net exudation was reduced from 0.641 to 0.315 nmol cm−1 hr−1 between the 10 and 80 cm depths.
2.2. Compound Specific Exudation
Root exudates are a cocktail of low molecular weight (LMW) C compounds with considerable heterogeneity in compound properties. Simulation results show that accumulation gradients vary considerably between C compounds (Figure 4). Consequently, solute properties exerted considerable influence on the final rhizosphere concentration with downstream influences on exudation efflux and influx. Overall, net exudation rates were up to two orders of magnitude different between C compounds. Net exudation of glycine at 40 cm depth was 0.31 nmol cm−1 hr−1 in comparison to 7.98 nmol cm−1 hr−1 for tartarate. The lower net exudation of amino acids was mainly due to their low root cytoplasm concentration and high recapture efficiency. The higher rhizoplane concentration in deeper soil resulted in greater recapture of sugars and amino acids (Figure 5a,b).
Conversely, negatively charged solutes such as tartarate are drawn out of the root at greater rates than non-charged solutes [3]. Exuded negatively charged compounds thereby have little influx ability given that the root interior maintains the same negative charge. As tartarate has a net negative charge of −2, its efflux rate is greater than solutes with comparable cell cytoplasm concentration (e.g., glucose: −1.48 nmol cm−1 hr−1 (37.4 µmol cm−3), tartarate: 7.98 nmol cm−1 hr−1 (59.5 µmol cm−3)). More importantly, whereas non-charged C compounds can be recaptured, and are thus regulated by influx mechanisms, organic acids such as tartarate are only regulated by efflux processes. Differences in net exudation between organic acids are the result of observed differences in cell cytoplasm concentration, and rates are generally invariable with depth (Figure 5c).
In addition to the exudation rate, the size of the rhizosphere has implications for methanogenesis. Larger rhizospheres are more likely to escape oxygenation from the root and reach a threshold concentration that signals microbial movement and proliferation. Unlike net exudation rates, there is a positive relationship between depth and the size of the rhizosphere (Figure 6). Rhizosphere size tended to increase with depth for all C compounds, likely due to lower mineralization rates. Rhizosphere size tended to be <5 mm for amino acids, <15 mm for sugars, and <20 mm for organic acids. Diffusion rate had considerable influence on the size of the rhizosphere, with the rhizosphere size of the slowly diffusing tartarate the lowest of all organic acids in spite of its higher exudation rate. The rhizosphere size was linearly related to depth, albeit the slope of the equation was solute specific. Pooled rhizosphere thickness and depth only had an R2 of 0.26. Conversely, linear relationships between these two variables for a single solute were in excess of R2 of 0.95.
2.3. Sensitivity Analysis
The global sensitivity analysis (n = 10,000) revealed the general behavior of the model points towards increasing rhizoplane concentration at lower depths (Figure 7). Linear regression with depth as the independent variable and the rhizoplane concertation as the dependent variable was statistically significant (p < 0.01) and had an R2 of 0.22. Albeit, there is considerable variability in the simulation results, the general trend towards higher rhizoplane concentration in deeper soil is clear.
The partial rank correlation coefficients for the entire model indicated that soil depth and the root influx capabilities had the strongest influence on the rhizoplane concentration (Figure 8). Neither are unsurprising, as soil depth influences mineralization rates while root exudate influx influences recapture efficiency. Both the maximum influx rate and the Michaelis–Menten coefficient were important in the model, likely as the Michaelis–Menten coefficient is crucial for determining the influx strength at low concentration. Moderately important factors were consistent with the diffusion coefficient and the mineralization rate. These factors are constant with soil depth. Hence, they represent the sensitivity of the model to different solute properties. The Q10 factor and soil sorption capabilities had a minor role in the rhizoplane concentration.
The strongest influential parameters, maximum sorption, maximum uptake rate, and Michaelis–Menten coefficient, remained fairly constant by depth (Figure 9). Interestingly, the mineralization rate and the Q10 soil temperature factor declined in the partial rank correlation coefficient rankings between 10 and 100 cm depths. Their influence likely waned as other factors such as the bulk density and microbial biomass exerted a stronger influence in the deeper soil.
3. Discussion
Root exudation regulators have previously been identified, yet their application to estimate exudation rates is rare. Furthermore, few studies have examined the role of vertical gradients of exudation regulators on estimated rates. This simulation model has demonstrated quantitatively the regulation of exudation via soil properties with depth dependence in a peatland environment. Vertical gradients in sugar and amino acid net exudation due to higher rhizoplane accumulation led to higher influx of exudates, suggesting that deeper roots may have lower loss of C. Consequently, the higher accumulation of exudates in the rhizosphere increases the width of the rhizosphere. As the rhizosphere width is independent of the oxic shell, larger rhizosphere widths may enable exudates to escape the oxic shell and become available to the methanogen community. In terms of methanogenesis, the higher accumulation gradient and larger rhizosphere are important consideration for exudates escaping the oxic shell around roots. The results of this model offer insights into root exudation regulation and is possible significance in methanogenesis and emissions at the sediment atmosphere interface.
Loss of labile C compounds via the root exudation pathways have been difficult to quantify empirically given the sizeable methodological limitations [5] and wide range in reported magnitude. The annual flux of C in forests was estimated at 9.4 g C m−2 year, or 1.5% of NPP utilizing a simple scaling schema [36]. Meanwhile, upscaled single exudation rates to the ecosystem scale using fine root biomass and the relative dominance of each species was estimated at a flux of 3.1–16.6% of aboveground NPP in tropical rainforests [37]. Determining the validity of these estimates is challenging since C exchanges operate at spatial and temporal scales that are not amenable to investigation and the sampling regime imposes a consistent environment. There are at least 11 variables that influence soil respiration, yet few empirical studies are methodologically capable of simulating all soil properties [38]. The dearth of tools and techniques to observe root exudation without interference is a considerable challenge for estimating the loss of C via the root exudate pathway.
Previous root exudation models range considerably in complexity, focus on single to whole plant simulation, and differ in the breadth of belowground processes incorporated [9]. No single model successfully incorporates all processes at a sophisticated level of complexity. Such parsimony is a reasonable tactic given our current understanding of belowground processes. The model developed in this work was of sufficient complexity to investigate whether all roots have homogenous exudation. The main model limitation is the assumption of static root cytoplasm concentration. Empirical evidence suggests that exudation varies temporally at seasonal timescales [36]. Furthermore, soil water uptake dynamics are crudely represented spatially and temporally in this model. Temporally, root water uptake is not constant as it responds to stomata conduction which is subsequently regulated by a set of climatic variables. Spatially, root water uptake varies with depth with root abundance and the spatial arrangement of roots [39].
Numerical analysis revealed the model was sensitive to solute properties. However, the precise behavior of plant roots and exudates are difficult to predict. For instance, considerable variations in sorption have been noted between different forest soils [40], while mineralization rates are unstable even for the same soil across years [41]. While the preponderance of evidence does suggest the parameter values utilized in this study are correct to within a factor or order of magnitude, the model results are sensitive to their variations. Net exudation rates could vary by a factor of seven for the same solute between the poles of the parameter set in the literature. In particular, exudation rates were sensitive to mineralization rates as this factor is the primary mechanisms for removal of solutes on the rhizoplane. However, regulation of mineralization rates by temperature is well documented [42,43], and long term thermal monitoring data exist to provide a large degree of confidence related to its depth sensitivity. Quantifying the role of microbial biomass is more speculative. Despite studies showing a clear decreasing mineralization rate with depth for structural litter, few studies have examined labile C which may be palatable to a wider microbial community than structurally complex litter [44]. Perhaps the process with the most unknown regarding its depth dependence is the diffusion. Many studies have highlighted the complex nature of the peat solid phase [45]. Converting these measured properties of the solid phase into reductions in the effective diffusion rate is a daunting task. However, the insights gained from this model should provide the next generation of modelers with a deeper understanding of root exudate regulation, specifically the depth dependence on exudation rates which could be incorporated as a simple exponential decay function.
4. Materials and Methods
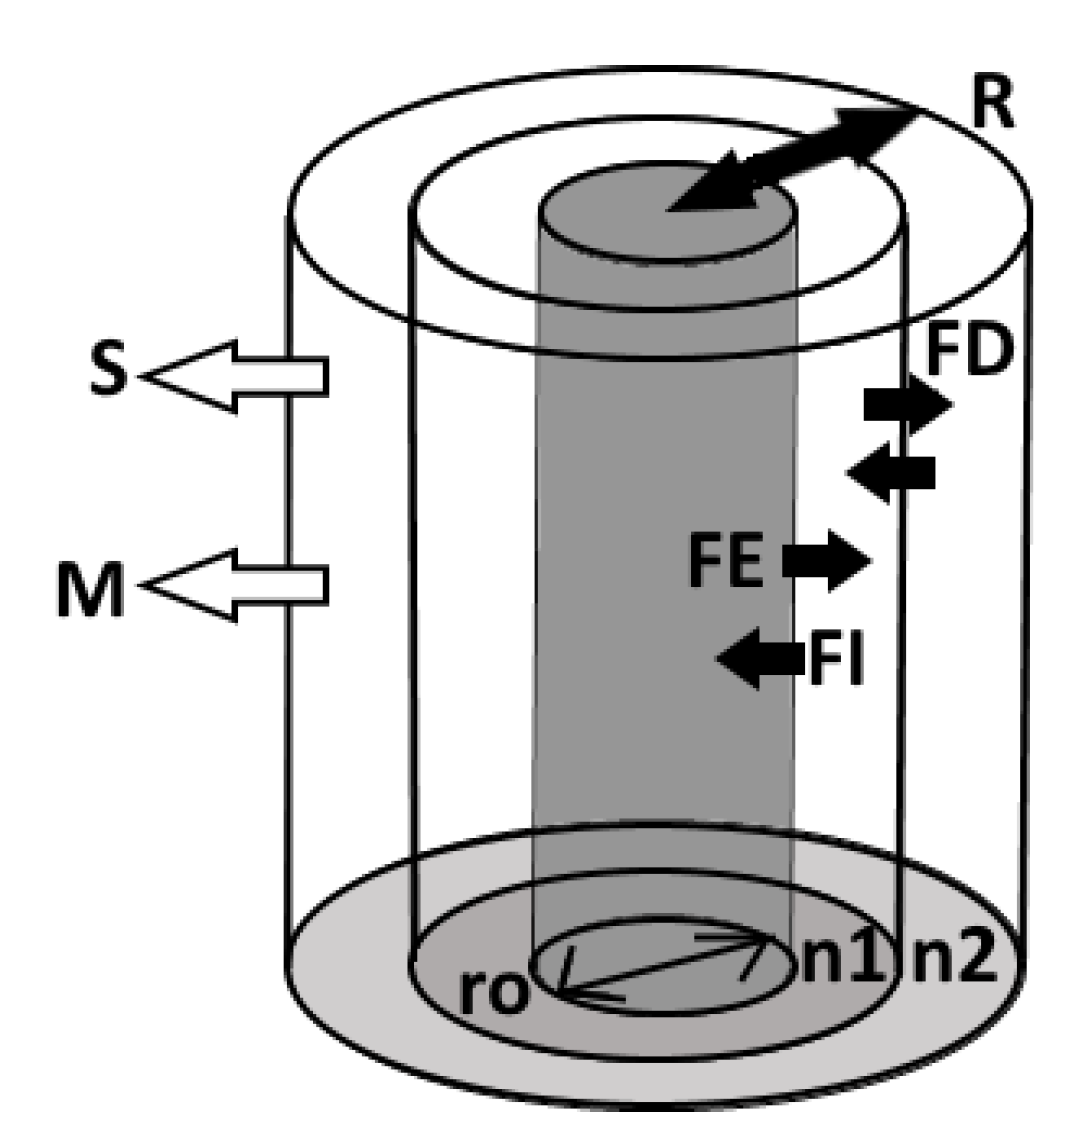
The model is based on a Barber–Cushman approach [46] to simulate accumulation gradients around a cylindrical root () and rhizosphere soil divided into multiple () thin vertical concentric annulus of equal thickness that are considered a homogenous medium with properties reflective of the peat layer depth (Figure 10). Efflux () and influx () between the root and the initial soil annulus (the rhizoplane) are proportional to their concentration gradient, with the root internal concentration held constant for simplicities sake. Net exudation into the rhizoplane occurs when . Exudation to the rhizoplane is removed from the soil cylinder pool either by sorption to the soil solid phase () or mineralization (). Remaining exudates exchange with adjacent soil cylinders via diffusion (), eventually forming an outward radial accumulation gradient until equilibrium is reached and the rhizosphere () has reached its full extent. The exudation rate at equilibrium is considered the depth dependent exudation rate.
4.1. Root Exudation Modeling Approach
Net exudation follows the efflux-influx model [3]. Exudation from the root into the initial soil cylinder, is given by:
where is the efflux (μmol cm−1 hr−1), and is the influx (μmol cm−1 hr−1) of solute . Efflux for non-charged compounds is described by the equation:
where is the root area (cm2/ cm root length), is the membrane permeability coefficient (cm hr−1), is the root cell cytoplasm concentration (µmol cm−3), and is the soil solution concentration (µmol cm−3). Influx of non-charged or weakly charged compounds are concentration dependent and described by Michaelis–Menten kinetics [47] where:
and is the maximum uptake rate (µmol C cm−1 root hr−1) and is the Michaelis–Menten coefficient (µmol cm−3).
For ionic compounds, the exterior face of the cell prevents in influx from occurring and draws the negatively charged compounds out of the cell at a greater rate dependent on the compound charge at a cytosol pH of 7~7.2. The net flux density equation [48] is used to describe the flux from the roots to the soil as:
and where is the membrane potential (−120 mV), is the faraday constant (9.649 × 10⁴ J mol−1 V−1), R as the gas constant 8.3143 (J mol−1 K−1), as the temperature in Kelvin (K), and is the charge of the solute is solution.
Flux of charged and non-charged exudates depend on the permeability of the root, which is solute specific due to variations in molecular size, and polarity [49]. However, the interpretation of permeability coefficients from existing experimental data has proven difficult, inhibiting asserting solute specific coefficients with confidence. Therefore, membrane permeability will be assumed invariable within the sugar, organic acid, and amino acid exudate classes [50], with the sugars coefficient of 1.15 × 10⁻⁴ cm hr−1, a higher coefficient organic acids of 4.32 × 10⁻⁴ cm hr−1 based on malate exudation from wheat root tips [3,50,51]. Permeability values for amino acids were not available, hence permeability was assumed the same as sugars as amino acids as they are mainly non-charged.
Model parameterization is based on the soil properties of Mer Bleue, Canada, a raised ombrotrophic bog 15 km east of Ottawa, Ontario (45.41° N, 75.52° W). Root parameters such as root area and internal root concentrations were based on [34] adjusted for units of surface area. E. vaginatum root cellular concentrations of glucose and malate are 44.7 and 27.4 µmol cm−3, respectively, which are comparable to 40 and 0.5 µmol cm−3 for maize roots [3].
4.2. Diffusion Modeling Approach ()
Solute movement in the soil is based on Fick’s law of diffusion based on the difference in solute concentration between adjacent soil cylinders. Aside from the concentration difference, the rate of flux depends upon the solute specific diffusion coefficient, whose values are available in the literature based on empirically measured diffusion in pure water. Solute transport along the inner boundary between two soil cylinders is given by Fick’s Law [52] as:
where is the concentration gradient for solute between soil cylinders and the solute concentration at radius in the adjacent soil cylinder, and is the effective diffusion coefficient for solute in soil layer . Diffusion coefficients for the movement of individual solutes in pure water are modified due to the introduction of a solid phase which reduces the liquid phase space to conducts water [53] and slows the rate of diffusion since the diffusion pathway elongates from a straight line based on the morphology of the pore space in three dimensions [54]. Diffusion rates are further attenuated by the capacity of the solid phase to physio-chemically bind C compounds. Thus, the effective diffusion of a sorbing solute in saturated media is represented as the fraction of the volume amenable to solute flow, (), tortuosity of the diffusion pathway, (, and a sorption retardation factor, ( as:
where (cm2 s−1) is the diffusion coefficient of solute in pure liquid water.
Compression and decomposition increase the mass of the solid phase per unit volume in deeper peat [55]. The faction amenable to solute flow is based on the porosity () of soil layer , where porosity is derived from bulk density [56]. Porosity [57] is the difference between a baseline specific gravity of peat (g cm−3) minus the bulk density as:
where the baseline specific gravity of peat is 1.5 g cm−3, as has been utilized by [57] and [58] for hydrological modeling at Mer Bleue. Bulk density is modeled as a power function [58] which is a power function for measured bulk density, (g cm−3), by depth, (cm) as:
where at Mer Bleue, , , equaling a bulk density increase from 0.0107 g cm−3 at the surface to an order of magnitude larger at 0.109 g cm−3 at 60 cm depth.
Depth further influences the pore geometry, shifting to fewer macropores, decreased average pore size, and the number of dead end flow paths increase [59,60]. As pore spaces close, the active porosity can be considerably less than the interparticle pore spaces actively transmitting solutes [61]. Tortuosity of the peat with depth is estimated from the porosity based on the Archie’s power law [62]:
where a value of provided the best fit for measured values at three northern Canadian peatland sites [61]. The retardation factor accounts for the interactions of the solute with the sorbing solid phase. As sorption is concentration dependent, the retardation factor increases until saturation is reached. This approach assumes sorption operates many times quicker than diffusion. The retardation factor [63] is:
where is the slope of the absorption isotherm for solute at the concentration in the diffusing soil cylinder , and is the bulk density of layer .
4.3. Sorption Modeling Approach ()
Sorption is often related to soil mineral and metal content, yet organic acid sorption in O horizons was shown to be non-zero [64]. Interactions of a labile C substrate with the soil cannot be easily predicted as they involve a number of complex chemical mechanisms that operate at various timescales [30]. As the binding sites in soil are limited, sorption saturates at high solution concentration. The partition between sorption to the solid and liquid phase was predicted by Langmuir adsorption isotherms [40]. Isotherms were C compound specific since their molecular properties such as molar weight, polarity, and net charge dictate their sorption to the solid phase [65], with weakly charged anions of organic acids such as acetate binding considerably less than citrate [66,67]. Neutral C compounds such as sugars have a neutral charge and thus low sorption. Sorption was tracked as a separate pool per soil layer for each C compound where the total C bound to the solid phase (µmol cm−3) is the difference between the current pool size and the pool size estimated by the Langmuir adsorption isotherm for the solution concentration (µmol cm−3):
where is the predicted amount of C compound absorbed to the soil per g of soil (µmol g−1), is the soil bulk density g cm−3, and is the volume of soil cylinder . Sorption for C compound is estimated [68] based on the maximum sorption and the affinity coefficient for each compound by:
4.4. Mineralization Modeling Approach ()
Mineralization of low molecular weight (LMW) C compounds proceeds at rates orders of magnitude greater than litter pools [69]. Half-lives for amino acids in aerobic soil are consistently reported as less than six hours [70]. Although anaerobic mineralization of litter is intrinsically slower than with the presence of oxygen, evidence from lake sediments [71], intertidal sediment [44], and marine glacial basin [72] indicate that mineralization rates of simple compounds like glucose vary greater between sites than between anoxic and oxic conditions. For example, glucose mineralization rates for anaerobic rice paddy soil were reported to have half-lives between 0.04–3.15 h [73], while half-lives of 1.10–46.2 h for salt marshes were reported [74]. These rates are comparable to those reported for agricultural grasslands [41], podsoils [75], and various topsoil types [76]. Differences between aerobic and anaerobic mineralization rates may be inconsequential since E. vaginatum roots contain aerenchyma tissues that ventilate the adjacent soil, likely sustaining oxic conditions up to one cm from the root surface [77]. Hence, this study assumes no difference between aerobic and anaerobic mineralization half-lives. The approach employed here simulates mineralization of available solutes in each layer as a first order process (similar to [32]), with base rates modified according to:
where is the base mineralization rate of C compound , is the pool size of C compound in soil layer , and is a depth affect multiplier for peat microbial biomass, and is a temperature effect mineralization modifier for layer .
Mineralization rates are mediated by a consortia of microorganisms shaped by historical C deposition [78], activity [79], and biomass [80]. Upper soil layers have a higher root density and subsequent influx of labile C that supports a larger microbial biomass pool, and select for flora specializing in consuming exudate feedstocks [3]. Inverse relationships between depth and mineralization rates are common [81]. Glucose mineralization rates in salt marshes declined by 59% between the 0–5 cm and 20–25 cm depth intervals [74], whereas acetate mineralization declined by 100% between the 0–4 cm and 18–22 cm depth intervals [82]. Microbial biomass strongly influences peatland mineralization rates [26]. In Mer Bleue, microbial biomass declines to ~53% of the surface peak value at 25 cm depth, concomitant with a decrease of 26–38% in litter decomposition rates [83], and organic acid half-lives were 2–6 times longer at 30–45 cm than 0–15 cm soil depth intervals [40]. Mineralization rates were assumed to decline with microbial biomass which declines exponentially with depth. The microbial biomass modifier is given by the following equation:
where and were fit with the nls package in R using the normalized microbial biomass [26].
The temperature modifier was the commonly employed Q10 function [43,84,85,86], utilizing values from published research on Mer Bleue. Q10 values for recalcitrant C typically range from 2.7 [87] to 6 [88], whereas labile peat displays less temperature sensitivity. Little is known about the effects of temperature on LMW C mineralization. Labile litter and peat was modeled with a smaller Q10 value of 2.3 [44,89] and estimated a Q10 of 2.0 for three amino acids over a 1–30 °C range. Mineralization temperature sensitivity was modeled by:
where Q10 = 2.3, is the temperature at soil layer . Soil temperature was modeled as a logarithmic function with depth based on the growing season daily average soil temperature (day of year 150–250) recorded for a Hollow at Mer Bleue by soil temperature probes at 10, 20, 40, 60, 80, 150, 250 cm depths for the years 1998–2010. The hollow site was chosen as features less interannual temperature variability. The soil temperature with depth relationship is an approximation of the summer average temperatures and does not account for soil temperature dynamics, which produce larger swings in temperature at shallower soil depth [43]. The soil temperature was simulated as per [43] by:
where and .
4.5. Numerical Analysis
Numerical analysis was conducted in two parts. Accumulation gradients were first estimated based on a C compound specific parameterization. Second, a global sensitivity analysis was conducted for non-polarized exudate compounds (sugars and amino acids). As insufficient sample size or improper sample distribution can hinder the reliability of a sensitivity analysis [90], the parameter space was based on the range of parameters found in the literature for said class (Table 1). All parameters were varied simultaneously [91] utilizing a Sobel sequence [92] to generate a uniform distribution in the multivariate parameter space [93]. The contribution of any parameter to the variance in model outputs was evaluated in R 2.9.0 and the sensitivity package for R [94].
For both analysis, accumulation gradients were simulated using 500 soil annuluses representing a potential rhizosphere radius of 10 cm (0.2 mm width per annulus). The potential rhizosphere radius was set high to ensure the model reached equilibrium before the last annulus. Exchanges between soil annuluses were set simulated with a one second time step. The accumulation gradient was assumed to have reached equilibrium when the relative change in solute concentration between time steps was less than 0.00001%. For each soil annulus, model outputs include the soil solute concentration, the solute concentration bound to the solid phase, the portion of solute mineralized per time step, the net flux between adjacent soil annuluses per time step. The rhizoplane concentration, the time to reach equilibrium, the rhizosphere extent are derived from the model outputs.
5. Conclusions
This simulation model has produced estimates of exudation rates that are in line with previous reports, while demonstrating that exudation rates for C compounds regulated by influx do vary with depth on account of greater recapture of accumulated exudates. The insights provided by this model help provide a better understanding of exudate regulation in peatlands. The quantity and composition of exudates may help determine the labile C pool available to the methanogen community, while understanding the size of the rhizosphere has downstream implications for whether exudates escape the oxic zone around the root. These two factors are critical for assessing the flux magnitude of exudates to the microbial community.
The model results and sensitivity analysis reveal that depth was one of the top controls on root exudation. Depth also controlled the relative influence of the controls, with uptake rate and the Michaelis–Menten coefficient increasing in deeper soil. The simulated effects of soil properties on exudation were found to be considerable, resulting in rates that differed by a factor of two. Based on these results, upscaling schemes attempting to translate single root measurements to the whole root system should account for soil property induced gradients in net exudation. Furthermore, peatland models may need to consider vertical variability in exudation rates when simulating soil priming effects, methanogenesis production and transport, and C sequestration. Overall, these findings suggest that deeper roots are more competitive against the microbial community for re-uptake of exudates. However, root density has also been suggested to increase root exudation re-uptake, and influx dynamics have yet to be investigated. Further research is needed to validate soil property influences on exudation rates and to understand the functional significance of this finding in the many and important processes in the belowground processing of C.
Author Contributions
Conceptualization, C.P.; methodology, C.P.; resources, Y.H.; writing—review and editing, C.P. and Y.H.; visualization. All authors have read and agreed to the published version of the manuscript.
Funding
This work was funded by NSERC Discovery Grant RGPIN-386183 and CFI/ORF #26492 to Yuhong He, UTFA Professional Development Fund-201072 to Vincent Robinson, the Graduate Expansion Fund in the Department of Geography, Geomatics and Environment at the University of Toronto Mississauga to Cameron Proctor.
Institutional Review Board Statement
Not applicable.
Informed Consent Statement
Not applicable.
Data Availability Statement
The data presented in this study are available on request from the corresponding author. The data are not publicly available due to the costs of online hosting of files of this magnitude.
Acknowledgments
We gratefully acknowledge the support of the Xavier Raynaud for his valuable work and contribution of the Barber-Cushman codebase.
Conflicts of Interest
The authors declare no conflict of interest.
References
- Grayston, S.J.; Vaughan, D.; Jones, D. Rhizosphere carbon flow in trees, in comparison with annual plants: The importance of root exudation and its impact on microbial activity and nutrient availability. Appl. Soil Ecol. 1997, 5, 29–56. [Google Scholar] [CrossRef]
- Jones, D.L.; Hodge, A.; Kuzyakov, Y. Plant and mycorrhizal regulation of rhizodeposition. New Phytol. 2004, 163, 459–480. [Google Scholar] [CrossRef]
- Farrar, J.; Hawes, M.; Jones, D.; Lindow, S. How roots control the flux of carbon to the rhizosphere. Ecology 2003, 84, 827–837. [Google Scholar] [CrossRef]
- Fan, T.W.-M.; Lane, A.N.; Shenker, M.; Bartley, J.P.; Crowley, D.; Higashi, R.M. Comprehensive chemical profiling of gramineous plant root exudates using high-resolution NMR and MS. Phytochemistry 2001, 57, 209–221. [Google Scholar] [CrossRef]
- Neumann, G.; Römheld, V. Root excretion of carboxylic acids and protons in phosphorus-deficient plants. Plant Soil 1999, 211, 121–130. [Google Scholar] [CrossRef]
- Bekkara, F.; Jay, M.; Viricel, M.R.; Rome, S. Distribution of phenolic compounds within seed and seedlings of two Vicia faba cvs differing in their seed tannin content, and study of their seed and root phenolic exudations. Plant Soil 1998, 203, 27–36. [Google Scholar] [CrossRef]
- Xia, J.H.; Roberts, J.K.M. Improved Cytoplasmic pH Regulation, Increased Lactate Efflux, and Reduced Cytoplasmic Lactate Levels Are Biochemical Traits Expressed in Root Tips of Whole Maize Seedlings Acclimated to a Low-Oxygen Environment. Plant Physiol. 1994, 105, 651–657. [Google Scholar] [CrossRef] [Green Version]
- Kuzyakov, Y.; Razavi, B.S. Rhizosphere size and shape: Temporal dynamics and spatial stationarity. Soil Biol. Biochem. 2019, 135, 343–360. [Google Scholar] [CrossRef]
- Hinsinger, P.; Gobran, G.R.; Gregory, P.J.; Wenzel, W.W. Rhizosphere geometry and heterogeneity arising from root-mediated physical and chemical processes. New Phytol. 2005, 168, 293–303. [Google Scholar] [CrossRef]
- Mariano, E.D.; Jorge, R.A.; Keltjens, W.G.; Menossi, M. Metabolism and root exudation of organic acid anions under aluminium stress. Braz. J. Plant Physiol. 2005, 17, 157–172. [Google Scholar] [CrossRef]
- Jones, D.L.; Darrah, P.R. Role of root derived organic acids in the mobilization of nutrients from the rhizosphere. Plant Soil 1994, 166, 247–257. [Google Scholar] [CrossRef]
- Paynel, F.; Murray, P.J.; Cliquet, J.B. Root exudates: A pathway for short-term N transfer from clover and ryegrass. Plant Soil 2001, 229, 235–243. [Google Scholar] [CrossRef]
- Sundin, P.; Valeur, A.; Olsson, S.; Odham, G. Interactions between bacteria-feeding nematodes and bacteria in the rape rhizosphere: Effects on root exudation and distribution of bacteria. FEMS Microbiol. Lett. 1990, 73, 13–22. [Google Scholar] [CrossRef]
- Hertenberger, G.; Wanek, W. Evaluation of methods to measure differential 15N labeling of soil and root N pools for studies of root exudation. Rapid Commun. Mass Spectrom. 2004, 18, 2415–2425. [Google Scholar] [CrossRef] [PubMed]
- Warren, C.R. Wheat roots efflux a diverse array of organic N compounds and are highly proficient at their recapture. Plant Soil 2015, 397, 147–162. [Google Scholar] [CrossRef] [Green Version]
- Oburger, E.; Dell’mour, M.; Hann, S.; Wieshammer, G.; Puschenreiter, M.; Wenzel, W.W. Evaluation of a novel tool for sampling root exudates from soil-grown plants compared to conventional techniques. Environ. Exp. Bot. 2013, 87, 235–247. [Google Scholar] [CrossRef]
- Pinton, R.; Varanini, Z.; Nannipieri, P. (Eds.) The Rhizosphere: Biochemistry and Organic Substances at the Soil-Plant Interface, 2nd ed.; Taylor & Francis Group: Boca Raton, FL, USA, 2009; Volume 104, pp. 1095–8290. ISBN 0305-7364. [Google Scholar]
- Nguyen, C. Rhizodeposition of organic C by plants: Mechanisms and controls. Agronomie 2003, 23, 375–396. [Google Scholar] [CrossRef]
- Ryan, P.R.; Delhaize, E.; Randall, P.J. Characterisation of Al-stimulated efflux of malate from the apices of Al-tolerant wheat roots. Planta 1995, 196, 103–110. [Google Scholar] [CrossRef]
- Neumann, G.; Martinoia, E. Cluster roots—An underground adaptation for survival in extreme environments. Trends Plant Sci. 2002, 7, 162–167. [Google Scholar] [CrossRef]
- Kraffczyk, I.; Trolldenier, G.; Beringer, H. Soluble root exudates of maize: Influence of potassium supply and rhizosphere microorganisms. Soil Biol. Biochem. 1984, 16, 315–322. [Google Scholar] [CrossRef]
- Ryan, P.; Delhaize, E.; Jones, D. Function and Mechanism of organic anion exudation from plant roots. Annu. Rev. Plant Physiol. Plant Mol. Biol. 2001, 52, 527–560. [Google Scholar] [CrossRef] [PubMed]
- Lesuffleur, F.; Paynel, F.; Bataillé, M.-P.; Deunff, E.L.; Cliquet, J.-B. Root amino acid exudation: Measurement of high efflux rates of glycine and serine from six different plant species. Plant Soil 2007, 294, 235–246. [Google Scholar] [CrossRef]
- Svennerstam, H.; Jämtgård, S.; Ahmad, I.; Huss-Danell, K.; Näsholm, T.; Ganeteg, U. Transporters in arabidopsis roots mediating uptake of amino acids at naturally occurring concentrations. New Phytol. 2011, 191, 459–467. [Google Scholar] [CrossRef] [PubMed]
- Lee, H.J.; Jeong, S.E.; Kim, P.J.; Madsen, E.L.; Jeon, C.O. High resolution depth distribution of Bacteria, Archaea, methanotrophs, and methanogens in the bulk and rhizosphere soils of a flooded rice paddy. Front. Microbiol. 2015, 6, 639. [Google Scholar] [CrossRef] [PubMed]
- Yan, W.; Artz, R.R.E.; Johnson, D. Species-specific effects of plants colonising cutover peatlands on patterns of carbon source utilisation by soil microorganisms. Soil Biol. Biochem. 2008, 40, 544–549. [Google Scholar] [CrossRef]
- Hafner, S.; Wiesenberg, G.L.B.; Stolnikova, E.; Merz, K.; Kuzyakov, Y. Spatial distribution and turnover of root-derived carbon in alfalfa rhizosphere depending on top- and subsoil properties and mycorrhization. Plant Soil 2014, 380, 101–115. [Google Scholar] [CrossRef]
- Tückmantel, T.; Leuschner, C.; Preusser, S.; Kandeler, E.; Angst, G.; Mueller, C.W.; Meier, I.C. Root exudation patterns in a beech forest: Dependence on soil depth, root morphology, and environment. Soil Biol. Biochem. 2017, 107, 188–197. [Google Scholar] [CrossRef]
- Luster, J.; Göttlein, A.; Nowack, B.; Sarret, G. Sampling, defining, characterising and modeling the rhizosphere-the soil science tool box. Plant Soil 2009, 321, 457–482. [Google Scholar] [CrossRef]
- Darrah, P.R. Measuring the diffusion coefficient of rhizosphere exudates in soil. I. The diffusion of non-sorbing compounds. J. Soil Sci. 1991, 42, 413–420. [Google Scholar] [CrossRef]
- Personeni, E.; Nguyen, C.; Marchal, P.; Pagès, L. Experimental evaluation of an efflux-influx model of C exudation by individual apical root segments. J. Exp. Bot. 2007, 58, 2091–2099. [Google Scholar] [CrossRef]
- Raynaud, X. Soil properties are key determinants for the development of exudate gradients in a rhizosphere simulation model. Soil Biol. Biochem. 2010, 42, 210–219. [Google Scholar] [CrossRef]
- Okutani, F.; Hamamoto, S.; Aoki, Y.; Nakayasu, M.; Nihei, N.; Nishimura, T.; Yazaki, K.; Sugiyama, A. Rhizosphere modelling reveals spatiotemporal distribution of daidzein shaping soybean rhizosphere bacterial community. Plant Cell Environ. 2020, 43, 1036–1046. [Google Scholar] [CrossRef] [PubMed]
- Horn, M.A.; Matthies, C.; Küsel, K.; Schramm, A.; Drake, H.L. Hydrogenotrophic methanogenesis by moderately acid-tolerant methanogens of a methane-emitting acidic peat. Appl. Environ. Microbiol. 2003, 69, 74–83. [Google Scholar] [CrossRef] [Green Version]
- Sun, Z.; Wang, Q.; Matsushita, B.; Fukushima, T.; Ouyang, Z.; Watanabe, M. A new method to define the VI-Ts diagram using subpixel vegetation and soil information: A case study over a semiarid agricultural region in the North China plain. Sensors 2008, 8, 6260–6279. [Google Scholar] [CrossRef] [PubMed] [Green Version]
- Phillips, R.P.; Erlitz, Y.; Bier, R.; Bernhardt, E.S. New approach for capturing soluble root exudates in forest soils. Funct. Ecol. 2008, 22, 990–999. [Google Scholar] [CrossRef]
- Aoki, M.; Fujii, K.; Kitayama, K. Environmental Control of Root Exudation of Low-Molecular Weight Organic Acids in Tropical Rainforests. Ecosystems 2012, 15, 1194–1203. [Google Scholar] [CrossRef]
- Raich, J.W.; Tufekcioglu, A. Vegetation and soil respiration: Correlations and controls. Biogeochemistry 2000, 48, 71–90. [Google Scholar] [CrossRef]
- Hao, X.; Zhang, R.; Kravchenko, A. Effects of root density distribution models on root water uptake and water flow under irrigation. Soil Sci. 2005, 170, 167–174. [Google Scholar] [CrossRef]
- Oburger, E.; Kirk, G.J.D.; Wenzel, W.W.; Puschenreiter, M.; Jones, D.L. Interactive effects of organic acids in the rhizosphere. Soil Biol. Biochem. 2009, 41, 449–457. [Google Scholar] [CrossRef]
- Glanville, H.; Rousk, J.; Golyshin, P.; Jones, D.L. Mineralization of low molecular weight carbon substrates in soil solution under laboratory and field conditions. Soil Biol. Biochem. 2012, 48, 88–95. [Google Scholar] [CrossRef]
- Wania, R.; Ross, I.; Prentice, I.C. Implementation and evaluation of a new methane model within a dynamic global vegetation model: LPJ-WHyMe v1.3.1. Geosci. Model Dev. 2010, 3, 565–584. [Google Scholar] [CrossRef] [Green Version]
- Wu, Y.; Blodau, C. PEATBOG: A biogeochemical model for analyzing coupled carbon and nitrogen dynamics in northern peatlands. Geosci. Model Dev. 2013, 6, 1173–1207. [Google Scholar] [CrossRef] [Green Version]
- Kristensen, E.; Ahmed, S.I.; Devol, A.H. Aerobic and anaerobic decomposition of organic matter in marine sediment: Which is fastest? Limnol. Oceanogr. 1995, 40, 1430–1437. [Google Scholar] [CrossRef]
- Rezanezhad, F.; Price, J.S.; Quinton, W.L.; Lennartz, B.; Milojevic, T.; Cappellen, P.V. Structure of peat soils and implications for water storage, flow and solute transport: A review update for geochemists. Chem. Geol. 2016, 429, 75–84. [Google Scholar] [CrossRef]
- Barber, S.; Cushman, J. Nutrient uptake model for agronomic crops. In Modelling Wastewater Renovation Land Treatment; Iskander, I., Ed.; Wiley: New York, NY, USA, 1981; Volume 1, pp. 382–409. [Google Scholar]
- Michaelis, L.; Menten, M. Die Kinetik der Invertinwirkung. Biochem. Z. 1913, 49, 333–369. [Google Scholar]
- Bresseleers, G.J.M.; Goderis, H.L.; Tobback, P.P. Measurement of the glucose permeation rate across phospholipid bilayers using small unilamellar vesicles Effect of membrane composition and temperature. BBA Biomembr. 1984, 772, 374–382. [Google Scholar] [CrossRef]
- Bertin, C.; Yang, X.; Weston, L.A. The role of root exudates and allelochemicals in the rhizosphere. Plant Soil 2003, 256, 67–83. [Google Scholar] [CrossRef]
- Jones, D.L. Organic acids in the rhizosphere—A critical review. Plant Soil 1998, 205, 25–44. [Google Scholar] [CrossRef]
- Jones, D.L.; Edwards, A.C. Influence of sorption on the biological utilization of two simple carbon substrates. Soil Biol. Biochem. 1998, 30, 1895–1902. [Google Scholar] [CrossRef]
- Tinker, P.B.; Nye, P.H. Solute Movement in the Rhizosphere; Oxford University Press: Oxford, UK, 2000; Volume 52, ISBN 1365-2389. [Google Scholar]
- Van Cappellen, P.; Gaillard, J.F. Biogeochemical dynamics in aquatic systems. In Reactive Transport in Porous Media, Reviews in Mineralogy; Lichtner, P., Steefel, C., Oelkers, E., Eds.; Mineralogical Society of America: Washington, DC, USA, 1996; Volume 34, pp. 335–376. [Google Scholar]
- Xia, J.H.; Saglio, P.H. Characterization of the Hexose Transport System in Maize Root Tips. Plant Physiol. 1988, 88, 1015–1020. [Google Scholar] [CrossRef] [Green Version]
- Hayward, P.M.; Clymo, R.S. Profiles of Water Content and Pore Size in Sphagnum and Peat, and their Relation to Peat Bog Ecology. Proc. R Soc. Lond. B Biol. Sci. 1982, 215, 299. [Google Scholar]
- Weiss, R.; Alm, J.; Laiho, R.; Laine, J. Modeling moisture retention in peat soils. Soil Sci. Soc. Am. J. 1998, 62, 305–313. [Google Scholar] [CrossRef]
- Dimitrov, D.D.; Grant, R.F.; Lafleur, P.M.; Humphreys, E.R. Modeling the effects of hydrology on ecosystem respiration at Mer Bleue bog. J. Geophys. Res. Biogeosci. 2010, 115, G04043. [Google Scholar] [CrossRef] [Green Version]
- Blodau, C.; Moore, T.R. Macroporosity affects water movement and pore water sampling in peat soils. Soil Sci. 2002, 167, 98–109. [Google Scholar] [CrossRef] [Green Version]
- Quinton, W.L.; Hayashi, M.; Chasmer, L.E. Peatland hydrology of discontinuous permafrost in the northwest territories: Overview and synthesis. Can. Water Resour. J. 2009, 34, 311–328. [Google Scholar] [CrossRef]
- Rezanezhad, F.; Quinton, W.L.; Price, J.S.; Elliot, T.R.; Elrick, D.; Shook, K.R. Influence of pore size and geometry on peat unsaturated hydraulic conductivity computed from 3D computed tomography image analysis. Hydrol. Process. 2010, 24, 2983–2994. [Google Scholar] [CrossRef]
- Quinton, W.L.; Hayashi, M.; Carey, S.K. Peat hydraulic conductivity in cold regions and its relation to pore size and geometry. Hydrol. Process. 2008, 22, 2829–2837. [Google Scholar] [CrossRef]
- Archie, G. The electrical resistivity log as an aid in determining some reservoir characteristics. Trans. AIME 1942, 146, 54–67. [Google Scholar] [CrossRef]
- Shackelford, C.D.; Daniel, D.E. Diffusion in saturated soil. I: Background. J. Geotech. Eng. 1991, 117, 467–484. [Google Scholar] [CrossRef]
- Van Hees, P.; Vinogradoff, S.; Edwards, A.; Godbold, D.; Jones, D. Low molecular weight organic acid adsorption in forest soils: Effects on soil solution concentrations and biodegradation rates. Soil Biol. Biochem. 2003, 35, 1015–1026. [Google Scholar] [CrossRef]
- Jagadamma, S.; Mayes, M.A.; Zinn, Y.L.; Gisladottir, G.; Russell, A.E. Sorption of organic carbon compounds to the fine fraction of surface and subsurface soils. Geoderma 2014, 213, 79–86. [Google Scholar] [CrossRef]
- Strom, L.; Owen, A.G.; Godbold, D.L.; Jones, D.L. Organic acid behaviour in a calcareous soil: Sorption reactions and biodegradation rates. Soil Biol. Biochem. 2001, 33, 2125–2133. [Google Scholar] [CrossRef]
- Hees, P.A.W.V.; Jones, D.L.; Godbold, D.L. Biodegradation of low molecular weight organic acids in coniferous forest podzolic soils. Soil Biol. Biochem. 2002, 34, 1261–1272. [Google Scholar] [CrossRef]
- Jones, D.L.; Brassington, D.S. Sorption of organic acids in acid soils and its implications in the rhizosphere. Eur. J. Soil Sci. 1998, 49, 447–455. [Google Scholar] [CrossRef]
- Tate, R.L. Soil Microbiology, 2nd ed.; Wiley: New York, NY, USA, 2000. [Google Scholar]
- Jones, D.L.; Kemmitt, S.J.; Wright, D.; Cuttle, S.P.; Bol, R.; Edwards, A.C. Rapid intrinsic rates of amino acid biodegradation in soils are unaffected by agricultural management strategy. Soil Biol. Biochem. 2005, 37, 1267–1275. [Google Scholar] [CrossRef]
- Toerien, D.F.; Cavari, B. Effect of Temperature on Heterotrophic Glucose Uptake, Mineralization, and Turnover Rates in Lake Sediments. Appl. Environ. Microbiol. 1982, 43, 1–5. [Google Scholar] [CrossRef] [PubMed] [Green Version]
- Lee, C. Controls on organic carbon preservation: The use of stratified water bodies to compare intrinsic rates of decomposition in oxic and anoxic systems. Geochim. Cosmochim. Acta 1992, 56, 3323–3335. [Google Scholar] [CrossRef]
- Chidthaisong, A.; Rosenstock, B.; Conrad, R. Measurement of monosaccharides and conversion of glucose to acetate in anoxic rice field soil. Appl. Environ. Microbiol. 1999, 65, 2350–2355. [Google Scholar] [CrossRef] [Green Version]
- Christian, R.R.; Wiebe, W.J. Anaerobic microbial community metabolism in Spartina alterniflora soil. Limnol. Oceanogr. 1978, 23, 328–336. [Google Scholar] [CrossRef]
- Kuzyakov, Y.; Demin, V. CO2 efflux by rapid decomposition of low molecular organic substances in soils. Sci. Soils 1998, 3, 11–22. [Google Scholar] [CrossRef]
- Jones, D.L.; Murphy, D.V. Microbial response time to sugar and amino acid additions to soil. Soil Biol. Biochem. 2007, 39, 2178–2182. [Google Scholar] [CrossRef]
- Greenup, A.L.; Bradford, M.A.; Mcnamara, N.P.; Ineson, P.; Lee, J.A. The role of Eriophorum vaginatum in CH4 flux from an ombrotrophic peatland. Plant Soil 2000, 227, 265–272. [Google Scholar] [CrossRef]
- Grayston, S.J.; Wang, S.; Campbell, C.D.; Edwards, A.C. Selective influence of plant species on microbial diversity in the rhizosphere. Soil Biol. Biochem. 1998, 30, 369–378. [Google Scholar] [CrossRef]
- Marschner, P.; Marhan, S.; Kandeler, E. Microscale distribution and function of soil microorganisms in the interface between rhizosphere and detritusphere. Soil Biol. Biochem. 2012, 49, 174–183. [Google Scholar] [CrossRef]
- Johnson, D.; Booth, R.E.; Whiteley, A.S.; Bailey, M.J.; Read, D.J.; Grime, J.P.; Leake, J.R. Plant community composition affects the biomass, activity and diversity of microorganisms in limestone grassland soil. Eur. J. Soil Sci. 2003, 54, 671–677. [Google Scholar] [CrossRef]
- Hees, P.A.W.V.; Jones, D.L.; Finlay, R.; Godbold, D.L.; Lundström, U.S. The carbon we do not see—The impact of low molecular weight compounds on carbon dynamics and respiration in forest soils: A review. Soil Biol. Biochem. 2005, 37, 1–13. [Google Scholar] [CrossRef]
- Balba, M.T.; Nedwell, D.B. Microbial metabolism of acetate, propionate and butyrate in anoxic sediment from the Colne Point saltmarsh, Essex, U.K. J. Gen. Microbiol. 1982, 128, 1415–1422. [Google Scholar] [CrossRef] [Green Version]
- Moore, T.R.; Bubier, J.L.; Bledzki, L. Litter decomposition in temperate peatland ecosystems: The effect of substrate and site. Ecosystems 2007, 10, 949–963. [Google Scholar] [CrossRef] [Green Version]
- Frolking, S.; Roulet, N.T.; Moore, T.R.; Lafleur, P.M.; Bubier, J.L.; Crill, P.M. Modeling seasonal to annual carbon balance of Mer Bleue Bog, Ontario, Canada. Glob. Biogeochem. Cycles 2002, 16. [Google Scholar] [CrossRef]
- Zhang, Y.; Li, C.; Trettin, C.C.; Li, H.; Sun, G. An integrated model of soil, hydrology, and vegetation for carbon dynamics in wetland ecosystems. Glob. Biogeochem. Cycles 2002, 16, 1–17. [Google Scholar] [CrossRef] [Green Version]
- Lai, D.Y.F. Modelling the effects of climate change on methane emission from a northern ombrotrophic bog in Canada. Environ. Geol. 2009, 58, 1197–1206. [Google Scholar] [CrossRef]
- Scanlon, D.; Moore, T. Carbon dioxide production from peatland soil profiles: The influence of temperature, oxic/anoxic conditions and substrate. Soil Sci. 2000, 165, 153–160. [Google Scholar] [CrossRef]
- Walter, B.P.; Heimann, M. A process-based, climate-sensitive model to derive methane emissions from natural wetlands: Application to five wetland sites, sensitivity to model parameters, and climate. Glob. Biogeochem. Cycles 2000, 14, 745–765. [Google Scholar] [CrossRef] [Green Version]
- Vinolas, L.C.; Healey, J.R.; Jones, D.L. Kinetics of soil microbial uptake of free amino acids. Biol. Fertil. Soils 2001, 33, 67–74. [Google Scholar] [CrossRef]
- Campolongo, F.; Cariboni, J.; Saltelli, A. An effective screening design for sensitivity analysis of large models. Environ. Model. Softw. 2007, 22, 1509–1518. [Google Scholar] [CrossRef]
- Bacour, C.; Jacquemoud, S.; Tourbier, Y.; Dechambre, M.; Frangi, J.P. Design and analysis of numerical experiments to compare four canopy reflectance models. Remote Sens. Environ. 2002, 79, 72–83. [Google Scholar] [CrossRef]
- Sobol, I. Sensitivity estimates for nonlinear mathematical models. Math. Model. Comput. Exp. Engl. Transl 1993, 1, 407–414. [Google Scholar]
- Saltelli, A.; Ratto, M.; Andres, T.; Campolongo, F.; Cariboni, J.; Gatelli, D.; Saisana, M.; Tarantola, S. Global Sensitivity Analysis: The Primer, 1st ed.; John Wiley and Sons: West Sussex, UK, 2008. [Google Scholar]
- Pujol, G. Sensitivity: Sensitivity Analysis. R Package Version 1.3-0. 2007. Available online: www2.uaem.mx/r-mirror/web/packages/sensitivity/sensitivity.pdf (accessed on 2 November 2020).
- Schramke, J.A.; Murphy, S.F.; Doucette, W.J.; Hintze, W.D. Prediction of aqueous diffusion coefficients for organic compounds at 25 °C. Chemosphere 1999, 38, 2381–2406. [Google Scholar] [CrossRef]
- Buffle, J.; Zhang, Z.; Startchev, K. Metal flux and dynamic speciation at (Bio)interfaces. Part I: Critical evaluation and compilation of physicochemical parameters for complexes with simple ligands and fulvic/humic substances. Environ. Sci. Technol. 2007, 41, 7609–7620. [Google Scholar] [CrossRef]
- Uedaira, H.; Uedaira, H. Sugar-water interaction from diffusion measurements. J. Solut. Chem. 1985, 14, 27–34. [Google Scholar] [CrossRef]
- Kuzyakov, Y.; Jones, D.L. Glucose uptake by maize roots and its transformation in the rhizosphere. Soil Biol. Biochem. 2006, 38, 851–860. [Google Scholar] [CrossRef]
- Proctor, C.; He, Y. Quantifying root extracts and exudates of sedge and shrub in relation to root morphology. Soil Biol. Biochem. 2017, 114, 168–180. [Google Scholar] [CrossRef]
- Kielland, K. Amino acid absorption by Arctic plants: Implications for plant nutrition and nitrogen cycling. Ecology 1994, 75, 2373–2383. [Google Scholar] [CrossRef]
- Williams, M.; Yanai, R.D. Multi-dimensional sensitivity analysis and ecological implications of a nutrient uptake model. Plant Soil 1996, 180, 311–324. [Google Scholar] [CrossRef]
- Basiliko, N.; Moore, T.R.; Lafleur, P.M.; Roulet, N.T. Seasonal and inter-annual decomposition, microbial biomass, and nitrogen dynamics in a canadian bog. Soil Sci. 2005, 170, 902–912. [Google Scholar] [CrossRef]
Figure 1.
Depth dependence of model parameters. (a) Bulk density. (b) Porosity factor. (c) Tortuosity factor. (d) Diffusion sorption for citrate and oxalate at 0.05 and 0.5 µmol cm−3 concentration. (e) Soil temperature factor. (f) Microbial biomass factor.
Figure 1.
Depth dependence of model parameters. (a) Bulk density. (b) Porosity factor. (c) Tortuosity factor. (d) Diffusion sorption for citrate and oxalate at 0.05 and 0.5 µmol cm−3 concentration. (e) Soil temperature factor. (f) Microbial biomass factor.
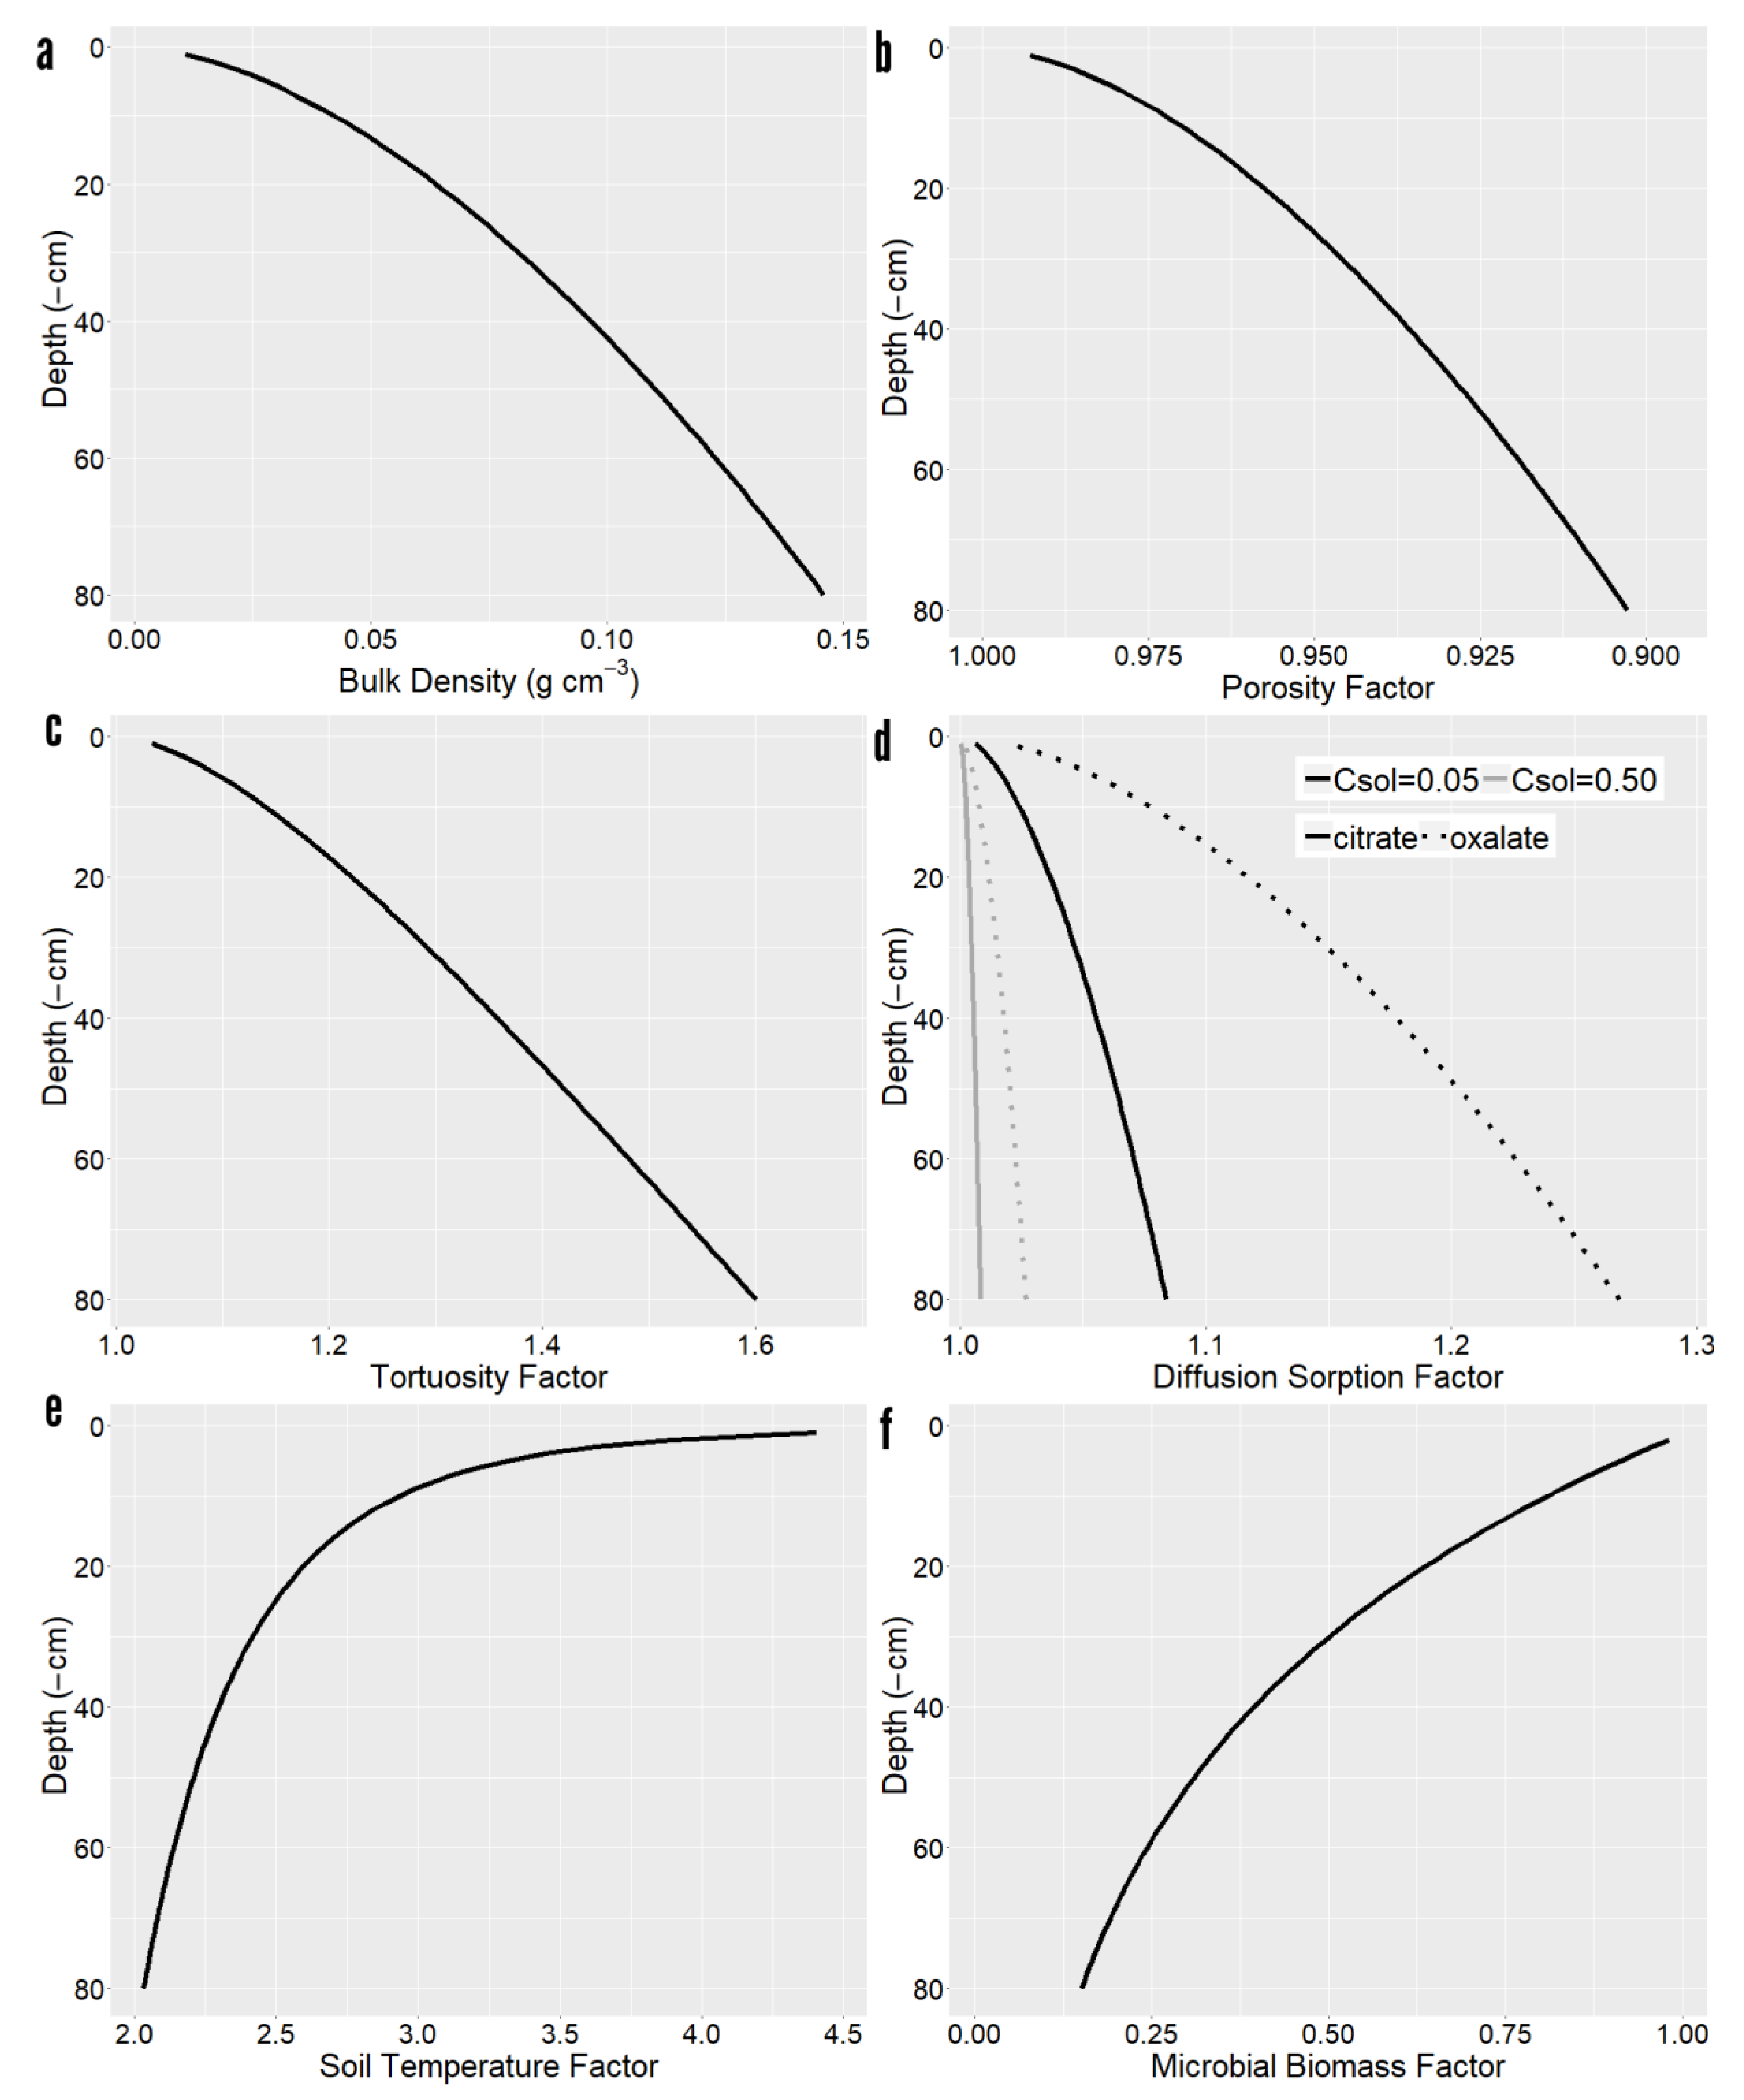
Figure 2.
Rhizosphere accumulation gradients for glucose as a function of soil depth.

Figure 3.
Depth induced exudation variability of glucose. (a) Concentration of accumulated exudates on the rhizoplane. (b) Net exudation rate as a function of depth.
Figure 3.
Depth induced exudation variability of glucose. (a) Concentration of accumulated exudates on the rhizoplane. (b) Net exudation rate as a function of depth.
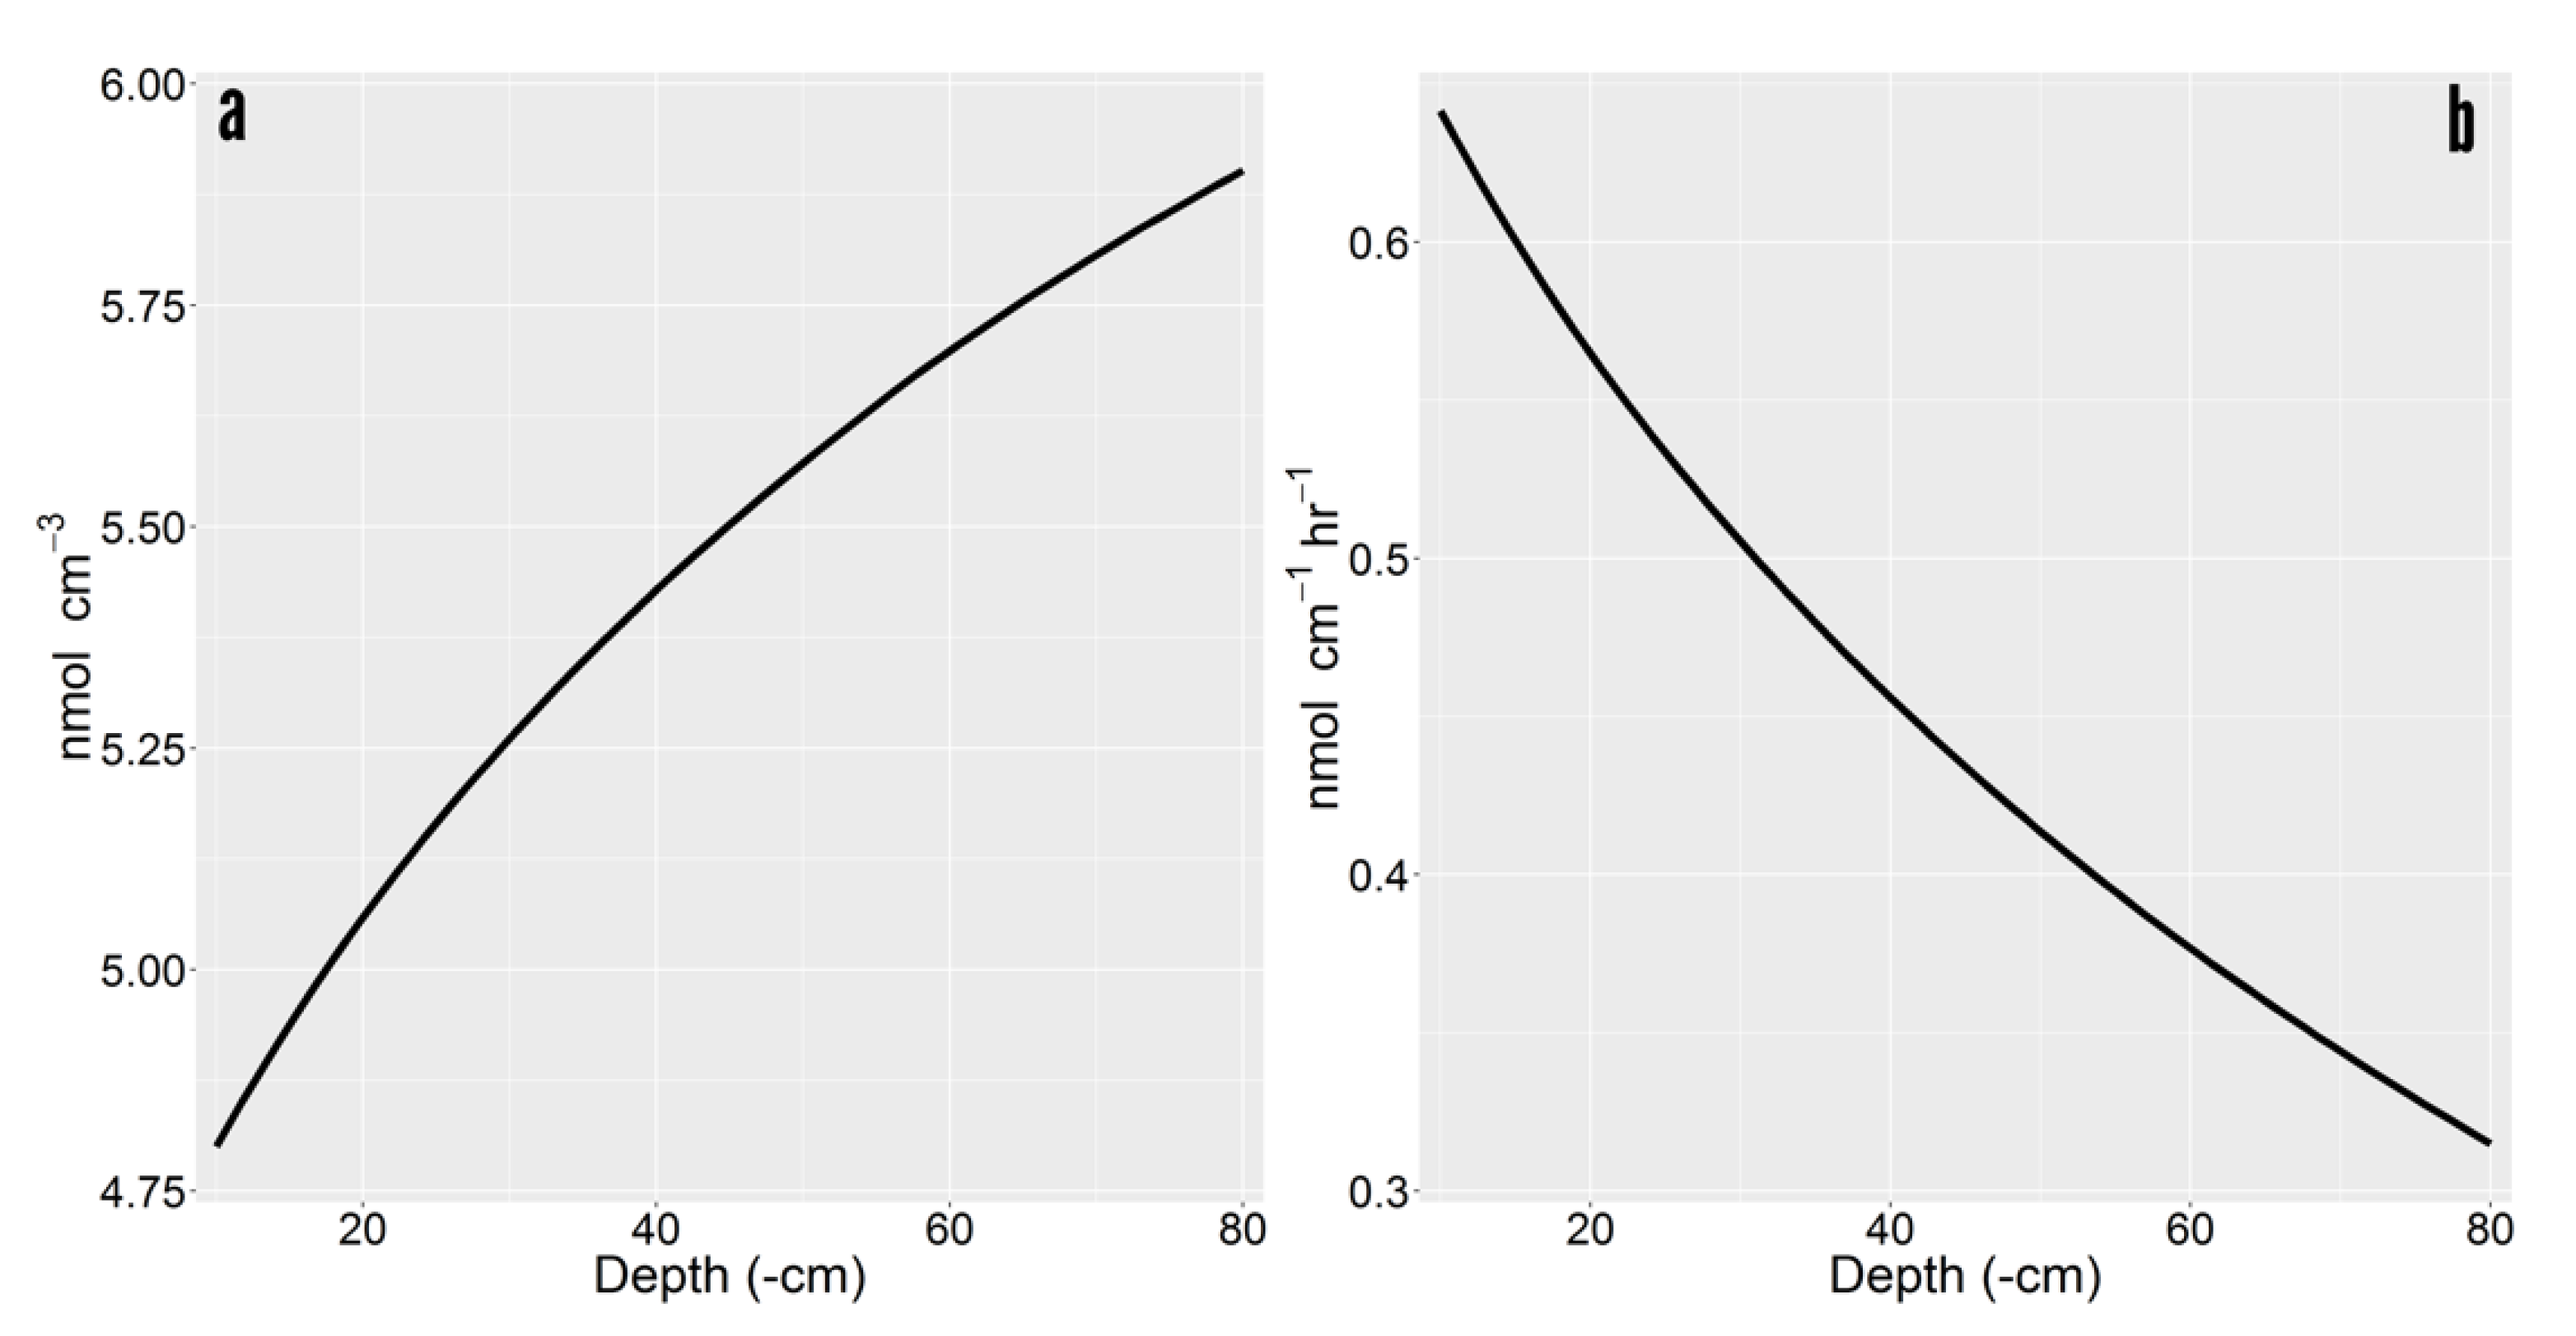
Figure 4.
Simulated rhizosphere accumulation gradients for select low molecular weight (LMW) C compounds at −40 cm depth.
Figure 4.
Simulated rhizosphere accumulation gradients for select low molecular weight (LMW) C compounds at −40 cm depth.

Figure 5.
Net root exudation per compound grouped by class. (a) Amino acids. (b) Sugars. (c) Organic acids. Note the scale of sugars varies from amino acids and sugars.
Figure 5.
Net root exudation per compound grouped by class. (a) Amino acids. (b) Sugars. (c) Organic acids. Note the scale of sugars varies from amino acids and sugars.
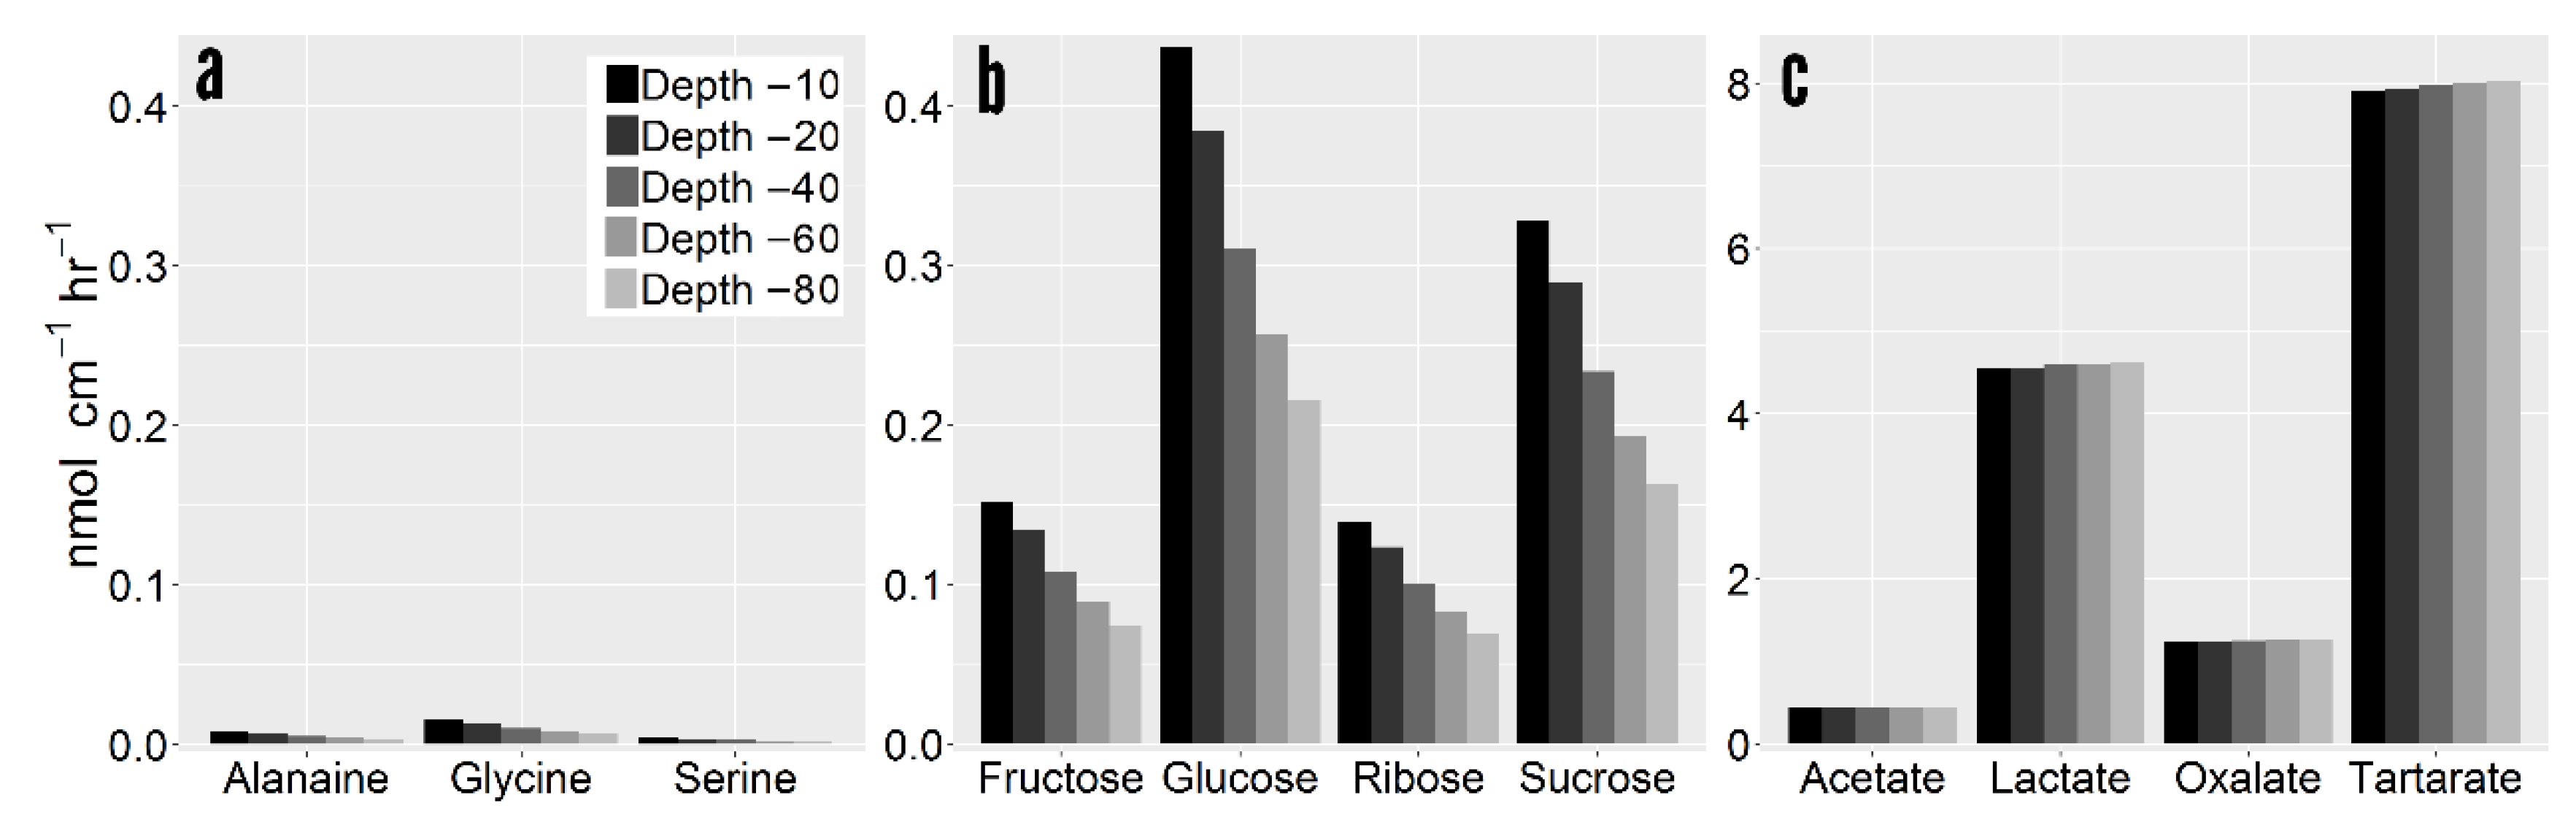
Figure 6.
Size of the rhizosphere at 0.01 nmol cm-3 threshold per LMW C compound. (a) Amino acids. (b) Sugars. (c) Organic acids.
Figure 6.
Size of the rhizosphere at 0.01 nmol cm-3 threshold per LMW C compound. (a) Amino acids. (b) Sugars. (c) Organic acids.

Figure 7.
Global sensitivity analysis of root exudate model for sugar and amino acid exudation indicating the rhizoplane concentration as a function of depth. Grey indicates the simulation results, black line represents a linear regression model.
Figure 7.
Global sensitivity analysis of root exudate model for sugar and amino acid exudation indicating the rhizoplane concentration as a function of depth. Grey indicates the simulation results, black line represents a linear regression model.
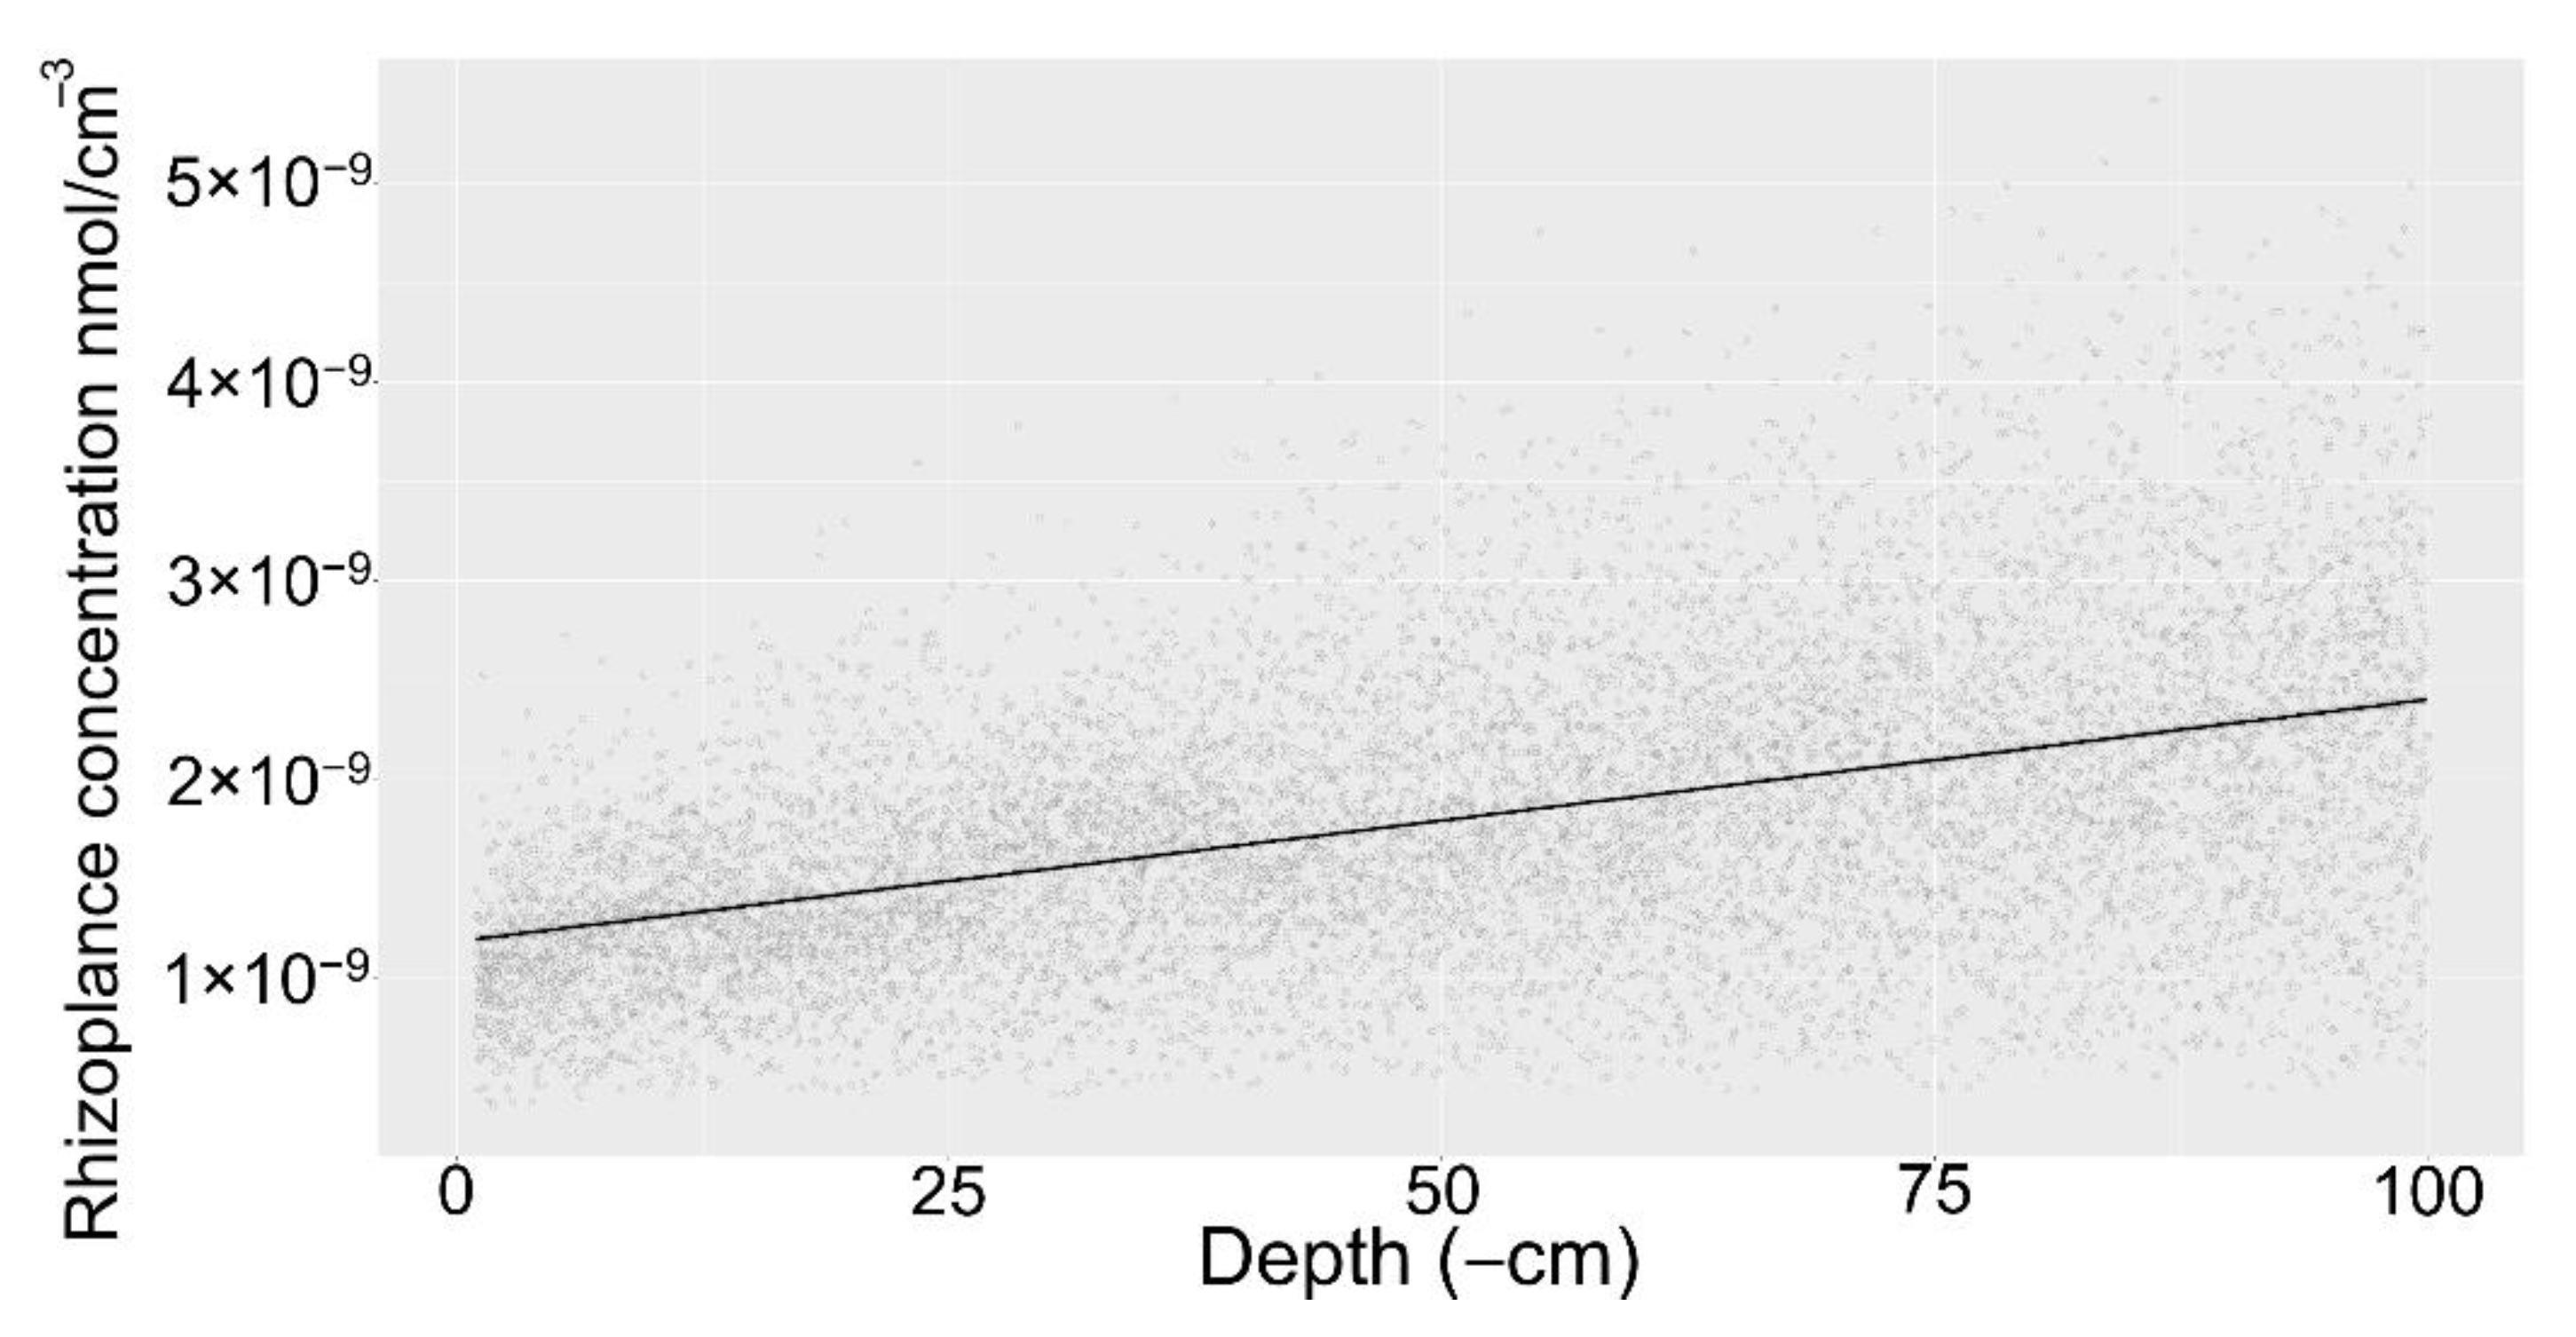
Figure 8.
Barplot of partial rank correlation coefficients of model parameters for rhizoplane concentration. Parameters: Diffusion coefficient of solute in H2O (Dinf), maximum uptake rate (Imax), mineralization rate (Kd), Michaelis–Menten coefficient (KI), sorption affinity coefficient (KS), Q10 temperature coefficient (Q10), maximum sorption (Smax), volume of water entering the root (v0).
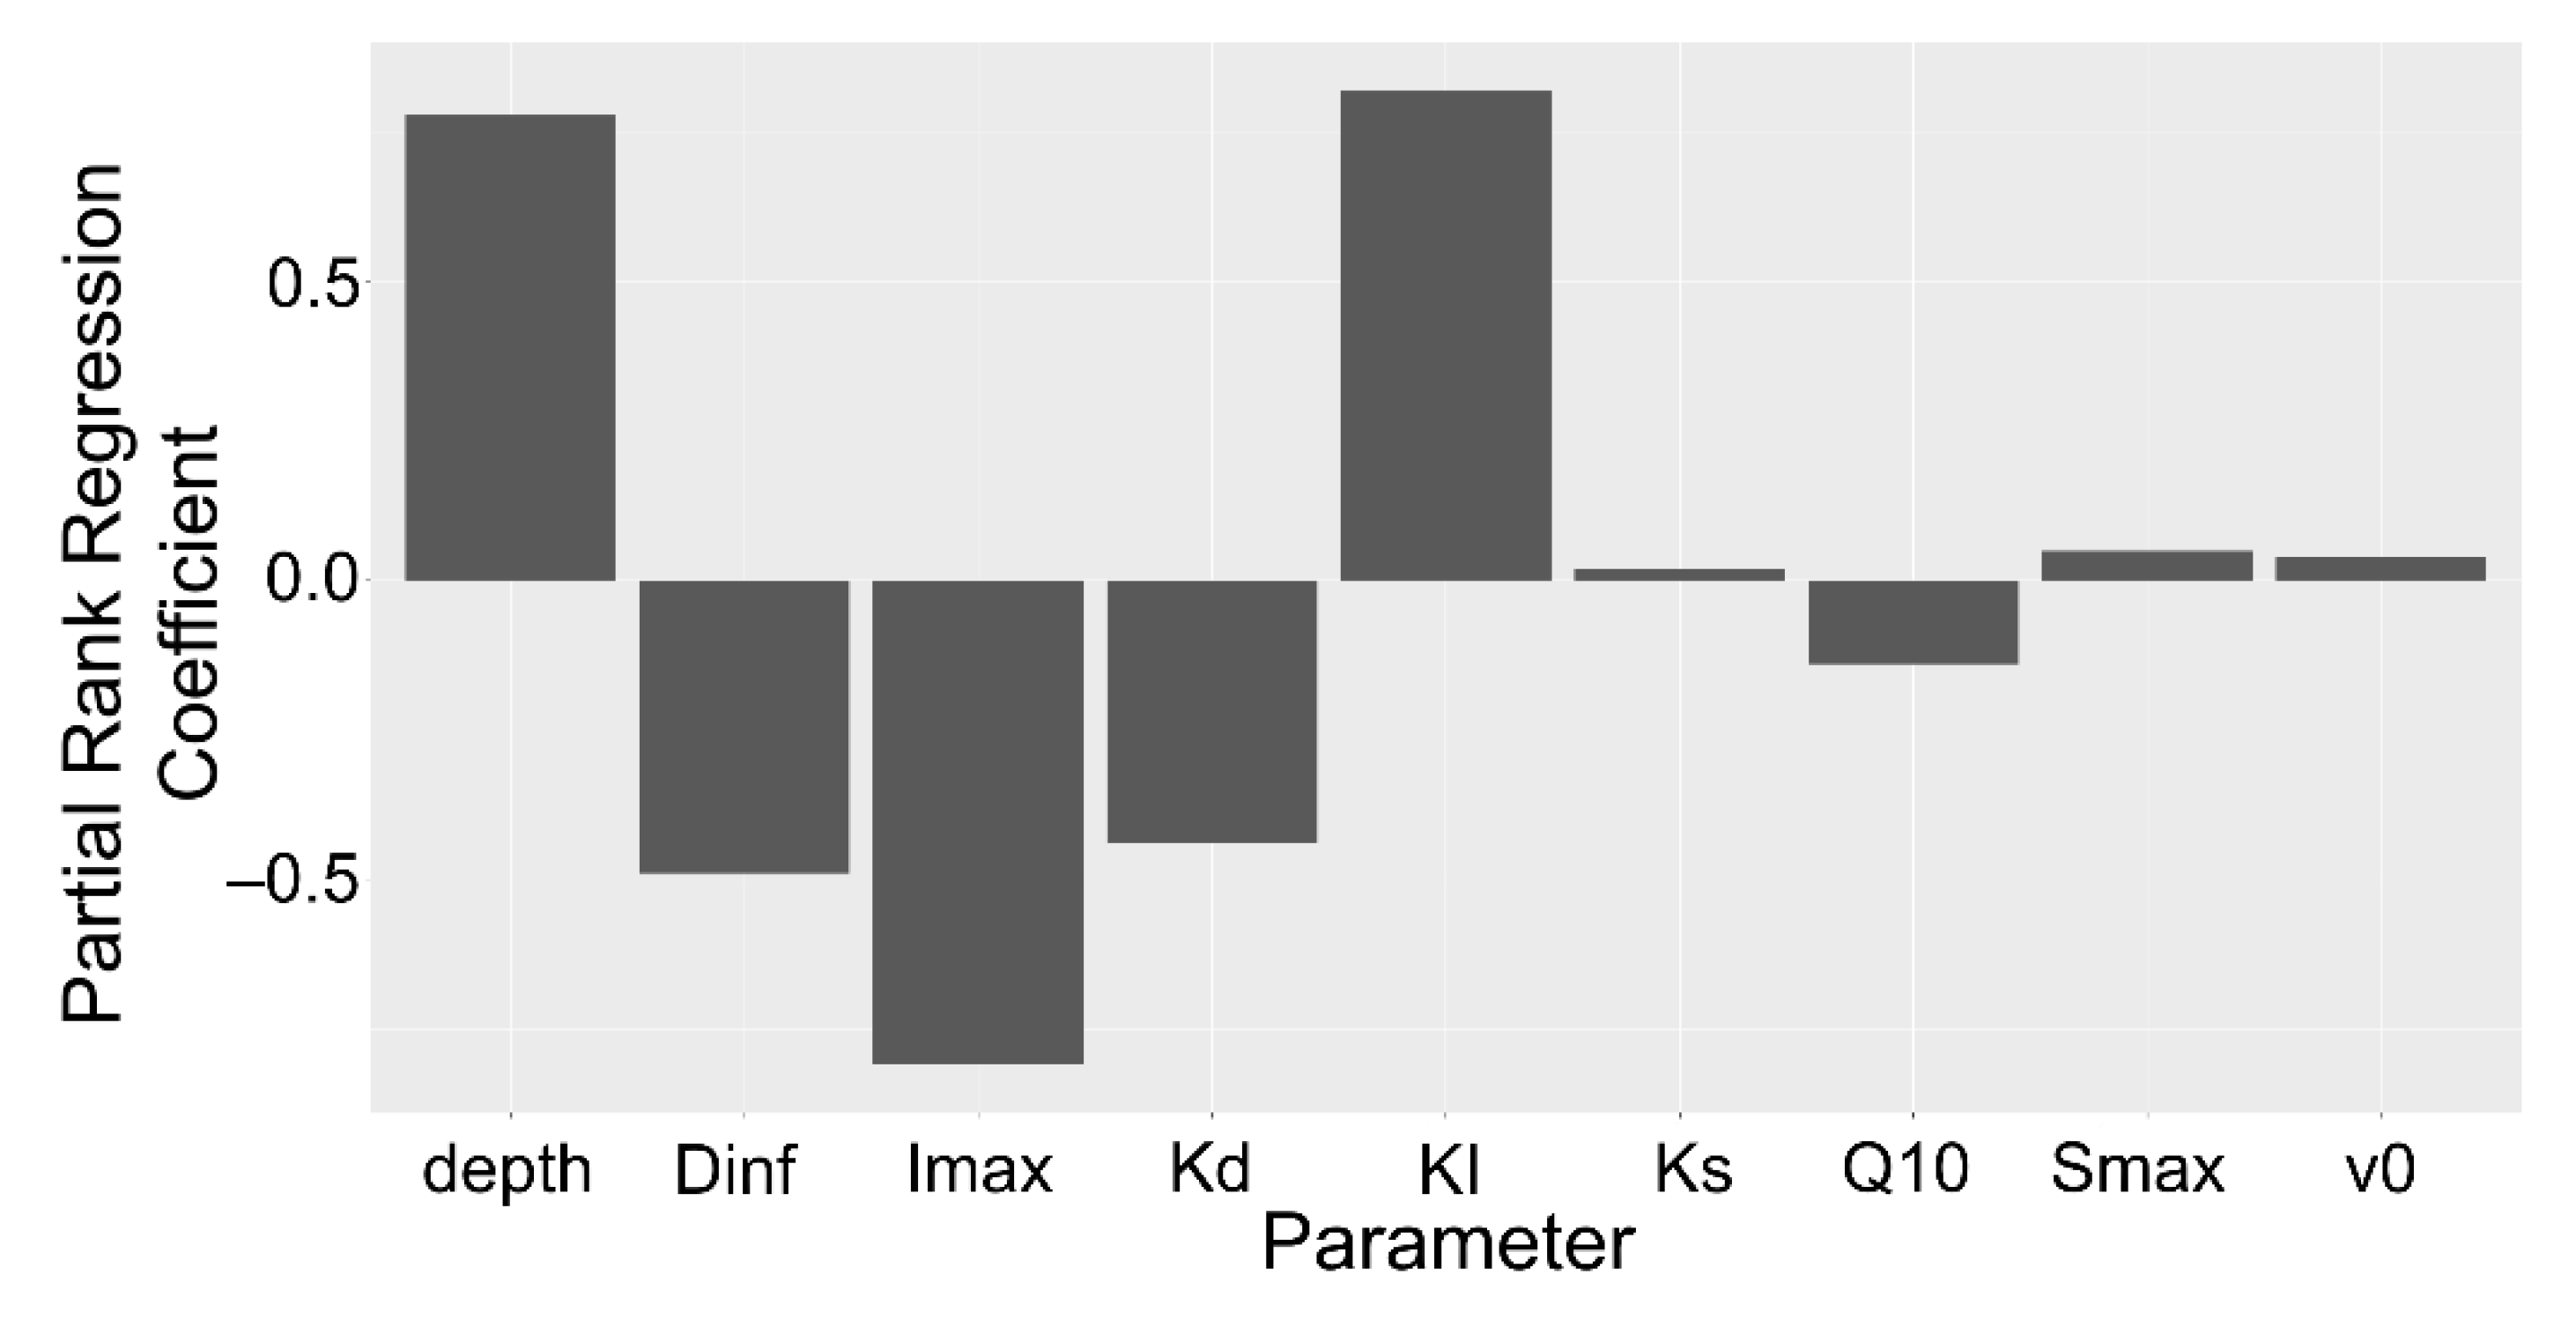
Figure 9.
Stacked barplot of partial rank correlation coefficients of model parameters for rhizoplane concentration by depth interval. All simulations within 10 cm depth intervals were grouped. Parameters: Diffusion coefficient of solute in H2O (Dinf), maximum uptake rate (Imax), mineralization rate (Kd), Michaelis–Menten coefficient (KI), sorption affinity coefficient (KS), Q10 temperature coefficient (Q10), maximum sorption (Smax), volume of water entering the root (v0).
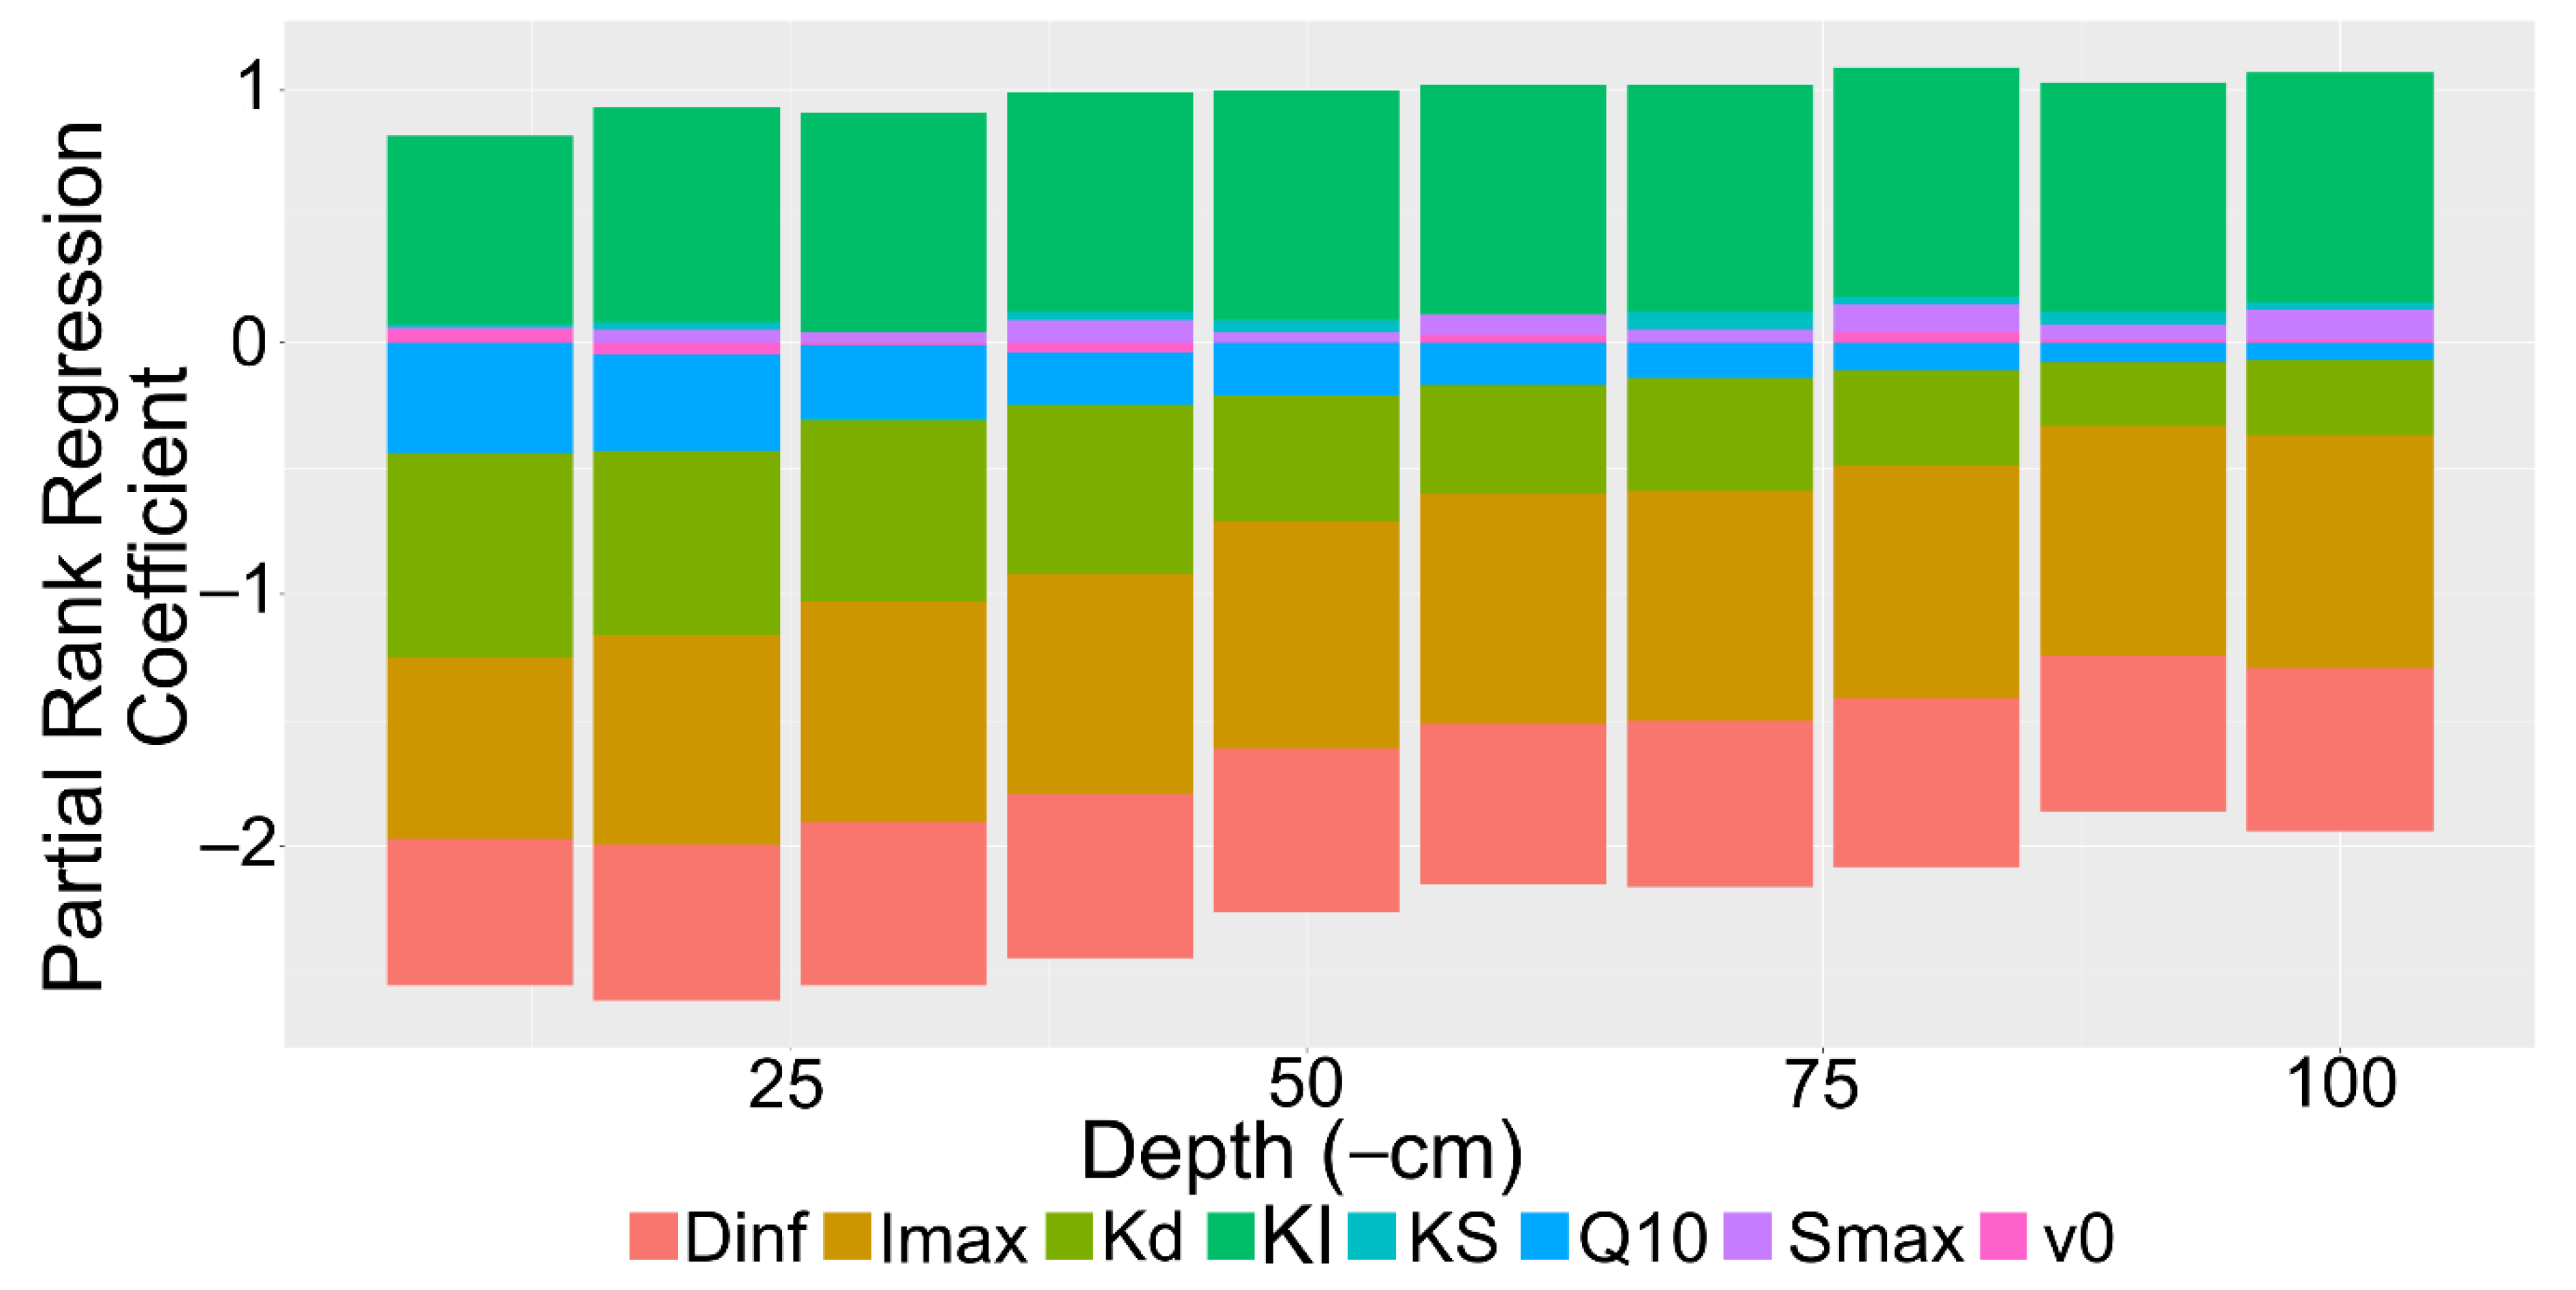
Figure 10.
Model structure. The inner grey cylinder represents the root. The root is surrounded by soil cylinders with the first cylinder, adjacent to the root. The closed arrows of , , represent the fluxes from diffusion, exudation efflux, and exudation influx. The open arrows , represent the soil solution concentration lost to sorption and mineralization. is the root radius, while is the width of the rhizosphere.

Table 1.
Model parameters and range utilized in this study.
| Symbol | Definition | Unit | Range | Ref. |
|---|---|---|---|---|
| Solute Parameters (* range is solute specific) | ||||
| Z | Charge of solute in solution * | −integer | −1 to −3 | |
| Diffusion coefficient of solute in H2O * | cm2 s−1 | 0.52–1.28 | [95,96,97] | |
| Maximum sorption * | µmol g−1 | 0.12–19.98 | [30,51,68,75,89,98] | |
| Sorption affinity coefficient * | Unitless | 0.145–4.3 | [30,51,68,75,89,98] | |
| kd | Mineralization rate * | hr−1 | 0.15–2.35 | [41,64,68,69,95,96] |
| Root Parameters (* Solute specific) | ||||
| l | Root length | cm | Constant | |
| r0 | Root radius | cm | Constant | |
| Ccyto | Root cell cytoplasm concentration * | µmol cm−3 | 0.5–40 | [99] |
| Perm | Membrane permeability coefficient * | cm hr−1 × 10⁻⁴ | 1.15–4.32 | [54] |
| Maximum uptake rate * | µmol cm−1 hr−1 | 0.006–0.07 | [24,54] | |
| Michaelis-Menten coefficient * | µmol cm−3 | 0.002–5.9 | [54,100] | |
| Membrane potential | mV | Constant | [83] | |
| v0 | Volume of water entering the root | cm3/s | 5.0 × 10⁻¹⁰–5.0 × 10⁻⁶ | [101] |
| Soil Parameters (all vary by depth) | ||||
| Tortuosity factor | unitless | 2–3 | [61] | |
| Bulk density | g cm−3 | 0.0107–0.146 | [58] | |
| Microbial biomass factor | unitless | 0–1 | [102] | |
| Soil temperature factor | unitless | 1.9–4.4 | ||
| Soil temperature | Celsius | 8–17.8 | ||
| ϵ(d) | Soil porosity | cm3/cm3 | 0–1 | |
| Sorption retardation factor per solute | unitless | >1 | ||
Publisher’s Note: MDPI stays neutral with regard to jurisdictional claims in published maps and institutional affiliations. |
© 2021 by the authors. Licensee MDPI, Basel, Switzerland. This article is an open access article distributed under the terms and conditions of the Creative Commons Attribution (CC BY) license (http://creativecommons.org/licenses/by/4.0/).
Share and Cite
MDPI and ACS Style
Proctor, C.; He, Y. Modeling Root Exudate Accumulation Gradients to Estimate Net Exudation Rates by Peatland Soil Depth. Plants 2021, 10, 106. https://doi.org/10.3390/plants10010106
AMA Style
Proctor C, He Y. Modeling Root Exudate Accumulation Gradients to Estimate Net Exudation Rates by Peatland Soil Depth. Plants. 2021; 10(1):106. https://doi.org/10.3390/plants10010106
Chicago/Turabian StyleProctor, Cameron, and Yuhong He. 2021. "Modeling Root Exudate Accumulation Gradients to Estimate Net Exudation Rates by Peatland Soil Depth" Plants 10, no. 1: 106. https://doi.org/10.3390/plants10010106
Note that from the first issue of 2016, this journal uses article numbers instead of page numbers. See further details here.