
Physiological Plasticity as a Strategy to Cope with Harsh Climatic Conditions: Ecophysiological Meta-Analysis of the Cosmopolitan Moss Ceratodon purpureus in the Southern Hemisphere

 ,
,
Abstract
:1. Introduction
2. Methods
2.1. Research Site and Sampling
2.2. Climatic Data
2.3. CO2 Exchange
2.4. Meta-Analysis
3. Results
3.1. Climatic Data
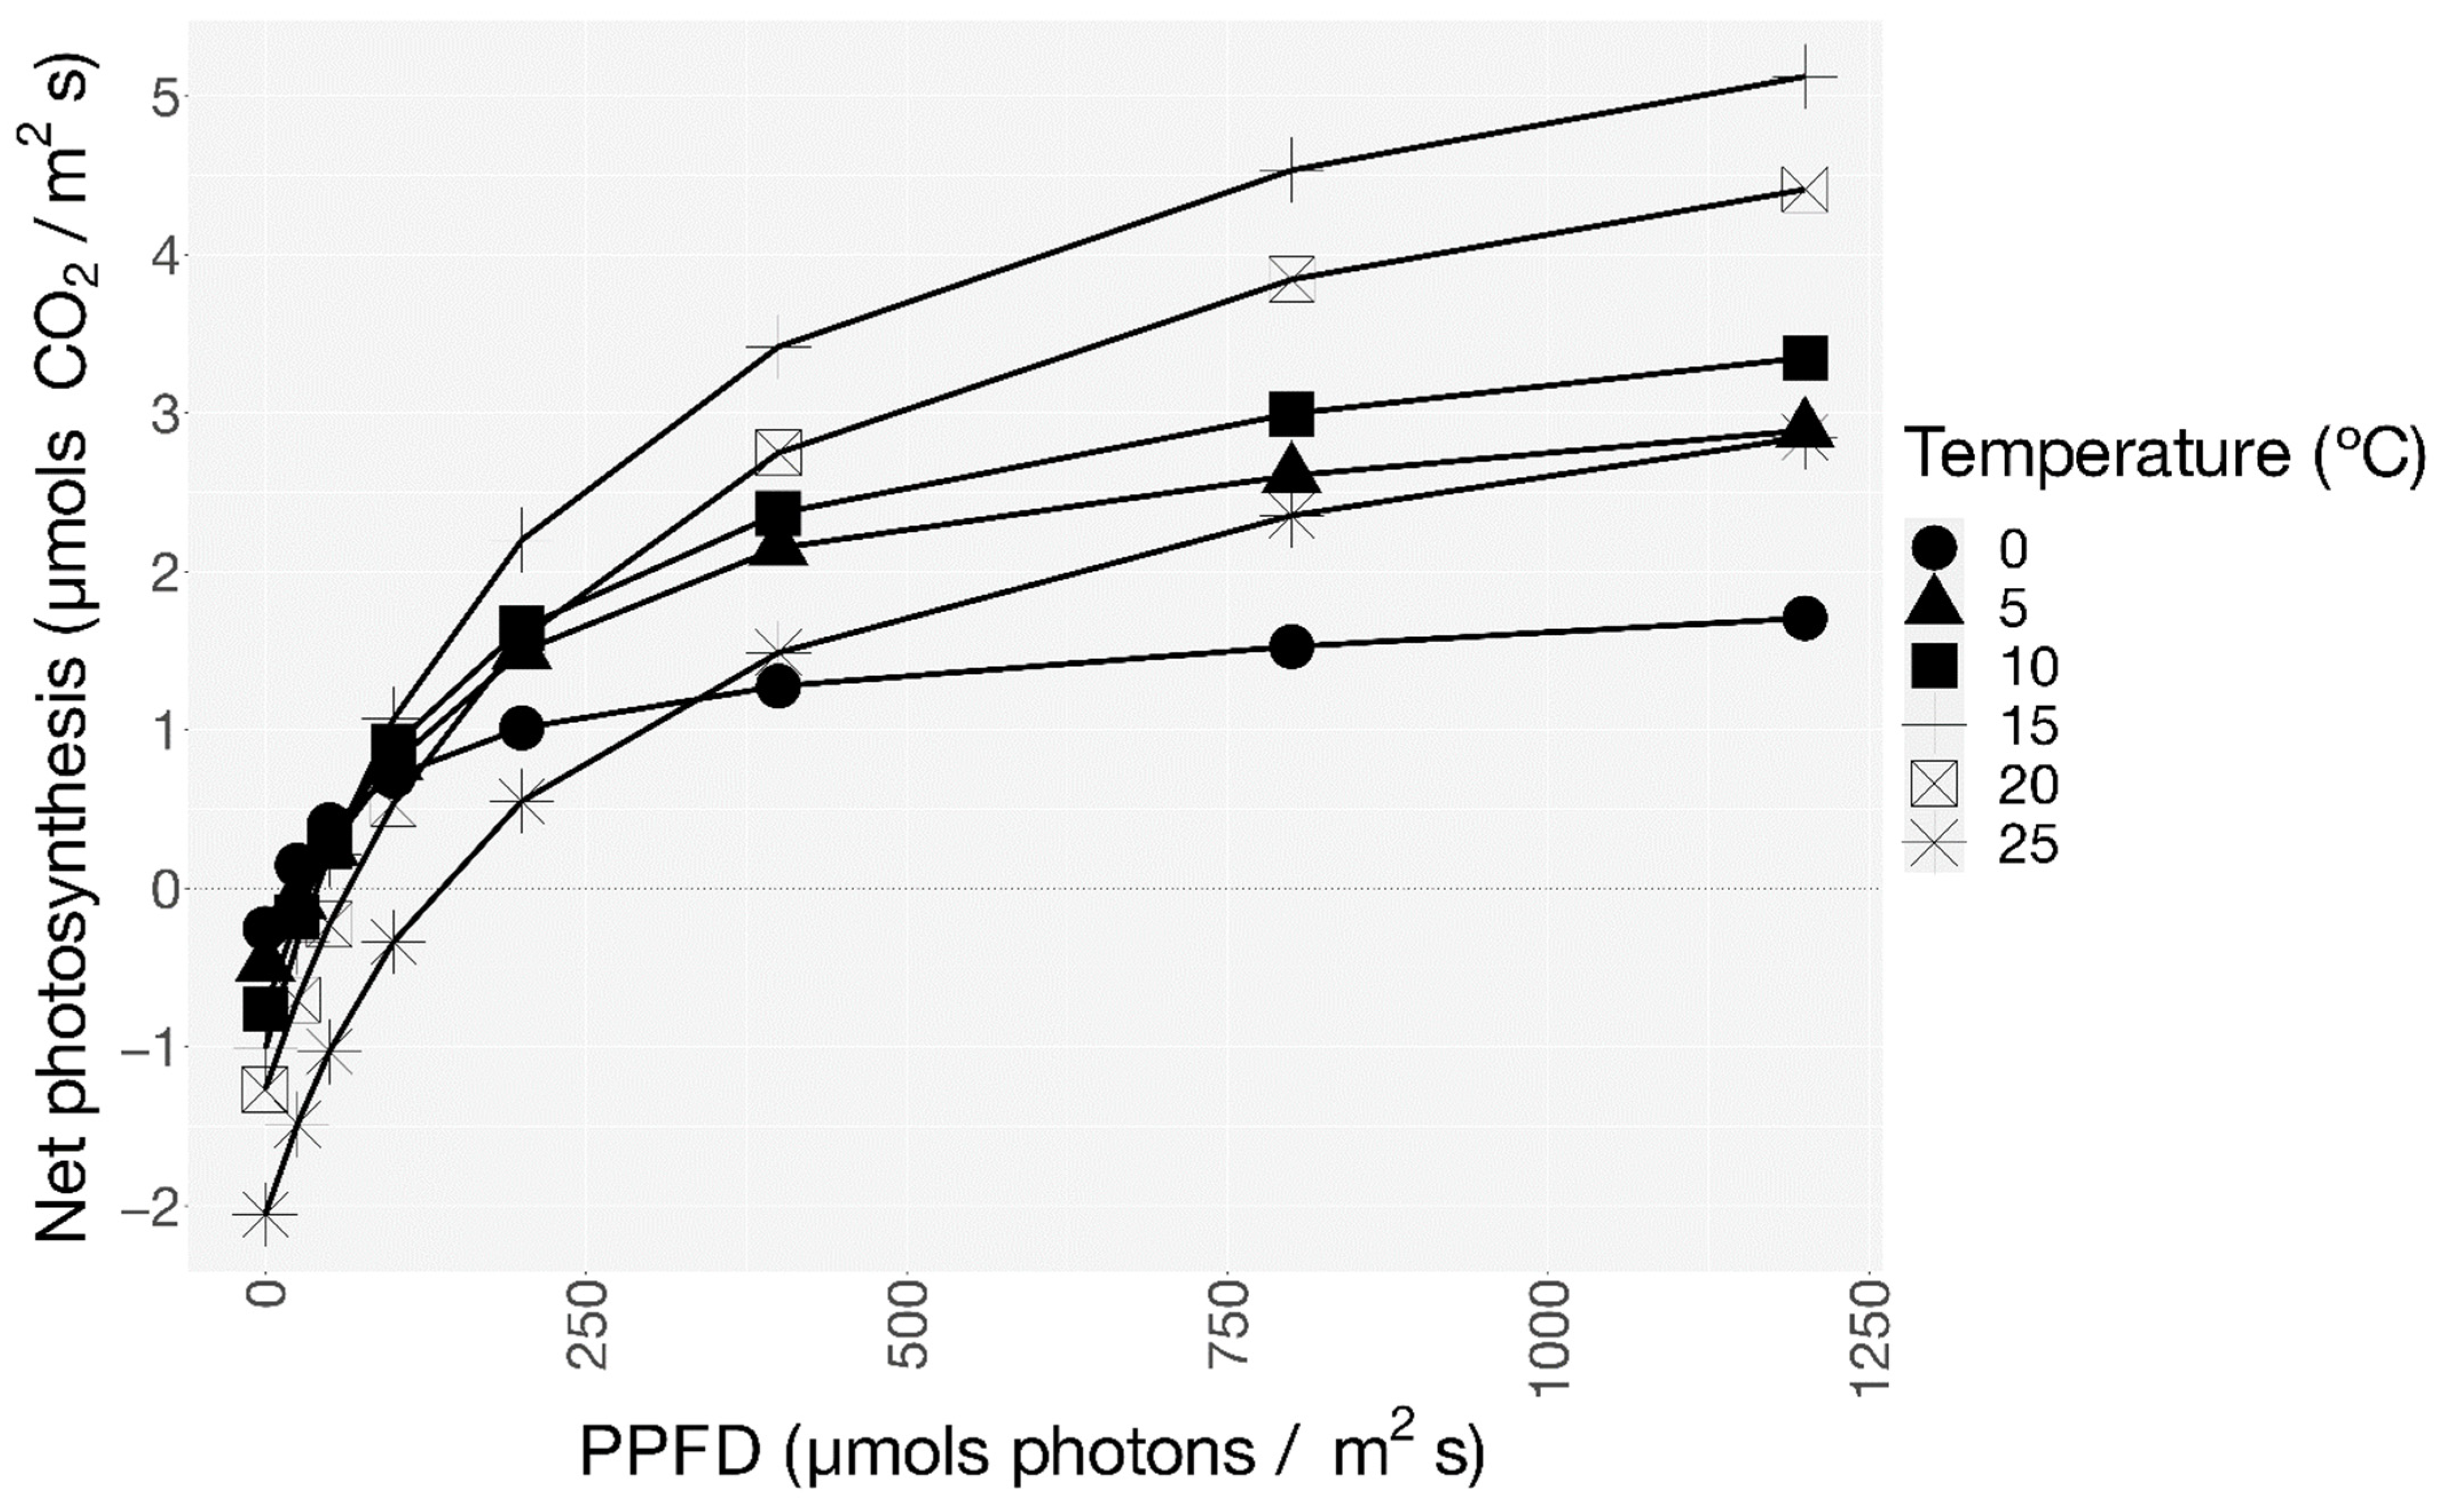
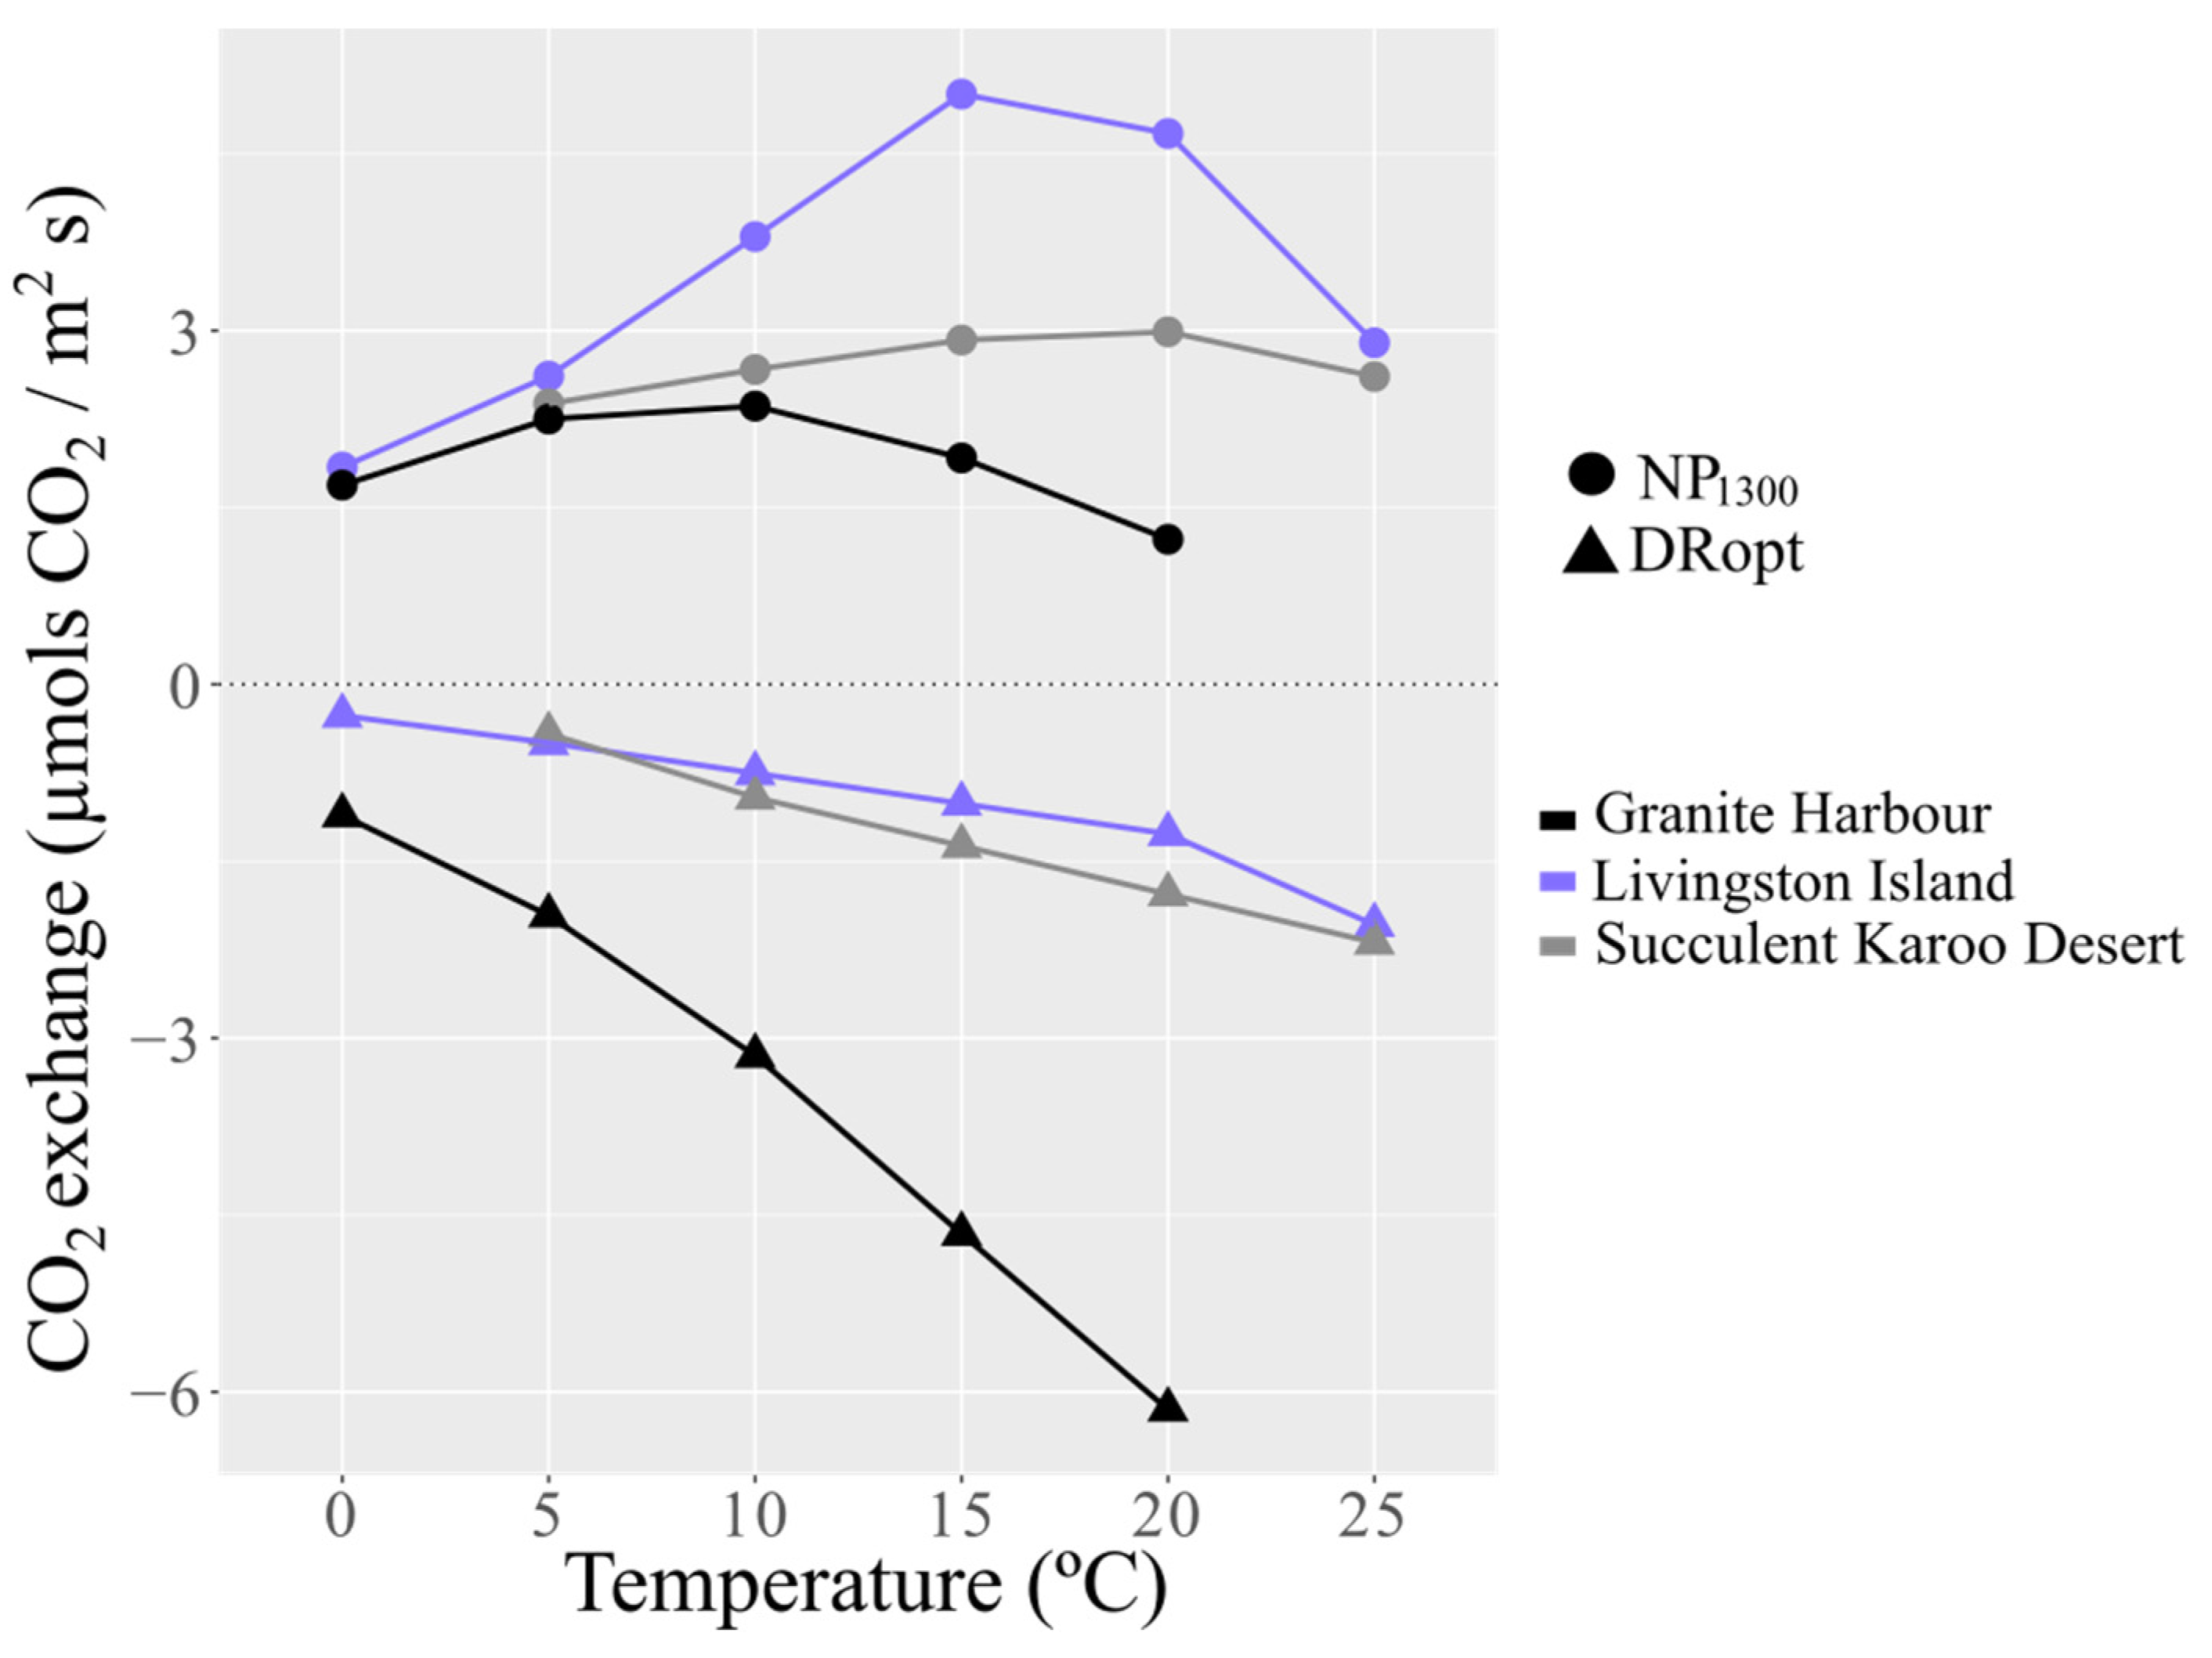
3.2. CO2 Exchange
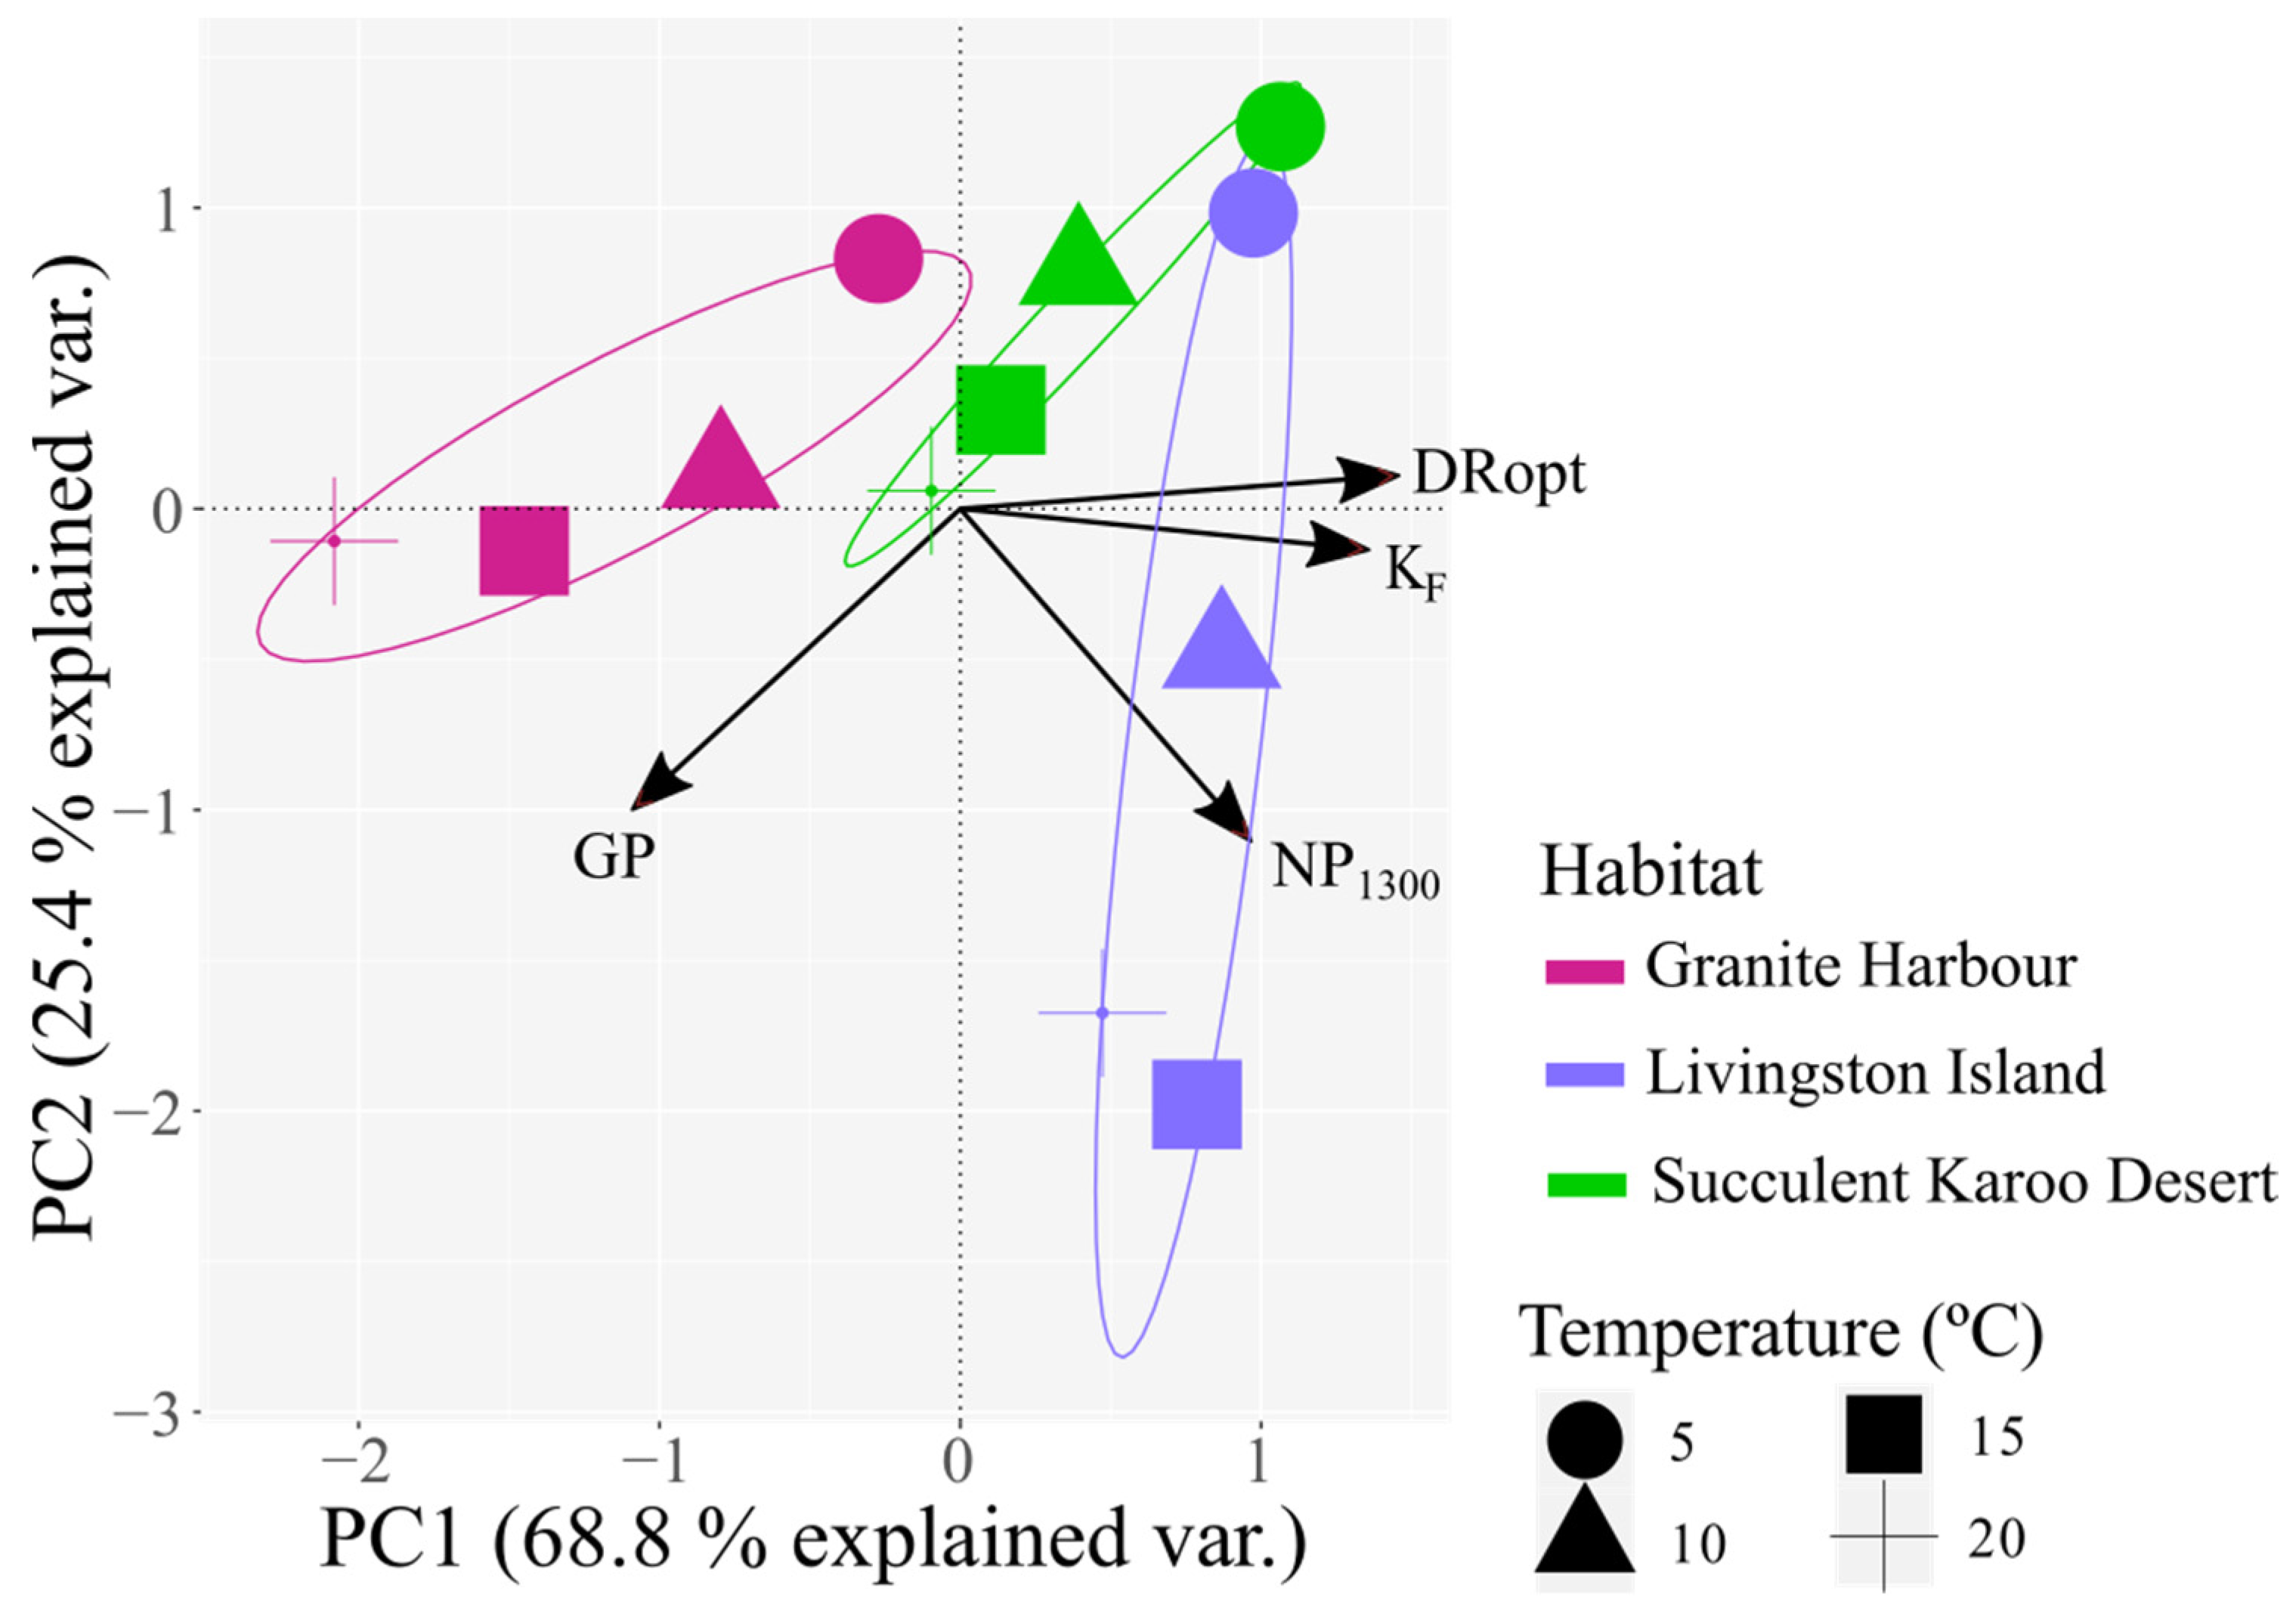
3.3. Meta-Analysis
4. Discussion
5. Conclusions
Supplementary Materials
Author Contributions
Funding
Data Availability Statement
Acknowledgments
Conflicts of Interest
References
- Green, T.G.A.; Sancho, L.G.; Pintado, A. Ecophysiology of desiccation/rehydration cycles in mosses and lichens. In Plant Desiccation Tolerance; Luttge, U., Beck, E., Bartels, D., Eds.; Springer: Berlin/Heidelberg, Germany, 2011; pp. 89–120. [Google Scholar]
- Lange, O.L. Photosynthesis of soil-crust biota as dependent on environmental factors. In Biological Soil Crusts: Structure, Function, and Management; Belnap, J., Lange, O.L., Eds.; Springer: Berlin/Heidelberg, Germany, 2001; pp. 217–240. [Google Scholar]
- Lange, O.L.; Meyer, A.; Zellner, H.; Ullmann, I.; Wessels, D.C.J. Eight days in the life of a desert lichen: Water relations and photosynthesis of Teloschistes capensis in the coastal fog zone of the Namib Desert. Madoqua 1990, 17, 17–30. [Google Scholar]
- Pintado, A.; Sancho, L.G.; Blanquer, J.; Green, T.G.A.; Lázaro, R. Microclimatic factors and photosynthetic activity of crustose lichens from the semi-arid southeast of Spain: Long-term measurements for Diploschistes diacapsis. Bibl. Lichenol. 2010, 105, 211–224. [Google Scholar]
- Raggio, J.; Green, T.G.A.; Sancho, L.G. In situ monitoring of microclimate and metabolic activity in lichens from Antarctic extremes: A comparison between South Shetland Islands and the McMurdo dry valleys. Polar Biol. 2016, 39, 113–122. [Google Scholar] [CrossRef]
- Schroeter, B.; Green, T.G.A.; Pannewitz, S.; Schlensog, M.; Sancho, L.G. Fourteen degrees of latitude and a continent apart: Comparison of lichen activity over two years at Continental and Maritime Antarctic sites. Antarct. Sci. 2010, 22, 681–690. [Google Scholar] [CrossRef] [Green Version]
- Schroeter, B.; Green, T.G.A.; Pannewitz, S.; Schlensog, M.; Sancho, L.G. Summer variability, winter dormancy: Lichen activity over 3 years at Botany Bay, 77°S latitude, Continental Antarctica. Polar Biol. 2011, 34, 13–22. [Google Scholar] [CrossRef]
- Beltrán-Sanz, N.; Raggio, J.; González, S.; Dal Grande, F.; Prost, S.; Green, T.G.A.; Pintado, A.; Sancho, L.G. Climate change leads to higher NPP at the end of the century in the Antarctic Tundra: Response patterns through the lens of lichens. Sci. Total Environ. 2022, 835, 155495. [Google Scholar] [CrossRef]
- He, X.; He, K.S.; Hyvönen, J. Will bryophytes survive in a warming world? Perspect. Plant Ecol. Evol. Syst. 2016, 19, 49–60. [Google Scholar] [CrossRef]
- Hoffman, G.R.; Gates, D.M. An energy budget approach to the study of water loss in cryptogams. J. Torrey Bot. Soc. 1970, 97, 361–366. [Google Scholar] [CrossRef]
- Lenné, T.; Bryant, G.; Hocart, C.H.; Huang, C.X.; Ball, M.C. Freeze avoidance: A dehydrating moss gathers no ice. Plant. Cell. Environ. 2010, 33, 1731–1741. [Google Scholar] [CrossRef] [Green Version]
- Longton, R.E. Biology of Polar Bryophytes and Lichens; Cambridge University Press: Cambridge, UK, 1988. [Google Scholar]
- Proctor, M.C.F. Physiological ecology: Water relations, light and temperature responses, carbon balance. In Bryophyte Ecology; Smith, A.J.E., Ed.; Chapman & Hall: London, UK, 1982; pp. 333–381. [Google Scholar]
- Kappen, L.; Valladares, F. Opportunistic growth and desiccation tolerance, the ecological success of the poikilohydrous strategy. In Functional Plant Ecology; Pugnaire, F.I., Valladares, F., Eds.; CRC Press/Taylor & Francis: Boca Raton, FL, USA, 2007; pp. 7–65. [Google Scholar]
- Bjerke, J.W.; Bokhorst, S.; Callaghan, T.V.; Zielke, M.; Phoenix, G.K. Rapid photosynthetic recovery of a snow-covered feather moss and Peltigera lichen during sub-Arctic midwinter warming. Plant. Ecol. Divers. 2013, 6, 383–392. [Google Scholar] [CrossRef] [Green Version]
- Davey, M.C. Effects of continuous and repeated dehydration on carbon fixation by bryophytes from the Maritime Antarctic. Oecologia 1997, 110, 25–31. [Google Scholar] [CrossRef] [PubMed]
- Atkin, O.; Scheurwater, I.; Pons, T. High thermal acclimation potential of both photosynthesis and respiration in two lowland Plantago species in contrast to an alpine congeneric. Glob. Chang. Biol. 2006, 12, 500–515. [Google Scholar] [CrossRef]
- Colesie, C.; Büdel, B.; Hurry, V.; Green, T.G.A. Can Antarctic lichens acclimatize to changes in temperature? Glob. Chang. Biol. 2018, 24, 1123–1135. [Google Scholar] [CrossRef] [PubMed] [Green Version]
- Hicklenton, P.R.; Oechel, W.C. Physiological aspects of the ecology of Dicranum fuscescens in the subarctic. I. Acclimation and acclimation potential of CO2 exchange in relation to habitat, light, and temperature. Canad. J. Bot. 1976, 54, 1104–1119. [Google Scholar] [CrossRef]
- Lange, O.L.; Green, T.G.A. Lichens show that fungi can acclimate their respiration to seasonal changes in temperature. Oecologia 2005, 142, 11–19. [Google Scholar] [CrossRef]
- Oechel, W.C. Seasonal patterns of temperature response of CO2 flux and acclimation in arctic mosses growing in situ. Photosynthetica 1976, 10, 447–456. [Google Scholar]
- Wagner, S.; Zotz, G.; Bader, M.Y. The temperature acclimation potential of tropical bryophytes. Plant Biol. 2013, 16, 117–124. [Google Scholar] [CrossRef]
- Wagner, S.; Zotz, G.; Salazar Allen, N.; Bader, M.Y. Altitudinal changes in temperature responses of net photosynthesis and dark respiration in tropical bryophytes. Ann. Bot. 2013, 111, 455–465. [Google Scholar] [CrossRef] [Green Version]
- Atkin, O.; Bruhn, D.; Tjoelker, M.G. Response of plant respiration to changes in temperature: Mechanisms and consequences of variations in Q10 values and acclimation. In Plant Respiration: From Cell to Ecosystem; Lambers, H., Ribas-Carbo, M., Eds.; Springer: Dordrecht, The Netherlands, 2005; pp. 95–135. [Google Scholar]
- Pintado, A.; Sancho, L.G.; Green, T.G.A.; Blanquer, J.M.; Lázaro, R. Functional ecology of the Biological Soil Crusts in semi-arid SE Spain: Sun and shade populations of Diploschistes diacapsis (Ach.) Lumbsch. Lichenologist 2005, 37, 425–432. [Google Scholar] [CrossRef] [Green Version]
- Schroeter, B.; Green, T.G.A.; Kulle, D.; Pannewitz, S.; Schlensog, M.; Sancho, L.G. The moss Bryum argenteum var. muticum Brid. is well adapted to cope with high light in Continental Antarctica. Antarct. Sci. 2012, 24, 281–291. [Google Scholar] [CrossRef] [Green Version]
- Green, T.G.A.; Büdel, B.; Meyer, A.; Zellner, H.; Lange, O.L. Temperate rainforest lichens in New Zealand: Light response of photosynthesis. N. Z. J. Bot. 1997, 35, 493–504. [Google Scholar] [CrossRef]
- Kappen, L.; Smith, R.I.L.; Meyer, M. Carbon dioxide exchange of two ecodemes of Schistidium antarctici in Continental Antarctica. Polar. Biol. 1989, 9, 415–422. [Google Scholar] [CrossRef]
- Colesie, C.; Green, T.G.A.; Haferkamp, I.; Büdel, B. Habitat stress initiates changes in composition, CO2 gas exchange and C-allocation as life traits in biological soil crusts. ISME J. 2014, 8, 2104–2115. [Google Scholar] [CrossRef] [PubMed]
- Raggio, J.; Green, T.G.A.; Pintado, A.; Sancho, L.G.; Büdel, B. Environmental determinants of biocrust carbon fluxes across Europe: Possibilities for a functional type approach. Plant Soil 2018, 429, 147–157. [Google Scholar] [CrossRef]
- Weber, B.; Graf, T.; Bass, M. Ecophysiological analysis of moss-dominated Biological Soil Crusts and their separate components from the Succulent Karoo, South Africa. Planta 2012, 236, 129–139. [Google Scholar] [CrossRef] [PubMed]
- Slot, M.; Kitajima, K. General patterns of acclimation of leaf respiration to elevated temperatures across biomes and plant types. Oecologia 2015, 177, 885–900. [Google Scholar] [CrossRef] [PubMed] [Green Version]
- Schofield, W.B.; Crum, H.A. Disjunctions in bryophytes. Ann. Missouri Bot. Gard. 1972, 59, 174–202. [Google Scholar] [CrossRef]
- Øvstedal, D.O.; Smith, R.L.I. Lichens of Antarctica and South Georgia: A Guide to Their Identification and Ecology; Cambridge University Press: Cambridge, UK, 2001. [Google Scholar]
- Ochyra, R.; Smith, R.I.L.; Bednarek-Ochyra, H. The Illustrated Moss Flora of Antarctica; Cambridge University Press: Cambridge, UK, 2008. [Google Scholar]
- Jules, E.S.; Shaw, A.J. Adaptation to metal-contaminated soils in populations of the moss, Ceratodon purpureus: Vegetative growth and reproductive expression. Am. J. Bot. 1994, 81, 791–797. [Google Scholar] [CrossRef]
- Shaw, J.; Beer, S.C. Life history variation in gametophyte populations of the moss Ceratodon purpureus (Ditrichaceae). Am. J. Bot. 1999, 86, 512–521. [Google Scholar] [CrossRef]
- Cove, D.J.; Knight, C.D.; Lamparter, T. Mosses as model systems. Trends. Plant. Sci. 1997, 2, 99–105. [Google Scholar] [CrossRef]
- Cove, D.J.; Bezanilla, M.; Harries, P.; Quatrano, R. Mosses as model systems for the study of metabolism and development. Annu. Rev. Plant. Biol. 2006, 57, 497–520. [Google Scholar] [CrossRef] [PubMed] [Green Version]
- Biersma, E.M.; Convey, P.; Wyber, R.; Robinson, S.A.; Dowton, M.; van de Vijver, B.; Linse, K.; Griffiths, H.; Jackson, J.A. Latitudinal biogeographic structuring in the globally distributed moss Ceratodon purpureus. Front. Plant. Sci. 2020, 11, 502359. [Google Scholar] [CrossRef] [PubMed]
- Clarke, L.; Ayre, D.; Robinson, S. Genetic structure of East Antarctic populations of the moss Ceratodon purpureus. Antarct. Sci. 2009, 21, 51–58. [Google Scholar] [CrossRef]
- McDaniel, S.F.; Shaw, A.J. Selective sweeps and intercontinental migration in the cosmopolitan moss Ceratodon purpureus (Hedw.) Brid. Mol. Ecol. 2005, 14, 1121–1132. [Google Scholar] [CrossRef] [PubMed]
- Skotnicki, M.; Mackenzie, A.; Ninham, J.A.; Selkirk, P. High levels of genetic variability in the moss Ceratodon purpureus from Continental Antarctica, sub-Antarctic Heard and Macquarie Islands, and Australasia. Polar. Biol. 2004, 27, 687–698. [Google Scholar] [CrossRef]
- Wood, A.J.; Oliver, M.J.; Cove, D.J. Bryophytes as model systems. Bryologist 2000, 103, 128–133. [Google Scholar] [CrossRef]
- Davey, M.C. Effects of short-term dehydration and rehydration on photosynthesis and respiration by Antarctic bryophytes. Environ. Exp. Bot. 1997, 37, 187–198. [Google Scholar] [CrossRef]
- Smith, R.I.L. Biological and environmental characteristics of three cosmopolitan mosses dominant in Continental Antarctica. J. Veg. Sci. 1999, 10, 231–242. [Google Scholar] [CrossRef]
- Tamm, A.; Caesar, J.; Kunz, N.; Colesie, C.; Reichenberger, H.; Weber, B. Ecophysiological properties of three Biological Soil Crusts types and their photoautotrophs from the Succulent Karoo, South Africa. Plant and Soil 2018, 429, 127–146. [Google Scholar] [CrossRef] [Green Version]
- Aro, E.-M.; Somersalo, S.; Karunen, P. Membrane lipids in Ceratodon purpureus protonemata grown at high and low temperatures. Physiol. Plant. 1987, 69, 65–72. [Google Scholar] [CrossRef]
- Aro, E.-M.; Karunen, P. Effects of hardening and freezing stress on membrane lipids and CO2 fixation of Ceratodon purpureus protonemata. Physiol. Plant. 1988, 74, 45–52. [Google Scholar] [CrossRef]
- Aro, E.-M.; Valanne, N. Effect of continuous light on CO2 fixation and chloroplast structure of the mosses Pleurozium schreberi and Ceratodon purpureus. Physiol. Plant. 1979, 45, 460–466. [Google Scholar] [CrossRef]
- Aro, E.-M. A Comparison of the chlorophyll-protein composition and chloroplast ultrastructure in two bryophytes and two higher plants. Z. Pjlanzenphysiol. Bd. 1982, 108, 97–105. [Google Scholar] [CrossRef]
- Post, A. Photoprotective pigment as an adaptive strategy in the Antarctic moss Ceratodon purpureus. Pol. Biol. 1990, 10, 241–245. [Google Scholar] [CrossRef]
- Valanne, N. Development of chloroplast structure and photosynthetic competence in dark-adapted moss protonemata after exposure to light. Protoplasma 1976, 89, 359–369. [Google Scholar] [CrossRef]
- Valanne, N. Effect of continuous light on CO2 fixation, chlorophyll content, growth and chloroplast structure in Ceratodon purpureus. Z. Pflanzenphysiol. 1976, 81, 347–357. [Google Scholar] [CrossRef]
- Valanne, N. The combined effects of light intensity and continuous light on the CO2 fixation, chlorophyll content and chloroplast structure of the protonema of Ceratodon purpureus. Z. Pflanzenphysiol. 1977, 83, 275–283. [Google Scholar] [CrossRef]
- Valanne, N.; Aro, E.-M.; Repo, E. Changes in photosynthetic capacity and activity of RuBPC-ase and glycolate oxidase during the early growth of moss protonemata in continuous and rhythmic light. Z. Pflanzenphysiol. 1978, 88, 123–131. [Google Scholar] [CrossRef]
- Ino, Y. Estimation of primary production in moss community on East Ongul Island, Antarctica. Geography 1983, 80, 30–38. [Google Scholar]
- Ino, Y. Photosynthesis and primary production in moss community at Syowa Station, Antarctica. Japn. J. Ecol. 1983, 33, 427–433. [Google Scholar]
- Ino, Y. Field measurement of net photosynthesis of mosses at Langhovde East Antarctica. Ecol. Res. 1990, 5, 195–205. [Google Scholar] [CrossRef]
- Ino, Y. Field measurement of the photosynthesis of mosses with a portable CO2 porometer at Langhovde, East Antarctica. Antarct. Rec. 1994, 38, 178–184. [Google Scholar]
- Ino, Y. Comparison of net photosynthesis and dark respiration of Antarctic mosses measured in the Antarctic and in Japan. Proc. NIPR. Symp. Polar. Biol. 1990, 3, 245–253. [Google Scholar]
- Pannewitz, S.; Green, T.G.A.; Maysek, K.; Schlensog, M.; Seppelt, R.; Sancho, L.G.; Türk, R.; Schroeter, B. Photosynthetic responses of three common mosses from Continental Antarctica. Antarct. Sci. 2005, 17, 341–352. [Google Scholar] [CrossRef] [Green Version]
- Perera-Castro, A.V.; Waterman, M.J.; Turnbull, J.D.; Ashcroft, M.B.; McKinley, E.; Watling, J.R.; Bramley-Alves, J.; Casanova-Katny, A.; Zuniga, G.; Flexas, J.; et al. It is hot in the sun: Antarctic mosses have high temperature optima for photosynthesis despite cold climate. Front. Plant Sci. 2020, 11, 1178. [Google Scholar] [CrossRef]
- Davey, M.C.; Rothery, P. Interspecific variation in respiratory and photosynthetic parameters in Antarctic bryophytes. N. Phytol. 1997, 137, 231–240. [Google Scholar] [CrossRef]
- Convey, P. Photosynthesis and dark respiration in Antarctic mosses—An initial comparative study. Polar Biol. 1994, 14, 65–69. [Google Scholar] [CrossRef]
- Ascaso, C.; Souza-Egipsy, V.; Sancho, L.G. Locating water in the dehydrated thallus of lichens from extreme microhabitats (Antarctica). Biblioth. Lichenol. 2003, 85, 215–223. [Google Scholar]
- AEMET. Informe Antártico del año 2019. 2019. Available online: https://antartida.aemet.es/index.php?pag=informes&bol=9 (accessed on 30 September 2018).
- González, S.; Fortuny, D. How robust are the temperature trends on the Antarctic Peninsula? Antarct. Sci. 2018, 30, 322–328. [Google Scholar] [CrossRef] [Green Version]
- Green, T.G.A.; Lange, O.L. Photosynthesis in poikilohydric plants: A comparison of lichens and bryophytes. In Ecophysiology of Photosynthesis; Schulze, E.D., Caldwell, M.M., Eds.; Springer Study Edition: Berlin/Heidelberg, Germany, 1995; pp. 319–341. [Google Scholar]
- Midgley, G.F.; Veste, M.; Willert, D.J.; Davis, G.W.; Steinberg, M.; Powrie, L.W. Comparative field performance of three different gas exchange systems. Bothalia 1997, 271, 83–89. [Google Scholar] [CrossRef] [Green Version]
- Wei, T.; Simko, V. R Package "Corrplot": Visualization of a Correlation Matrix (Version 0.92). 2021. Available online: https://github.com/taiyun/corrplot (accessed on 1 December 2021).
- Atkin, O.K.; Tjoelker, M.G. Thermal acclimation and the dynamic response of plant respiration to temperature. Trends. Plant. Sci. 2003, 8, 343–351. [Google Scholar] [CrossRef] [PubMed]
- Raggio, J.; Green, T.G.A.; Sancho, L.G.; Pintado, A.; Colesie, C.; Weber, B.; Büdel, B. Metabolic activity duration can be effectively predicted from macroclimatic data for Biological Soil Crusts habitats across Europe. Geoderma 2017, 306, 10–17. [Google Scholar] [CrossRef]
- Schlensog, M.; Green, T.G.A.; Schroeter, B. Life form and water source interact to determine active time and environment in cryptogams: An example from the Maritime Antarctic. Oecologia 2013, 173, 59–72. [Google Scholar] [CrossRef] [PubMed]
- Schroeter, B.; Green, T.G.A.; Pintado, A.; Türk, R.; Sancho, L.G. Summer activity patterns for mosses and lichens in Maritime Antarctica. Antarct. Sci. 2017, 29, 517–530. [Google Scholar] [CrossRef]
- Davey, M.C.; Pickup, J.; Block, W. Temperature variation and its biological significance in fellfield habitats on a Maritime Antarctic Island. Antarct. Sci. 1992, 4, 383–388. [Google Scholar] [CrossRef]
- Raggio, J.; Green, T.G.A.; Pintado, A.; Sancho, L.G.; Büdel, B. Functional performance of biocrusts across Europe and its implications for drylands. J. Arid Environ. 2021, 186, 104402. [Google Scholar] [CrossRef]
- Atkin, O.K.; Bruhn, D.; Hurry, V.M.; Tjoelker, M.G. The hot and the cold: Unravelling the variable response of plant respiration to temperature. Funct. Plant Biol. 2005, 32, 87–105. [Google Scholar] [CrossRef] [Green Version]
- Convey, P.; Chown, S.L.; Clarke, A.; Barnes, D.K.A.; Bokhorst, S.; Cummings, V.; Ducklow, H.W.; Frati, F.; Green, T.G.A.; Gordon, S.; et al. The spatial structure of Antarctic biodiversity. Ecol. Monogr. 2014, 84, 203–244. [Google Scholar] [CrossRef]
- Xiong, F.S.; Mueller, E.C.; Day, T.A. Photosynthetic and respiratory acclimation and growth response of Antarctic vascular plants to contrasting temperature regimes. Am. J. Bot. 2000, 87, 700–710. [Google Scholar] [CrossRef]
- Pannewitz, S.; Green, T.G.A.; Scheidegger, C.; Schlensog, M.; Schroeter, B. Activity pattern of the moss Hennediella heimii (Hedw.) Zand. in the Dry Valleys, southern Victoria Land, Antarctica, during the mid-austral summer. Polar. Biol. 2003, 26, 545–551. [Google Scholar] [CrossRef]
- Semikhatova, O.A.; Gerasimenko, T.V.; Ivanova, T.I. Photosynthesis, respiration, and growth of plants in the Soviet Arctic. In Arctic Ecosystems in a Changing Climate: An Ecophysiological Perspective; Chapin, F., Jeffereis, R., Reynolds, J., Shaver, G., Svoboda, J., Eds.; Academic Press: San Diego, CA, USA, 1992; pp. 169–192. [Google Scholar]
- Green, T.G.A.; Proctor, M.C.F. Physiology of photosynthetic organisms within Biological Soil Crusts: Their adaptation, flexibility, and plasticity. In Biological Soil Crusts: An Organizing Principle in Drylands; Weber, B., Büdel, B., Belnap, J., Eds.; Springer: Cham, Switzerland, 2016; pp. 347–381. [Google Scholar]
- Kanda, H. Regenerative development in culture of Antarctic plants Ceratodon purpureus (Dew.) Brid. Mem. Natl. Inst. Pol. Res. Spec. Issue 1979, 11, 58–69. [Google Scholar]
- Pannewitz, S.; Green, T.G.A.; Schlensog, M.; Seppelt, R.; Sancho, L.G.; Schroeter, B. Photosynthetic performance of Xanthoria mawsonii C. W. Dodge in coastal habitats, Ross Sea region, Continental Antarctica. Lichenologist 2006, 38, 67–81. [Google Scholar] [CrossRef] [Green Version]
- Sérgio, C.; Figueira, R.; Menezes, R. Modeling the distribution of Sematophyllum substrumulosum (Hampe) E. Britton as a signal of climatic changes in Europe. In Bryophyte Ecology and Climate Change; Tuba, Z., Slack, N., Stark, L., Eds.; Cambridge University Press: Cambridge, UK, 2011; pp. 427–440. [Google Scholar]
- Lechowicz, M.J. Ecological trends in lichen photosynthesis. Oecologia 1982, 53, 330–336. [Google Scholar] [CrossRef] [PubMed]
- Green, T.G.A.; Kulle, D.; Pannewitz, S.; Sancho, L.G.; Schroeter, B. UV-A protection in mosses growing in Continental Antarctica. Polar Biol. 2005, 28, 822–827. [Google Scholar] [CrossRef]
- Sala-Carvalho, W.R.; Montessi-Amaral, F.P.; Esposito, M.P.; Campestrini, R.; Rossi, M.; Peralta, D.F.; Furlan, C.M. Metabolome of Ceratodon purpureus (Hedw.) Brid.; a cosmopolitan moss: The influence of seasonality. Planta 2022, 255, 77. [Google Scholar] [CrossRef] [PubMed]
- Lovelock, C.; Robinson, S. Surface reflectance properties of Antarctic moss and their relationship to plant species, pigment composition and photosynthetic function. Plant. Cell. Environ. 2002, 25, 1239–1250. [Google Scholar] [CrossRef]
- Ueno, T.; Bekku, Y.; Uchida, M.; Kanda, H. Photosynthetic light responses of a widespread moss, Sanionia uncinata, from contrasting water regimes in the high Arctic tundra, Svalbard, Norway. J. Bryol. 2006, 28, 345–349. [Google Scholar] [CrossRef]


| Microclimatic Conditions | Macroclimatic Conditions | |||
|---|---|---|---|---|
| Temperature | Relative Humidity | Temperature | Relative Humidity | |
| (°C) | (%) | (°C) | (%) | |
| Mean ± standard deviation | 2.72 ± 3.09 | 95.23 ± 8.17 | 2.15 ± 1.90 | 85.22 ± 8.42 |
| Minimum | −1.25 | 57 | −5.4 | 53 |
| Median | 2.81 | 100 | 2.50 | 87 |
| Maximum | 13.02 | 100 | 10.2 | 98 |
| Temperature | DRopt | NP1300 | GP | Photosynthetic Efficiency | LCP | LSP |
|---|---|---|---|---|---|---|
| °C | µmol CO2 m−2 s−1 | Adimensional | µmol Photons m−2 s−1 | |||
| 0 | −0.26 ± 0.09 | 1.71 ± 0.69 | 1.96 ± 0.70 | 7.69 ± 2.8 | 20 ± 22 | 491 ± 572 |
| 5 | −0.48 ± 0.22 | 2.89 ± 0.44 | 3.37 ± 0.22 | 7.06 ± 5.9 | 33 ± 23 | 765 ± 137 |
| 10 | −0.61 ± 0.17 | 3.35 ± 0.26 | 3.93 ± 0.27 | 6.49 ± 1.2 | 38 ± 14 | 794 ± 142 |
| 15 | −1.01 ± 0.11 | 5.12 ± 0.94 | 6.14 ± 0.86 | 6.06 ± 1.4 | 42 ± 7 | 840 ± 75 |
| 20 | −1.27 ± 0.12 | 4.41 ± 0.90 | 5.68 ± 1.02 | 4.47 ± 1.0 | 63 ± 1 | 950 ± 67 |
| 25 | −2.05 ± 0.49 | 2.85 ± 1.13 | 4.90 ± 1.11 | 2.39 ± 0.6 | 111 ± 64 | 973 ± 55 |
Disclaimer/Publisher’s Note: The statements, opinions and data contained in all publications are solely those of the individual author(s) and contributor(s) and not of MDPI and/or the editor(s). MDPI and/or the editor(s) disclaim responsibility for any injury to people or property resulting from any ideas, methods, instructions or products referred to in the content. |
© 2023 by the authors. Licensee MDPI, Basel, Switzerland. This article is an open access article distributed under the terms and conditions of the Creative Commons Attribution (CC BY) license (https://creativecommons.org/licenses/by/4.0/).
Share and Cite
Beltrán-Sanz, N.; Raggio, J.; Pintado, A.; Dal Grande, F.; García Sancho, L. Physiological Plasticity as a Strategy to Cope with Harsh Climatic Conditions: Ecophysiological Meta-Analysis of the Cosmopolitan Moss Ceratodon purpureus in the Southern Hemisphere. Plants 2023, 12, 499. https://doi.org/10.3390/plants12030499
Beltrán-Sanz N, Raggio J, Pintado A, Dal Grande F, García Sancho L. Physiological Plasticity as a Strategy to Cope with Harsh Climatic Conditions: Ecophysiological Meta-Analysis of the Cosmopolitan Moss Ceratodon purpureus in the Southern Hemisphere. Plants. 2023; 12(3):499. https://doi.org/10.3390/plants12030499
Chicago/Turabian StyleBeltrán-Sanz, Núria, José Raggio, Ana Pintado, Francesco Dal Grande, and Leopoldo García Sancho. 2023. "Physiological Plasticity as a Strategy to Cope with Harsh Climatic Conditions: Ecophysiological Meta-Analysis of the Cosmopolitan Moss Ceratodon purpureus in the Southern Hemisphere" Plants 12, no. 3: 499. https://doi.org/10.3390/plants12030499