Article

Population Variation and Phylogeography of Cherry Blossom (Prunus conradinae) in China

1
Co-Innovation Center for Sustainable Forestry in Southern China, College of Life Sciences, Nanjing Forestry University, Nanjing 210037, China
2
Cerasus Research Center, College of Life Sciences, Nanjing Forestry University, Nanjing 210037, China
*
Authors to whom correspondence should be addressed.
Plants 2024, 13(7), 974; https://doi.org/10.3390/plants13070974
Submission received: 20 February 2024 / Revised: 12 March 2024 / Accepted: 14 March 2024 / Published: 28 March 2024
(This article belongs to the Special Issue Origin and Evolution of the East Asian Flora (EAF))

Abstract

:
Prunus conradinae (subgenus Cerasus, Rosaceae) is a significant germplasm resource of wild cherry blossom in China. To ensure the comprehensiveness of this study, we used a large sample size (12 populations comprising 244 individuals) which involved the fresh leaves of P. conradinae in Eastern, Central, and Southwestern China. We combined morphological and molecular evidence (three chloroplast DNA (cpDNA) sequences and one nuclear DNA (nr DNA) sequence) to examine the population of P. conradinae variation and differentiation. Our results revealed that Central, East, and Southwest China are important regions for the conservation of P. conradinae to ensure adequate germplasm resources in the future. We also found support for a new variant, P. conradinae var. rubrum. We observed high genetic diversity within P. conradinae (haplotype diversity [Hd] = 0.830; ribotype diversity [Rd] = 0.798), with novel genetic variation and a distinct genealogical structure among populations. There was genetic variation among populations and phylogeographic structure among populations and three geographical groups (Central, East, and Southwest China). The genetic differentiation coefficient was the lowest in the Southwest region and the gene exchange was obvious, while the differentiation was obvious in Central China. In the three geographic groups, we identified two distinct lineages: an East China lineage (Central China and East China) and a Southwest China lineage ((Central China and Southwest China) and East China). These two lineages originated approximately 4.38 million years ago (Mya) in the early Pliocene due to geographic isolation. P. conradinae expanded from Central China to East China at 3.32 Mya (95% HPD: 1.12–5.17 Mya) in the Pliocene. The population of P. conradinae spread from East China to Southwest China, and the differentiation time was 2.17 Mya (95% (HPD: 0.47–4.54 Mya), suggesting that the population of P. conradinae differentiated first in Central and East China. The population of P. conradinae experienced differentiation from Central China to Southwest China around 1.10 Mya (95% HPD: 0.11–2.85 Mya) during the early Pleistocene of the Quaternary period. The southeastern region of East China, near Mount Wuyi, likely serves as a refuge for P. conradinae. This study establishes a theoretical foundation for the classification, identification, conservation, and exploitation of germplasm resources of P. conradinae.

1. Introduction

Prunus conradinae (Koehne) Yu et Li, a member of the subgenus Cerasus (Mill.) in the Rosaceae family [1,2,3], is a deciduous species of wild cherry blossom native to China. Mature P. conradinae trees range from 3 to 10 m in height. P. conradinae umbels usually contain three to five large flowers, with white or pink petals that bloom prior to leaf emergence [4]. The leaves of P. conradinae are blunt and serrated, with small glands at the toothed ends [4]. P. conradinae bears red fruit and this species is characterized by a long blooming period, with showy flowers [5]. P. conradinae is valued as a significant germplasm resource for the selection, breeding, and crossbreeding of new cherry blossom varieties suited to Chinese cultivation [6,7]. This species thrives at middle-to-high altitude regions (500–2100 m) in China, including Hunan, Hubei, Sichuan, Guizhou, Yunnan, Guangxi, Shaanxi, and Henan [8,9]. Due to centuries of cultivation, interspecific crossbreeding, and complexities in topography, climate, and soil, P. conradinae populations exhibit substantial variations in morphology and structure, exhibiting high genetic diversity [10,11,12]. Earlier studies have primarily focused on community structure and morphological features of P. conradinae, reporting diversity in terms of P. conradinae flower color. The phylogeography of P. conradinae has not been the focus of research, thus leaving its biogeographic status uncertain [13,14].
In recent years, researchers have exploited maternally inherited chloroplast DNA (cpDNA) and biparentally inherited nrDNA sequence data in phylogeographic plant studies [15,16]. This approach has provided insights into species’ migratory routes and refuge locations, which remain unaffected by parental genetic confounding, as well as evidence of plant evolution through hybridization, polyploidy, and gene introgression [17,18]. Drawing upon phenotypic traits, ecological geography, and other theories, researchers aim to unravel species definitions, lineages, and patterns of historical evolutionary change.
In today’s information-rich era, various software simulations can be used to safeguard species’ germplasm resources. Niche simulation, in conjunction with phylogeographic investigations, can illuminate species’ responses to climate change, including species isolation and differentiation [19]. The MaxEnt model, devised by Phillips, is an efficient and highly accurate tool for predicting potential species habitats [20]. Considering these advancements, our research aims to expand the sample size for P. conradinae phylogeographic study and improve genetic evidence data. By integrating three cpDNA sequence segments and one nrDNA sequence fragment in a niche model, we aim to predict present and potential habitat regions for P. conradinae, define species, and compile phylogeographic data on population variation and differentiation [21]. This study will shed light on historical factors influencing the current distribution of P. conradinae, thus providing a theoretical framework for exploring the species’ origin, migration paths, and post Ice Age dispersion modes, thereby offering crucial insights for the conservation and utilization of its germplasm resources [22,23].

2. Materials and Methods

2.1. Ecological Niche Model

Longitudinal and latitudinal data on the geographic distribution points of P. conradinae were obtained from field investigations and species specimen databases. In total, 554 specimens were retrieved from 24 herbariums. The database specimen data were compared to ensure that the geographic habitat distributions were correct. Within each 2.5 × 2.5 grid, the distribution point nearest to the center was selected. This approach resulted in 201 P. conradinae geographic distribution points [24]. Environmental data were downloaded from the World Climate Database WorldClim, version 2.1, January 2020 (http://www.worldclim.org/ (accessed on 20 February 2023)). The database contains information on 19 climatic factors for given periods: current day (1970–2000), 2050s (2041–2060), and 2070s (2061–2080), with a spatial resolution of 2.5 min. Projected climate data (2050s and 2070s) were modelled using a general atmospheric circulation model, CCSM4. Climate information and key factors influencing the geographic distribution of P. conradinae were obtained using DIVA-GIS, version 7.5, and the data were cross-referenced with the altitude, longitude, and latitude of each distribution point [25]. We conducted Pearson’s correlation analysis [26]. Based on the recorded geographic distribution of P. conradinae and climate data, we used MaxEnt, version 3.4.1 to construct a map of the current and future (2050s and 2070s) geographic distribution of P. conradinae.

2.2. Plant Materials

A plant sampling strategy was developed based on the statistical analysis and verification of the specimen data, along with forecasts of the contemporary suitable area and data on the contemporary distribution of P. conradinae. Between 2019 and 2022, field investigations were conducted, with 244 samples from 12 populations (fresh leaves of P. conradinae in Eastern, Central, and Southwestern China) collected across eight provinces (Table 1). During the sampling of P. conradinae in Hubei Province, two populations (Phoenix Pool, Yichang City, FHC; Gexian Mountain, Xianning City, GXS) exhibited a stable and continuous red–pink coloration. In addition, leaves and hypanthiums of a population in the Wangcheng Slope area of Enshi Autonomous Prefecture in Hubei Province displayed pubescence. In addition to field observations, samples from each of these populations were subjected to a detailed morphological analysis and comparison with samples from populations located there. Traditional phenotypic characteristics showed a stable and continuous variation amongst different populations in the same area (Table 1). Based on our observations, two new variations were identified: P. conradinae var. ruburm and P. conradinae var. pubescens. This classification was then corroborated by molecular validation of samples sourced from each population.

2.3. DNA Extraction, Polymerase Chain Reaction (PCR) Amplification, Sequencing, and Sequence Alignment

Genomic DNA was extracted from 244 fresh leaves of P. conradinae (The number and location of each population in leaf collection are shown in Table 1) using a commercial kit (Tiangen Biotechnology Co., Ltd., Shanghai, China) following the manufacturer’s instructions. The concentration and purity of the extracted DNA were assessed via 1% agarose gel electrophoresis. DNA samples that met the required standards were stored in a refrigerator at –80 °C. These samples were then shipped to Shanghai, China Shanghai Shenggong Co., Ltd. for sequencing to obtain haplotypes for subsequent phylogeographic analysis. Universal primers for different sequences of cpDNA and nrDNA in cherry blossom were collated by reviewing the relevant literature and accessing the NCBI website. Three pairs of cpDNA universal primers—a gene maturation enzyme gene fragment (MatK-F: CGATCTATTCATTCAATATTTC; R: TCTAGCACACGAAAGTCGAAGT) [27], a non-coding gene spacer fragment (TrnL-F-F: CGAAATCGGTAGACGCTACG; R: ATTTGAACTGGTGGTGACACGAG) [28], and (TrnD-E-F: ACCAATTGAACTACAATCCC; R: AGGACATCTCTCTTTCAAGGAG) [29] and a pair of nrDNA sequence fragments (ITS-F: GGAAGTAAAAGTCGTAACAAGG; R: TCCTCCTCC-GCTTATTGATATGC)—were employed to determine the genetic diversity and population structure of P. conradinae in different regions. A 25 μL PCR amplification reaction system was constructed using 2.0 μL of DNA template, 0.5 μL (10 μmol/L) each of upstream and downstream primers, 12.5 μL of 2×PCR Master Mix, and 9.5 μL of ddH2O. The PCR amplification protocol was as follows: initial denaturation at 94 °C for 5 min, followed by 30 cycles of denaturation at 94 °C for 1 min, annealing at 54–56 °C for 1 min, extension at 72 °C for 1 min, and a final extension at 72 °C for 5 min. After the end of the PCR experimental reaction procedure, the samples were sent to China Shanghai BioEngineering for purification and sequencing after the 1% agarose gel electrophoresis test met the requirements of sending amplified products.

2.4. Data Analysis

All cpDNA sequences were aligned using MAFFT, version 7 [30] and then manually reviewed and edited using PhyloSuite, version 1.2.2. After trimming, the sequences of MatK, TrnL-F, and TrnD-E were concatenated. DnaSP, version 6 was used to estimate the genetic diversity of each population. [31]. The primary parameters considered included the number of haplotypes (h), haplotype diversity (Hd), nucleotide diversity (Pi/π), and number of polymorphic sites (S) [32]. An AMOVA analysis of molecular variance was performed using Arlequin, version 3.1 [33], with significance tested via 1000 nonparametric permutations. Factors, such as the degree of freedom (d.f.), total variance, variation component, variation variance distribution, and genetic differentiation index (FST), were estimated within and among P. conradinae populations. Parameters were set to acquire the numerical values of Nst, Gst, and the significance level of P, assisting in the exploration of factors influencing genetic differentiation in the P. conradinae populations and the presence of a marked phylogeographic structure. Software, including PopArt, version 1.7 and Notepad++, version 7.7, and the TCS Network, were used to construct a haplotype network diagram and investigate haplotype kinship [34]. Based on TCS haplotype relationships, a geographic distribution map of haplotypes was created using ArcMap, version 10.2, which also corresponded to the species of haplotype and distribution proportion. Neutrality tests (Tajima’s and Fu’s FS tests) and pairwise mismatch distribution analyses were carried out using Arlequin, version 3.1 [35]. Expected and observed value curves, sourced from DnaSP version 6.1, were compared to test the hypothesis of sudden population expansion if they coincided. The study also sought to ascertain if the P. conradinae population had undergone bottleneck or expansion events [36].

2.5. Molecular Dating and Demographic Analyses

BEAST, version 6 software was employed to construct a temporal phylogenetic tree for the Rosaceae family and estimate the divergence time of the P. conradinae lineage [37]. Using the most recent phylogenetic tree of family Rosaceae [38], four representative groups from different subfamilies were selected, along with their corresponding chloroplast genome sequences obtained from NCBI. Multiple sequence alignment of all chloroplast genomes was conducted using MAFFT, version 7 [30]. A best fit nucleotide substitution model was constructed using the maximum likelihood method and phylogeny. IQ-Tree, version 1.6.12 software was employed to derive the model [39]. The best fit nucleotide substitution model was calculated using the Bayesian information criterion (BIC) [40]. A random starting tree was used for 10,000 generations, with a sampling frequency of one every 1000 generations, facilitating the selection of the best fit nucleotide replacement model. A phylogenetic tree of the Rosaceae intergenus (encompassing four subfamilies) was constructed with the aid of five molecular clocks or fossil calibration points. The full chloroplast genome was utilized to determine the differentiation time of P. conradinae versus that of other cherry blossom species within the same clade. From two fossil calibration points, phylogenetic trees reflecting the divergence time of 10 nrDNA (ITS) ribotypes of P. conradinae were constructed, enabling predictions of the differentiation times and migration routes of P. conradinae. The software parameters were eventually set to a GTR substitution model and an exponential uncorrelated relaxed model using the Yule process. Two independent MCMC runs were carried out, each comprising 300,000,000 generations and sampling every 1000 generations. The first 12,000,000 generations in each run were discarded as burn-in. Based on the fossil divergence time, the crown group of Rosaceae (N1) was constrained with a log-normal distribution, setting the mean at 90.18 Mya and the standard deviation at 0.05 (Table 2) [38]. The group (tribe Maleae and tribe Spiraeeae) and tribe Amygdaleae (N2) was constrained with a log-normal distribution, setting the mean value at 72.62 Mya and the standard deviation at 0.05 [10,41]. The tribe Amygdaleae (N3) was constrained with a log-normal distribution, setting the mean at 68.58 Mya and the standard deviation at 0.01 [41,42,43]. Based on the fossil divergence time, the differentiation time of Prunus in a strict sense ranged from 60.7 to 62.4 Mya. The mean divergence time of Prunus was set at 55 Mya (N4), and the standard deviation was set at 0.09 [44,45]. The node subgenus Cerasus (N5) was constrained by a log-normal distribution, setting the mean value at 28.21 Mya and the standard deviation at 0.05 [41]. The log files and tree files from the two separate runs were merged using LogCombiner, version 2.6.6 (part of the BEAST package). All effective sample size values were above 200. TreeAnnotator, version 1.7.3 (part of the BEAST, version 1.7.3 package) was used, with 25% removed as burn-in to estimate the mean divergence time and 95% highest posterior density (HPD) interval. Finally, FigTree, version 1.3.1 [46] was utilized to display the age of each node and its 95% HPD interval [44,47].

3. Results

3.1. Ecological Niche Model

Based on the model evaluation criteria of the receiver operating curve, the detection outcomes for P. conradinae attained an excellent standard (training setting: 0.945, test setting: 0.949) [38]. Based on current potential suitable areas data, suitable habitat regions for P. conradinae include Hubei, Zhejiang, Fujian, Jiangxi, Anhui, Henan, Yunnan, Chongqing, Guizhou, Hunan, and Sichuan, as well as possibly Jiangsu and Shandong. The core distribution areas of P. conradinae are located mainly in Central and Eastern China. In future scenarios, with gradual climate warming, the total suitable area in the 2050s will be reduced compared to that in the current period but will increase in the 2070s. Under the future climate (CCSM4) scenario change in the 2050s, the total suitable area decreased compared with the current situation, but under the future climate scenario change in the 2070s, the total suitable area increased, and the extremely suitable area spread to the high latitude and northeast direction, and the high suitable area spread to the low latitude direction. The core suitable areas, however, remain consistent in Central and Eastern China (Figure 1). Utilizing DIVIA-GIS, 10 limiting environmental factors were identified within the habitats of the potential distribution areas. The primary factors limiting the geographic distribution of P. conradinae at present were the amount of seasonal (bio16) and annual precipitation (bio12). The annual minimum temperature (bio7) was shown to not be a significant climate factor. Water, as the dominant climate-limiting factor, proved to have a stronger impact on the geographic distribution of P. conradinae than temperature. This is postulated to be associated with the climatic zone of the P. conradinae distribution area being affected by north subtropical and subtropical humid monsoon regions. By the 2070s, rainfall is predicted to increase in China, particularly in Central and Southwestern regions, and temperature changes may become significantly noticeable [26]. The anticipated growth of the total suitable area of P. conradinae in the 2070s is linked to the evolving trend of these comprehensive climate factors.

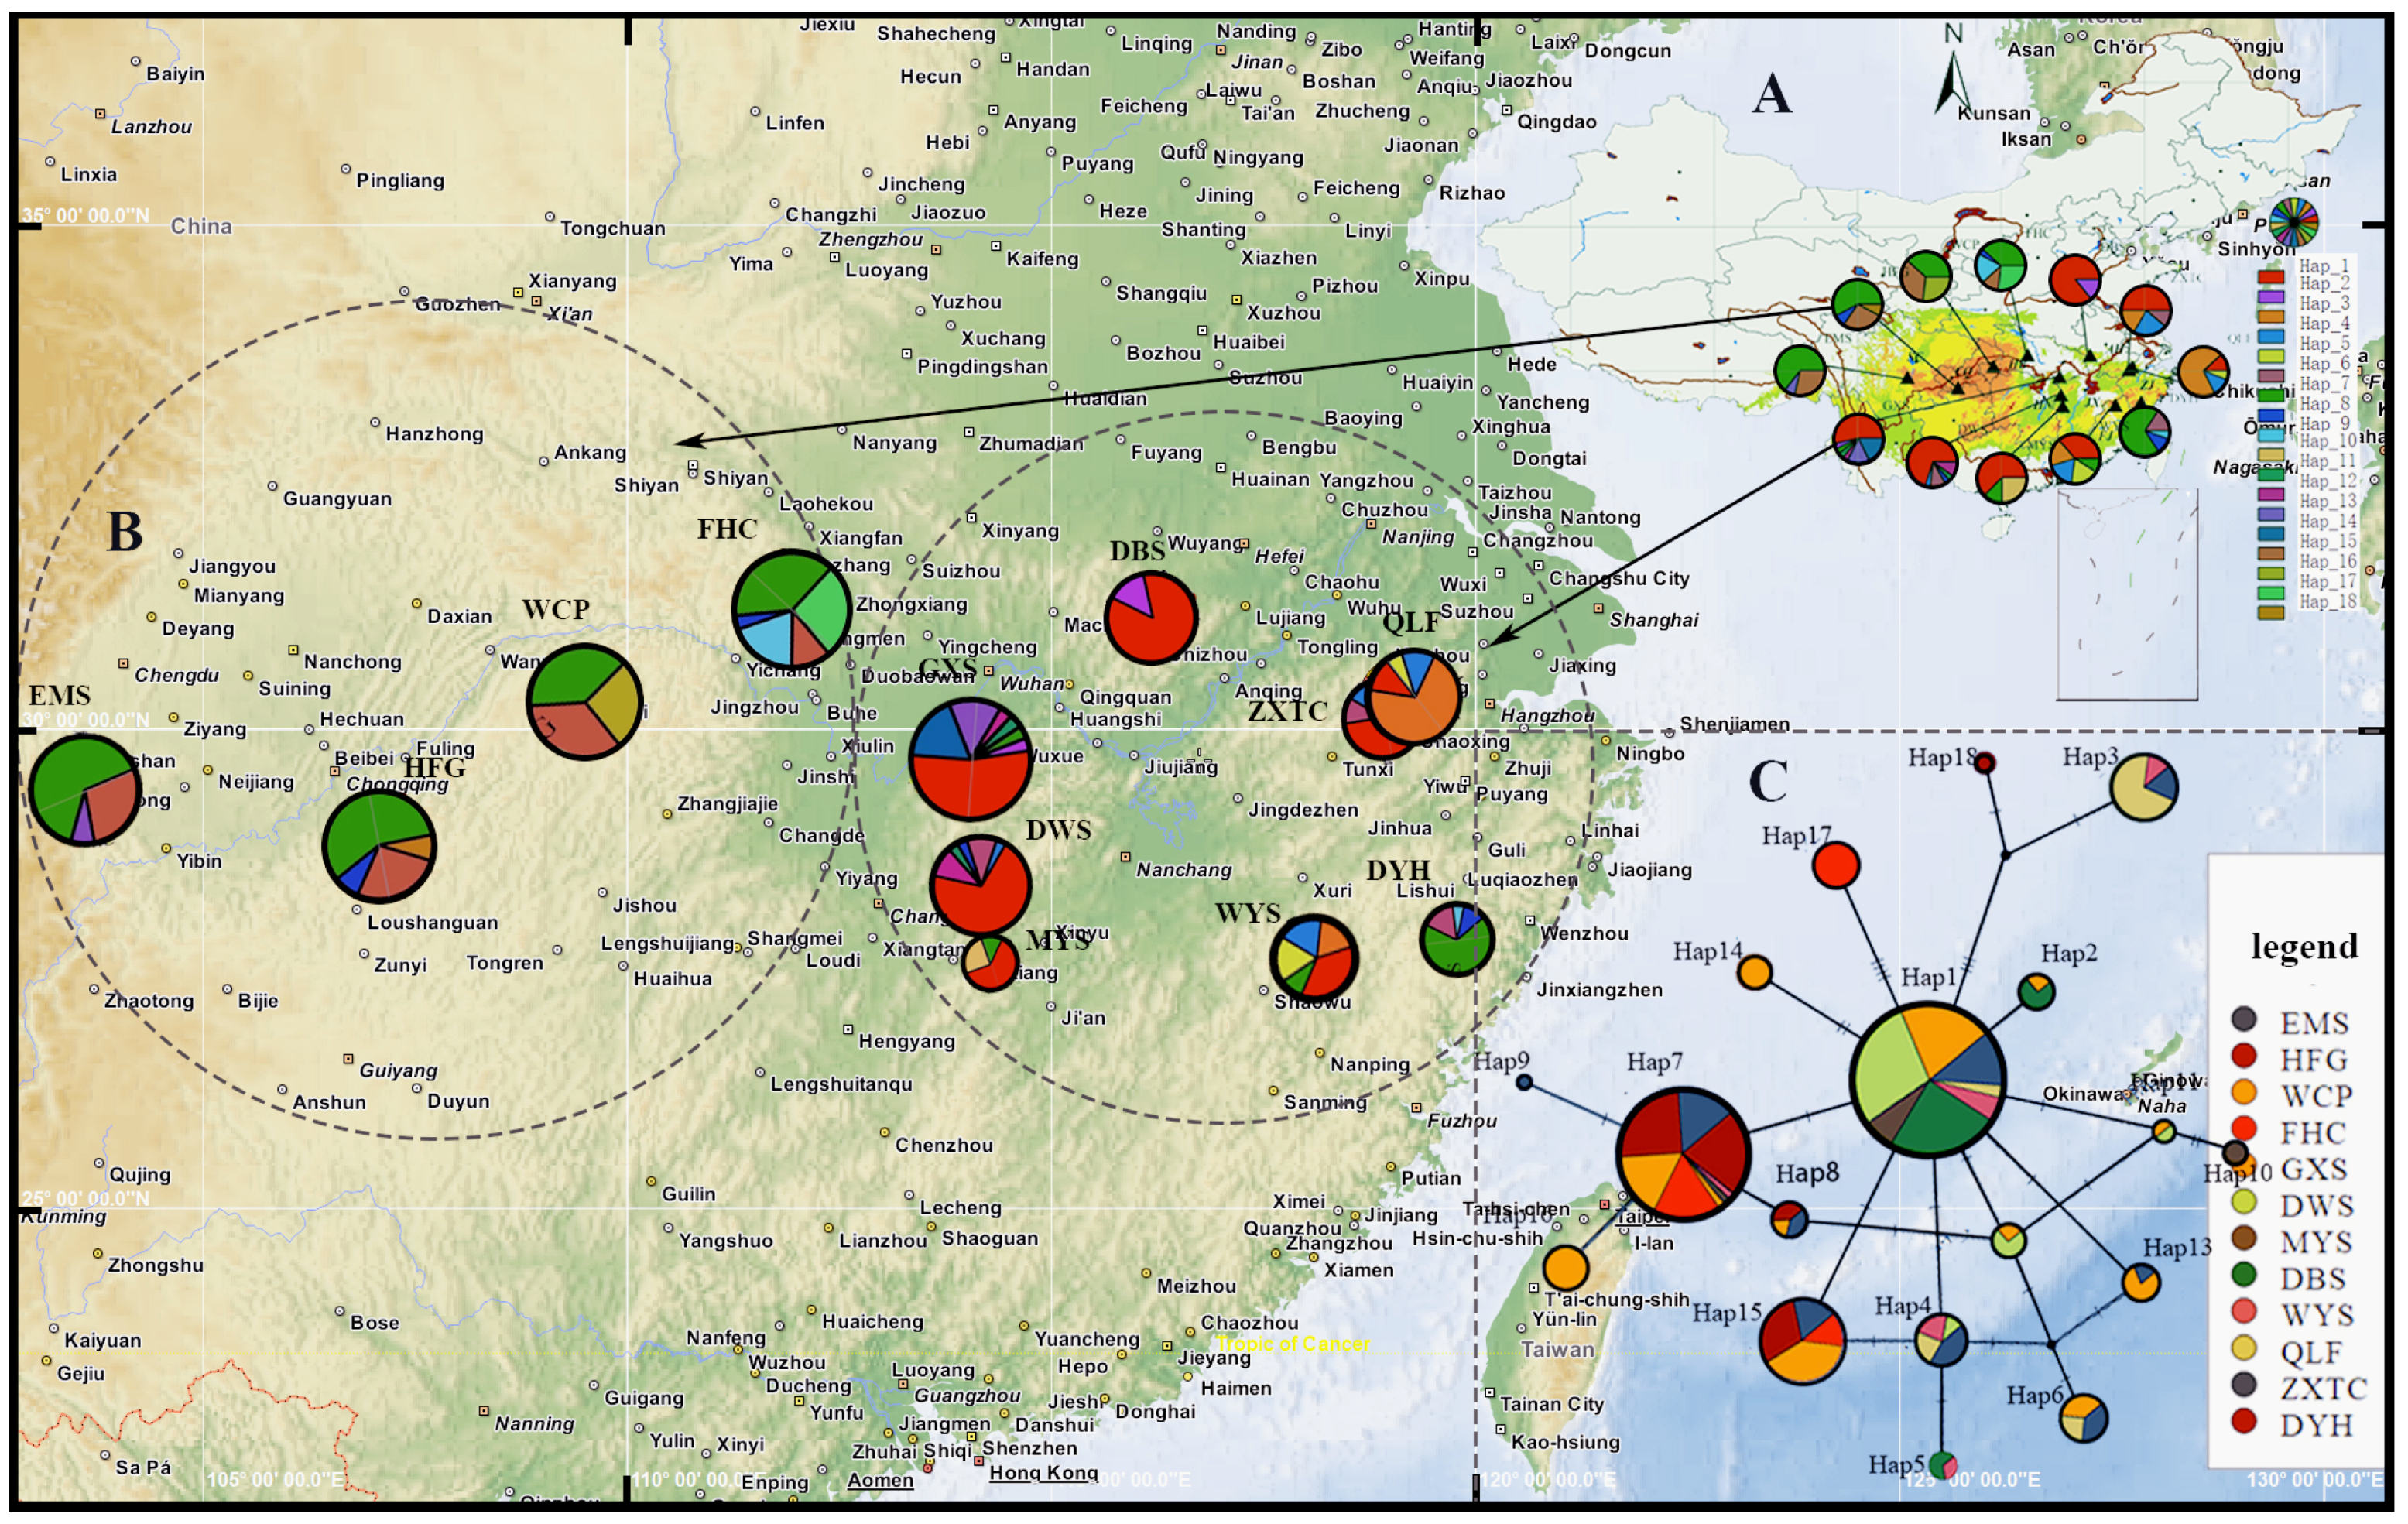
3.2. Sequence Variation, Haplotype Frequency, and Distribution

Three cpDNA fragments, namely MatK, TrnL-F, and TrnD-E, had a combined length of 2238 bp, with fragment lengths of 740 bp, 868 bp, and 630 bp, respectively. Analysis of these fragments detected 22 mutation sites: two in the MatK fragment, twelve in the TrnL-F fragment, and eight in the TrnD-E fragment. Among the 12 populations studied, 18 distinct chloroplast haplotypes (H1–H18) were identified. Among these, the most frequently observed were H1, H7, and H15, accounting for 30.33% (74), 24.59% (60), and 9.43% (23), respectively, of haplotypes in the populations (Table 3). Haplotype H1, with the highest frequency, was found in populations in Central China (Gexianshan [GXS] and Dawei Mountain [DWS]) and East China (Mingyue Mountain [MYS], Wuyi Mountain [WYS], Dabie Mountain [DBS], Qingliang Peak [QLF], and Tianchi Lake [ZXTC]). H7 was detected in populations in Southwest China (Mount Emei [EMS], Heifeng Valley [HFG]), Central China (Enshi Autonomous Prefecture [WCP], Heifeng Valley [FHC], and Gexianshan [GXS]), and East China (Mingyue Mountain [MYS], Wuyi Mountain [WYS], and Dayang Lake [DYH]). H15 occurred in Southwest China (Mount Emei [EMS] and Heifeng Valley [HFG]) and Central China (Enshi Autonomous Prefecture [WCP] and Phoenix Pool [FHC]). Haplotypes H10, H11, and H18 exhibited the lowest frequencies, each detected in only two populations. H1–H9, H11–H13, and H15 were the most commonly detected haplotypes. Haplotypes H10, H14, H16, H17, and H18 were endemic, detected only in populations in East China (MYS), Central China (GXS and FHC), and Southwest China (WCP and HFG). Among these populations, the Gexian Mountain (GXS) population displayed the greatest Hd, with seven haplotypes, and the Dabie Mountain (DBS) population displayed the least, with two haplotypes (Table 3 and Table 4).
The length of the nrDNA sequencing fragment was 578 bp, and 19 mutation sites were identified. From the 12 populations analyzed, 11 ribotypes (R1–R11) were identified. The most common ribotypes were R4, R1, and R3, with frequencies of 30.3% (85), 24.5% (47), and 9.4% (28), respectively (Table 3). R4 had the highest frequency and was found in Central China (GXS and DWS) and East China (MYS, WYS, QLF, ZXTC, and DYH). R1 was detected in populations in Southwest China (EMS and HFG) and Central China (WCP and FHC). R3 was detected in populations in Central China (WCP and FHC). R6, a unique ribotype, was detected in populations in the Gexian Mountain (GXS). The Gexian Mountain (GXS) population had the most diverse ribotypes (N = 6), including rare ones, and the overall highest count of ribotypes (Table 3 and Table 4).

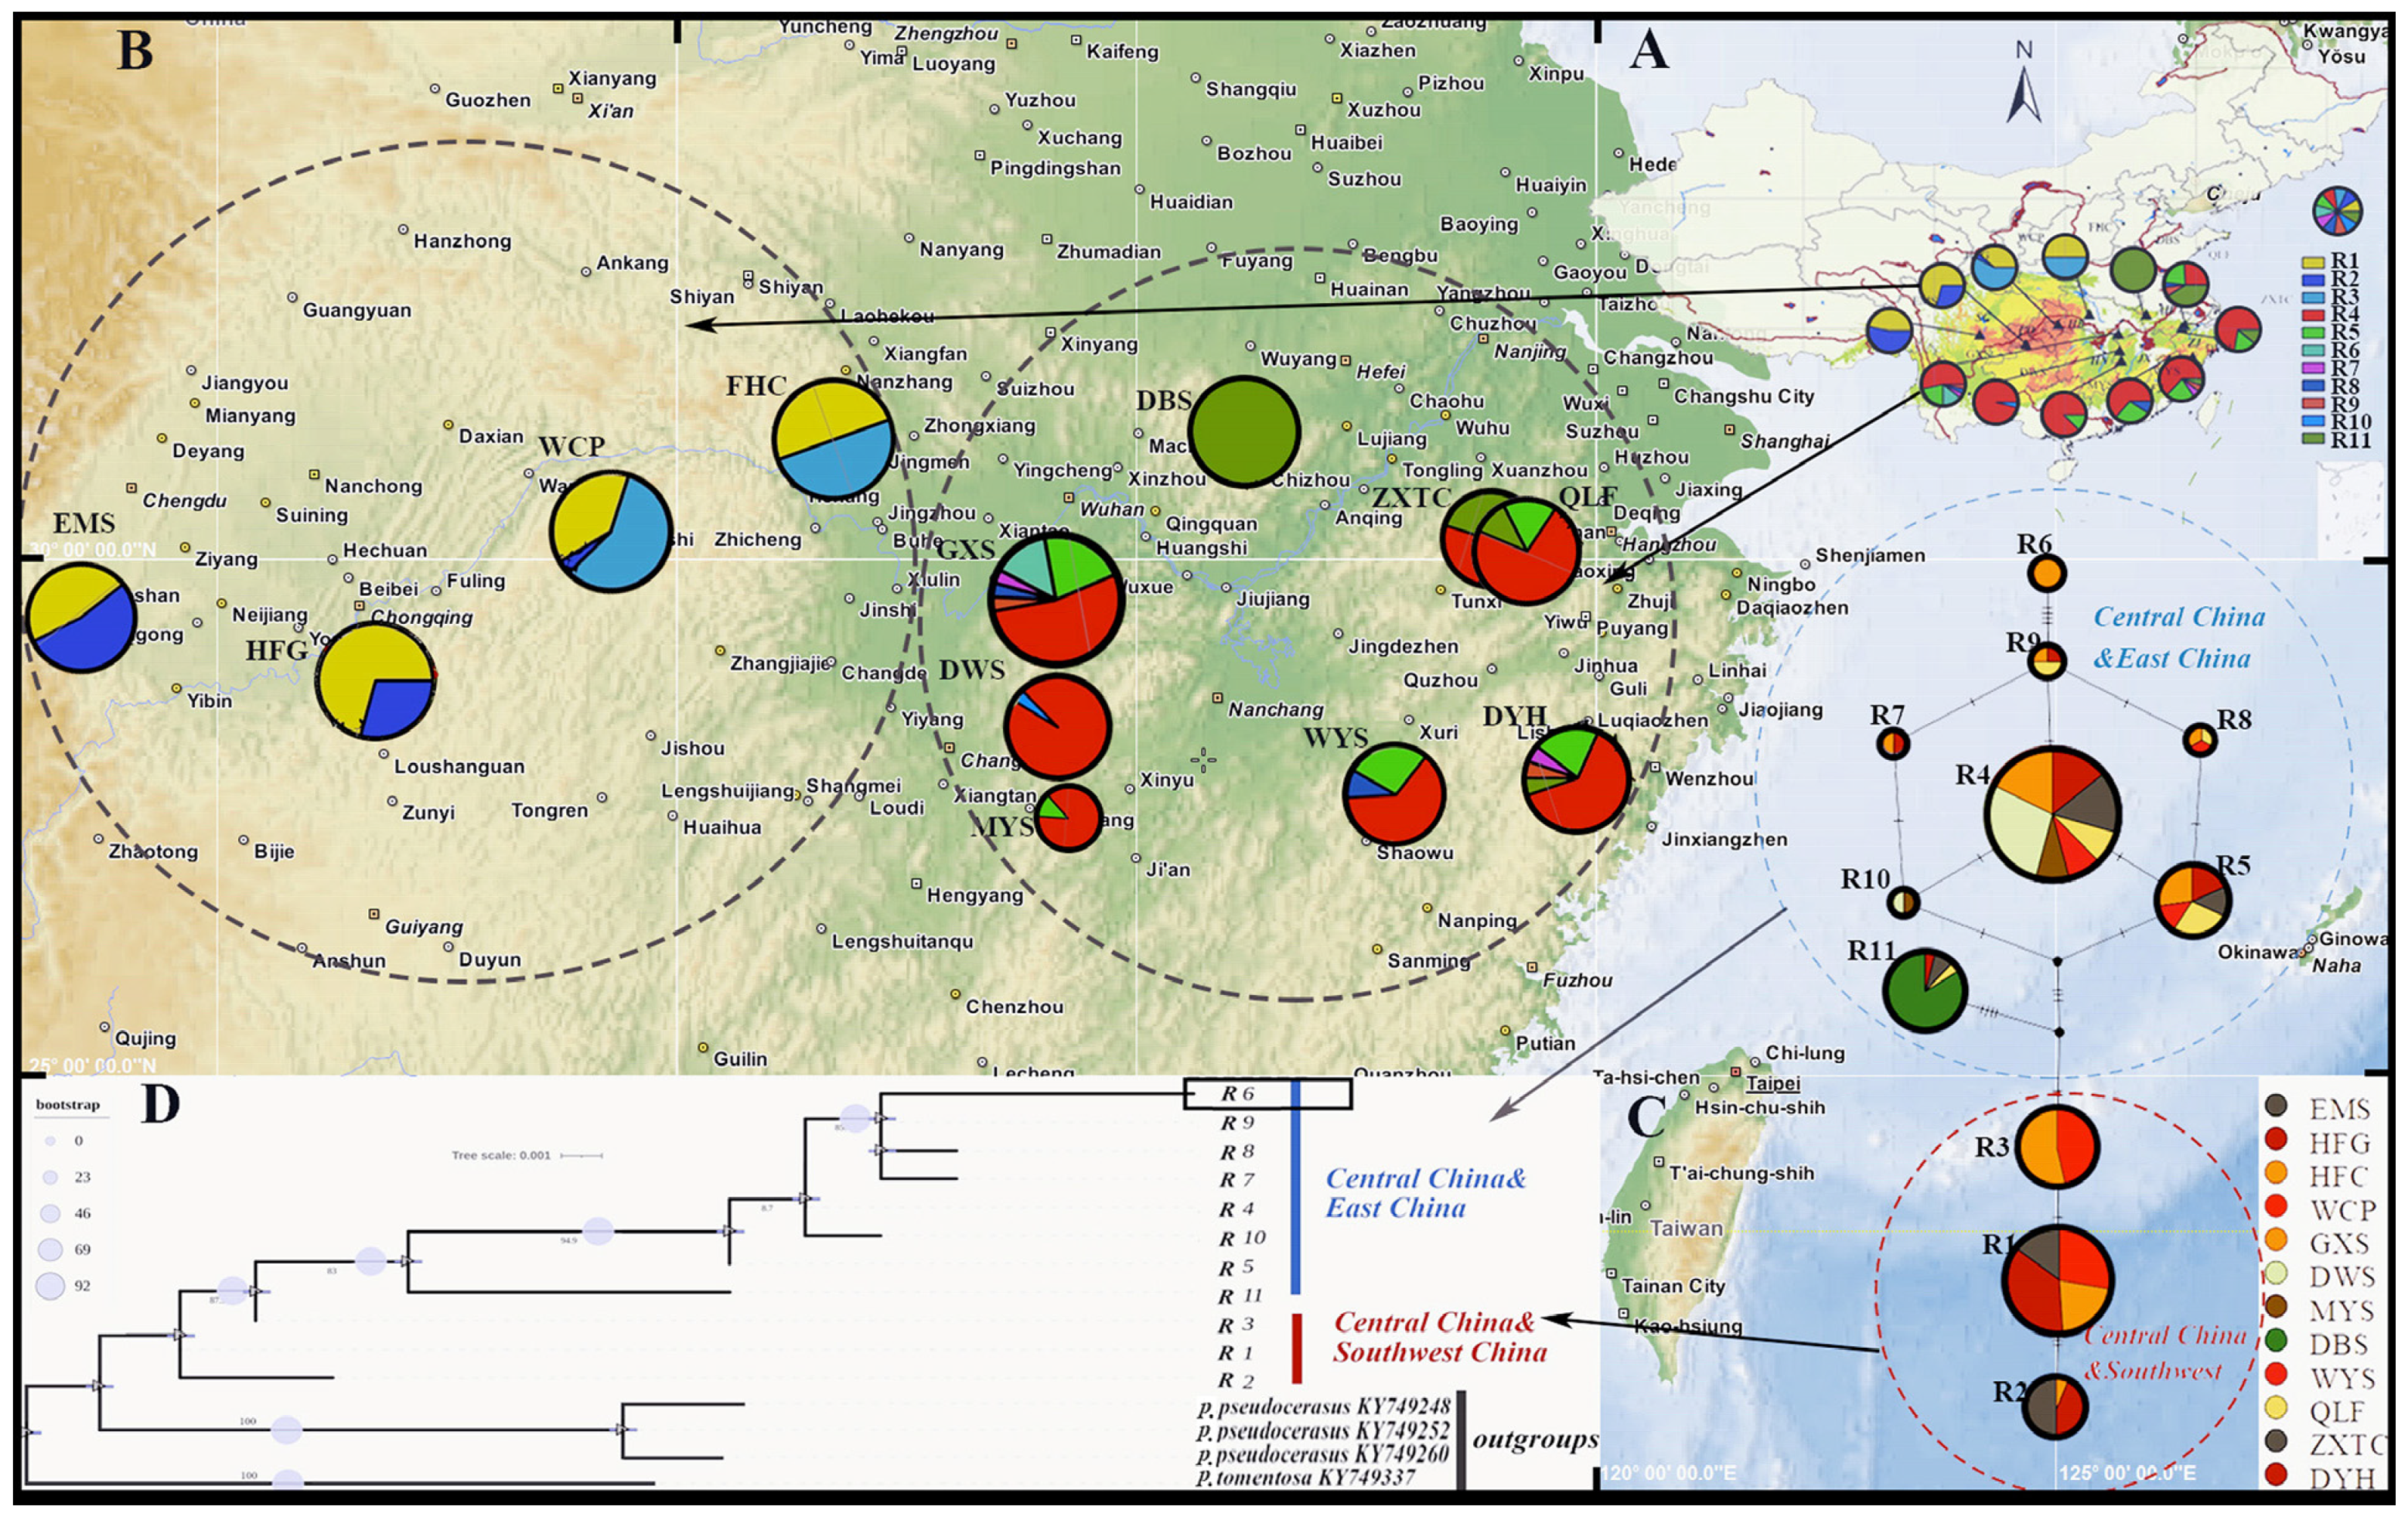
3.3. Haplotype Network

Based on the TCS haplotype network diagram, Hap1 and Hap7 were located in the central region, while H1, H7, and H15 had a higher number of individuals. Consequently, Hap1 and Hap7 are considered to be ancient haplotypes, whereas the remaining haplotypes are considered to be derived. The 18 haplotypes identified formed two distinct groups: an East China lineage (Central China and East China) and a Southwest China lineage ((Central China and Southwest China) and East China). Different haplotypes under each branch communicate in the same area. Seventeen of the eighteen haplotypes were detected in populations in Central China. Notably, H10, H14, H16, H17, and H18 were unique to specific locations, namely MYS, GXS, WCP, FHC, and HFG, respectively (Figure 2, Table 3).
According to the network diagram of TCS ribotypes (Figure 3), R4 was located in the central part of the diagram, while individuals R1, R4, and R5 were highly prevalent in the central part of the diagram. Thus, it can be inferred that R4 is an ancient ribotype. The 11 ribotypes detected in populations in Central China were divided into two lineages: an East China lineage (Central China and East China) and a Southwest China lineage (Central China and Southwest China). Ten of the 11 ribotypes detected were found in populations in Central China. R6 was identified as an endemic ribotype in Gexian Mountain (GXS) (Figure 3, Table 3).

3.4. Genetic Diversity and Population Genetic Structure

In terms of Hd, the Wuyi Mountain (WYS) population in Fujian had the highest diversity index, and the Dabie Mountain (DBS) population in Anhui had the lowest genetic diversity index. The overall population haplotype diversity was Hd = 0.830, the overall population nucleotide diversity was Pi × 10−3 = 0.878, and the average nucleotide difference count was K = 1.916. The variation in Hd among the different populations ranged from 0.257 to 0.836, the variation in nucleotide diversity (Pi × 10−3) ranged from 0.230 to 1.113, and the variation in the mean nucleotide difference count (K) ranged from 0.524 to 2.191 (Table 4). In Southwest China (Chongqing, Sichuan), Central China (Hubei, Hunan), and East China (Jiangxi, Anhui, Fujian, Zhejiang), Hd varied from 0.627 to 0.774, and nucleotide diversity (Pi × 10−3) varied from 1.050 to 1.240.
The range of the mean nucleotide difference (K) was 1.895–2.771. The genetic diversity of the populations in Central China was higher than that in the other regions. The population differentiation index (FST) for cpDNA in P. conradinae was 0.48886, signifying a significant level of differentiation. Among populations, genetic variation accounted for 48.89%, while within populations it was 51.11%. Genetic variation within populations slightly exceeded the variation between populations, although the values were similar [27]. As shown by the AMOVA results, genetic variation between populations accounted for 3.06% of three geographical groups and genetic variation within populations accounted for 46.32% of three geographical groups. Within populations, the genetic variation within three geographical groups was 50.62%, slightly higher compared to the genetic variation between populations in three geographical groups. The genetic differentiation parameters of the P. conradinae population (NST = 0.29843, NST = 0.28176, p < 0.05) indicated population substructuring. Genetic differentiation was detected in all three geographic regions: Southwest China (NST = 0.081, NST = 0.072, p < 0.05), Central China (NST = 0.22810, GST = 0.18051, p < 0.05), and East China (NST = 0.33970, GST = 0.30473, p < 0.05) (Table 4 and Table 5).
The total ribotype diversity (Rd) was 0.798, the nucleotide diversity (Pi × 10−3) was 0.886, and the average nucleotide difference (K) was 3.799. The Rd value of the different populations ranged from 0.000 to 0.798, the nucleotide diversity (Pi × 10−2) ranged from 0.000 to 0.886, and the average nucleotide difference (K) ranged from 0.000 to 3.799 (Table 4). The Rd, nucleotide diversity (Pi × 10−2) and average nucleotide difference (K) values in Southwest, Central, and East China ranged from 0.486 to 0.745, 0.169 to 0.756, and 0.972 to 4.341, respectively.
The populations in Central China exhibited higher genetic diversity compared to those in the other regions. The population differentiation index indicated high horizontal differentiation at the population level (FST = 0.82511). The genetic variation was 82.51% among populations and 17.49% within populations. The results of the AMOVA indicated that the genetic variation among three geographical groups was 16.51%, whereas the genetic variation among populations within three geographical groups was 56.25%, with the lowest coefficient of differentiation observed among populations in Southwest China. Within the three geographical groups, the genetic variation among populations exceeded that within populations (Table 4 and Table 5).

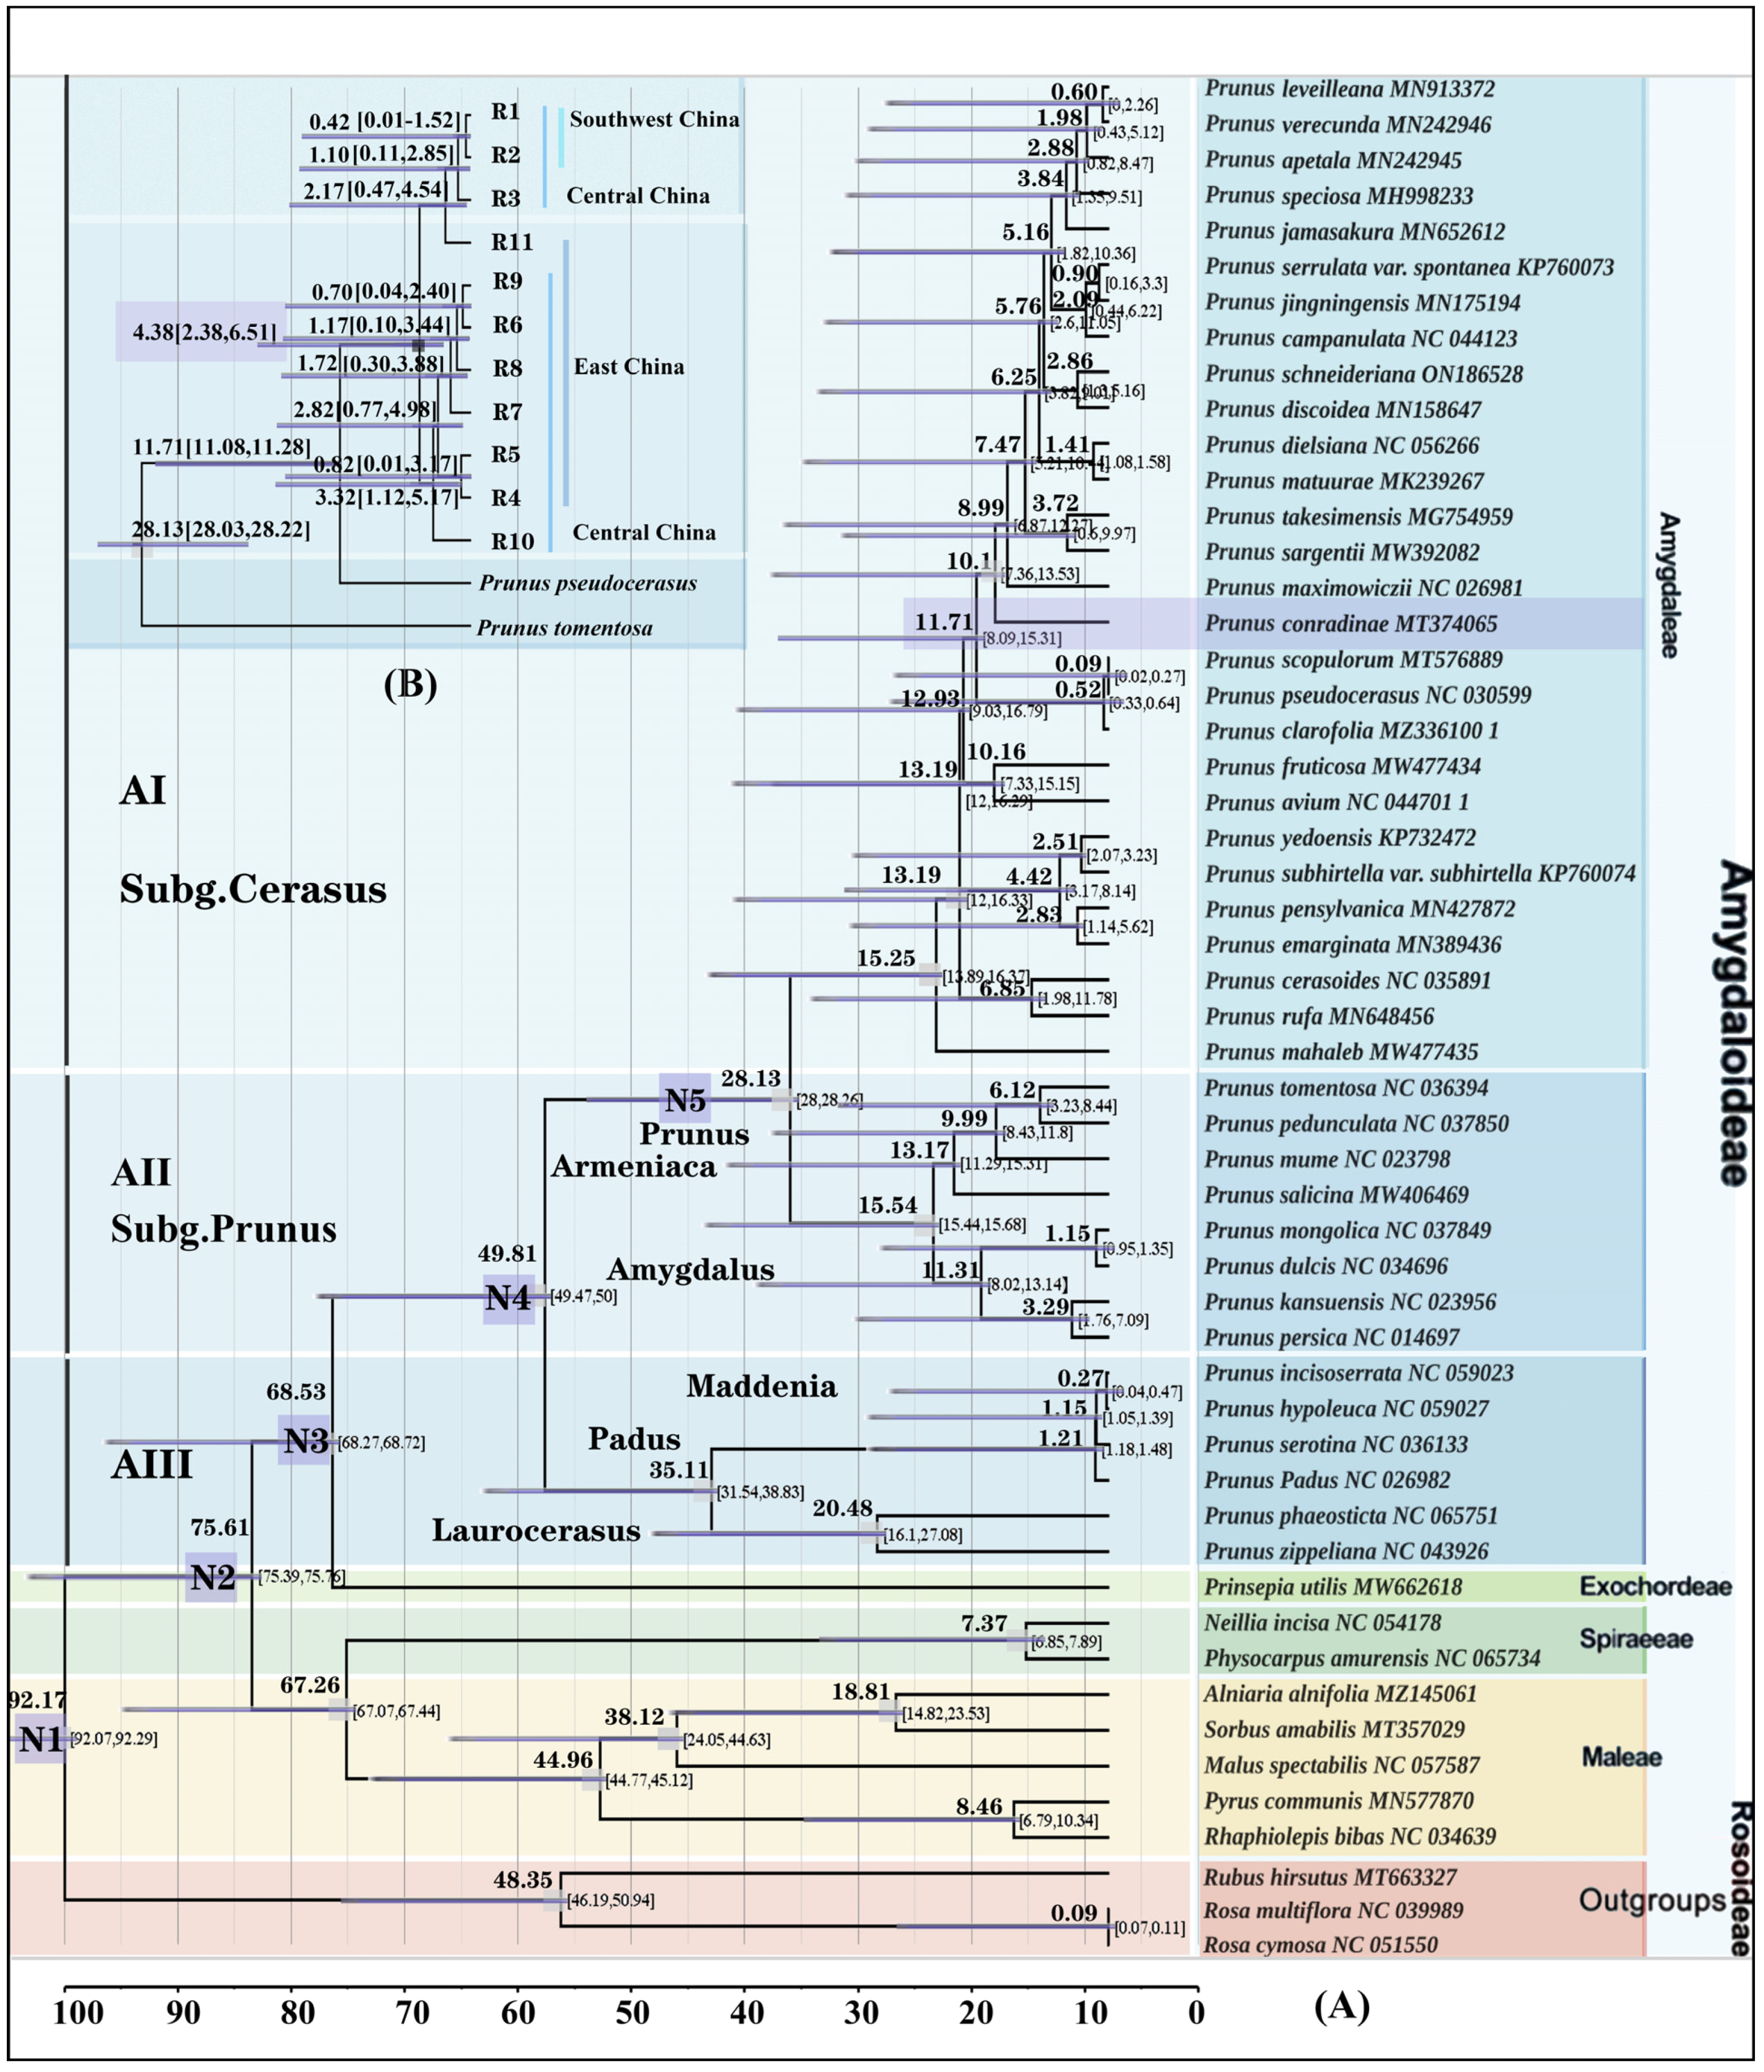
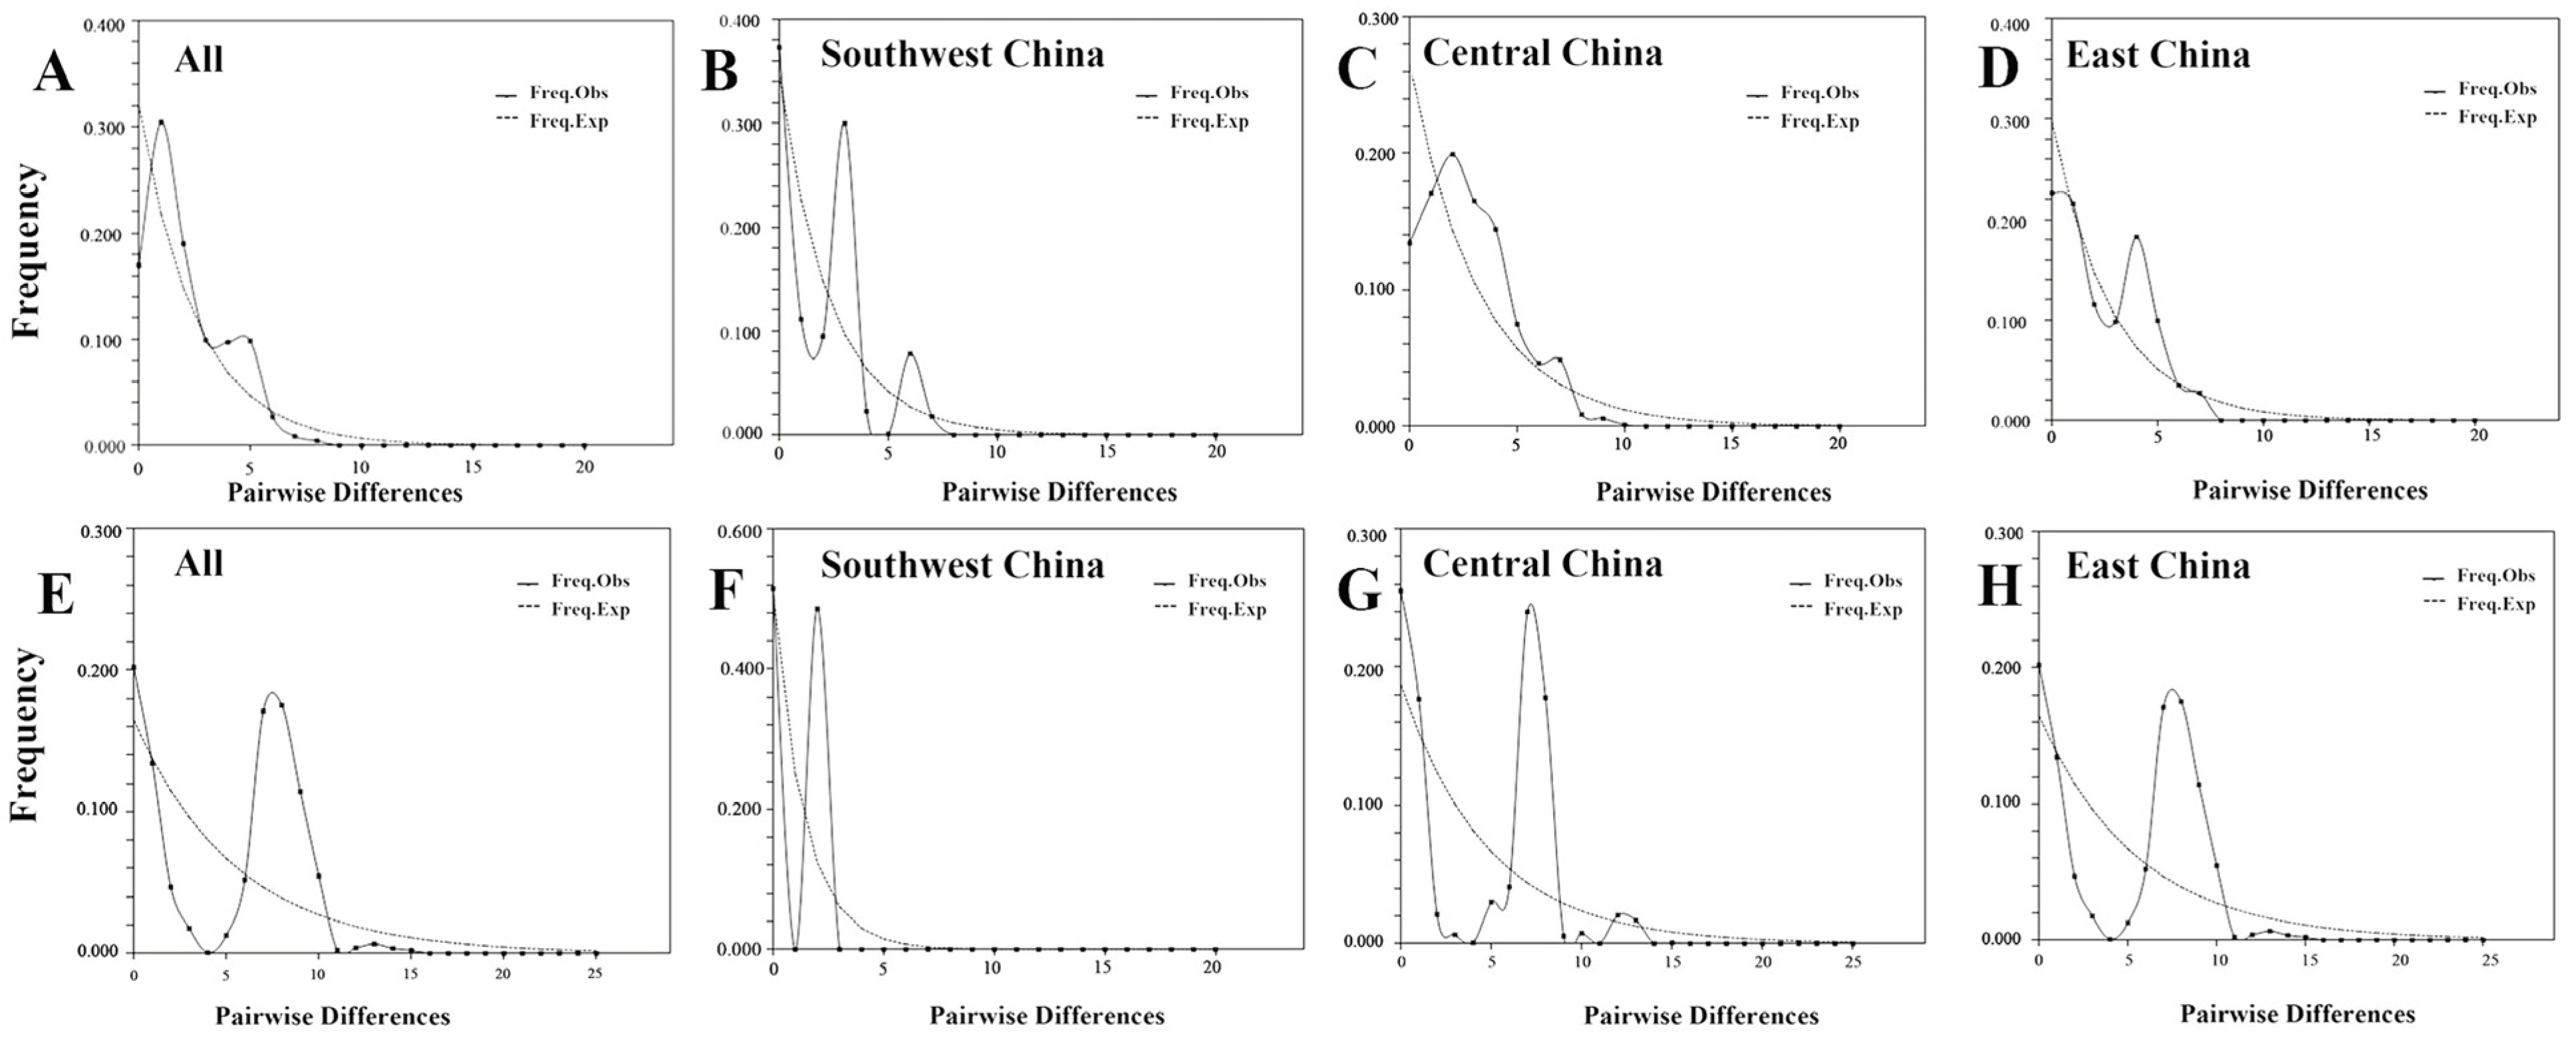
3.5. Molecular Dating and Demographic Analyses

N1: The estimated differentiation time for Rosaceae (subfamily Amygdaloideae and subfamily Rosoideae) was 92.17 Mya (95% HPD: 92.07–92.29 Mya). N2: The estimated differentiation time for three tribes (Maleae, Spiraeeae, and Amygdaleae) was 75.61 Mya (95% HPD: 75.39–75.76 Mya). N3: The estimated differentiation time for Prinsepia + ((Laurocerasus + (Padus + Maddenia)) + (Amygdalus + (Prunus + Armeniaca)) + Sub.g Cerasus) was 68.53 Mya (95% HPD: 68.27–68.72 Mya). N4: The estimated differentiation time for (Laurocerasus + (Padus + Maddenia)) + (Amygdalus + (Armeniaca + Prunus)) + Sub.g Cerasus was 49.81 Mya (95% HPD: 49.47–50.0 Mya). N5: The estimated differentiation time for (Amygdalus + (Armeniaca + Prunus)) + Sub.g Cerasus was 28.13 Mya (95% HPD: 28.0–28.26 Mya). In the sub-branch, P. mahaleb diverged from the common ancestor of the other true cherry (Sub.g Cerasus) approximately 15.25 Mya (95% HPD: 13.89–16.37 Mya). The estimated differentiation time for Prunus clarofolia + (Prunus pseudocerasus + Prunus scopulorum) + P. conradinae was approximately 11.71 Mya (95% HPD: 8.09–15.31 Mya) (Figure 4A).
The estimated coancestor time for the 10 ribotypes of P. conradinae was 4.38 Mya (95% HPD: 2.38–6.51 Mya) in the Pliocene epoch. We identified two distinct lineages: an East China lineage (Central China and East China) and a Southwest China lineage ((Central China and Southwest China) and East China). These two lineages originated approximately 4.38 million years ago (Mya) in the early Pliocene due to geographic isolation. The first ribotype to differentiate from the population of P. conradinae in Central China + East China lineage was R10, belonging to the Central-China-specific ribotype, which indicated that the population of P. conradinae in Central China and East China differentiated first. The estimated differentiation time for this event was approximately 3.32 Mya (95% HPD: 1.12–5.17 Mya) during the Pliocene epoch. R11 was the earliest haplotype to diverge from a Southwest China lineage ((Central China and Southwest China) and East China). R11 belongs to a ribotype specific to East China and originated approximately 2.17 Mya (95% (HPD: 0.47–4.54 Mya). This suggests that P. conradinae may have spread to the southwest from East China. On the other hand, R3 was the first ribotype to differentiate from the lineage of Central China + Southwest China. R3 is exclusive to Central China and emerged around 1.10 Mya (95% HPD: 0.11–2.85 Mya) during the Pleistocene. This indicates that the differentiation time of P. conradinae from Central China to Southwest China was about 1.10 Mya (Figure 4B).
If a mismatch distribution analysis curve exhibits bimodal or multi-modal patterns, and the values of SSD and Hrag are low (p value of <0.05 under a transient expansion model), it suggests that the population of P. conradinae is relatively stable or gradually declining over time. Conversely, if a mismatch distribution analysis curve displays a single peak, and the values of SSD and Hrag are high (p value of >0.05), it indicates a recent population expansion event (Figure 5, Table 6). Alternatively, examining the similarity between the expected value and the observed value curves can provide insights. Greater similarity signifies a past expansion event, whereas greater dissimilarity suggests no expansion event (Figure 5). The analysis of mismatch distribution at the species level revealed that all 12 populations in the eight provinces had a double p value greater than 0.05, indicating population expansion (Table 6). At the population and geographic grouping levels, the population of P. conradinae peak was insignificant in Central China and East China but significant in Southwest China, with all p-values exceeding 0.05. These results demonstrate that both the population and the three geographic groups of P. conradinae align with expansion at the P. conradinae population and geographic levels.

3.6. Population Variation and Taxonomic Status

An optimal nucleotide replacement model, GTR + F + I + G4, was constructed using IQ-Tree, version 1.6.12, based on the BIC. Among the 18 haplotypes, H10, H14, H16, H17, and H18 were specific to MYS, GXS, WCP, FHC, and HFG, respectively. The phylogenetic analysis of nrDNA (ITS) molecular markers revealed that R6 was a specific ribotype for GXS, among 11 ribotypes examined (Table 3, Figure 6). The cpDNA sequence-binding phenotype supported the existence of two varieties (P. conradinae var. ruburm and P. conradinae var. pubescens). However, the combination of nrDNA (ITS) sequence and phenotype provided evidence in favor of P. conradinae var. ruburm as a distinct variety. Insufficient molecular evidence was found for P. conradinae var. ruburm, and no pronounced variation was observed between P. conradinae and other populations. Therefore, the results from morphological and sequence markers support a distinction between P. conradinae and P. conradinae var. pubescens [48] (Table 3, Figure 6).

4. Discussion

4.1. Genetic Diversity and Population Genetic Structure

P. conradinae is widely distributed throughout China and exhibits significant morphological diversity and phenotypic variation. Genetic differentiation among populations was observed based on cpDNA and nrDNA markers, indicating high levels of population genetic diversity in P. conradinae (Hd = 0.830; Rd = 0.798). This level of diversity surpasses the average value found in 170 other seed plant species (mean value: Hd = 0.67) [49]. High Hd of cpDNA is typically associated with a long evolutionary history and restricted gene flow between populations [50,51].
In the present study, between-population variation was more common than within-population variation, and genealogical structure was detected at the population level in all three geographic regions, albeit with low genetic differentiation coefficients. The southwestern region of China exhibited the lowest differentiation. Gene exchange was also apparent in this region, likely due to the abundance of wild cherry blossom resources in the region. In contrast, significant differentiation was detected in Central China, possibly linked to the strong adaptability of P. conradinae and seed dispersal facilitated by birds, animals, water, and wind [52].

4.2. Geographical Structure of Pedigree

The P. conradinae population was divided into two distinct lineages consisting of three geographic groups: an East China lineage (Central China and East China) and a Southwest China lineage ((Central China and Southwest China) and East China), as determined by the cpDNA and nrDNA haplotype phylogenetic tree and the TCS network map [44,45]. The phylogeographic group differentiation occurred approximately 4.38 Mya (95% HPD: 2.38–6.51 Mya) during the early Pliocene, resulting in the divergence of the two lineages due to geographic isolation [23]. Climate change in the Pliocene had a marked influence on the population expansion of P. conradinae [12]. East China lineage (Central China and East China), and R10, a ribotype specific to populations in Central China, was the first ribotype to differentiate from this lineage [21]. P. conradinae expanded from Central China to Eastern China at 3.32 Mya (95% HPD: 1.12–5.17 Mya) in the Pliocene. Another lineage, referred to as Southwest China lineage ((Central China and Southwest China) and East China), was identified. R11 was the first ribotype to differentiate from the P. conradinae population in the Southwest China lineage (East China and (Central China and Southwest China)) lineage and falls into the East-China-specific ribotype category. R11 belongs to a ribotype specific to East China and originated approximately 2.17 Mya (95% (HPD: 0.774.54 Mya). This suggests that P. conradinae may have spread to the southwest from East China and significant gene exchange between East China and Central China. This gene exchange has led to noticeable morphological variation and intraspecific genetic differentiation. The majority of the other subclades underwent divergence in the Pliocene period. Ribotype R3 marks the initial differentiation within the Central China + Southwest China lineage of the population of P. conradinae. This ribotype was exclusively found in Central China of the population of P. conradinae, with ribotype differentiation occurring round 1.10 Mya (95% HPD: 0.11–2.85 Mya) during the Pleistocene epoch. The population of P. conradinae experienced differentiation from Central China to Southwest China around 1.10 Mya (95% HPD: 0.11–2.85 Mya) during the early Pleistocene of the Quaternary period. Consequently, the formation of the distribution center and overall pattern of P. conradinae occurred during the transition from the Pliocene to the Pleistocene, aligning with predictions that the distribution center of cherry blossom was established prior to the commencement of the Quaternary glacial period.
The mountains in the Northern Hemisphere are located at middle and lower latitudes. Glacial activity during the Quaternary resulted in alternating periods of cold glaciation and warm interglacial periods, causing significant fluctuations in sea levels [53]. P. conradinae is believed to have differentiated in Southwest China. The results of the mismatch distribution analysis indicated that the population of P. conradinae and the three geographic groups did not reject the expected expansion model [54]. The haplotype distribution, diversity analysis, and TCS results pointed to the highest genetic diversity among the populations in Central China. The species of haplotype were most abundant in the southeastern region near Wuyi Mountain in Eastern China and were the most likely sanctuaries for P. conradinae. Taking into account the haplotype distribution range and diversity index analysis, it can be inferred that the southwestern region of Central China served as another refuge for P. conradinae [55].
Approximately 2.82 Mya (95% HPD: 0.77–4.98 Mya), the P. conradinae population in Central China, including Dawei Mountain and Gexian Mountain, expanded toward the southeast, including Wuyi Mountain and Qingliang Feng. Subsequently, the species spread to Dabie Mountain (R11) in the northwest of Anhui Province. The expansion of P. conradinae predominantly took place during the middle Pleistocene period [56]. This expansion stage corresponded to the third glacial age of the Quaternary glaciation period. The expansion of the P. conradinae population is believed to be attributed to climate change during the Quaternary interglacial period [57]. P. conradinae is predominantly found in cool and humid regions in Central China, East China, and Southwest China. The expansion event at this stage can be further explained by the habitat and climate characteristics of the distribution area. Therefore, P. conradinae established a distribution center and served as a refuge prior to the onset of the Quaternary glaciation, particularly in the southeastern region of Eastern China near Wuyi Mountain. Around 1.10 Mya during the Pleistocene period (95% HPD: 0.11–2.85 Mya), during an interglacial period of the Quaternary glacial stage, P. conradinae migrated from Central and Eastern China toward southwestern regions, including Heifeng Valley, Chongqing City, and Mount Emei, Sichuan Province [10,41].

5. Conclusions

In this study, to ensure the comprehensiveness of the study, we used a large sample size (12 populations comprising 244 individuals) which involved the fresh leaves of P. conradinae in Eastern, Central and Southwestern China. We combined morphological and molecular evidence (three chloroplast DNA (cpDNA) sequences and one nuclear DNA (nr DNA) sequence) to examine populations of P. conradinae variation [29]. Several studies have provided support for the existence of variant P. conradinae var. rubrum [22,23]. Central China, East China, and Southwest China were identified as the primary regions for conservation and utilization of germplasm resources of P. conradinae. Our results revealed that the genetic diversity of P. conradinae was high, with Hd = 0.830 and Rd = 0.798. We also observed genetic variation among populations of P. conradinae, as well as a genealogical geographic structure among the populations and three geographic groups. However, the genetic differentiation coefficient at each level was low. Gene exchange was evident in Southwest China, and differentiation was more pronounced in Central China. The population of P. conradinae exhibited two distinct lineages: an East China lineage (Central China and East China) and a Southwest China lineage ((Central China and Southwest China) and East China). Geographical isolation led to the occurrence of these two lineages, which can be traced back to 4.38 Mya during the early Pliocene period. P. conradinae expanded from Central China to East China at 3.32 Mya (95% HPD: 1.12–5.17 Mya) in the Pliocene. The population of P. conradinae spread from East China to Southwest China, and the differentiation time was 2.17 Mya (95% (HPD: 0.47–4.54 Mya), suggesting that the population of P. conradinae differentiated first in central and East China. The population of P. conradinae experienced differentiation from Central China to Southwest China around 1.10 Mya (95% HPD: 0.11–2.85 Mya) during the early Pleistocene of the Quaternary period. The southeastern part of Eastern China near Mount Wuyi was identified as the most plausible refuge for P. conradinae [10]. Southwestern Central China may be another possible refuge for P. conradinae. This study provides insights into the distribution prediction, phenotypic variation, classification, and phylogeography of potential suitable areas for P. conradinae [58]. The findings offer a theoretical foundation for the classification and identification of P. conradinae, as well as the protection and utilization of germplasm resources.

Supplementary Materials

The following supporting information can be downloaded at: https://www.mdpi.com/article/10.3390/plants13070974/s1, Table S1. Score coefficients of the initial three principal components in relation to 19 environmental variables; Table S2. Adaptive area of P. conradinae under different climatic conditions (×104 km2); Table S3. Haplotypes sequence variation of three cpDNA fragments was detected in P. conradinae; Table S4. NrDNA sequence polymorphisms detected of identifying 11 ribotypes in P. conradinae; Table S5. Summary of cpDNA and nrDNA-based divergence time estimation by Bayesian; Figure S1. ROC curve prediction results in MaxEnt model; Figure S2. Current climate conditions in China offer potential habitat for P. conradinae; Figure S3. P. conradinae variation in color. (A-B. P. conradinae; C-D. P. conradinae var. ruburm); Figure S4. Variation of coat of leaf in P. conradinae. (P. conradinae var. pubescens); Figure S5. P. conradinae var. pubescens in different populations.

Author Contributions

Conceptualization: J.D. Sample collection: J.D., X.Y. and X.W. Data curation: S.G., X.C., W.F., X.Z., Y.Y. and S.Q. Valuable advice: M.L., X.Y. and X.W. Writing—review and editing: J.D. All authors have read and agreed to the published version of the manuscript.

Funding

This study was funded by the Jiangsu Province Modern Agriculture Key Project [BE2020343]: Breeding and promotion of new varieties of red cherry in Yangtze River Basin. Xuzhou Science and the Xuzhou Science and Technology Project [KC21336]: Breeding, demonstration and promotion of excellent cherry variety resources in Xuzhou area.

Data Availability Statement

Data analysed in this study is publicly available at Figshare (https://figshare.com/articles/dataset/PS-DE/21904659 (accessed on 20 February 2023)) and Supplementary Materials.

Acknowledgments

We thank Yongmei Yi, Can Ma, Haozhengji Wu, Hong Yang and all the members of the Cerasus Research Center for their assistance in the field, Lin Chen, Jing Qiu, Min Zhang, Cheng Zhang, and Yao Chen for their valuable suggestions in data analysis.

Conflicts of Interest

The authors declare no conflict of interest.

References

  1. Yü, D.J.; Lu, L.T.; Ku, T.C.; Li, C.L.; Chen, S.X. Flora of China; Science Press: Beijing, China, 1986; Volume 38. [Google Scholar]
  2. Shulaev, V.; Korban, S.S.; Sosinski, B.; Abbott, A.G.; Aldwinckle, H.S.; Folta, K.M. Multiple models for Rosaceae genomics. Plant Physiol. 2008, 147, 985–1003. [Google Scholar] [CrossRef]
  3. Phipps, J.B. Flora of North America North of Mexico; Oxford University Press: Oxford, UK, 2014; Volume 9. [Google Scholar]
  4. Wang, R.X. An Illustrated Monograph of Cherry Cultivars in China; Science Press: Beijing, China, 2014; Volume 12, pp. 24–28. [Google Scholar]
  5. Chen, N.L. Evaluation of Ornamental Traits of Cerasus Species and Study on Suitable Areas of Chinese Wild Species in Zhejiang; Zhejiang Science and Technology University: Hangzhou, China, 2015. [Google Scholar]
  6. Bai, F.W.; Yu, L.; Li, H.J.; Nei, L.D.; Yan, W.J.; Wu, Z.S.; Li, C.J.; Xiao, D.J. Investigation of Cerasus resources on Dawei Mountain. Hunan For. Sci. Technol. 2019, 46, 85–90. [Google Scholar]
  7. Chen, T.; Li, L.; Zhang, J.; Huang, Z.L.; Zhang, H.W.; Liu, Y. Investigation, collection and preliminary evaluation of genetic resources of Chinese cherry [Cerasus pseudocerasus (Lindl.) G. Don]. J. Fruit Sci. 2016, 33, 917–933. [Google Scholar] [CrossRef]
  8. Potter, D.; Eriksson, T.; Evans, R.C.; Oh, S.; Smedmark, J.E.; Morgan, D.R. Phylogeny and classification of Rosaceae. Plant Syst. Evol. 2007, 266, 5–43. [Google Scholar] [CrossRef]
  9. Chen, T.; Hu, G.P.; Wang, Y.; Chen, Q.; Zhang, J.; Wang, L. Survey, collection and conservation of wild Cerasus Mill. germplasm resources in China. J. Plant Genet. Resour. 2020, 21, 532–541. [Google Scholar] [CrossRef]
  10. Zhang, S.D.; Jin, J.J.; Chen, S.Y.; Chase, M.W.; Soltis, D.E.; Li, H.T. Diversification of Rosaceae since the Late Cretaceous based on plastid phylogenomics. New Phytol. 2017, 214, 1355–1367. [Google Scholar] [CrossRef]
  11. Aranzana, M.J.; Decroocq, V.; Dirlewanger, E.; Eduardo, I.; Gao, Z.S.; Gasic, K. Prunus genetics and applications after de novo genome sequencing: Achievements and prospects. Hortic. Res. 2019, 6, 58. [Google Scholar] [CrossRef]
  12. Chen, F.; Song, Y.F.; Li, X.J.; Chen, J.H.; Mo, L.; Zhang, X.T. Genome sequences of horticultural plants: Past, present, and future. Hortic. Res. 2019, 6, 112. [Google Scholar] [CrossRef]
  13. Yu, L.; Li, H.J.; Bai, F.W.; Nei, D.L.; Zhang, X.W.; Wu, Z.S.; Han, L.X. Investigation and Utilization Evaluation of Wild Cerasus Resources in Daxiong Mountain of Hunan Province. For. Environ. Sci. 2019, 35, 38–43. [Google Scholar]
  14. Nybom, H.; Weising, K.; Rotter, B. DNA fingerprinting in botany: Past, present, future. Investig. Genet. 2014, 5, 1. [Google Scholar] [CrossRef]
  15. Avise, J.C.; Arnold, J.; Ball, R.M.; Bermingham, E.; Lamb, T.; Neigel, J.E.; Reeb, C.A.; Saunders, N.C. Intraspecific phylogeography: The mitochondrial DNA bridge between population genetics and systematics. Annu. Rev. Ecol. Syst. 1987, 18, 489–522. [Google Scholar] [CrossRef]
  16. Avise, J.C. Phylogeography: The History and Formation of Species; Harvard University Press: Cambridge, MA, USA, 2000. [Google Scholar]
  17. Vander Wall, S.B.; Beck, M.J. A comparison of frugivory and scatter-hoardin seed- dispersal syndromes. Bot. Rev. 2012, 78, 10–31. [Google Scholar] [CrossRef]
  18. Perdereau, A.C.; Kelleher, C.T.; Douglas, G.C.; Hodkinson, T.R. High levels of gene flow and genetic diversity in Irish populations of Salix caprea L. inferred from chloroplast and nuclear SSR markers. BMC Plant Biol. 2014, 14, 202. [Google Scholar] [CrossRef]
  19. Chan, L.M.; Brown, J.L.; Yoder, A.D. Integrating statistical genetic and geospatial methods brings new power to phylogeography. Mol. Phylogenet. Evol. 2011, 59, 523–537. [Google Scholar] [CrossRef]
  20. Phillips, S.; Dudík, M.; Schapire, R. A maximum entropy approach to species distribution modeling. In Proceedings of the Twenty-First International Conference on Machine Learning, Banff, AB, Canada, 4–8 July 2004; ACM: New York, NY, USA, 2004. [Google Scholar]
  21. Turkoglu, Z.; Bilgener, S.; Ercisli, S.; Bakir, M.; Koc, A.; Akbulut, M.; Gercekcioglu, R.; Gunes, M.; Esitken, A. Simple sequence repeat-based assessment of genetic relationships among Prunus rootstocks. Genet. Mol. Res. 2010, 9, 2156–2165. [Google Scholar] [CrossRef]
  22. Bai, N.W.; Zhang, Y.D. Current status and future directions in plant phylogeography. Chin. Bull. Life Sci. 2014, 26, 125–137. [Google Scholar] [CrossRef]
  23. Yi, G.X.; Yu, X.; Chen, J.; Zhang, M.; Liu, S.W.; Zhu, H.; Li, M.; Duan, Y.F.; Chen, L.; Wu, L.; et al. The genome of Chinese flowering cherry (Cerasus serrulata) provides new insights into Cerasus species. Hortic. Res. 2020, 7, 14. [Google Scholar] [CrossRef]
  24. Qiu, J.; Zhu, H.; Chen, X. Modeling the suitable areas and ecological characteristics of Sorbus alnifolia using DIVA-GIS software. J. Beijing For. Univ. 2018, 40, 25–32. [Google Scholar]
  25. Zhu, H.; You, L.X.; Li, F.Y. Modeling the Geographical Distribution Pattern and Climatic Limited Factors of Cerasus schneideriana. J. Trop. Subtrop. Bot. 2017, 25, 315–322. [Google Scholar] [CrossRef]
  26. Garah, K.; Bentouati, A. Using the MaxEnt model for assessing the impact of climate change on the Aurasian Aleppo pine distribution in Algeria. Afr. J. Ecol. 2019, 57, 500–511. [Google Scholar] [CrossRef]
  27. Heckenhauer, J.; Barfuss, M.; Samuel, R. Universal multiplexable matK primers for DNA barcoding of angiosperms. Appl. Plant Sci. 2016, 4, 14. [Google Scholar] [CrossRef] [PubMed]
  28. Feng, Y.; Liu, T.; Wang, X.Y.; Li, B.B.; Liang, C.; Cai, Y. Characterization of the complete chloroplast genome of the Chinese cherry Prunus pseudocerasus, (Rosaceae). Conserv. Genet. Resour. 2018, 10, 85–88. [Google Scholar] [CrossRef]
  29. Yi, G.X. Study on Population Variation and Phylogeography of Cerasus Serrulata; Nanjing Forestry University: Nanjing, China, 2018. [Google Scholar]
  30. Katoh, K.; Standley, D.M. MAFFT multiple sequence alignment software version 7: Improvements in performance and usability. Mol. Biol. Evol. 2013, 30, 772–780. [Google Scholar] [CrossRef] [PubMed]
  31. Librado, P.; Rozas, J. DnaSP v5: A software for comprehensive analysis of DNA polymorphism data. Bioinformatics 2009, 25, 1451–1452. [Google Scholar] [CrossRef] [PubMed]
  32. Nei, M. Molecular Evolutionary Genetics; Columbia University Press: New York, NY, USA, 1987. [Google Scholar]
  33. Excoffier, L.; Lischer, H.E. Arlequin suite version 3.5: A new series of programs to perform population genetics analyses under Linux and Windows. Mol. Ecol. Resour. 2010, 10, 564–567. [Google Scholar] [CrossRef] [PubMed]
  34. Clement, M.; Podada, D.; Crandall, K.A. TCS: A computer program to estimate gene genealogies. Mol. Ecol. 2000, 9, 1657–1659. [Google Scholar] [CrossRef] [PubMed]
  35. Tajima, F. Statistical method for testing the neutral mutation hypothesis by DNA polymorphism. Genetics 1989, 123, 585–595. [Google Scholar] [CrossRef] [PubMed]
  36. Harpending, H.C. Signature of ancient population growth in a low- resolution mitochondrial DNA mismatch distribution. Hum. Biol. 1994, 66, 591–600. [Google Scholar]
  37. Drummond, A.J.; Rambaut, A. BEAST: Bayesian evolutionary analysis by sampling trees. BMC Evol. Biol. 2007, 7, 214. [Google Scholar] [CrossRef]
  38. Nogués-Bravo, D. Predicting the past distribution of species climatic niches. Glob. Ecol. Biogeogr. 2009, 18, 521–531. [Google Scholar] [CrossRef]
  39. Nguyen, L.T.; Schmidt, H.A.; von Haeseler, A.; Minh, B.Q. IQ-TREE: A fast and effective stochastic algorithm for estimating maximum-likelihood phylogenies. Mol. Biol. Evol. 2015, 32, 268–274. [Google Scholar] [CrossRef] [PubMed]
  40. Darriba, D.; Taboada, G.L.; Doallo, R.; Posada, D. jModelTest 2: More models, new heuristics and parallel computing. Nat. Methods 2012, 9, 772. [Google Scholar] [CrossRef] [PubMed]
  41. Zhang, J.; Wang, Y.; Chen, T.; Chen, Q.; Wang, L.; Liu, Z.S.; Wang, H.; Xie, R.; He, W.; Li, M.; et al. Evolution of Rosaceae Plastomes Highlights Unique Cerasus Diversification and Independent Origins of Fruiting Cherry. Front. Plant Sci. 2021, 12, 736053. [Google Scholar] [CrossRef] [PubMed]
  42. Wehr, W.C.; Hopkins, D.Q. The Eocene orchards and gardens of Republic, Washington. Wash. Geol. 1994, 22, 27–34. [Google Scholar]
  43. Xiang, Y.Z.; Huang, C.H.; Hu, Y.; Wen, J.; Li, S.S.; Yi, T.S.; Chen, H.; Xiang, J.; Ma, H. Evolution of Rosaceae fruit types based on nuclear phylogeny in the context of geological times and genome duplication. Mol. Biol. Evol. 2017, 34, 262–281. [Google Scholar] [CrossRef] [PubMed]
  44. Li, Y.; Smith, T.; Liu, C.J.; Awasthi, N.; Yang, J.; Wang, Y.F.; Cheng, S.L. Endocarps of Prunus (Rosaceae: Prunoideae) from the early Eocene of Wutu, Shandong Province, China. Taxon 2011, 60, 555–564. [Google Scholar] [CrossRef]
  45. Chin, S.W.; Shaw, J.; Haberle, R.; Wen, J.; Potter, D. Diversification of almonds, peaches, plums and cherries-molecular systematics and biogeographic history of Prunus (Rosaceae). Mol. Phylogenet. Evol. 2014, 76, 34–48. [Google Scholar] [CrossRef]
  46. Rambaut, A. FigTree 2009, 1.3.1. Available online: http://tree.bio.ed.ac.uk/software/figtree (accessed on 20 February 2023).
  47. Verde, I.; The International Peach Genome Initiative; Abbott, A.G.; Scalabrin, S.; Jung, S.; Shu, S.; Marroni, F.; Zhebentyayeva, T.; Dettori, M.T.; Grimwood, J.; et al. The high-quality draft genome of peach (Prunus persica) identifies unique patterns of genetic diversity, domestication and genome evolution. Nat. Genet. 2013, 45, 487–494. [Google Scholar] [CrossRef]
  48. Hodel, R.; Zimmer, E.; Wen, J. A phylogenomic approach resolves the backbone of Prunus (Rosaceae) and identifies signals of hybridization and allopolyploidy. Mol. Phylogenet. Evol. 2021, 160, 107118. [Google Scholar] [CrossRef]
  49. Petit, R.J.; Duminil, J.; Fineschi, S.; Hampe, A.; Salvini, D.; Vendramin, G.G. Invited review: Comparative organization of chloroplast, mitochondrial and nuclear diversity in plant populations. Mol. Ecol. 2005, 14, 689–701. [Google Scholar] [CrossRef]
  50. Varvio, S.L.; Chakraborty, R.; Nei, M. Genetic variation in subdivided populations and conservation genetics. Heredity 1986, 57, 189–198. [Google Scholar] [CrossRef]
  51. Qiu, Y.X.; Guan, B.C.; Fu, C.X.; Comes, H.P. Did glacials and/or interglacials promote allopatric incipient speciation in East Asian temperate plants? Phylogeographic and coalescent analyses on refugial isolation and divergence in Dysosma versipellis. Mol. Phylogenet. Evol. 2009, 51, 281–293. [Google Scholar] [CrossRef]
  52. Zhang, Q.; Chiang, T.; George, M.; Liu, J.Q.; Abbott, R.J. Phylogeography of the Qinghai-Tibetan Plateau endemic Juniperus przewalskii (Cupressaceae) inferred from chloroplast DNA sequence variation. Mol. Ecol. 2010, 14, 3513–3524. [Google Scholar] [CrossRef] [PubMed]
  53. Hewitt, G.M. Post-glacial re-colonization of European biota. Biol. J. Linn. Soc. 1999, 68, 87–112. [Google Scholar] [CrossRef]
  54. Wang, Y.H.; Jiang, W.M.; Hans, P.C.; Hu, F.S.; Qiu, Y.-X.; Fu, C.-X. Molecular phylogeography and ecological niche modelling of a widespread herbaceous climber, Tetrastigma hemsleyanum (Vitaceae): Insights into Plio-Pleistocene range dynamics of evergreen forest in subtropical China. New Phytol. 2015, 206, 852–867. [Google Scholar] [CrossRef]
  55. Qiu, X.Y.; Lu, X.Q.; Zhang, H.Y.; Cao, N.Y. Phylogeography of East Asia’s Tertiary relict plants: Current progress and future prospects. Biodivers. Sci. 2017, 25, 136–146. [Google Scholar] [CrossRef]
  56. Arenas, M.; Ray, N.; Currat, M.; Excoffier, L. Consequences of range contractions and range shifts on molecular diversity. Mol. Biol. Evol. 2012, 29, 207–218. [Google Scholar] [CrossRef]
  57. Mona, S.; Ray, N.; Arenas, M.; Excoffier, L. Genetic consequences of habitat fragmentation during a range expansion. Heredity 2014, 112, 291–299. [Google Scholar] [CrossRef]
  58. Alvarado-Serrano, D.F.; Knowles, L.L. Ecological niche models in phylogeographic studies: Applications, advances and precautions. Mol. Ecol. Resour. 2014, 14, 233–248. [Google Scholar] [CrossRef]
Figure 1. (AD) The potential adaptive areas of P. conradinae under different climate change scenarios (RCP2.6, RCP4.5, RCP6.0, and RCP8.5) in the 2050s, as determined by the MaxEnt model. (EH) The potential adaptive area of P. conradinae in the 2070s, as predicted by the MaxEnt model, is explored under various climate change scenarios: RCP2.6, RCP4.5, RCP6.0, and RCP8.5.
Plants 13 00974 g001
Figure 2. (A) The distribution range of P. conradinae in China and the potential habitat for P. conradinae in China under current climatic conditions. (B) The locations of the 12 natural populations and the geographic distribution of the 18 cpDNA haplotypes (H1–H18) are depicted in pie charts, where the size of each chart corresponds to the number of individuals sampled. (C) The TCS network illustrates the interrelationships among haplotypes, with circles representing each haplotype and colors corresponding to their respective populations. The size of each pie chart is proportionate to the frequency of its associated haplotype.
Plants 13 00974 g002
Figure 3. (A) The distribution range of P. conradinae in China and the potential habitat for P. conradinae in China under current climatic conditions. (B) The locations of the 12 natural populations and the geographic distribution of 11 nrDNA Ribotypes (R1–R11) are depicted in pie charts, with the size of each chart corresponding to the number of individuals sampled. (C) The TCS network visually depicts the interrelationships among Ribotypes, which are represented by circles. The colors of these circles correspond to their representation across all populations. Additionally, the size of each pie chart accurately reflects the frequency of its respective Ribotype. (D) The Bayesian phylogenetic tree of Ribotypes size is constructed based on nrDNA (ITS) sequences.
Plants 13 00974 g003
Figure 4. (A) The complete chloroplast genome was utilized to determine the divergence time of various Rosaceae species based on five divergence time nodes. (B) The construction of nrDNA (ITS) ribosomal divergence time of P. conradinae is based on two nodes representing differentiation events.
Plants 13 00974 g004
Figure 5. (AD) Mismatch distribution map of distinct geographical lineages (groups) of P. conradinae based on nrDNA fragment. (EH) The mismatch distribution map of distinct geographical groups (lineages) of P. conradinae is generated based on cpDNA fragment analysis.
Plants 13 00974 g005
Figure 6. (A) The cladograms of P. conradinae haplotypes are constructed based on the cpDNA (MatK, TrnD-E, TrnL-F) sequence. (B) The cladograms of P. conradinae ribotypes are constructed based on the nrDNA (ITS) sequence.
Plants 13 00974 g006
Table 1. Voucher information and geographic characteristics of 12 populations of P. conradinae.
TaxaCodeCountryLocationGPSAltitude/mSample Size
P. conradinaeEMSChinaMount Emei, Leshan City,
Sichuan Province
103.4680 E
29.5770 N
68014
HFGChinaHeifeng Valley, Heishan Town,
Chongqing City
106.9800 E
28.8690 N
58026
DWSChinaDawei Mountain, Changsha City,
Hunan Province
114.1640 E
28.3620 N
69230
MYSChinaMingyue Mountain, Yichun City,
Jiangxi Provin
114.2970 E
27.5870 N
11008
DBSChinaDabie Mountain, Lu ‘an City,
Anhui Province
116.2010 E
31.1300 N
89021
WYSChinaWuyi Mountain, Nanping City,
Fujian Province
117.9630 E
27.6680 N
98011
QLFChinaQingliangfeng Peak, Lin ‘an City,
Zhejiang Province
118.9140 E
30.1150 N
105017
ZXTCChinaTianchi Lake, West Zhejiang, Lin ‘an City,
Zhejiang Province
119.1270 E
30.3000 N
120018
DYHChinaDayang Lake in Lishui City,
Zhejiang Province
119.7480 E
27.8740 N
123019
P. conradinae var. ruburmFHCChinaPhoenix Pool, Yichang City,
Hubei Province
111.8470 E
31.1440 N
78026
GXSChinaGexian Mountain, Xianning City,
Hubei Province
114.0710 E
29.6380 N
68028
P. conradinae var. pubescensWCPChinaWangcheng slope, Enshi Autonomous Prefecture,
Hubei Province
109.4520 E
30.3480 N
85026
Table 2. Fossils and molecular estimation used as calibration points for molecular dating.
NodeMean Values/Standard Deviation
Used at Calibration Points
References
N1# Rosaceae Crown90.18/0.05Zhang et al., 2017 [38]
N2# (Tribe Maleae + Tribe Spiraeeae) + 75.62/0.05Zhang et al., 2017; Zhang et al., 2021 [10,41]
        Tribe Amygdaleae
N3# Tribe Amygdaleae68.58/0.01Wehr and Hopkins, 1994; Xiang et al., 2017; Zhang et al., 2021 [41,42,43]
N4# Node Prunus 55.0/0.09Li et al., 2011; Chin et al., 2014 [44,45]
N5# Node Sub.g Cerasus28.21/0.05Zhang et al., 2021 [41]
Table 3. Distribution of haplotypes (ribotypes) in P. conradinae among individuals, populations, and glaciated/unglaciated regions of China.
HaplotypesNumber of
Individuals
Frequencies in
Individuals(%)
Number of
Populations
Frequencies in
Populations(%)
Geographical
Distributions
Hap17430.33%758.33%GXS DWS MYS DBS WYS QLF ZXTC
Hap241.64%18.33%GXS
Hap3176.97%325.00%WYS QLF ZXTC
Hap493.69%433.33%DWS WYS QLF ZXTC
Hap531.23%216.67%WYS QLF
Hap683.28%325.00%DWS ZXTC DYH
Hap76024.59%866.67%EMS HFG WCP FHC GXS MYS WYS DYH
Hap862.46%433.33%HFG WCP FHC GXS
Hap962.46%216.67%FHC DYH
Hap1020.82%18.33%MYS
Hap1120.82%216.67%GXS DWS
Hap1241.64%216.67%GXS DWS
Hap1352.05%18.33%GXS
Hap1452.05%18.33%GXS
Hap15239.43%433.33%EMS HFG WCP FHC
Hap1672.87%18.33%WCP
Hap1772.87%18.33%FHC
Hap1820.82%18.33%HFG
RibotypesNumber of
individuals
Frequencies in
individuals(%)
Number of
populations
Frequencies in
populations(%)
Geographical
Distributions
Rib 14719.75%433.33%EMS HFG WCP FHC
Rib 2166.72%325.00%EMS HFG WCP
Rib 32811.76%216.67%WCP FHC
Rib 48535.71%758.33%GXS DWS MYS WYS QLF ZXTC DYH
Rib 5229.24%650.00%GXS MYS WYS QLF ZXTC DYH
Rib 641.68%18.33%GXS
Rib 720.84%216.67%GXS DYH
Rib 831.26%325.00%GXS WYS QLF
Rib 941.68%325.00%GXS WYS DYH
Rib1020.84%18.33%MYS
Rib112510.50%433.33%DBS QLF ZXTC DYH
Table 4. Genetic characteristics of 12 P. conradinae populations studied.
Population CodePop. SizeHdPi × 10−3Haplotypes/Ribotypes (no. of Individuals)
Genetic diversity parameters of sampled populations and their chloroplast genes
1EMS1 40.5380.680H7(9)H13(1)H15(4)
2HFG260.6830.960H7(15)H8(2)H15(7)H18(2)
3WCP260.6860.810H7(10)H15(9)H16(7)
4FHC260.7851.780H7(10)H8(1)H9(5)H15(3)H17(7)
5GXS280.6800.540H1(15)H2(1)H7(1)H11(1)H12(1)H13(4)H14(5)
6DWS300.6870.950H1(21)H4(1)H6(3)H8(1)H11(1)H12(3)
7MYS80.6070.690H1(5)H7(1)H10(2)
8DBS210.2570.230H1(18)H2(3)
9WYS110.8361.113H1(4)H3(2)H4(2)H5(2)H7(1)
10QLF170.5001.070H1(2)H3(12)H4(2)H5(1)
11ZXTC180.6991.010H1(9)H3(3)H4(4)H6(2)
12DYH190.5260.700H6(3)H7(13)H8(2)H9(1)
Southwest China 400.6271.050H7(24)H8(2)H13(1)H15(11)H18(2)
Central China 1100.8661.240H1(41)H2(1)H7(21)H8(2)H9(5)H11(2)H12(4)
H13(4)H14(5)H15(12)H16(7)H17(7)
East China 940.7741.150H1(36)H2(1)H4(1)H6(3)H7(21)H8(2)H9(5)H10(2)
Mean 0.6230.878
All2440.8301.04
Genetic diversity parameters of sampled populations and their nuclear genes (ITS)
1EMS150.5330.186R1(7), R2(8)
2HFG240.4310.150R1(17), R2(7)
3WCP260.5380.115R1(10), R2(1), R3(15)
4FHC260.5200.091R1(13), R3(13)
5GXS280.6670.325R4(15), R5(6), R6(4), R7(1), R8(1), R9(1)
6DWS250.0800.014R4(24), R10(1)
7MYS80.2500.044R4(7), R5(1)
8DBS210.0000.000R11(21)
9WYS110.5640.120R4(7), R5(3), R8(1)
10QLF170.7280.311R4(7), R5(6), R8(1), R9(2), R11(1)
11ZXTC180.4640.368R4(13), R5(3), R11(2)
12DYH190.5790.269R4(12), R5(4), R7(1), R9(1), R11(1)
Southwest China 390.4860.169R1(24), R2(15)
Central China 1050.7450.756R1(23), R2(1), R3(28), R4(39), R5(6), R6(4), R7(1), R8(1), R9(1), R10(1)
East China 940.6660.669R4(46), R5(17), R7(1), R8(2), R9(3), R11(25)
All2380.7980.886R1(24), R2(15)
Table 5. Analyses of molecular variance (AMOVAs) based on cpDNA and nrDNA data for populations of P. conradinae.
Source of Variationd.f.Sum of
Squares
Variance
Components
Percentage
of Variation
Fixation IndicesGST/NST
chloroplast DNA fragments
All groups
Among populations111560.5316.6996448.89FST = 0.488860.28176/0.29843
(p < 0.05)
Within populations2321625.1617.00501 51.11
Southwest China
Among populations10.4020.1090 11.01FST = 0.081260.072/0.081
(p < 0.05)
Within populations3836.6510.96451 88.99
Central China
Among populations327.0650.29098 22.04FST = 0.220380.18051/0.22810
(p < 0.05)
Within populations106109.1161.02940 77.96
East China
Among populations51173.34914.1644946.05FST = 0.460460.30473/0.33970
(p < 0.05)
Within populations881460.53416.5969853.95
Southwest & Central & East
Among regions2359.2030.42291 3.06FSC = 0.47782
Within regions91201.3286.41002 46.32FST =0.49378
Within populations2321625.1617.00501 50.62FCT =0.03056
nuclear DNA fragments
All groups
Among populations11499.2512.2834182.51FST = 0.749180.37339/0.74924
Within populations226109.3800.48398 17.49 (p < 0.05)
Southwest China
Among populations11.2130.03707 6.55FST = 0.061570.03221/0.06157
Within populations3719.5560.52853 93.45 (p < 0.05)
Central China
Among populations3255.1253.23420 94.38FST = 0.856630.38164/0.85743
Within populations10119.4510.19258 5.62 (p < 0.05)
East China
Among populations5126.3561.60432 73.73FST = 0.737340.29616/0.55987
Within populations8850.2930.57151 26.27 (p < 0.05)
Southwest & Central & East
Among regions2197.7750.46342 16.51FSC = 0.67382
Within regions12577.4261.57873 56.25FST = 0.72768
Within populations461352.3170.76424 27.23FCT = 0.16513
FCT: Proportion of genetic variation among groups. FSC: Proportion of genetic variation between populations within groups. FST: Proportion of genetic variation between populations and groups overall.
Table 6. Neutrality and population expansion tests for P. conradinae.
GroupsTajima’s D
(p-Value)
Fu’s Fs
(p-Value)
Demographic ExpansionSpatial Expansion
(SSD)
(p-Value)
Raggedness Index (p-Value)(SSD)
(p-Value)
Raggedness Index (p-Value)
Based on the detection results of chloroplast DNA fragments
12 populations 244 individuals0.099000.100000.388000.442000.269000.43600
Southwest China0.264000.642000.149000.100000.193000.27900
Central China0.244000.080000.124000.391000.254000.43400
East China0.408000.509000.685000.842000.557000.87500
Based on the detection results of nuclear DNA fragments
12 populations 238 individuals0.35291N.A.0.177720.033000.085000.12093
Southwest China1.000000.953000.323240.000000.124000.32879
Central China0.986000.791000.127640.029000.219000.17021
East China0.62164N.A.0.284500.118000.561000.39557
Disclaimer/Publisher’s Note: The statements, opinions and data contained in all publications are solely those of the individual author(s) and contributor(s) and not of MDPI and/or the editor(s). MDPI and/or the editor(s) disclaim responsibility for any injury to people or property resulting from any ideas, methods, instructions or products referred to in the content.

