
Fine Mapping of qAL5.2 Controlling Anther Length in Oryza sativa
by
 , , ,
, , ,
Xinyong Liu
1,2,†, 
Zixuan Yu
1,†,
Xiaohong Tong
1,
Longxue Chang
1,
Jie Huang
1,
Yifeng Wang
1,
Jiezheng Ying
1,
Xingwang Li
2,
Shen Ni
1,* and
Jian Zhang
1,* 1
State Key Laboratory of Rice Biology and Breeding, China National Rice Research Institute, Hangzhou 311400, China
2
College of Life Science and Technology, Huazhong Agricultural University, Wuhan 430070, China
*
Authors to whom correspondence should be addressed.
†
These authors contributed equally to this article.
Plants 2024, 13(8), 1130; https://doi.org/10.3390/plants13081130
Submission received: 8 March 2024
/
Revised: 8 April 2024
/
Accepted: 16 April 2024
/
Published: 18 April 2024
(This article belongs to the Special Issue Research on Plant Genomics and Breeding 2023)
Abstract
:Anther length is the critical floral trait determining hybrid rice seed production and is controlled by many quantitative trait loci (QTL). However, the cloning of genes specifically controlling anther size has yet to be reported. Here, we report the fine mapping of qAL5.2 for anther size using backcross inbred lines (BILs) in the genetic background of Oryza sativa indica Huazhan (HZ). Gene chip analysis on the BC4F2 and BC5F1 population identified effective loci on Chr1, Chr5, and Chr8 and two genomic regions on Chr5, named qAL5.1 and qAL5.2. qAL5.2 was identified in both populations with LOD values of 17.54 and 10.19, which explained 35.73% and 25.1% of the phenotypic variances, respectively. Ultimately qAL5.2 was localized to a 73 kb region between HK139 and HK140 on chromosome 5. And we constructed two near-isogenic lines (NILs) for RNA-seq analysis, named NIL-qAL5.2HZ and NIL-qAL5.2KLY, respectively. The result of the GO enrichment analysis revealed that differential genes were significantly enriched in the carbohydrate metabolic process, extracellular region, and nucleic acid binding transcription, and KEGG enrichment analysis revealed that alpha-linolenic acid metabolism was significantly enriched. Meanwhile, candidate genes of qAL5.2 were analyzed in RNA-seq, and it was found that ORF8 is differentially expressed between NIL-qAL5.2HZ and NIL-qAL5.2KLY. The fine mapping of qAL5.2 conferring anther length will promote the breed improvement of the restorer line and understanding of the mechanisms driving crop mating patterns.
1. Introduction
Rice is one of the most populous crops in the world, and hybrid rice technology is an important technique for improving rice yield. Hybrid rice technology breaks the limitations of self-pollinating crops, using outcrossing pollination between restoring and sterile lines to obtain offspring and exhibiting strong heterosis in F1 generation, which can significantly improve rice yield [1]. Hybrid rice technology mainly includes the “three-line system” and the “two-line system”. The earliest hybrid varieties were obtained through the three-line system. Hybrid varieties developed with a three-line (CMS, maintainer, and restorer) system can improve 20–40% higher yields and are widely recommended since 1976 in China [1].
Three-line hybrid technology includes rice cytoplasmic male sterile lines, a rice cytoplasmic male sterile maintainer line, and a rice cytoplasmic male sterile restorer line [2,3]. WA352 and Rf4 were the first genes to be cloned from wild abortive cytoplasmic male sterility (CMS-WA) [4,5]. It consists of two main steps, first breeding the female sterile parent by crossing the sterile line with the maintainer line and then crossing the sterile line with the restorer line to produce the F1 hybrid seed. In subsequent research, scientists discovered the photoperiod/thermo-sensitive male sterile lines and achieved “two-line system” technology without the maintainer line, which effectively simplified the process of hybrid rice seed production [6,7]. Since rice is a self-pollinating crop and needs to be pollinated artificially, enough restorer lines should be planted to ensure that the sterile line can obtain sufficient pollen to complete fertilization, whether the three-line system or the two-line system [8]. However, the overplanting of restorer lines will reduce the area of sterile lines, causing a decrease in the yield of hybrid seed production. In recent years, the high labor cost and low yield in hybrid rice seed production led to high seed prices, severely limiting the promotion and application of hybrid rice [9,10].
Improving the anther size of the restoring line or the exsertion rate of the sterile line stigma can effectively increase the yield of hybrid seed production [11]. Some researchers have detected QTL for anther length by different populations. Tazib et al. detected four major QTL located on chromosomes 2, 3, 5, and 7 through backcross inbred lines derived from the backcrossing of the rice cultivars (Nipponbare × Kasalath) × Nipponbare [12]. Four QTL for anther length were also detected on chromosomes 2, 3, and 8 by populations derived from a cross between an indica (SPR1) and a common wild rice [13]. Recently, some new anther QTL were identified by the advanced backcross line of O. longistaminata accession W1508 and chromosomal segment substitution lines in the genetic background of O. sativa Taichung 65 and found anther size was regulated by cell elongation and cell proliferation in two different ways [14]. However, the region of these QTL is too rough for accurate mapping, making it challenging to apply in hybrid seed production.
In this study, we detected six QTL by backcross inbred lines derived from two rice cultivars HZ and Koliya (KLY). And qAL5.2 was narrowed down to a 73 kb region by fine mapping. Regulatory pathways of anther size were analyzed by RNA-seq, and it was revealed that anther size might be regulated by pathways related to alpha-linolenic acid metabolism.
2. Results
2.1. Anther Morphology of NIL-HZ and NIL-KLY
To discover probable quantitative trait loci (QTL) controlling anther length, we investigated the parental phenotype of the restore line Huazhan (HZ, Oryza sativa ssp. Indica) and Koliya (KLY) from south-east Asia (Figure 1). The anther length of HZ and KLY were 1.96 ± 0.04 mm and 2.53 ± 0.09 mm, respectively. However, KLY exhibits much shorter grain length than HZ (Figure 1F). The grain length of KLY was only 6.5 mm, which is 23% shorter than that of HZ, resulting in a much higher anther/glume length ratio (Figure 1E,F). Subsequently, we constructed a mapping population and the near-isogenic line (NIL) using anther length as the trait for selection (Figure S1). At the same time, we investigated the phenotype of NIL-HZ and NIL-KLY derived from BC4F1 with the genetic background of HZ (Figure 2). The anther length of NIL-HZ and NIL-KLY were 2.00 ± 0.1 mm and 2.52 ± 0.05 mm, respectively (Figure 2C,D). At the same time, there were no noticeable significant differences in anther width, 1000-grain weight, grain length, or grain width but there were in plant height (Figure 2E–I).
2.2. Effects of qAL5.2 for Anther Length
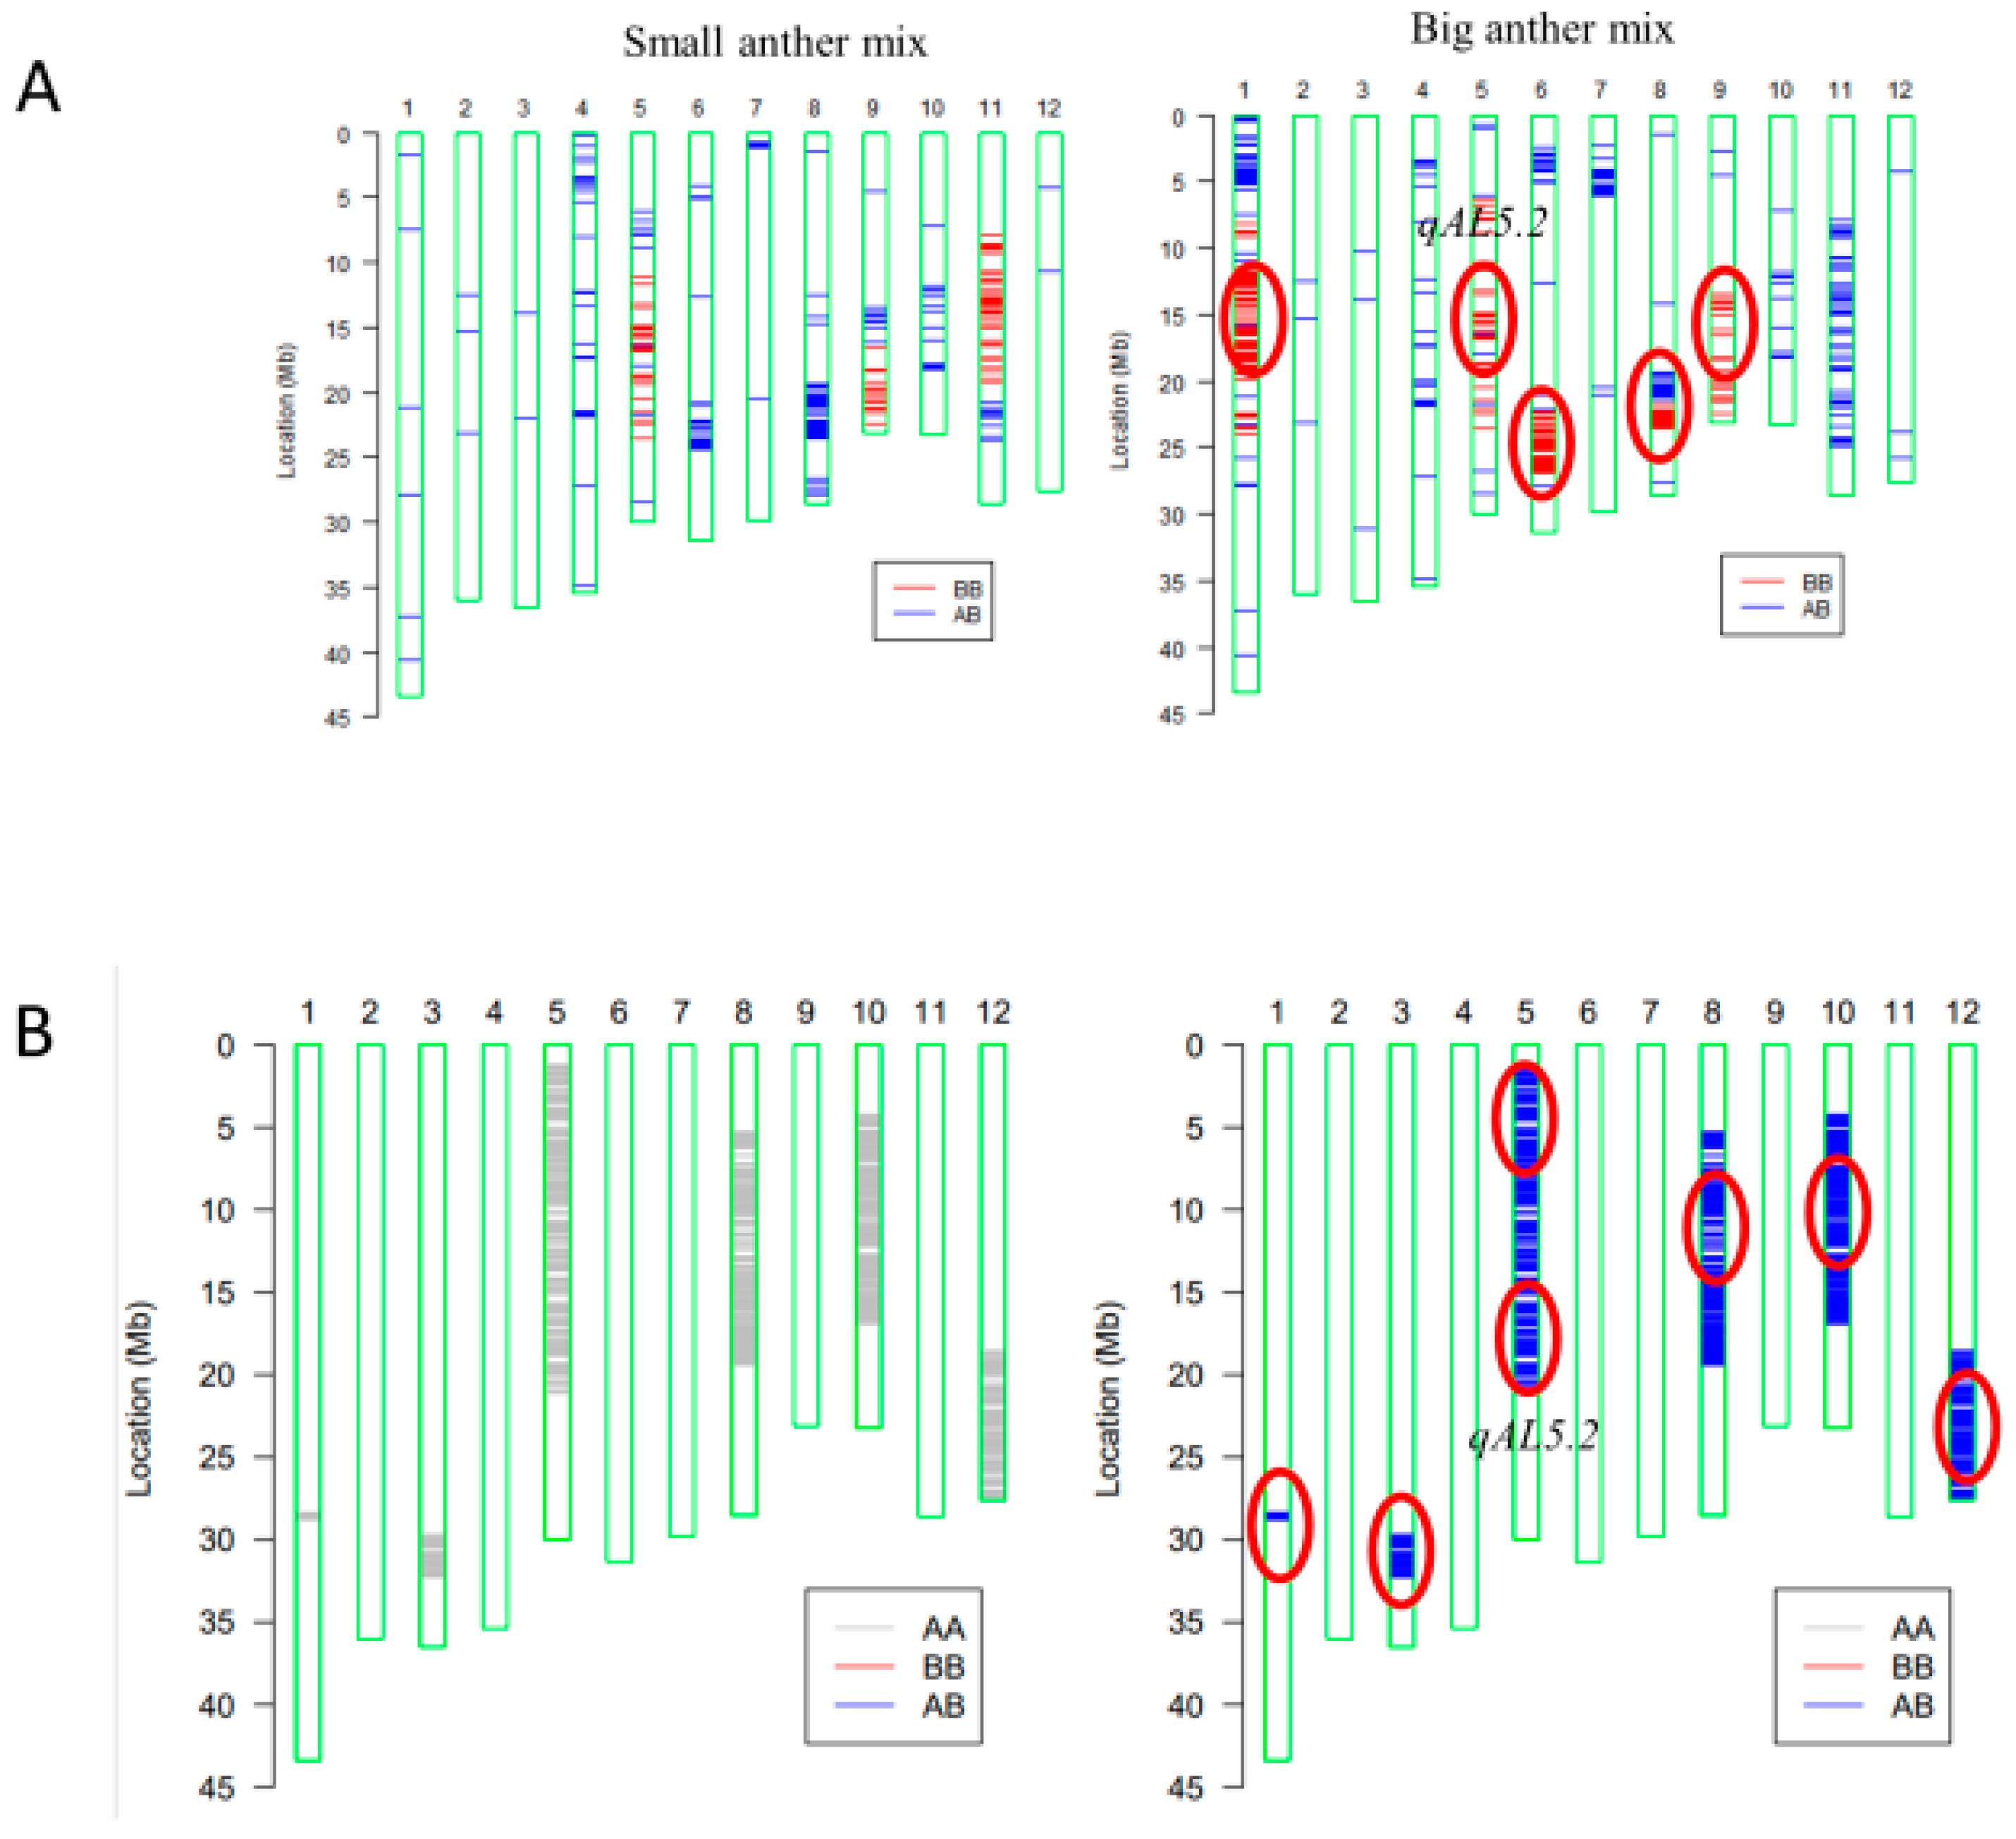
For mapping quantitative trait loci (QTL) of anther length, the BC4F2 population was constructed with the genetic background of HZ (Figure S1). BC4F2 individuals with extremely large or small anthers were pool sampled, respectively, for gene chip analysis (Figure 3A). In the BC4F2 population (n = 20), five loci on Chr1-1, Chr5, Chr6, Chr8-1, and Chr9 (Figure 3A) were detected. Subsequently, six loci were detected on Chr1-2, Chr3, Chr5, Chr8-2, Chr10, and Chr12 in the BC5F1 population (n = 10) (Figure 3B).
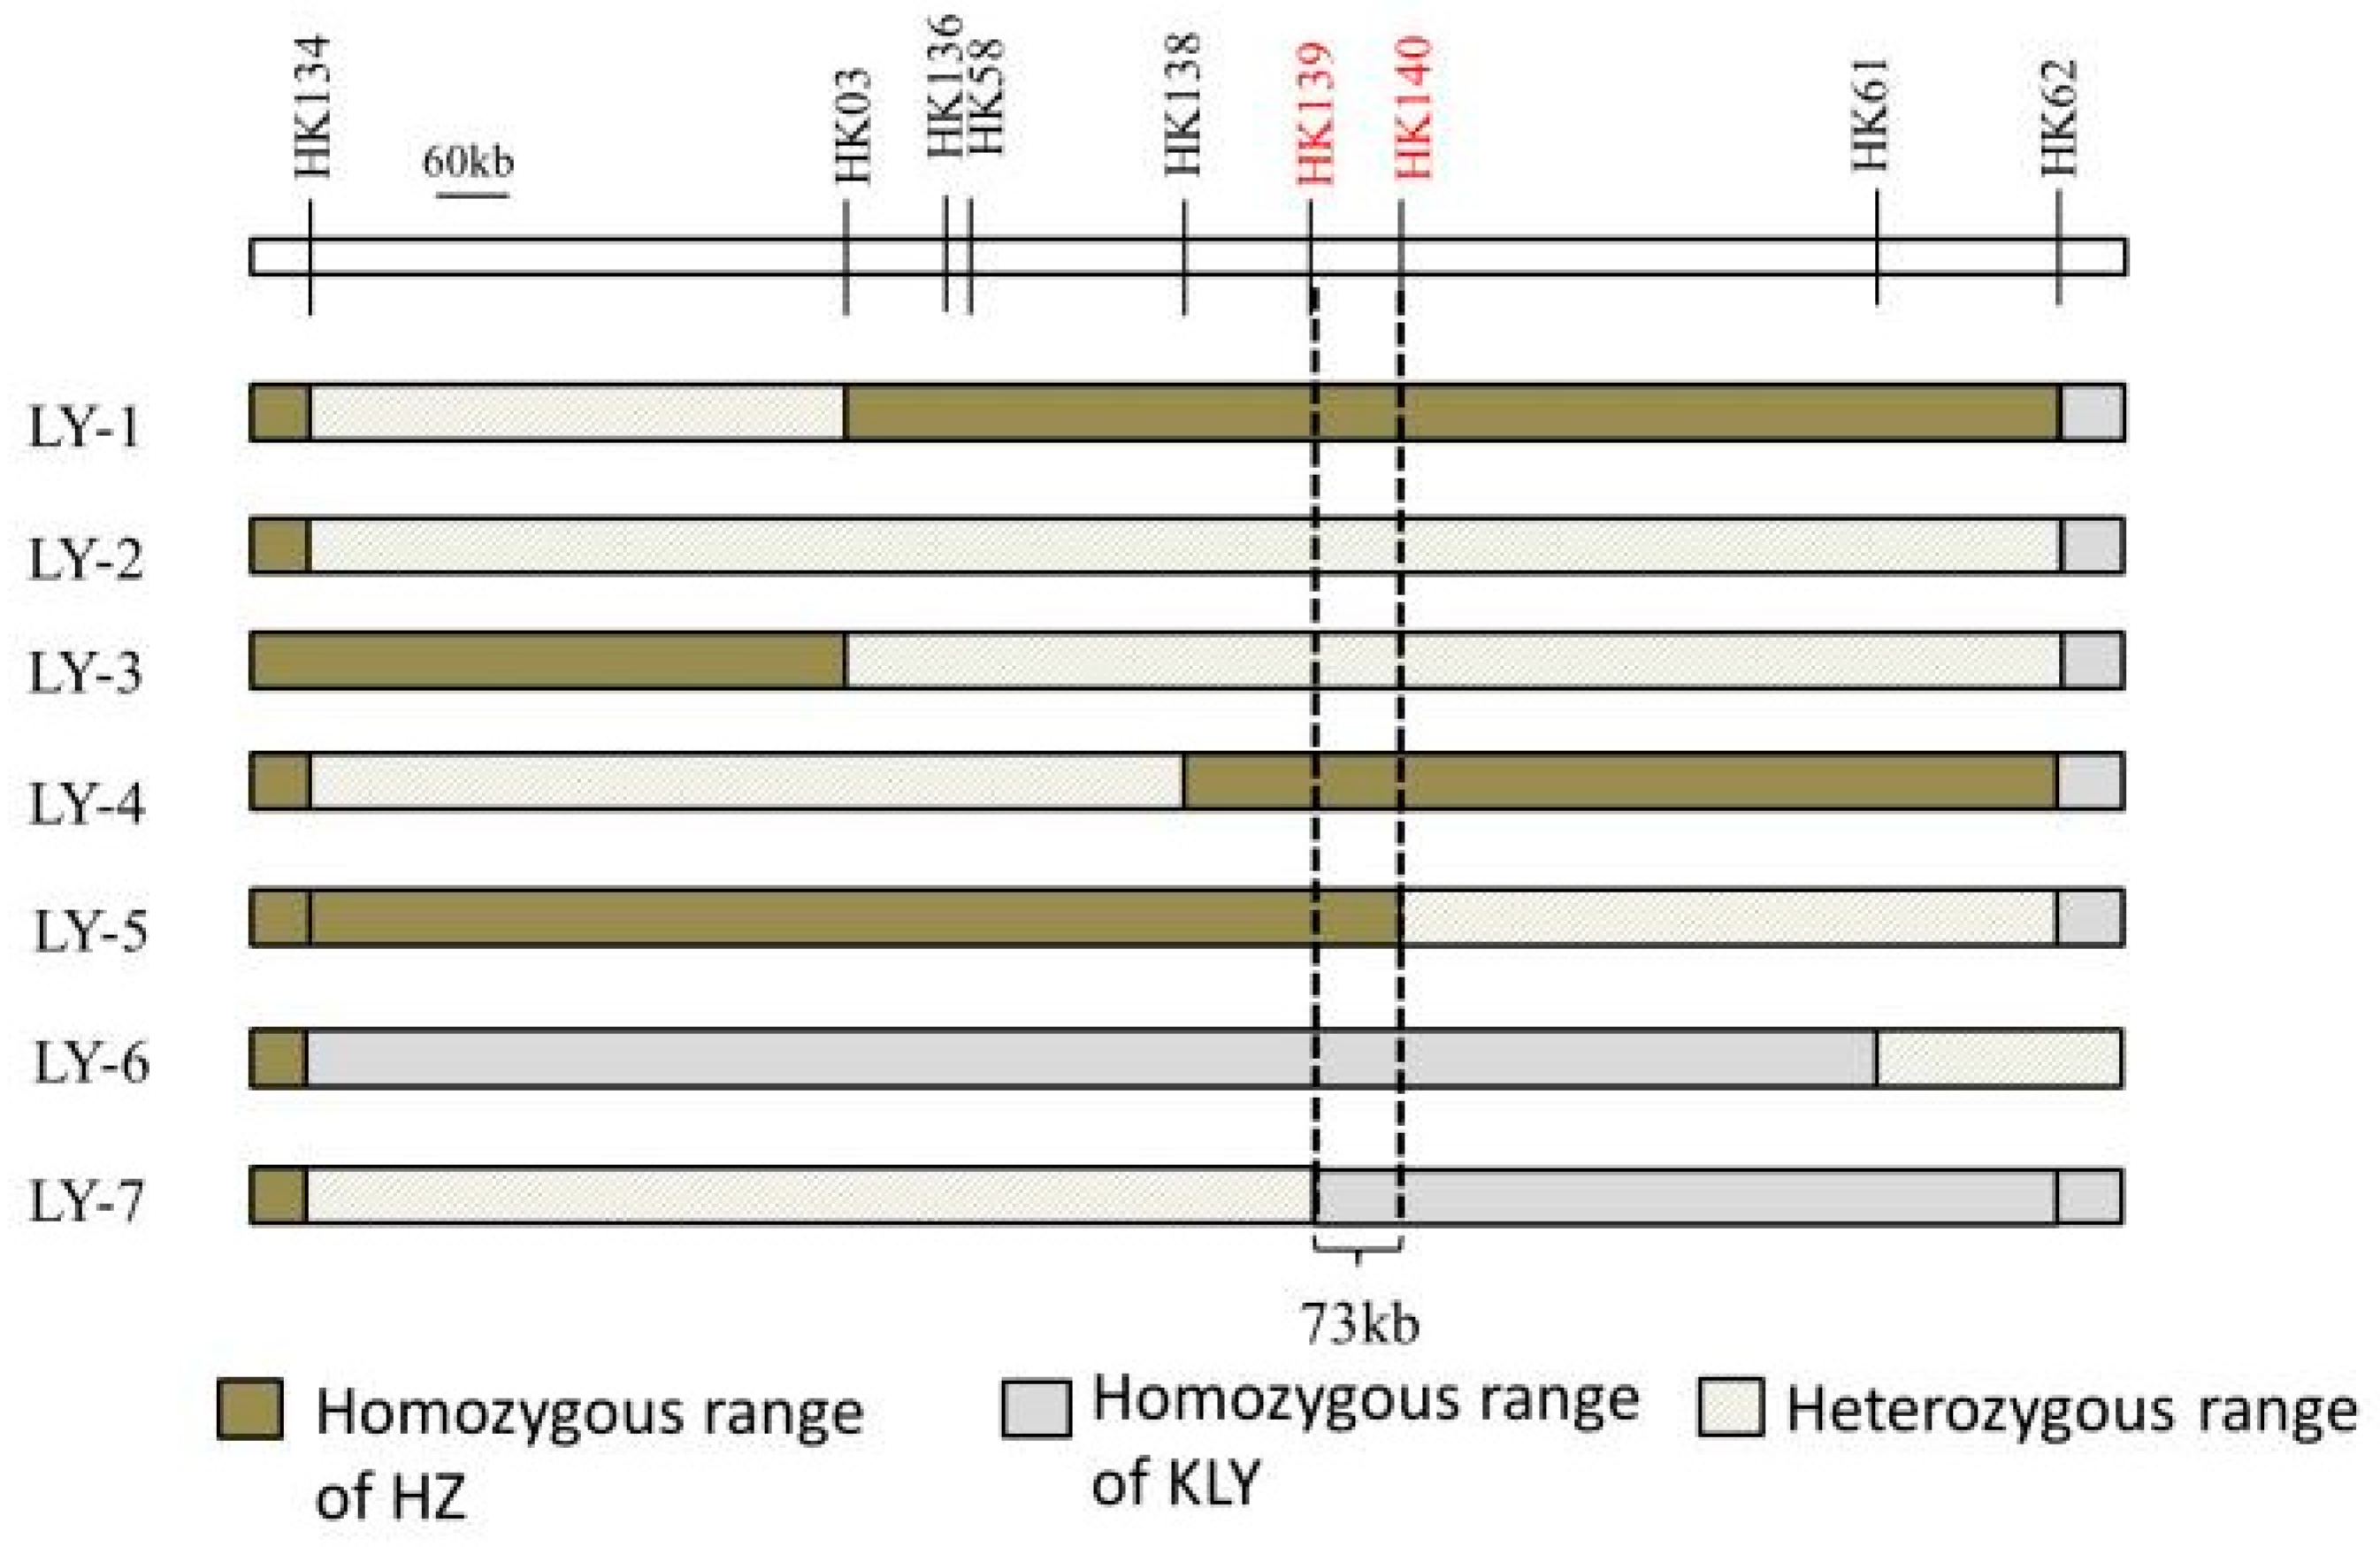
The draft mapping results revealed that two genomic regions in Chr5 were repeatedly detected in the BC4F2 and BC5F1 populations and thereafter named as qAL5.1 and qAL5.2, respectively. To fine map QTL of anther length, we constructed seven BC5F2 populations with the segregating regions covering the chip mark R0516540382GA- F0520537816TG in qAL5.2, and QTL analysis was performed (Figure 4). The result showed that qAL5.2 was observed in LY-2 and LY-3 populations. In LY-2 and LY-3 populations, the peak LOD values were 17.54 and 10.19, and the additive effects were 0.12 mm and 0.08 mm, explaining 35.73% and 25.1% of the phenotypic variances, respectively (Figure S2). There were no significant QTL in other populations (Table 1). So qAL5.2 might be localized to a 73 kb interval between HK139 and HK140 on chromosome 5.
2.3. Enrichment Analysis of RNA-Seq
To analyze how qAL5.2 affects the development of the anther, we conducted an RNA-sequence experiment using the anther samples in the S4-stage (pollen microspore metaphase stage) from the near-isogenic lines NIL-qAL5-2HZ and NIL-qAL5-2KLY, respectively. Compared with NIL-qAL5-2KLY, there were 952 genes observably up-regulated and 541 genes significantly down-regulated in the S4-stage anther in differential expression gene (DEG) analysis (Figure 5A and Table S3). In order to verify the DEG results, three genes were randomly detected by qRT-PCR, and the results showed that the relative expression of the three genes was consistent with the DEG results (Figure 5B). So it could be used in the following analysis.
The result of the GO enrichment analysis showed that differential genes were mainly enriched in the carbohydrate metabolic process, extracellular region, and nucleic acid binding transcription (Figure 6A). The result of the KEGG enrichment analysis revealed that they were significantly (p < 0.05) enriched in alpha-linolenic acid metabolism, porphyrin and chlorophyll metabolism, and amino sugar and nucleotide sugar metabolism pathways (Figure 6B), indicating qAL5.2 is involved in the regulation of the energy metabolism of anthers.
2.4. Candidate Gene Analysis of qAL5.2
There were eight predicted reading frames (ORFs) covered by qAL5.2. We analyzed the expression of all eight candidate genes using the data from the Rice Genome Annotation Project. We found that only ORF1, ORF3, ORF4, and ORF8 showed expression in the rice anther, and ORF8 had a particularly high level (Table 2 and Figure S3). And only ORF8 expression has a significant difference in RNA-Seq.
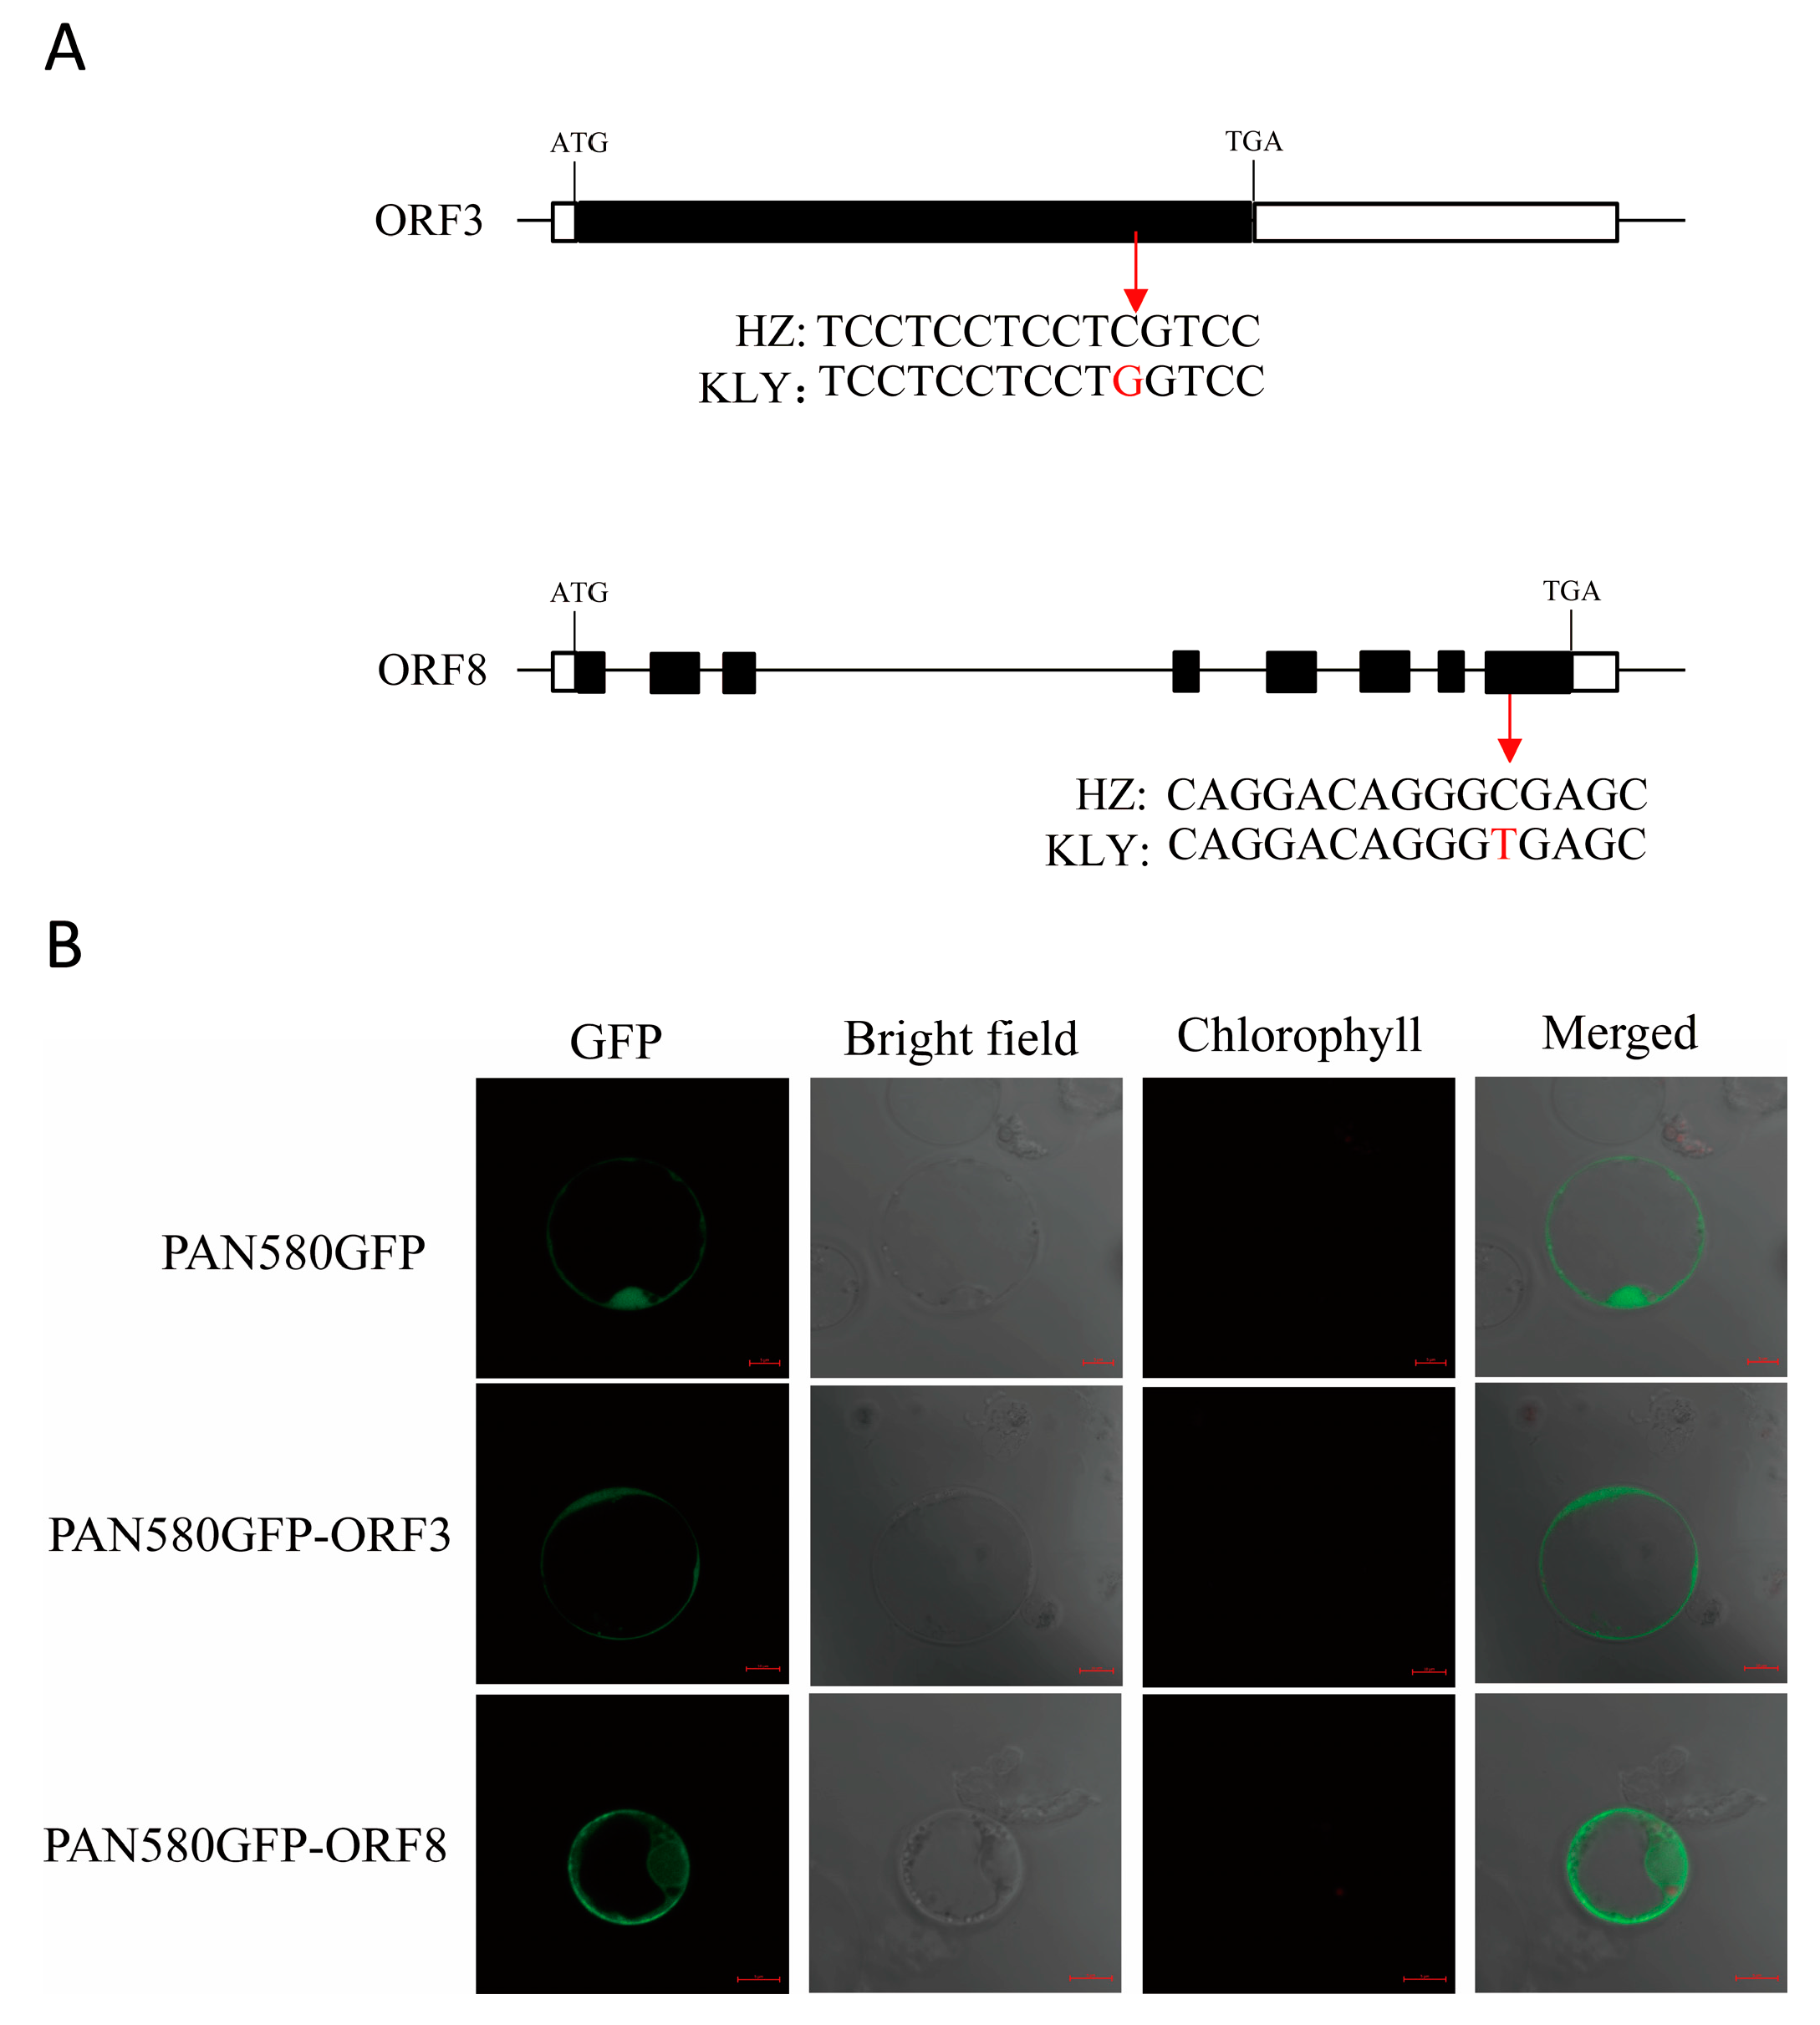
According to the Sanger sequencing results, there was a nonsynonymous mutation with T to C in exon 8 of ORF8, resulting in one amino acid substitution form Ala to Val. ORF3 also had a nonsynonymous SNP with G to C in exon and caused one acid substitution from Ser to Trp. (Figure 7A). A subcellular localization analysis of ORF3 and 8 was performed. The result showed that ORF3-GFP localized in plasma membranes and cytosol, and ORF8-GFP localized in the nucleus, plasma membranes, and cytosol (Figure 7B).
3. Discussion
The anther length was an essential trait in improving the outcrossing yield in rice, and the majority of QTL controlling anther size could be used in marker-assisted selection breeding. In this research, we constructed advanced backcross populations of HZ and KLY, and eight QTL sites of anther length were obtained by gene chip analysis. qAL5.2 was fine mapped to a 73 kb region between HK139 and HK140 on chromosome 5 by seven BC5F2 populations, and candidate genes were analyzed by RNA-sequence.
In the past decade, wild rice segregating populations were used for the QTL analysis of anther size, such as O. longistaminata and O. rufipogon [13,14]. Although there were significant differences in anthers between wild rice and cultivated rice, the fine mapping of the genes remains difficult, primarily due to the challenges in phenotyping. We used two cultivated rice HZ and KLY for a QTL analysis of anther size. The significant difference in the anther/glume ratio between KLY and HZ helped to rule out the influence of the grain length QTL on anther length (Figure 1 and Figure 2). At the same time, it quickly generated the mapping populations, and we obtained seven BC5F2 populations for qAL5.2 mapping. The genotypes of LY-1, LY-4, and LY-5 were HZ homozygous in qAL5.2 (Figure 4), and the average anther length was 2.03 mm, 2.12 mm, and 2.15, respectively (Table S1). The anther length of LY-1 was similar to HZ; LY-4 and LY-5 were longer than HZ. We speculated that LY-4 and LY-5 populations closer to the heterozygous range were more prone to genetic recombination. The genotypes of LY-6 and LY-7 were KLY homozygous range in qAL5.2, named qAL5.2KLY, and the average anther length of LY-6 was 2.26 mm, which was the longest anther in all BC5F2 populations. Notably, the anther of homozygous qAL5.2KLY is not identical to KLY, indicating that other QTL may co-regulate anther size.
This research showed that the genomic regions were located on Chr1, Chr3, Chr5, Chr6, Chr8, Chr9, Chr10, and Chr12 by DNA microarray mapping (Figure 3A,B). Previously, several other groups have attempted to map QTL for anther size. Eighteen QTL for anther traits were detected using five mapping populations, and the QTL sites of Chr1, Chr3, Chr5, Chr8, and Chr9 overlapped with the current study’s locations [15]. It suggested that gene chip mapping was reliable for QTL preliminary mapping. There was no coincident QTL that was detected by all mapping populations in Uga et al., and it was similar to other research [14,16]. Therefore, we supposed that anther length was regulated by different minor QTL in different populations, and major QTL have yet to be touched. The qAL5.2 site was close to the RM18569 marker, and a similar site was detected in multiple populations, including O. longistaminata (W1508), O. rufipogon (P16), and indica (IR24, T65, Aijiao Nante) [14,15,16]. qAL5.2 should be a major QTL for anther length.
Although qAL5 has been detected before, the candidate gene remains elusive. Based on the expression profile, there were eight predicted reading frames in the qAL5.2 region, and only four genes showed expression in rice (Table 2). ORF1 and ORF3 were mainly expressed during seed development; ORF4 and ORF8 were mainly expressed in the panicle formation stage, and the expression of ORF4 was also higher during the young seed stage (Table 2 and Figure S3). Only ORF3 and ORF8 had a nonsynonymous variation between HZ and KLY (Figure 7A), and ORF8 encoded a lipase belonging to the alpha/beta-hydrolase (ABH) family, and have been reported in regulating plant development [17,18]. SDP1 encodes lipase with a patatin-like acyl-hydrolase domain, mainly expressed in developing seeds, and sdp1 exhibited a post-germinative growth arrest phenotype in Arabidopsis [19]. RVMS (Reversible Male Sterile) encodes a GDSL lipase/hydrolase protein predominantly expressed in anthers. The mutant of rvms is fertile at a low temperature (17 °C) but is male-sterile at normal temperature (24 °C), so lipase is also necessary for anther development [20,21]. And CSE, the Arabidopsis homolog protein of ORF8, has been reported to be involved in lignin synthesis, and cse2 shows severe dwarfing and reduction in lignin content, so we thought ORF8 was probably a candidate gene of qAL5.2 [22,23].
The development of the anther is a complex process involving many regulatory pathways, such as the hormone pathway, phosphorylation pathway, and ubiquitination pathway [24,25]. In this research, we conducted an RNA-sequence experiment using an S4-stage anther of the near-isogenic line of qAL5.2 to analyze possible regulatory pathways. The differentially expressed genes were highly enriched in the nucleic acid binding transcription and alpha-linolenic acid metabolism pathway, indicating that many enzymes or substrates related to lipid synthesis are transcribed. So we guess qAL5.2 may be involved in regulating transcription factors and lipid metabolism in developing anthers.
In conclusion, we detected a new QTL and narrowed in a 73 kb region by fine mapping. At the same time, candidate genes of qAL5.2 were analyzed, and RNA-sequence analysis showed that qAL5.2 was involved in the regulation of the anther’s energy metabolism.
4. Materials and Methods
4.1. Plant Materials and Growth Conditions
Oryza sativa L. ssp. indica Huazhan (HZ) was a recurrent parent. Oryza sativa L. ssp. Japonica Poliya (PLY) was the donor parent. F1 of a big anther was identified from the HZ/KLY population derived from the cross between HZ and KLY. The BC4F2 population was derived from F1 with the recurrent parent HZ for four consecutive generations. NIL-qAL5.2HZ and NIL-qAL5.2KLY were derived from BC5F3. All plants were grown in the nature field at Hangzhou, Zhejiang Province of China, from May to October and at Linshui, Hainan Province of China, from January to April.
4.2. Measurement of Traits
The agronomic traits, including plant height, anther length, grain length, grain width and 1000-grain weight, were measured with more than three replicates at the mature stage. The anther length, anther width, grain length, and grain width were measured by SC-G software (Wanshen Detection Technology Co., Ltd., Hangzhou, China). The phenotypic variance was calculated by SPSS 17.0 software.
4.3. Genotype Analysis
The genomic DNA of each plant was extracted by the CTAB method [26]. For PCR amplification, a 20 µL reaction mixture consisted of 0.2 µM primers, 10 µL 2 × Taq PCR MasterMix (LSC, Hangzhou, China), and ∼15 ng of a genomic DNA sample. The PCR amplified profile was as follows: a pre-denaturation of 5 min at 94 °C, 30 cycles of 30 s at 94 °C, 30 s at 55 °C, and 30 s at 72 °C, and a final elongation at 72 °C for 5 min. Insertion and deletion markers were designed with NCBI and Primer5, and the primer sequences are listed in Table S2. The amplified products were electrophoresed in 3% agarose gel in 1× TAE buffer.
4.4. Genetic Mapping
The BC4F2 and BC5F1 population, individuals with extreme phenotypes of a big anther or small anther, were used for gene chip bulked segregation analysis by the company (Shuang Lv Yuang Bioinformatics Technology, Wuhan, China). Fine mapping was experimented with seven populations and nine markers by the method described previously. Briefly, genotype and phenotype analyses were conducted using Mapmaker/Exp 3.0, in which genetic distances between markers were presented in centiMorgans (cM) derived with the Kosambi function. QTL analysis was performed with the IM method by Windows QTL Cartographer 2.5, and an LOD value of 2.5 was taken as the threshold value [27].
4.5. Transcriptomics Analysis
About 1 g of the S4-stage (pollen microspore metaphase stage) anther of NIL-qAL5.2HZ and NIL-qAL5.2KLY was collected for Transcriptomics sequence. Different expression analyses, GO and KEGG, were performed by Tianjin Novogene Bioinformatics Technology. In brief, the PCR products were purified by AMPure XP system (Beckman Coulter, Pasadena, CA, USA), and the library quality was assessed using the Agilent Bioanalyzer 2100 system (Agilent, Santa Clara, CA, USA). After cluster generation, the library preparations were sequenced on the Illumina HiSeq platform (Illumina, San Diego, CA, USA) and 125 bp/150 bp paired-end reads were generated [28].
4.6. Subcellular Localization of qAL5
CDS of ORF3 and ORF8 without the stop codon were cloned into a transient expression vector PAN580-GFP to determine the subcellular localization. The fusions of GFP were transformed into protoplasts that were extracted from 15 d old HZ seedlings based on the CaCl2-PEG4000 method [29]. An empty PAN580-GFP vector was the control.
Supplementary Materials
The following supporting information can be downloaded at https://www.mdpi.com/article/10.3390/plants13081130/s1, Figure S1: Development of advanced backcross lines; Figure S2. The LOD score plots by WinQTLCart. (A) The LOD score of LY2 population. (B) The LOD score of LY3 population; Figure S3. The expression profiles of the candidate genes in different tissues; Table S1: Anther length of populations; Table S2: Prime list used in this study; Table S3: Differential expression genes list.
Author Contributions
Conceptualization, J.Z., S.N. and X.L. (Xinwang Li); methodology, X.L. (Xinyong Liu), S.N. and Z.Y.; software, X.L. (Xinyong Liu) and Z.Y.; validation, X.L. (Xinyong Liu), Z.Y. and L.C.; formal analysis, X.L. (Xinyong Liu) and Z.Y.; investigation, X.L. (Xinyong Liu) and Z.Y.; resources, J.H., Y.W., X.T., J.Y. and X.L. (Xinwang Li); data curation, X.L. (Xinyong Liu) and Z.Y.; writing—original draft preparation, X.L. (Xinyong Liu); writing—review and editing, J.Z. and J.Y.; visualization, X.L. (Xinyong Liu) and Z.Y.; supervision, J.Z. and S.N.; project administration, J.Z.; funding acquisition, J.Z. All authors have read and agreed to the published version of the manuscript.
Funding
This work was supported by National Key R&D Program of China (2022YFE0125600), Special support plan for high-level talents in Zhejiang (Grant No. 2022R52020), National Natural Science Foundation of China (Grant No. U22A20456), and Natural Science Foundation of Zhejiang (Grant No. LD24C130001).
Data Availability Statement
The data presented in this study are available in the article or the Supplementary Materials.
Conflicts of Interest
The authors declare no competing interests.
References
- Qian, Q.; Zhang, F.; Xin, Y. Yuan Longping and Hybrid Rice Research. Rice 2021, 14, 101. [Google Scholar] [CrossRef]
- Liao, C.; Yan, W.; Chen, Z.; Xie, G.; Deng, X.W.; Tang, X. Innovation and development of the third-generation hybrid rice technology. Crop J. 2021, 9, 693–701. [Google Scholar] [CrossRef]
- Cheng, S.H.; Zhuang, J.Y.; Fan, Y.Y.; Du, J.H.; Cao, L.Y. Progress in Research and Development on Hybrid Rice: A Super-domesticate in China. Ann. Bot. 2007, 100, 959–966. [Google Scholar] [CrossRef]
- Luo, D.; Xu, H.; Liu, Z.; Guo, J.; Li, H.; Chen, L.; Fang, C.; Zhang, Q.; Bai, M.; Yao, N.; et al. A detrimental mitochondrial-nuclear interaction causes cytoplasmic male sterility in rice. Nat. Genet. 2013, 45, 573–577. [Google Scholar] [CrossRef]
- Tang, H.; Luo, D.; Zhou, D.; Zhang, Q.; Tian, D.; Zheng, X.; Chen, L.; Liu, Y.-G. The Rice Restorer Rf4 for Wild-Abortive Cytoplasmic Male Sterility Encodes a Mitochondrial-Localized PPR Protein that Functions in Reduction of WA352 Transcripts. Mol. Plant 2014, 7, 1497–1500. [Google Scholar] [CrossRef]
- Kim, Y.-J.; Zhang, D. Molecular Control of Male Fertility for Crop Hybrid Breeding. Trends Plant Sci. 2018, 23, 53–65. [Google Scholar] [CrossRef]
- Fujii, S.; Toriyama, K. Suppressed expression of RETROGRADE-REGULATED MALE STERILITY restores pollen fertility in cytoplasmic male sterile rice plants. Proc. Natl. Acad. Sci. USA 2009, 106, 9513–9518. [Google Scholar] [CrossRef]
- Malik, T.U.H.; Baba, A. Techniques hybrid seed production in rice. J. Pharmacogn. Phytochem. 2018, 7, 962–967. [Google Scholar]
- Li, J.; Luo, X.; Zhou, K. Research and development of hybrid rice in China. Plant Breed. 2023, 143, 96–104. [Google Scholar] [CrossRef]
- Ying, J.; Qin, Y.; Zhang, F.; Duan, L.; Cheng, P.; Yin, M.; Wang, Y.; Tong, X.; Huang, J.; Li, Z.; et al. A weak allele of TGW5 enables greater seed propagation and efficient size-based seed sorting for hybrid rice production. Plant Commun. 2024, 5, 100811. [Google Scholar] [CrossRef]
- Rubiyo; Satoto; Widyastuti, Y.; Indrawanto, C. Hybrid rice development in Indonesia: Constraints and opportunities. E3S Web Conf. 2021, 306, 01047. [Google Scholar] [CrossRef]
- Tazib, T.; Kobayashi, Y.; Koyama, H.; Matsui, T. QTL analyses for anther length and dehiscence at flowering as traits for the tolerance of extreme temperatures in rice (Oryza sativa L.). Euphytica 2014, 203, 629–642. [Google Scholar] [CrossRef]
- Khumto, S.; Pusadee, T.; Olsen, K.M.; Jamjod, S. Genetic relationships between anther and stigma traits revealed by QTL analysis in two rice advanced-generation backcross populations. Euphytica 2017, 214, 5. [Google Scholar] [CrossRef]
- Ogami, T.; Yasui, H.; Yoshimura, A.; Yamagata, Y. Identification of Anther Length QTL and Construction of Chromosome Segment Substitution Lines of Oryza longistaminata. Plants 2019, 8, 388. [Google Scholar] [CrossRef]
- Uga, Y.; Siangliw, M.; Nagamine, T.; Ohsawa, R.; Fujimura, T.; Fukuta, Y. Comparative mapping of QTLs determining glume, pistil and stamen sizes in cultivated rice (Oryza sativa L.). Plant Breed. 2010, 129, 657–669. [Google Scholar] [CrossRef]
- Xiong, L.Z.; Liu, K.D.; Dai, X.K.; Xu, C.G.; Zhang, Q. Identification of genetic factors controlling domestication-related traits of rice using an F2 population of a cross between Oryza sativa and O. rufipogon. Theor. Appl. Genet. 1999, 98, 243–251. [Google Scholar] [CrossRef]
- Shen, G.; Sun, W.; Chen, Z.; Shi, L.; Hong, J.; Shi, J. Plant GDSL Esterases/Lipases: Evolutionary, Physiological and Molecular Functions in Plant Development. Plants 2022, 11, 468. [Google Scholar] [CrossRef]
- Nardini, M.; Dijkstra, B.W. Alpha/beta hydrolase fold enzymes: The family keeps growing. Curr. Opin. Struct. Biol. 1999, 9, 732–737. [Google Scholar] [CrossRef]
- Eastmond, P.J. SUGAR-DEPENDENT1 Encodes a Patatin Domain Triacylglycerol Lipase That Initiates Storage Oil Breakdown in Germinating Arabidopsis Seeds. Plant Cell 2006, 18, 665–675. [Google Scholar] [CrossRef]
- Zhu, J.; Lou, Y.; Shi, Q.-S.; Zhang, S.; Zhou, W.-T.; Yang, J.; Zhang, C.; Yao, X.-Z.; Xu, T.; Liu, J.-L.; et al. Slowing development restores the fertility of thermo-sensitive male-sterile plant lines. Nat. Plants 2020, 6, 360–367. [Google Scholar] [CrossRef]
- Kim, H.U.; Hsieh, K.; Ratnayake, C.; Huang, A.H.C. A Novel Group of Oleosins Is Present Inside the Pollen of Arabidopsis. J. Biol. Chem. 2002, 277, 22677–22684. [Google Scholar] [CrossRef]
- Ha, C.M.; Escamilla-Trevino, L.; Yarce, J.C.S.; Kim, H.; Ralph, J.; Chen, F.; Dixon, R.A. An essential role of caffeoyl shikimate esterase in monolignol biosynthesis in Medicago truncatula. Plant J. 2016, 86, 363–375. [Google Scholar] [CrossRef] [PubMed]
- Barros, J.; Escamilla-Trevino, L.; Song, L.; Rao, X.; Serrani-Yarce, J.C.; Palacios, M.D.; Engle, N.; Choudhury, F.K.; Tschaplinski, T.J.; Venables, B.J.; et al. 4-Coumarate 3-hydroxylase in the lignin biosynthesis pathway is a cytosolic ascorbate peroxidase. Nat. Commun. 2019, 10, 1994. [Google Scholar] [CrossRef]
- Aya, K.; Ueguchi-Tanaka, M.; Kondo, M.; Hamada, K.; Yano, K.; Nishimura, M.; Matsuoka, M. Gibberellin Modulates Anther Development in Rice via the Transcriptional Regulation of GAMYB. Plant Cell 2009, 21, 1453–1472. [Google Scholar] [CrossRef]
- Marchant, D.B.; Walbot, V. Anther development—The long road to making pollen. Plant Cell 2022, 34, 4677–4695. [Google Scholar] [CrossRef] [PubMed]
- Allen, G.C.; Flores-Vergara, M.A.; Krasynanski, S.; Kumar, S.; Thompson, W.F. A modified protocol for rapid DNA isolation from plant tissues using cetyltrimethylammonium bromide. Nat. Protoc. 2006, 1, 2320–2325. [Google Scholar] [CrossRef]
- Cheng, Y.C.; Li, G.; Yin, M.; Adegoke, T.V.; Wang, Y.F.; Tong, X.H.; Zhang, J.; Ying, J.Z. Verification and dissection of one quantitative trait locus for grain size and weight on chromosome 1 in rice. Sci. Rep. 2021, 11, 18252. [Google Scholar] [CrossRef]
- Zhou, Q.; Hu, X. Systemic Stress and Recovery Patterns of Rice Roots in Response to Graphene Oxide Nanosheets. Environ. Sci. Technol. 2017, 51, 2022–2030. [Google Scholar] [CrossRef]
- Li, Z.; Wei, X.; Tong, X.; Zhao, J.; Liu, X.; Wang, H.; Tang, L.; Shu, Y.; Li, G.; Wang, Y.; et al. The OsNAC23-Tre6P-SnRK1a feed-forward loop regulates sugar homeostasis and grain yield in rice. Mol. Plant 2022, 15, 706–722. [Google Scholar] [CrossRef]
Figure 1.
The phenotypic characterization of Huazhan (HZ) and Koliya (KLY). (A,B) The gestational stage (A) and maturation stage (B) of HZ and KLY grown under natural field conditions, Bar = 25 cm. (C) The grain length of HZ (down) and KLY (up), Bar = 5 cm. (D) The anther of the spikelet of HZ (left) and KLY (right), Bar = 1 cm. (E–H) The statistics of the agronomic traits of HZ and KLY: anther length (E), grain length (F), grain width (G), and plant height (H). Values are means ± SD from three biological replicates. Asterisks indicate statistical significance as determined by Student’s t-test (** p < 0.01).
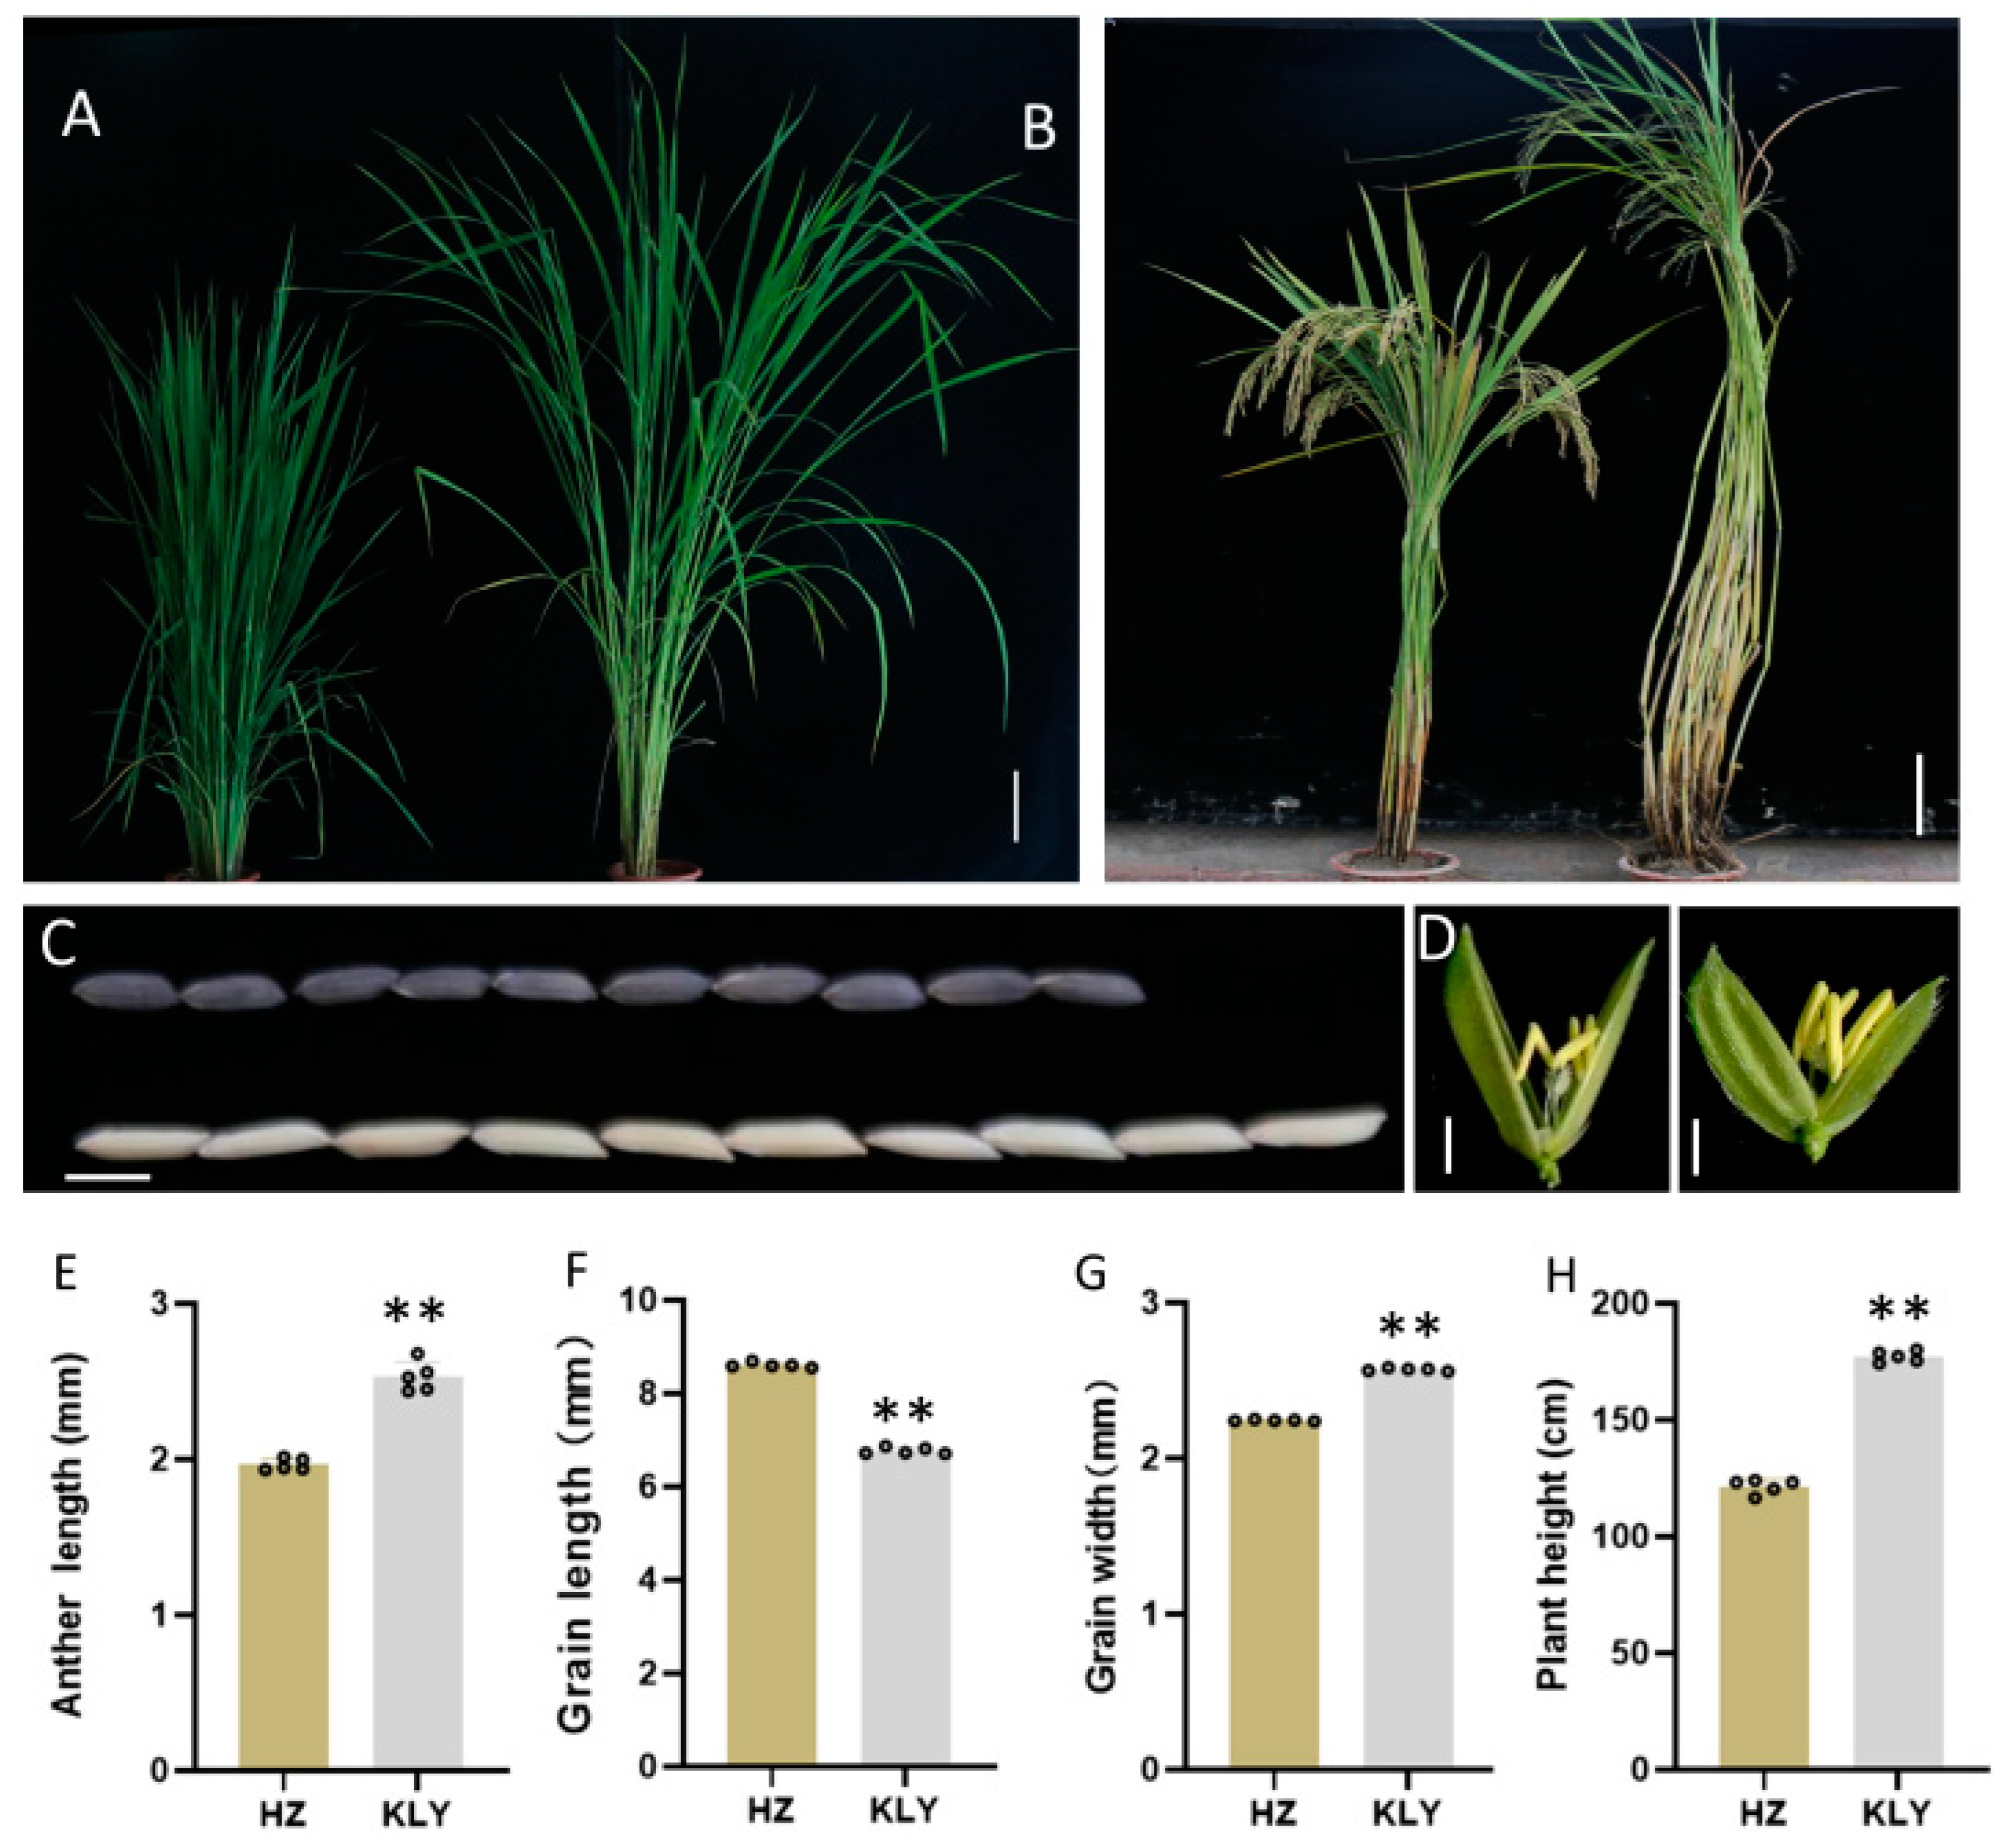
Figure 2.
The phenotypic characterization of NIL-HZ and NIL-KLY. (A) The gestational stage of NIL-HZ and NIL-KLY grown under natural field conditions, Bar = 10 cm. (B,C) The length of the spikelet (B) and anther (C) of NIL-HZ (left) and NIL-KLY (right), Bar = 5 mm and 2 mm. (D–I) The statistics of the agronomic traits of NIL-HZ and NIL-KLY: anther length (D), anther width (E), the weight of 1000 grains (F), grain length (G), grain width (H), and plant height (I). Values are means ± SD from three biological replicates. Asterisks indicate statistical significance as determined by Student’s t-test (* p < 0.05; ** p < 0.01).

Figure 3.
Primary mapping of QTL for anther length using gene chips containing 10 K molecular markers. (A) Analysis of plants with extremely short and long anther size in BC4F2 (n = 20). (B) Analysis in F1 of BC5F1 (n = 10). AA stands for HZ; BB stands for KLY. Red circles represent QTL locations.
Figure 3.
Primary mapping of QTL for anther length using gene chips containing 10 K molecular markers. (A) Analysis of plants with extremely short and long anther size in BC4F2 (n = 20). (B) Analysis in F1 of BC5F1 (n = 10). AA stands for HZ; BB stands for KLY. Red circles represent QTL locations.

Figure 4.
The genotypic compositions of populations in the segregating regions.

Figure 5.
Differential expression analysis in RNA-seq. (A) Volcano plot of mRNA expression in S4 anther (pollen microspore metaphase stage). (B) Verification of DEG by qRT-PCR. Asterisks indicate statistical significance as determined by Student’s t-test (** p < 0.01).
Figure 5.
Differential expression analysis in RNA-seq. (A) Volcano plot of mRNA expression in S4 anther (pollen microspore metaphase stage). (B) Verification of DEG by qRT-PCR. Asterisks indicate statistical significance as determined by Student’s t-test (** p < 0.01).

Figure 6.
Candidate gene selection from RNA-seq analysis. (A) Enrichment of GOs for differentially expressed mRNAs. (B) Bubble plot of pathways for differentially expressed mRNAs. BP biological process; CC cellular component; MF molecular function.
Figure 6.
Candidate gene selection from RNA-seq analysis. (A) Enrichment of GOs for differentially expressed mRNAs. (B) Bubble plot of pathways for differentially expressed mRNAs. BP biological process; CC cellular component; MF molecular function.
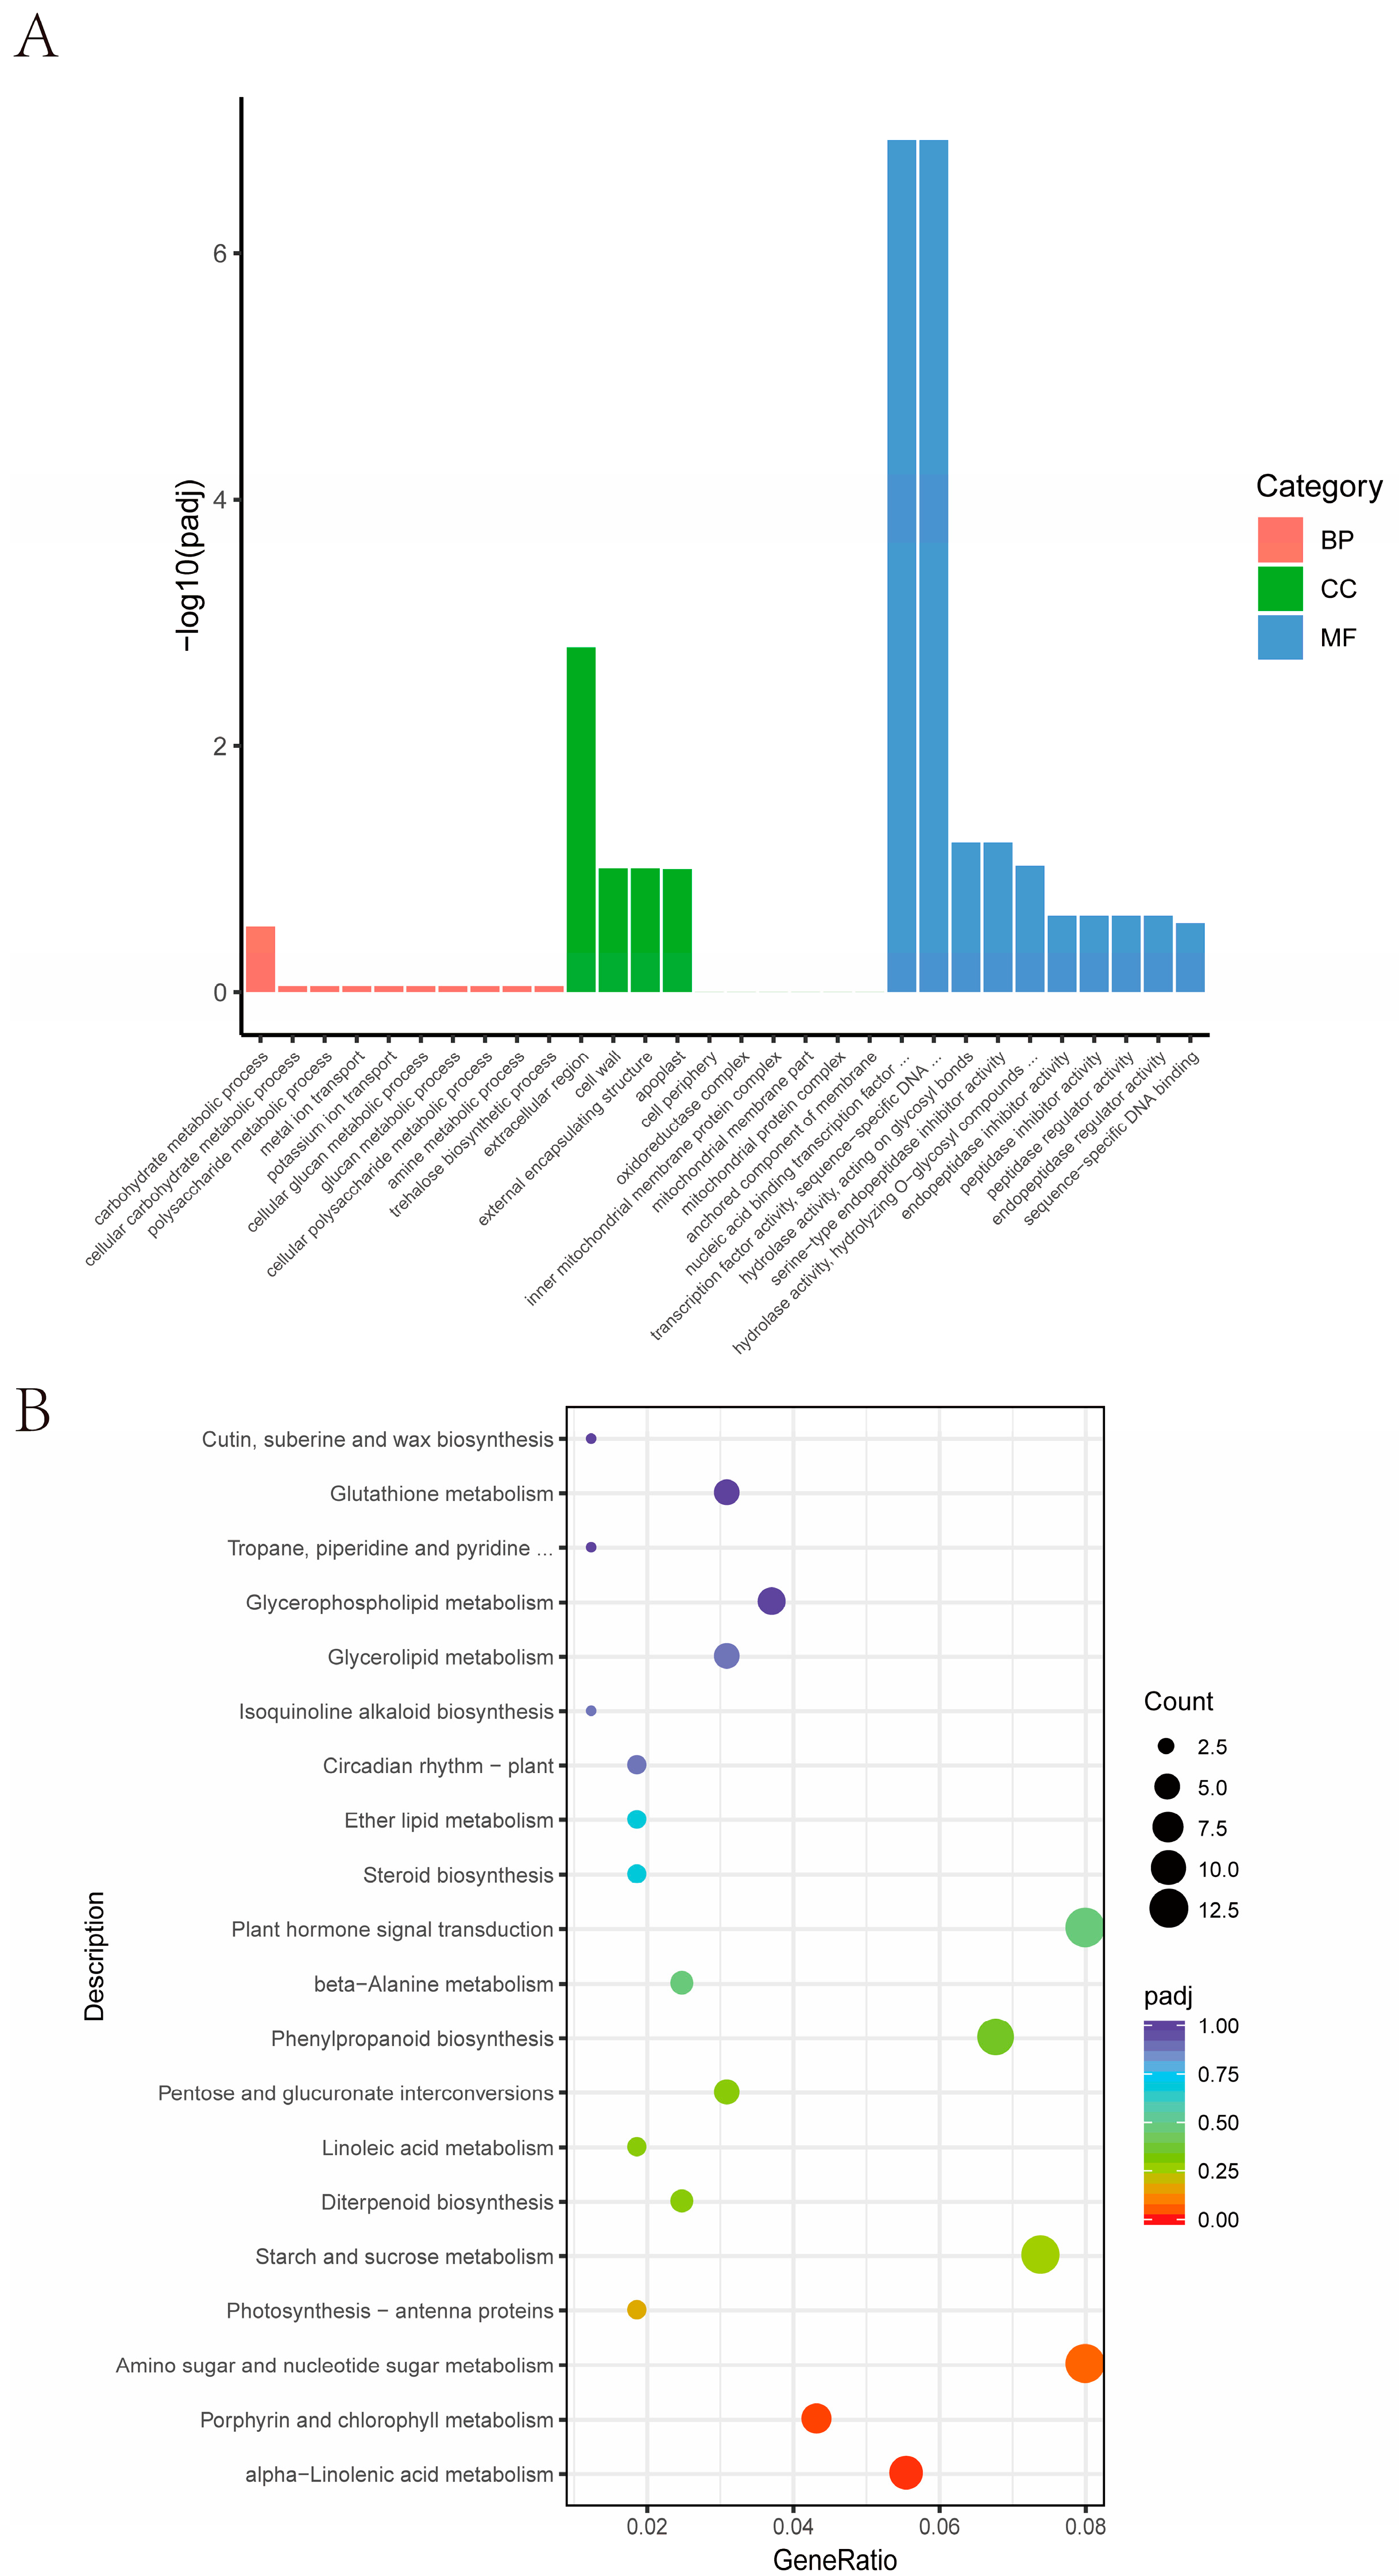
Figure 7.
The identification of candidate genes for anther length. (A) A schematic diagram of the SNP of the candidate genes between HZ and KLY. An SNP occurred in ORF3, resulting in the residues being changed from Ser in HZ to Trp in KLY. An SNP occurred in ORF8, resulting in the residues being changed from Ala in HZ to Val in KLY. White boxes indicate UTR, black boxes indicate exons, and the lines between them represent introns. (B) Free green fluorescent protein (GFP) and ORF3/ORF8-GFP fusion protein were transiently expressed in rice protoplasts. Green fluorescence shows GFP.


Table 1.
QTL detected for anther length in seven BC5F2 populations. A, the additive effect of replacing an HZ allele with a KLY allele; D, dominance effect; R2, the proportion of phenotypic variance explained by the QTL effect; ns, no significance.
Table 1.
QTL detected for anther length in seven BC5F2 populations. A, the additive effect of replacing an HZ allele with a KLY allele; D, dominance effect; R2, the proportion of phenotypic variance explained by the QTL effect; ns, no significance.
| Population | Heterozygous Interval | LOD | A | D | R2 |
|---|---|---|---|---|---|
| LY-1 | HK134–HK03 | ns | - | - | - |
| LY-2 | HK134–HK62 | 17.54 | 0.12 | 0.01 | 35.73 |
| LY-3 | HK03–HK62 | 10.19 | 0.08 | - | 25.10 |
| LY-4 | HK134–HK138 | ns | - | - | - |
| LY-5 | HK140–HK62 | ns | - | - | - |
| LY-6 | HK61–HK62 | ns | - | - | - |
| LY-7 | HK134–HK139 | ns | - | - | - |
Table 2.
Candidate genes in the target region of qAL5.2.
| ORF | ID | Gene Product | The Highest Expression |
|---|---|---|---|
| ORF1 | LOC_Os05g29900 | expressed protein | Seed-S4 |
| ORF2 | LOC_Os05g29910 | retrotransposon protein, putative, expressed | No |
| ORF3 | LOC_Os05g29920 | expressed protein | Seed-S5 |
| ORF4 | LOC_Os05g29930 | late embryogenesis abundant protein, expressed | SAM |
| ORF5 | LOC_Os05g29940 | expressed protein | No |
| ORF6 | LOC_Os05g29950 | expressed protein | No |
| ORF7 | LOC_Os05g29960 | expressed protein | No |
| ORF8 | LOC_Os05g29974 | lipase, putative, expressed | Anther |
Disclaimer/Publisher’s Note: The statements, opinions and data contained in all publications are solely those of the individual author(s) and contributor(s) and not of MDPI and/or the editor(s). MDPI and/or the editor(s) disclaim responsibility for any injury to people or property resulting from any ideas, methods, instructions or products referred to in the content. |
© 2024 by the authors. Licensee MDPI, Basel, Switzerland. This article is an open access article distributed under the terms and conditions of the Creative Commons Attribution (CC BY) license (https://creativecommons.org/licenses/by/4.0/).
Share and Cite
MDPI and ACS Style
Liu, X.; Yu, Z.; Tong, X.; Chang, L.; Huang, J.; Wang, Y.; Ying, J.; Li, X.; Ni, S.; Zhang, J. Fine Mapping of qAL5.2 Controlling Anther Length in Oryza sativa. Plants 2024, 13, 1130. https://doi.org/10.3390/plants13081130
AMA Style
Liu X, Yu Z, Tong X, Chang L, Huang J, Wang Y, Ying J, Li X, Ni S, Zhang J. Fine Mapping of qAL5.2 Controlling Anther Length in Oryza sativa. Plants. 2024; 13(8):1130. https://doi.org/10.3390/plants13081130
Chicago/Turabian StyleLiu, Xinyong, Zixuan Yu, Xiaohong Tong, Longxue Chang, Jie Huang, Yifeng Wang, Jiezheng Ying, Xingwang Li, Shen Ni, and Jian Zhang. 2024. "Fine Mapping of qAL5.2 Controlling Anther Length in Oryza sativa" Plants 13, no. 8: 1130. https://doi.org/10.3390/plants13081130
Note that from the first issue of 2016, this journal uses article numbers instead of page numbers. See further details here.