
In Situ Use of Mining Substrates for Wetland Construction: Results of a Pilot Experiment

 ,
,  and
and
Abstract
:1. Introduction
Background
2. Results
2.1. Characterisation and Selection of the Substrate Used
2.2. Study of Potential and Natural Mobilisation in the Base Materials (BS and YS)
2.3. Results of the Monitoring Plan
3. Materials and Methods
3.1. Selection of Materials Used in the Experiment
- Limestone filler (LF)
- Black Sand (BS)
- Yellow Sand (YS)
- Topsoil (TS)
- Peat
3.2. Construction of Ponds
3.3. Development of the Experiment
3.4. Experiment Monitoring Plan
3.5. Analytical Methodology
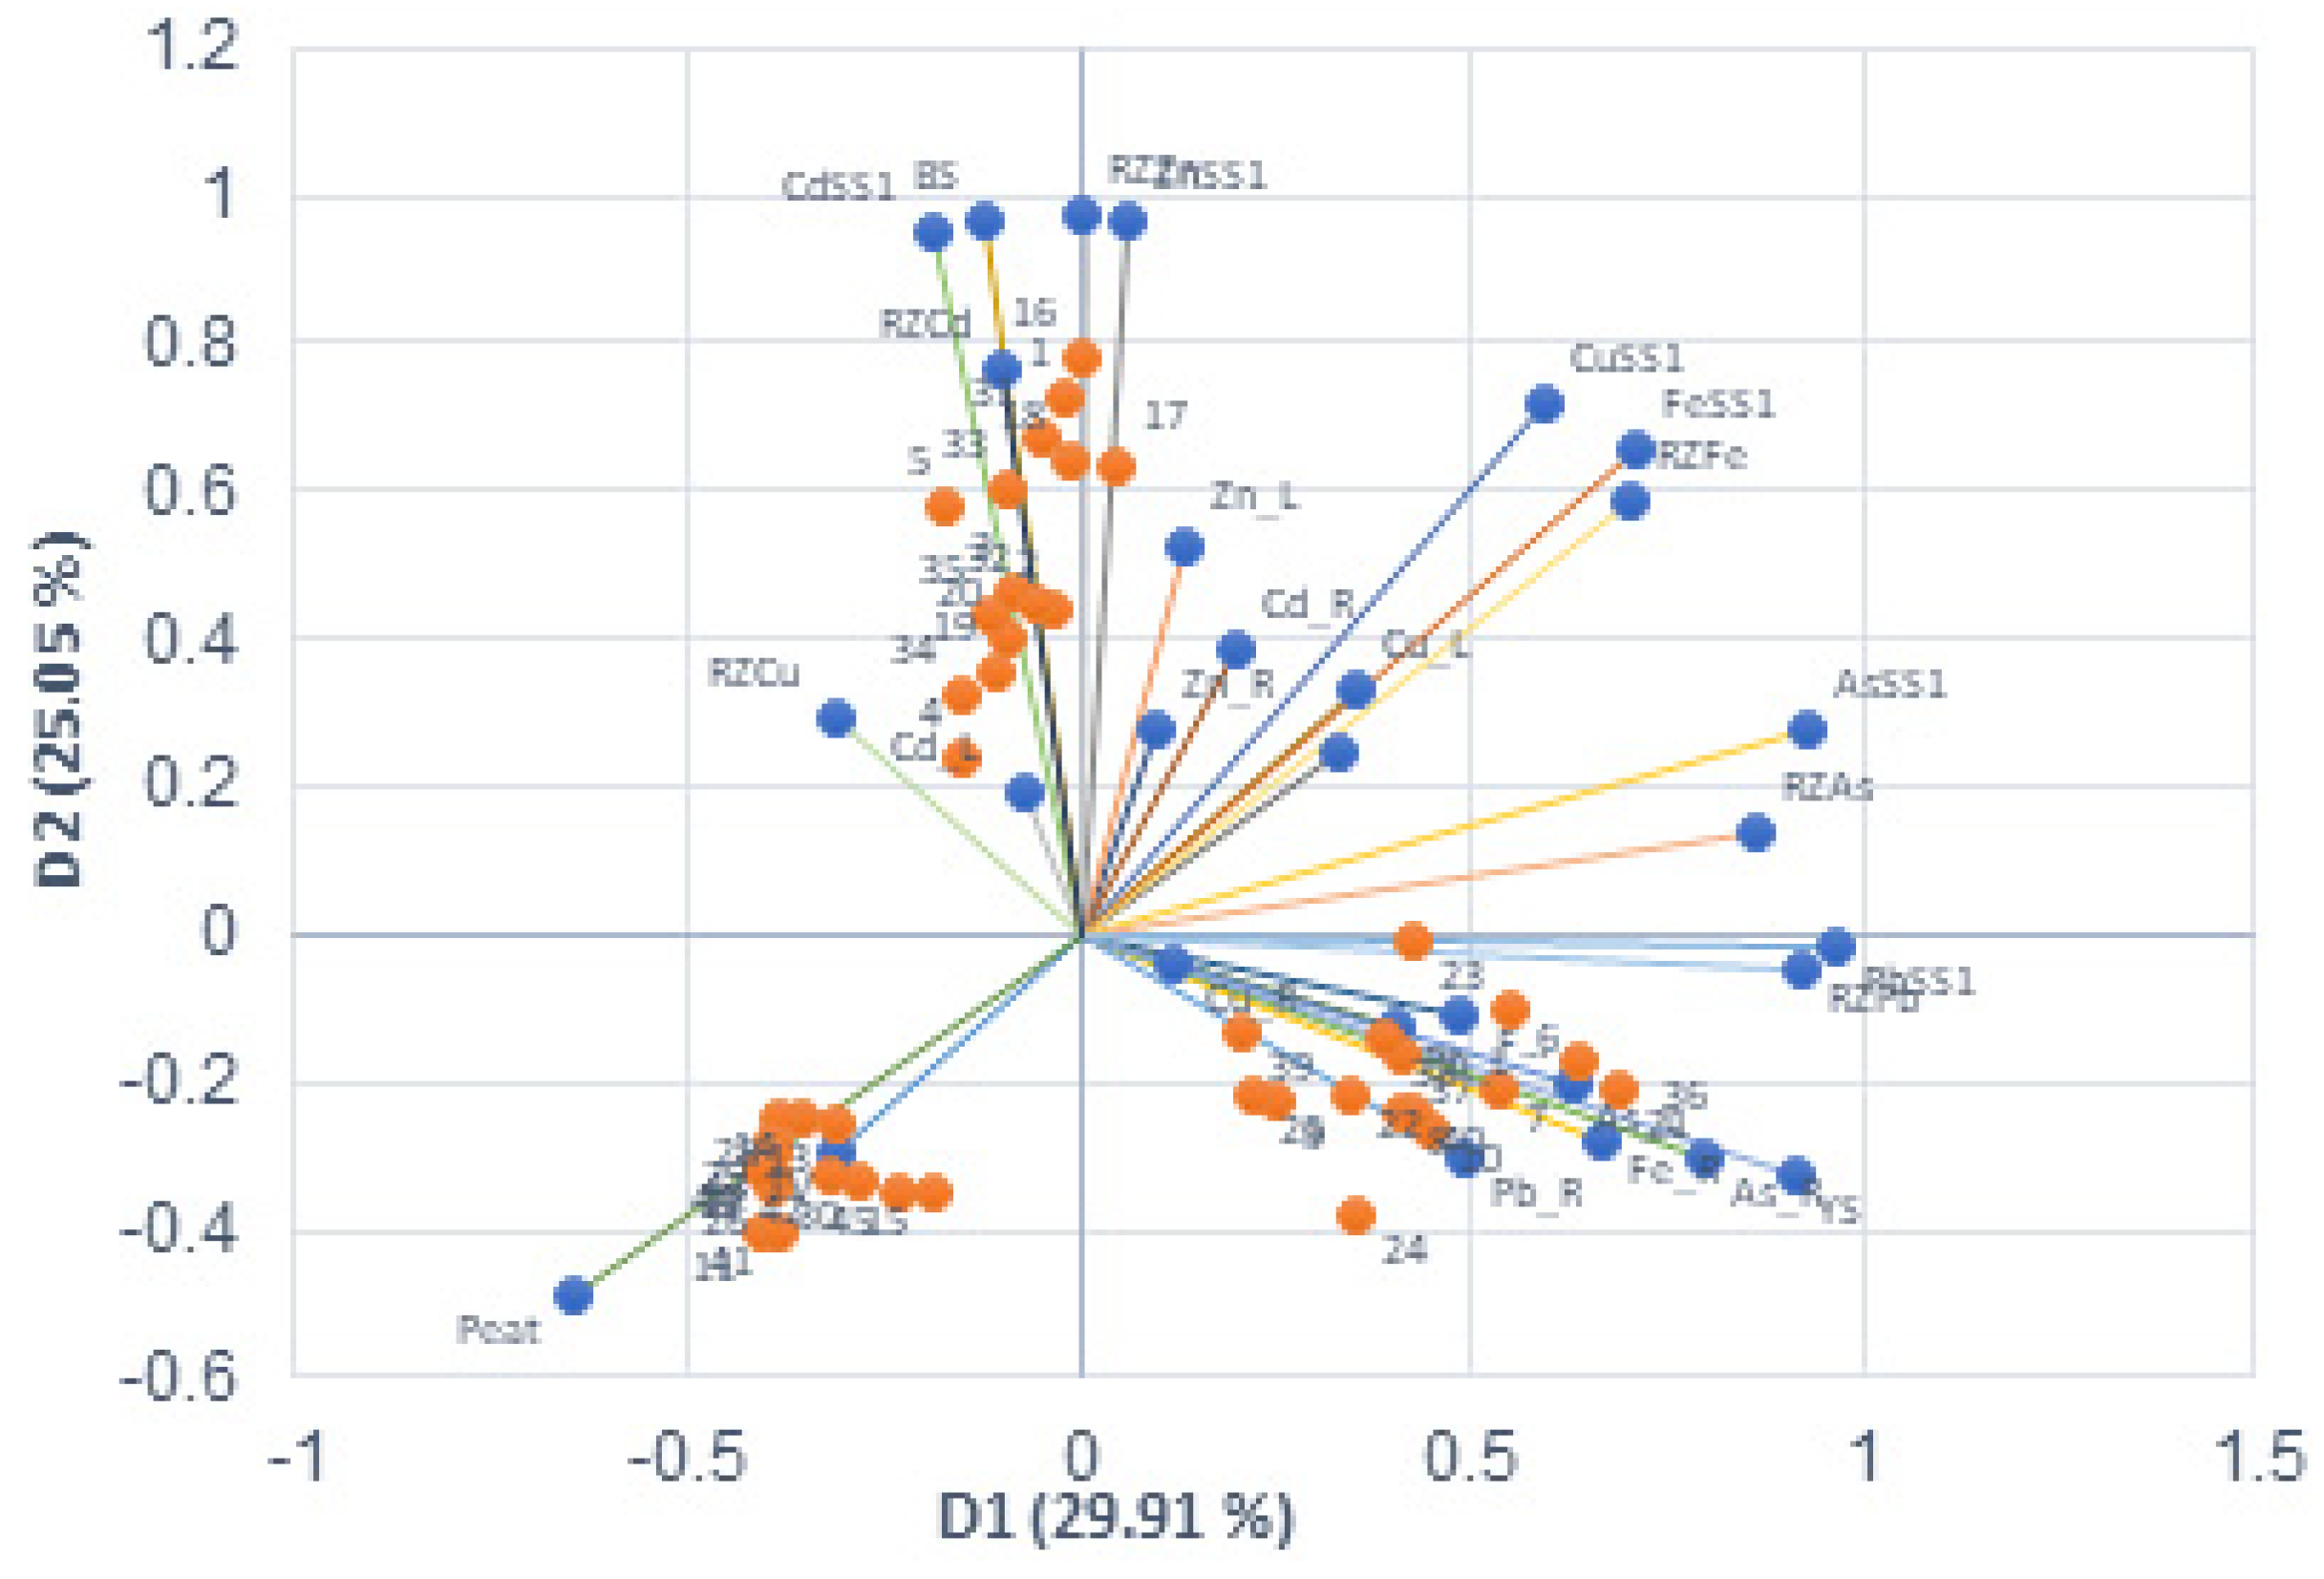
3.6. Statistical Analysis
4. Conclusions
Author Contributions
Funding
Data Availability Statement
Acknowledgments
Conflicts of Interest
References
- Ramani, R.V. Surface mining technology: Progress and Prospects. Procedia Eng. 2012, 46, 9–21. [Google Scholar] [CrossRef]
- Venkateswarlu, K.; Nirola, R.; Kuppusamy, S.; Thavamani, P.; Naidu, R.; Megharaj, M. Abandoned metalliferous mines: Ecological impacts and potential approaches for reclamation. Rev. Environ. Sci. Biotechnol. 2016, 15, 327–354. [Google Scholar] [CrossRef]
- Miller, A.; Zégre, N. Mountaintop removal mining and catchment hydrology. Water 2014, 6, 472–499. [Google Scholar] [CrossRef]
- Mummey, D.L.; Stahl, P.D.; Buyer, J.S. Soil microbiological properties 20 years after surface mine reclamation: Spatial analysis of reclaimed and undisturbed sites. Soil Biol. Biochem. 2002, 34, 1717–1725. [Google Scholar] [CrossRef]
- Isosaari, P.; Sillanpää, M. Electromigration of arsenic and co-existing metals in mine tailings. Chemosphere 2010, 81, 1155–1158. [Google Scholar] [CrossRef] [PubMed]
- Rooney, R.C.; Bayley, S.E.; Schindler, D.W. Oil sands mining and reclamation cause massive loss of peatland and stored carbon. Proc. Natl. Acad. Sci. USA 2012, 109, 4933–4937. [Google Scholar] [CrossRef]
- Luckeneder, S.; Giljum, S.; Schaffartzik, A.; Maus, V.; Tost, M. Surge in global metal mining threatens vulnerable ecosystems. Glob. Environ. Chang. 2021, 69, 102303. [Google Scholar] [CrossRef]
- Lima, A.T.; Mitchell, K.; O’Connell, D.W.; Verhoeven, J.; Van Cappellen, P. The legacy of surface mining: Remediation, restoration, reclamation and rehabilitation. Environ. Sci. Policy 2016, 66, 227–233. [Google Scholar] [CrossRef]
- Dold, B. Evolution of Acid Mine Drainage Formation in Sulphidic Mine Tailings. Minerals 2014, 4, 621–641. [Google Scholar] [CrossRef]
- Sánchez-Castro, I.; Molina, L.; Prieto-Fernández, M.A.; Segura, A. Past, present and future trends in the remediation of heavy-metal contaminated soil—Remediation techniques applied in real soil-contamination events. Heliyon 2023, 9, e16692. [Google Scholar] [CrossRef]
- Thomas, G.; Sheridan, C.; Holm, P.E. A critical review of phytoremediation for acid mine drainage impacted environments. Sci. Total Environ. 2022, 811, 152230. [Google Scholar] [CrossRef] [PubMed]
- Xu, X.; Mills, G.L. Do constructed wetlands remove metals or increase metal bioavailability? J. Environ. Manag. 2018, 218, 245–255. [Google Scholar] [CrossRef] [PubMed]
- García Rizo, C.; Martínez Sánchez, J.; Pérez Sirvent, C. Enviromental transfer of zinc in calcareous soils in zones near old mining with semi-aridic climate. Chemosphere 1999, 39, 209–227. [Google Scholar] [CrossRef]
- Anawar, H.M. Sustainable rehabilitation of mining waste and acid mine drainage using geochemistry, mine type, mineralogy, texture, ore extraction and climate knowledge. J. Environ. Manag. 2015, 158, 111–121. [Google Scholar] [CrossRef] [PubMed]
- Martínez López, S.; Martínez Sánchez, M.J.; Pérez Sirvent, C. Do old mining areas represent an environmental problem and health risk? A critical discussion through a particular case. Minerals 2021, 11, 594. [Google Scholar] [CrossRef]
- Ahmed, S.F.; Kumar, P.S.; Rozbu, M.R.; Chowdhury, A.T.; Nuzhat, S.; Rafa, N.; Mahlia, T.M.I.; Ong, H.C.; Mofijur, M. Heavy metal toxicity, sources, and remediation techniques for contaminated water and soil. Environ. Technol. Innov. 2022, 25, 102114. [Google Scholar] [CrossRef]
- Sheoran, A.S.; Sheoran, V. Heavy metal removal mechanism of acid mine drainage in wetlands: A critical review. Miner. Eng. 2006, 19, 105–116. [Google Scholar] [CrossRef]
- Chen, J.; Deng, S.; Jia, W.; Li, X.; Chang, J. Removal of multiple heavy metals from mining-impacted water by biochar-filled constructed wetlands: Adsorption and biotic removal routes. Bioresour. Technol. 2021, 331, 125061. [Google Scholar] [CrossRef]
- Saeed, T.; Alam, M.K.; Miah, M.J.; Majed, N. Removal of heavy metals in subsurface flow constructed wetlands: Application of effluent recirculation. J. Environ. Sustain. Indic. 2021, 12, 100146. [Google Scholar] [CrossRef]
- Pat-Espadas, A.M.; Loredo Portales, R.; Amabilis-Sosa, L.E.; Gómez, G.; Vidal, G. Review of Constructed Wetlands for Acid Mine. Drainage Treatment. Water 2018, 10, 1685. [Google Scholar] [CrossRef]
- Nyquist, J.; Greger, M. A field study of constructed wetlands for preventing and treating acid mine drainage. Ecol. Eng. 2009, 35, 630–642. [Google Scholar] [CrossRef]
- Wibowo, Y.G.; Safri, M.; Wijaya, C.; Halomoan, P.; Yudhoyono, A. Constructed Wetlands for Treatment of Acid Mine Drainage: A Review. J. Presipitasi 2020, 19, 436–450. [Google Scholar] [CrossRef]
- Wang, T.; Peverly, J.H. Oxidation states and fractionation of plaque iron on roots of common reeds. Soil Sci. Soc. Am. J. 1996, 60, 323–329. [Google Scholar] [CrossRef]
- Elbaz-Poulichet, F.; Morley, N.H.; Cruzado, A.; Velasquez, Z.; Achterberg, E.P.; Braungardt, C.B. Trace metal and nutrient distribution in an extremely low pH (2.5) river-estuarine system, the Ria of Huelva (South-West Spain). Sci. Total Environ. 1999, 227, 73–83. [Google Scholar] [CrossRef]
- Lamers, L.P.M.; Van Diggelen, J.M.H.; Op den Camp, H.J.M.; Visser, E.J.W.; Lucassen, E.C.H.E.T.; Vile, M.A.; Jetten, M.S.M.; Smolders, A.J.P.; Roelofs, J.G.M. Microbial transformations of nitrogen, sulfur, and iron dictate vegetation composition in wetlands: A review. Front. Microbiol. 2012, 3, 156. [Google Scholar] [CrossRef] [PubMed]
- Sobolewski, A. A review of processes responsible for metal removal in wetlands treating contaminated mine drainage. Int. J. Phytoremediat. 1999, 1, 19–51. [Google Scholar] [CrossRef]
- Dushenko, W.T.; Bright, D.A.; Reimer, K.J. Arsenic bioaccumulation and toxicity in aquatic macrophytes exposed to gold-mine effluent: Relationships with environmental partitioning, metal uptake and nutrients. Aquat. Bot. 1995, 50, 141–158. [Google Scholar] [CrossRef]
- Guittonny-Philippe, A.; Masotti, V.; Höhener, P.; Boudenne, J.L.; Viglione, J.; Laffont-Schwob, I. Constructed wetlands to reduce metal pollution from industrial catchments in aquatic Mediterranean ecosystems: A review to overcome obstacles and suggest potential solutions. Environ. Int. 2014, 64, 1–16. [Google Scholar] [CrossRef] [PubMed]
- Gazea, B.; Adam, K.; Kontopoulos, A. A review of passive systems for the treatment of acid mine drainage. Miner. Eng. 1996, 9, 23–42. [Google Scholar] [CrossRef]
- Stottmeister, U.; Wiessner, A.; Kuschk, P.; Kappelmeyer, U.; Kästner, M.; Bederski, O.; Müller, R.A.; Moormann, H. Effects of plants and microorganisms in constructed wetlands for wastewater treatment. Biotechnol. Adv. 2003, 22, 93–117. [Google Scholar] [CrossRef]
- Borralho, T.; Gago, D.; Almeida, A. Study on the Application of Floating Beds of Macrophites (Vetiveria zizanioides and Phragmites australis) in Pilot Scale for the Removal of Heavy Metals from Água Forte Stream (Alentejo-Portugal). J. Ecol. Eng. 2020, 21, 153–163. [Google Scholar] [CrossRef] [PubMed]
- Leung, H.M.; Duzgoren-Aydin, N.S.; Au, C.K.; Krupanidhi, S.; Fung, K.Y.; Cheung, K.C.; Wong, Y.K.; Peng, X.L.; Ye, Z.H.; Yung, K.K.L.; et al. Monitoring and assessment of heavy metal contamination in a constructed wetland in Shaoguan (Guangdong Province, China): Bioaccumulation of Pb, Zn, Cu and Cd in aquatic and terrestrial components. Environ. Sci. Pollut. Res. 2017, 24, 9079–9088. [Google Scholar] [CrossRef] [PubMed]
- García-Lorenzo, M.L.; Pérez-Sirvent, C.; Martínez-Sánchez, M.J.; Molina-Ruiz, J.; Martínez Lopez, S.; Arroyo, X.; Martinez-Martinez, L.B.; Bech, J. Potential bioavailability assessment and distribution of heavy metal (oids) in cores from Portman Bay (SE, Spain). GEEA 2019, 19, 193–200. [Google Scholar] [CrossRef]
- González Ciudad, E. Evaluación en Nave Cerrada de los Riesgos para la Salud en Tecnosoles Procedentes de Residuos de Minería Polimetálica. Ph.D. Thesis, University of Murcia, Murcia, Spain, 2014. [Google Scholar]
- Martínez Sánchez, M.J.; Pérez-Sirvent, C. Proyecto Piloto de la Bahía de Portmán; Informe Técnico Privado; Universidad de Murcia—Ministerio de Medio Ambiente y Medio Rural y Marino-TRAGSA: Murcia, Spain, 2009. [Google Scholar]
- Martínez-Sánchez, M.L.; Pérez-Sirvent, C. Niveles de Fondo y Niveles Genéricos de Referencia de Metales Pesados en Suelos de la Región de Murcia; Universidad de Murcia—Región de Murcia. Comunidad Autónoma de la Región de Murcia: Murcia, Spain, 2007; ISBN 978-84-6909-104-3. [Google Scholar]
- García-Lorenzo, M.L.; Pérez-Sirvent, C.; Martínez-Sánchez, M.J.; Molina-Ruiz, J.; Tudela, M.L. Spatial distribution and sources of trace elements in sediments affected by old mining activities. Environ. Monit. Assess. 2012, 184, 7041–7052. [Google Scholar] [CrossRef] [PubMed]
- Pérez-Sirvent, C.; Hernández-Pérez, C.; Martínez-Sánchez, M.J.; García-Lorenzo, M.L.; Bech, J. Geochemical characterisation of surface waters, topsoils and efflorescences in a historic metal-mining area in Spain. J. Soils Sediments 2016, 16, 1238–1252. [Google Scholar] [CrossRef]
- Vymazal, J.; Brezinová, T. Accumulation of heavy metals in aboveground biomass of Phragmites australis in horizontal flow constructed wetlands for wastewater treatment: A review. J. Chem. Eng. 2016, 290, 232–242. [Google Scholar] [CrossRef]
- Adriano, D.C.; Wenzel, W.W.; Vangronsveld, J.; Bolan, N.S. Role of assisted natural remediation in environmental cleanup. Geoderma 2004, 122, 121–142. [Google Scholar] [CrossRef]
- Briffa, J.; Sinagra, E.; Blundell, R. Heavy metal pollution in the environment and their toxicological effects on humans. Heliyon 2020, 6, 04691. [Google Scholar] [CrossRef] [PubMed]
- Hernández-Pérez, C.; Martínez-Sánchez, M.J.; García-Lorenzo, M.L.; Bech, J.; Pérez-Sirvent, C. Phytoremediation of potentially toxic elements using constructed wetlands in coastal areas with a mining influence. Environ. Geochem. Health 2021, 43, 1385–1400. [Google Scholar] [CrossRef] [PubMed]
- Pérez-Sirvent, C.; Hernández-Pérez, C.; Martínez-Sánchez, M.J.; García-Lorenzo, M.L.; Bech, J. Metal uptake by wetland plants: Implications for phytoremediation and restoration. J. Soils Sediments 2017, 17, 1384–1393. [Google Scholar] [CrossRef]
- Liu, W.J.; Zhu, Y.G.; Hu, Y.; Williams, P.N.; Gault, A.G.; Meharg, A.A.; Charnock, J.M.; Smith, F.A. Arsenic sequestration in iron plaque, its accumulation and speciation in mature rice plants (Oryza sativa L.). Environ. Sci. Technol. 2006, 40, 5730–5736. [Google Scholar] [CrossRef] [PubMed]
- Weis, J.S.; Weis, P. Metal uptake, transport and release by wetland plants: Implications for phytoremediation and restoration. Environ. Int. 2004, 30, 685–700. [Google Scholar] [CrossRef] [PubMed]
- Liu, H.; Zhang, J.; Christie, P.; Zhang, F. Influence of iron plaque on uptake and accumulation of Cd by rice (Oryza sativa L.) seedlings grown in soil. Sci. Total Environ. 2008, 394, 361–368. [Google Scholar] [CrossRef] [PubMed]
- Matagi, S.V.; Swai, D.; Mugabe, R. A review of heavy metal removal mechanisms in wetlands. Afr. J. Trop. Hydrobiol. Fish. 1998, 8, 23–35. [Google Scholar] [CrossRef]
- Batty, L.C.; Baker, A.J.M.; Wheeler, B.D. The effect of vegetation on porewater composition in a natural wetland receiving acid mine drainage. Wetlands 2006, 26, 40–48. [Google Scholar] [CrossRef]
- Woulds, C.; Ngwenya, B.T. Geochemical processes governing the performance of a constructed wetland treating acid mine drainage, Central Scotland. J. Appl. Geochem. 2004, 19, 1773–1783. [Google Scholar] [CrossRef]
- Mayes, W.M.; Batty, L.C.; Younger, P.L.; Jarvis, A.P.; Kõiv, M.; Vohla, C.; Mander, U. Wetland treatment at extremes of pH: A review. Sci. Total Environ. 2009, 407, 3944–3957. [Google Scholar] [CrossRef] [PubMed]
- Nordstrom, D.K. Hydrogeochemical processes governing the origin, transport and fate of major and trace elements from mine wastes and mineralized rock to surface waters. J. Appl. Geochem. 2011, 26, 1777–1791. [Google Scholar] [CrossRef]
- Gilbert, S.E.; Cooke, D.R.; Hollings, P. The effects of hardpan layers on the water chemistry from the leaching of pyrrhotite-rich tailings material. Environ. Geol. 2003, 44, 687–697. [Google Scholar] [CrossRef]
- Stumm, W.; Morgan, J.J. Aquatic Chemistry: Chemical Equilibria and Rates in Natural Waters, 3rd ed.; John Wiley & Sons: New York, NY, USA, 1996. [Google Scholar]
- Liu, H.; Yang, L.; Li, N.; Zhou, C.; Feng, H.; Yang, J.; Han, X. Cadmium toxicity reduction in rice (Oryza sativa L.) through iron addition during primary reaction of photosynthesis. Ecotoxicol. Environ. Saf. 2020, 200, 110746. [Google Scholar] [CrossRef]
- Jia, X.; Otte, M.L.; Liu, Y.; Qin, L.; Tian, X.; Lu, X.; Jiang, M.; Zou, Y. Performance of iron plaque of wetland plants for regulating iron, manganese, and phosphorus from agricultural drainage water. Water 2018, 10, 42. [Google Scholar] [CrossRef]
- An, J.; Kim, J.Y.; Kim, K.W.; Park, J.Y.; Lee, J.S.; Jang, M. Natural attenuation of arsenic in the wetland system around abandoned mining area. Environ. Geochem. Health 2011, 33, 71–80. [Google Scholar] [CrossRef] [PubMed]
- Veiga del Baño, J.M.; Martínez López, S.; Pérez Sirvent, C.; Martínez Sánchez, M.J.; Andreo Martínez, P. Optimisation of the chemical immobilisation by limestone filler of heavy metals and metalloids in contaminated soils via response surface methodology (RSM). Miner. Eng. 2023, 201, 108211. [Google Scholar] [CrossRef]
- EU 2019/1009; Regulation (EU) 2019/1009 of the European Parliament and of the Council of 5 June 2019 Laying down Rules on the Making Available on the Market of EU Fertilising Products and Amending Regulations (EC) No 1069/2009 and (EC) No 1107/2009 and Repealing Regulation (EC) No 2003/2003. European Union: Brussels, Belgium, 2019.
- Wildeman, T.; Dietz, J.; Gusek, J.; Morea, S. Handbook for Constructed Wetlands Receiving Acid Mine Drainage; Contract No. CR 815325 Project Officer; Edward, R., Ed.; Bates Office of Research and Development Risk Reduction Engineering Laboratory Cincinnati: Cincinnati, OH, USA, 1993; p. 45268. [Google Scholar]
- Morel, A.; Diener, S. Greywater Management in Low and Middle-Income Countries, Review of Different Treatment Systems for Households or Neighbourhoods; Swiss Federal Institute of Aquatic Science and Technology (Eawag): Dübendorf, Switzerland, 2006. [Google Scholar]
- Ridderstolpe, P. Introduction to Greywater Management. SEL Communication Sweden; Report 2004, 4—WRS Uppsala AB EcoSanRes Programme; Stockholm Environment Institute: Stockholm, Sweden, 2004; pp. 1–8. [Google Scholar]
- Mehra, O.P.; Jackson, M.L. Iron Oxide Removal from Soils and Clay by a Dithionite-Citrate System Buffered with Sodium Bicarbonate. Clays Clay Miner. 1960, 7, 317–327. [Google Scholar]
- Sutherland, R.A.; Tack, F.M.G. Determination of Al, Cu, Fe, Mn, Pb and Zn in certified reference materials using the optimized BCR sequential extraction procedure. Anal. Chim. Acta 2002, 454, 249–257. [Google Scholar] [CrossRef]
- Martin, J.D. XPowderX, A Software Package for Powder X-ray Diffraction Analysis, version 16.01.10. Qualitative, Quantitative and Microtexture; Lgl. Dp. GR 780. 2016; ISBN 978-84-16478-87-3. ISBN 84-609-1497-6.10.


| pH | Eh (mV) | Electric Conductivity (mS·cm−1) | Mean Particle Size (µm) | Textural Class USDAas | BET (m2·g−1) | Permeability (cm·h−1) | Relative Density g·cm−3 | Porosity (%) |
|---|---|---|---|---|---|---|---|---|
| 9.02 ± 0.09 | 150 ± 0.4 | 0.22 ± 0.04 | 55 ± 1 | silt | 0.70 ± 0.3 | 1.04 ± 0.32 | 2.30 ± 0.05 | 17.0 ± 0.1 |
| Sample | pH | EC (dS/m) | OM% | Clay% | Silt% | Sand% |
|---|---|---|---|---|---|---|
| BS | 7.46 ± 0.08 | 2.44 ± 0.22 | 0.17 ± 0.08 | - | 2.00 ± 0.55 | 98.00 ± 0.60 |
| YS | 5.05 ± 0.10 | 18.43 ± 3.57 | <QL | 0.19 ± 0.09 | 10.41 ± 2.57 | 81.20 ± 3.05 |
| TS | 8.10 ± 0.25 | 2.0 ± 0.32 | 1.8 ± 0.21 | 7.51 ± 1.35 | 40.59 ± 3.02 | 52.00 ± 2.83 |
| LF | 9.02 ± 0.09 | 0.22 ± 0.04 | <QL | 20.88 ± 4.43 | 71.2 ± 3.51 | 8.00 ± 2.70 |
| Sample | Phyl. 14 Å | Phyl. 10 Å | Quartz | Albite | Calcite | Dolomite | Siderite | Akageneite | Hematite | Gypsum | Jarosite | Pyrite | Magnetite | Goethite | Greenalite | Copiapite |
|---|---|---|---|---|---|---|---|---|---|---|---|---|---|---|---|---|
| BS | 14 ± 2 | 6 ± 2 | 7 ± 2 | 27 ± 3 | 12 ± 3 | 5 ± 3 | 2 ± 2 | 9 ± 3 | 6 ± 3 | 6 ± 2 | 7 ± 2 | |||||
| YS | 8 ± 1 | 12 ± 2 | 8 ± 4 | 10 ± 2 | 5 ± 2 | 8 ± 2 | 36 ± 6 | 5 ± 3 | 6 ± 2 | 6 ± 2 | 16 ± 10 | |||||
| TS | 4 ± 2 | 30 ± 6 | 12 ± 2 | 2 ± 2 | 34 ± 2 | 18 ± 5 | 2 ± 2 | 5 ± 2 | ||||||||
| LF | 3 ± 1 | 4 ± 2 | 60 ± 5 | 33 ± 5 |
| Sample | As (mg/kg) | Pb (mg/kg) | Cd (mg/kg) | Cu (mg/kg) | Fe (%) | Zn (mg/kg) | Mn (mg/kg) |
|---|---|---|---|---|---|---|---|
| 1 * | 202 ± 20 | 670 ± 25 | 8 ± 1 | 31 ± 1 | 25.90 ± 0.5 | 8993 ± 87 | 7360 ± 89 |
| 2 | 155 ± 17 | 516 ± 19 | 6 ± 1 | 26 ± 1 | 20.47 ± 0.7 | 7032 ± 56 | 2500 ± 110 |
| 3 | 152 ± 19 | 504 ± 22 | 6 ± 1 | 28 ± 1 | 19.68 ± 0.8 | 6855 ± 68 | 2432 ± 121 |
| 4 | 109 ± 12 | 361 ± 18 | 5 ± 1 | 22 ± 2 | 15.00 ± 0.9 | 5072 ± 49 | 1852 ± 45 |
| 5 | 102 ± 14 | 337 ± 20 | 5 ± 1 | 25 ± 2 | 13.42 ± 0.8 | 4717 ± 59 | 4525 ± 225 |
| 6 ** | 333 ± 35 | 2037 ± 59 | 1 ± 0.3 | 28 ± 1 | 24.07 ± 1.0 | 2396 ± 65 | 320 ± 54 |
| 7 | 253 ± 25 | 1541 ± 45 | 1 ± 0.2 | 24 ± 2 | 19.07 ± 0.7 | 2085 ± 43 | 423 ± 49 |
| 8 | 250 ± 28 | 1529 ± 54 | 1 ± 0.4 | 25 ± 1 | 18.28 ± 0.5 | 1907 ± 56 | 529 ± 31 |
| 9 | 174 ± 16 | 1045 ± 32 | 1 ± 0.3 | 20 ± 1 | 14.06 ± 0.6 | 1773 ± 48 | 520 ± 46 |
| 10 | 167 ± 19 | 1021 ± 25 | 1 ± 0.3 | 23 ± 2 | 12.48 ± 0.7 | 1418 ± 36 | 360 ± 28 |
| 11 *** | 1 ± 0.6 | 4 ± 2 | 1 ± 0.1 | 18 ± 1 | 0.90 ± 0.2 | 440 ± 20 | 105 ± 17 |
| 12 | 5 ± 2 | 16 ± 3 | 1 ± 0.1 | 17 ± 1 | 1.69 ± 0.4 | 618 ± 32 | 250 ± 34 |
| 13 | 8 ± 2 | 28 ± 3 | 1 ± 0.2 | 15 ± 1 | 2.48 ± 0.5 | 795 ± 30 | 450 ± 28 |
| 14 | 12 ± 2 | 40 ± 2 | 1 ± 0.2 | 14 ± 1 | 3.27 ± 0.6 | 973 ± 48 | 747 ± 59 |
| 15 **** | 15 ± 3 | 52 ± 4 | 1 ± 0.2 | 12 ± 1 | 4.06 ± 0.7 | 1150 ± 78 | 840 ± 52 |
| Iris pseudocorus | Juncus effusus | Phragmites australis | Iris pseudocorus | Juncus effusus | Phragmites australis | Iris pseudocorus | Juncus effusus | Phragmites australis | ||||||||||
|---|---|---|---|---|---|---|---|---|---|---|---|---|---|---|---|---|---|---|
| Black Sand | Yellow Sand | Control | ||||||||||||||||
| Root | ||||||||||||||||||
| Media | SD | Media | SD | Media | SD | Media | SD | Media | SD | Media | SD | Media | SD | Media | SD | Media | SD | |
| Cu_R | 22 | 8 | 23 | 3 | 19 | 3 | 16 | 15 | 29 | 15 | 33 | 25 | 20 | 18 | 20 | 7 | 21 | 11 |
| Fe_R | 0.44 | 0.28 | 0.54 | 0.50 | 0.46 | 0 42 | 0.29 | 0.17 | 4.12 | 2.68 | 3.16 | 2.94 | 0.82 | 0.12 | 0.57 | 0.50 | 0.58 | 0.12 |
| Pb_R | 33 | 27 | 59 | 54 | 16 | 9 | 169 | 94 | 248 | 140 | 125 | 96 | 18 | 18 | 21 | 11 | 23 | 22 |
| As_R | 37 | 32 | 11 | 6 | 14 | 12 | 272 | 164 | 225 | 212 | 409 | 145 | 15 | 14 | 21 | 17 | 16 | 20 |
| Zn_R | 624 | 305 | 723 | 645 | 514 | 385 | 284 | 130 | 291 | 183 | 521 | 234 | 176 | 113 | 373 | 332 | 132 | 59 |
| Cd_R | 2 | 2 | 1 | 1 | 1 | 1 | <Q.L | 1 | 1 | 1 | 1 | 1 | <Q.L | |||||
| Mn R | 228 | 214 | 296 | 206 | 566 | 520 | 85 | 109 | 246 | 189 | 471 | 397 | 331 | 326 | 216 | 130 | 172 | 164 |
| Leaf | ||||||||||||||||||
| Cu_L | 8 | 4 | 17 | 4 | 13 | 3 | 11 | 5 | 11 | 6 | 12 | 7 | 10 | 9 | 7 | 2 | 8 | 3 |
| Fe_L | 356 | 145 | 543 | 377 | 461 | 357 | 2231 | 3346 | 1105 | 822 | 634 | 270 | 368 | 153 | 160 | 73 | 188 | 63 |
| Pb_L | 7 | 7 | 8 | 5 | 4 | 4 | 14 | 10 | 17 | 11 | 4 | 3 | 6 | 4 | 2 | 1 | 4 | 5 |
| As_L | 4 | 7 | 2 | 3 | 1 | 0.5 | 13 | 13 | 10 | 9 | 4 | 5 | 1 | 0.5 | 1 | 0.5 | 1 | 1 |
| Zn_L | 132 | 57 | 333 | 143 | 248 | 100 | 131 | 105 | 156 | 112 | 152 | 43 | 143 | 80 | 138 | 41 | 106 | 18 |
| Cd_L | <Q.L | 1 | 0.1 | <Q.L | <Q.L | <Q.L | <Q.L | <Q.L | <Q.L | <Q.L | ||||||||
| Mn L | 43 | 36 | 163 | 92 | 169 | 37 | 87 | 27 | 74 | 52 | 126 | 65 | 205 | 73 | 100 | 94 | 138 | 87 |
| Rhizosphere | ||||||||||||||||||
| As_Rz | 202 | 54 | 234 | 50 | 220 | 125 | 374 | 72 | 268 | 120 | 527 | 99 | 7 | 6 | 26 | 12 | 24 | 11 |
| Zn_Rz | 6080 | 1235 | 7031 | 827 | 6054 | 1013 | 1500 | 150 | 1526 | 168 | 1633 | 322 | 116 | 47 | 101 | 13 | 93 | 39 |
| Fe_Rz | 26.88 | 5.05 | 28.83 | 4.27 | 27.36 | 4.73 | 20.05 | 4.07 | 21.66 | 4.66 | 23.78 | 5.77 | 4.21 | 1.85 | 4.34 | 0.18 | 5.42 | 1.84 |
| Pb_Rz | 482 | 206 | 483 | 170 | 449 | 209 | 1473 | 179 | 1261 | 235 | 1473 | 179 | 47 | 25 | 66 | 21 | 48 | 27 |
| Cu_Rz | 26 | 4 | 22 | 3 | 30 | 14 | 17 | 4 | 20 | 8 | 26 | 3 | 26 | 7 | 27 | 4 | 27 | 11 |
| Cd_Rz | 9 | 2 | 9 | 1 | 9 | 2 | 2 | 2 | 1 | 0.4 | 1 | 0.4 | 2 | 1 | 2 | 0.5 | 2 | 1 |
| Mn Rz | 4840 | 3300 | 3659 | 2246 | 7048 | 2921 | 436 | 163 | 437 | 120 | 418 | 167 | 633 | 293 | 675 | 280 | 644 | 325 |
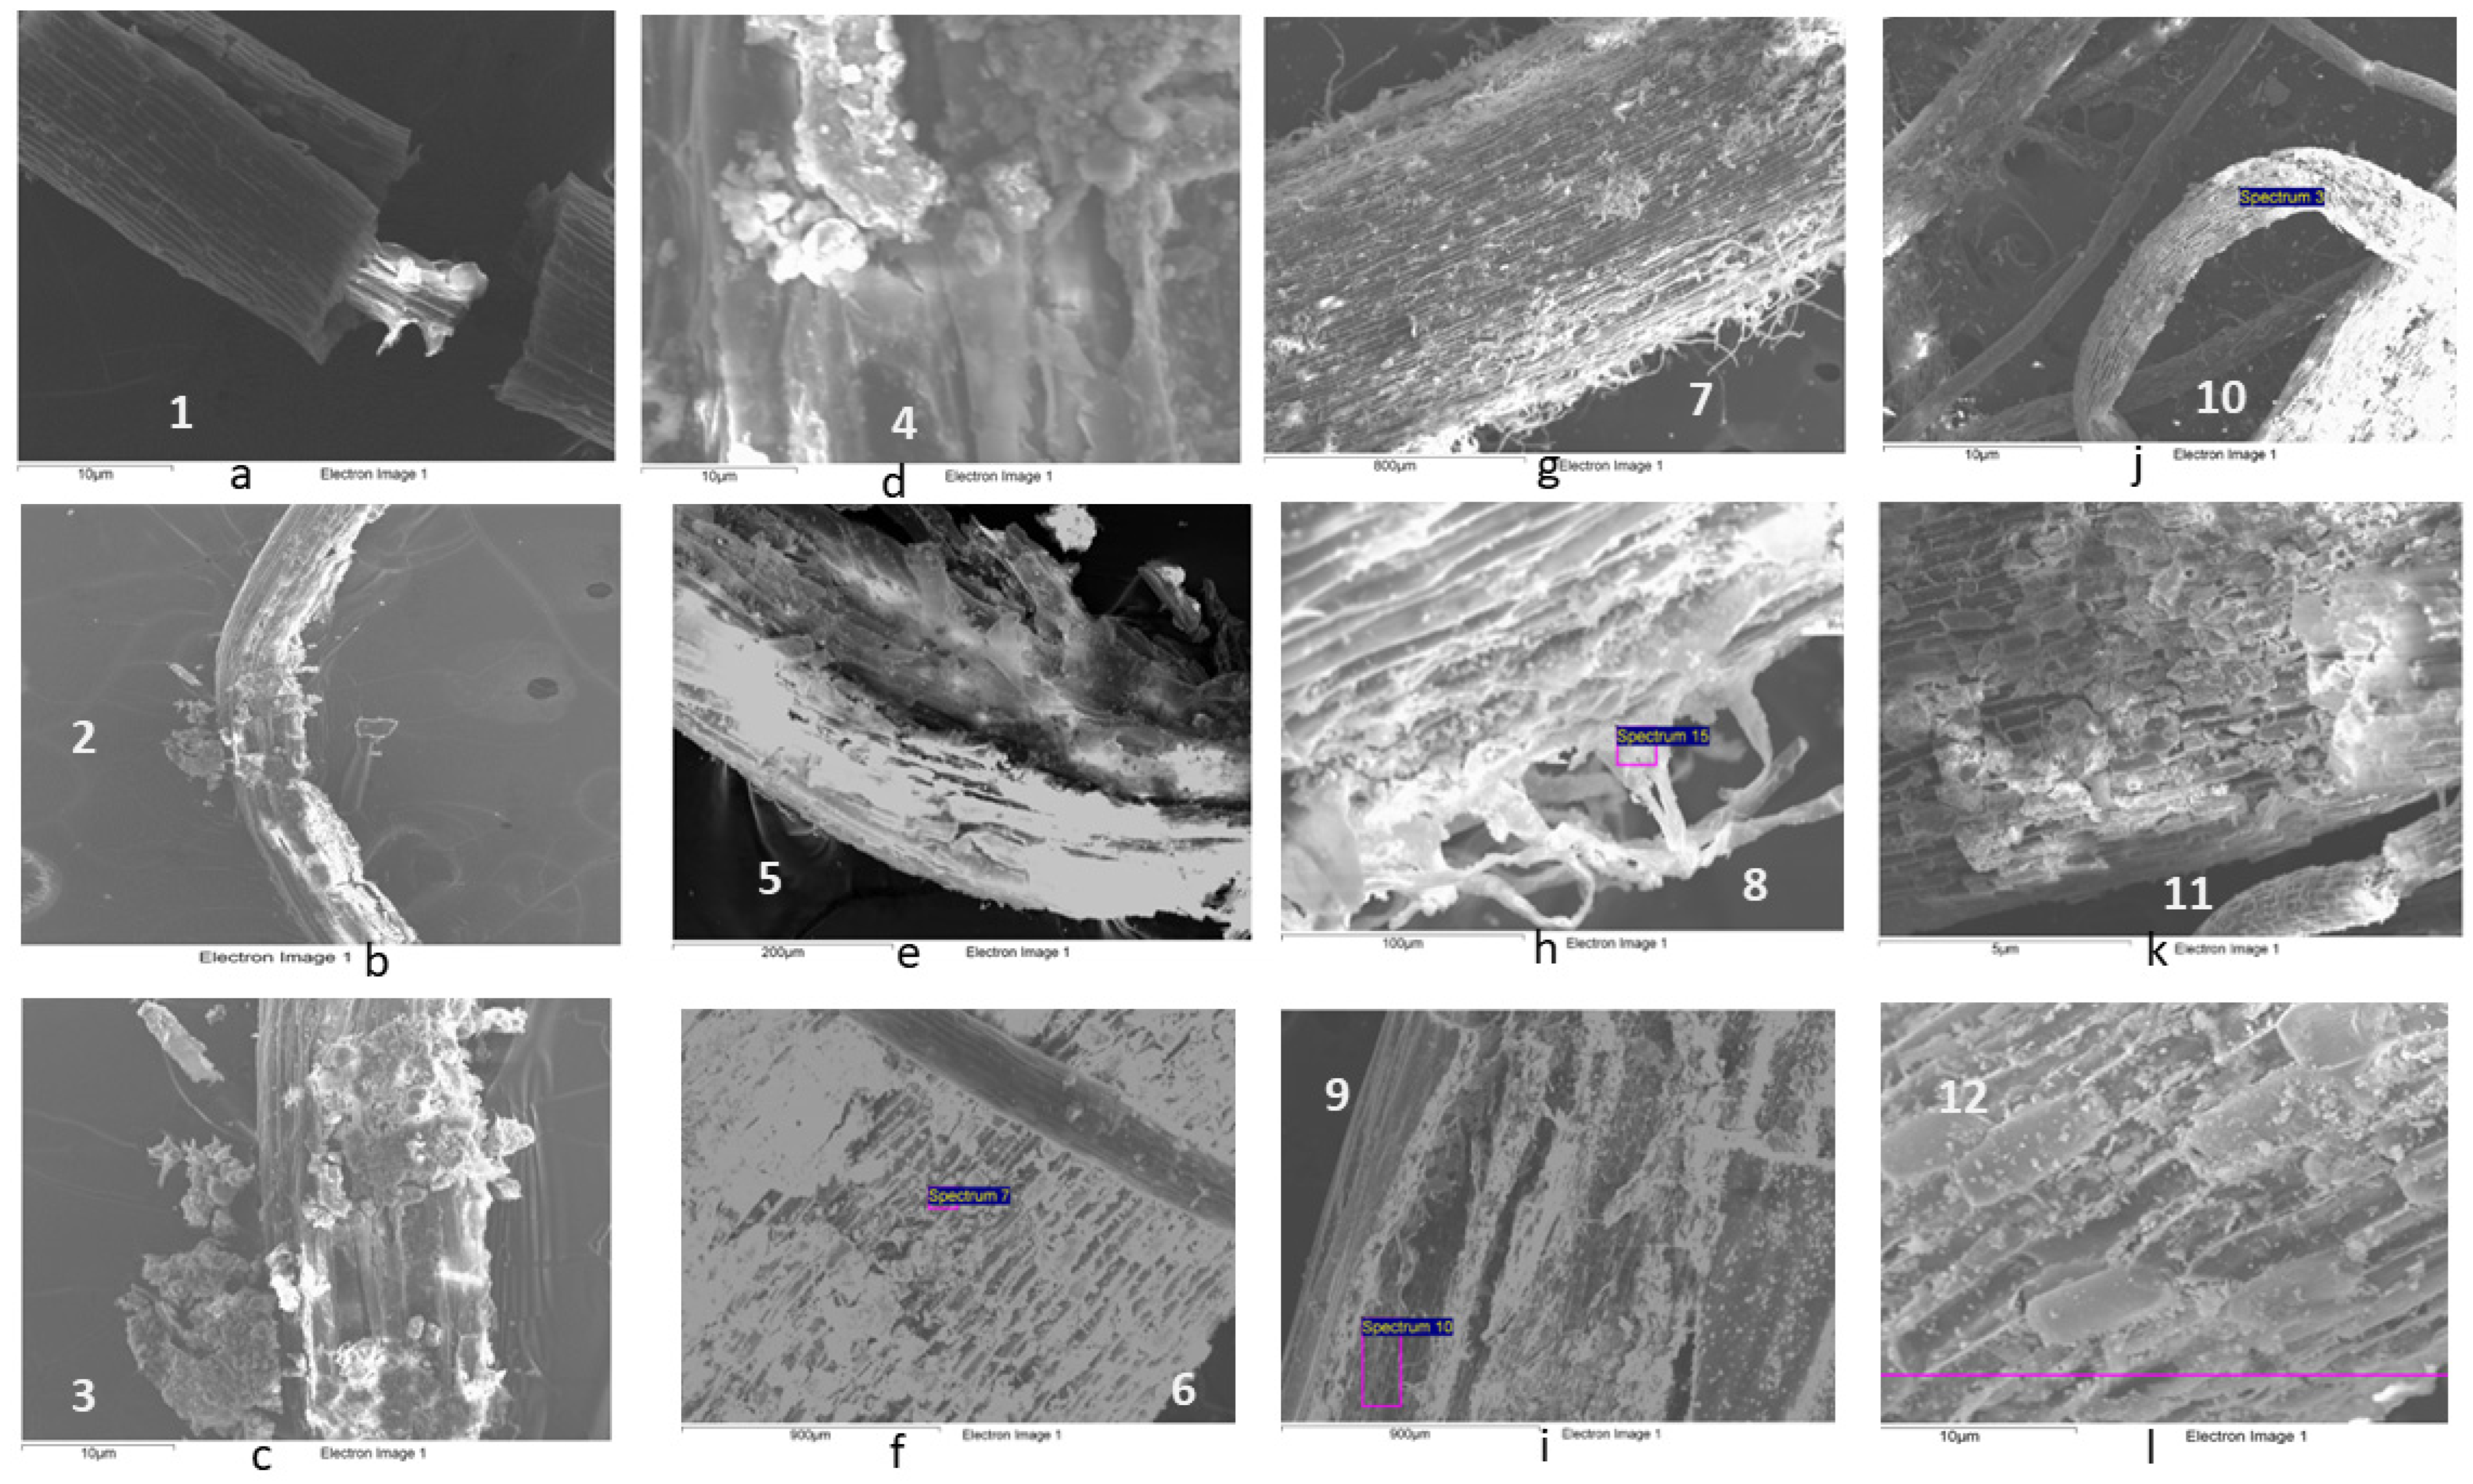
| Element | c Iris pseudacorus | d Iris pseudacorus | f Juncus effusus | h Juncus effusus | i Phragmites australis | l Phragmites australis |
|---|---|---|---|---|---|---|
| O | 17.27 | 27.36 | 28.06 | 29.68 | 11.38 | 32.74 |
| Na | 2.70 | 3.16 | 4.01 | 4.66 | 0.96 | 2.11 |
| Mg | 1.34 | 0.71 | 1.43 | 1.82 | 2.41 | 2.78 |
| Al | 0.68 | 0.71 | 1.26 | 1.66 | 3.13 | 9.55 |
| Si | 7.93 | 8.61 | 3.57 | 3.95 | 11.71 | 17.14 |
| P | 0.46 | 0.20 | 0.27 | 0.20 | 0.22 | 0.28 |
| S | 1.75 | 1.98 | 13.35 | 14.26 | 6.73 | 2.45 |
| Cl | 5.49 | 6.46 | 1.76 | 1.51 | 3.32 | 1.65 |
| K | 4.59 | 5.31 | 3.80 | 5.71 | 3.71 | 4.69 |
| Ca | 2.46 | 1.99 | 1.53 | 2.13 | 7.48 | 2.73 |
| Mn | 0.52 | 0.20 | 0.12 | 0.16 | 0.07 | 0.23 |
| Fe | 53.50 | 40.29 | 36.85 | 30.21 | 44.02 | 23.14 |
| Cu | 0.40 | 1.12 | 0.27 | 0.34 | 0.32 | 0.26 |
| Zn | 0.50 | 0.40 | 0.28 | 0.40 | 0.73 | 0.30 |
| As L | 2.43 | 0.66 | 0.59 | 0.71 | 0.57 | 0.66 |
| Pb | 0.22 | 2.82 | 2.87 | 2.64 | 2.28 | 0.20 |
| Cd | 0.30 | 0.15 | 0.50 | 0.13 | 0.55 | 32.74 |
| BS (%) | YS (%) | TS (%) | Peat (%) | LF | |
|---|---|---|---|---|---|
| 1 | 100 | ||||
| 2 | 75 | 25 | |||
| 3 | 75 | 25 | |||
| 4 | 50 | 50 | |||
| 5 | 50 | 50 | |||
| 6 | 70 | 30 | |||
| 7 | 52.5 | 25 | 22.3 | ||
| 8 | 52.5 | 25 | 22.3 | ||
| 9 | 35 | 50 | 15 | ||
| 10 | 35 | 50 | 15 | ||
| 11 | 100 | ||||
| 12 | 25 | 75 | |||
| 13 | 50 | 50 | |||
| 14 | 75 | 25 | |||
| 15 | 100 |
Disclaimer/Publisher’s Note: The statements, opinions and data contained in all publications are solely those of the individual author(s) and contributor(s) and not of MDPI and/or the editor(s). MDPI and/or the editor(s) disclaim responsibility for any injury to people or property resulting from any ideas, methods, instructions or products referred to in the content. |
© 2024 by the authors. Licensee MDPI, Basel, Switzerland. This article is an open access article distributed under the terms and conditions of the Creative Commons Attribution (CC BY) license (https://creativecommons.org/licenses/by/4.0/).
Share and Cite
Hernández-Pérez, C.; Martínez-López, S.; Martínez-Sánchez, M.J.; Martínez-Martínez, L.B.; García-Lorenzo, M.L.; Perez Sirvent, C. In Situ Use of Mining Substrates for Wetland Construction: Results of a Pilot Experiment. Plants 2024, 13, 1161. https://doi.org/10.3390/plants13081161
Hernández-Pérez C, Martínez-López S, Martínez-Sánchez MJ, Martínez-Martínez LB, García-Lorenzo ML, Perez Sirvent C. In Situ Use of Mining Substrates for Wetland Construction: Results of a Pilot Experiment. Plants. 2024; 13(8):1161. https://doi.org/10.3390/plants13081161
Chicago/Turabian StyleHernández-Pérez, Carmen, Salvadora Martínez-López, María José Martínez-Sánchez, Lucia Belén Martínez-Martínez, María Luz García-Lorenzo, and Carmen Perez Sirvent. 2024. "In Situ Use of Mining Substrates for Wetland Construction: Results of a Pilot Experiment" Plants 13, no. 8: 1161. https://doi.org/10.3390/plants13081161