
Variation among Soybean Cultivars in Mesophyll Conductance and Leaf Water Use Efficiency


USDA-ARS, Crop Systems and Global Change Laboratory, Beltsville, MD 20705, USA
Plants 2016, 5(4), 44; https://doi.org/10.3390/plants5040044
Submission received: 14 September 2016
/
Revised: 30 November 2016
/
Accepted: 7 December 2016
/
Published: 11 December 2016
(This article belongs to the Special Issue Abiotic Environmental Stress Responses of Plants)
Abstract
:Improving water use efficiency (WUE) may prove a useful way to adapt crop species to drought. Since the recognition of the importance of mesophyll conductance to CO2 movement from inside stomatal pores to the sites of photosynthetic carboxylation, there has been interest in how much intraspecific variation in mesophyll conductance (gm) exists, and how such variation may impact leaf WUE within C3 species. In this study, the gm and leaf WUE of fifteen cultivars of soybeans grown under controlled conditions were measured under standardized environmental conditions. Leaf WUE varied by a factor of 2.6 among the cultivars, and gm varied by a factor of 8.6. However, there was no significant correlation (r = −0.047) between gm and leaf WUE. Leaf WUE was linearly related to the sub-stomatal CO2 concentration. The value of gm affected the ratio of maximum Rubisco carboxylation capacity calculated from the sub-stomatal CO2 concentration to that calculated from the CO2 concentration at the site of carboxylation. That is, variation in gm affected the efficiency of Rubisco carboxylation, but not leaf WUE. Nevertheless, there is considerable scope for genetically improving soybean leaf water use efficiency.
1. Introduction
With increasing limitations on the amount of water available to support agriculture, increasing the water use efficiency (WUE) of crops—the ratio of crop dry mass gained to water consumed—is a reasonable objective. Selection for high leaf WUE in wheat improved yield in dry conditions [1]. Leaf WUE is often defined as the ratio of photosynthesis to transpiration. However, the rate of transpiration is directly related to the difference in water vapor pressure between the air inside and outside the leaf (the leaf to air vapor pressure difference, LAVPD), so the LAVPD during the measurement has a large impact on WUE. Because of this, comparisons of leaf WUE often use “intrinsic” water use efficiency [2], the ratio of photosynthesis to stomatal conductance.
Limitations to C3 photosynthesis at high light and at the current ambient CO2 concentration have long been quantified by the maximum capacity of rubisco carboxylation (VCmax) [3]. However, it has been recognized within the last several years that mesophyll conductance to CO2 movement from inside the stomata to the site of fixation within chloroplasts (gm) can be a significant limitation to photosynthesis (A) [4,5]. Because of the potential of variation in gm to affect A independently from stomatal conductance (gs), there is interest in determining the extent of variation in gm within species, and its effect on leaf WUE.
Intraspecific variation in gm has been reported in barley [6], grape [7], tomato [8], wheat [9], and rice [10], and its relationship to leaf WUE examined. In grape and barley, gm was positively correlated with leaf WUE. In tomato and rice, variation was found in the ratio of gm to gs, and that ratio was correlated with leaf WUE. In wheat variation, gm was correlated with A, but there was no clear relationship between gm and leaf WUE.
Among these studies, gm was quantified either from leaf fluorescence changes with CO2 concentration, or from carbon isotope discrimination, both of which methods are based on assumptions which are sometimes dubious [11,12,13]. A more rapid method for estimating gm, with fewer assumptions, has been developed based on the response of photosynthesis to oxygen concentration [14], and was used here to screen fifteen cultivars of soybean for gm and to test for relationships among gm, gs, A, and leaf WUE. Genetic improvement of WUE depends upon sufficient genetic variation in WUE and the identification of physiological processes which affect it, which, as indicated by the literature cited, may vary with crop species. The goals of this study were to determine whether variation in intrinsic leaf WUE or gm occurred in soybean measured under standardized conditions, and to determine whether any variation in gm was related to variation in intrinsic leaf WUE.
2. Results
The cultivars differed significantly in gs, gm, leaf intrinsic WUE, sub-stomatal CO2 concentration (Ci), and the CO2 concentration at rubisco (Cc), but not in VCmCc (VCmax based on Cc), VCmCi (VCmax based on Cc), or A (Table 1). For cultivars with high and low values of gm, the values estimated using the initial slope of A vs. Ci agreed with those using the O2 effect. Intrinsic leaf WUE varied by a factor of 2.6 among the cultivars, with Fiskeby having the highest, and Ford having the lowest WUE (Table 1). Mesophyll conductance varied by a factor of 8.6 among cultivars, with Biloxi having the highest and Clark the lowest mean values. Variation in cultivar means of intrinsic WUE was due mostly to variation in gs, which ranged from 0.38 to 1.12 mmol H2O m−2·s−1, rather than photosynthesis, which ranged from 23.7 to 31.1 μ mol CO2 m−2·s−1. Fiskeby, with the highest WUE, had the second lowest gs, and Ford, with the lowest WUE, had the highest gs. For all individual leaf measurements, intrinsic WUE was strongly negatively related to gs, with the reciprocal of WUE linearly related to gs (Figure 1). Ci ranged from about 225 to 345 μ mol·mol−1 and there was a negative linear relationship between Ci and intrinsic WUE (Figure 2).
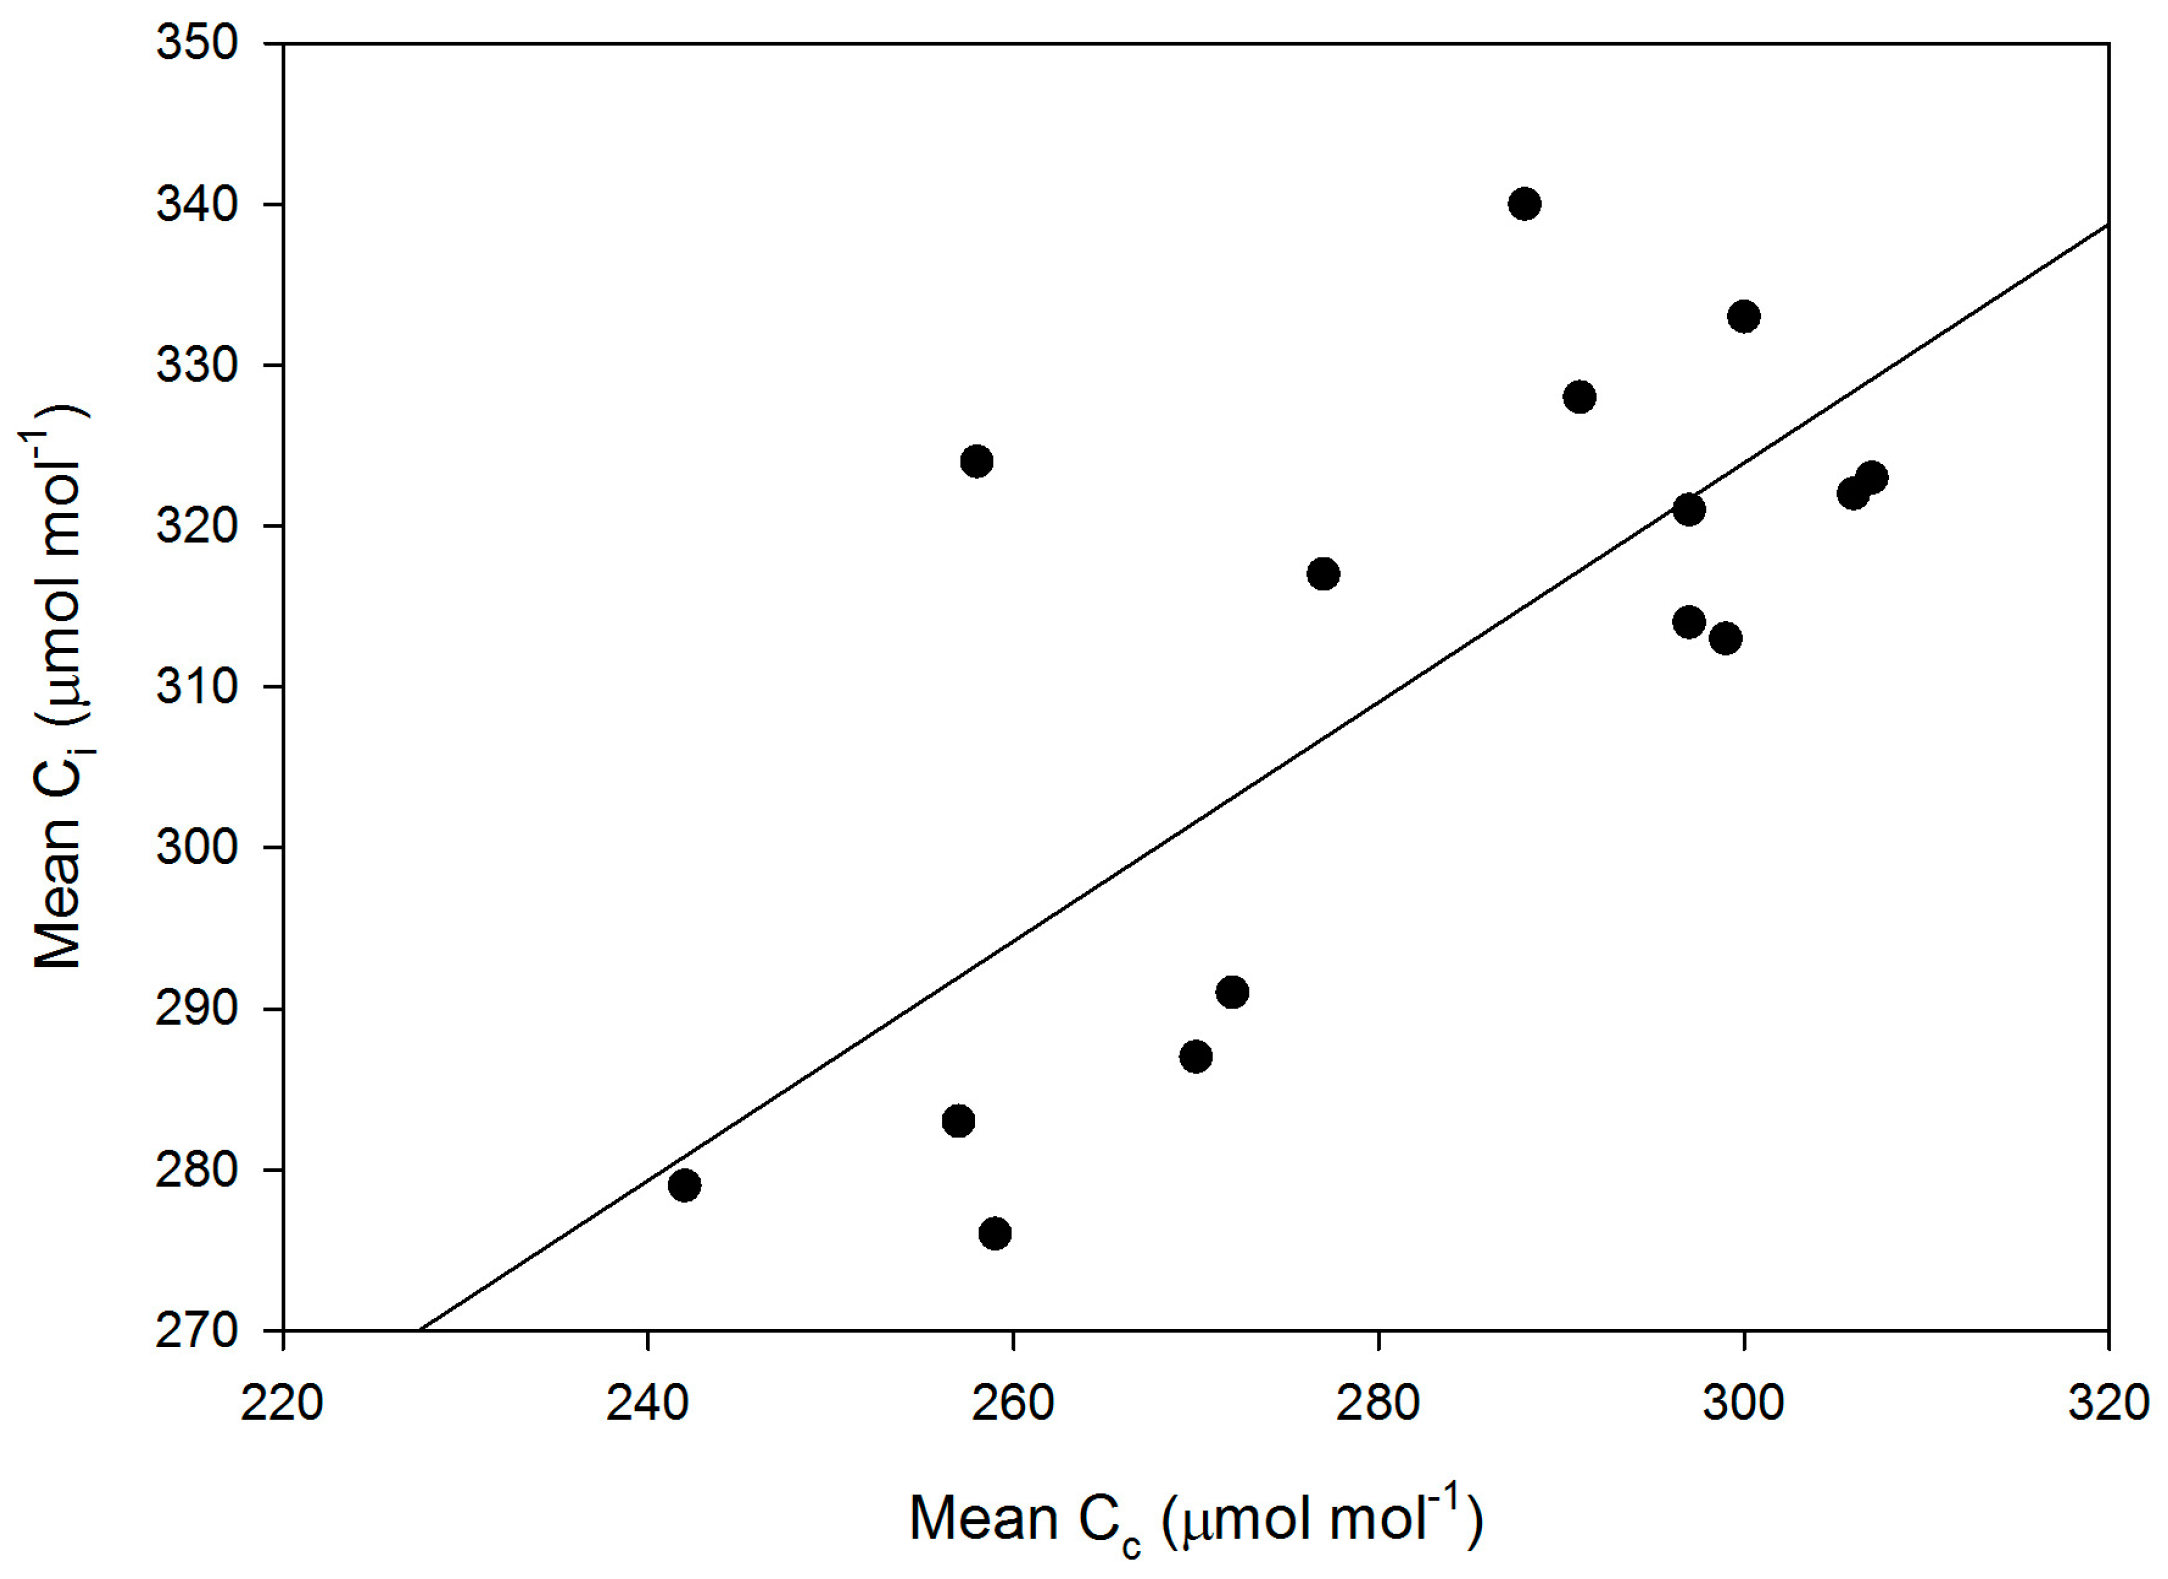
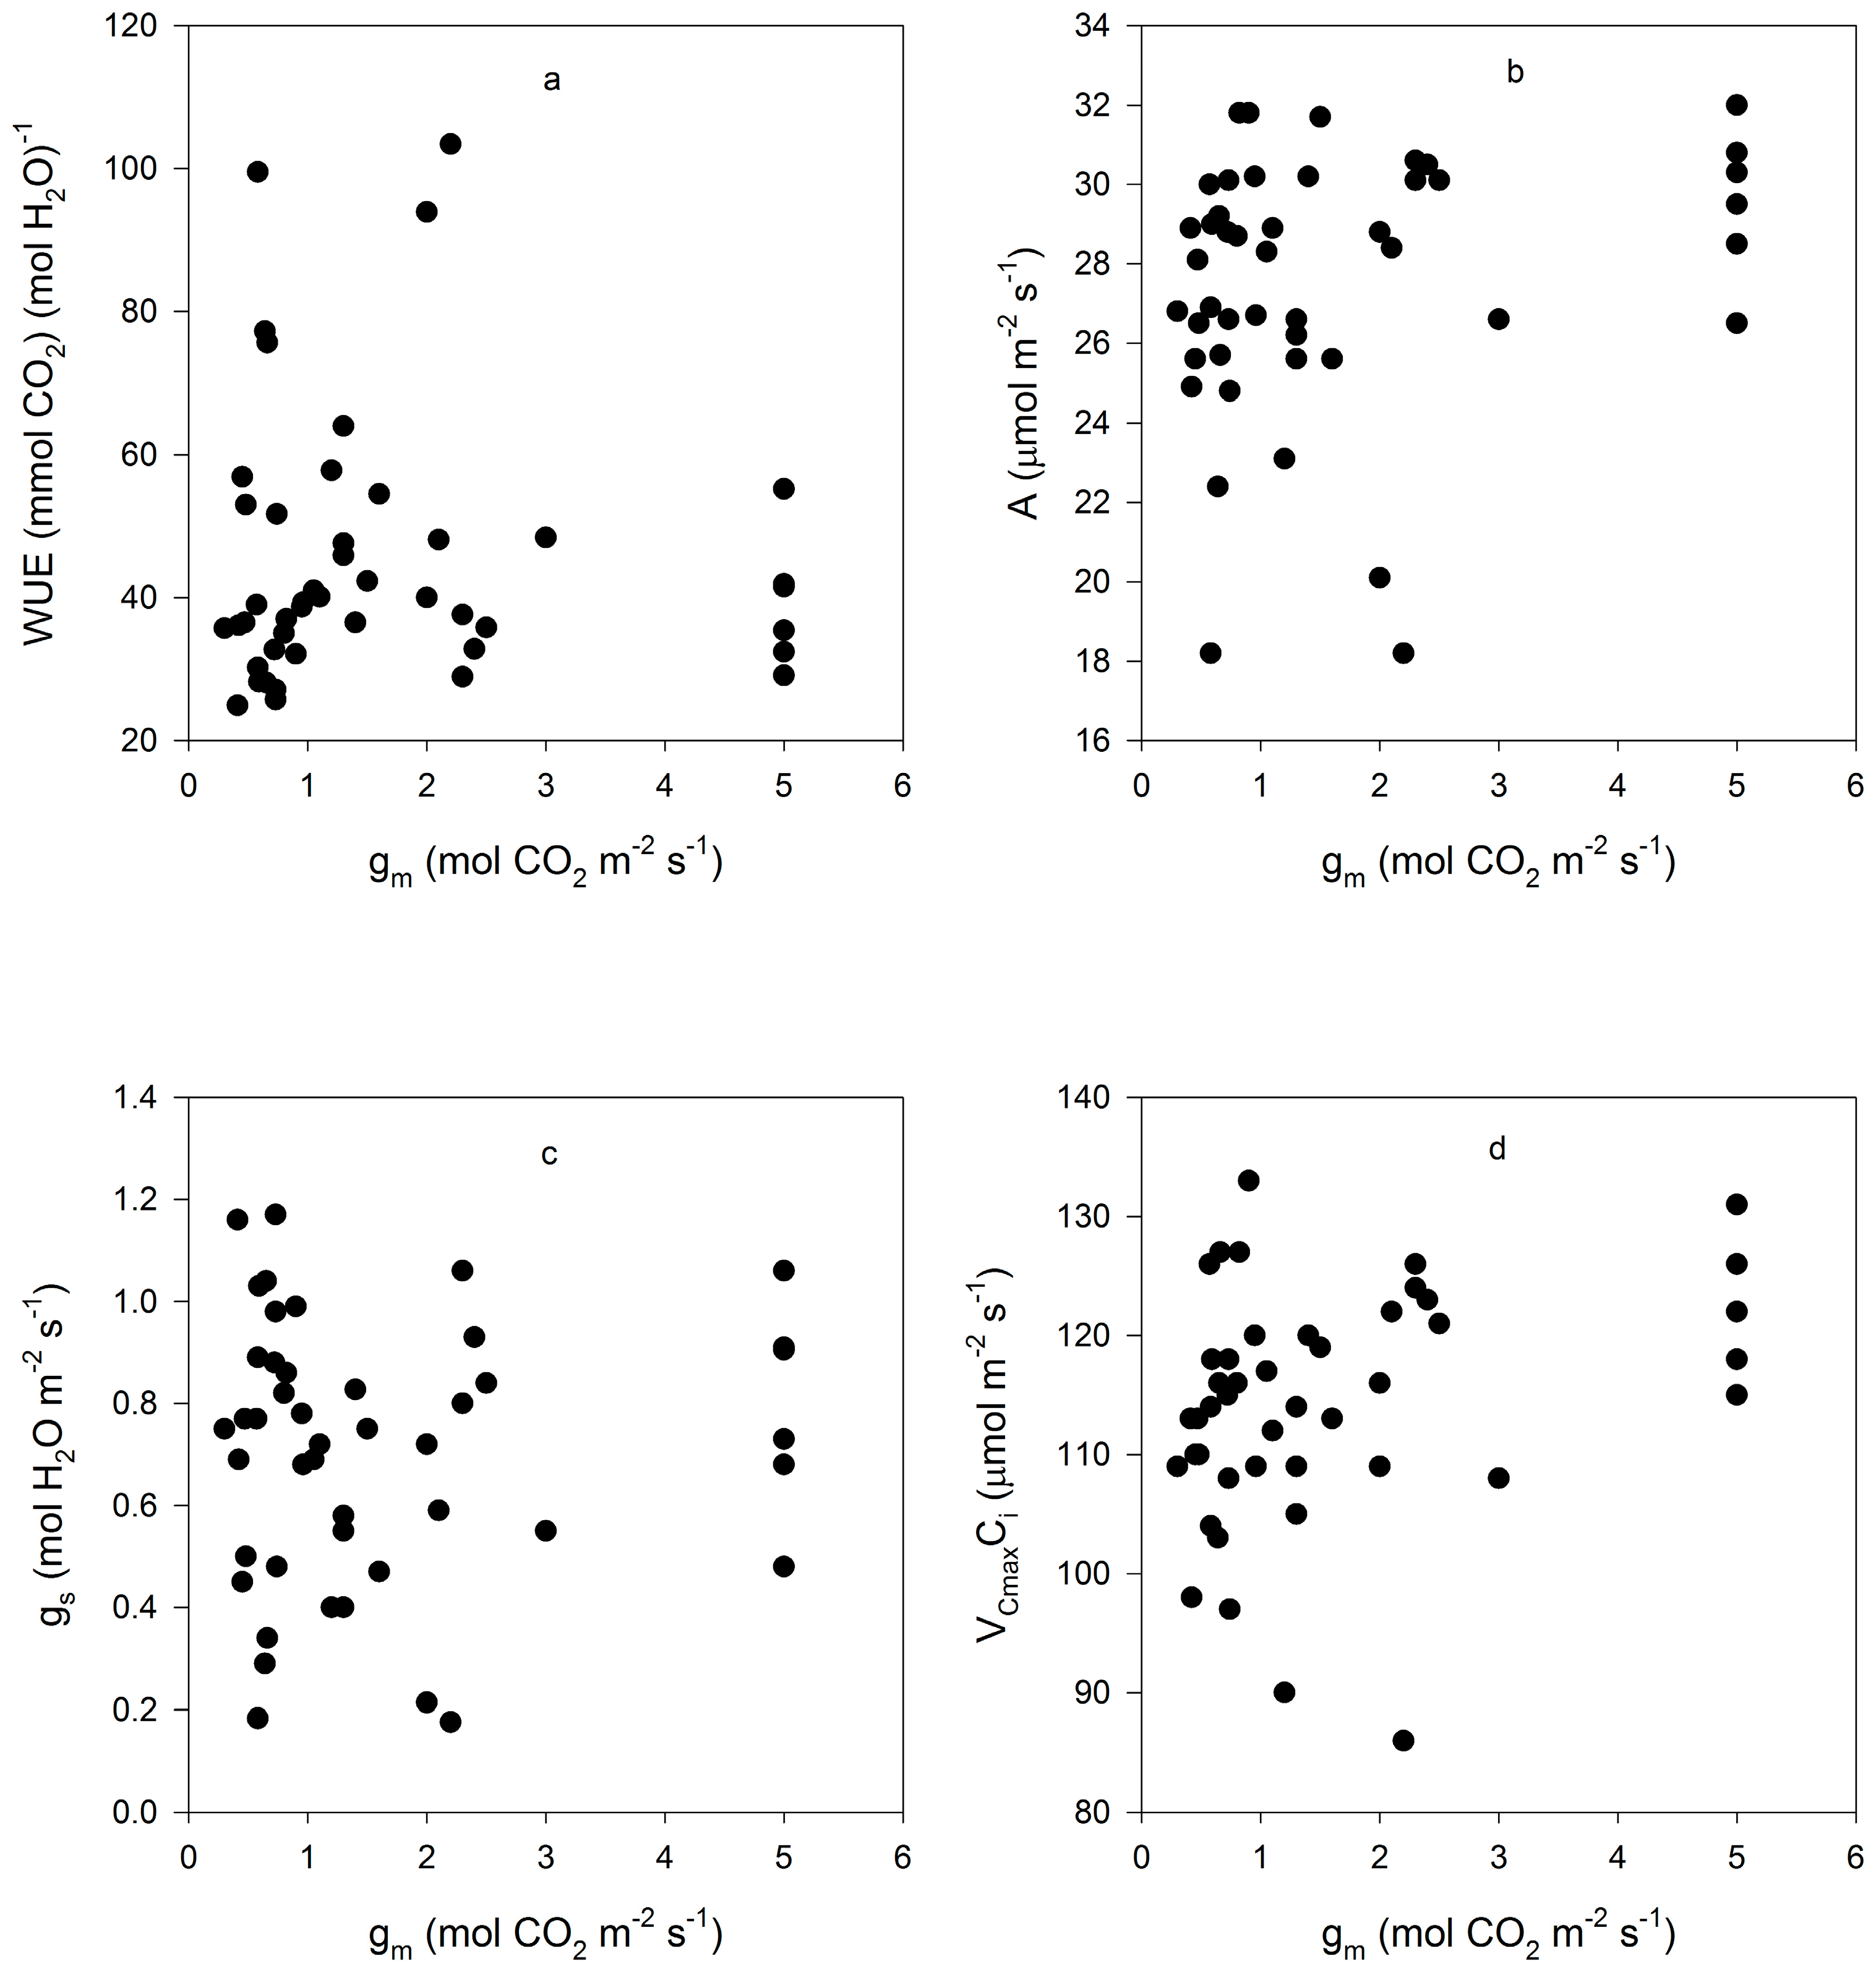
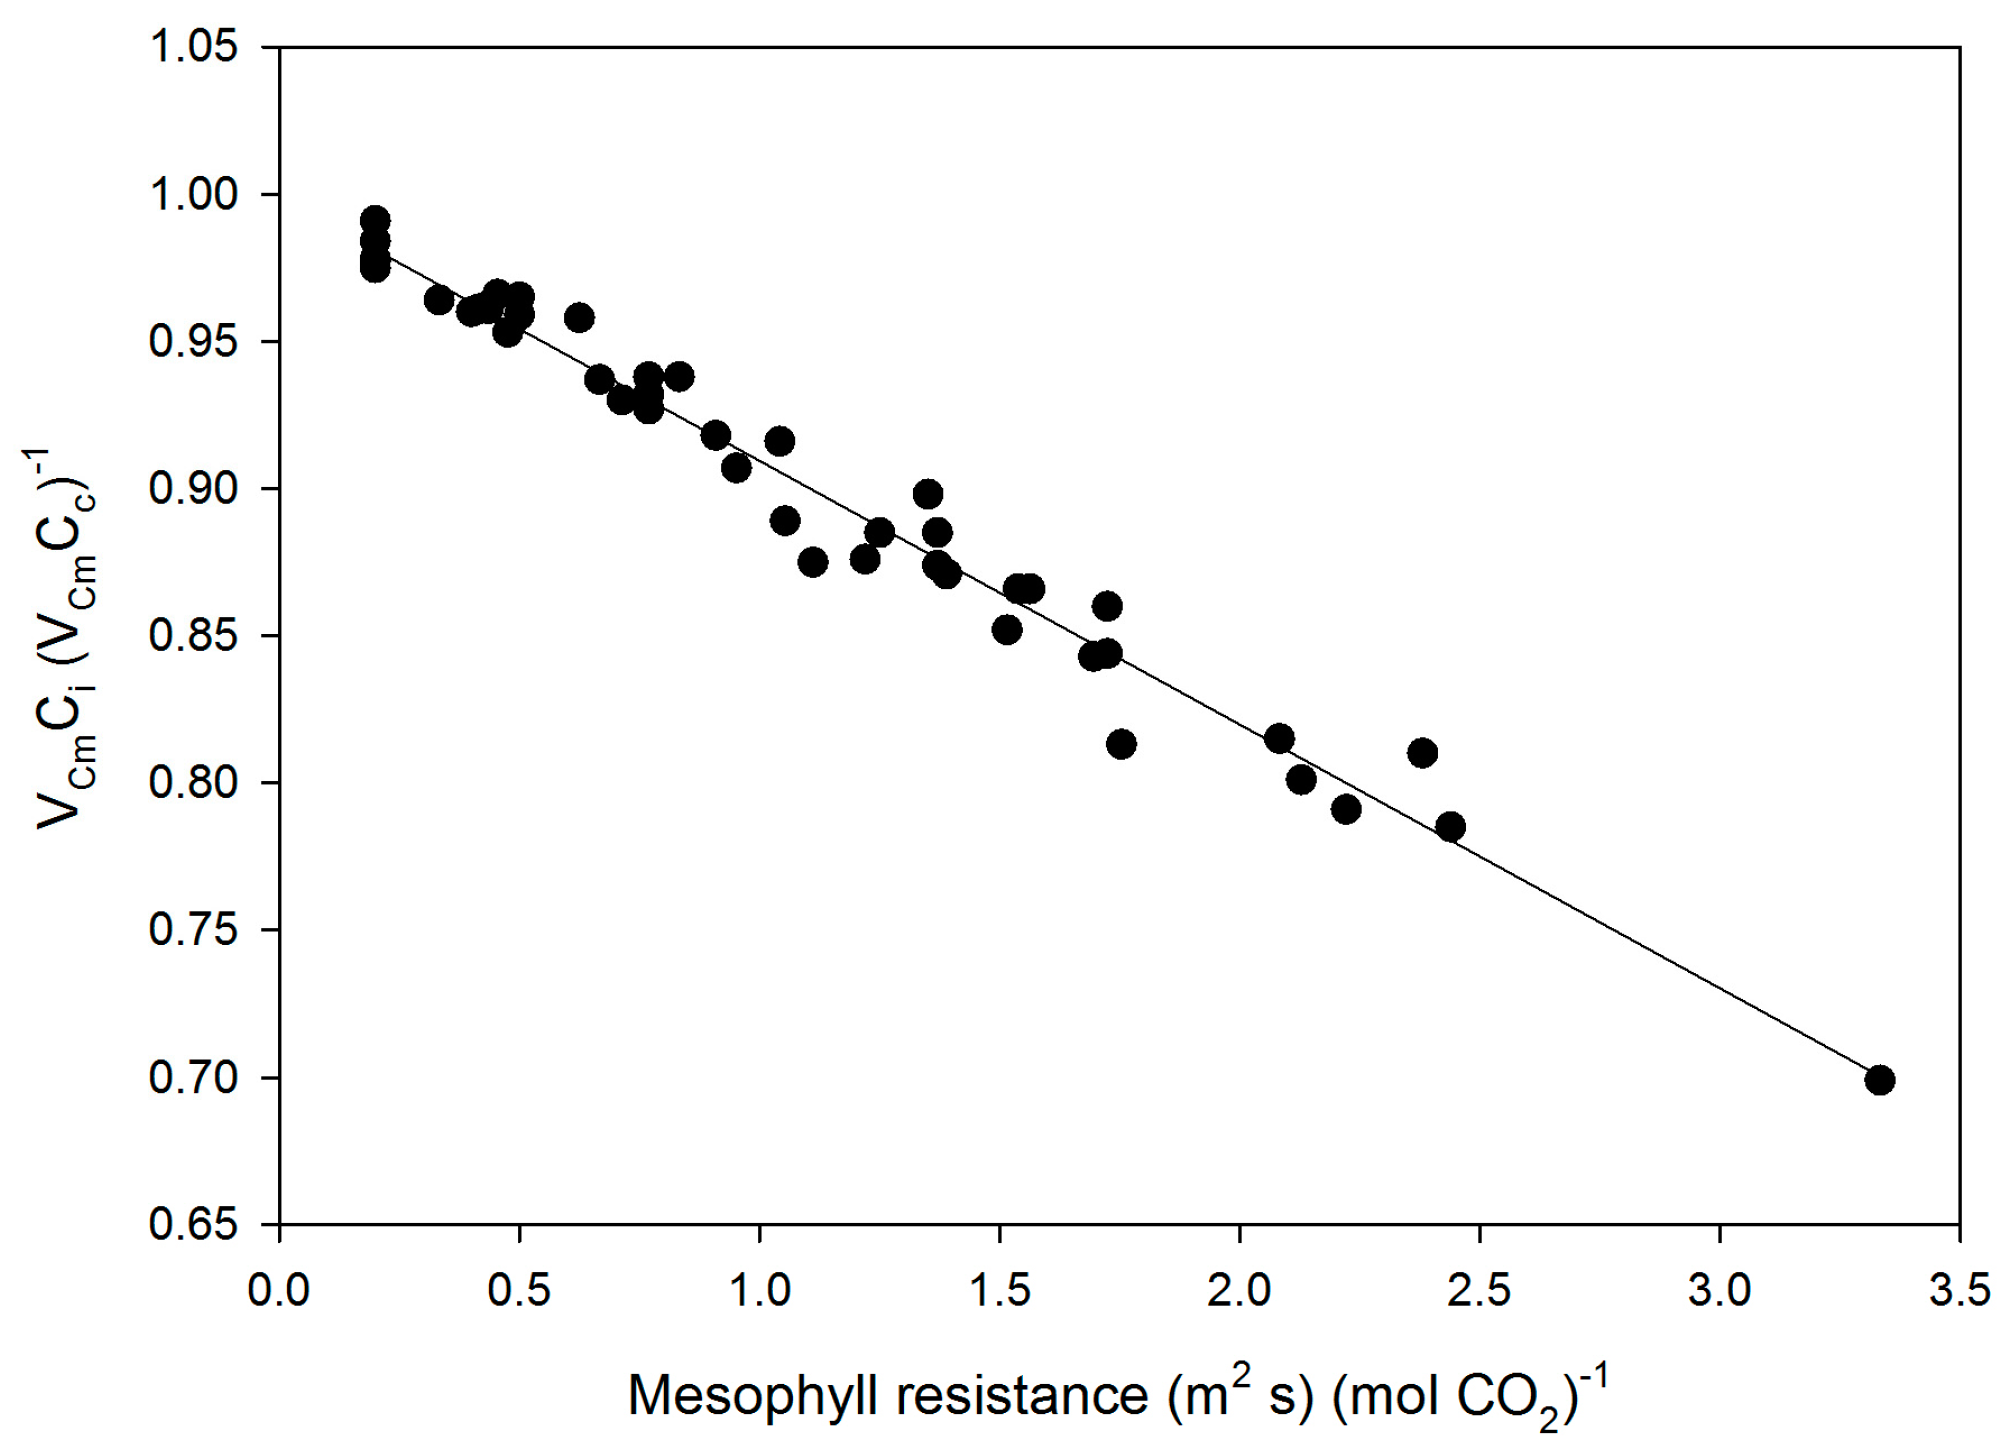
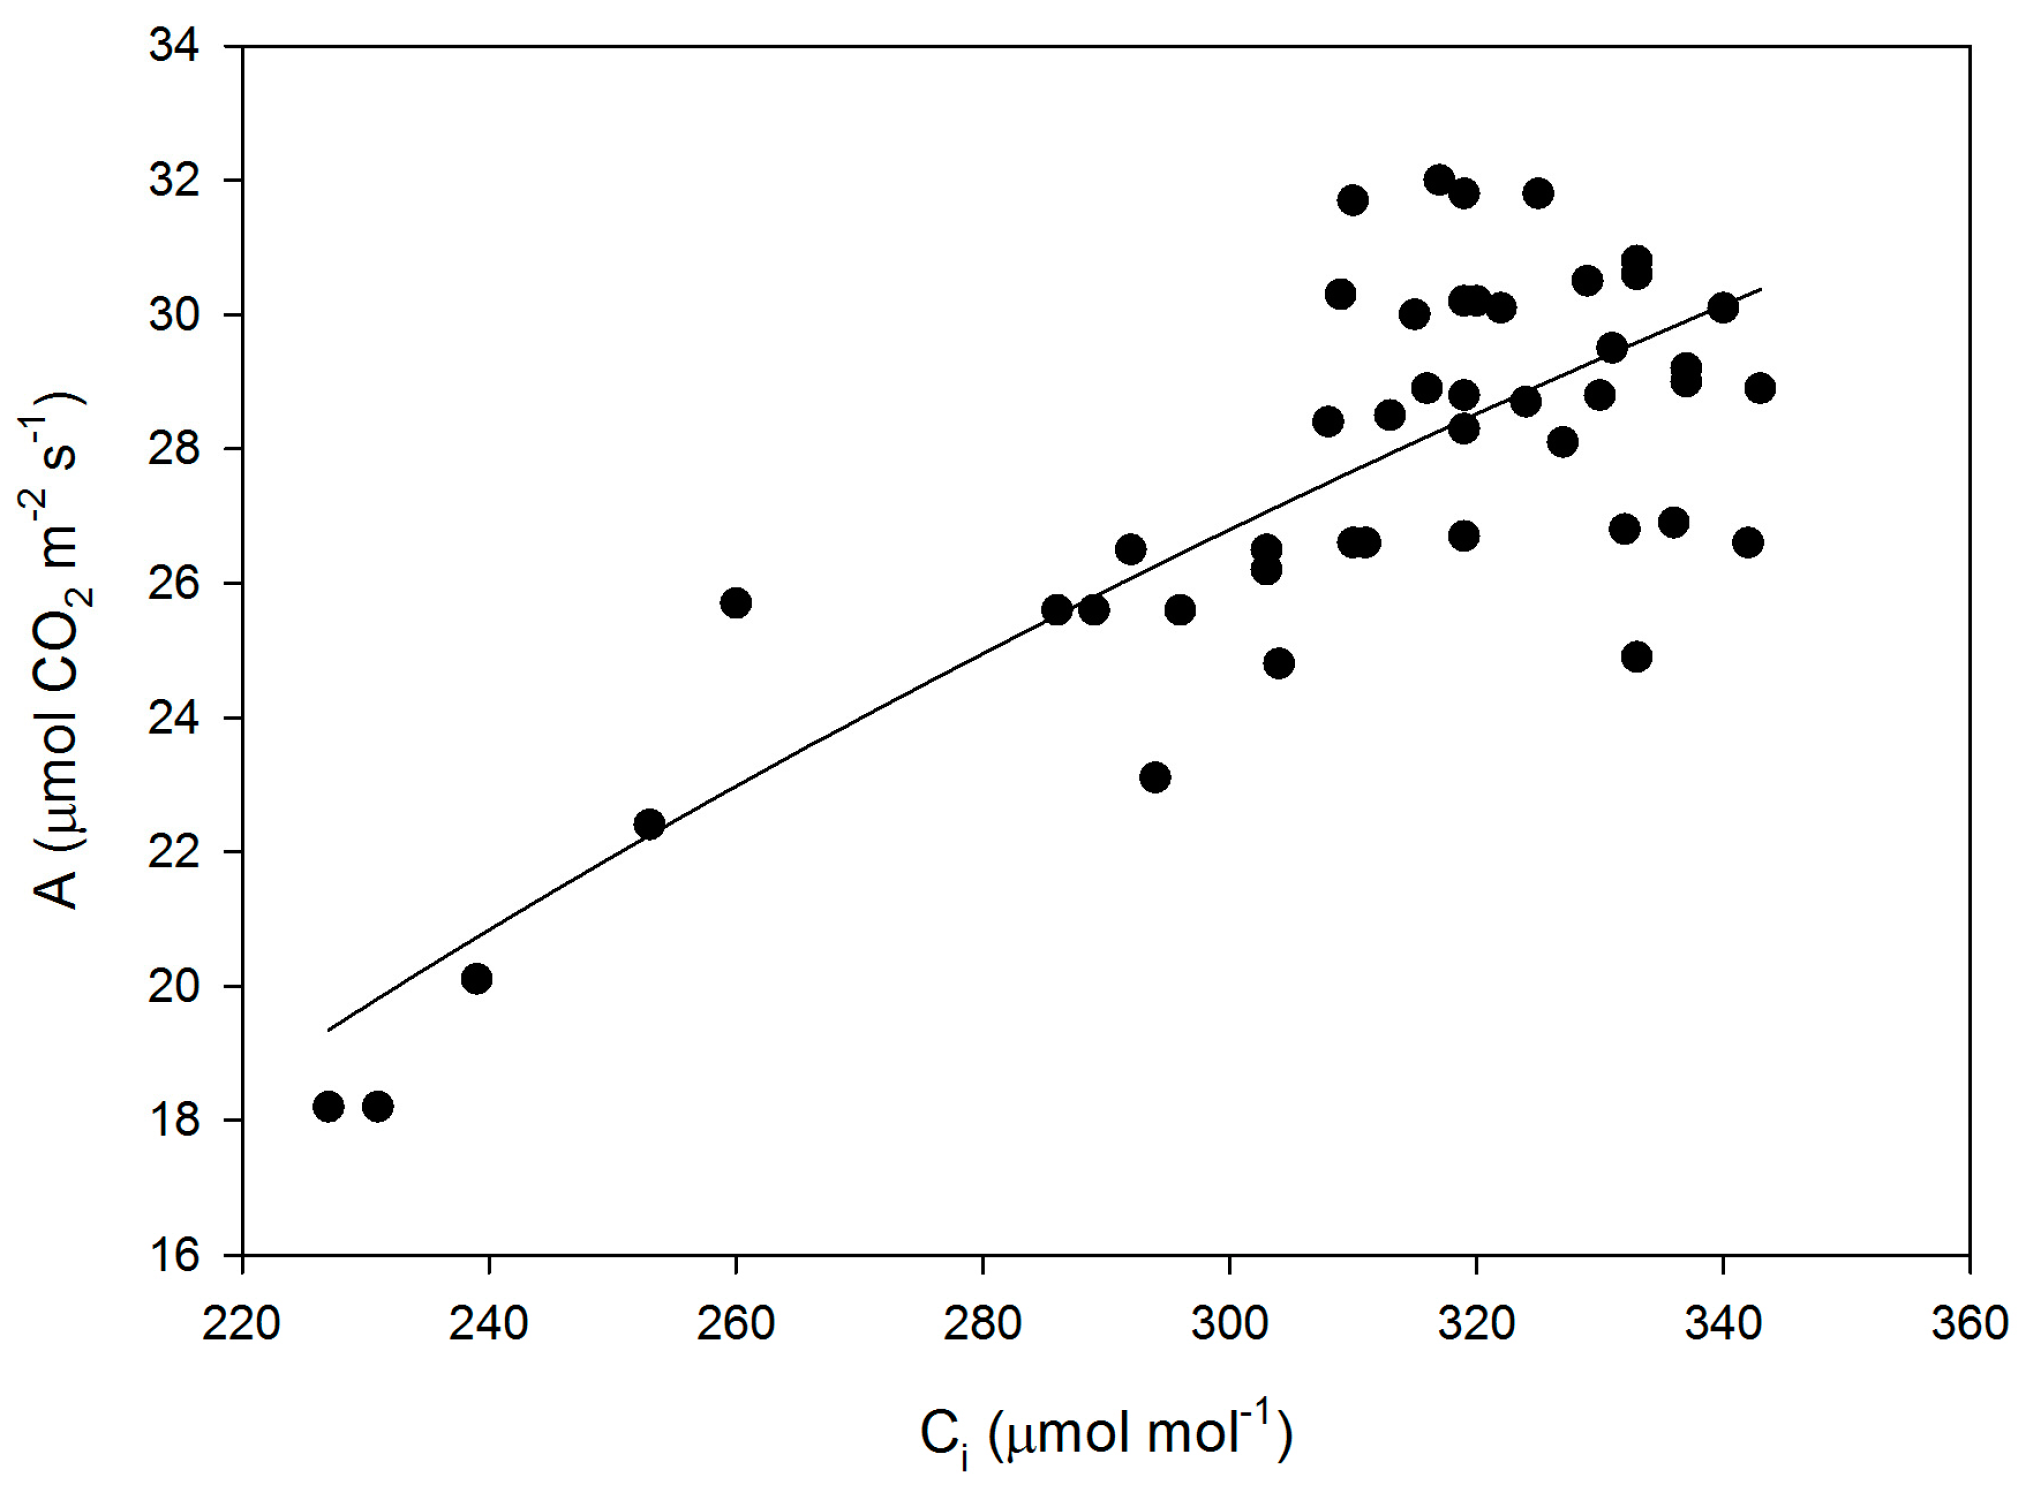
Mesophyll conductance had no significant correlation with intrinsic WUE (r = −0.047), gs (r = +0.065), A (r = +0.234), or VCmaxCi (r = +0.227) (Figure 3). Using means for the cultivars for all of these parameters also produced no significant correlations (r = 0.079, 0.217, 0.040, and 0.301, for gm versus intrinsic WUE, gs, A, and VCmaxCi, respectively). The ratio of gm to gs in soybean had a small but significant correlation with intrinsic leaf WUE (Figure 4), but there was no significant correlation between Ci and gm (Figure 4). The ratio of the maximum capacity of rubisco carboxylation modelled based on Ci to that that based on Cc decreased with mesophyll resistance, which is the reciprocal of gm, from about 0.70 to 0.98 (Figure 5). Photosynthesis at Ca = 400 μ mol·mol−1 was positively related to Ci (Figure 6), similar to a saturating A vs. Ci curve for an individual leaf. While there was a small but significant correlation between Ci and Cc (Figure 7), there was a wide range of Ci values for a given Cc. For example cultivar means of Ci ranged from about 275 to 325 μ mol·mol−1 for mean Cc values of about 256 to 259 μ mol·mol−1 (Figure 7).
3. Discussion
The linear relationship between intrinsic leaf WUE and Ci was as expected, since Ca was constant across the measurements. Carbon isotope discrimination has long been used as a surrogate for Ci in screening for leaf WUE in C3 species. It is important to know how much variation in gm would disrupt the correlation between Ci (and WUE) and carbon isotope discrimination, which should reflect Cc rather than Ci [6]. The ranking of these soybean cultivars based on Cc or carbon isotope discrimination would not provide a reliable ranking of their Ci or intrinsic leaf WUE values (Figure 7).
While variation among cultivars in Ci was more strongly influenced by variation in gs than A, there was still the usual [15] penalty in A associated with low gs, low Ci and high intrinsic WUE (Figure 5). One reason for interest in gm with regard to WUE is the possibility that high gm might offset the penalty in A associated with low Ci and high WUE [16]. Certainly, a high gm results in a higher value of A at a given Ci, and results in VCmCi being closer to VCmCc (Figure 4). However, gm was poorly correlated with any other leaf gas exchange parameter (gs, A, Ci, VCmCi, WUE) in this data. It is possible that the correlation between the ratio of gm to gs and WUE reported in rice and tomato [8,10] has little to do with variation in gm, but simply reflects a strong relationship between gs and WUE, as found here in soybean. Furthermore, it remains unknown how much a genetic increase in gm might cost in terms of leaf nitrogen, which would tend to offset the resulting increased efficiency of rubisco [16]. It is thought that there is a metabolic component to gm, and that therefore there would be some nitrogen cost to increasing gm [16]. Reasons for cultivar differences in the operational Ci under these identical and non-stressful environmental conditions remain unknown, but gs and the operational Ci were clearly the primary determinates of leaf intrinsic WUE among these soybean leaves.
The observed 2.95 fold range in mean gs among soybean cultivars would have a substantial impact on canopy transpiration, even though relative differences in transpiration decrease as the scale increases from leaf to canopy [17]. Using the mean leaf boundary layer conductance of 1200 mmol (H2O) m−2·s−1 of soybean leaves measured near midday on 9 days in Beltsville, Maryland [18], a 2.95 fold range in leaf gs would translate into approximately a 1.45 fold range in canopy transpiration. Such a large range in canopy transpiration could have a substantial impact on the rate of development of plant water stress in the field. Thus, there is considerable scope for reduction in canopy transpiration rate and improvement in soybean WUE through breeding. However, the results of this study make it unlikely that screening soybeans for gm values would be a profitable method of attempting to increase WUE in soybean.
It should be noted that the intrinsic leaf WUE and gs values measured here were measured under a standardized LAVPD. “Intrinsic” leaf WUE is, of course, not really intrinsic to the leaf, but would be expected to vary with the measurement conditions, as A and gs vary with environment. The response of gs to LAVPD in soybean is known to vary among cultivars [19]. Fletcher et al. [20] have identified lines of soybeans differing in the response of whole plant transpiration rate to LAVPD, but did not provide information about either gs or photosynthetic responses to LAVPD, or information on leaf WUE. Field measurements of gs and A in response to LAVPD in several soybean cultivars [21] did not present data on operational Ci.
Our results indicated that gs and Ci were correlated with leaf intrinsic WUE, and may be useful in selecting lines with high WUE. However, the lack of correlation between gm and leaf intrinsic WUE indicates that gm may not be useful in ranking lines for WUE, although both factors varied among cultivars. It will be important to assess the operational Ci of soybean lines under a range of field conditions to determine how robust the differences in leaf intrinsic WUE found here are in the field. The results presented here also indicate that carbon isotope discrimination may not reliably identify soybean lines with differences in leaf intrinsic WUE.
4. Materials and Methods
Three or four plants of each of fifteen cultivars of soybean (Glycine max L. Merr.) obtained from the U.S. Department of Agriculture soybean germplasm collection (Table 1) were grown together in one large controlled environment chamber at the controlled environment facility of the Beltsville Agricultural Research Center, Beltsville, Maryland. All of the cultivars are adapted to the eastern United States. Some (Biloxi, Clark, Kent, PI-471938, A5959) were chosen because they had diverse responses of stomatal conductance or transpiration rate to humidity in prior studies [19,20]. The others were chosen based on my prior measurements of leaf gas exchange rates in various experiments. The chamber had 14 h of light per day at 1000 μ mol m−2·s−1 photosynthetic photon flux density (PPFD) from a combination of metal halide and high pressure sodium lamps. This gave a daily total photon flux similar to average mid-summer days at Beltsville, Maryland. The day/night air temperatures were 26/20 °C, with a dew point temperature of about 18 °C. These approximate mean conditions in Beltsville for the soybean growing season. The CO2 concentration was controlled at 400 μ mol·mol−1 during the day and 430 μ mol·mol−1 at night by the addition of pure CO2 or air scrubbed of CO2, under the control of a WMA-5 (PP Systems, Amesbury, MA, USA) infrared analyzer which sampled chamber air continuously. Plants were grown one per pot in 15 cm diameter plastic pots filled with vermiculite and were fertilized daily with a complete nutrient solution containing 14.5 mN nitrogen.
Leaf gas exchange measurements were conducted on fourth main stem trifoliolate leaves a few days after those leaves reached full area expansion. Leaf gas exchange measurements were made with a recently calibrated Li-6400 portable photosynthesis system (Li-Cor, Inc., Lincoln, NE, USA). Leaf temperature was controlled at 25 °C, the PPFD was 1500 μ mol m−2·s−1, and the LAVPD was maintained at 1.0 ± 0.1 kPa. Each leaf was measured under three conditions of CO2 and O2. First, the leaf was exposed to 21% O2, and 400 μ mol·mol−1 external CO2. The external CO2 was then lowered to 300 μ mol mol−1 at the same O2 concentration. Finally, the oxygen concentration was lowered to 2%, while the CO2 concentration remained at 300 μ mol·mol−1. Care was taken to ensure that gas exchange rates were steady at each condition. These measurements were made on three or four replicate leaves from different plants for each cultivar. A, gs, Ci, and LAVPD were calculated by the instrument software.
Intrinsic leaf WUE was calculated separately for each leaf as A/gs measured at 400 ± 5 μ mol mol−1 CO2, and 21% O2, at 25 °C, and at a LAVPD of 1 kPa. Mesophyll conductance was also calculated for each leaf from the gas exchange rates at 300 μ mol·mol−1 CO2 at 21% and 2% O2 using the method described in Bunce [14], with the calculation utility developed by Singh [22]. The method is based on the idea that the sensitivity of photosynthesis to oxygen depends on the concentration of CO2 at the site of Rubisco, rather than the sub-stomatal CO2 concentration. This method of estimating gm uses the change in photosynthetic rate between two O2 concentrations at limiting CO2 concentrations to indicate the CO2 concentration at the site of rubisco (Cc), using a standard biochemical C3 photosynthesis model [14]. This method of estimating gm also provides estimates of VCmax based on Ci and based on Cc. For some leaves with the highest and lowest values of gm, additional points on A vs. Ci curves at 21% O2 were used to calculate gm using the Sharkey et al. calculation utility [23] based on the curvature of the initial slope of the A vs. Ci curve.
Analysis of variance was used to test for differences among cultivars in mean leaf gas exchange parameters. For both gs and gm, homogeneity of variance was violated, so values were log transformed prior to ANOVA. Correlations among gas exchange parameters were calculated using all data on individual leaves, because of the increased statistical power compared with using mean values, given the substantial variability among leaves with cultivars. Where correlations were significant at p = 0.05, linear or simple non-linear regressions are presented.
Conflicts of Interest
The author declares no conflict of interest.
References
- Condon, A.G.; Richards, R.A.; Rebetzke, G.L.; Farquhar, G.D. Breeding for high water-use efficiency. J. Exp. Bot. 2004, 55, 2447–2460. [Google Scholar] [CrossRef] [PubMed]
- Seibt, U.; Rajabi, A.; Griffiths, H.; Berry, J.A. Carbon isotopes and water use efficiency: Sense and sensitivity. Oecologia 2008, 155, 441–454. [Google Scholar] [CrossRef] [PubMed]
- Farquhar, G.D.; von Caemmerer, S.; Berry, J.A. A biochemical model of photosynthetic CO2 assimilation in leaves of C3 species. Planta 1980, 149, 78–90. [Google Scholar] [CrossRef] [PubMed]
- Warren, C.R. Stand aside stomata, another actor deserves centre stage: The forgotten role of the internal conductance to CO2 transfer. J. Exp. Bot. 2008, 59, 1475–1487. [Google Scholar] [CrossRef] [PubMed]
- Evans, J.R.; Kaldenhoff, R.; Genty, B.; Terashima, I. Resistances along the CO2 diffusion pathway inside leaves. J. Exp. Bot. 2009, 21, 475–495. [Google Scholar] [CrossRef] [PubMed]
- Barbour, M.M.; Warren, C.R.; Farquhar, G.D.; Forrester, G.; Brown, H. Variability in mesophyll conductance between barley genotypes, and effects on transpiration efficiency and carbon isotype discrimination. Plant Cell Environ. 2010, 33, 1176–1185. [Google Scholar] [PubMed]
- Tomas, M.; Medrano, H.; Brugnoli, E.; Escalona, J.M.; Martorell, S.; Pou, A.; Ribas-Carbo, M.; Flexas, J. Variability of mesophyll conductance in grapevine cultivars under water stress conditions in relation to leaf anatomy and water use efficiency. Aust. J. Grape Wine Res. 2014, 20, 272–280. [Google Scholar] [CrossRef]
- Galmes, J.; Conesa, M.A.; Ochogavia, J.M.; Perdomo, J.A.; Francis, D.M.; Ribas-Carbo, M.; Save, R.; Flexas, J.; Medrano, H.; Cifre, J. Physiological and morphological adaptations in relation to water use efficiency in Mediterranean accessions of Solanum lycopersicum. Plant Cell Environ. 2011, 34, 245–260. [Google Scholar] [CrossRef] [PubMed]
- Jahan, E.; Amthor, J.S.; Farquhar, G.D.; Trethowan, R.; Barbour, M.M. Variation in mesophyll conductance among Australian wheat genotypes. Funct. Plant Biol. 2014, 41, 568–580. [Google Scholar] [CrossRef]
- Gioliani, R.; Koteyeva, N.; Voznesenskaya, E.; Evans, M.A.; Cousins, A.B.; Edwards, G.E. Coordination of leaf photosynthesis, transpiration, and structural traits in rice and wild relatives (genus Oryza). Plant Physiol. 2013, 162, 1632–1651. [Google Scholar] [CrossRef] [PubMed]
- Pons, T.L.; Flexas, J.; von Caemmeer, S.; Evans, J.R.; Genty, B.; Ribas-Carbo, M.; Brugnoli, E. Estimating mesophyll conducgtance to CO2: Methodology, potential errors, and recommendations. J. Exp. Bot. 2009, 60, 2217–2234. [Google Scholar] [CrossRef] [PubMed]
- Tholen, D.; Ethier, G.; Genty, B.; Pepin, S.; Zhu, X.-G. Variable mesophyll conductance revisited: Theoretical background and experimental implications. Plant Cell Environ. 2012, 35, 2087–2103. [Google Scholar] [CrossRef] [PubMed]
- Gu, L.; Sun, Y. Artefactual responses of mesophyll conductance to CO2 and irradiance estimated with the variable J and online isotope discrimination methods. Plant Cell Environ. 2014, 37, 1231–1249. [Google Scholar] [CrossRef] [PubMed]
- Bunce, J.A. Use of the response of photosynthesis to oxygen to estimate mesophyll conductance to carbon dioxide in water-stressed soybean leaves. Plant Cell Environ. 2009, 32, 875–881. [Google Scholar] [CrossRef] [PubMed]
- Blum, A. Effective use of water (EUW) and not water-use efficiency (WUE) is the target of crop yield improvement under drought stress. Field Crops Res. 2009, 112, 119–123. [Google Scholar] [CrossRef]
- Buckley, T.N.; Warren, C.R. The role of mesophyll conductance in the economics of nitrogen and water use in photosynthesis. Photosynth. Res. 2014, 119, 77–88. [Google Scholar] [CrossRef] [PubMed]
- Wilson, K.B.; Carlson, T.N.; Bunce, J.A. Feedback significantly influences the simulated effect of CO2 on seasonal evapotranspiration from two agricultural species. Glob. Chang. Biol. 1999, 5, 903–917. [Google Scholar] [CrossRef]
- Bunce, J.A. Use of a minimally invasive method of measuring leaf stomatal conductance to examine stomatal responses to water vapor pressure under field conditions. Agric. Meteorol. 2006, 139, 335–343. [Google Scholar] [CrossRef]
- Bunce, J.A. Identifying soybean lines differing in gas exchange sensitivity to humidity. Ann. Appl. Biol. 1984, 105, 313–318. [Google Scholar] [CrossRef]
- Fletcher, A.L.; Sinclair, T.R.; Allen, L.H., Jr. Transpiration responses to vapor pressure deficit in well water “slow-wilting” and commercial soybean. Environ. Exp. Bot. 2007, 61, 145–151. [Google Scholar] [CrossRef]
- Gilbert, M.E.; Holbrook, N.M.; Zwieniecki, M.A.; Sadok, W.; Sinclair, T.R. Field confirmation of genetic variation in soybean transpiration response to vapor pressure deficit and photosynthetic compensation. Field Crops Res. 2011, 124, 85–92. [Google Scholar] [CrossRef]
- Singh, S.K.; Reddy, V.R. Methods of mesophyll conductance estimation: Its impact on key biochemical parameters and photosynthetic limitations in phosphorus-stressed soybean across CO2. Physiol. Plant. 2016, 157, 234–254. [Google Scholar] [CrossRef] [PubMed]
- Sharkey, T.D.; Bernacchi, C.J.; Farquhar, G.D.; Singsaas, E.L. Fitting photosynthetic carbon dioxide response curves for C3 leaves. Plant Cell Environ. 2007, 30, 1035–1040. [Google Scholar] [CrossRef] [PubMed]
Figure 1.
Leaf intrinsic water use efficiency (WUE) (a); and the reciprocal of leaf intrinsic WUE (b) as a function of stomatal conductance (gs) for all measurements made on fifteen cultivars of soybean. The linear regression of (1/WUE) = 0.0044 + 0.029 × gs had an r2 value of 0.965.
Figure 1.
Leaf intrinsic water use efficiency (WUE) (a); and the reciprocal of leaf intrinsic WUE (b) as a function of stomatal conductance (gs) for all measurements made on fifteen cultivars of soybean. The linear regression of (1/WUE) = 0.0044 + 0.029 × gs had an r2 value of 0.965.
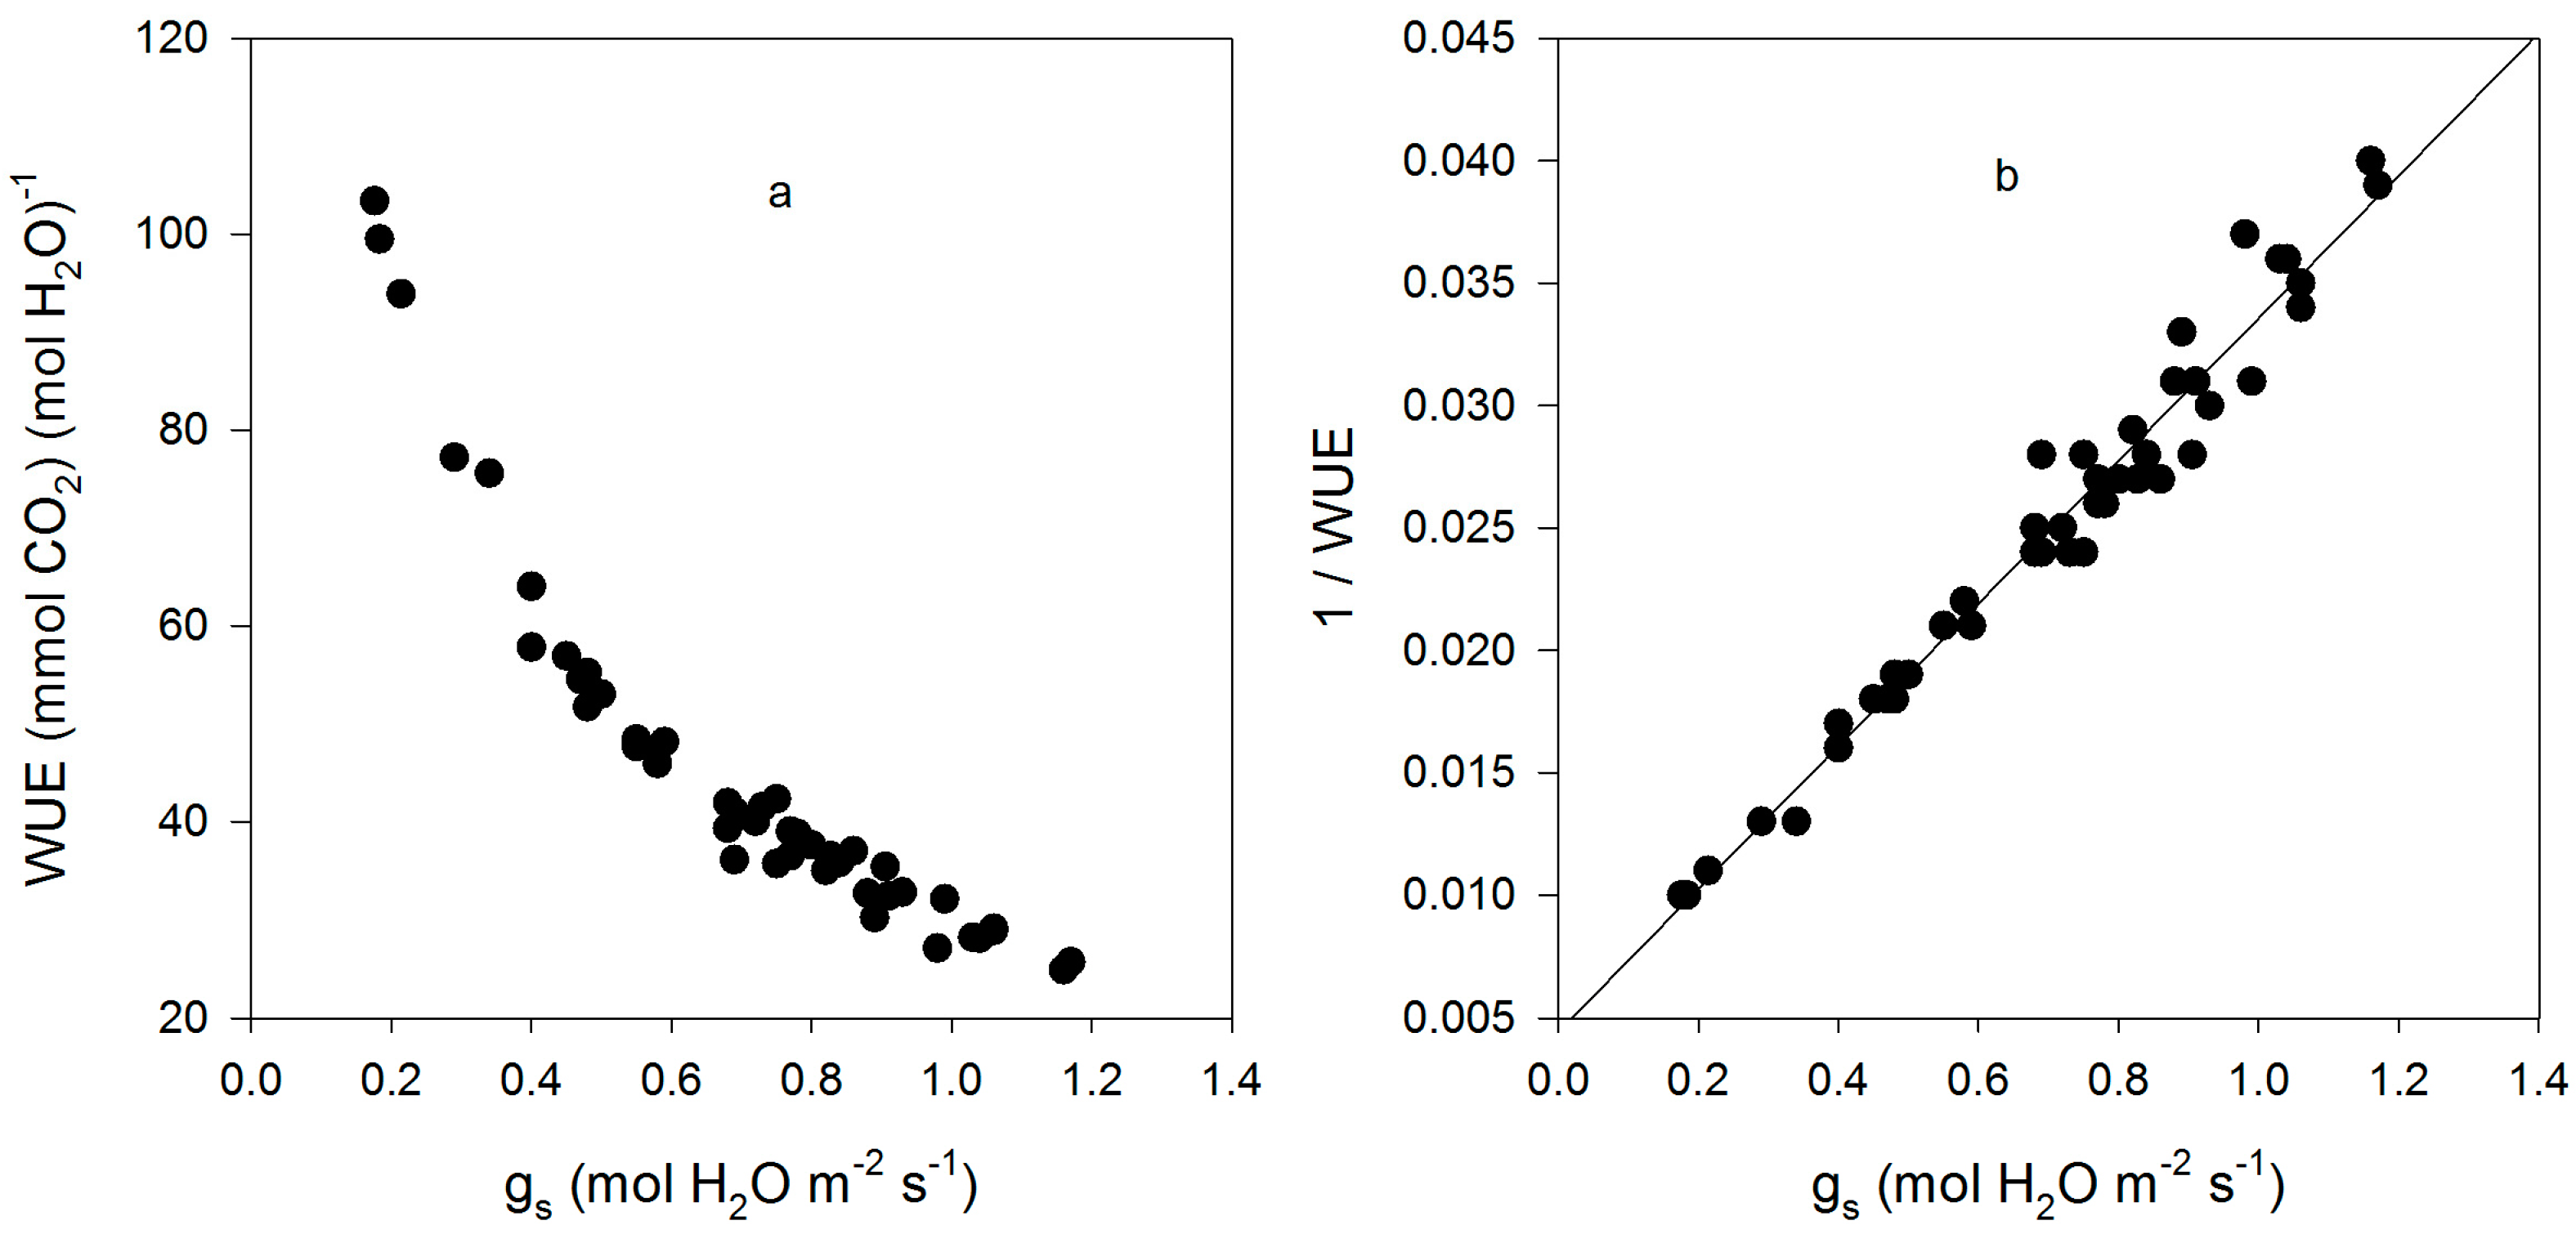
Figure 2.
Leaf intrinsic water use efficiency (WUE) as a function of sub-stomatal CO2 concentration (Ci) for all measurements made on fifteen cultivars of soybean. The linear regression: WUE = 248 − 0.654 × Ci had an r2 of 0.98.
Figure 2.
Leaf intrinsic water use efficiency (WUE) as a function of sub-stomatal CO2 concentration (Ci) for all measurements made on fifteen cultivars of soybean. The linear regression: WUE = 248 − 0.654 × Ci had an r2 of 0.98.
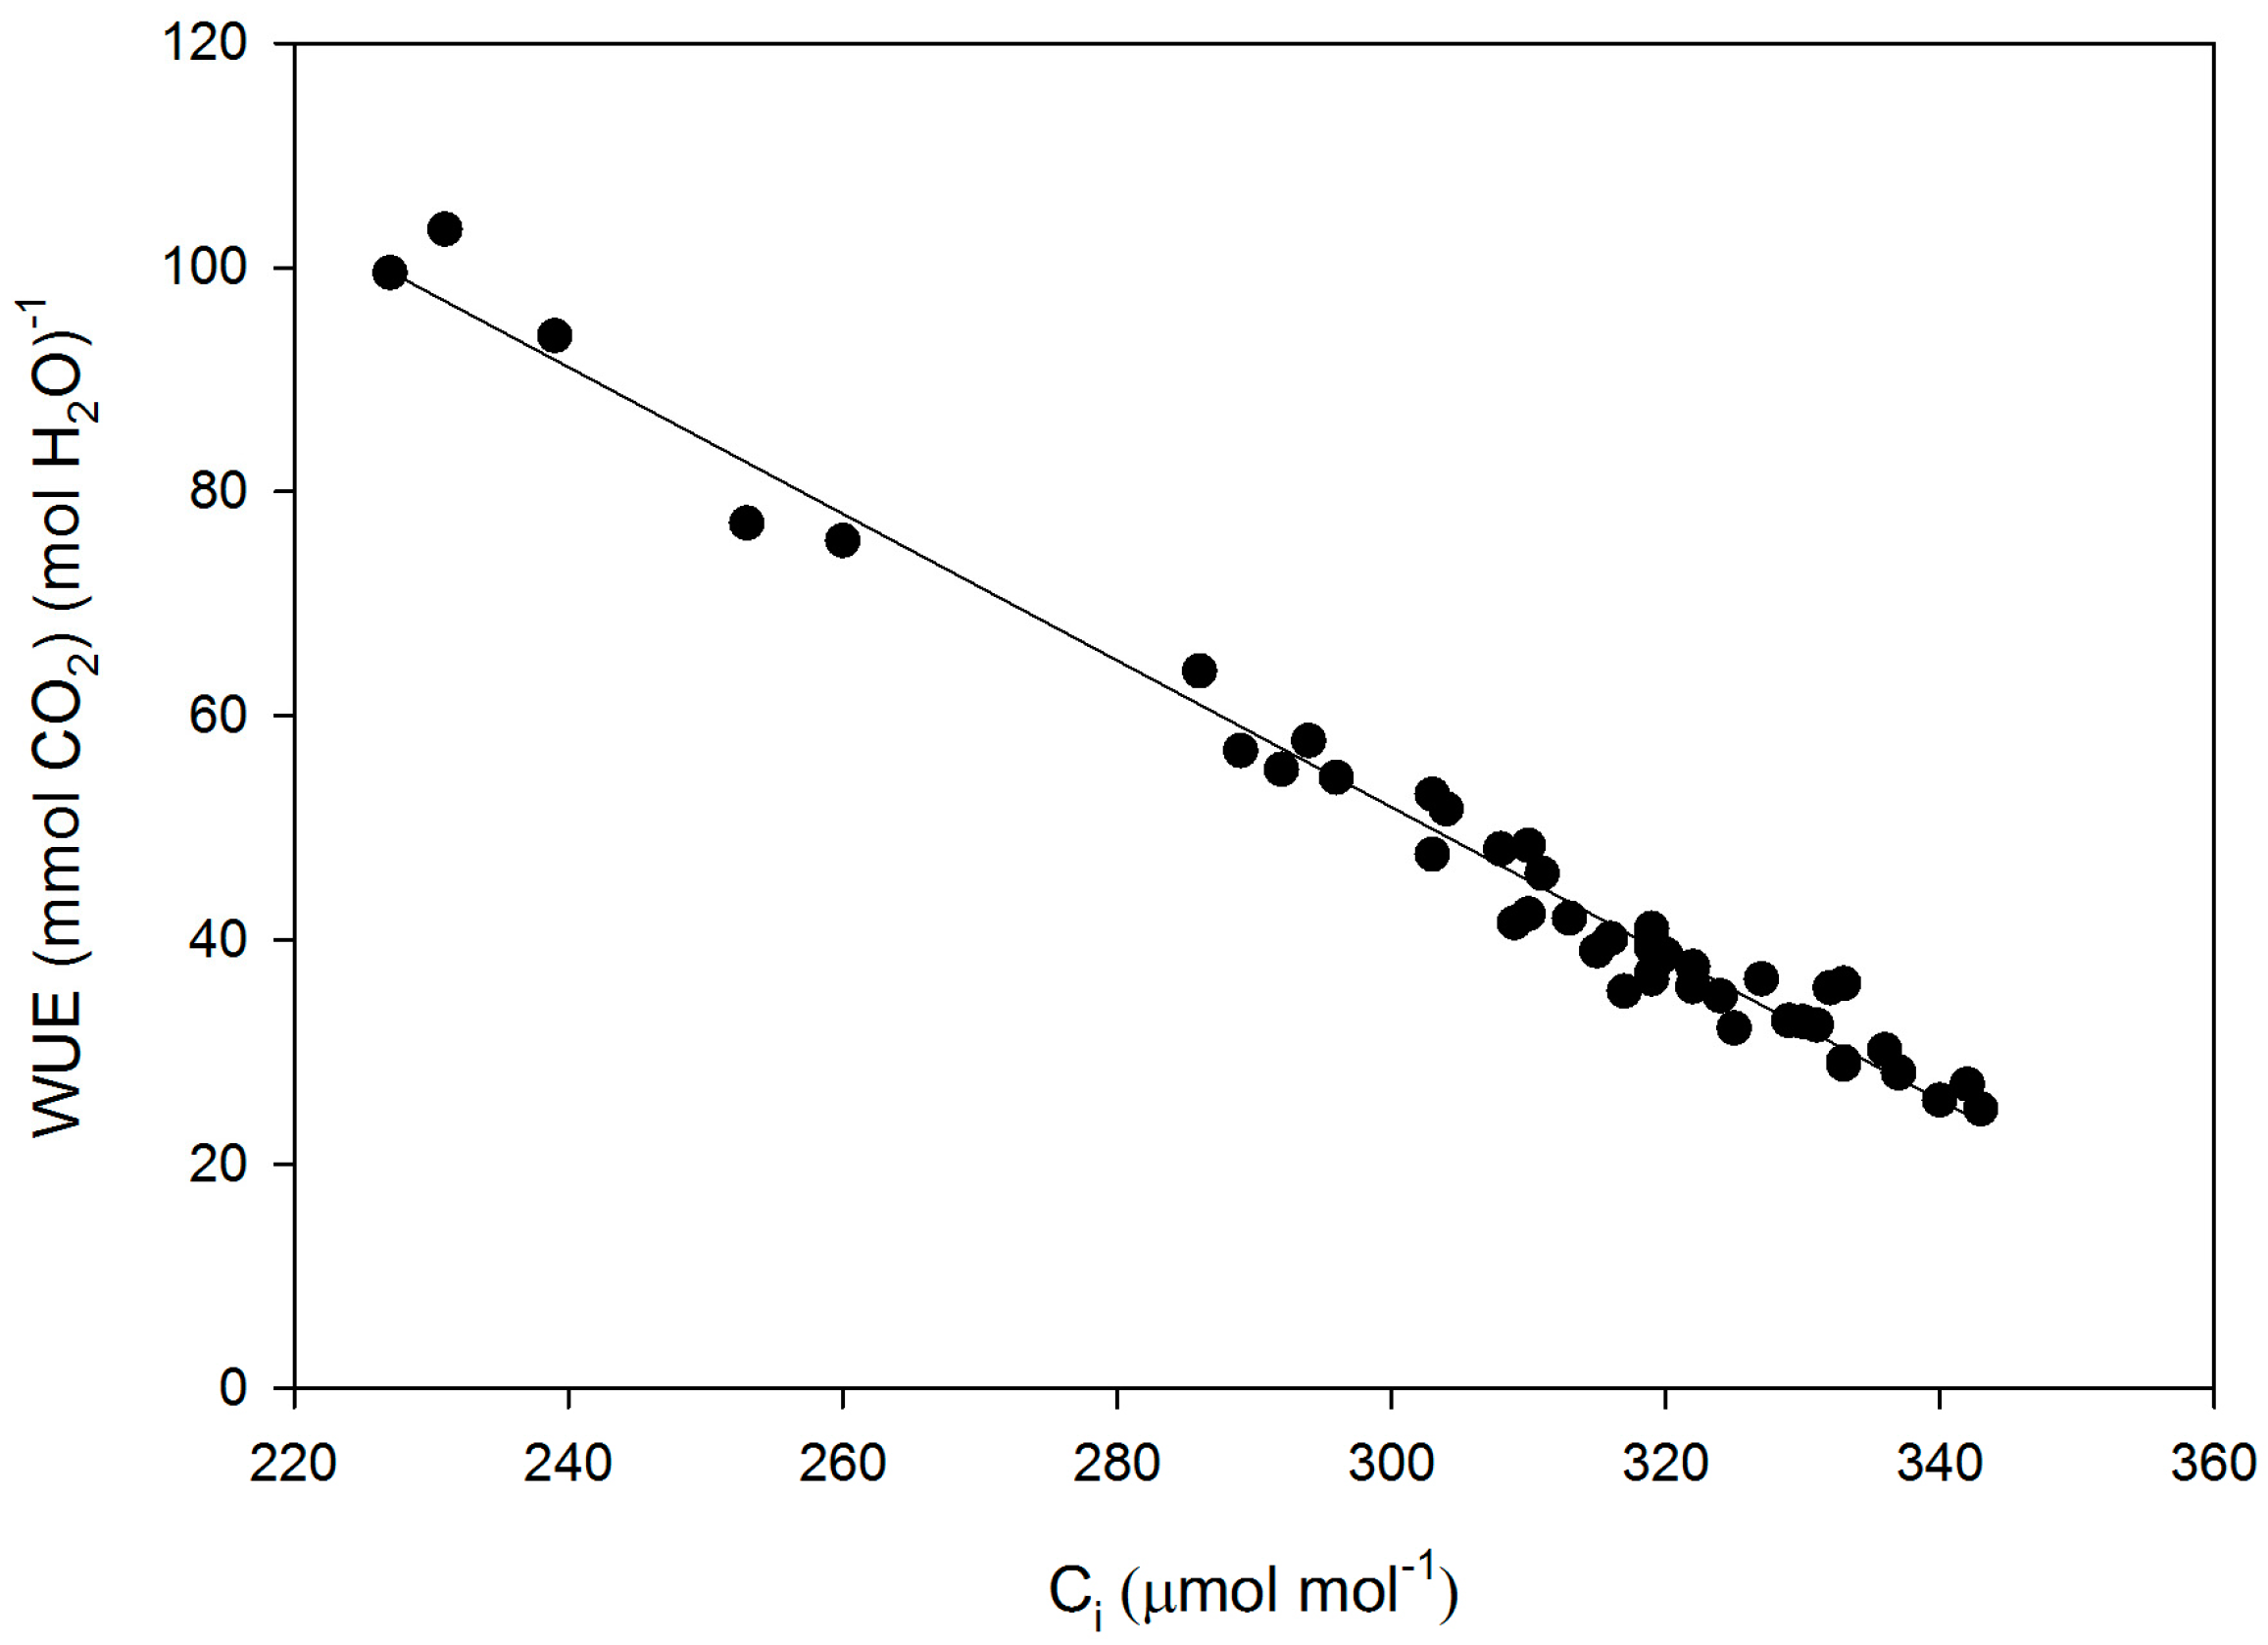
Figure 3.
Correlations between gm and (a) leaf intrinsic water use efficiency (WUE); (b) CO2 assimilation rate (A); (c) stomatal conductance (gs); (d) and the maximum rate of rubisco carboxylation based on Ci (VCmaxCi) for all measurements made on fifteen cultivars of soybean. Correlation coefficients were not significant at p = 0.05, and are given in the text.

Figure 4.
Relationships between the ratio of gm to gs and WUE (a); and between gm and Ci (b) for all measurements made on fifteen cultivars of soybean. The correlation between the gm to gs ratio and WUE had an r value of +0.53, and that between gm and Ci was +0.116, which was not significant at p = 0.05.
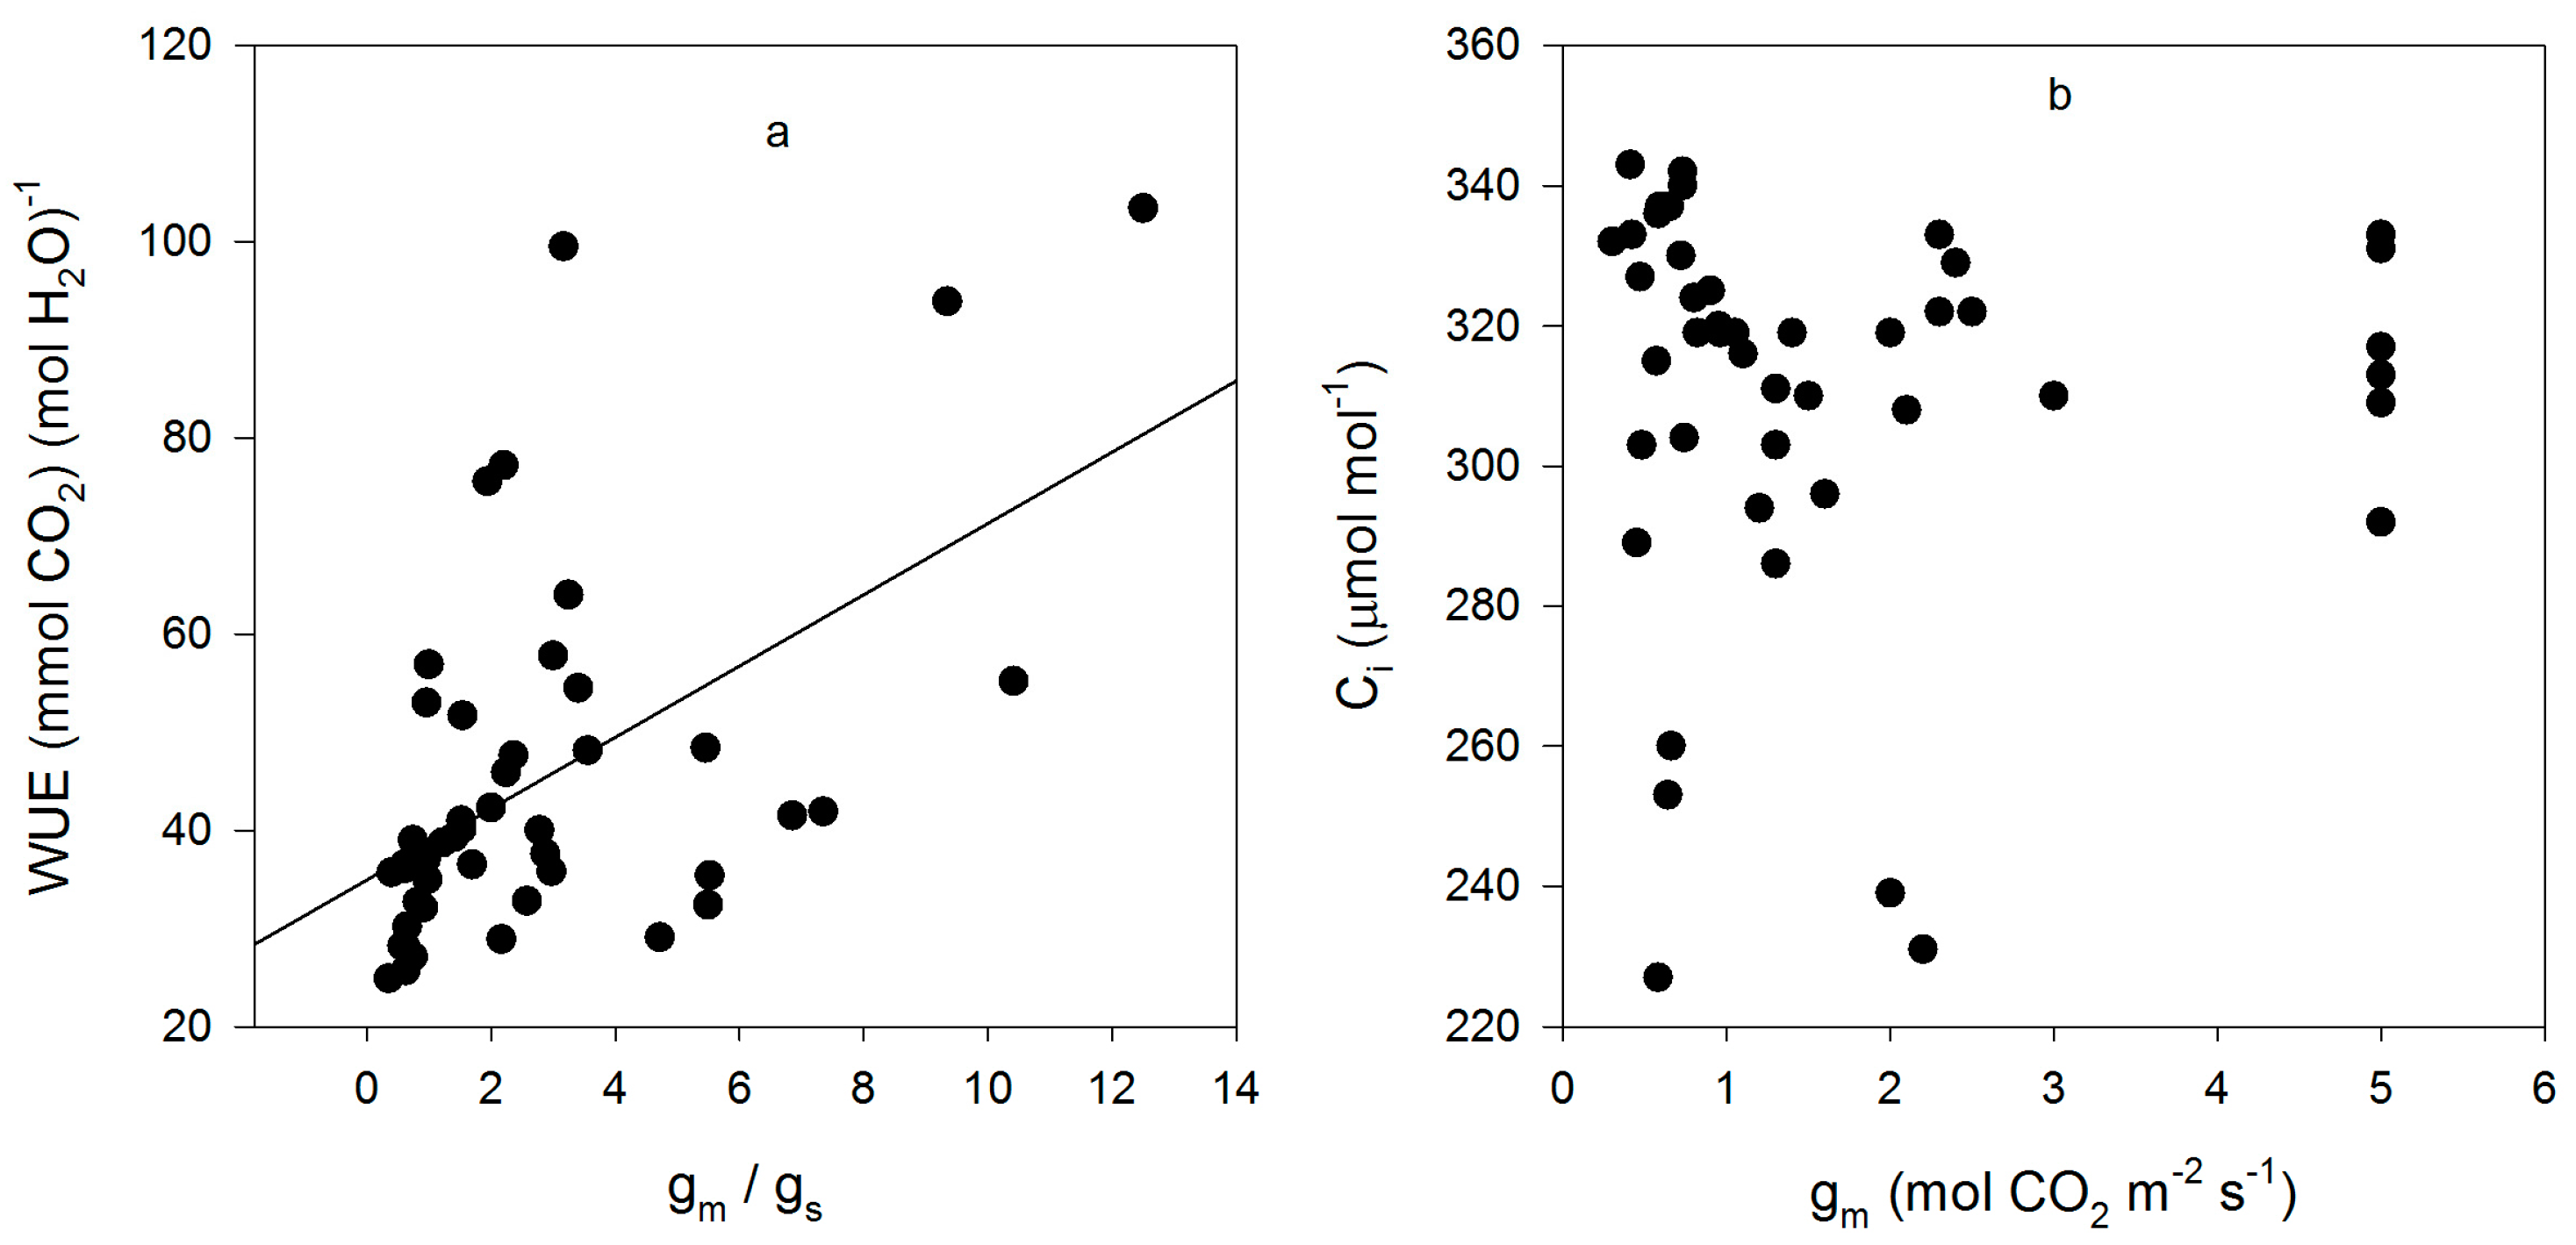
Figure 5.
The ratio of VCmax based on Ci to that based on Cc as a function of mesophyll resistance, the reciprocal of gm, for all measurements made on fifteen cultivars of soybean. The linear regression: VCmCi/VCmCc = 1.00 − 0.090 × (1/gm) had an r2 of 0.976.
Figure 5.
The ratio of VCmax based on Ci to that based on Cc as a function of mesophyll resistance, the reciprocal of gm, for all measurements made on fifteen cultivars of soybean. The linear regression: VCmCi/VCmCc = 1.00 − 0.090 × (1/gm) had an r2 of 0.976.

Figure 6.
CO2 assimilation rate (A) as a function of sub-stomatal CO2 concentration (Ci) for all measurements made on leaves of fifteen cultivars of soybean. The equation A = −125.6 + 26.7 ln(Ci) had an r2 value of 0.645.
Figure 6.
CO2 assimilation rate (A) as a function of sub-stomatal CO2 concentration (Ci) for all measurements made on leaves of fifteen cultivars of soybean. The equation A = −125.6 + 26.7 ln(Ci) had an r2 value of 0.645.

Figure 7.
Cultivar mean values of Ci versus mean values of Cc. The linear regression had an r2 value of 0.532.
Figure 7.
Cultivar mean values of Ci versus mean values of Cc. The linear regression had an r2 value of 0.532.

Table 1.
Mean leaf gas exchange parameter values of the soybean cultivars tested. Parameters were determined for three or four leaves per cultivar. gs is stomatal conductance in mmol (H2O) m−2·s−1, gm is mesophyll conductance in mmol (CO2) m−2·s−1, A is photosynthetic rate in μ mol (CO2) m−2·s−1 measured at 400 μ mol·mol−1 CO2, WUE is intrinsic water use efficiency in mmol (CO2) per mol (H2O), VCmCi is the maximum rate of rubisco carboxylation based on Ci, and VCmCc is the maximum rate of rubisco carboxylation based on Cc. Ci is the sub-stomatal CO2 concentration, and Cc is the CO2 concentration at rubisco, in μ mol·mol−1. Probability of equal means from ANOVA is given, and the Tukey–Kramer honestly significant difference (HSD) is provided when the probability is <0.05.
| Cultivar | gs | gm | A | WUE | VCmCi | VCmCc | Ci | Cc |
|---|---|---|---|---|---|---|---|---|
| A5959 | 703 | 2.63 | 27.7 | 43.1 | 113 | 118 | 313 | 299 |
| Biloxi | 803 | 3.60 | 28.9 | 36.4 | 116 | 123 | 323 | 307 |
| Chief | 878 | 2.28 | 31.1 | 35.9 | 127 | 139 | 321 | 297 |
| Clark | 677 | 0.42 | 26.6 | 40.3 | 108 | 138 | 324 | 258 |
| Essex | 587 | 1.50 | 26.4 | 56.9 | 114 | 121 | 291 | 272 |
| Fiskeby V | 418 | 2.56 | 24.4 | 67.6 | 114 | 122 | 276 | 259 |
| Ford | 1123 | 0.60 | 29.4 | 26.2 | 116 | 138 | 340 | 288 |
| Holt | 502 | 2.05 | 25.0 | 63.5 | 105 | 112 | 287 | 270 |
| Kent | 820 | 0.78 | 28.0 | 34.7 | 115 | 132 | 328 | 291 |
| Lincoln | 725 | 0.77 | 28.4 | 39.1 | 118 | 137 | 317 | 277 |
| Perry | 883 | 2.10 | 30.8 | 35.7 | 121 | 127 | 322 | 306 |
| PI-41 | 430 | 1.09 | 25.8 | 62.0 | 117 | 130 | 283 | 257 |
| Ripley | 380 | 0.76 | 23.7 | 64.0 | 101 | 118 | 279 | 242 |
| Spencer | 728 | 2.68 | 29.0 | 41.6 | 118 | 124 | 314 | 297 |
| Wabash | 910 | 1.11 | 28.1 | 31.8 | 114 | 128 | 333 | 300 |
| Probability | 0.001 | 0.016 | 0.081 | 0.029 | 0.097 | 0.279 | 0.019 | 0.036 |
| HSD | 592 | 2.79 | 31.1 | 56 | 65 |
© 2016 by the author; licensee MDPI, Basel, Switzerland. This article is an open access article distributed under the terms and conditions of the Creative Commons Attribution (CC-BY) license (http://creativecommons.org/licenses/by/4.0/).
Share and Cite
MDPI and ACS Style
Bunce, J. Variation among Soybean Cultivars in Mesophyll Conductance and Leaf Water Use Efficiency. Plants 2016, 5, 44. https://doi.org/10.3390/plants5040044
AMA Style
Bunce J. Variation among Soybean Cultivars in Mesophyll Conductance and Leaf Water Use Efficiency. Plants. 2016; 5(4):44. https://doi.org/10.3390/plants5040044
Chicago/Turabian StyleBunce, James. 2016. "Variation among Soybean Cultivars in Mesophyll Conductance and Leaf Water Use Efficiency" Plants 5, no. 4: 44. https://doi.org/10.3390/plants5040044
Note that from the first issue of 2016, this journal uses article numbers instead of page numbers. See further details here.