The Impact of Heat Stress and Water Deficit on the Photosynthetic and Stomatal Physiology of Olive (Olea europaea L.)—A Case Study of the 2017 Heat Wave

 , , , and
Abstract
:1. Introduction
2. Results
3. Discussion
4. Materials and Methods
4.1. Plant Material and Growth Conditions
4.2. Leaf Gas Exchange Analysis
4.3. Chlorophyll Fluorescence
Author Contributions
Funding
Conflicts of Interest
Appendix A
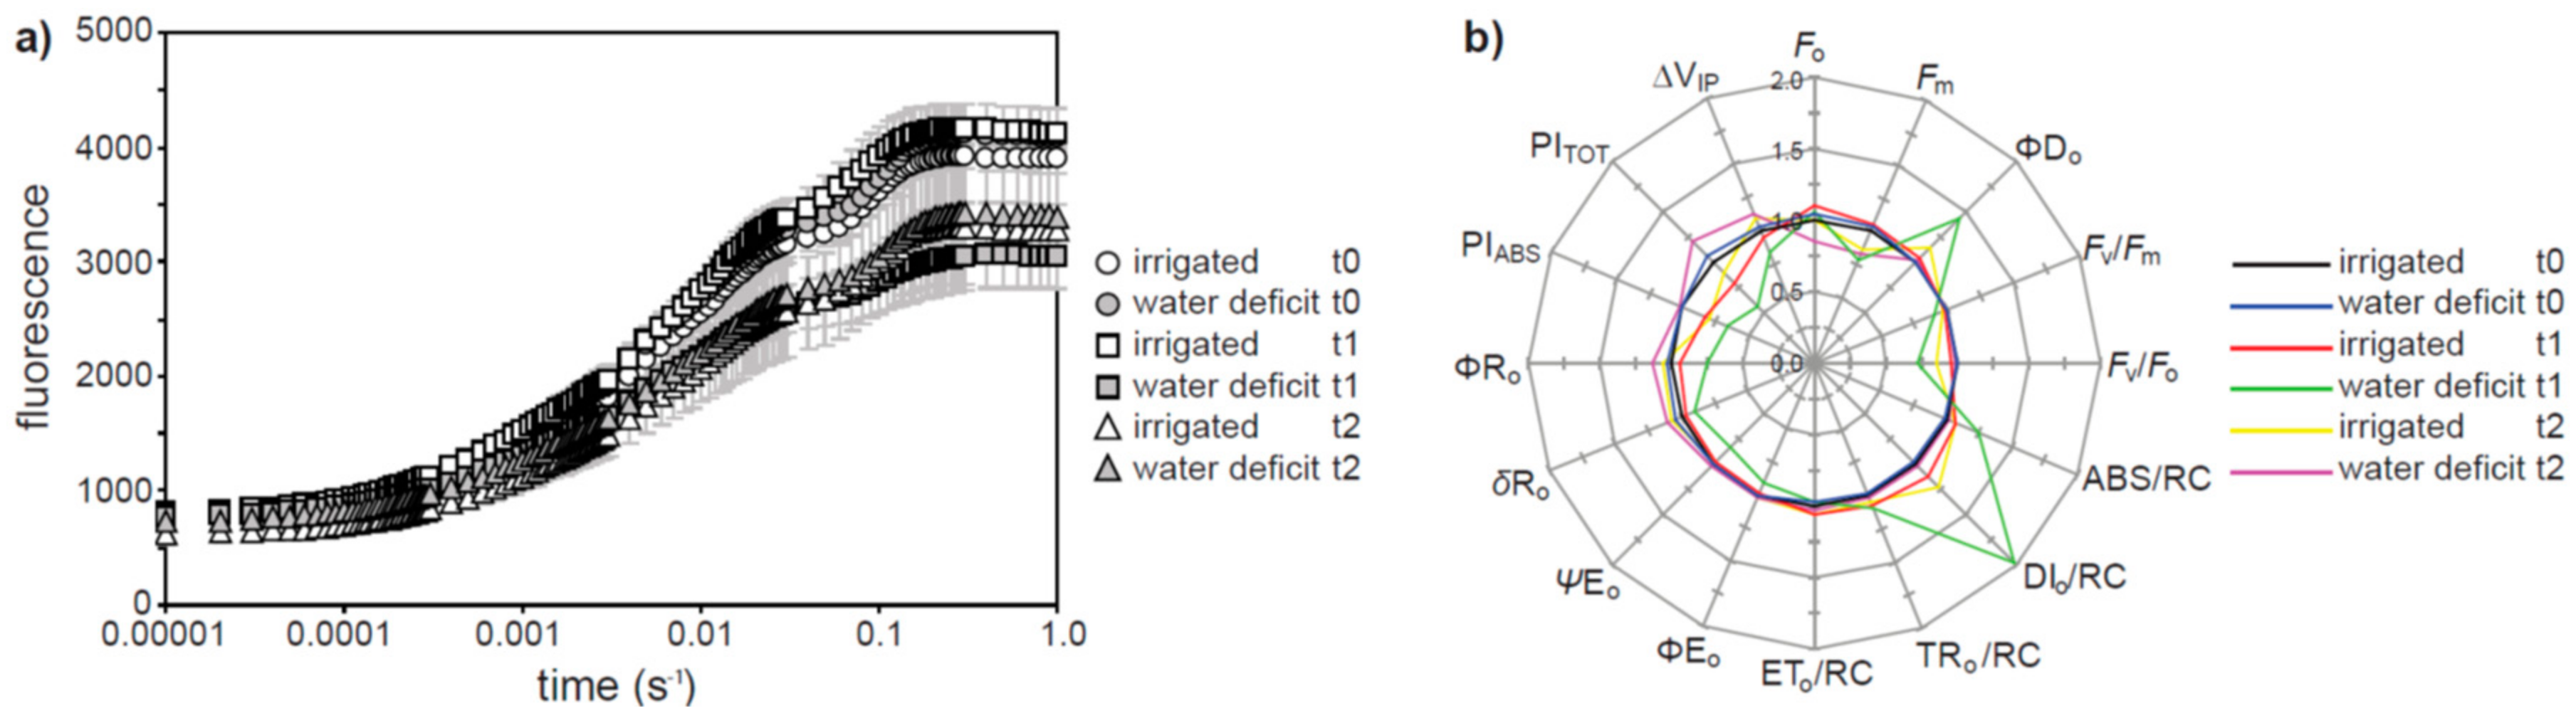
| Fo | minimum fluorescence yield in dark-adapted conditions. |
| Fm | maximum fluorescence yield in dark-adapted conditions. |
| ΦDo | quantum yield of energy dissipation. |
| Fv/Fm | maximum quantum yield of PSII photochemistry. |
| Fv/Fo | an indicator of the activity of the oxygen evolving complex on the donor side of PSII. |
| ABS/RC | absorption of chlorophyll antennae per reaction center. |
| DIo/RC | flux of energy dissipated for each reaction center. |
| TRo/RC | flux of trapped energy per reaction center leading to the reduction of plastoquinone A. |
| ETo/RC | electron flux beyond plastoquinone A per reaction center. |
| ΦEo | initial quantum yield of electron transport. |
| ΨEo | probability that harvested excitation energy is utilized for electron transport to the primary plastoquinone A acceptor of PSII. |
| δRo | efficiency of electron carriers in reducing end electron acceptors at the PSI acceptor. |
| ΦRo | quantum yield of the reduction of final stage acceptors at the PSI stage. |
| PIABS | a performance index based on the photochemical and non-photochemical energy absorption of chlorophyll antennae. |
| PITOT | performance index incorporating the concentration of reaction centers. |
| ΔVIP | efficiency of the electron chain flux in the I to P phase of the chlorophyll a fluorescence. |
References
- Intergovernmental Panel on Climate Change (IPCC). Climate Change 2014: Impacts, Adaptation, and Vulnerability; Contribution of Working Group II to the Fifth Assessment Report of the Intergovernmental Panel on Climate Change; IPCC: Cambridge, UK, 2014. [Google Scholar]
- International Olive Council (IOC). World Olive Oil Figures; International Olive Council: Madrid, Spain, 2014. [Google Scholar]
- Teuling, A.J. A hot future for European droughts. Nat. Clim. Chang. 2018, 8, 364–365. [Google Scholar] [CrossRef]
- Lauteri, M.; Haworth, M.; Serraj, R.; Monteverdi, M.C.; Centritto, M. Photosynthetic diffusional constraints affect yield in drought stressed rice cultivars during flowering. PLoS ONE 2014, 9, e109054. [Google Scholar] [CrossRef] [PubMed]
- Haworth, M.; Cosentino, S.L.; Marino, G.; Brunetti, C.; Scordia, D.; Testa, G.; Riggi, E.; Avola, G.; Loreto, F.; Centritto, M. Physiological responses of Arundo donax ecotypes to drought: A common garden study. GCB Bioenergy 2017, 9, 132–143. [Google Scholar] [CrossRef]
- Crafts-Brandner, S.J.; Salvucci, M.E. Sensitivity of photosynthesis in a C4 plant, maize, to heat stress. Plant Physiol. 2002, 129, 1773–1780. [Google Scholar] [CrossRef] [PubMed]
- Davies, W.J.; Zhang, J.H. Root signals and the regulation of growth and development of plants in drying soil. Annu. Rev. Plant Physiol. Plant Mol. Biol. 1991, 42, 55–76. [Google Scholar] [CrossRef]
- Haworth, M.; Cosentino, S.L.; Marino, G.; Brunetti, C.; Riggi, E.; Avola, G.; Loreto, F.; Centritto, M. Increased free abscisic acid during drought enhances stomatal sensitivity and modifies stomatal behaviour in fast growing giant reed (Arundo donax L.). Environ. Exp. Bot. 2018, 147, 116–124. [Google Scholar] [CrossRef]
- Marino, G.; Brunetti, C.; Tattini, M.; Romano, A.; Biasioli, F.; Tognetti, R.; Loreto, F.; Ferrini, F.; Centritto, M. Dissecting the role of isoprene and stress-related hormones (ABA and ethylene) in Populus nigra exposed to unequal root zone water stress. Tree Physiol. 2017, 37, 1637–1647. [Google Scholar] [CrossRef] [PubMed]
- Meyer, S.; Genty, B. Heterogeneous inhibition of photosynthesis over the leaf surface of Rosa rubiginosa L. during water stress and abscisic acid treatment: Induction of a metabolic component by limitation of CO2 diffusion. Planta 1999, 210, 126–131. [Google Scholar] [CrossRef] [PubMed]
- Demmig-Adams, B.; Adams, W.W. Photoprotection and other responses of plants to high light stress. Annu. Rev. Plant Physiol. Plant Mol. Biol. 1992, 43, 599–626. [Google Scholar] [CrossRef]
- Pinheiro, C.; Chaves, M.M. Photosynthesis and drought: Can we make metabolic connections from available data? J. Exp. Bot. 2011, 62, 869–882. [Google Scholar] [CrossRef] [PubMed]
- Killi, D.; Haworth, M. Diffusive and metabolic constraints to photosynthesis in quinoa during drought and salt stress. Plants 2017, 6, E49. [Google Scholar] [CrossRef] [PubMed]
- Kalaji, H.M.; Jajoo, A.; Oukarroum, A.; Brestic, M.; Zivcak, M.; Samborska, I.A.; Cetner, M.D.; Łukasik, I.; Goltsev, V.; Ladle, R.J. Chlorophyll a fluorescence as a tool to monitor physiological status of plants under abiotic stress conditions. Acta Physiol. Plant. 2016, 38, 102. [Google Scholar] [CrossRef]
- Centritto, M.; Lauteri, M.; Monteverdi, M.C.; Serraj, R. Leaf gas exchange, carbon isotope discrimination, and grain yield in contrasting rice genotypes subjected to water deficits during the reproductive stage. J. Exp. Bot. 2009, 60, 2325–2339. [Google Scholar] [CrossRef] [PubMed] [Green Version]
- Marino, G.; Pallozzi, E.; Cocozza, C.; Tognetti, R.; Giovannelli, A.; Cantini, C.; Centritto, M. Assessing gas exchange, sap flow and water relations using tree canopy spectral reflectance indices in irrigated and rainfed Olea europaea L. Environ. Exp. Bot. 2014, 99, 43–52. [Google Scholar] [CrossRef]
- Sorrentino, G.; Haworth, M.; Wahbi, S.; Mahmood, T.; Zuomin, S.; Centritto, M. Abscisic acid induces rapid reductions in mesophyll conductance to carbon dioxide. PLoS ONE 2016, 11, e0148554. [Google Scholar] [CrossRef] [PubMed]
- Tholen, D.; Ethier, G.; Genty, B.; Pepin, S.; Zhu, X.-G. Variable mesophyll conductance revisited: Theoretical background and experimental implications. Plant Cell Environ. 2012, 35, 2087–2103. [Google Scholar] [CrossRef] [PubMed]
- Miyazawa, S.-I.; Yoshimura, S.; Shinzaki, Y.; Maeshima, M.; Miyake, C. Deactivation of aquaporins decreases internal conductance to CO2 diffusion in tobacco leaves grown under long-term drought. Funct. Plant Biol. 2008, 35, 553–564. [Google Scholar] [CrossRef]
- Centritto, M.; Brilli, F.; Fodale, R.; Loreto, F. Different sensitivity of isoprene emission, respiration and photosynthesis to high growth temperature coupled with drought stress in black poplar (Populus nigra) saplings. Tree Physiol. 2011, 31, 275–286. [Google Scholar] [CrossRef] [PubMed]
- Velikova, V.; Tsonev, T.; Barta, C.; Centritto, M.; Koleva, D.; Stefanova, M.; Busheva, M.; Loreto, F. BVOC emissions, photosynthetic characteristics and changes in chloroplast ultrastructure of Platanus orientalis L. exposed to elevated CO2 and high temperature. Environ. Pollut. 2009, 157, 2629–2637. [Google Scholar] [CrossRef] [PubMed]
- Heckathorn, S.A.; Downs, C.A.; Sharkey, T.D.; Coleman, J.S. The small, methionine-rich chloroplast heat-shock protein protects photosystem II electron transport during heat stress. Plant Physiol. 1998, 116, 439–444. [Google Scholar] [CrossRef] [PubMed]
- Jordan, D.B.; Ogren, W.L. The CO2/O2 specificity of ribulose 1,5-bisphosphate carboxylase/oxygenase: Dependence on ribulosebisphosphate concentration, pH and temperature. Planta 1984, 161, 308–313. [Google Scholar] [CrossRef] [PubMed]
- Crafts-Brandner, S.J.; Salvucci, M.E. Rubisco activase constrains the photosynthetic potential of leaves at high temperature and CO2. Proc. Natl. Acad. Sci. USA 2000, 97, 13430–13435. [Google Scholar] [CrossRef] [PubMed]
- Feller, U.; Crafts-Brandner, S.J.; Salvucci, M.E. Moderately high temperatures inhibit ribulose-1,5-bisphosphate carboxylase/oxygenase (rubisco) activase-mediated activation of rubisco. Plant Physiol. 1998, 116, 539–546. [Google Scholar] [CrossRef] [PubMed]
- Law, R.D.; Crafts-Brandner, S.J. Inhibition and acclimation of photosynthesis to heat stress is closely correlated with activation of Ribulose-1,5-Bisphosphate Carboxylase/Oxygenase. Plant Physiol. 1999, 120, 173–182. [Google Scholar] [CrossRef] [PubMed]
- Killi, D.; Bussotti, F.; Raschi, A.; Haworth, M. Adaptation to high temperature mitigates the impact of water deficit during combined heat and drought stress in C3 sunflower and C4 maize varieties with contrasting drought tolerance. Physiol. Plant. 2016, 159, 130–147. [Google Scholar] [CrossRef] [PubMed]
- Bunce, J.A. Acclimation of photosynthesis to temperature in eight cool and warm climate herbaceous C3 species: Temperature dependence of parameters of a biochemical photosynthesis model. Photosynth. Res. 2000, 63, 59–67. [Google Scholar] [CrossRef] [PubMed]
- Urban, J.; Ingwers, M.; McGuire, M.A.; Teskey, R.O. Stomatal conductance increases with rising temperature. Plant Signal. Behav. 2017, 12, e1356534. [Google Scholar] [CrossRef] [PubMed] [Green Version]
- Haworth, M.; Belcher, C.M.; Killi, D.; Dewhirst, R.A.; Materassi, A.; Raschi, A.; Centritto, M. Impaired photosynthesis and increased leaf construction costs may induce floral stress during episodes of global warming over macroevolutionary timescales. Sci. Rep. 2018, 8, 6206. [Google Scholar] [CrossRef] [PubMed]
- Fares, S.; Mahmood, T.; Liu, S.; Loreto, F.; Centritto, M. Influence of growth temperature and measuring temperature on isoprene emission, diffusive limitations of photosynthesis and respiration in hybrid poplars. Atmos. Environ. 2011, 45, 155–161. [Google Scholar] [CrossRef]
- Centritto, M.; Tognetti, R.; Leitgeb, E.; Střelcová, K.; Cohen, S. Above ground processes—Anticipating climate change influences. In Forest Management and the Water Cycle: An Ecosystem-Based Approach; Ecological Studies 212; Bredemeier, M., Cohen, S., Godbold, D.L., Lode, E., Pichler, V., Schleppi, P., Eds.; Springer: London, UK, 2011; pp. 31–64. [Google Scholar]
- Ethier, G.J.; Livingston, N.J. On the need to incorporate sensitivity to CO2 transfer conductance into the Farquhar–von Caemmerer–Berry leaf photosynthesis model. Plant Cell Environ. 2004, 27, 137–153. [Google Scholar] [CrossRef]
- Dbara, S.; Haworth, M.; Emiliani, G.; Mimoun, M.B.; Gómez-Cadenas, A.; Centritto, M. Partial root-zone drying of olive (Olea europaea var. ‘Chetoui’) induces reduced yield under field conditions. PLoS ONE 2016, 11, e0157089. [Google Scholar] [CrossRef] [PubMed] [Green Version]
- Dichio, B.; Xiloyannis, C.; Angelopoulos, K.; Nuzzo, V.; Bufo, S.A.; Celano, G. Drought-induced variations of water relations parameters in Olea europaea. Plant Soil 2003, 257, 381–389. [Google Scholar] [CrossRef]
- Connor, D.J. Adaptation of olive (Olea europaea L.) to water-limited environments. Aust. J. Agric. Res. 2005, 56, 1181–1189. [Google Scholar] [CrossRef]
- Rizhsky, L.; Liang, H.; Shuman, J.; Shulaev, V.; Davletova, S.; Mittler, R. When defense pathways collide. The response of Arabidopsis to a combination of drought and heat stress. Plant Physiol. 2004, 134, 1683–1696. [Google Scholar] [CrossRef] [PubMed]
- Killi, D.; Bussotti, F.; Gottardini, E.; Pollastrini, M.; Mori, J.; Tani, C.; Papini, A.; Ferrini, F.; Fini, A. Photosynthetic and morphological responses of oak species to temperature and [CO2] increased to levels predicted for 2050. Urban For. Urban Green. 2018, 31, 26–37. [Google Scholar] [CrossRef]
- Centritto, M.; Loreto, F.; Chartzoulakis, K. The use of low [CO2] to estimate diffusional and non-diffusional limitations of photosynthetic capacity of salt-stressed olive saplings. Plant Cell Environ. 2003, 26, 585–594. [Google Scholar] [CrossRef]
- Aganchich, B.; Wahbi, S.; Loreto, F.; Centritto, M. Partial root zone drying: Regulation of photosynthetic limitations and antioxidant enzymatic activities in young olive (Olea europaea) saplings. Tree Physiol. 2009, 29, 685–696. [Google Scholar] [CrossRef] [PubMed]
- Schansker, G.; Tóth, S.Z.; Strasser, R.J. Methylviologen and dibromothymoquinone treatments of pea leaves reveal the role of photosystem I in the Chl a fluorescence rise OJIP. Biochim. Biophys. Acta Bioenerg. 2005, 1706, 250–261. [Google Scholar] [CrossRef] [PubMed] [Green Version]
- Ceppi, M.G.; Oukarroum, A.; Çiçek, N.; Strasser, R.J.; Schansker, G. The IP amplitude of the fluorescence rise OJIP is sensitive to changes in the photosystem I content of leaves: A study on plants exposed to magnesium and sulfate deficiencies, drought stress and salt stress. Physiol. Plant. 2012, 144, 277–288. [Google Scholar] [CrossRef] [PubMed]
- Pospíšil, P. Production of reactive oxygen species by photosystem II. Biochim. Biophys. Acta Bioenerg. 2009, 1787, 1151–1160. [Google Scholar] [CrossRef] [PubMed]
- Pospíšil, P. Production of reactive oxygen species by photosystem II as a response to light and temperature stress. Front. Plant Sci. 2016, 7, 1950. [Google Scholar] [CrossRef] [PubMed]
- Flexas, J.; Bota, J.; Loreto, F.; Cornic, G.; Sharkey, T. Diffusive and metabolic limitations to photosynthesis under drought and salinity in C3 plants. Plant Biol. 2004, 6, 269–279. [Google Scholar] [CrossRef] [PubMed]
- Bongi, G.; Loreto, F. Gas-exchange properties of salt-stressed olive (Olea europaea L.) leaves. Plant Physiol. 1989, 90, 1408–1416. [Google Scholar] [CrossRef] [PubMed]
- Loreto, F.; Centritto, M.; Chartzoulakis, K. Photosynthetic limitations in olive cultivars with different sensitivity to salt stress. Plant Cell Environ. 2003, 26, 595–601. [Google Scholar] [CrossRef] [Green Version]
- Raschke, K. Temperature dependence of CO2 assimilation and stomatal aperture in leaf sections of Zea mays. Planta 1970, 91, 336–363. [Google Scholar] [CrossRef] [PubMed]
- Drake, B.; Raschke, K.; Salisbury, F. Temperature and transpiration resistances of Xanthium leaves as affected by air temperature, humidity, and wind speed. Plant Physiol. 1970, 46, 324–330. [Google Scholar] [CrossRef] [PubMed]
- Schulze, E.-D.; Lange, O.; Evenari, M.; Kappen, L.; Buschbom, U. The role of air humidity and leaf temperature in controlling stomatal resistance of Prunus armeniaca L. under desert conditions: I a simulation of the daily course of stomatal resistance. Oecologia 1974, 17, 159–170. [Google Scholar] [CrossRef] [PubMed]
- Schulze, E.-D.; Lange, O.; Kappen, L.; Buschbom, U.; Evenari, M. Stomatal responses to changes in temperature at increasing water stress. Planta 1973, 110, 29–42. [Google Scholar] [CrossRef] [PubMed]
- Crawford, A.J.; McLachlan, D.H.; Hetherington, A.M.; Franklin, K.A. High temperature exposure increases plant cooling capacity. Curr. Biol. 2012, 22, R396–R397. [Google Scholar] [CrossRef] [PubMed]
- Centritto, M.; Wahbi, S.; Serraj, R.; Chaves, M. Effects of partial rootzone drying (PRD) on adult olive tree (Olea europaea) in field conditions under arid climate: II. Photosynthetic responses. Agric. Ecosyst. Environ. 2005, 106, 303–311. [Google Scholar] [CrossRef]
- Drake, B.; Salisbury, F. After effects of low and high temperature pre-treatment on leaf resistance, transpiration, and leaf temperature in Xanthium. Plant Physiol. 1972, 50, 572–575. [Google Scholar] [CrossRef] [PubMed]
- Bauerle, W.; Whitlow, T.; Setter, T.; Vermeylen, F. Abscisic acid synthesis in Acer rubrum L. leaves—A vapour-pressure-deficit-mediated response. J. Am. Soc. Hortic. Sci. 2004, 129, 182–187. [Google Scholar]
- Jones, H.G.; Sutherland, R.A. Stomatal control of xylem embolism. Plant Cell Environ. 1991, 14, 607–612. [Google Scholar] [CrossRef]
- Haworth, M.; Centritto, M.; Giovannelli, A.; Marino, G.; Proietti, N.; Capitani, D.; De Carlo, A.; Loreto, F. Xylem morphology determines the drought response of two Arundo donax ecotypes from contrasting habitats. GCB Bioenergy 2017, 9, 119–131. [Google Scholar] [CrossRef]
- Sperry, J.S. Relationship of xylem embolism to xlem pressure potential, stomatal closure, and shoot morphology in the palm Rhapis excelsa. Plant Physiol. 1986, 80, 110–116. [Google Scholar] [CrossRef] [PubMed]
- Elliott-Kingston, C.; Haworth, M.; Yearsley, J.M.; Batke, S.P.; Lawson, T.; McElwain, J.C. Does size matter? Atmospheric CO2 may be a stronger driver of stomatal closing rate than stomatal size in taxa that diversified under low CO2. Front. Plant Sci. 2016, 7, 1253. [Google Scholar] [CrossRef] [PubMed]
- Haworth, M.; Scutt, C.P.; Douthe, C.; Marino, G.; Gomes, M.T.G.; Loreto, F.; Flexas, J.; Centritto, M. Allocation of the epidermis to stomata relates to stomatal physiological control: Stomatal factors involved in the diversification of the angiosperms and development of amphistomaty. Environ. Exp. Bot. 2018, 151, 55–63. [Google Scholar] [CrossRef]
- Sun, P.; Wahbi, S.; Tsonev, T.; Haworth, M.; Liu, S.; Centritto, M. On the use of leaf spectral indices to assess water status and photosynthetic limitations in Olea europaea L. during water-stress and recovery. PLoS ONE 2014, 9, e105165. [Google Scholar] [CrossRef] [PubMed]
- Gucci, R.; Lodolini, E.; Rapoport, H. Productivity of olive trees with different water status and crop load. J. Hortic. Sci. Biotechnol. 2007, 82, 648–656. [Google Scholar] [CrossRef]
- Angelopoulos, K.; Dichio, B.; Xiloyannis, C. Inhibition of photosynthesis in olive trees (Olea europaea L.) during water stress and rewatering. J. Exp. Bot. 1996, 47, 1093–1100. [Google Scholar] [CrossRef]
- Benincasa, C.; Bati, C.B.; Iannotta, N.; Pellegrino, M.; Pennino, G.; Rizzuti, B.; Romano, E. Efficacy of kaolin and copper based products on olive-fruit fly (B. aloea Gmelin) and effects on nutritional and sensory parameters of olive oils. Sci. Appl. Aliment. 2008, 4, 21–31. [Google Scholar]
- Hoagland, D.R.; Arnon, D.I. The water-culture method for growing plants without soil. Circ. Calif. Agric. Exp. Stn. 1950, 347, 32. [Google Scholar]
- Loriaux, S.; Avenson, T.; Welles, J.; McDermitt, D.; Eckles, R.; Riensche, B.; Genty, B. Closing in on maximum yield of chlorophyll fluorescence using a single multiphase flash of sub-saturating intensity. Plant Cell Environ. 2013, 36, 1755–1770. [Google Scholar] [CrossRef] [PubMed] [Green Version]
- Genty, B.; Briantais, J.-M.; Baker, N.R. The relationship between the quantum yield of photosynthetic electron transport and quenching of chlorophyll fluorescence. Biochim. Biophys. Acta Gen. Subj. 1989, 990, 87–92. [Google Scholar] [CrossRef]
- Harley, P.C.; Loreto, F.; Dimarco, G.; Sharkey, T.D. Theoretical considerations when estimating the mesophyll conductance to CO2 flux by analysis of the response of photosynthesis to CO2. Plant Physiol. 1992, 98, 1429–1436. [Google Scholar] [CrossRef] [PubMed]
- Rodeghiero, M.; Niinemets, Ü.; Cescatti, A. Major diffusion leaks of clamp-on leaf cuvettes still unaccounted: How erroneous are the estimates of Farquhar et al. model parameters? Plant Cell Environ. 2007, 30, 1006–1022. [Google Scholar] [CrossRef] [PubMed]
- Strasser, R.J.; Tsimilli-Michael, M.; Srivastava, A. Analysis of the chlorophyll a fluorescence transient. In Chlorophyll a Fluorescence; Papageorgiou, G., Govindjee, F.C., Gantt, E., Golbeck, J., Golden, S., Eds.; Springer: Dordrecht, The Netherlands, 2004; Volume 19, pp. 321–362. [Google Scholar]


© 2018 by the authors. Licensee MDPI, Basel, Switzerland. This article is an open access article distributed under the terms and conditions of the Creative Commons Attribution (CC BY) license (http://creativecommons.org/licenses/by/4.0/).
Share and Cite
Haworth, M.; Marino, G.; Brunetti, C.; Killi, D.; De Carlo, A.; Centritto, M. The Impact of Heat Stress and Water Deficit on the Photosynthetic and Stomatal Physiology of Olive (Olea europaea L.)—A Case Study of the 2017 Heat Wave. Plants 2018, 7, 76. https://doi.org/10.3390/plants7040076
Haworth M, Marino G, Brunetti C, Killi D, De Carlo A, Centritto M. The Impact of Heat Stress and Water Deficit on the Photosynthetic and Stomatal Physiology of Olive (Olea europaea L.)—A Case Study of the 2017 Heat Wave. Plants. 2018; 7(4):76. https://doi.org/10.3390/plants7040076
Chicago/Turabian StyleHaworth, Matthew, Giovanni Marino, Cecilia Brunetti, Dilek Killi, Anna De Carlo, and Mauro Centritto. 2018. "The Impact of Heat Stress and Water Deficit on the Photosynthetic and Stomatal Physiology of Olive (Olea europaea L.)—A Case Study of the 2017 Heat Wave" Plants 7, no. 4: 76. https://doi.org/10.3390/plants7040076