Intrusive Growth of Phloem Fibers in Flax Stem: Integrated Analysis of miRNA and mRNA Expression Profiles

 ,
,
Abstract
:1. Introduction
2. Results
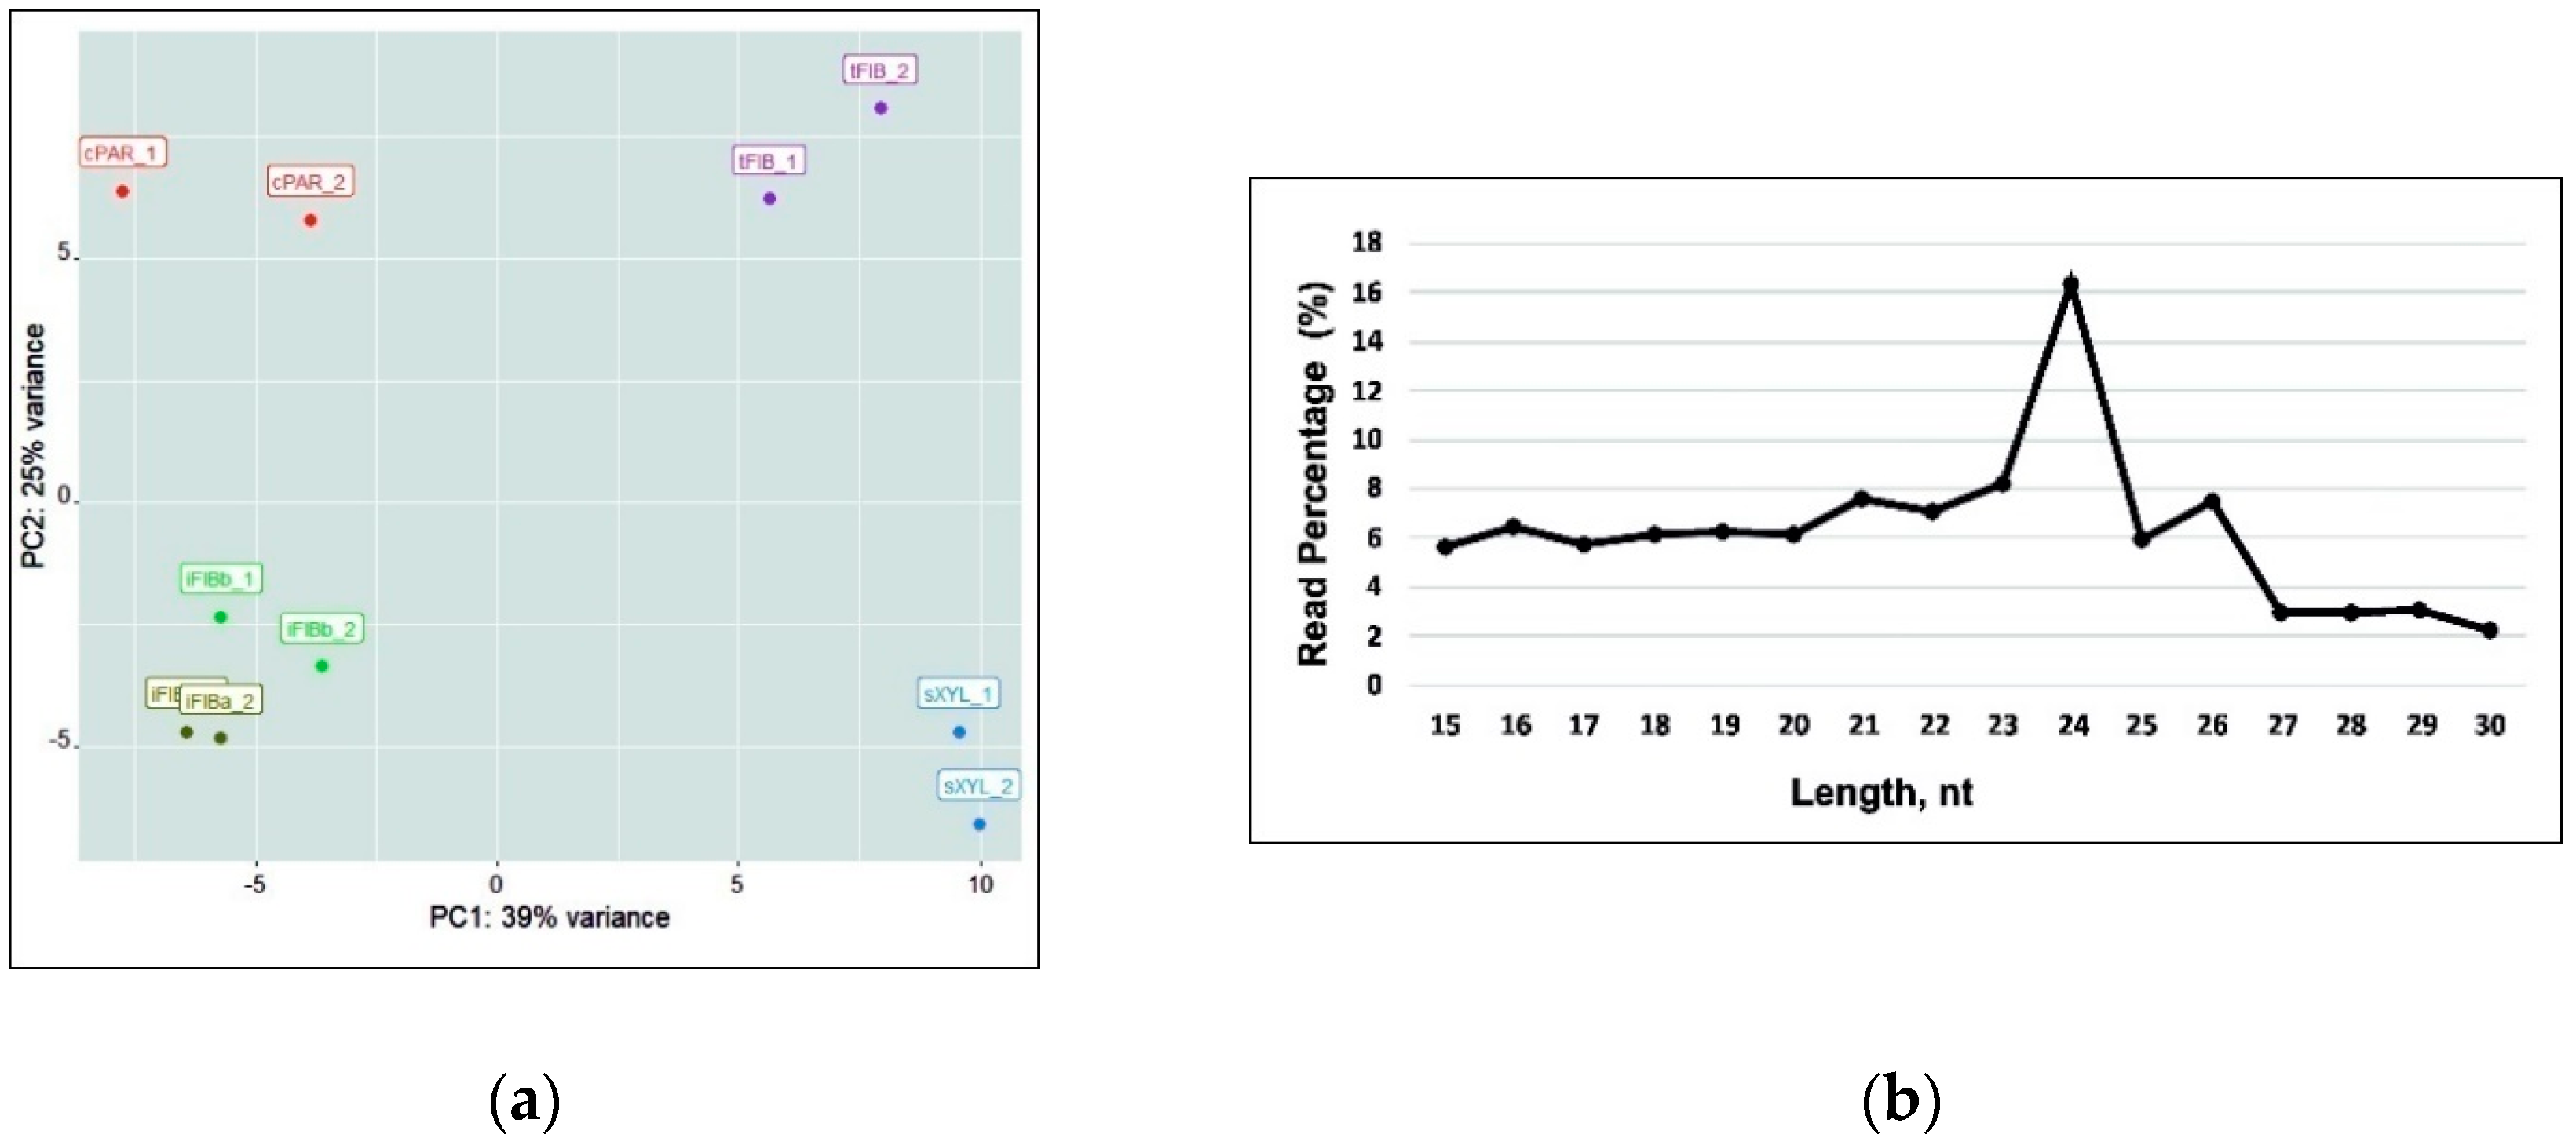
2.1. Deep-Sequencing of Flax Fiber Small RNAs
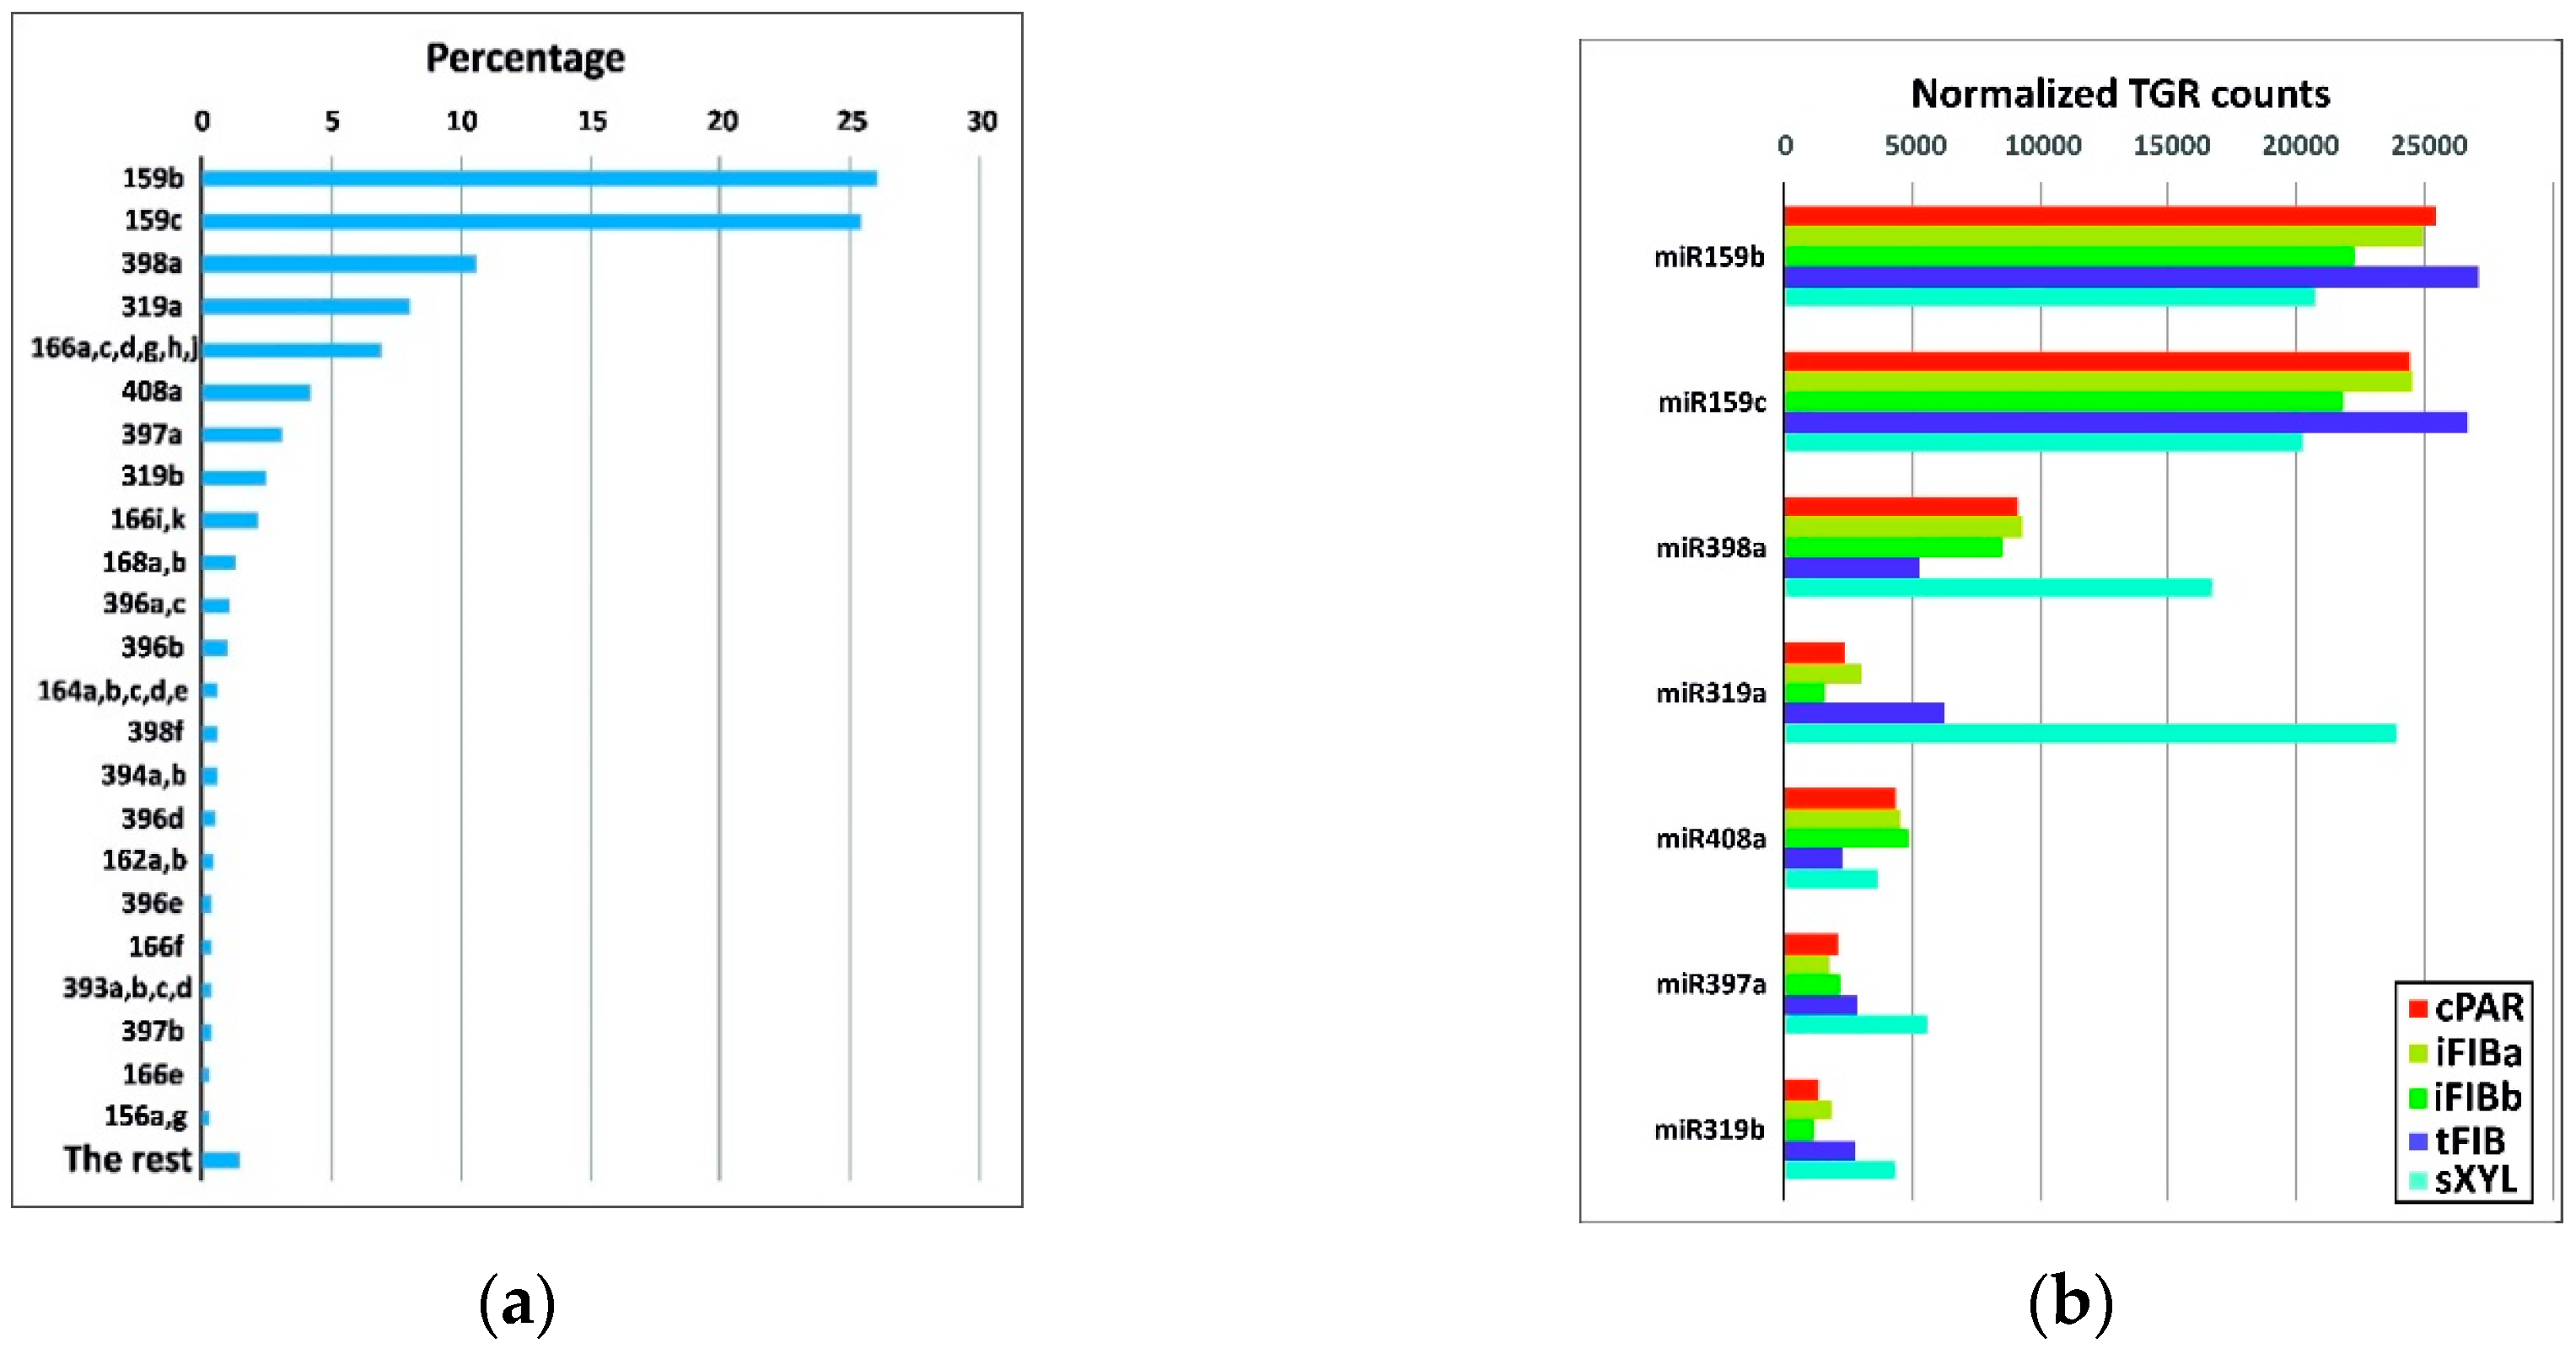
2.2. Characterization of the Expressed Flax miRNAs
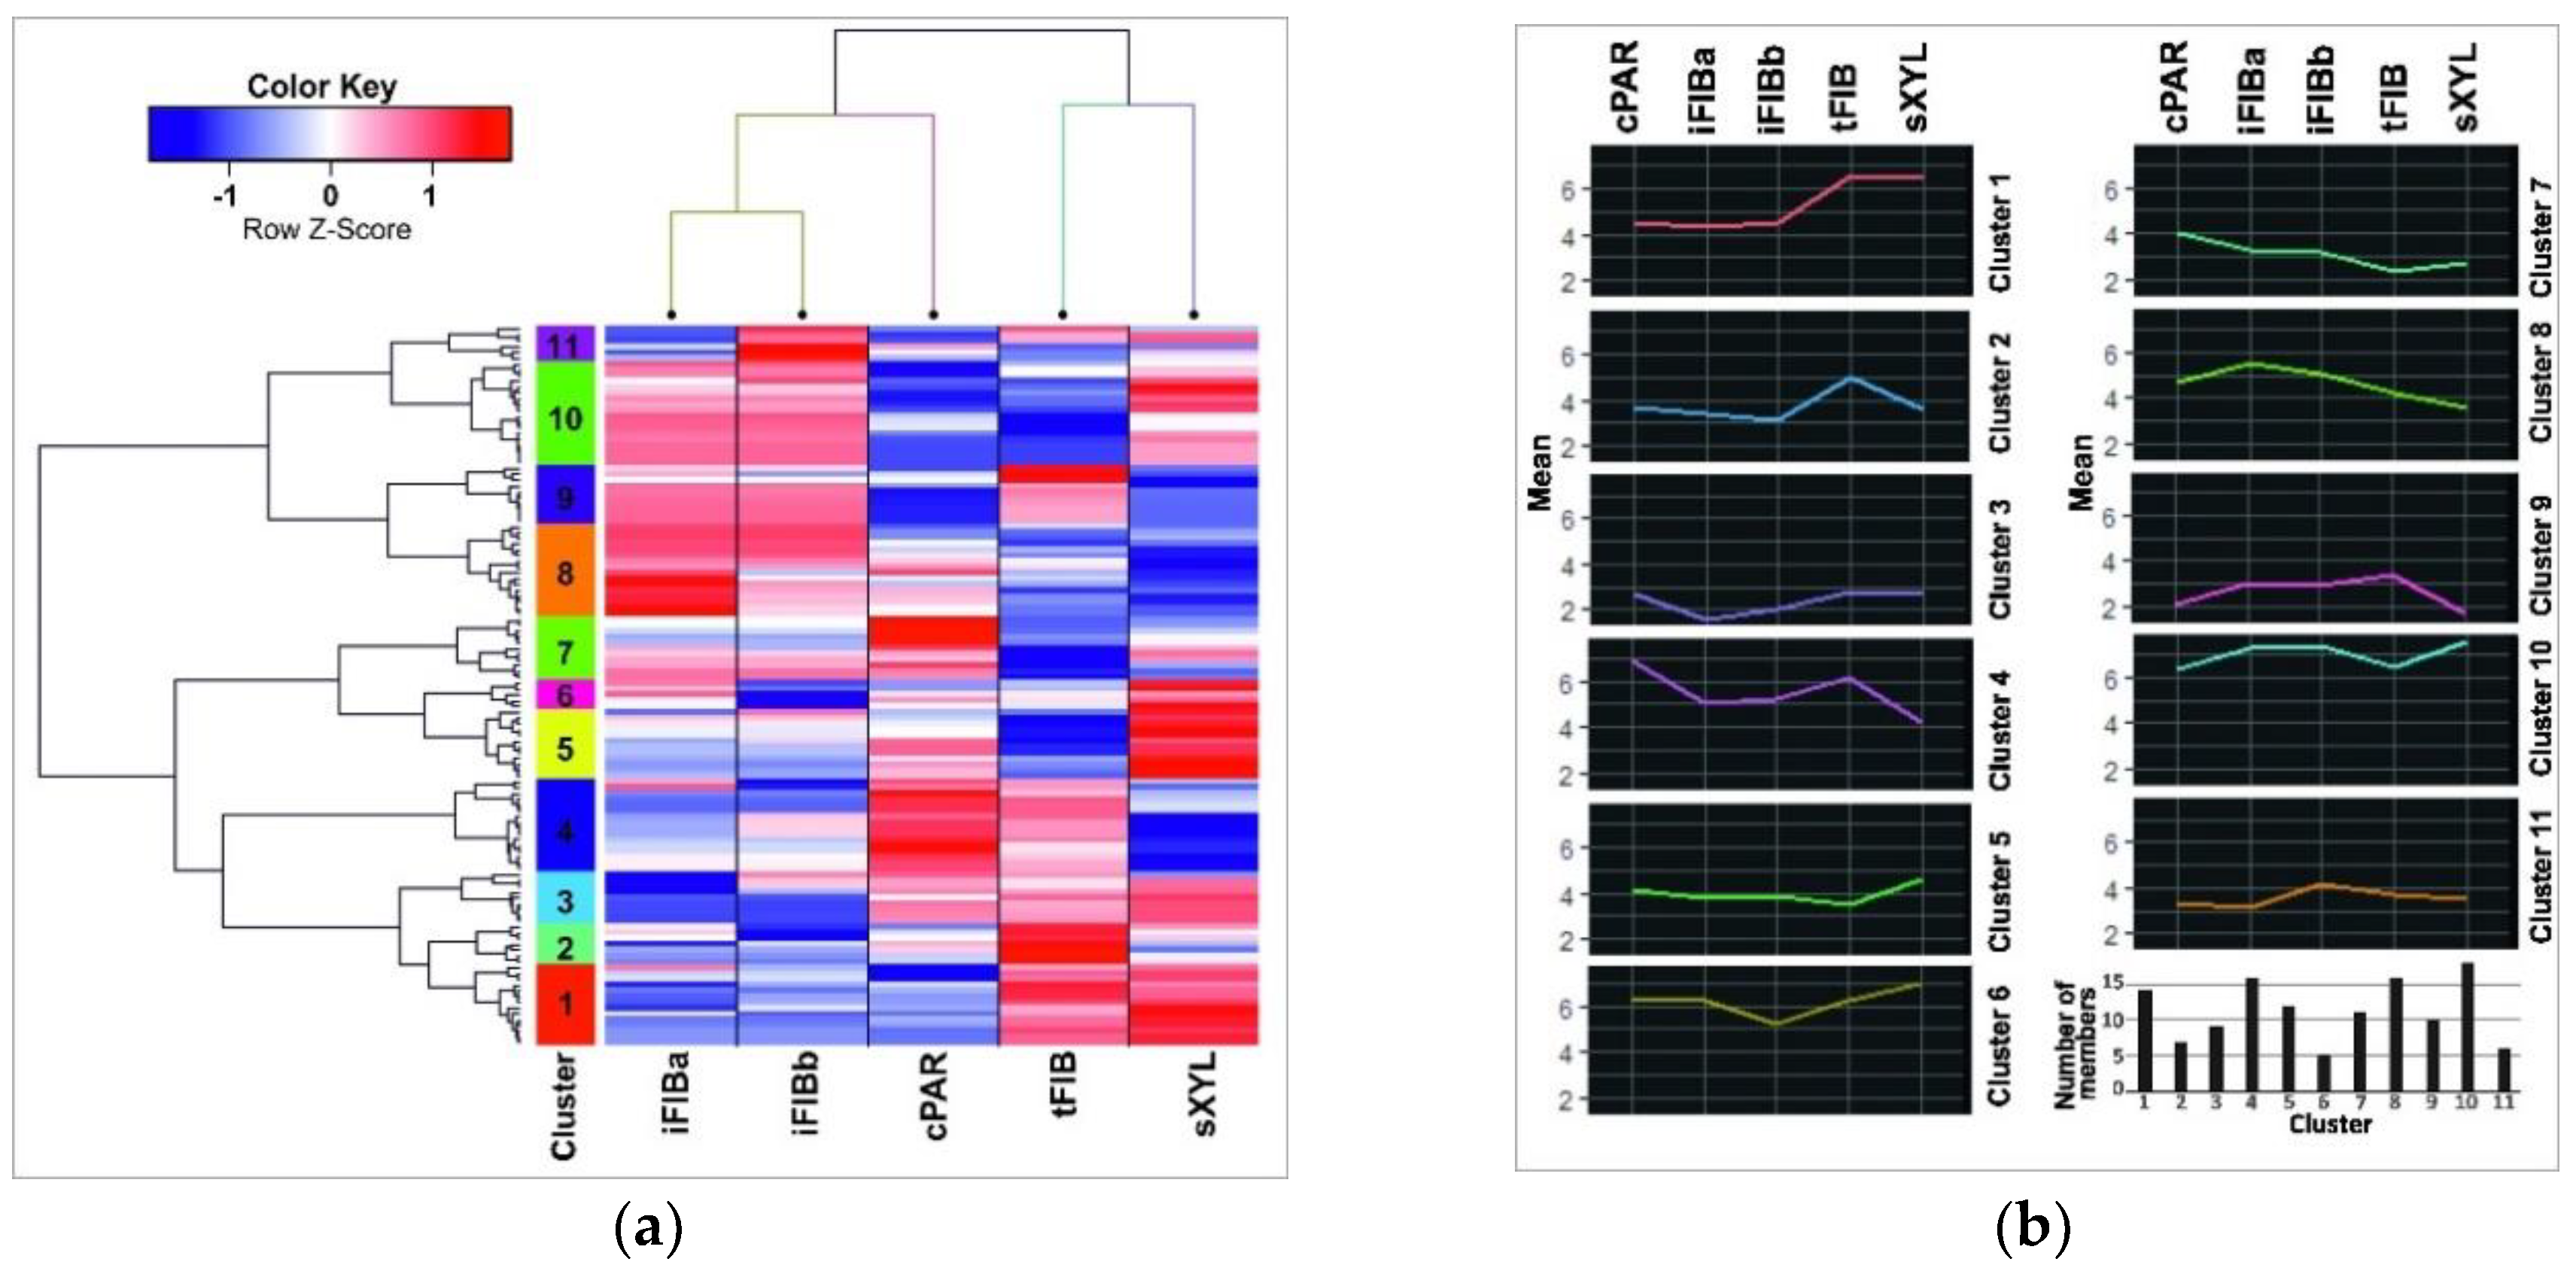
2.3. Identification of Differentially Expressed miRNAs during Intrusive Elongation of Phloem Fibers in Flax Stems
2.4. Identification of miRNA Targets Up- and Down-Regulated during Intrusive Elongation of Phloem Fibers in Flax Stems
2.5. Comparison of miRNA and mRNA Expression Profiles at the Two Substages of Fiber Intrusive Elongation
3. Discussion
3.1. miRNAs and Their Predicted Targets That Are Important for Intrusive Growth of Phloem Fibers in Flax Stems
3.2. Members of miR396 Family Are Down-Regulated in Intrusively Growing Phloem Fibers in Flax Stems
3.3. Similar miRNA Families Are Related to Cell Elongation in Various Plant Tissues
3.4. Genes Important at the Early Stage of Intrusive Elongation
4. Materials and Methods
4.1. Plant Materials and Sample Preparation
4.2. Cryosectioning and Laser Microdissection
4.3. RNA Isolation, Library Preparation and Sequencing
4.4. Bioinformatic Analysis and Data Visualization
4.4.1. RNA-seq Data Analysis
4.4.2. miRNA-seq Data Analysis
4.4.3. Differential Expression Analysis
4.4.4. Hierarchical Clustering of Samples and miRNAs
4.5. Computational Prediction of Flax miRNA Targets
5. Conclusions
Supplementary Materials
Author Contributions
Funding
Acknowledgments
Conflicts of Interest
References
- Gorshkova, T.; Brutch, N.; Chabbert, B.; Deyholos, M.; Hayashi, T.; Lev-Yadun, S.; Mellerowicz, E.J.; Morvan, C.; Neutelings, G.; Pilate, G. Plant Fiber Formation: State of the Art, Recent and Expected Progress, and Open Questions. Crit. Rev. Plant Sci. 2012, 31, 201–228. [Google Scholar] [CrossRef]
- Mokshina, N.; Chernova, T.; Galinousky, D.; Gorshkov, O.; Gorshkova, T. Key Stages of Fiber Development as Determinants of Bast Fiber Yield and Quality. Fibers 2018, 6, 20. [Google Scholar] [CrossRef]
- Gorshkova, T.A.; Sal’nikov, V.V.; Chemikosova, S.B.; Ageeva, M.V.; Pavlencheva, N.V.; van Dam, J.E.G. The snap point: A transition point in Linum usitatissimum bast fiber development. Ind. Crops Prod. 2003, 18, 213–221. [Google Scholar] [CrossRef]
- Esau, K. Vascular differentiation in the vegetative shoot of Linum. III. The origin of bast fibers. Am. J. Bot. 1943, 30, 579–586. [Google Scholar] [CrossRef]
- Ageeva, M.V.; Petrovská, B.; Kieft, H.; Sal’nikov, V.V.; Snegireva, A.V.; van Dam, J.E.; van Veenendaal, W.L.; Emons, A.M.; Gorshkova, T.A.; van Lammeren, A.A. Intrusive growth of flax phloem fibers is of intercalary type. Planta 2005, 222, 565–574. [Google Scholar] [CrossRef] [PubMed]
- Lev-Yadun, S. Intrusive growth—The plant analog of dendrite and axon growth in animals. New Phytol. 2001, 150, 508–512. [Google Scholar] [CrossRef]
- Snegireva, A.; Chernova, T.; Ageeva, M.; Lev-Yadun, S.; Gorshkova, T. Intrusive growth of primary and secondary phloem fibres in hemp stem determines fibre-bundle formation and structure. AoB Plants 2015, 7, plv061. [Google Scholar] [CrossRef]
- Gorshkova, T.; Chernova, T.; Mokshina, N.; Ageeva, M.; Mikshina, P. Plant ‘muscles’: Fibers with a tertiary cell wall. New Phytol. 2018, 218, 66–72. [Google Scholar] [CrossRef]
- Gorshkova, T.; Mikshina, P.; Petrova, A.; Chernova, T.; Mokshina, N.; Gorshkov, O. Plants at Bodybuilding: Development of Plant “Muscles”. In Plant Biomechanics; Geitmann, A., Gril, J., Eds.; Springer: Cham, Switzerland, 2018; pp. 141–163. ISBN 978-3-319-79098-5. [Google Scholar]
- Gorshkov, O.; Mokshina, N.; Gorshkov, V.; Chemikosova, S.; Gogolev, Y.; Gorshkova, T. Transcriptome portrait of cellulose-enriched flax fibers at advanced stage of specialization. Plant Mol. Biol. 2017, 93, 431–449. [Google Scholar] [CrossRef]
- Gorshkova, T.; Chernova, T.; Mokshina, N.; Gorshkov, V.; Kozlova, L.; Gorshkov, O. Transcriptome Analysis of Intrusively Growing Flax Fibers Isolated by Laser Microdissection. Sci. Rep. 2018, 8, 14570. [Google Scholar] [CrossRef]
- Lee, R.C.; Feinbaum, R.L.; Ambros, V. The C. elegansheterochronic gene lin-4 encodes small RNAs with antisense complementarity to lin-14. Cell 1993, 75, 843–854. [Google Scholar] [CrossRef]
- Wightman, B.; Ha, I.; Ruvkun, G. Posttranscriptional regulation of the heterochronic gene lin-14 by lin-4 mediates temporal pattern formation in C. elegans. Cell 1993, 5, 855–862. [Google Scholar] [CrossRef]
- D’Ario, M.; Griffiths-Jones, S.; Kim, M. Small RNAs: Big Impact on Plant Development. Trends Plant Sci. 2017, 22, 1056–1068. [Google Scholar] [CrossRef] [PubMed]
- Brant, E.J.; Budak, H. Plant Small Non-coding RNAs and Their Roles in Biotic Stresses. Front. Plant Sci. 2018, 9, 1038. [Google Scholar] [CrossRef]
- Singh, A.; Gautam, V.; Singh, S.; Sarkar Das, S.; Verma, S.; Mishra, V.; Mukherjee, S.; Sarkar, A.K. Plant small RNAs: Advancement in the understanding of biogenesis and role in plant development. Planta 2018, 248, 545–558. [Google Scholar] [CrossRef] [PubMed]
- Axtell, M.J.; Bartel, D.P. Antiquity of microRNAs and their targets in land plants. Plant Cell 2005, 17, 1658–1673. [Google Scholar] [CrossRef] [PubMed]
- Barozai, M.Y. In silico identification of micrornas and their targets in fiber and oil producing plant flax (Linum usitatissimum L.). Pak. J. Bot. 2012, 44, 1357–1362. [Google Scholar]
- Zinati, Z.; Shamloo-Dashtpagerdi, R.; Behpouri, A. In silico identification of miRNAs and their target genes and analysis of gene co-expression network in saffron (Crocus sativus L.) stigma. Mol. Biol. Res. Commun. 2016, 5, 233–246. [Google Scholar]
- Samad, A.F.A.; Nazaruddin, N.; Murad, A.M.A.; Jani, J.; Zainal, Z.; Ismail, I. Deep sequencing and in silico analysis of small RNA library reveals novel miRNA from leaf Persicaria minor transcriptome. 3 Biotech 2018, 8, 136. [Google Scholar] [CrossRef] [PubMed]
- Yi, X.; Zhang, Z.; Ling, Y.; Xu, W.; Su, Z. PNRD: A plant non-coding RNA database. Nucleic Acids Res. 2015, 43, D982–D989. [Google Scholar] [CrossRef]
- Neutelings, G.; Fénart, S.; Lucau-Danila, A.; Hawkins, S. Identification and characterization of mirnas and their potential targets in flax. J. Plant Physiol. 2012, 169, 1754–1766. [Google Scholar] [CrossRef] [PubMed]
- Barvkar, V.T.; Pardeshi, V.C.; Kale, S.M.; Qiu, S.Q.; Rollins, M.; Datla, R.; Gupta, V.S.; Kadoo, N.Y. Genome-wide identification and characterization of microRNA genes and their targets in flax (Linum usitatissimum): Characterization of flax miRNA genes.). Planta 2013, 237, 1149–1161. [Google Scholar] [CrossRef] [PubMed]
- Yu, Y.; Wu, G.; Yuan, H.; Cheng, L.; Zhao, D.; Huang, W.; Zhang, S.; Zhang, L.; Chen, H.; Zhang, J.; et al. Identification and characterization of miRNAs and targets in flax (Linum usitatissimum) under saline, alkaline, and saline-alkaline stresses. BMC Plant Biol. 2016, 16, 124. [Google Scholar] [CrossRef] [PubMed]
- Melnikova, N.V.; Dmitriev, A.A.; Belenikin, M.S.; Koroban, N.V.; Speranskaya, A.S.; Krinitsina, A.A.; Krasnov, G.S.; Lakunina, V.A.; Snezhkina, A.V.; Sadritdinova, A.F.; et al. Identification, Expression Analysis, and Target Prediction of Flax Genotroph MicroRNAs Under Normal and Nutrient Stress Conditions. Front. Plant Sci. 2016, 7, 399. [Google Scholar] [CrossRef] [PubMed]
- Dmitriev, A.A.; Kudryavtseva, A.V.; Bolsheva, N.L.; Zyablitsin, A.V.; Rozhmina, T.A.; Kishlyan, N.V.; Krasnov, G.S.; Speranskaya, A.S.; Krinitsina, A.A.; Sadritdinova, A.F.; et al. miR319, miR390, and miR393 Are Involved in Aluminum Response in Flax (Linum usitatissimum L.). BioMed Res. Int. 2017, 2017, 6915898. [Google Scholar] [CrossRef] [PubMed]
- Axtell, M.J.; Meyers, B.C. Revisiting criteria for plant microRNA annotation in the era of big data. Plant Cell 2018, 30, 272–284. [Google Scholar] [CrossRef]
- Puzey, J.R.; Karger, A.; Axtell, M.; Kramer, E.M. Deep annotation of Populustrichocarpa microRNAs from diverse tissue sets. PLoS ONE 2012, 7, e33034. [Google Scholar] [CrossRef]
- Zhang, R.; Marshall, D.; Bryan, G.J.; Hornyik, C. Identification and characterization of miRNA transcriptome in potato by high-throughput sequencing. PLoS ONE 2013, 8, e57233. [Google Scholar] [CrossRef]
- He, X.; Zheng, W.; Cao, F.; Wu, F. Identification and comparative analysis of the microRNA transcriptome in roots of two contrasting tobacco genotypes in response to cadmium stress. Sci. Rep. 2016, 6, 32805. [Google Scholar] [CrossRef] [Green Version]
- Peng, C.; Chen, X.; Wang, X.; Xu, X.; Wei, W.; Wang, C.; Xu, J. Comparative analysis of miRNA expression profiles in transgenic and non-transgenic rice using miRNA-Seq. Sci. Rep. 2018, 8, 338. [Google Scholar] [CrossRef]
- Ma, C.; Yang, J.; Cheng, Q.; Mao, A.; Zhang, J.; Wang, S.; Weng, Y.; Wen, C. Comparative analysis of miRNA and mRNA abundance in determinate cucumber by high-throughput sequencing. PLoS ONE 2018, 13, e0190691. [Google Scholar] [CrossRef]
- Li, Y.; Alonso-Peral, M.; Wong, G.; Wang, M.B.; Millar, A.A. Ubiquitous miR159 repression of MYB33/65 in Arabidopsis rosettes is robust and is not perturbed by a wide range of stresses. BMC Plant Biol. 2016, 16, 179. [Google Scholar] [CrossRef] [PubMed]
- Schommer, C.; Bresso, E.G.; Spinelli, S.V.; Palatnik, J.F. Role of MicroRNA miR319 in Plant Development. In MicroRNAs in Plant Development and Stress Responses. Signaling and Communication in Plants; Sunkar, R., Ed.; Springer: Berlin/Heidelberg, Germany, 2012; Volume 15, pp. 29–47. ISBN 978-3-642-27383-4. [Google Scholar]
- Pilon, M. The copper microRNAs. New Phytol. 2017, 213, 1030–1035. [Google Scholar] [CrossRef] [PubMed]
- Ercoli, M.F.; Rojas, A.M.; Debernardi, J.M.; Palatnik, J.F.; Rodriguez, R.E. Control of cell proliferation and elongation by miR396. Plant Signal. Behav. 2016, 11, e1184809. [Google Scholar] [CrossRef] [PubMed] [Green Version]
- Dai, X.; Zhuang, Z.; Zhao, P.X. psRNATarget: A plant small RNA target analysis server (2017 release). Nucleic Acids Res. 2018. [Google Scholar] [CrossRef]
- Wang, Z.W.; Hobson, N.; Galindo, L.; Zhu, S.; Shi, D.; McDill, J.; Yang, L.; Hawkins, S.; Neutelings, G.; Datla, R.; et al. The genome of flax (Linum usitatissimum) assembled de novo from short shotgun sequence reads. Plant J. 2012, 72, 461–473. [Google Scholar] [CrossRef] [PubMed]
- Anders, S.; Pyl, P.T.; Huber, W. HTSeq—A Python framework to work with high-throughput sequencing data. Bioinformatics 2015, 31, 166–169. [Google Scholar] [CrossRef] [PubMed]
- Love, M.I.; Huber, W.; Anders, S. Moderated estimation of fold change and dispersion for RNA-seq data with DESeq2. Genome Biol. 2014, 15, 550. [Google Scholar] [CrossRef]
- Voinnet, O. Origin, biogenesis, and activity of plant microRNAs. Cell 2009, 136, 669–687. [Google Scholar] [CrossRef]
- Snegireva, A.V.; Ageeva, M.V.; Amenitskii, S.I.; Chernova, T.E.; Ebskamp, M.; Gorshkova, T.A. Intrusive growth of sclerenchyma fibers. Russ. J. Plant Physiol. 2010, 57, 342–355. [Google Scholar] [CrossRef] [Green Version]
- Lipka, E.; Gadeyne, A.; Stöckle, D.; Zimmermann, S.; De Jaeger, G.; Ehrhardt, D.W.; Kirik, V.; Van Damme, D.; Müller, S. The Phragmoplast-Orienting Kinesin-12 Class Proteins Translate the Positional Information of the Preprophase Band to Establish the Cortical Division Zone in Arabidopsis thaliana. Plant Cell 2014, 26, 2617–2632. [Google Scholar] [CrossRef] [PubMed] [Green Version]
- Rusk, N. When microRNAs activate translation. Res. Highlights 2008, 5, 122–123. [Google Scholar] [CrossRef]
- Vasudevan, S. Posttranscriptional upregulation by microRNAs. Wiley Interdiscip. Rev. RNA 2012, 3, 311–330. [Google Scholar] [CrossRef] [PubMed]
- Saraiya, A.A.; Li, W.; Wang, C.C. Transition of a microRNA from repressing to activating translation depending on the extent of base pairing with the target. PLoS ONE 2013, 8, e55672. [Google Scholar] [CrossRef]
- Narsai, R.; Howell, K.A.; Millar, A.H.; O’Toole, N.; Small, I.; Whelan, J. Genome-wide analysis of mRNA decay rates and their determinants in Arabidopsis thaliana. Plant Cell 2007, 19, 3418–3436. [Google Scholar] [CrossRef] [PubMed]
- Liu, D.M.; Song, Y.; Chen, Z.X.; Yu, D.Q. Ectopic expression of miR396 suppresses GRF target gene expression and alters leaf growth in Arabidopsis. Physiol. Plant. 2009, 136, 223–236. [Google Scholar] [CrossRef] [PubMed]
- Rodriguez, R.E.; Mecchia, M.A.; Debernardi, J.M.; Schommer, C.; Weigel, D.; Palatnik, J.F. Control of cell proliferation in Arabidopsis thaliana by microRNA miR396. Development 2010, 137, 103–112. [Google Scholar] [CrossRef]
- Wang, L.; Gu, X.; Xu, D.; Wang, W.; Wang, H.; Zeng, M.; Chang, Z.; Huang, H.; Cui, X. miR396-targeted AtGRF transcription factors are required for coordination of cell division and differentiation during leaf development in Arabidopsis. J. Exp. Bot. 2011, 62, 761–773. [Google Scholar] [CrossRef]
- Oh, S.A.; Bourdon, V.; Das ‘Pal, M.; Dickinson, H.; Twell, D. Arabidopsis kinesins HINKEL and TETRASPORE act redundantly to control cell plate expansion during cytokinesis in the male gametophyte. Mol. Plant 2008, 1, 794–799. [Google Scholar] [CrossRef]
- Wang, Y.; Zhang, W.Z.; Song, L.F.; Zou, J.J.; Su, Z.; Wu, W.H. Transcriptome analyses show changes in gene expression to accompany pollen germination and tube growth in Arabidopsis. Plant Physiol. 2008, 148, 1201–1211. [Google Scholar] [CrossRef]
- Gao, P.; Bai, X.; Yang, L.; Lv, D.; Li, Y.; Cai, H.; Ji, W.; Guo, D.; Zhu, Y. Over-expression of osa-MIR396c decreases salt and alkali stress tolerance. Planta 2010, 231, 991–1001. [Google Scholar] [CrossRef] [PubMed]
- Vazquez, F.; Vaucheret, H.; Rajagopalan, R.; Lepers, C.; Gasciolli, V.; Mallory, A.C.; Hilbert, J.L.; Bartel, D.P.; Crété, P. Endogenous trans-acting siRNAs regulate the accumulation of Arabidopsis mRNAs. Mol. Cell 2004, 16, 69–79. [Google Scholar] [CrossRef] [PubMed]
- Montgomery, T.A.; Howell, M.D.; Cuperus, J.T.; Li, D.; Hansen, J.E.; Alexander, A.L.; Chapman, E.J.; Fahlgren, N.; Allen, E.; Carrington, J.C. Specificity of ARGONAUTE7-miR390 interaction and dual functionality in TAS3 trans-acting siRNA formation. Cell 2008, 133, 128–141. [Google Scholar] [CrossRef] [PubMed]
- Fang, X.; Qi, Y. RNAi in plants: An argonaute-centered view. Plant Cell 2016, 28, 272–285. [Google Scholar] [CrossRef] [PubMed]
- Mecchia, M.A.; Debernardi, J.M.; Rodriguez, R.E.; Schommer, C.; Palatnik, J.F. MicroRNA miR396 and RDR6 synergistically regulate leaf development. Mech. Dev. 2013, 130, 2–13. [Google Scholar] [CrossRef]
- Wang, Y.; Ding, Y.; Liu, J.-Y. Identification and Profiling of microRNAs Expressed in Elongating Cotton Fibers Using Small RNA Deep Sequencing. Front. Plant Sci. 2016, 7, 1722. [Google Scholar] [CrossRef]
- Shao, C.; Ma, X.; Xu, X.; Meng, Y. Identification of the highly accumulated microRNA*s in Arabidopsis (Arabidopsis thaliana) and rice (Oryza sativa). Gene 2012, 515, 123–127. [Google Scholar] [CrossRef]
- Hu, W.; Wang, T.; Yue, E.; Zheng, S.; Xu, J.-H. Flexible microRNA arm selection in rice. Biochem. Biophys. Res. Commun. 2014, 447, 526–530. [Google Scholar] [CrossRef]
- Zhu, H.; Hu, F.; Wang, R.; Zhou, X.; Sze, S.H.; Liou, L.W.; Barefoot, A.; Dickman, M.; Zhang, X. Arabidopsis Argonaute10 specifically sequesters miR166/165 to regulate shoot apical meristem development. Cell 2011, 145, 242–256. [Google Scholar] [CrossRef]
- Miyashima, S.; Honda, M.; Hashimoto, K.; Tatematsu, K.; Hashimoto, T.; Sato-Nara, K.; Okada, K.; Nakajima, K. A comprehensive expression analysis of the Arabidopsis MICRORNA165/6 gene family during embryogenesis reveals a conserved role in meristem specification and a non-cell-autonomous function. Plant Cell Physiol. 2013, 54, 375–384. [Google Scholar] [CrossRef]
- Schuetz, M.; Smith, R.; Ellis, B. Xylem tissue specification, patterning, and differentiation mechanisms. J. Exp. Bot. 2013, 64, 11–31. [Google Scholar] [CrossRef] [PubMed]
- Mishra, A.K.; Puranik, S.; Prasad, M. Structure and regulatory networks of WD40 protein in plants. J. Plant Biochem. Biotechnol. 2012, 21 (Suppl. 1), 32–39. [Google Scholar] [CrossRef]
- Guerriero, G.; Hausman, J.-F.L.; Ezcurra, I. WD40-Repeat Proteins in Plant Cell Wall Formation: Current Evidence and Research Prospects. Front. Plant Sci. 2015, 6, 1112. [Google Scholar] [CrossRef] [PubMed]
- Pilot, G.; Stransky, H.; Bushey, D.F.; Pratelli, R.; Ludewig, U.; Wingate, V.P.M.; Frommer, W.B. Overexpression of GLUTAMINE DUMPER1 Leads to Hypersecretion of Glutamine from Hydathodes of Arabidopsis Leaves. Plant Cell 2004, 16, 1827–1840. [Google Scholar] [CrossRef] [PubMed] [Green Version]
- Pratelli, R.; Voll, L.M.; Horst, R.J.; Frommer, W.B.; Pilot, G. Stimulation of nonselective amino acid export by glutamine dumper proteins. Plant Physiol. 2010, 152, 762–773. [Google Scholar] [CrossRef] [PubMed]
- Liang, G.; He, H.; Li, Y.; Ai, Q.; Yu, D. MYB82 functions in regulation of trichome development in Arabidopsis. J. Exp. Bot. 2014, 65, 3215–3223. [Google Scholar] [CrossRef] [PubMed] [Green Version]
- Horiguchi, G.; Kim, G.T.; Tsukaya, H. The transcription factor AtGRF5 and the transcription coactivator AN3 regulate cell proliferation in leaf primordia of Arabidopsis thaliana. Plant J. 2005, 43, 68–78. [Google Scholar] [CrossRef] [Green Version]
- Imamura, A.; Hanaki, N.; Umeda, H.; Nakamura, A.; Suzuki, T.; Ueguchi, C.; Mizuno, T. Response regulators implicated in His-to-Asp phosphotransfer signaling in Arabidopsis. Proc. Natl. Acad. Sci. USA 1998, 95, 2691–2696. [Google Scholar] [CrossRef] [Green Version]
- To, J.P.C.; Haberer, G.; Ferreira, F.J.; Deruere, J.; Mason, M.G.; Schaller, G.E.; Alonso, J.M.; Ecker, J.R.; Kieber, J.J. Type-A Arabidopsis response regulators are partially redundant negative regulators of cytokinin signaling. Plant Cell 2004, 16, 658–671. [Google Scholar] [CrossRef]
- Shockey, J.M.; Fulda, M.S.; Browse, J. Arabidopsis Contains a Large Superfamily of Acyl-Activating Enzymes. Phylogenetic and Biochemical Analysis Reveals a New Class of Acyl-Coenzyme A Synthetases. Plant Physiol. 2003, 132, 1065–1076. [Google Scholar] [CrossRef] [Green Version]
- Reichelt, M.; Brown, P.D.; Schneider, B.; Oldham, N.J.; Stauber, E.; Tokuhisa, J.; Kliebenstein, D.J.; Mitchell-Olds, T.; Gershenzon, J. Benzoic acid glucosinolate esters and other glucosinolates from Arabidopsis thaliana. Phytochemistry 2002, 59, 663–671. [Google Scholar] [CrossRef]
- O’Malley, D.M.; Whetten, R.; Bao, W.; Chen, C.-L.; Sederoff, R.R. The role of laccase in lignification. Plant J. 1993, 4, 751–757. [Google Scholar] [CrossRef]
- Paniagua, C.; Bilkova, A.; Jackson, P.; Dabravolski, S.; Riber, W.; Didi, V.; Houser, J.; Gigli-Bisceglia, N.; Wimmerova, M.; Budínská, E.; et al. Dirigent proteins in plants: Modulating cell wall metabolism during abiotic and biotic stress exposure. J. Exp. Bot. 2017, 68, 3287–3301. [Google Scholar] [CrossRef] [PubMed]
- Cai, X.; Davis, E.J.; Ballif, J.; Liang, M.; Bushman, E.; Haroldsen, V.; Torabinejad, J.; Wu, Y. Mutant identification and characterization of the laccase gene family in Arabidopsis. J. Exp. Bot. 2006, 57, 2563–2569. [Google Scholar] [CrossRef] [PubMed] [Green Version]
- Cheng, Y.; Dai, X.; Zhao, Y. Auxin biosynthesis by the YUCCA flavin monooxygenases controls the formation of floral organs and vascular tissues in Arabidopsis. Genes Dev. 2006, 20, 1790–1799. [Google Scholar] [CrossRef] [PubMed] [Green Version]
- Mokshina, N.; Gorshkova, T.; Deyholos, M.K. Chitinase-like (CTL) and cellulose synthase (CESA) gene expression in gelatinous-type cellulosic walls of flax (Linum usitatissimum L.) bast fibers. PLoS ONE 2014, 9, e97949. [Google Scholar] [CrossRef] [PubMed]
- Mokshina, N.; Gorshkov, O.; Ibragimova, N.; Chernova, T.; Gorshkova, T. Cellulosic fibres of flax recruit both primary and secondary cell wall cellulose synthases during deposition of thick tertiary cell walls and in the course of graviresponse. Funct. Plant Biol. 2017, 44, 820–831. [Google Scholar] [CrossRef]
- Petrov, A.I.; Kay, S.; Kalvari, I.; Howe, K.L.; Gray, K.A.; Bruford, E.A.; Kersey, P.J.; Cochrane, G.; Finn, R.D. RNAcentral: A comprehensive database of non-coding RNA sequences. Nucleic Acids Res. 2017, 45, D128–D134. [Google Scholar] [CrossRef]
- BBTools. Available online: https://jgi.doe.gov/data-and-tools/bbtools/bb-tools-user-guide/bbduk-guide/ (accessed on 21 January 2019).
- Kim, D.; Langmead, B.; Salzberg, S.L. HISAT: A fast spliced aligner with low memory requirements. Nat. Methods 2015, 12, 357–360. [Google Scholar] [CrossRef]
- Goodstein, D.M.; Shu, S.; Howson, R.; Neupane, R.; Hayes, R.D.; Fazo, J.; Mitros, T.; Dirks, W.; Hellsten, U.; Putnam, N.; et al. Phytozome: A comparative platform for green plant genomics. Nucleic Acids Res. 2012, 40, D1178–D1186. [Google Scholar] [CrossRef]
- Martin, M. Cutadapt removes adapter sequences from high-throughput sequencing reads. EMBnet.journal 2011, 17, 10–12. [Google Scholar] [CrossRef]
- Kozomara, A.; Birgaoanu, M.; Griffiths-Jones, S. miRBase: From microRNA sequences to function. Nucleic Acids Res. 2018. [Google Scholar] [CrossRef] [PubMed]
- Langmead, B.; Salzberg, S.L. Fast gapped-read alignment with Bowtie 2. Nat. Methods 2012, 9, 357–359. [Google Scholar] [CrossRef] [PubMed] [Green Version]
- Li, H.; Handsaker, B.; Wysoker, A.; Fennell, T.; Ruan, J.; Homer, N.; Marth, G.; Abecasis, G.; Durbin, R.; 1000 Genome Project Data Processing Subgroup. The Sequence Alignment/Map format and SAMtools. Bioinformatics 2009, 25, 2078–2079. [Google Scholar] [CrossRef] [Green Version]
- SEQC/MAQC-III Consortium. A comprehensive assessment ofRNA-seq accuracy, reproducibility and information content by thesequencing quality control consortium. Nat. Biotechnol. 2014, 32, 903–914. [Google Scholar] [CrossRef] [PubMed]
- Love, M.I.; Anders, S.; Kim, V.; Huber, W. RNA-Seq workflow: Gene-level exploratory analysis and differential expression. F1000Research 2015, 4, 1070. [Google Scholar] [CrossRef] [PubMed]
- R Development Core Team. R: A Language and Environment for Statistical Computing; R Foundation for Statistical Computing: Vienna, Austria, 2014; ISBN 3-900051-07-0. Available online: http://www.R-project.org (accessed on 12 December 2018).
- psRNATarget: A Plant Small RNA Target Analysis Server (2017 Update). Available online: http://plantgrn.noble.org/psRNATarget/) (accessed on 28 November 2018).
- Havelda, Z. Biogenesis and Function of Plant microRNAs. In Regulation of Gene Expression by Small RNAs, 1st ed.; Gaur, R.K., Rossi, J.J., Eds.; CRC Press: Boca Raton, FL, USA, 2009; pp. 173–196. ISBN 9781138111738. [Google Scholar]


| cPAR | iFIBa | iFIBb | tFIB | sXYL | |
|---|---|---|---|---|---|
| Raw reads | 25,949,391 | 27,817,347 | 26,770,365 | 22,233,088 | 21,301,402 |
| Adapter removed | 23,992,256 | 25,566,467 | 24,081,883 | 20,595,701 | 20,243,016 |
| r-, t-, sn-, snoRNA removed | 20,278,935 | 21,214,545 | 20,292,005 | 19,125,440 | 18,330,421 |
| 15–30 nt filtering | 11,290,477 | 13,311,657 | 12,439,784 | 10,681,782 | 11,197,941 |
| Reads that were too short, % | 32.4 | 27.8 | 29.75 | 29.05 | 24.6 |
| Reads that were too long, % | 11.95 | 9.45 | 8.95 | 14.75 | 14.1 |
| Filtered and cleaned reads, % | 55.6 | 62.7 | 61.3 | 56.2 | 61.25 |
| Cluster. | lus_miR | iFIBa&b vs. cPAR, log2FC | padj | iFIBa vs. iFIBb, log2FC | padj | iFIBa vs. tFIB, log2FC | padj | iFIBb vs. tFIB, log2FC | padj | iFIBa&b vs. sXYL, log2FC | padj |
|---|---|---|---|---|---|---|---|---|---|---|---|
| DOWN-regulated miRNAs related to intrusive growth | |||||||||||
| 1 | miR396c | −2.00 | 3.2 × 10⁻² | −1.72 | 1.0 | −9.04 | 3.1 × 10⁻¹⁶ | −7.32 | 4.1 × 10⁻¹⁹ | −7.40 | 1.2 × 10⁻²³ |
| miR396d | −1.17 | 2.0 × 10⁻¹ | −1.86 | 1.0 | −8.64 | 2.4 × 10⁻¹⁹ | −6.78 | 1.1 × 10⁻²¹ | −6.82 | 1.1 × 10⁻²⁴ | |
| miR396a | −1.08 | 2.0 × 10⁻¹ | −1.81 | 1.0 | −7.86 | 1.1 × 10⁻²¹ | −6.05 | 2.4 × 10⁻²⁰ | −6.12 | 2.7 × 10⁻²² | |
| miR396b | −1.59 | 2.2 × 10⁻¹ | −2.76 | 7.5 × 10⁻³ | −5.97 | 9.3 × 10⁻¹⁷ | −3.21 | 1.9 × 10⁻⁵ | −3.25 | 4.6 × 10⁻³ | |
| miR396e | −1.40 | 2.9 × 10⁻¹ | −1.93 | 1.0 | −4.43 | 1.3 × 10⁻⁶ | −2.50 | 1.0 × 10⁻² | −3.64 | 1.3 × 10⁻³ | |
| miR156a | −0.32 | 8.2 × 10⁻¹ | 0.10 | 1.0 | −3.24 | 5.8 × 10⁻⁴ | −3.34 | 6.3 × 10⁻⁴ | −2.47 | 1.3 × 10⁻³ | |
| miR167i | 1.40 | 2.8 × 10⁻¹ | 0.03 | 1.0 | −2.47 | 2.9 × 10⁻² | −2.50 | 2.8 × 10⁻² | −1.69 | 5.3 × 10⁻² | |
| miR159a | 3.74 | 7.6 × 10⁻² | 2.18 | 1.0 | −2.12 | 9.2 × 10⁻² | −4.30 | 9.1 × 10⁻³ | −3.97 | 2.9 × 10⁻⁵ | |
| 2 | miR166f | −2.47 | 1.8 × 10⁻⁴ | −0.90 | 1.0 | −4.22 | 3.7 × 10⁻⁹ | −3.32 | 7.8 × 10⁻⁶ | −0.50 | 5.3 × 10⁻¹ |
| miR166e | −1.90 | 3.5 × 10⁻³ | −0.49 | 1.0 | −3.60 | 4.8 × 10⁻⁷ | −3.11 | 2.1 × 10⁻⁵ | −0.47 | 5.4 × 10⁻¹ | |
| 4 | miR166a | −3.75 | 5.0 × 10⁻¹² | −0.70 | 1.0 | −2.71 | 2.2 × 10⁻⁵ | −2.00 | 3.5 × 10⁻³ | 2.37 | 2.9 × 10⁻⁵ |
| miR166b | −2.52 | 1.6 × 10⁻⁴ | −0.58 | 1.0 | −2.71 | 7.1 × 10⁻⁴ | −2.12 | 1.0 × 10⁻² | 1.69 | 1.7 × 10⁻² | |
| miR166c | −3.54 | 2.5 × 10⁻¹¹ | −0.41 | 1.0 | −2.41 | 2.4 × 10⁻⁴ | −2.00 | 4.1 × 10⁻³ | 2.43 | 1.5 × 10⁻⁵ | |
| miR166h | −3.34 | 1.2 × 10⁻¹⁰ | −0.52 | 1.0 | −2.39 | 1.9 × 10⁻⁴ | −1.86 | 5.3 × 10⁻³ | 2.32 | 2.5 × 10⁻⁵ | |
| miR166k | −3.63 | 1.3 × 10⁻¹⁰ | −0.72 | 1.0 | −2.35 | 5.8 × 10⁻⁴ | −1.63 | 2.6 × 10⁻² | 2.88 | 1.7 × 10⁻⁶ | |
| miR166d | −3.72 | 5.0 × 10⁻¹² | −0.68 | 1.0 | −2.35 | 2.4 × 10⁻⁴ | −1.67 | 1.2 × 10⁻² | 2.35 | 2.8 × 10⁻⁵ | |
| miR166j | −3.63 | 6.0 × 10⁻¹¹ | −0.69 | 1.0 | −2.19 | 1.1 × 10⁻³ | −1.50 | 3.7 × 10⁻² | 2.76 | 2.5 × 10⁻⁶ | |
| miR166g | −3.32 | 3.7 × 10⁻¹⁰ | −0.59 | 1.0 | −2.08 | 1.4 × 10⁻³ | −1.48 | 3.3 × 10⁻² | 2.77 | 8.5 × 10⁻⁷ | |
| 6 | miR319a | −0.01 | 9.9 × 10⁻¹ | 0.97 | 1.0 | −1.04 | 9.6 × 10⁻² | −2.01 | 6.3 × 10⁻⁴ | −3.39 | 6.5 × 10⁻¹¹ |
| UP-regulated miRNAs related to intrusive growth | |||||||||||
| 5 | miR390a | −0.55 | 4.9 × 10⁻¹ | 0.05 | 1.0 | 2.03 | 1.5 × 10⁻² | 1.98 | 2.0 × 10⁻² | −1.19 | 5.3 × 10⁻² |
| miR390c | −1.53 | 3.2 × 10⁻² | −0.26 | 1.0 | 2.39 | 1.0 × 10⁻² | 2.65 | 4.8 × 10⁻³ | −1.58 | 1.6 × 10⁻² | |
| 7 | miR390b | −1.71 | 2.2 × 10⁻² | 0.58 | 1.0 | 2.58 | 5.7 × 10⁻³ | 2.01 | 4.6 × 10⁻² | −1.55 | 2.4 × 10⁻² |
| miR169k | 0.08 | 9.4 × 10⁻¹ | 0.19 | 1.0 | 3.44 | 1.7 × 10⁻³ | 3.25 | 5.1 × 10⁻³ | 3.49 | 7.1 × 10⁻⁵ | |
| 8 | miR399d | 1.56 | 1.8 × 10⁻¹ | 0.70 | 1.0 | 2.55 | 3.0 × 10⁻² | 1.86 | 1.3 × 10⁻¹ | 3.11 | 1.0 × 10⁻³ |
| miR160h | 1.71 | 1.4 × 10⁻¹ | 0.10 | 1.0 | 2.58 | 4.2 × 10⁻² | 2.48 | 5.1 × 10⁻² | 3.15 | 1.2 × 10⁻³ | |
| miR160j | 1.16 | 3.6 × 10⁻¹ | 0.51 | 1.0 | 2.97 | 2.9 × 10⁻² | 2.45 | 7.1 × 10⁻² | 4.15 | 2.9 × 10⁻⁴ | |
| miR160a | 1.31 | 2.2 × 10⁻¹ | 0.60 | 1.0 | 3.06 | 8.1 × 10⁻³ | 2.46 | 4.4 × 10⁻² | 4.05 | 2.9 × 10⁻⁵ | |
| miR160i | 0.97 | 4.9 × 10⁻¹ | 1.06 | 1.0 | 3.18 | 2.6 × 10⁻² | 2.12 | 1.6 × 10⁻¹ | 4.06 | 8.1 × 10⁻⁴ | |
| miR160d | 0.47 | 7.1 × 10⁻¹ | 1.15 | 1.0 | 3.46 | 5.6 × 10⁻⁴ | 2.31 | 3.7 × 10⁻² | 3.76 | 2.6 × 10⁻⁵ | |
| miR160b | 0.58 | 6.6 × 10⁻¹ | 0.34 | 1.0 | 3.51 | 3.6 × 10⁻³ | 3.18 | 1.1 × 10⁻² | 4.46 | 1.8 × 10⁻⁵ | |
| miR169e | 1.98 | 1.0 × 10⁻¹ | 0.13 | 1.0 | 3.63 | 5.7 × 10⁻³ | 3.51 | 1.0 × 10⁻² | 3.23 | 1.2 × 10⁻³ | |
| 10 | miR394b | 2.78 | 1.8 × 10⁻⁶ | 0.46 | 1.0 | 2.74 | 2.3 × 10⁻⁵ | 2.28 | 7.9 × 10⁻⁴ | −1.97 | 3.3 × 10⁻⁴ |
| miR394a | 2.68 | 3.9 × 10⁻⁴ | 0.03 | 1.0 | 2.96 | 3.9 × 10⁻⁴ | 2.93 | 6.4 × 10⁻⁴ | −1.64 | 1.7 × 10⁻² | |
| Family of miR | Member of lus-miR Family | Transcript ID | At Homolog | At Symbol | Description | iFIBa vs. tFIB, log2FC | padj | iFIBb vs. tFIB, log2FC | padj |
|---|---|---|---|---|---|---|---|---|---|
| miR156 | a | Lus10021034 | AT2G42200 | SPL9 | squamosa promoter binding protein-like 9 | 4.43 | 3.68 × 10−89 | 4.67 | 5.11 × 10−99 |
| a | Lus10002430 | AT3G62390 | TBL6 | TRICHOME BIREFRINGENCE-LIKE 6 | 3.34 | 8.55 × 10⁻¹² | 3.12 | 2.46 × 10⁻¹⁰ | |
| a | Lus10023818 | AT2G42200 | SPL9 | squamosa promoter binding protein-like 9 | 2.87 | 1.04 × 10⁻¹⁰ | 2.85 | 1.60 × 10⁻¹⁰ | |
| a | Lus10024555 | AT4G12110 | SMO1 | sterol-4alpha-methyl oxidase 1-1 | 2.53 | 8.25 × 10⁻³³ | 2.61 | 1.20 × 10⁻³⁴ | |
| a | Lus10012020 | AT2G42200 | SPL9 | squamosa promoter binding protein-like 9 | 2.44 | 6.94 × 10⁻¹⁹ | 2.25 | 4.82 × 10⁻¹⁶ | |
| a | Lus10021141 | AT1G69170 | Squamosa promoter-binding protein-like (SBP domain) transcription factor family protein | 2.08 | 2.14 × 10⁻¹⁰ | 1.46 | 1.87 × 10⁻⁵ | ||
| a | Lus10007726 | AT3G49760 | bZIP5 | basic leucine-zipper 5 | 1.97 | 6.20 × 10⁻³ | 3.23 | 2.10 × 10⁻⁶ | |
| miR159 | a | Lus10027321 | AT5G47560 | TDT | tonoplast dicarboxylate transporter | 4.99 | 5.39 × 10⁻³ | 6.78 | 9.58 × 10⁻⁵ |
| a | Lus10031827 | AT5G12930 | 3.86 | 1.89 × 10⁻¹⁹ | 3.31 | 2.65 × 10⁻¹⁴ | |||
| a | Lus10041729 | AT5G25620 | YUC6 | Flavin-binding monooxygenase family protein | 3.8 | 2.85 × 10⁻² | 4.62 | 6.86 × 10⁻³ | |
| a | Lus10016550 | AT5G07900 | Mitochondrial transcription termination factor family protein | 3.23 | 1.81 × 10⁻⁷ | 2.77 | 1.38 × 10⁻⁵ | ||
| a | Lus10034196 | AT3G11920 | glutaredoxin-related | 3.06 | 1.60 × 10⁻⁸ | 2.18 | 1.17 × 10⁻⁴ | ||
| a | Lus10031256 | AT5G12930 | 3.04 | 2.98 × 10⁻⁶ | 2.61 | 1.02 × 10⁻⁴ | |||
| a | Lus10019870 | AT3G19184 | AP2/B3-like transcriptional factor family protein | 2.11 | 5.70 × 10⁻⁴ | 1.43 | 3.14 × 10⁻² | ||
| miR166 | a,b,c,d,e,f,g,h,i,j,k | Lus10029117 | AT1G17100 | SOUL hem × 10-binding family protein | 7.05 | 6.17 × 10⁻⁵ | 6.78 | 1.43 × 10⁻⁴ | |
| b | Lus10022678 | AT3G51740 | IMK2 | inflorescence meristem receptor-like kinase 2 | 3.04 | 3.50 × 10⁻¹² | 2.87 | 8.73 × 10⁻¹¹ | |
| a,c,d,e,f,g,h,i,j,k | Lus10030381 | AT2G45850 | AT hook motif DNA-binding family protein | 2.87 | 4.96 × 10⁻³³ | 2.56 | 4.37 × 10⁻²⁶ | ||
| a,b,c,d,e,f,g,h,i,j,k | Lus10027060 | AT3G59680 | 2.67 | 4.26 × 10⁻⁴ | 3.39 | 4.96 × 10⁻⁶ | |||
| a,b,c,d,e,f,g,h,i,j,k | Lus10023357 | AT2G34710 | HB14,PHB | Homeobox-leucine zipper family protein/lipid-binding START domain-containing protein | 2.42 | 1.15 × 10−39 | 2.13 | 8.75 × 10⁻³¹ | |
| a,b,c,d,e,f,g,h,i,j,k | Lus10037568 | AT1G52150 | HB15,CNA,ICU4 | Homeobox-leucine zipper family protein/lipid-binding START domain-containing protein | 2.38 | 8.48 × 10−55 | 2.01 | 7.92 × 10−39 | |
| a,b,c,d,e,f,g,h,i,j,k | Lus10038449 | AT2G34710 | HB14,PHB | Homeobox-leucine zipper family protein/lipid-binding START domain-containing protein | 2.3 | 3.80 × 10−39 | 2.09 | 4.33 × 10⁻³² | |
| a,c,d,e,f,g,h,i,j,k | Lus10037696 | AT5G63950 | CHR24 | chromatin remodeling 24 | 2.21 | 2.98 × 10⁻²⁰ | 1.9 | 4.84 × 10⁻¹⁵ | |
| a,b,c,d,e,f,g,h,i,j,k | Lus10011426 | AT4G32880 | HB8 | homeobox gene 8 | 2.13 | 1.14 × 10⁻³² | 1.79 | 4.14 × 10⁻²³ | |
| a,b,c,d,e,f,g,h,i,j,k | Lus10011616 | AT4G32880 | HB8 | homeobox gene 8 | 2.1 | 5.98 × 10⁻¹⁴ | 1.94 | 5.89 × 10⁻¹² | |
| a,b,c,d,e,f,g,h,i,j,k | Lus10025223 | AT3G56370 | Leucine-rich repeat protein kinase family protein | 2 | 1.31 × 10⁻¹⁸ | 2.1 | 3.33 × 10⁻²⁰ | ||
| miR166 miR396 | b a,b,c,e | Lus10012048 | AT3G19050 | POK2 | phragmoplast orienting kinesin 2 | 2.49 | 1.92 × 10⁻³⁰ | 2.48 | 4.58 × 10⁻³⁰ |
| miR167 | i | Lus10026283 | AT2G21180 | 4.41 | 4.80 × 10⁻² | 4.7 | 3.59 × 10⁻² | ||
| i | Lus10006347 | AT5G12080 | MSL10 | mechanosensitive channel of small conductance-like 10 | 2.68 | 6.14 × 10⁻⁴ | 2.8 | 3.62 × 10⁻⁴ | |
| i | Lus10029912 | AT3G05330 | ATTAN | cyclin family | 2.28 | 4.39 × 10⁻¹⁰ | 2.46 | 1.62 × 10⁻¹¹ | |
| i | Lus10020804 | AT5G37020 | ARF8 | auxin response factor 8 | 2.19 | 1.21 × 10⁻²⁰ | 1.98 | 5.94 × 10⁻¹⁷ | |
| i | Lus10038019 | AT2G46980 | 2.07 | 8.42 × 10⁻⁶ | 2.26 | 1.10 × 10⁻⁶ | |||
| i | Lus10031354 | AT5G37020 | ARF8 | auxin response factor 8 | 1.96 | 8.84 × 10−53 | 2.02 | 8.09 × 10−56 | |
| i | Lus10002960 | AT5G12080 | MSL10 | mechanosensitive channel of small conductance-like 10 | 0.88 | 4.13 × 10⁻¹ | 2.03 | 3.15 × 10⁻² | |
| miR319 | a | Lus10041994 | AT5G52450 | MATE efflux family protein | 2.9 | 2.27 × 10⁻²⁵ | 2.26 | 1.44 × 10⁻¹⁵ | |
| a | Lus10004295 | AT5G49160 | DMT1,MET1,MET2 | methyltransferase 1 | 2.04 | 5.75 × 10⁻²² | 1.99 | 8.43 × 10⁻²¹ | |
| miR396 | a,b,c,e | Lus10038002 | AT2G45480 | GRF9 | growth-regulating factor 9 | 7.09 | 7.27 × 10⁻⁴ | 4.46 | 5.41 × 10⁻² |
| a,b,c,e | Lus10019275 | AT2G22840 | GRF1 | growth-regulating factor 1 | 5.84 | 2.41 × 10⁻¹² | 3.53 | 4.90 × 10⁻⁵ | |
| a,b,c,e | Lus10019274 | AT2G22840 | GRF1 | growth-regulating factor 1 | 5.14 | 1.60 × 10⁻²³ | 2.78 | 2.52 × 10⁻⁷ | |
| a,b,c,e | Lus10000473 | AT3G13960 | GRF5 | growth-regulating factor 5 | 4.75 | 6.53 × 10⁻⁵ | 3.55 | 4.21 × 10⁻³ | |
| a,b,c,e | Lus10011559 | AT2G22840 | GRF1 | growth-regulating factor 1 | 4.5 | 2.91 × 10⁻⁶ | 2.11 | 4.80 × 10⁻² | |
| a,b,c,e | Lus10009234 | AT2G45480 | GRF9 | growth-regulating factor 9 | 4.06 | 2.83 × 10⁻² | 3.6 | 6.19 × 10⁻² | |
| a,c | Lus10042952 | AT1G18370 | HIK,NACK1 | ATP binding microtubule motor family protein | 3.49 | 9.07 × 10−39 | 3.32 | 7.30 × 10⁻³⁵ | |
| a,b,c,e | Lus10011558 | AT2G22840 | GRF1 | growth-regulating factor 1 | 3.48 | 4.32 × 10⁻¹² | 0.67 | 2.90 × 10⁻¹ | |
| a,b,c,e | Lus10031717 | AT5G62360 | Plant invertase/pectin methylesterase inhibitor superfamily protein | 3.46 | 8.90 × 10⁻³⁴ | 3.68 | 4.89 × 10−38 | ||
| a,c | Lus10032452 | AT1G18370 | HIK,NACK1 | ATP binding microtubule motor family protein | 3.19 | 3.52 × 10−41 | 3.17 | 1.55 × 10−40 | |
| a,b,c,e | Lus10028754 | AT1G64080 | 3.04 | 6.45 × 10⁻⁶ | 0.82 | 3.35 × 10⁻¹ | |||
| a,c | Lus10004012 | AT3G61740 | ATX3,SDG14 | SET domain protein 14 | 2.9 | 2.28 × 10⁻⁷ | 3.22 | 7.72 × 10⁻⁹ | |
| d | Lus10024639 | AT4G23440 | Disease resistance protein (TIR-NBS class) | 2.76 | 2.89 × 10⁻⁴ | 1.62 | 5.34 × 10⁻² | ||
| d | Lus10039159 | AT1G33500 | 2.71 | 3.25 × 10⁻² | 2.57 | 4.91 × 10⁻² | |||
| a,b,c,e | Lus10010519 | AT3G06030 | MAPKKK12,NP3 | NPK1-related protein kinase 3 | 2.69 | 9.82 × 10⁻²⁶ | 2.61 | 4.96 × 10⁻²⁴ | |
| b,e | Lus10006983 | AT5G57655 | xylose isomerase family protein | 2.59 | 1.22 × 10−42 | 2.01 | 7.05 × 10⁻²⁶ | ||
| a,b,c,e | Lus10027933 | AT3G19050 | POK2 | phragmoplast orienting kinesin 2 | 2.57 | 2.29 × 10⁻³² | 2.61 | 3.04 × 10⁻³³ | |
| d | Lus10018093 | AT3G48210 | 2.47 | 1.92 × 10⁻¹⁹ | 2.38 | 5.86 × 10⁻¹⁸ | |||
| a,b,c,e | Lus10033441 | AT3G13960 | GRF5 | growth-regulating factor 5 | 2.46 | 7.44 × 10⁻⁵ | 1.56 | 1.92 × 10⁻² | |
| a,b,c,e | Lus10033236 | AT4G24150 | GRF8 | growth-regulating factor 8 | 2.25 | 8.03 × 10⁻⁴ | 1.1 | 1.56 × 10⁻¹ | |
| a,b,c,e | Lus10008268 | AT4G24150 | GRF8 | growth-regulating factor 8 | 2.24 | 1.04 × 10⁻³ | 1.05 | 1.80 × 10⁻¹ | |
| a,b,c,e | Lus10009533 | AT3G13960 | GRF5 | growth-regulating factor 5 | 2.21 | 2.19 × 10⁻¹⁴ | 1.23 | 7.23 × 10⁻⁵ | |
| b,e | Lus10043134 | AT1G04730 | CTF18 | P-loop containing nucleoside triphosphate hydrolases superfamily protein | 2.15 | 9.94 × 10⁻²¹ | 2.2 | 1.37 × 10⁻²¹ | |
| d | Lus10004364 | AT4G16820 | PLA-I{beta]2 | alpha/beta-Hydrolases superfamily protein | 2.12 | 3.86 × 10⁻¹⁵ | 1.28 | 7.12 × 10⁻⁶ | |
| a,c | Lus10037136 | AT1G69440 | AGO7,ZIP | Argonaute family protein | 2.1 | 1.60 × 10⁻¹⁰ | 0.27 | 5.49 × 10⁻¹ | |
| d | Lus10034335 | AT1G25400 | 1.75 | 1.72 × 10⁻⁴ | 2.09 | 5.30 × 10⁻⁶ |
| Family of miR | Member of lus-miR Family | Transcript ID | At Homolog | At Symbol | Description | iFIBa vs. tFIB, log2FC | padj | iFIBb vs. tFIB, log2FC | padj |
|---|---|---|---|---|---|---|---|---|---|
| miR160 | a,b,d,h,i,j | Lus10002356 | AT4G13830 | J20 | DNAJ-like 20 | −5.5 | 9.25 × 10⁻³ | −0.69 | 7.18 × 10⁻¹ |
| a,b,d,h,i,j | Lus10016090 | AT2G28350 | ARF10 | auxin response factor 10 | −4.05 | 1.93 × 10⁻²¹ | −2.92 | 1.27 × 10⁻¹⁴ | |
| a,b,d,h,i,j | Lus10018087 | AT3G48360 | BT2 | BTB and TAZ domain protein 2 | −3.39 | 2.08 × 10⁻²¹ | −3.9 | 9.03 × 10⁻²⁷ | |
| a,b,d,h,i,j | Lus10026510 | AT4G30080 | ARF16 | auxin response factor 16 | −2.98 | 6.02 × 10⁻¹¹ | −2.5 | 4.18 × 10⁻⁸ | |
| a,b,d,h,i,j | Lus10019940 | AT4G30080 | ARF16 | auxin response factor 16 | −2.79 | 5.29 × 10⁻⁹ | −3.1 | 1.54 × 10⁻⁹ | |
| a,b,d,h,i,j | Lus10021467 | AT4G30080 | ARF16 | auxin response factor 16 | −2.71 | 2.06 × 10⁻¹² | −1.74 | 4.11 × 10⁻⁶ | |
| a,b,d,h,i,j | Lus10007948 | AT4G30190 | HA2,PMA2 | H(+)-ATPase 2 | −2.69 | 1.23 × 10−48 | −2.36 | 1.64 × 10−37 | |
| a,b,d,h,i,j | Lus10010263 | AT4G37250 | Leucine-rich repeat protein kinase family protein | −2.11 | 5.48 × 10⁻²⁵ | −2.04 | 3.02 × 10⁻²³ | ||
| a,b,d,h,i,j | Lus10042082 | AT3G48360 | BT2 | BTB and TAZ domain protein 2 | −1.87 | 1.05 × 10⁻¹² | −2.3 | 4.72 × 10⁻¹⁸ | |
| miR169 | e,k | Lus10011003 | AT5G02890 | HXXXD-type acyl-transferase family protein | −10.21 | 5.23 × 10⁻¹⁰ | −6.55 | 1.78 × 10⁻¹¹ | |
| k | Lus10008780 | AT3G01500 | ATSABP3,CA1 | carbonic anhydrase 1 | −7.78 | 2.99 × 10⁻⁴ | −2.33 | 2.81 × 10⁻¹ | |
| k | Lus10014812 | AT4G27290 | S-locus lectin protein kinase family protein | −6.83 | 7.34 × 10⁻⁵ | −4.19 | 2.06 × 10⁻³ | ||
| e | Lus10028782 | AT4G21380 | RK3 | receptor kinase 3 | −6.02 | 3.94 × 10⁻¹⁷ | −6.3 | 5.02 × 10⁻¹⁵ | |
| k | Lus10022235 | AT3G01500 | SABP3,CA1 | carbonic anhydrase 1 | −5.69 | 5.27 × 10⁻⁹ | −3.56 | 4.05 × 10⁻⁴ | |
| k | Lus10031671 | AT5G07200 | GA20OX3,YAP169 | gibberellin 20-oxidase 3 | −5.53 | 1.57 × 10⁻⁴ | −7.74 | 2.26 × 10⁻⁵ | |
| k | Lus10028494 | AT1G66880 | Protein kinase superfamily protein | −5.17 | 3.00 × 10⁻¹⁰ | −5.57 | 2.82 × 10⁻¹⁰ | ||
| k | Lus10007724 | −4.43 | 1.20 × 10⁻¹⁴ | −2.66 | 1.11 × 10⁻⁷ | ||||
| e | Lus10023139 | AT3G62700 | MRP10 | multidrug resistance-associated protein 10 | −4.02 | 2.22 × 10−36 | −2.72 | 9.29 × 10⁻¹⁹ | |
| e | Lus10019657 | AT2G23450 | Protein kinase superfamily protein | −3.79 | 8.29 × 10⁻³⁰ | −2.9 | 1.44 × 10⁻¹⁹ | ||
| e | Lus10000741 | AT2G23450 | Protein kinase superfamily protein | −3.44 | 2.60 × 10⁻²² | −2.96 | 3.16 × 10⁻¹⁷ | ||
| e | Lus10016493 | AT1G07430 | HAI2 | highly ABA-induced PP2C gene 2 | −2.88 | 2.63 × 10⁻⁸ | −3.33 | 7.92 × 10⁻¹⁰ | |
| e | Lus10040231 | AT2G39920 | HAD superfamily, subfamily IIIB acid phosphatase | −2.82 | 2.71 × 10⁻³ | −4.86 | 8.06 × 10⁻⁵ | ||
| e | Lus10033665 | AT1G03790 | SOM | Zinc finger C-x8-C-x5-C-x3-H type family protein | −2.52 | 2.05 × 10⁻² | −8.55 | 3.52 × 10⁻⁶ | |
| e,k | Lus10001275 | AT1G76680 | OPR1 | 12-oxophytodienoate reductase 1 | −2.45 | 5.20 × 10⁻² | −2.98 | 2.48 × 10⁻² | |
| k | Lus10040311 | AT2G39510 | nodulin MtN21 /EamA-like transporter family protein | −2.45 | 1.01 × 10⁻³ | −2.6 | 5.16 × 10⁻⁴ | ||
| e,k | Lus10009473 | AT1G76690 | OPR2 | 12-oxophytodienoate reductase 2 | −2.37 | 4.46 × 10⁻¹³ | −2.35 | 1.09 × 10⁻¹² | |
| k | Lus10030400 | AT5G60900 | RLK1 | receptor-like protein kinase 1 | −2.36 | 1.32 × 10⁻³ | −1.86 | 1.39 × 10⁻² | |
| e | Lus10002765 | AT4G18950 | Integrin-linked protein kinase family | −2.2 | 2.88 × 10⁻³ | −3.61 | 9.09 × 10⁻⁶ | ||
| e | Lus10011498 | AT2G47800 | EST3,MRP4 | multidrug resistance-associated protein 4 | −2.11 | 1.36 × 10⁻¹⁹ | −1.12 | 3.07 × 10⁻⁶ | |
| k | Lus10039629 | AT4G37930 | SHM1,STM | serine transhydroxymethyltransferase 1 | −2.11 | 1.27 × 10⁻⁹ | −1.44 | 6.52 × 10⁻⁵ | |
| e | Lus10029265 | AT4G18820 | AAA-type ATPase family protein | −2.02 | 4.10 × 10⁻⁹ | −1.63 | 2.77 × 10⁻⁶ | ||
| e | Lus10031828 | AT4G12070 | −0.72 | 2.86 × 10⁻¹ | −2.69 | 1.35 × 10⁻⁴ | |||
| miR390 | a,b,c | Lus10005017 | AT4G08850 | Leucine-rich repeat receptor-like protein kinase family protein | −11.56 | 2.46 × 10⁻¹³ | −11.36 | 7.56 × 10⁻¹³ | |
| a,b,c | Lus10005042 | AT5G01360 | TBL3 | Plant protein of unknown function (DUF828) | −9.48 | 6.10 × 10−58 | −8.76 | 3.31 × 10−67 | |
| a,b,c | Lus10018911 | AT3G24240 | Leucine-rich repeat receptor-like protein kinase family protein | −8.76 | 9.13 × 10⁻³³ | −8.33 | 2.81 × 10⁻³⁰ | ||
| a,b,c | Lus10023323 | AT5G46330 | FLS2 | Leucine-rich receptor-like protein kinase family protein | −5.86 | 2.27 × 10−53 | −4.86 | 1.13 × 10−44 | |
| a,b,c | Lus10021769 | AT4G33300 | ADR1-L1 | ADR1-like 1 | −5.6 | 7.13 × 10⁻²⁴ | −5.82 | 4.23 × 10⁻²³ | |
| a,b,c | Lus10034303 | AT1G13340 | Regulator of Vps4 activity in the MVB pathway protein | −5.21 | 3.82 × 10⁻³⁰ | −6.93 | 1.88 × 10−36 | ||
| a,b,c | Lus10036167 | AT4G24580 | REN1 | Rho GTPase activation protein (RhoGAP) with PH domain | −4.37 | 4.35 × 10−56 | −5.06 | 1.46 × 10−59 | |
| a,b,c | Lus10040592 | AT1G75820 | CLV1,FAS3,FLO5 | Leucine-rich receptor-like protein kinase family protein | −3.95 | 9.34 × 10⁻¹¹ | −4.05 | 6.10 × 10⁻¹¹ | |
| a,b,c | Lus10023879 | AT2G36380 | PDR6 | pleiotropic drug resistance 6 | −3.87 | 2.14 × 10⁻³ | −4.67 | 6.74 × 10⁻³ | |
| a,b,c | Lus10027196 | AT5G62310 | IRE | AGC (cAMP-dependent, cGMP-dependent and protein kinase C) kinase family protein | −3.34 | 1.85 × 10⁻⁸ | −2.99 | 5.21 × 10⁻⁷ | |
| a,b,c | Lus10023842 | AT1G49470 | Family of unknown function (DUF716) | −2.29 | 1.56 × 10⁻¹⁷ | −1.76 | 5.73 × 10⁻¹¹ | ||
| a,b,c | Lus10017267 | AT1G75820 | CLV1,FAS3,FLO5 | Leucine-rich receptor-like protein kinase family protein | −2.16 | 1.86 × 10⁻¹⁰ | −1.64 | 2.06 × 10⁻⁶ | |
| miR394 | a,b | Lus10003801 | AT3G22142 | Bifunctional inhibitor/lipid-transfer protein/seed storage 2S albumin superfamily protein | −8.55 | 3.26 × 10⁻⁷ | −5.32 | 1.77 × 10⁻⁶ | |
| a,b | Lus10021450 | AT5G60720 | Protein of unknown function, DUF547 | −6.8 | 2.36 × 10−64 | −6.36 | 7.89 × 10−64 | ||
| a,b | Lus10039263 | AT4G25640 | DTX35,FFT | detoxifying efflux carrier 35 | −5.64 | 3.15 × 10⁻⁶ | −4.43 | 2.24 × 10⁻⁵ | |
| a,b | Lus10033103 | AT5G62720 | Integral membrane HPP family protein | −3.81 | 1.63 × 10⁻⁹ | −2.92 | 1.84 × 10⁻⁶ | ||
| a,b | Lus10020331 | AT5G17540 | HXXXD-type acyl-transferase family protein | −3.62 | 1.24 × 10⁻³ | −7.21 | 6.10 × 10⁻⁵ | ||
| a,b | Lus10016114 | AT5G60720 | Protein of unknown function, DUF547 | −3.15 | 8.12 × 10⁻³ | −2.24 | 6.61 × 10⁻² | ||
| a,b | Lus10028650 | AT1G29470 | S-adenosyl-L-methionine-dependent methyltransferases superfamily protein | −3.02 | 6.12 × 10−68 | −2.82 | 3.44 × 10−59 | ||
| a,b | Lus10036563 | AT4G00750 | S-adenosyl-L-methionine-dependent methyltransferases superfamily protein | −2.82 | 6.15 × 10⁻⁵ | −1.34 | 6.69 × 10⁻² | ||
| a,b | Lus10017657 | AT1G53210 | sodium/calcium exchanger family protein/calcium-binding EF hand family protein | −2.75 | 1.21 × 10⁻⁴ | −1.58 | 3.59 × 10⁻² | ||
| a,b | Lus10010152 | AT1G33170 | S-adenosyl-L-methionine-dependent methyltransferases superfamily protein | −2.46 | 1.26 × 10⁻¹⁴ | −1.45 | 3.31 × 10⁻⁶ | ||
| a,b | Lus10026325 | AT3G18870 | Mitochondrial transcription termination factor family protein | −2.23 | 6.14 × 10⁻⁴ | −1.68 | 1.07 × 10⁻² | ||
| miR399 | d | Lus10022548 | AT3G54700 | PHT1;7 | phosphate transporter 1;7 | −11.35 | 7.73 × 10⁻¹³ | −11.15 | 3.19 × 10⁻¹² |
| d | Lus10016821 | −8.64 | 4.81 × 10⁻⁶ | −5.97 | 1.33 × 10⁻⁴ | ||||
| d | Lus10002217 | AT5G54960 | PDC2 | pyruvate decarboxylase-2 | −6.19 | 7.04 × 10−54 | −5.15 | 4.97 × 10−53 | |
| d | Lus10025530 | AT3G59310 | Eukaryotic protein of unknown function (DUF914) | −2.56 | 3.37 × 10⁻²⁷ | −2.2 | 1.61 × 10⁻²⁰ | ||
| d | Lus10009312 | AT2G45670 | calcineurin B subunit-related | −2.07 | 8.47 × 10⁻³⁴ | −1.94 | 1.58 × 10⁻²⁹ |
| Transcript ID | Description | At Homolog | At-Symbol | iFIBa vs. iFIBb, log2FC | iFIBa vs. tFIB, log2FC | iFIBa&b vs. cPAR, log2FC | cPAR | iFIBa | iFIBb | tFIB | sXYL |
|---|---|---|---|---|---|---|---|---|---|---|---|
| Lus10009510 | Transducin/WD40 repeat-like superfamily protein | AT3G50390 | 4.70 | 6.85 | 1.05 | 5.8 | 22.5 | 0.8 | 0.0 | 17.5 | |
| Lus10016231 | Disease resistance-responsive (dirigent-like protein) family protein | AT1G65870 | 3.48 | 4.22 | 6.15 | 0.6 | 98.4 | 8.8 | 5.3 | 2.0 | |
| Lus10038092 | Myb domain protein 82 | AT5G52600 | MYB82 | 3.06 | 9.59 | 2.68 | 13.3 | 150.5 | 18.1 | 0.0 | 0.0 |
| Lus10030235 | Laccase 6 | AT2G46570 | LAC6 | 2.17 | 9.55 | 3.95 | 6.1 | 145.8 | 32.4 | 0.0 | 0.6 |
| Lus10021514 | Heparan-alpha-glucosaminide N-acetyltransferase-like protein (DUF1624) | AT5G27730 | 2.06 | 3.15 | 1.80 | 11.8 | 65.6 | 15.6 | 7.4 | 30.3 | |
| Lus10013125 | Flavin-binding monooxygenase family protein | AT5G11320 | YUC4 | 1.97 | 9.35 | 5.62 | 2.0 | 127.7 | 32.5 | 0.0 | 18.5 |
| Lus10037136 | Argonaute family protein | AT1G69440 | AGO7,ZIP | 1.83 | 2.10 | 1.54 | 85.5 | 387.6 | 109.2 | 90.7 | 178.8 |
| Lus10020787 | Acyl activating enzyme 12 | AT1G65890 | AAE12 | 1.80 | 6.03 | 2.67 | 70.3 | 691.2 | 197.8 | 10.6 | 3.9 |
| Lus10015513 | Glutamine dumper 3 | AT5G57685 | GDU3,LSB1 | 1.75 | 2.19 | 3.21 | 12.9 | 173.3 | 51.6 | 38.1 | 115.8 |
| Lus10012546 | Uncharacterized protein | AT3G01960 | 1.57 | 7.56 | 6.45 | 1.6 | 200.2 | 67.6 | 1.1 | 0.0 | |
| Lus10020352 | Growth-regulating factor 5 | AT3G13960 | GRF5 | 1.40 | 1.95 | 2.24 | 39.9 | 271.5 | 103.1 | 70.5 | 56.8 |
| Lus10015909 | Basic helix-loop-helix (bHLH) DNA-binding superfamily protein | AT4G02590 | UNE12 | 1.34 | 3.38 | 5.13 | 9.9 | 495.9 | 195.3 | 47.6 | 341.3 |
| Lus10008497 | AT hook motif DNA-binding family protein | AT1G63470 | 1.31 | 2.94 | 2.46 | 32.2 | 244.0 | 98.1 | 31.8 | 166.7 | |
| Lus10042938 | Response regulator 7 | AT1G19050 | ARR7 | 1.21 | 1.02 | 2.15 | 24.1 | 145.0 | 62.6 | 71.5 | 54.7 |
© 2019 by the authors. Licensee MDPI, Basel, Switzerland. This article is an open access article distributed under the terms and conditions of the Creative Commons Attribution (CC BY) license (http://creativecommons.org/licenses/by/4.0/).
Share and Cite
Gorshkov, O.; Chernova, T.; Mokshina, N.; Gogoleva, N.; Suslov, D.; Tkachenko, A.; Gorshkova, T. Intrusive Growth of Phloem Fibers in Flax Stem: Integrated Analysis of miRNA and mRNA Expression Profiles. Plants 2019, 8, 47. https://doi.org/10.3390/plants8020047
Gorshkov O, Chernova T, Mokshina N, Gogoleva N, Suslov D, Tkachenko A, Gorshkova T. Intrusive Growth of Phloem Fibers in Flax Stem: Integrated Analysis of miRNA and mRNA Expression Profiles. Plants. 2019; 8(2):47. https://doi.org/10.3390/plants8020047
Chicago/Turabian StyleGorshkov, Oleg, Tatyana Chernova, Natalia Mokshina, Natalia Gogoleva, Dmitry Suslov, Alexander Tkachenko, and Tatyana Gorshkova. 2019. "Intrusive Growth of Phloem Fibers in Flax Stem: Integrated Analysis of miRNA and mRNA Expression Profiles" Plants 8, no. 2: 47. https://doi.org/10.3390/plants8020047