Article

DRB1, DRB2 and DRB4 Are Required for Appropriate Regulation of the microRNA399/PHOSPHATE2 Expression Module in Arabidopsis thaliana

by
Joseph L. Pegler
,
Jackson M. J. Oultram
,
Christopher P. L. Grof
and
Andrew L. Eamens
*
Centre for Plant Science, School of Environmental and Life Sciences, Faculty of Science, University of Newcastle, Callaghan 2308, New South Wales, Australia
*
Author to whom correspondence should be addressed.
Plants 2019, 8(5), 124; https://doi.org/10.3390/plants8050124
Submission received: 15 April 2019 / Revised: 3 May 2019 / Accepted: 9 May 2019 / Published: 13 May 2019
(This article belongs to the Special Issue The Role of MicroRNAs in Plants)

Abstract

:
Adequate phosphorous (P) is essential to plant cells to ensure normal plant growth and development. Therefore, plants employ elegant mechanisms to regulate P abundance across their developmentally distinct tissues. One such mechanism is PHOSPHATE2 (PHO2)-directed ubiquitin-mediated degradation of a cohort of phosphate (PO4) transporters. PHO2 is itself under tight regulation by the PO4 responsive microRNA (miRNA), miR399. The DOUBLE-STRANDED RNA BINDING (DRB) proteins, DRB1, DRB2 and DRB4, have each been assigned a specific functional role in the Arabidopsis thaliana (Arabidopsis) miRNA pathway. Here, we assessed the requirement of DRB1, DRB2 and DRB4 to regulate the miR399/PHO2 expression module under PO4 starvations conditions. Via the phenotypic and molecular assessment of the knockout mutant plant lines, drb1, drb2 and drb4, we show here that; (1) DRB1 and DRB2 are required to maintain P homeostasis in Arabidopsis shoot and root tissues; (2) DRB1 is the primary DRB required for miR399 production; (3) DRB2 and DRB4 play secondary roles in regulating miR399 production, and; (4) miR399 appears to direct expression regulation of the PHO2 transcript via both an mRNA cleavage and translational repression mode of RNA silencing. Together, the hierarchical contribution of DRB1, DRB2 and DRB4 demonstrated here to be required for the appropriate regulation of the miR399/PHO2 expression module identifies the extreme importance of P homeostasis maintenance in Arabidopsis to ensure that numerous vital cellular processes are maintained across Arabidopsis tissues under a changing cellular environment.

1. Introduction

Phosphorous (P) is one of the most limiting factors for plant growth worldwide [1,2,3], with large quantities of P an essential requirement for numerous processes vital to the plant cell, including energy trafficking, signaling cascades, enzymatic reactions and nucleic acid and phospholipid synthesis [3,4]. Inorganic phosphate (Pi), in the form of PO4, is the predominant form of P taken up by a plant from the soil, however, soil PO4 primarily exists in organic or insoluble forms that are largely inaccessible to plant root uptake mechanisms [1]. Therefore, due to limited soil PO4 availability, combined with the importance of an adequate concentration of P in plant cells to ensure normal growth and development, plants employ elegant mechanisms to spatially regulate P abundance across their developmentally distinct tissues [5,6]. Phosphorous homeostasis is therefore tightly controlled and involves both the remobilization of internal P stores and the increased acquisition of external PO4 [5,7]. For example, P limitation triggers the release of organic acids from the plant root system into the soil rhizosphere to chelate with metal ions to promote soluble PO4 uptake to maintain or increase intracellular P concentration [1,8]. In addition, the P stored in the older leaves of a plant when the plant experiences P stress is remobilized; this allows for (1) continued growth of actively expanding tissues, and (2) the promotion of new growth. Enhanced P trafficking is achieved via promoting the expression of genes encoding PO4 transporter proteins, and in turn, elevated PO4 transporter protein abundance generally ensures that the cellular P concentration is maintained irrespective of external PO4 levels [1,7].
In Arabidopsis thaliana (Arabidopsis), the first protein identified to be required for the maintenance of P homeostasis under PO4 limiting conditions was PHOSPHATE1 (PHO1) [9]. The gene encoding PHO1 (PHO1; AT1G14040) was identified by [9] via their characterization of pho1 plants, an Arabidopsis mutant line demonstrated to over-accumulate P in root tissues due to defective P translocation to the shoot. Although the Arabidopsis PHO1 protein, and the PHO1 proteins of other plant species characterized to date, do not closely resemble other PO4 transporter proteins, PHO1 is indeed central to P movement in plants. The PHO1 protein is essential for PO4 efflux into the root vascular cylinder; the first step in P transportation to the upper aerial tissues [10,11]. PHOSPHATE2 (PHO2) was the second protein demonstrated essential for the maintenance of P homeostasis with the pho2 mutant shown to accumulate P to toxic levels in shoot tissues [12,13]. The PHO2 gene (AT2G33770) has since been shown to encode a ubiquitin conjugating enzyme24 (UBC24), with the PHO2 UBC24 proposed to direct ubiquitin-mediated degradation of PO4 transporters, PHOSPHATE TRANSPORTER1;4 (PHT1;4), PHT1;8 and PHT1;9 [14]. Further, PHO2 is almost ubiquitously expressed in Arabidopsis shoot and root tissues [15], with the loss of PHO2-directed suppression of PHT1;4, PHT1;8 and PHT1;9 abundance in pho2 plants leading to the enhanced translocation of P from the roots to the shoot tissue [14]. In addition to PHO1 and PHO2, traditional mutagenesis-based approaches have further identified other proteins essential to P homeostasis maintenance, including PHOSPHATE STARVATION RESPONSE1 (PHR1), a MYB domain transcription factor that regulates the expression of numerous P responsive genes [16,17].
More contemporary research, however, has concentrated on documenting the regulatory role directed at the posttranscriptional level by small regulatory RNAs (sRNA), specifically the microRNA (miRNA) class of sRNA, in order to maintain P homeostasis [18,19]. The advent of high throughput sequencing technologies has made sRNA profiling across plant species, and under different growth regimes, including exposure of a plant to abiotic and biotic stress, a routine experimental procedure in modern research [14,20,21]. Such profiling has identified a common suite of conserved miRNAs (miRNAs identified across multiple, evolutionary unrelated plant species) that accumulate differentially when mineral nutrients are lacking, including P, nitrogen (N), copper and sulphur [20,21]. Responsiveness of a single miRNA to multiple mineral nutrient stresses is not surprising considering the considerable overlap in the complex regulation of metal ion transport and/or uptake in plants [14,22,23]. In Arabidopsis for example, P and N uptake mechanisms are reciprocally linked to one another, therefore; a miRNA with enhanced accumulation during periods of P stress will usually be reduced in abundance during N starvation [19,24,25].
The miRNA, miR399, has been conclusively linked with the maintenance of P homeostasis and the regulation of PO4 uptake in Arabidopsis [18,19]. In Arabidopsis, the miR399 sRNA is processed from six precursor transcripts, namely PRE-MIR399A to PRE-MIR399F, transcribed from five genomic loci (MIR399A-MIR399D and MIR399E/F). The miR399 sRNA is unique amongst Arabidopsis miRNAs in that it acts as a mobile systemic signal upon PO4 stress [21,26]. More specifically, when P becomes limited in Arabidopsis shoots, MIR399 gene expression is stimulated by PHR1 [27], and following processing of the now abundant miR399 precursor transcripts by the protein machinery of the Arabidopsis miRNA pathway, the mature miR399 sRNA is transported to the roots. Here, miR399 is actively loaded by the miRNA-induced silencing complex (miRISC) to direct miRISC-mediated cleavage of PHO2, the target transcript of miR399 [7,21,27]. Reduced PHO2 protein abundance, due to elevated miRISC-mediated cleavage of the PHO2 transcript, in turn removes the PHO2-mediated suppression of PO4 transporters, PHT1;4, PHT1;8 and PHT1;9, to ultimately promote root-to-shoot P transport in an attempt to maintain shoot P homeostasis in P limited conditions [28,29,30,31]. Additional regulatory complexity to the miR399/PHO2 expression module is offered by the non-protein-coding RNA, INDUCED BY PHOSPHATE STARVATION1 (IPS1) [32]. Once transcribed, IPS1 acts as an endogenous target mimic (eTM) of miR399 activity [33]. Specifically, the miR399 target site harbored by IPS1 contains a three nucleotide mismatch bulge across miR399 nucleotide positions 10 and 11: the position at which the catalytic core of miRISC, ARGONAUTE1 (AGO1), catalyzes the cleavage of miRNA target transcripts [34]. The bulge that forms at this position once miR399-directed AGO1 binds IPS1, renders IPS1 resistant to AGO1-catalyzed cleavage, thereby effectively sequestering away miR399 activity [33].
Three of the five members of the Arabidopsis DOUBLE-STRANDED RNA BINDING (DRB) protein family, including DRB1, DRB2 and DRB4, have been assigned functional roles in the Arabidopsis miRNA pathway [35,36,37,38,39]. Both DRB1 and DRB4 form functional partnerships with DICER-LIKE (DCL) proteins, RNase III-like endonucleases that cleave molecules of double-stranded RNA (dsRNA). More specifically, the DRB1/DCL1 partnership processes stem-loop structured molecules of imperfectly dsRNA that form post miRNA precursor transcript folding [35,36,37], and the DRB4/DCL4 partnership is central for the processing of a small subset of miRNA precursor transcripts that fold to form stem-loop structures with high levels of base-pairing due to the almost perfect complementarity of the nucleotide sequences of the stem-loop arms [39]. More recently, DRB2 has also been assigned a functional role in the Arabidopsis miRNA pathway due to its demonstrated antagonism and/or synergism with the roles of both DRB1 and DRB4 in sRNA production [37,40]. Here, we therefore assessed the requirement of DRB1, DRB2 and DRB4 in the regulation of the miR399/PHO2 expression module, both under non-stressed growth conditions and when wild-type Arabidopsis plants (ecotype Columbia-0 (Col-0)) and the drb1, drb2 and drb4 mutant lines are exposed to PO4 starvation. More specifically, we aimed to determine; (1) the contribution of DRB1, DRB2 and/or DRB4 to miR399 production; (2) the mode of silencing directed by miR399 to regulate PHO2 expression, and; (3) whether either DRB1, DRB2 or DRB4 are required for P homeostasis maintenance. Phenotypic and molecular assessment of Col-0, drb1, drb2 and drb4 plants post exposure to a 7-day period of PO4 starvation, revealed that DRB1 and DRB2 are required for P homeostasis maintenance. Further, DRB1 was established as the primary DRB protein required to regulate miR399 production. However, DRB2 and DRB4 were demonstrated to play a secondary role in miR399 production regulation. Furthermore, miR399 appears to regulate the expression of its targeted transcript, PHO2, via both the canonical mechanism of plant miRNA-directed target gene expression repression, target mRNA cleavage, and via the alternative mode of target gene expression regulation, translational repression. Taken together, the hierarchical contribution of DRB1, DRB2 and DRB4 to the regulation of the miR399/PHO2 expression module in Arabidopsis shoots and roots identifies the extreme importance of maintaining P homeostasis to ensure that numerous vital cellular processes are maintained across Arabidopsis tissue types and under a changing cellular environment.

2. Results

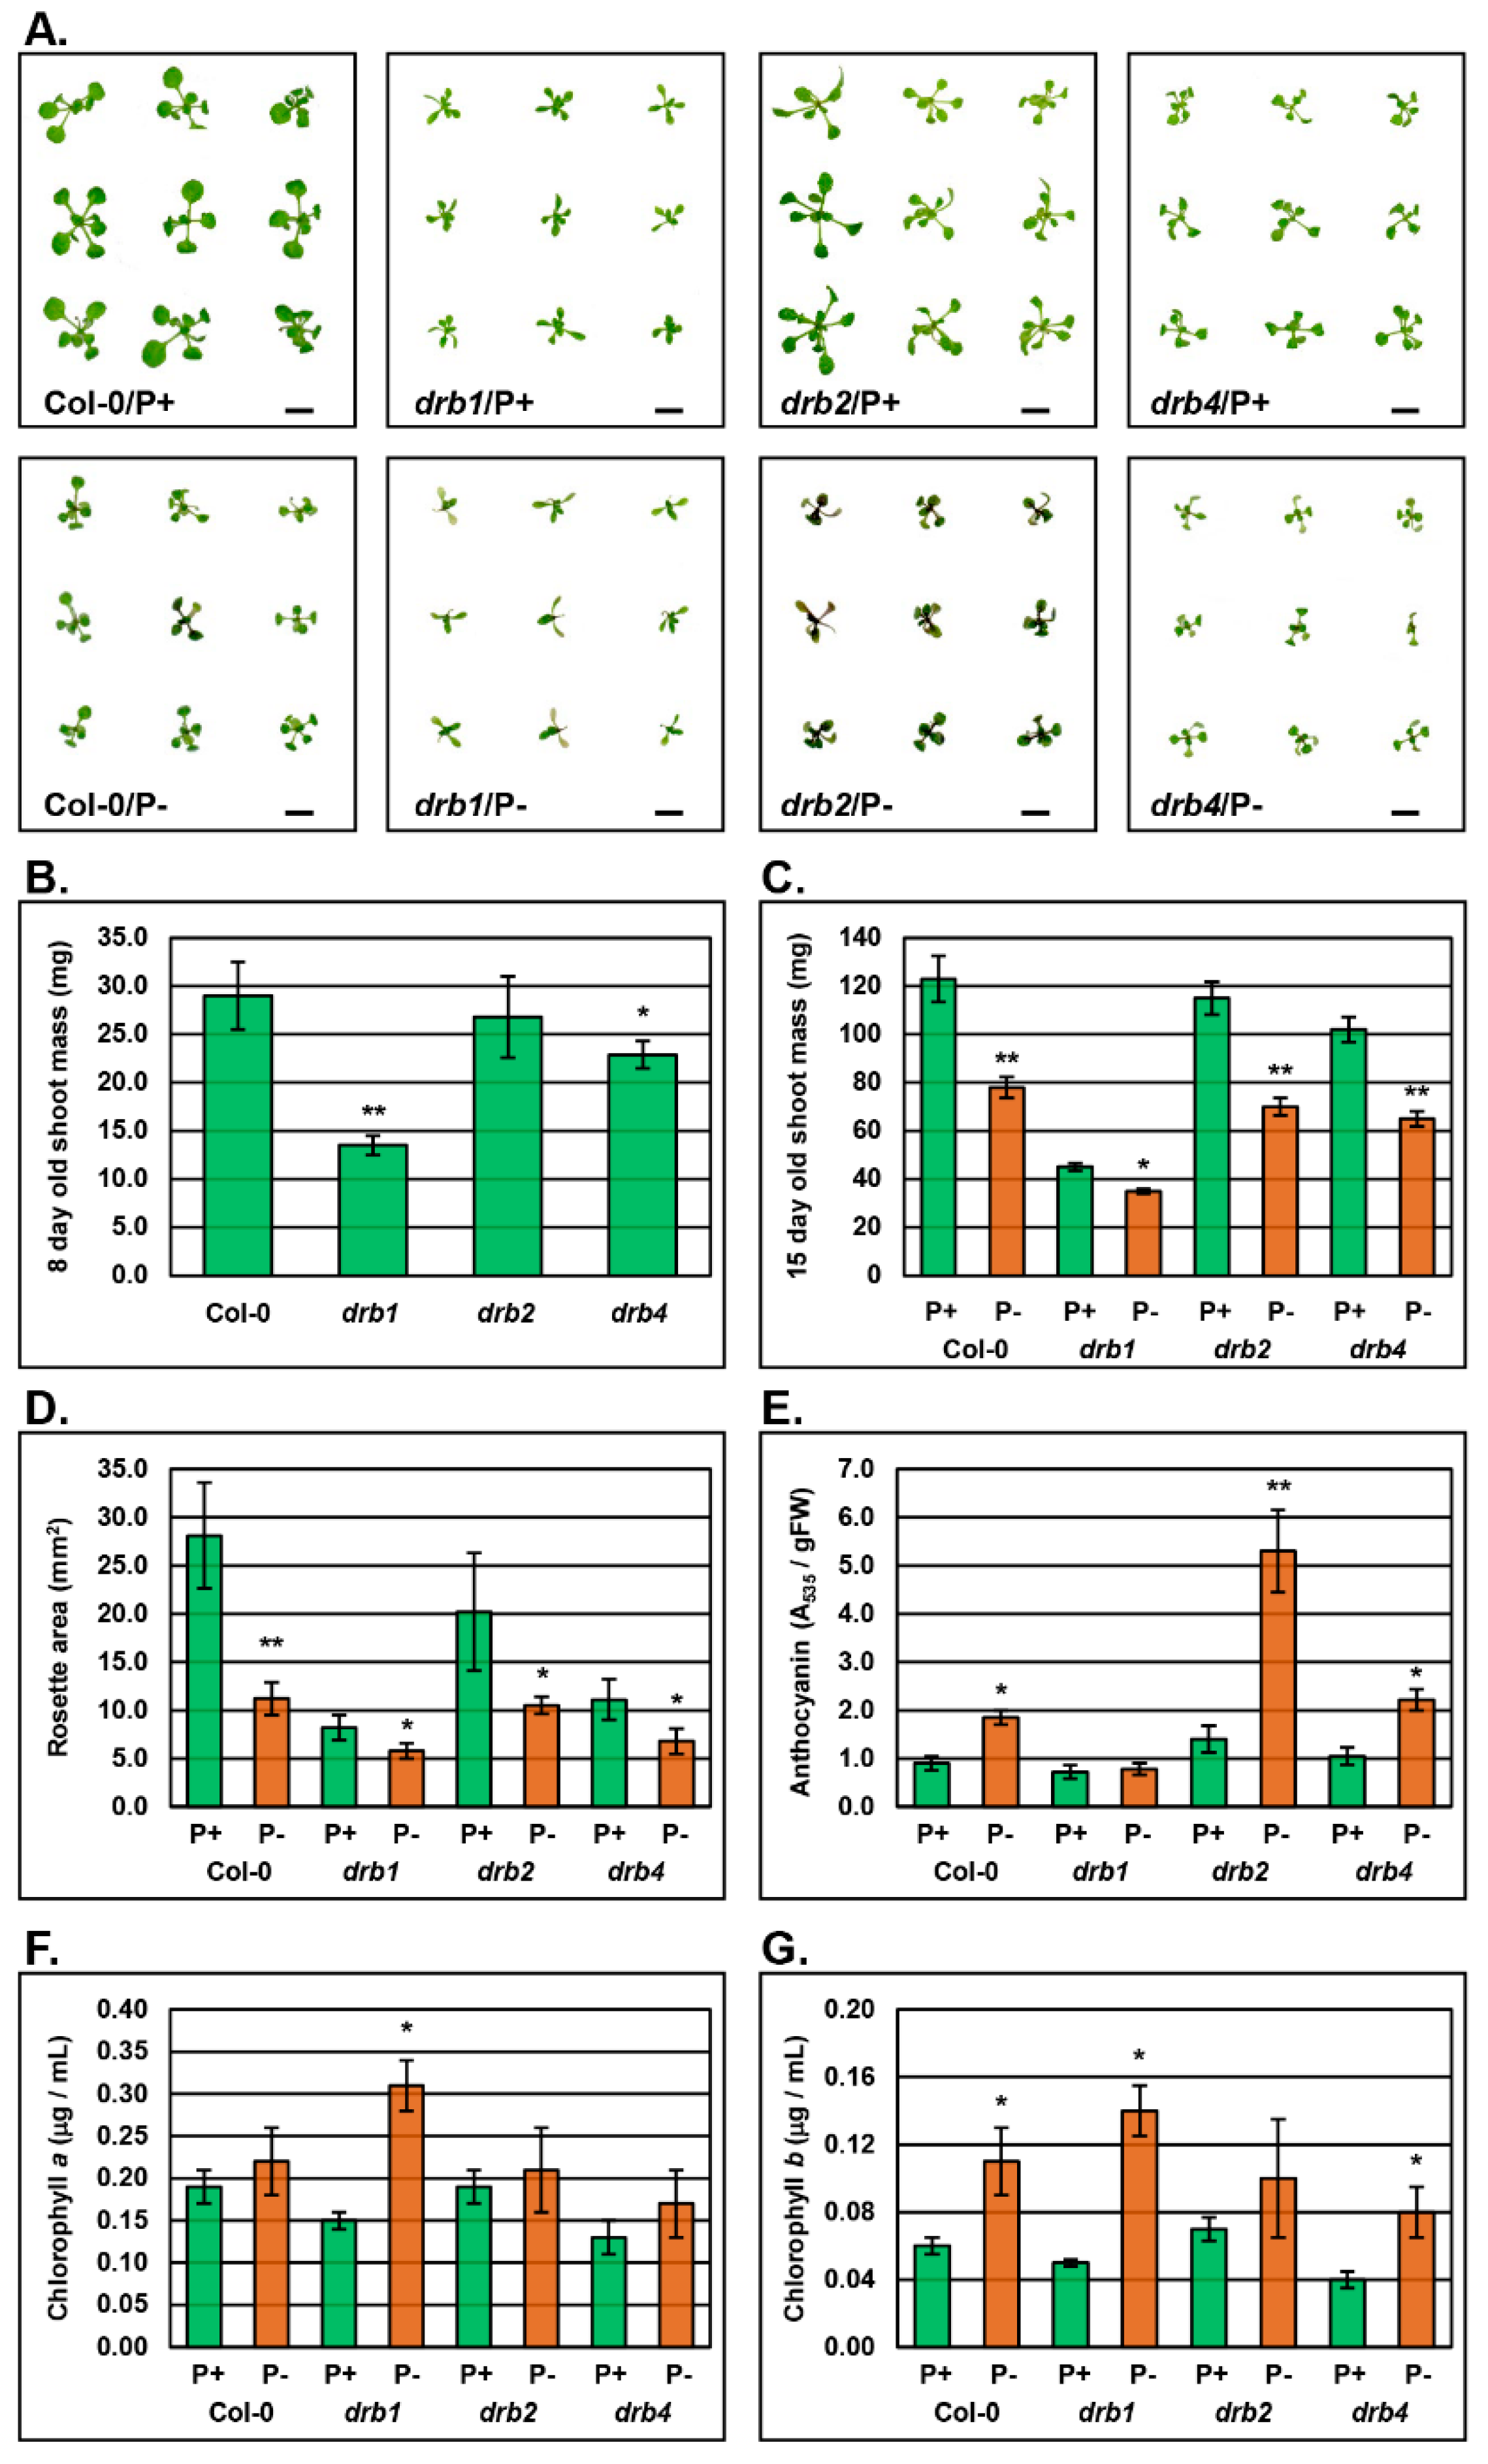
2.1. The Phenotypic and Physiological Response to PO4 Stress in the Shoot Tissues of Arabidopsis Plant Lines Defective in DRB Protein Activity

To determine the consequence of loss of DRB activity on P homeostasis maintenance in 15-day old Arabidopsis plants post a 7-day period of PO4 starvation, a series of phenotypic and physiological parameters were assessed in Col-0, drb1, drb2 and drb4 shoots. The severe developmental phenotype of the drb1 mutant has been reported previously [36,41,42]. Figure 1A clearly reveals the reduced size of the drb1 mutant at 15 days of age, compared to Col-0 plants, when both Arabidopsis lines are cultivated on standard growth media (P+ media). The retarded development of the drb1 mutant is further evidenced in Figure 1B where the fresh weight of 8-day old Col-0 and drb1 seedlings is presented. Specifically, prior to seedling transfer to either P+ or P media, the fresh weight of an 8-day old drb1 seedling (13.5 ± 1.0 mg) is 53.4% less than that a Col-0 seedling (29.0 ± 3.5 mg). Compared to drb1, the drb2 and drb4 mutants display mild developmental phenotypes [37,42] as evidenced by those displayed by 15-day old drb2 and drb4 plants cultivated on P+ growth media (Figure 1A), and by the fresh weights of 8-day old drb2 (26.8 ± 4.2 mg) and drb4 (22.9 ± 1.4 mg) seedlings. Although the drb1 mutant displayed the most severe phenotype, drb1 development appeared to be the least affected by the 7-day PO4 stress treatment. The fresh weight of P drb1 plants (35.5 ± 1.0 mg) was only reduced by 21.6% compared to P+ drb1 plants (45.3 mg ± 1.5 mg) (Figure 1C). The development of Col-0, drb2 and drb4 plants was negatively impacted to a similar degree by the 7-day PO4 stress treatment, with their fresh weights reduced by 36.6%, 39.1% and 36.3%, respectively (Figure 1C). Determination of rosette area revealed largely similar trends across the drb mutant lines analyzed, that is, drb1 rosette area was reduced by 29.3%, while the rosette development of P drb2 and P drb4 plants was reduced by 48.0% and 38.7%, respectively (Figure 1D). Interestingly, the observed reductions to the rosette area of P drb1, P drb2 and P drb4 plants was considerably less than the 60.1% reduction to the rosette area of P Col-0 plants (11.2 ± 1.7 mm2) compared to P+ Col-0 plants (28.1 ± 5.5 mm2) (Figure 1D).
Anthocyanin, chlorophyll a and chlorophyll b content of Col-0, drb1, drb2 and drb4 shoots was also determined. Phosphate starvation has been previously shown to elevate the levels of PRODUCTION OF ANTHOCYANIN PIGMENT1 (PAP1/MYB75), PAP2 (MYB90) and MYB113, three MYB domain transcription factors that in turn stimulate the expression of a cohort of genes required for anthocyanin production in vegetative tissues [19,43]. These reports, in combination with the readily observable pigmentation that accumulated in the rosette leaves of P Col-0, P drb2 and P drb4 plants (Figure 1A), identified anthocyanin as an ideal metric to further assess the response of each drb mutant to PO4 starvation. The anthocyanin content of non-stressed Col-0, drb1, drb2 and drb4 shoots was similar (Figure 1E). However, when PO4 is limited, an approximate 2.0-fold increase in anthocyanin accumulation was detected for P Col-0 shoots. Further promotion of anthocyanin accumulation was determined for PO4-stressed drb2 and drb4 plants, with anthocyanin content elevated 3.7- and 2.8-fold in P drb2 and P drb4 plants, respectively (Figure 1E). As readily observable in Figure 1A, anthocyanin accumulation was not promoted in the shoot tissue of P drb1 plants. However, spectrophotometry revealed abundance changes for both chlorophyll a and chlorophyll b in the shoot tissue of P drb1 plants. Specifically, chlorophyll a (Figure 1F) and chlorophyll b (Figure 1G) abundance was elevated by 2.1- and 2.8-fold in P drb1 shoots, compared to P+ drb1 shoots. In PO4-stressed Col-0, drb2 and drb4 shoots, the chlorophyll a level remained largely unchanged compared to the non-stressed counterpart of each plant line (Figure 1F). Chlorophyll b accumulation however, was determined to be promoted in Col-0 and drb4 shoots, by 1.8- and 2.0-fold, by the 7-day PO4 starvation period (Figure 1G).

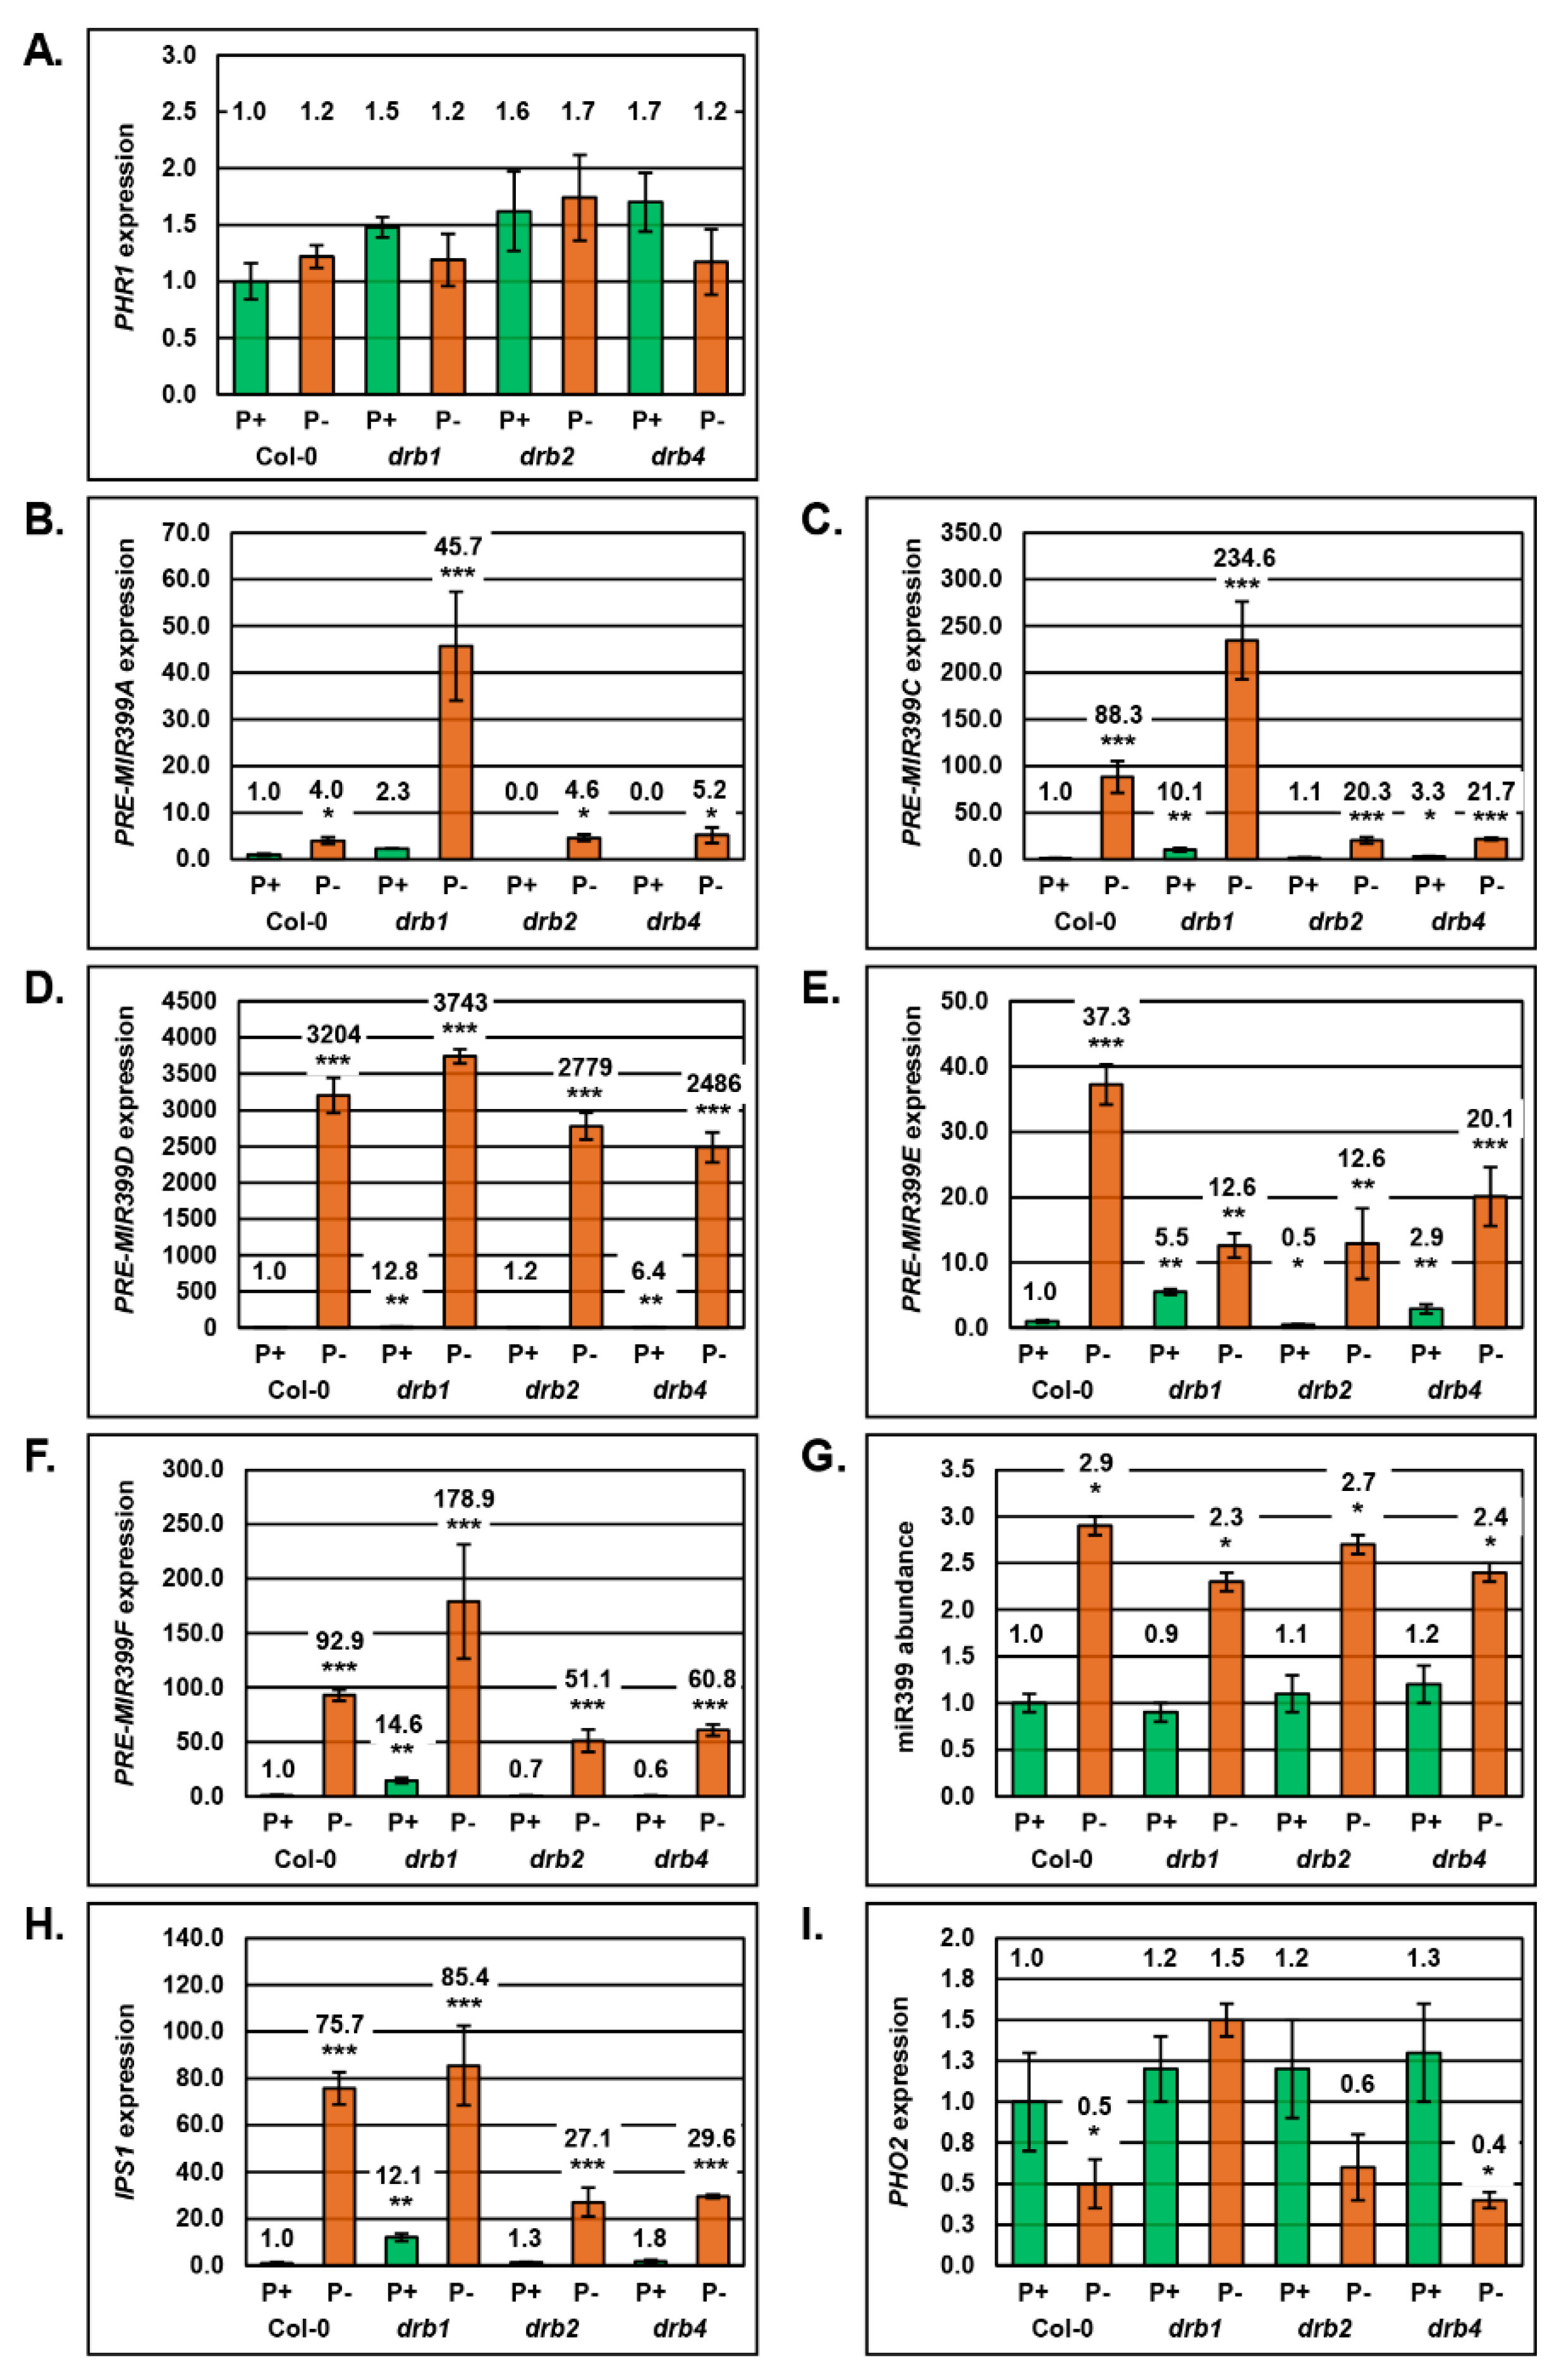
2.2. Molecular Profiling of the miR399/PHO2 Expression Module in the Shoot Tissues of Arabidopsis Plant Lines Defective in DRB Protein Activity

The results presented in Figure 1 strongly indicated that each drb mutant was responding differently to the applied stress and when this finding is considered together with the documented roles of DRB1, DRB2 and DRB4 in the Arabidopsis miRNA pathway [35,36,37,38,39], including the demonstrated antagonism between DRB1 and DRB2 [37] and between DRB2 and DRB4 [40] in miRNA production, the miR399/PHO2 expression module was next profiled via a RT-qPCR-based approach. RT-qPCR profiling was conducted in an attempt to determine if the observed differences in the response of each drb mutant line to PO4 stress was a result of dysfunction of the miR399/PHO2 expression module.
In Arabidopsis shoots, PHR1 promotes MIR399 gene expression when PO4 supplies become limited, resulting in elevated miR399 abundance [27]. Therefore, RT-qPCR was first used to assess PHR1 expression in control and PO4-stressed Col-0, drb1, drb2 and drb4 shoots (Figure 2A). PHR1 expression was only mildly elevated by 1.5-, 1.6- and 1.7-fold in P+ drb1, P+ drb2 and P+ drb4 shoots respectively, compared to its levels in non-stressed Col-0 shoots (Figure 2A). RT-qPCR further revealed that PO4 stress only induced mild elevations to PHR1 expression in P Col-0 (1.00 to 1.22 relative expression) and P drb2 shoots (1.62 to 1.74 relative expression) (Figure 2A). This result was not unexpected in view of the previous report of only mild PHR1 expression induction in PO4-stressed Arabidopsis [17]. Interestingly, PHR1 expression was reduced by 19.6% and 31.2% in P drb1 and P drb4 shoots, respectively (Figure 2A), and not mildly elevated as expected.
The miR399 sRNA is processed from six structurally distinct precursor transcripts (PRE-MIR399A to PRE-MIR399F), transcribed from five genomic loci (MIR399A to MIR399D and MIR399E/F) in Arabidopsis. RT-qPCR only failed to detect PRE-MIR399B expression in Col-0 shoots. RT-qPCR did however clearly reveal that PO4 stress induced the expression of the five detectable miR399 precursor transcripts by 4.0-, 88.3-, 3204-, 37.3- and 92.9-fold in the shoots of P Col-0 plants (Figure 2B–F). Of the three members of the Arabidopsis DRB protein family analyzed here, Figure 2B–F clearly show that DRB1 is the primary DRB protein required to regulate miR399 production in Arabidopsis shoots with the abundance of PRE-MIR399A, PRE-MIR399C, PRE-MIR399D, PRE-MIR399E and PRE-MIR399F elevated by 2.3-, 10.1-, 12.8-, 5.5- and 14.6-fold, respectively, in P+ drb1 shoots. The primary role of DRB1 in regulating miR399 production in Arabidopsis shoots was further highlighted for PRE-MIR399A, PRE-MIR399C, PRE-MIR399D and PRE-MIR399F via additional elevations to their respective expression levels, specifically 45.7-, 234.6- 3743- and 178.9-fold increases to transcript abundance in P- drb1 shoots (Figure 2B–D,F).
Failure to detect the PRE-MIR399A precursor by RT-qPCR in P+ drb2 shoots, and a similar degree of over-accumulation of this precursor in P Col-0 (4.0-fold) and P drb2 shoots (4.6-fold), indicated that DRB2 is not required to regulate miR399 production from this precursor (Figure 2B). Wild-type-like accumulation of PRE-MIR399C (1.1-fold) and PRE-MIR399D (1.2-fold) in P+ drb2 shoots, and a lower degree of over-accumulation of these two precursors in P drb2 shoots, compared to P Col-0 shoots, indicated that DRB2 plays a secondary role in regulating miR399 production from these two precursors (Figure 2C,D). A similar level of expression of PRE-MIE399E in PO4-stressed drb1 and drb2 shoots suggested that both DRB1 and DRB2 are required for miR399 production from this precursor (Figure 2E). However, lower transcript abundance (0.5 relative expression) in P+ drb2 shoots, compared to relative expression levels of 1.0 and 5.5 in P+ Col-0 and P+ drb1 shoots, respectively (Figure 2E), again indicated that under standard growth conditions, DRB2 plays a secondary role in regulating miR399 production from the PRE-MIR399E precursor. The abundance of the PRE-MIR399F transcript is also reduced in P+ drb2 shoots compared to its levels in P+ Col-0 shoots, and further, the degree of over-accumulation of PRE-MIR399F is less in P drb2 shoots compared to its levels in P Col-0 shoots (Figure 2F). When these expression trends are considered together with those documented for P+ and P drb1 shoots, they again indicate a secondary role for DRB2 in regulating miR399 production from this precursor.
As demonstrated for P+ drb2 shoots, the PRE-MIR399A transcript remained below the detection sensitivity of RT-qPCR in P+ drb4 shoots (Figure 2B). RT-qPCR did however, reveal PRE-MIR399A expression to be elevated by 5.2-fold in P drb4 shoots, a similar degree of transcript elevation to that observed in P Col-0 shoots (4.0-fold increase) (Figure 2B). This indicates that DRB4 is not involved in regulating miR399 production from this precursor. Comparison of the RT-qPCR generated expression trends for PRE-MIR399C, PRE-MIR399D and PRE-MIR399E in P+ and P drb4 shoots, to those of P+ Col-0, P Col-0, P+ drb1 and P drb1 shoots, revealed a secondary role for DRB4 in regulating miR399 production from these three precursor transcripts (Figure 2C–E). DRB4 also appears to play a role in regulating miR399 production from the PRE-MIR399F transcript, with PRE-MIR399F abundance reduced by 40% in P+ drb4 shoots (Figure 2F). RT-qPCR also revealed that the expression of this precursor transcript was elevated to a relative expression level of 60.8 in PO4-stressed drb4 shoots; a lower degree of relative expression than observed in either P Col-0 (92.9 relative expression) or P drb1 (178.9 relative expression) shoots (Figure 2F). This finding suggests that in the absence of DRB4 activity, miR399 is more efficiently processed from the PRE-MIR399F precursor transcript.
RT-qPCR was next applied to quantify miR399 abundance in the shoot material of non-stressed or PO4-stressed Col-0, drb1, drb2 and drb4 plants. This analysis revealed that in spite of the considerable variation in precursor transcript abundance in the shoot tissues of P+ Col-0, P+ drb1, P+ drb2 and P+ drb4 plants, miR399 levels remained largely unchanged (Figure 2G). This was an especially surprising finding for control drb1 plants, with the PRE-MIR399A, PRE-MIR399C, PRE-MIR399D, PRE-MIR399E and PRE-MIR399F transcripts demonstrated to over-accumulate by 4.0-, 10.1-, 12.8-, 5.5- and 14.6-fold in P+ drb1 shoots, compared to their respective levels in P+ Col-0 shoots. However, miR399 abundance was only reduced by 10% in P+ drb1 shoots. Similarly, although the expression level of the five miR399 precursors varied considerably in P+ drb2 and P+ drb4 shoots, miR399 abundance was only elevated by 10% and 20%, respectively (Figure 2G). Enhanced miR399 accumulation in P+ drb2 and P+ drb4 shoots did however further identify that both of these DRB proteins are required to correctly regulate miR399 abundance in Arabidopsis shoots. The degree of alteration to miR399 abundance was demonstrated to be higher in the shoot tissues of the four assessed plant lines when these lines were cultivated on PO4 deplete media. Specifically, RT-qPCR revealed 2.9-, 2.6-, 2.5- and 2.0-fold enhancement to miR399 abundance in PO4-stressed Col-0, drb1, drb2 and drb4 shoots, respectively (Figure 2G).
The mild alteration to miR399 abundance quantified by RT-qPCR in non-stressed and PO4-stressed shoots (Figure 2G) led us to next assess the expression of IPS1, the eTM of miR399 [32,33,34]. Due to IPS1 being a PO4 stress-induced gene, it was unsurprising to only observe mild (P+ drb2 and P+ drb4 shoots) to moderate differences (P+ drb1 shoots) in IPS1 transcript abundance in the shoot tissue of non-stressed Col-0, drb1, drb2 and drb4 plants (Figure 2H). Further, and as expected, RT-qPCR showed that PO4 stress induced the expression of IPS1, with IPS1 transcript abundance elevated by 75.7-, 7.1-, 20.8- and 16.4-fold in the shoot tissues of PO4 stressed Col-0, drb1, drb2 and drb4 plants, respectively (compared to the non-stressed counterpart of each plant line).
Next, the expression of the target gene of miR399, PHO2, was determined by RT-qPCR to largely remain at wild-type levels (P+ Col-0 shoots) in the shoot tissues of P+ drb1, P+ drb2 and P+ drb4 plants (Figure 2I). This was an unsurprising result considering that RT-qPCR also revealed only mild changes to miR399 abundance across the three drb mutant lines assessed when each plant line was cultivated on standard Arabidopsis culture media (Figure 2G). RT-qPCR also revealed that elevated miR399 abundance in P Col-0, P drb2 and P drb4 plants, promoted miR399-directed expression repression of PHO2, with the abundance of the PHO2 transcript reduced by 50%, 40% and 60% in the shoot tissues of these three plant lines, respectively (Figure 2I). In P drb1 shoots however, the level of the PHO2 transcript was increased by 50% (Figure 2I). Elevated PHO2 expression in P drb1 shoots, a tissue where miR399 abundance was also demonstrated to be elevated, indicated that in the absence of DRB1 activity, miR399-directed mRNA cleavage-mediated regulation of PHO2 expression is lost.

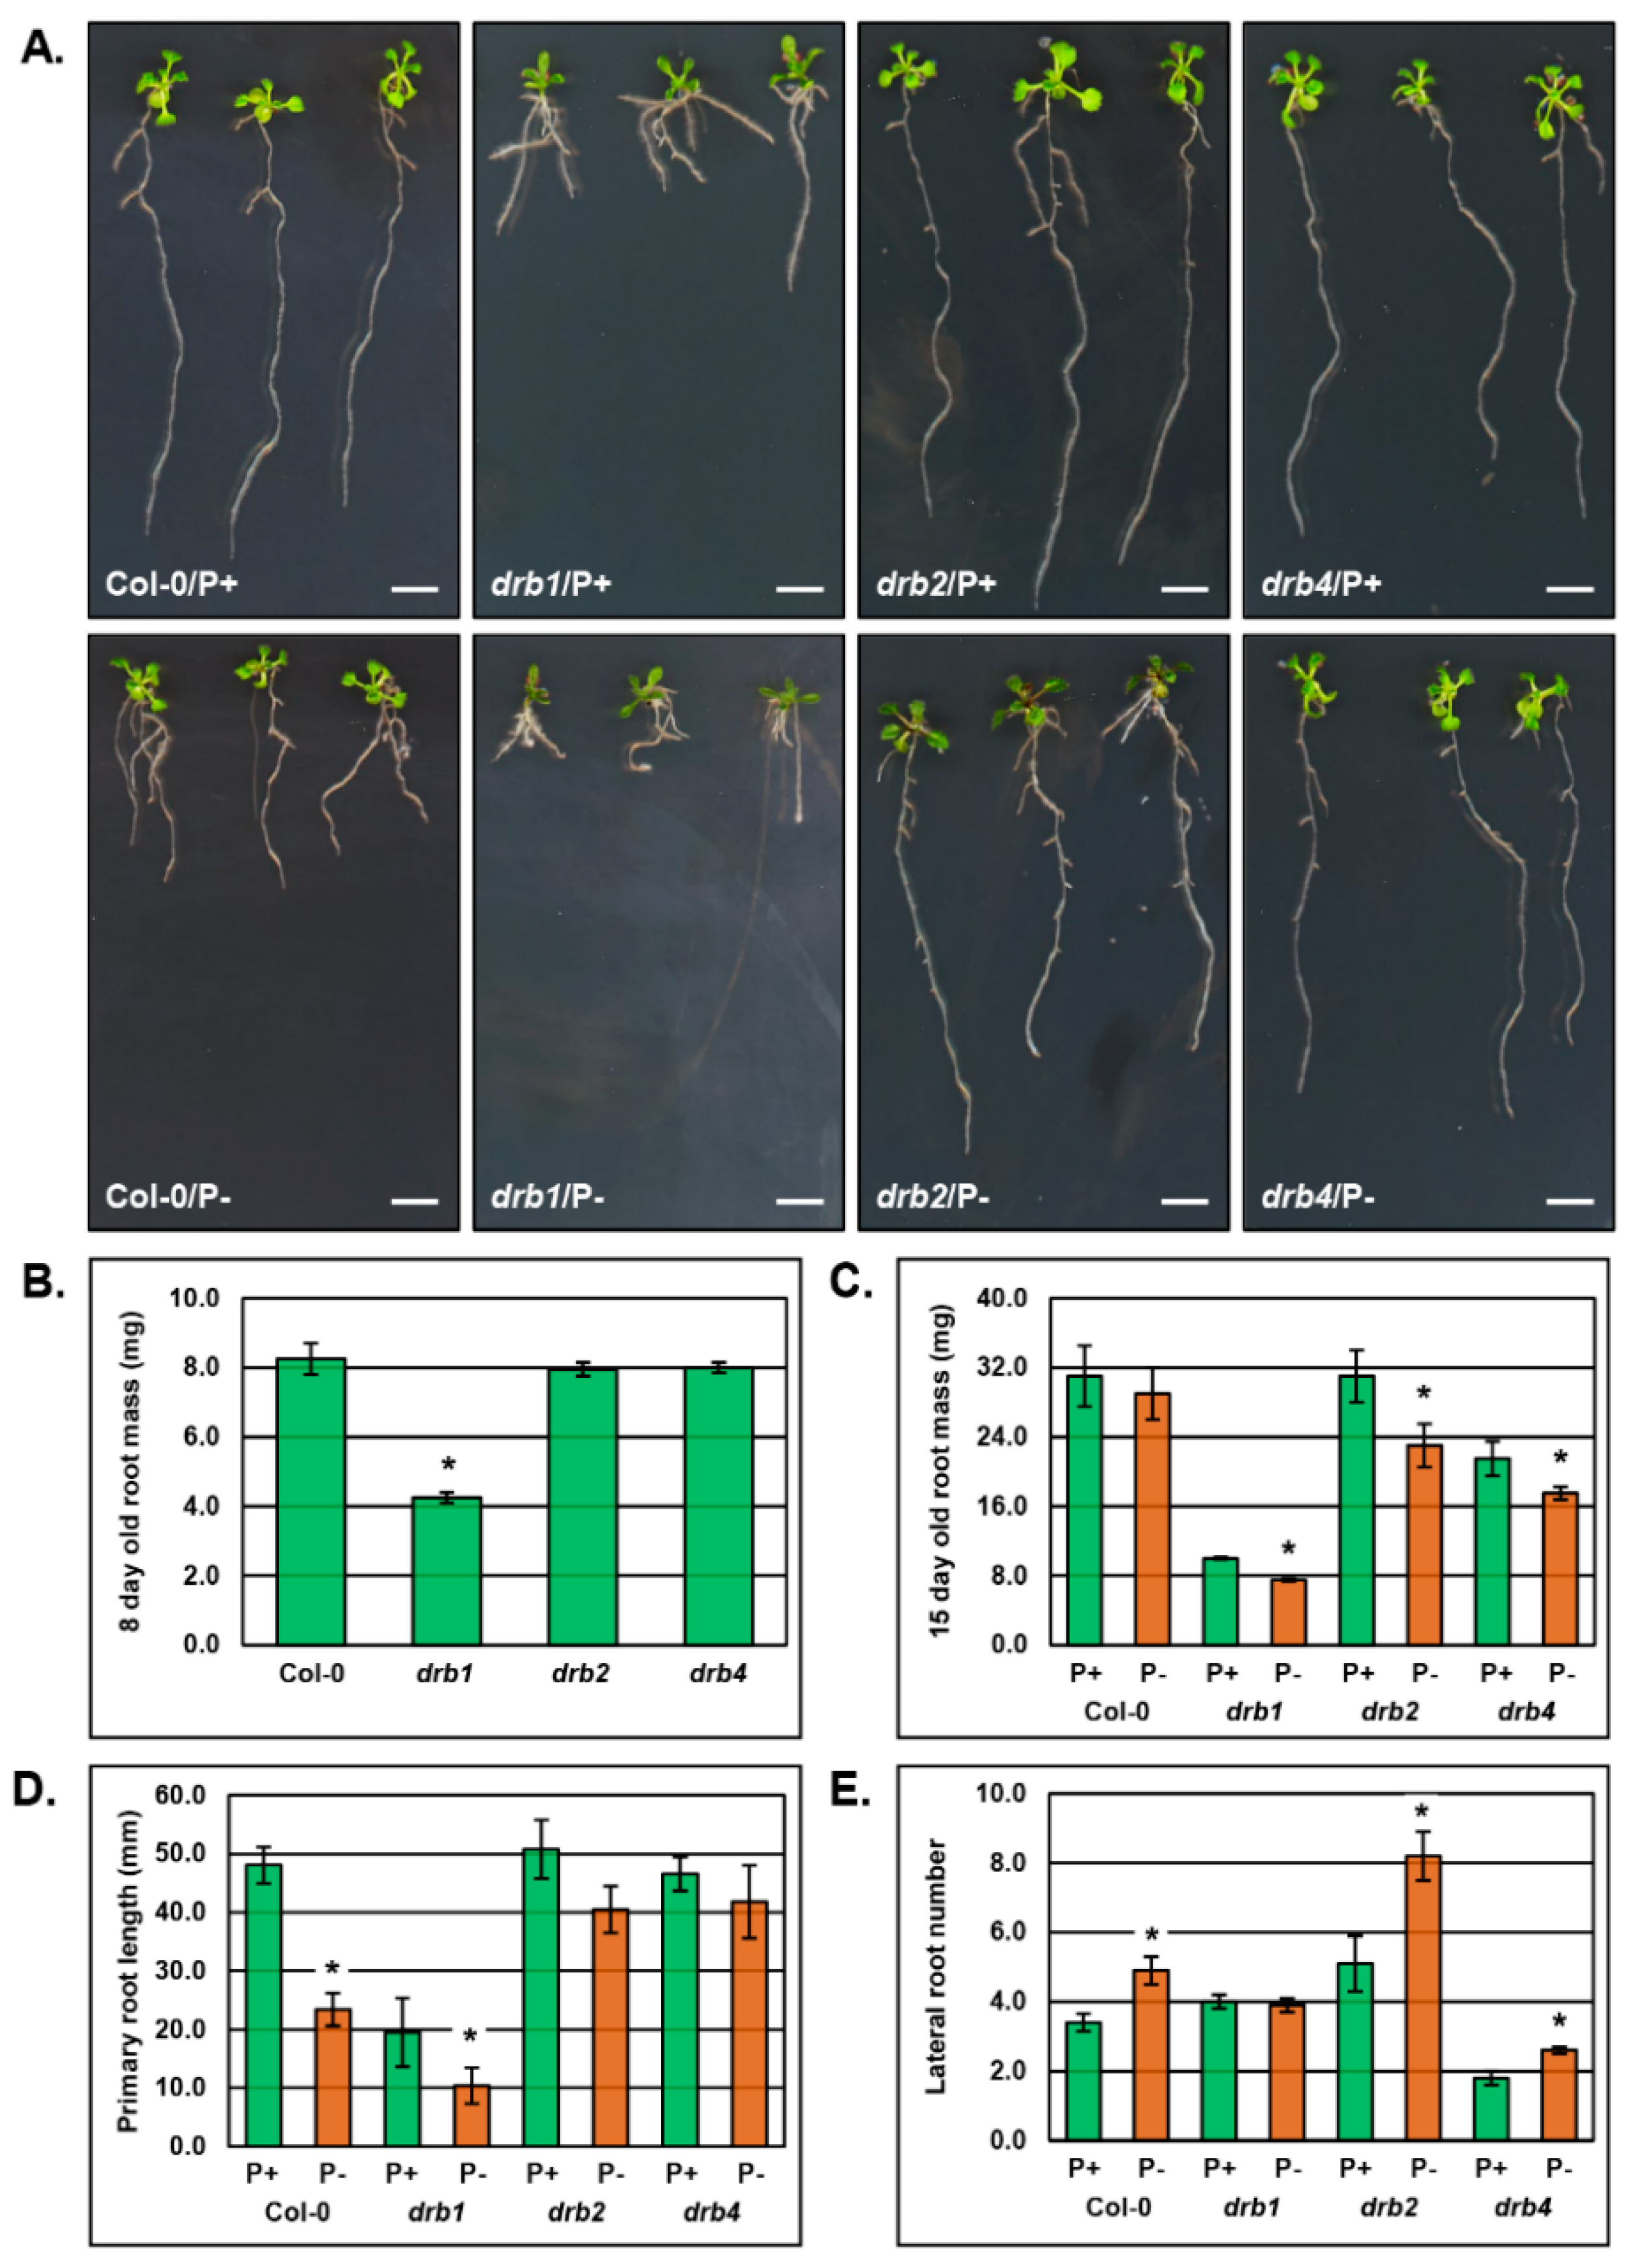
2.3. The Phenotypic and Physiological Response to PO4 Stress of the Root System of Arabidopsis Plant Lines Defective in DRB Protein Activity

The unique phenotypic (Figure 1) and molecular (Figure 2) response displayed by drb1, drb2 and drb4 shoots to PO4 starvation led us to next repeat these assessments on the root system of each mutant background. As reported for the aerial tissue phenotypes expressed by the drb1, drb2 and drb4 mutants (Figure 1), Figure 3A again clearly displays the severe developmental phenotype expressed by the drb1 mutant as well as the comparatively mild phenotypes that result from the loss of either DRB2 or DRB4 activity in drb2 and drb4 plants, respectively. The severity of the developmental phenotypes expressed by the three drb mutants assessed in this study is further evidenced when the fresh weight of the root system of 8-day old seedlings cultivated on standard growth media was determined. Specifically, the fresh weight of the root system of 8-day old drb2 and drb4 seedlings, 7.95 ± 0.20 mg and 8.00 ± 0.15 mg respectively, was equivalent to the fresh weight of the root system of Col-0 plants, 8.25 ± 0.45 mg (Figure 3B). However, the fresh weight of the root system of 8-day old drb1 plants, 4.25 ± 0.15 mg, was approximately 50% less than that of an 8-day old Col-0 seedling (Figure 3B).
Figure 3C shows that at the completion of the 7-day PO4 starvation period, the fresh weight of 15-day old P Col-0 roots (29.0 ± 3.0 mg) was only reduced by 2.0 mg compared to P+ Col-0 roots (31.0 ± 3.5 mg), a mild 6.5% reduction. The fresh weight of the root system of PO4 stressed drb1, drb2 and drb4 plants all showed a much greater reduction when compared to their non-stressed counterparts (Figure 3C). That is, the fresh weight of the root system of 15-day old P drb1 (7.5 ± 0.15 mg), P drb2 (23.0 ± 2.5 mg) and P drb4 plants (17.5 ± 0.75 mg) was reduced by 25.0%, 25.8% and 18.6%, respectively (Figure 3C).
Inhibition of primary root length is one of the main phenotypic responses of Arabidopsis to PO4 stress [2,44], and accordingly, Figure 3A,D clearly show that the primary root length of 15-day old P Col-0 plants (23.4 ± 2.8 mm) was significantly reduced by 51.2% compared to non-stressed P+ Col-0 plants (48.1 ± 3.1 mm) (Figure 3D). Although primary root length is already severely inhibited due to detrimental consequences of the loss of DRB1 activity on Arabidopsis development, the 7-day stress treatment caused a 46.7% reduction to the primary root length of P drb1 plants (10.4 ± 3.1 mm) compared to P+ drb1 plants (19.5 ± 5.9 mm) (Figure 3D). Interestingly, PO4 stress impacted primary root development to a much lower degree in both the drb2 and drb4 mutant backgrounds. Namely, primary root length was reduced by 20.3% and 10.3% in P drb2 (40.5 ± 4.0 mm) and P drb4 (41.8 ± 6.2 mm) plants respectively, compared to the primary root length of P+ drb2 (50.8 ± 5.0 mm) and P+ drb4 (46.6 ± 2.9 mm) plants (Figure 3D).
In parallel with inhibition to primary root length, promotion of lateral root development is a commonly reported phenotypic response of Arabidopsis plants exposed to PO4 stress [2,44]. It was therefore unsurprising to document a 44% increase in the number of lateral roots that formed on 15-day old P Col-0 plants (4.9 ± 0.4) compared to P+ Col-0 plants (3.4 ± 0.3) (Figure 3E). Interestingly, this phenotypic response to PO4 stress appeared completely defective in the drb1 mutant background with both P+ drb1 (4.0 ± 0.2) and P drb1 (3.9 ± 0.2) plants forming approximately the same number of lateral roots. Unlike the drb1 mutant, lateral root development was promoted by ~61% in the drb2 mutant background with P drb2 plants forming 8.2 ± 0.7 lateral roots compared to P+ drb2 plants which formed 5.1 ± 0.8 lateral roots. Lateral root formation was also induced by PO4 stress in the drb4 mutant with the number of lateral roots increased by 44% in P drb4 plants (2.6 ± 0.1) compared to their number in P+ drb4 plants (1.8 ± 0.2).

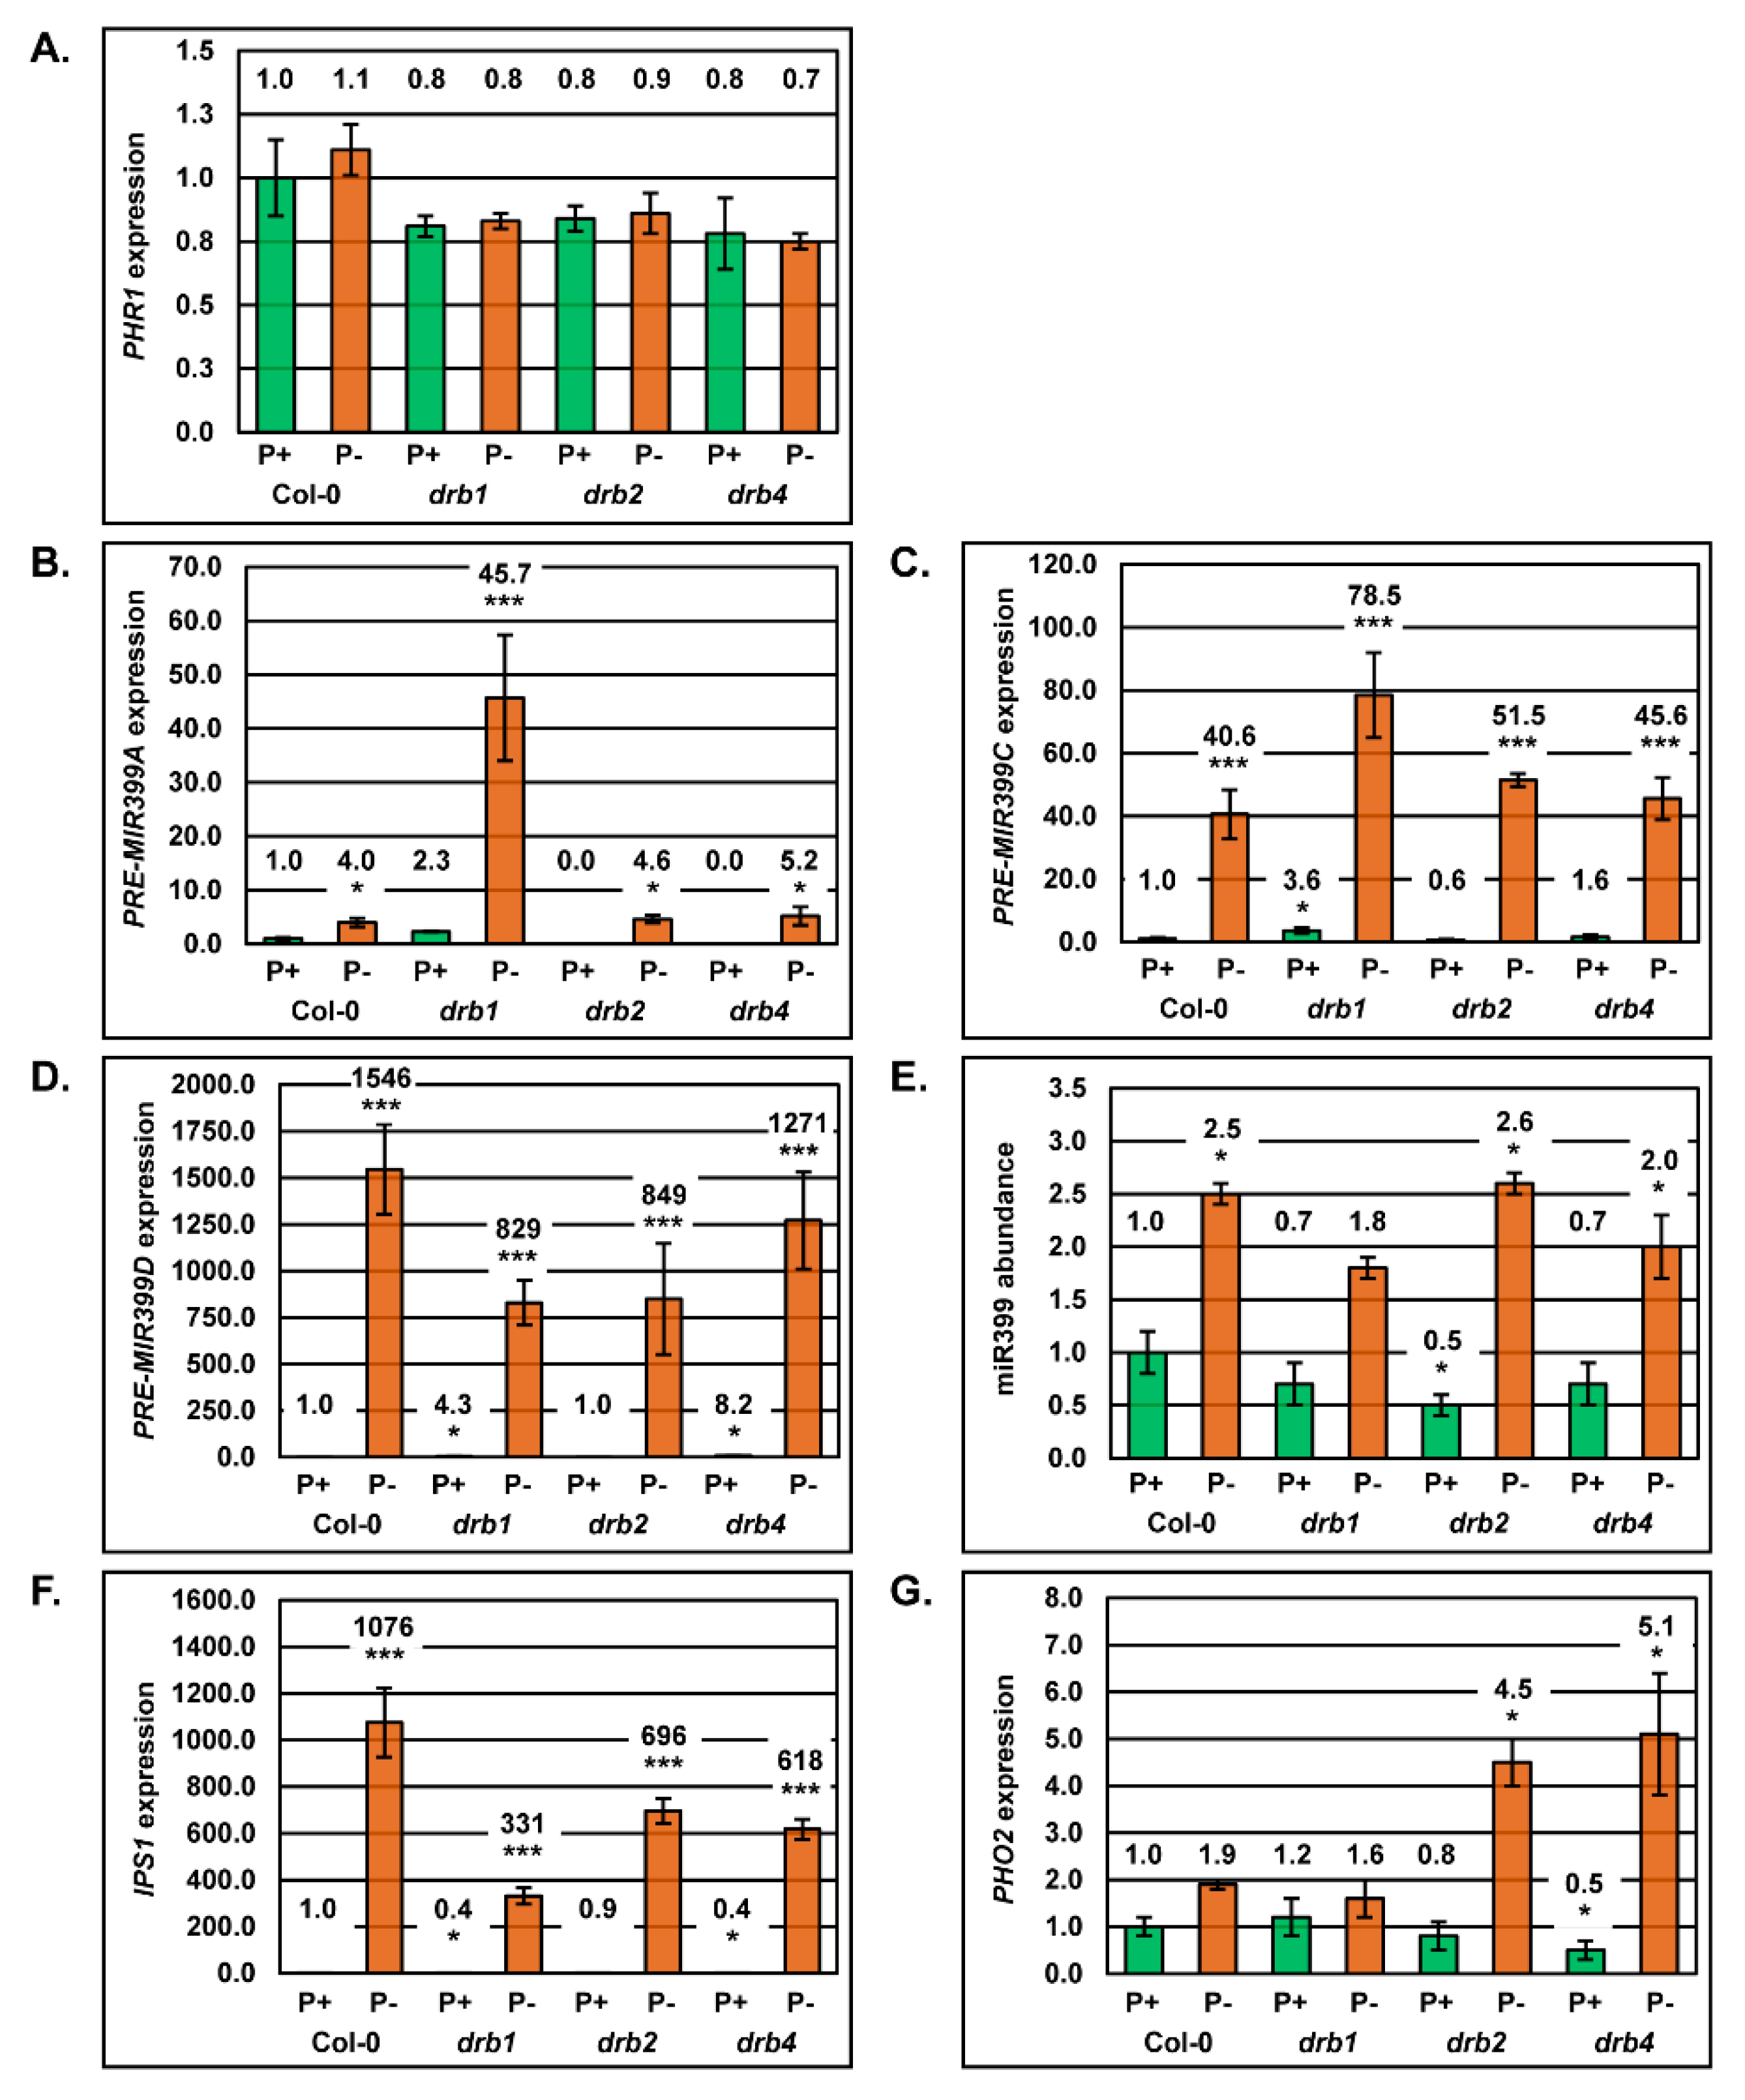
2.4. Molecular Profiling of the miR399/PHO2 Expression Module in the Root System of Arabidopsis Plant Lines Defective in DRB Protein Activity

Due to its demonstrated role in inducing MIR399 gene expression in PO4 depleted conditions [27], RT-qPCR was initially used to profile PHR1 expression in PO4-stressed Col-0, drb1, drb2 and drb4 roots (Figure 4A). This analysis revealed that compared to the root system of each plant line’s non-stressed counterpart, PHR1 expression remained remarkably constant in P Col-0, P drb1, P drb2 and P drb4 roots (Figure 4A). Although RT-qPCR revealed that PHR1 expression remained constant in the roots of control and PO4-stressed plants, RT-qPCR was next applied to profile the expression of the six MIR399 precursor transcripts in the roots of P+ and P plants. Of the six miR399 precursors, RT-qPCR only allowed for expression quantification of three miR399 precursors, namely PRE-MIR399A, PRE-MIR399C and PRE-MIR399D in Arabidopsis roots (Figure 4B–D). In P Col-0 roots, RT-qPCR clearly revealed that PO4 stress induced the expression of the miR399 precursors, PRE-MIR399A, PRE-MIR399C and PRE-MIR399D, by 4.0-, 40.6- and 1546-fold, respectively (Figure 4B–D). When compared to P+ Col-0 roots, the moderate 2.3- and 3.6-fold elevation in the abundance of PRE-MIR399A and PRE-MIR399C in P+ drb1 roots, identified DRB1 as the primary DRB required for miR399 production regulation from these two precursor transcripts in the roots of wild-type Arabidopsis plants (Figure 4B,C). The primary role of DRB1 in PRE-MIR399A and PRE-MIR399C processing in non-stressed Col-0 roots is further evidenced by the wild-type equivalent accumulation of these two precursors in P+ drb2 and P+ drb4 roots, and by the highest degree of PRE-MIR399A and PRE-MIR399C precursor transcript over-accumulation in P drb1 roots (Figure 4B,C). Considering this result, it was therefore of considerable interest to observe the greatest degree of PRE-MIR399D over-accumulation, an 8.2-fold increase, in P+ drb4 roots and not in P+ drb1 roots (4.3-fold increase) (Figure 4D). This finding suggests that in non-stressed wild-type Arabidopsis roots, DRB4 is the primary DRB responsible for regulating miR399 production from this precursor transcript. In addition, and under PO4 stress conditions, the PRE-MIR399D transcript increased in its abundance to relative expression values of 829, 849 and 1271 in drb1, drb2 and drb4 roots, respectively (Figure 4D). Although these determined increases in precursor transcript abundance are all highly significant, they are not as significant as the 1546 relative expression value obtained for the PRE-MIR399D transcript in P Col-0 roots. A lower degree of precursor transcript over-accumulation in each assessed drb mutant background, compared to the expression induction observed in wild-type roots, indicated that all three DRB proteins potentially play a role in fine-tuning the regulation of miR399 production from the PRE-MIR399D precursor in PO4-stressed Arabidopsis roots (Figure 4D).
Post-establishment of highly variable expression profiles for PRE-MIR399A, PRE-MIR399C and PRE-MIR399D in non-stressed drb1, drb2 and drb4 roots (Figure 4B–D), miR399 abundance reductions of 30%, 50% and 30% in P+ drb1, P+ drb2 and P+ drb4 roots, respectively, was expected (Figure 4E). Quantification of miR399 abundance, 2.5-, 1.8-, 2.6- and 2.0-fold elevations, respectively, in the root tissues of PO4-stressed Col-0, drb1, drb2 and drb4 plants, revealed that the considerable induction to PRE-MIR399A, PRE-MIR399C and PRE-MIR399D expression (Figure 4B–D), did not however, result in an overly altered miR399 accumulation profile (Figure 4E).
Failure to establish a strong correlation between precursor transcript expression and miR399 abundance in either control or PO4-stressed Col-0, drb1, drb2 and drb4 roots, led us to next assess IPS1 expression in this tissue (Figure 4F). IPS1 transcript abundance remained relatively unchanged in the root tissues of non-stressed Col-0 and drb2 plants (Figure 4F). Interestingly, IPS1 expression was reduced by 60% in P+ drb1 and P+ drb4 roots (Figure 4F). Significant induction of IPS1 expression was observed in PO4-stressed drb1, drb2 and drb4 roots, 331-, 696- and 618-fold elevations, respectively. Interestingly, RT-qPCR demonstrated that IPS1 expression was promoted to its greatest degree, 1076-fold, in PO4-stressed Col-0 roots (Figure 4F).
The expression of the miR399 target gene, PHO2, was next quantified by RT-qPCR in non-stressed and PO4-stressed Col-0, drb1, drb2 and drb4 roots (Figure 4G). In P+ drb1 and P+ drb2 roots, RT-qPCR revealed PHO2 expression to be elevated and reduced by 20%, respectively, and in P+ drb4 roots, PHO2 expression was reduced by 30%. Elevated PHO2 expression in P+ drb1 roots was expected considering the slight reduction to miR399 abundance observed in this tissue (Figure 4E). However, the reduced PHO2 transcript levels in P+ drb2 and P+ drb4 roots was a surprise finding considering that miR399 abundance was also reduced in these two mutant lines by 50% and 30%, respectively (Figure 4E). PHO2 expression was demonstrated by RT-qPCR to be elevated by 1.9-, 1.6-, 4.5- and 5.1-fold in PO4-stressed Col-0, drb1, drb2 and drb4 roots, respectively (Figure 4G). This finding also formed an unexpected result considering that PO4 starvation induced the accumulation of the miR399 sRNA in all four assessed plant lines (Figure 4E).

2.5. Correct Inorganic Phosphate Partitioning Between the Shoot and Root Tissue of Arabidopsis Requires DRB1 and DRB2

The molecular profiling of alterations to the miR399/PHO2 expression module in the shoot and root tissue of Arabidopsis Col-0, drb1, drb2 and drb4 plants under PO4 stress, in combination with each plant line displaying a unique phenotypic response to this stress, led us to next assess Pi partitioning in the aerial tissue and root system of P+ and P Col-0, drb1, drb2 and drb4 plants. In the shoot tissues of 15-day old plants cultivated in PO4 replete conditions, Pi content was only altered in the drb2 mutant background, with the Pi content of P+ drb2 shoots (13.8 μmol/gFW) reduced by 27.4% compared to the Pi content of P+ Col-0 shoots (19.0 μmol/gFW) (Figure 5A). When cultivated in PO4-stress conditions however, only the Pi content of P drb1 shoots (1.15 μmol/gFW) differed to that of P Col-0 shoots (1.75 μmol/gFW); a 34.3% reduction (Figure 5A). In non-stressed roots, the Pi content of P+ drb1 (11.4 μmol/gFW) and P+ drb2 (9.8 ± 0.8 μmol/gFW) roots was determined to be elevated by 58.3% and 37.5% respectively, compared to P+ Col-0 roots (7.2 μmol/gFW) (Figure 5B). As demonstrated for non-stressed drb1 and drb2 roots, the Pi content of P drb1 (1.84 μmol/gFW) and P drb2 (0.65 μmol/gFW) roots also differed to that of PO4-stressed Col-0 roots (1.25 μmol/gFW), elevated and reduced by 47.2% and 48%, respectively (Figure 5B).
The reduced Pi content of P+ drb2 shoots (Figure 5A), together with the elevated Pi contents of P+ drb1 and P+ drb2 roots (Figure 5B), suggested that Pi partitioning was potentially defective in these two mutant backgrounds. We therefore next determined the Pi content ratio of the shoot and root of non-stressed and PO4-stressed Col-0, drb1, drb2 and drb4 plants. Figure 5C clearly shows that Pi partitioning between the shoot and root tissue of P+ drb1 and P+ drb2 plants is defective, even when these two mutant lines are cultivated on standard Arabidopsis growth media. Under PO4 stress conditions, defective Pi partitioning is even more readily evident in the drb1 mutant background which showed a 0.38:0.62 shoot to root Pi content ratio, compared to the shoot to root Pi content ratio of 0.58:0.42 for P Col-0 plants. Although not as striking as determined for P+ drb2 plants, the altered shoot to root Pi content ratio (0.65:0.35) of PO4-stressed drb2 plants again indicated that Pi partitioning is defective in this mutant background (Figure 5D).
Altered shoot to root Pi content ratios in drb1 and drb2 plants strongly suggested that Pi partitioning is defective in these two mutant backgrounds. Considering that PO4 transporters, PHT1;4, PHT1;8 and PHT1;9, are known targets of PHO2-mediated ubiquitination [7,14], together with our demonstration in Figure 2 and Figure 4 that the miR399/PHO2 expression module is altered to differing degrees in the shoot and root tissues of each of the three assessed drb mutants, RT-qPCR was next applied to profile PHT1;4, PHT1:8 and PHT1:9 expression in non-stressed and PO4-stressed Col-0, drb1, drb2 and drb4 plants. RT-qPCR revealed that PO4 starvation promoted PHT1;4, PHT1:8 and PHT1:9 expression by 9.1-, 39.6- and 4.3-fold in Col-0 shoots (Figure 5E,G,I), and by 1.2-, 2.6- and 1.4-fold in Col-0 roots, respectively (Figure 5F,H,J). In non-stressed drb1 shoots, the abundance of the PHT1;4, PHT1:8 and PHT1:9 transcripts were only mildly altered compared to their respective expression levels in P+ Col-0 shoots, returning 1.4-, 1.6- and 2.1-fold changes in expression. A similar mild degree of expression alteration was observed for P+ drb1 roots. Specifically, compared to P+ Col-0 roots, the PHT1;4, PHT1:8 and PHT1:9 transcripts returned fold changes in abundance of 0.6, 1.0 and 0.7, respectively. The expression of these three PO4 transporters was significantly induced by the 7-day stress period, returning abundance fold changes of 24.5 (PHT1;4), 359.2 (PHT1:8) and 242.5 (PHT1:9), respectively (Figure 5E,G,I), in P drb1 shoots. In spite of the significant induction of PHT1 gene expression in P drb1 shoots, PHT1;4, PHT1:8 and PHT1:9 levels were reduced (0.7-fold), elevated (2.0-fold) and unchanged (1.0-fold), respectively (Figure 5F,H,J) in the root system of PO4-stressed drb1 roots. As demonstrated for P+ drb1 shoots, RT-qPCR again revealed that PHT1;4, PHT1:8 and PHT1:9 expression was mildly altered in P+ drb2 shoots by 0.8-, 1.0- and 3.4-fold, respectively. In non-stressed drb2 roots however, the expression of all three PO4 transporters was reduced by 40%, 50% and 60%, respectively, compared to their expression levels in non-stressed Col-0 roots. Furthermore, Figure 5E–J clearly show that the 7-day PO4 starvation period induced the expression of these three PO4 transporter encoding genes in both the P drb2 shoot and root samples, compared to their expression levels in non-stressed drb2 shoot and roots. Considering that Pi content of non-stressed and PO4-stressed drb4 shoots and roots was determined to be the same as that of the corresponding tissues in P+ and P Col-0 plants, it was unexpected to observe such varied differences in PO4 transporter expression across both assessed tissues/growth conditions. For example, in P+ drb4 roots, PHT1;4, PHT1;8 and PHT1;9 levels were each reduced by 60%, compared to P+ Col-0 roots (Figure 5F,H,J), yet the Pi content of non-stressed Col-0 and drb4 roots was identical (Figure 5B).

3. Discussion

A lack of available P in the soil is a key limitation for plant growth globally [3,45] and as a consequence of P limitation, land plants have evolved highly complex regulatory mechanisms to control both the uptake of external P from the soil, primarily in the form of PO4 (Pi), as well as the remobilization of internal stores of P during periods of low external PO4 availability [46]. These elaborate P responsive mechanisms allow a plant to attempt to (1) maintain growth and development and (2) regulate cellular P content, regardless of external P concentration [1,2,7]. More contemporary research has focused on the regulatory role played by a suite of PO4 responsive miRNA sRNAs that either initiate or maintain PO4 signaling pathways across the plant kingdom [4,20]. Central to this PO4 responsive miRNA cohort, is miR399, with the miR399 sRNA required to regulate the abundance of the PHO2 transcript, to in turn regulate the level of the PHO2 protein, an E2 ubiquitin conjugase that mediates the ubiquitin-directed turnover of a group of PO4 transporter proteins [7,14,47]. The DRB family members, DRB1, DRB2 and DRB4, have each been ascribed a specific functional role in the Arabidopsis miRNA pathway [35,36,37,38,39,40,48,49]. Therefore, we sought to document the involvement of these three DRBs in the production of the PO4 responsive miRNA, miR399, and to determine the mode of action directed by the miR399 sRNA during PO4 starvation to regulate PHO2 abundance in the drb1, drb2 and drb4 mutant backgrounds. Specifically, we attempted to determine what effect an altered miR399/PHO2 expression module profile would have on the response of drb1, drb2 or drb4 mutant plants to the imposed stress in order to establish the contribution of either DRB1, DRB2 and/or DRB4 to the maintenance of P homeostasis in Arabidopsis.

3.1. DRB1 is Required to Maintain Phosphorous Homeostasis in Arabidopsis

Here, it was discovered that the maintenance of P homeostasis is impaired in the drb1 loss-of-function mutant. The most compelling evidence for this was the documented alteration of the shoot to root Pi content ratio in both non-stressed (Figure 5C) and PO4-stressed drb1 plants (Figure 5D), relative to wild-type Arabidopsis (P+ or P Col-0 plants). Specifically, the shoot Pi content was reduced to a much greater degree in PO4-stressed drb1 plants than the observed reduction to Pi content in P Col-0 shoots. Furthermore, Pi was demonstrated to over-accumulate in the roots of both P+ and P drb1 plants (Figure 5A,B), compared to the Pi content of the corresponding tissue, and growth regime, of Col-0 plants. The maintenance of appropriate P content in plant tissues is essential for the production of macromolecules, energy trafficking and for numerous signaling pathways [1,2,46]. Therefore, alterations to the P content of the shoot and root tissues of drb1 plants indicated that in the absence of functional DRB1, P partitioning is impaired. Assessment of the expression of PO4 transporters, PHT1;4, PHT1;8 and PHT1;9, revealed that the abundance of each transporter was highly elevated by 24.5- 359.2- and 242.5-fold respectively, in the shoot tissue of P drb1 plants. Phosphate transporter expression was also demonstrated to be altered in both P+ (PHT1;4 reduced by 1.7-fold and PHT1;9 reduced by 1.5-fold) and P (PHT1;4 reduced by 1.5-fold and PHT1;8 elevated by 2.0-fold) drb1 roots, expression alterations that when taken together indicated that incorrect Pi partitioning in drb1 plants potentially results from defective PO4 transport from the root system to the aerial tissue in this mutant background.
Defective root to shoot PO4 transport in the drb1 mutant was further evidenced by the unique phenotypic response displayed by the drb1 shoot to PO4 stress. Specifically, the fresh weight of the shoot of 15-day old P drb1 plants was only reduced by 21.6% compared to its non-stressed counterpart (Figure 1C). The rosette area of P drb1 plants was also demonstrated to only be reduced by 29.3% post the 7-day PO4 stress treatment (Figure 1D). Both responses were comparatively mild compared to the 36.6% and 60.1% reductions to fresh weight and rosette area respectively, documented for Col-0 shoots post the application of PO4 stress. In addition, anthocyanin failed to change in abundance in the shoot tissues of P drb1 plants compared to the shoots of non-stressed P+ drb1 plants (Figure 1E). Anthocyanin production is a general response to a range of abiotic stresses, including PO4 starvation [19,50]. The impaired ability of drb1 shoots to produce anthocyanin in response to PO4 stress may implicate DRB1, and the functional partnership DRB1 forms with DCL1, in the induction of PO4 responsive gene expression pathways. Considering these mild responses displayed by drb1 shoots, it was therefore surprising to observe that chlorophyll a and b overaccumulation was promoted to the greatest extent in the aerial tissues of drb1 plants starved of PO4. Altered chlorophyll content in P+ drb1 shoots indicated that (1) drb1 shoots are indeed negatively impacted by the imposed PO4 stress, and (2) that DRB1 may potentially mediate a PO4-directed role in regulating photosynthesis in Arabidopsis chloroplasts.
Considering the well-established role of the DRB1/DCL1 functional partnership in the production of the majority of miRNAs that accumulate in Arabidopsis tissues, it was unsurprising to observe that the miR399 precursors, PRE-MIR399A, PRE-MIR399C, PRE-MIR399D, PRE-MIR399E and PRE-MIR399F, over-accumulated to the greatest extent in P+ drb1 shoots (Figure 2A–E). In addition, precursors PRE-MIR399A, PRE-MIR399C, PRE-MIR399D and PRE-MIR399F were further demonstrated to be most highly abundant in the shoot tissues of PO4-stressed drb1 plants. The enhanced abundance of miRNA precursor transcripts in the drb1 mutant background is most likely the result of inefficient precursor transcript processing by DCL1 in the absence of DRB1 functional assistance, with DRB1 accurately positioning DCL1 on each miRNA precursor to direct accurate processing [48,49]. In spite of the readily observable evidence of inefficient miR399 precursor transcript processing in P+ drb1 shoots, miR399 levels were only reduced by 10% (Figure 5G). Similarly, although miR399 precursor transcript abundance was elevated to a much greater degree in P drb1 shoots due to a combination of (1) MIR399 gene expression induction in response to PO4 starvation, and (2) inefficient precursor transcript processing in the absence of DRB1 activity, miR399 abundance was again demonstrated to be only mildly elevated by 2.3-fold in the shoots of PO4-stressed drb1 plants (Figure 5G). Further, the abundance of the miR399 target transcript, PHO2, was only mildly elevated by 1.2-fold in response to the 10% reduction in miR399 levels in P+ drb1 shoots (Figure 2I). Surprisingly, PHO2 transcript abundance was elevated by 1.5-fold in response to the 2.3-fold elevation in miR399 accumulation in P drb1 shoots, and not reduced as expected. However, in P+ Col-0 shoots, and as expected, the 2.9-fold enhancement to miR399 abundance led to a 50% reduction in PHO2 expression (Figure 5G,I). Therefore, elevated PHO2 abundance in response to enhanced miR399 levels in P drb1 shoots, readily demonstrates that miR399-directed PHO2 transcript cleavage, to regulate PHO2 expression, is defective in the absence of DRB1 activity.
Altered PO4 transporter expression in drb1 roots indicated that the response of the root system of the drb1 mutant to PO4 stress would differ to that of the root system of wild-type Arabidopsis. Accordingly, the fresh weight of PO4-stressed drb1 roots was reduced by 25.0% compared to the mild 6.5% reduction to the fresh weight of P Col-0 roots, a 3.8-fold enhancement to the severity of this phenotypic response (Figure 3C). It was therefore curious to observe a similar degree of reduction to primary root length in P drb1 (46.7%) and P Col-0 (51.2%) plants (Figure 3D). A greater degree of reduction to the fresh weight of P drb1 roots, compared to P Col-0 roots, could be partially explained by the observation that the induction of lateral root formation by PO4 stress was completely defective in P drb1 roots, compared to a 44.0% increase in lateral root number in P Col-0 roots (Figure 3D). Considering that the measurement of fresh weight is largely assessing the moisture content of a plant, the observed reduction to fresh weight of P drb1 roots could potentially be indicating that under PO4 stress conditions, DRB1 is somehow involved in regulating the moisture content of the root system of Arabidopsis. However, this was not assessed in this study with the mechanism driving the enhancement of fresh weight reductions requiring further investigation in the future.
Similar to its establishment as the primary DRB protein required to regulate miR399 production from the PRE-MIR399A, PRE-MIR399C, PRE-MIR399D, PRE-MIR399E and PRE-MIR399F precursors in the aerial tissues of non-stressed Arabidopsis plants, DRB1 was again demonstrated to be the primary DRB protein required to regulate miR399 production from the PRE-MIR399A and PRE-MIR399C precursor transcripts in the Arabidopsis root system with both precursors demonstrated to accumulate to the greatest degree in P+ and P drb1 roots (Figure 4B,C). Reduced PRE-MIR399A and PRE-MIR399C processing efficiency in the absence of DRB1 activity, reduced miR399 abundance by 30% in P+ drb1 roots (Figure 4E), and in turn, this moderate reduction to miR399 levels led to a mild elevation (1.2-fold) in the expression of the miR399 target gene, PHO2 (Figure 4G). As documented in P drb1 shoots, the 1.8-fold elevation to miR399 levels in P drb1 roots, resulted in a moderate elevation to PHO2 transcript abundance (1.6-fold), and not a reduction in target gene expression as would be expected for a miRNA that regulates the expression of its targeted genes solely via a mRNA cleavage mode of RNA silencing. However, considering that a similar miRNA/target gene expression profile of elevated miR399 abundance (2.5-fold), together with enhanced PHO2 expression (1.9-fold) was also observed in PO4-stressed Col-0 roots, this curious finding indicates that miR399-directed PHO2 transcript cleavage may not be the predominant mechanism of target gene expression regulation directed by the miR399 sRNA in the Arabidopsis root system. Alternatively, elevated PHO2 expression in P+ Col-0 and P+ drb1 roots when miR399 abundance is also elevated may result from the enhanced expression of the eTM of miR399 activity, IPS1. In P Col-0 shoots for example, where elevated miR399 abundance was demonstrated to direct enhanced expression repression of the PHO2 transcript (Figure 2G,I), IPS1 abundance was elevated by 75.7-fold, compared to its abundance in P+ Col-0 shoots (Figure 2H). In PO4-stressed roots, however, IPS1 expression was elevated to a much greater degree, by 1076-fold (Figure 4F). This 14.2-fold greater promotion to IPS1 expression in P Col-0 roots, than that observed in P Col-0 shoots, would be expected to sequester a higher amount of miR399, which in turn, could have led to the observed elevation in PHO2 expression in P Col-0 roots in the presence of 2.5-fold greater abundance of the PHO2 targeting miRNA, miR399.

3.2. DRB2 is Required to Maintain Phosphate Homeostasis in Arabidopsis

As documented for the drb1 mutant, P homeostasis was determined to be defective in the drb2 mutant. Specific to drb2 plants however, was the 27.8% reduction to the Pi content of non-stressed drb2 shoots (Figure 5A). Of the four Arabidopsis plant lines assessed in this study, drb2 was the only line determined to have a reduced aerial tissue Pi content when cultivated under standard growth conditions. Furthermore, in P+ drb2 shoots, PHT1;4 (Figure 5E) and PHT1;8 (Figure 5G) expression was determined to be reduced and elevated by 1.2- and 3.4-fold respectively, compared to the expression of these two PO4 transporters in P+ Col-0 shoots. In addition, Pi was determined to over-accumulate by 36.1% in P+ drb2 roots. In P+ drb2 roots, PHT1;4, PHT1;8 and PHT1;9 expression was reduced by 1.7-, 2.0- and 2.4-fold respectively, compared to their expression levels in P+ Col-0 roots. Together, (1) reduced Pi content of P+ drb2 shoots, (2) elevated Pi content in P+ drb2 roots, and (3) reduced PO4 transporter gene expression in P+ drb2 roots, indicated that PO4 root to shoot transport is defective in non-stressed drb2 plants. Based on this finding, it was curious to observe a similar Pi content in P drb2 shoots and P Col-0 shoots (Figure 5A), especially considering the document enhancement to PHT1;4 and PHT1;9 expression in P drb2 shoots, with the expression of these two PO4 transporters elevated by 2.8- and 7.0-fold respectively, compared to the degree of expression induction observed in P Col-0 roots (Figure 5E,I). However, and as demonstrated for P+ drb2 shoots and roots, the Pi content of the root system of PO4-stressed drb2 plants was altered, reduced by 48% compared to the Pi content of P Col-0 roots. Interestingly, RT-qPCR revealed similar degrees of elevated PHT1;8 (Figure 5H) and PHT1;9 (Figure 5J) expression in PO4-stressed Col-0 and drb2 roots with only the PHT1;4 transcript returning a slight difference in its expression in P Col-0 roots (elevated by 1.2-fold compared to P+ Col-0 roots) and P drb2 roots (reduced by 1.1-fold compared to P+ Col-0 roots). The PO4 transporters, PHT1;1 and PHT1;4, have been demonstrated to be responsible for the import of more than half of the Pi that is taken up from the soil [51]. It therefore seems unlikely that the mild 10% reduction to PHT1;4 transcript abundance documented in PO4-stressed drb2 roots, is the sole cause of the considerable reduction to the Pi content of the root system in the drb2 mutant background.
Considering that the Pi content of PO4-stressed Col-0 and drb2 shoots was determined to be similar, it was unsurprising to document a similar degree of reduction to fresh weight of the shoot tissues of P Col-0 (36.6%) and P drb2 (39.1%) plants (Figure 1C). Rosette area was also decreased by a similar degree in P Col-0 (60.1%) and P drb2 (48.0%) plants (Figure 1D). However, compared to PO4-stressed Col-0 shoots, anthocyanin accumulated to considerably higher levels in the aerial tissues of drb2 plants when exposed to PO4 stress (Figure 1E). The induction of anthocyanin production is a well-characterized response to PO4 starvation [19,50]. Therefore, the considerable enhancement of anthocyanin accumulation in P drb2 shoots, compared to the shoot tissues of PO4-stressed Col-0 plants, suggests that this P-responsive pathway is hyperactivated in the absence of DRB2 activity, as well as potentially implicating DRB2 in mediating a regulatory role in a range of other P-responsive pathways in Arabidopsis aerial tissues that were not assessed in this study.
We have previously demonstrated a role for DRB2 in the production stage of the Arabidopsis miRNA pathway with the abundance of specific miRNA cohorts altered in the drb2 mutant background [37]. More specifically, DRB2 can either be antagonistic or synergistic to DRB1 function in the DRB1/DCL1 partnership for the production of specific miRNAs, resulting in miRNA abundance either being enhanced (antagonistic) or reduced (synergistic) in drb2 plants [37,38]. Reduced precursor transcript abundance in non-stressed drb2 shoots, indicated that DRB2 plays a secondary role in regulating miR399 production from the PRE-MIR399A, PRE-MIR399E and PRE-MIR399F precursors, potentially via antagonism of DRB1 function (Figure 2B,E,F). The antagonism of DRB2 on the DRB1/DCL1 partnership becomes more readily apparent via the profiling of miR399 precursor transcript expression in P drb2 shoots, with lower degrees of expression induction observed for the PRE-MIR399C, PRE-MIR399D, PRE-MIR399E and PRE-MIR399F precursors (Figure 2C–F). Reduced precursor transcript abundance in P drb2 shoots, compared to the respective abundance of each precursor in either P Col-0 or P drb1 shoots, indicates that in the absence of DRB2 activity, precursor transcript processing efficiency is enhanced due to more precursor transcript being freely available to enter the canonical DRB1/DCL1 production pathway.
As demonstrated in P+ drb1 shoots, significantly altered precursor transcript abundance in P+ drb2 shoots, failed to have a strong influence on the accumulation of miR399, with miR399 levels only mildly elevated by 10% in P+ drb2 shoots, compared to P+ Col-0 shoots (Figure 5G). However, DRB2 antagonism was still evidenced by this mild increase to miR399 abundance compared to the 10% reduction in miR399 levels observed in P+ drb1 shoots. The antagonism of DRB2 on miR399 production was further evidenced by the enhanced expression repression of PHO2 in P drb2 shoots (Figure 2I). The abundance of miR399 was elevated by 2.7-fold in P drb2 shoots, and therefore, a further degree of reduced PHO2 expression in P drb2 shots, compared to P drb1 shoots where miR399 levels were elevated by 2.3-fold and PHO2 expression was enhanced by 1.5-fold, clearly demonstrated enhanced DRB1-mediated, miR399-directed, PHO2 transcript cleavage in the absence of DRB2 antagonism. Similarly, it is important to note here that IPS1 transcript abundance was enhanced to a much lower degree in P drb2 shoots (27.1-fold) compared to IPS1 abundance induction in either PO4-stressed Col-0 (75.7-fold) or drb1 (85.4-fold) shoots. This unexpected observation again indicated that in the absence of DRB2 activity, miR399-directed target transcript cleavage was enhanced. Although IPS1 has been identified as a non-cleavable eTM of miR399 activity, the IPS1 expression trends presented in Figure 5H suggest that miR399 may well be capable of directing miRISC-catalyzed cleavage of the IPS1 transcript in addition to solely being sequestered by IPS1.
Compared to the mild 6.5% reduction to the fresh weight of P Col-0 roots, the negative response of the root system of the drb2 mutant to PO4 stress was considerably more pronounced at 25.8% (Figure 3C). Considering that the correct regulation of Pi content is dysfunctional in both control and PO4-stressed drb2 roots, differing responses to PO4 stress in drb2 roots, compared to P Col-0 roots, was not surprising. Similarly, inhibition of the primary root length of P drb2 plants at 20.3% was comparatively mild compared to the severe 51.2% inhibition to the primary root length observed for P Col-0 plants (Figure 5D). The degree of lateral root induction also differed between PO4-stressed Col-0 and drb2 roots (Figure 5E), specifically; lateral root formation was enhanced by ~44% in P Col-0 plants, and in PO4-stressed drb2 plants, lateral root formation was further promoted by 17% with P drb2 plants developing ~61% more lateral roots than their non-stressed counterparts. When these phenotypic responses of the root system of PO4-stressed drb2 plants are considered together, including a lower degree of primary root length inhibition (2.5-fold less than P Col-0 plants), and a more pronounced enhancement to lateral root formation (1.4-fold more than P Col-0 plants), it was highly surprising that the fresh weight of P drb2 roots was reduced by a 4.0-fold greater degree than documented for P Col-0 roots.
Similar levels of expression of PRE-MIR399A in both non-stressed and PO4-stressed Col-0 and drb2 roots revealed that DRB2 does not play a role in regulating miR399 processing from this precursor transcript (Figure 4B). Reduced expression of PRE-MIR399C in P+ drb2 roots (compared to P Col-0 and P drb1 roots) and a lower level of precursor over-accumulation in P drb2 roots (compared to P drb1 roots), identified DRB2 as playing a secondary role in regulating miR399 production from this precursor transcript in the Arabidopsis root system (Figure 4C) via antagonism of DRB1 function. The expression trend of PRE-MIR399D in P drb2 roots additionally identified a secondary role for DRB2 in regulating miR399 production from the third miR399 precursor transcript detected in the root system of the four Arabidopsis plants lines assessed in this study. However, for the PRE-MIR399D precursor, DRB2 appears to be antagonistic to the DRB4/DCL4 partnership, and not to the canonical DRB1/DCL1 partnership demonstrated to be required for the production of the majority of Arabidopsis miRNAs. DRB2 has been demonstrated previously to be antagonistic to DRB4 function in the DRB4/DCL4 partnership for the production of a small subset of newly evolved Arabidopsis miRNAs processed from precursor transcripts that fold to form highly complementary stem-loop structures [39,40]. Considering that in P+ drb2 roots, PRE-MIR399A and PRE-MIR399D remained at their approximate wild-type levels, and that the PRE-MIR399C precursor was reduced in its abundance by 1.7-fold, a finding that initially indicated that this precursor is more efficiently processed by DRB1/DCL1 in the absence of DRB2 activity, the 2.0-fold reduction to miR399 abundance alternatively indicated that MIR399C gene expression may in fact be reduced in PO4-stressed drb2 roots. It was therefore curious to observe PHO2 expression to be reduced by 1.3-fold in P+ drb2 roots, and not elevated in response to reduced miR399 abundance as expected. However, this observation is potentially demonstrating that in spite of being reduced in abundance, this lower level of miR399 directs more efficient cleavage of the PHO2 transcript in the absence of DRB2 activity. In P drb2 roots, miR399 abundance was determined to be elevated by 2.6-fold compared to its abundance in P Col-0 roots (Figure 4E). As observed in P+ drb2 roots, PHO2 expression scaled in accordance with elevated miR399 abundance, with PHO2 expression increased by 4.5-fold in PO4-stressed drb2 roots. It is interesting to note here that PHO2 expression scaled with miR399 abundance in six out the eight root tissue samples molecularly assessed by RT-qPCR in this study. We have previously demonstrated that DRB2-dependent miRNAs direct a translational repression mode of miRNA-directed target gene expression repression [52], and scaling of miRNA target transcripts together with their targeting miRNA, has been previously reported for miRNA sRNAs that direct a translational repression mode of target gene expression regulation [52,53,54].

3.3. DRB4 is Required For miR399 Production in Arabidopsis Roots

Profiling of PO4 transporter expression in the shoots and roots of P+ and P drb4 plants revealed considerable alteration to PHT1;4, PHT1;8 and PHT1;9 transcript abundance across both assessed tissues and growth regimes (Figure 5E–J). However, in spite of these documented differences in PO4 transporter gene expression in drb4 shoots and roots, the Pi content of non-stressed and PO4-stressed drb4 tissues remained at levels comparable to P+ and P Col-0 shoots and roots (Figure 5A,B). Considering this finding, it was unsurprising that the developmental progression of Col-0 and drb4 plants was impeded to the same extent when cultivated in the absence of PO4 for a 7-day period. Specifically, the fresh weight of both P Col-0 and P drb4 shoots was reduced by ~36% compared to their non-stressed counterparts of the same age (Figure 1C). In addition, anthocyanin, chlorophyll a and chlorophyll b were all elevated to the same degree in PO4-stressed Col-0 and drb4 shoots, compared to their respective non-stressed counterparts. It was therefore surprising that the rosette area of P drb4 plants was only reduced by 38.7% compared to the more severe 60.1% reduction observed for P Col-0 plants. Although an unexpected finding, this result clearly indicated that some of the responses of the drb4 mutant to PO4 starvation differ to those of wild-type Arabidopsis.
Considering the well-established role of the DRB4/DCL4 partnership in trans-acting siRNA (tasiRNA) [55,56] and p4-siRNA [40] production, and for the processing of a small number of newly evolved miRNAs from their highly complementary precursor transcripts [39], it was highly surprising to additionally establish the widespread involvement of DRB4 in regulating the production of the highly conserved miRNA, miR399, in Arabidopsis shoots (Figure 2). Specifically, DRB4 was determined to play a secondary role to DRB1 in regulating the efficiency of miR399 production from all five precursors detectable by RT-qPCR in non-stressed Arabidopsis shoots. As demonstrated for DRB2, the involvement of DRB4 in miR399 production in Arabidopsis shoots is most likely via antagonism of the canonical DRB1/DCL1 partnership. Antagonism of the DRB1/DCL1 partnership by DRB4 was again demonstrated by the accumulation profiles of precursors, PRE-MIR399C, PRE-MIR399D, PRE-MIR399E and PRE-MIR399F, in the shoot tissues of PO4-stressed drb4 plants (Figure 2C–F). Although precursor transcript abundance was highly variable in drb4 shoots, miR399 levels were only mildly elevated by 1.2- and 2.4-fold in P+ drb4 and P drb4 shoots, respectively (Figure 2G). Surprisingly, in spite of the 20% elevation to miR399 levels in P+ drb4 shoots, PHO2 expression was elevated to a similar degree (30% increase), and not reduced as expected (Figure 5I). In P drb4 shoots, however, the 2.4-fold elevated abundance of the miR399 sRNA was determined, as expected, to reduce the expression of PHO2 by 2.5-fold. This result clearly indicated that in the absence of DRB4 activity in Arabidopsis shoots, the efficiency of DRB1-mediated, miR399-directed cleavage of the PHO2 transcript is enhanced.
The fresh weight of P drb4 roots was reduced by 18.6% compared to the fresh weight of P+ drb4 roots, a 2.9-fold further enhancement of this phenotypic response to PO4 stress, compared to the mild response of P Col-0 roots (6.5% fresh weight reduction compared to P+ Col-0 roots). The response of the primary root of the drb4 mutant to PO4 stress also differed to that of wild-type roots. Namely, the length of P drb4 primary root was only reduced by 10.3% compared to the significant 51.2% reduction to the length of the primary root of P Col-0 plants (Figure 3D). Although lateral root development was induced to the same degree (44%) in the root system of PO4-stressed Col-0 and drb4 plants, the considerable differences observed for the fresh weight of the drb4 root system, and the lack of inhibition to primary root length in P drb4 plants, clearly revealed that the drb4 mutant background is defective in some of its responses to PO4 starvation, compared to the responses of the Col-0 root system to this stress.
At the molecular level, the wild-type-like expression of the PRE-MIR399A precursor in the roots of non-stressed and PO4-stressed drb4 plants indicated that DRB4 does not play a role in regulating miR399 production from this precursor in Arabidopsis roots. Expression analysis of PRE-MIR399C did however identify a secondary role for DRB4 in regulating miR399 production from this precursor, potentially via antagonism of DRB1 function (Figure 4C). Of particular interest stemming from miR399 precursor transcript profiling in non-stressed and PO4-stressed Arabidopsis roots is the unexpected finding that DRB4 appears to be the primary DRB required to regulate miR399 production from the PRE-MIR399D precursor (Figure 4D), with the abundance of the PRE-MIR399D precursor over-accumulating to its highest levels in both P+ and P drb4 roots. Curiously, assessment of the stem-loop folding structures of the six precursors from which the miR399 sRNA is liberated does not readily distinguish the PRE-MIR399D structure from the folding structures of the other five miR399 precursor transcripts. Therefore, the establishment of a role for DRB4 in regulating miR399 processing efficiency from its precursor transcripts was a highly unexpected finding, a finding that requires additional experimentation in the future to identify the precursor transcript-based sequence and/or structural features that recruits the involvement of DRB4 to the miR399/PHO2 expression module.
The elevated abundance of the PRE-MIR399C and PRE-MIR399D precursors in P+ drb4 roots indicated reduced precursor transcript processing efficiency in the absence of DRB4. Accordingly, a 30% reduction to miR399 accumulation was observed in P+ drb4 roots (Figure 4E). Surprisingly, this 1.4-fold reduction to miR399 levels in P+ drb4 roots led to a 2.0-fold reduction to PHO2 expression (Figure 4G). This result suggested that although miR399 levels were reduced in non-stressed drb4 roots, the reduced amount of the miR399 sRNA was actually directing enhanced PHO2 expression repression via unimpeded DRB1-mediated, miR399-directed, PHO2 cleavage. However, enhanced miR399-directed PHO2 cleavage appeared to be lost in PO4-stressed drb4 roots with both miR399 and PHO2 levels elevated by 2.0- and 5.1-fold, respectively (Figure 4E,G). Therefore, when taken together, although miR399-directed PHO2 cleavage appeared to be enhanced in P+ drb4 roots, the scaling of PHO2 expression together with miR399 abundance in PO4-stressed drb4 roots, potentially suggests that in a cell type with altered physiology, and where DRB4 function is defective, the miR399 sRNA changed from directing an mRNA cleavage mode of RNA silencing, to directing a translational repression mode of RNA silencing.

3.4. DRB1, DRB2 and DRB4 Are Required to Regulate the miR399/PHO2 Expression Module in Arabidopsis Shoots and Roots

Here we demonstrate that the phenotypic and molecular response to PO4 starvation were unique to each drb mutant background assessed due to the hierarchical contribution of DRB1, DRB2 and DRB4 to the regulation of the miR399/PHO2 expression module. Specifically, the molecular profiling of miR399 precursor transcript expression identified DRB1 as the primary DRB required for efficient miR399 production from each precursor in non-stressed and PO4-stressed shoots and roots. Deregulated miR399 precursor transcript processing efficiency in the absence of DRB1 activity was demonstrated to result in defective P homeostasis maintenance, altering the shoot to root ratio of Pi content in the drb1 mutant background. The maintenance of P homeostasis was also defective in drb2 plants, with the Pi content shoot to root ratio altered in this mutant background, both under standard growth conditions and in conditions of PO4 starvation. An altered Pi content in drb2 tissues appeared to result from defective PO4 transport between the root system and aerial tissues in the absence of DRB2 function. Further, DRB2 was determined to play a secondary role to DRB1 in regulating miR399 production from the profiled PRE-MIR399 precursor transcripts. The secondary role of DRB2 in regulating miR399 production from the assessed PRE-MIR399 precursor transcripts was revealed to most likely be via antagonism of DRB1 function. DRB4 was also determined to play a secondary role in regulating the miR399/PHO2 expression module in Arabidopsis shoots and roots, and as demonstrated for the secondary role of DRB2 in providing additional regulatory complexity to this expression module, DRB4 also appeared to be antagonistic to the primary functional role of DRB1 in regulating miR399 precursor transcript processing efficiency. Furthermore, DRB4 also appeared to be the primary DRB required for miR399 production from the PRE-MIR399D precursor in non-stressed and PO4-stressed Arabidopsis roots. When taken together, the hierarchical contribution of DRB1, DRB2 and DRB4 to the regulation of the miR399/PHO2 expression module documented here, readily demonstrates the crucial importance of maintaining P homeostasis in Arabidopsis tissues to ensure the maintenance of a wide range of cellular processes to which P is essential.

4. Materials and Methods

4.1. Plant Material and Phosphate Stress Treatment

The T-DNA insertion knockout mutant lines used in this study, including the drb1 (drb1-1; SALK_064863), drb2 (drb2-1; GABI_348A09) and drb4 (drb4-1; SALK_000736) mutants, have been described previously [42]. The seeds of these three drb mutant lines, and of wild-type Arabidopsis (ecotype Columbia-0 (Col-0)) plants, were sterilized using chlorine gas and post-sterilization, seeds were plated out onto standard Arabidopsis plant growth media (half-strength Murashige and Skoog (MS) salts), and stratified for 48 h at 4 °C in the dark. Post-stratification, the sealed plates were transferred to a temperature-controlled growth cabinet (A1000 Growth Chamber, Conviron® Australia) and cultivated for an 8-day period under a standard growth regime of 16 h light / 8 h dark, and a day/night temperature of 22 °C / 18 °C. Post this initial 8-day cultivation period, equal numbers of Col-0, drb1, drb2 and drb4 seedlings were transferred under sterile conditions to either fresh standard Arabidopsis plant growth media that contained 1.0 mM of PO4 (P+ plants; non-stressed controls) or to Arabidopsis plant growth media where the PO4 had been replaced with an equivalent molar amount (1.0 mM) of potassium chloride (KCl) (P plants; PO4 stress treatment). Post seedling transfer, the P+ and P plates for each plant line were returned to the temperature-controlled growth cabinet for an additional 7-day cultivation period. For the tissue-specific analyses performed here, namely the root tissue assessments, additional Col-0, drb1, drb2 and drb4, 8-day old seedlings were treated exactly as outlined above, except for the 7-day treatment period, where P+ and P plates were orientated for vertical growth. Unless stated otherwise, all the phenotypic and molecular analyses reported here were conducted on 15-day old plants.

4.2. Phenotypic and Physiological Assessments

The fresh weight of 8-day old Col-0, drb1, drb2 and drb4 whole plants germinated and cultivated on standard Arabidopsis plant growth media was initially determined to establish the effect of loss of DRB1, DRB2 or DRB4 activity on Arabidopsis development. The fresh weight of 15-day old Col-0, drb1, drb2 and drb4 plants was also determined to establish the effect of the 7-day PO4 stress treatment on the development of each plant line. The area of the rosette and the length of the primary root of 15-day old Col-0, drb1, drb2 and drb4 plants was determined via the assessment of photographic images using the ImageJ software. The same photographic images were also used to establish the number of lateral roots formed by P+ and P Col-0, drb1, drb2 and drb4 plants post the 7-day stress treatment period.
A standard methanol:HCl (99:1 v/v) extraction method was applied to extract anthocyanin from P+ and P plants, and post extraction, anthocyanin content was determined using a spectrophotometer (Thermo Scientific, Australia) at an absorbance wavelength of 535 nanometers (A535). The 99:1 (v/v) methanol:HCl extraction buffer was used as the blanking solution and the A535 of each sample was next divided by the fresh weight of the sample to calculate the relative anthocyanin content per gram of fresh weight (A535/g FW).
For chlorophyll a and b content quantification, rosette leaves of 15-day old P+ and P Col-0, drb1, drb2 and drb4 plants were sampled and incubated in 80% acetone for 24 h in the dark. Post incubation, rosette leaf tissue was clarified via centrifugation at 15,000 × g for 7 min at room temperature. The resulting supernatants were immediately transferred to a spectrophotometer and the absorbance of these solutions assessed at wavelengths 646 nm (A646) and 663 nm (A663) using 80% acetone as the blanking solution. The chlorophyll a and b content of each sample was then determined using the Lichtenthaler’s equations exactly as outlined in [57], and these initially determined values were subsequently converted to micrograms per gram of fresh weight (μg/g FW).
The shoot and root tissue of 15-day old P+ and P Col-0, drb1, drb2 and drb4 plants were carefully separated from each other and then ground into a fine powder under liquid nitrogen (LN2). One milliliter (1.0 mL) of 10% acetic acid (v/v in H2O) was added to the ground powder and the powder thoroughly resuspended via vigorous vortexing. The resulting resuspension was then centrifuged at 15,000 × g for 5 min at room temperature, and post centrifugation, 700 μL of the resulting supernatant was mixed with an equivalent volume of Ames Assay Buffer (6 parts 0.5% ammonium molybdite (v/v in H2O) to 1 part of 2.5% sulphuric acid (v/v in 10% acetic acid)) and incubated at room temperature for 1 h in the dark. The absorbance of each solution was determined using a spectrophotometer at wavelength 820 nm (A820) and the Pi content (μmol/gFW) of each sample subsequently determined via the construction of a Pi standard curve.

4.3. Total RNA Extraction for Quantitative Molecular Assessments

For each molecular assessment reported here, total RNA was extracted from four biological replicates (each biological replicate contained tissue sampled from eight individual plants) of 15-day old P+ and P Col-0, drb1, drb2 and drb4 plants using TRIzolTM Reagent according to the manufacturer’s (InvitrogenTM) instructions. The quality of the extracted total RNA was visually assessed via a standard electrophoresis approach on a 1.2% (w/v) ethidium bromide stained agarose gel and the quantity of total RNA extracted determined using a NanoDrop spectrophotometer (NanoDrop® ND-1000, Thermo Scientific, Australia).
For the synthesis of a miR399-specific complementary DNA (cDNA), 200 nanograms (ng) of total RNA was treated with 0.2 units (U) of DNase I (New England Biolabs, Australia) according to the manufacturer’s instructions. The DNase I-treated total RNA was next used as template for cDNA synthesis with 1.0 U of ProtoScript® II Reverse Transcriptase (New England Biolabs, Australia) and the cycling conditions of 1 cycle of 16 °C for 30 min; 60 cycles of 30 °C for 30 s, 42 °C for 30 s, and 50 °C for 2 s, and; 1 cycle of 85 °C for 5 min.
A global, high molecular weight cDNA library for gene expression quantification was constructed via the initial treatment of 5.0 μg of total RNA with 5.0 U of DNase I according to the manufacturer’s protocol (New England Biolabs, Australia). The DNase I-treated total RNA was next purified using an RNeasy Mini Kit (Qiagen, Australia) and 1.0 μg of this preparation used as template for cDNA synthesis along with 1.0 U of ProtoScript® II Reverse Transcriptase (New England Biolabs, Australia) and 2.5 mM of oligo dT(18), according to the manufacturer’s instructions.
All generated, single-stranded cDNAs were next diluted to a working concentration of 50 ng/μL in RNase-free H2O prior to their use as a template for the quantification of the abundance of either the miR399 sRNA or of gene transcripts. In addition, all RT-qPCRs used the same cycling conditions of 1 cycle of 95 °C for 10 min, followed by 45 cycles of 95 °C for 10 s and 60 °C for 15 s, and the GoTaq® qPCR Master Mix (Promega, Australia) was used as the fluorescent reagent for all performed RT-qPCR experiments. miR399 abundance and gene transcript expression was quantified using the 2ΔΔCT method with the small nucleolar RNA, snoR101, and UBIQUITIN10 (UBI10; AT4G05320) used as the respective internal controls to normalize the relative abundance of each assessed transcript. The sequence of each DNA oligonucleotide used in this study either for the synthesis of a miR399-specific cDNA, or to quantify transcript abundance via RT-qPCR is provided in Supplemental Table S1.

Supplementary Materials

The following are available online at https://www.mdpi.com/2223-7747/8/5/124/s1, Table S1: Sequences of the DNA oligonucleotides used in this study for the synthesis of miRNA-specific cDNAs and the RT-qPCR based quantification of miRNA abundance, miRNA target gene expression, or the assessment of standard gene expression.

Author Contributions

J.L.P., C.P.G. and A.L.E. conceived and designed the research. J.L.P. and J.M.O. performed the experiments and analyzed the data. J.L.P., C.P.G., J.M.O. and A.L.E. authored the manuscript and, J.L.P., C.P.G., J.M.O. and A.L.E. have read and approved the final version of the manuscript.

Funding

This research received no external funding.

Acknowledgments

The authors would like to thank fellow members of the Centre for Plant Science at the University of Newcastle for their guidance with plant growth care and RT-qPCR experiments.

Conflicts of Interest

The authors declare no conflict of interest.

References

  1. Abel, S.; Ticconi, C.A.; Delatorre, C.A. Phosphate sensing in higher plants. Planta 2002, 115, 1–8. [Google Scholar] [CrossRef]
  2. Hammond, J.P.; Bennett, M.J.; Bowen, H.C.; Broadley, M.R.; Eastwood, D.C.; May, S.T.; Rahn, C.; Swarup, R.; Woolaway, K.E.; White, P.J. Changes in Gene Expression in Arabidopsis Shoot during Phosphate Starvation and the Potential for Developing Smart Plants. Society 2003, 132, 578–596. [Google Scholar] [CrossRef] [PubMed]
  3. Raghothama, K.G. Phosphate transport and signaling. Curr. Opin. Plant Biol. 2000, 3, 182–187. [Google Scholar] [CrossRef]
  4. Hackenberg, M.; Shi, B.J.; Gustafson, P.; Langridge, P. Characterization of phosphorus-regulated miR399 and miR827 and their isomirs in barley under phosphorus- sufficient and phosphorus-deficient conditions. BMC Plant Biol. 2013, 13, 214. [Google Scholar] [CrossRef]
  5. Chiou, T.J.; Lin, S.I. Signaling network in sensing phosphate availability in plants. Annu. Rev. Plant Biol. 2011, 62, 185–206. [Google Scholar] [CrossRef] [PubMed]
  6. Wu, P.; Ma, L.; Hou, X.; Wang, M.; Wu, Y.; Liu, F.; Deng, X.W. Phosphate Starvation Triggers Distinct Alterations of Genome Expression in Arabidopsis Roots and Leaves. Plant Physiol. 2003, 132, 1260–1271. [Google Scholar] [CrossRef] [PubMed]
  7. Lin, S.I.; Chiang, S.F.; Lin, W.Y.; Chen, J.W.; Tseng, C.Y.; Wu, P.C.; Chiou, T.J. Regulatory network of microRNA399 and PHO2 by systemic signaling. Plant Physiol. 2008, 147, 732–746. [Google Scholar] [CrossRef] [PubMed]
  8. Jones, D.L. Organic acids in the rhizosphere—A critical review. Plant Soil 1998, 205, 25–44. [Google Scholar] [CrossRef]
  9. Poirier, Y.; Thoma, S.; Somerville, C.; Schiefelbein, J. Mutant of Arabidopsis deficient in xylem loading of phosphate. Plant Physiol. 1991, 97, 1087–1093. [Google Scholar] [CrossRef]
  10. Stefanovic, A.; Arpat, A.B.; Bligny, R.; Gout, E.; Vidoudez, C.; Bensimon, M.; Poirier, Y. Over-expression of PHO1 in Arabidopsis leaves reveals its role in mediating phosphate efflux. Plant J. 2011, 66, 689–699. [Google Scholar] [CrossRef]
  11. Wang, Y.; Ribot, C.; Rezzonico, E.; Poirier, Y. Structure and Expression Profile of the Arabidopsis PHO1 Gene Family Indicates a Broad Role in Inorganic Phosphate Homeostasis 1. Plant Physiol. 2004, 135, 400–411. [Google Scholar] [CrossRef]
  12. Delhaize, E.; Randall, P.J. Characterization of a Phosphate-Accumulator Mutant of Arabidopsis thaliana. Plant Physiol. 1995, 107, 207–213. [Google Scholar] [CrossRef]
  13. Dong, B.; Rengel, Z.; Delhaize, E. Uptake and translocation of phosphate by pho2 mutant and wild-type seedlings of Arabidopsis thaliana. Planta 1998, 205, 251–256. [Google Scholar] [CrossRef]
  14. Park, B.S.; Seo, J.S.; Chua, N.H. Nitrogen Limitation Adaptation recruits PHOSPHATE2 to target the phosphate transporter PT2 for degradation during the regulation of Arabidopsis phosphate homeostasis. Plant Cell 2014, 26, 454–464. [Google Scholar] [CrossRef]
  15. Aung, K. pho2, a Phosphate Overaccumulator, Is Caused by a Nonsense Mutation in a MicroRNA399 Target Gene. Plant Physiol. 2006, 141, 1000–1011. [Google Scholar] [CrossRef]
  16. Nilsson, L.; Müller, R.; Nielsen, T.H. (2007). Increased expression of the MYB-related transcription factor, PHR1, leads to enhanced phosphate uptake in Arabidopsis thaliana. Plant Cell Environ. 2007, 30, 1499–1512. [Google Scholar] [CrossRef]
  17. Rubio, V.; Linhares, F.; Solano, R.; Mart’in, A.C.; Iglesias, J.; Leyva, A.; Paz-Ares, J. A conserved MYB transcription factor involved in phosphate starvation signaling both in vascular plants and in unicellular algae. Genes Dev. 2001, 15, 2122–2133. [Google Scholar] [CrossRef] [Green Version]
  18. Fujii, H.; Chiou, T.J.; Lin, S.I.; Aung, K.; Zhu, J.K. A miRNA involved in phosphate-starvation response in Arabidopsis. Curr. Biol. 2005, 15, 2038–2043. [Google Scholar] [CrossRef]
  19. Hsieh, L.C.; Lin, S.I.; Shih, A.C.C.; Chen, J.W.; Lin, W.Y.; Tseng, C.Y.; Li, W.H.; Chiou, T.J. Uncovering small RNA-mediated responses to phosphate deficiency in Arabidopsis by deep sequencing. Plant Physiol. 2009, 151, 2120–2132. [Google Scholar] [CrossRef]
  20. Buhtz, A.; Springer, F.; Chappell, L.; Baulcombe, D.C.; Kehr, J. Identification and characterization of small RNAs from the phloem of Brassica napus. Plant J. 2008, 53, 739–749. [Google Scholar] [CrossRef]
  21. Pant, B.D.; Buhtz, A.; Kehr, J.; Scheible, W.R. MicroRNA399 is a long distance signal for the regulation of plant phosphate homeostasis. Plant J. 2008, 53, 731–738. [Google Scholar] [CrossRef]
  22. Wang, Y.-H.; Garvin, D.F.; Kochian, L.V. Rapid induction of regulatory and transporter genes in response to phosphorus, potassium, and iron deficiencies in tomato roots. Evidence for cross talk and root/rhizosphere-mediated signals. Plant Physiol. 2002, 130, 1361–1370. [Google Scholar] [CrossRef]
  23. Shin, R.; Berg, R.H.; Schachtman, D.P. Reactive oxygen species and root hairs in Arabidopsis root response to nitrogen, phosphorus and potassium deficiency. Plant Cell Physiol. 2005, 46, 1350–1357. [Google Scholar] [CrossRef]
  24. Kant, S.; Peng, M.; Rothstein, S.J. Genetic regulation by NLA and microRNA827 for maintaining nitrate-dependent phosphate homeostasis in Arabidopsis. PLoS Genet. 2011, 7, e1002021. [Google Scholar] [CrossRef] [PubMed]
  25. Liang, G.; He, H.; Yu, D. Identification of Nitrogen Starvation-Responsive MicroRNAs in Arabidopsis thaliana. PLoS ONE 2012, 7, e48951. [Google Scholar] [CrossRef] [PubMed]
  26. Doerner, P. Phosphate starvation signaling: A threesome controls systemic Pi homeostasis. Curr. Opin. Plant Biol. 2008, 11, 536–540. [Google Scholar] [CrossRef]
  27. Bari, R.; Pant, B.D.; Stitt, M.; Golm, S.P. PHO2, MicroRNA399, and PHR1 Define a Phosphate-Signaling Pathway in Plants. Plant Physiol. 2006, 141, 988–999. [Google Scholar] [CrossRef] [PubMed]
  28. Berkowitz, O.; Jost, R.; Kollehn, D.O.; Fenske, R.; Finnegan, P.M.; O’Brien, P.A.; Hardy, G.E.S.J.; Lambers, H. Acclimation responses of Arabidopsis thaliana to sustained phosphite treatments. J. Exp. Bot. 2013, 64, 1731–1743. [Google Scholar] [CrossRef] [PubMed]
  29. Chiou, T.J.; Aung, K.; Lin, S.I.; Wu, C.C.; Chiang, S.F.; Su, C.L. Regulation of phosphate homeostasis by MicroRNA in Arabidopsis. Plant Cell 2006, 18, 412–421. [Google Scholar] [CrossRef] [PubMed]
  30. Huang, T.K.; Han, C.L.; Lin, S.I.; Chen, Y.J.; Tsai, Y.C.; Chen, Y.R.; Chen, J.W.; Lin, W.Y.; Chen, P.M.; Liu, T.Y.; et al. Identification of downstream components of ubiquitin-conjugating enzyme PHOSPHATE2 by quantitative membrane proteomics in Arabidopsis roots. Plant Cell 2013, 25, 4044–4060. [Google Scholar] [CrossRef]
  31. Rouached, H.; Arpat, A.B.; Poirier, Y. Regulation of phosphate starvation responses in plants: Signaling players and cross-talks. Mol. Plant 2010, 3, 288–299. [Google Scholar] [CrossRef] [PubMed]
  32. Martin, A.C.; Del Pozo, J.C.; Iglesias, J.; Rubio, V.; Solano, R.; De La Peňa, A.; Leyva, A.; Paz-Ares, J. Influence of cytokinins on the expression of phosphate starvation responsive genes in Arabidopsis. Plant J. 2000, 24, 559–567. [Google Scholar] [CrossRef] [PubMed]
  33. Franco-Zorrilla, J.M.; Valli, A.; Todesco, M.; Mateos, I.; Puga, M.I.; Rubio-Somoza, I.; Leyva, A.; Weigel, D.; García, J.A.; Paz-Ares, J. Target mimicry provides a new mechanism for regulation of microRNA activity. Nat. Genet. 2007, 39, 1033–1037. [Google Scholar] [CrossRef] [PubMed]
  34. Mallory, A.C.; Bouché, N. MicroRNA-directed regulation: To cleave or not to cleave. Trends Plant Sci. 2008, 13, 359–367. [Google Scholar] [CrossRef] [PubMed]
  35. Han, M.H.; Goud, S.; Song, L.; Fedoroff, N. (2004). The Arabidopsis double-stranded RNA-binding protein HYL1 plays a role in microRNA-mediated gene regulation. Proc. Natl. Acad. Sci. USA 2004, 101, 1093–1098. [Google Scholar] [CrossRef]
  36. Eamens, A.L.; Smith, N.A.; Curtin, S.J.; Wang, M.B.; Waterhouse, P.M. The Arabidopsis thaliana double-stranded RNA binding protein DRB1 directs guide strand selection from microRNA duplexes. RNA 2009, 15, 2219–2235. [Google Scholar] [CrossRef]
  37. Eamens, A.L.; Kim, K.W.; Curtin, S.J.; Waterhouse, P.M. DRB2 is required for microRNA biogenesis in Arabidopsis thaliana. PLoS ONE 2012, 7, e35933. [Google Scholar] [CrossRef]
  38. Eamens, A.L.; Kim, K.W.; Waterhouse, P.M. DRB2, DRB3 and DRB5 function in a non-canonical microRNA pathway in Arabidopsis thaliana. Plant Signal. Behav. 2012, 7, 1224–1229. [Google Scholar] [CrossRef]
  39. Rajagopalan, R.; Vaucheret, H.; Trejo, J.; Bartel, D.P. A diverse and evolutionarily fluid set of microRNAs in Arabidopsis thaliana. Genes Dev. 2006, 20, 3407–3425. [Google Scholar] [CrossRef]
  40. Pélissier, T.; Clavel, M.; Chaparro, C.; Pouch-Pélissier, M.N.; Vaucheret, H.; Deragon, J.M. Double-stranded RNA binding proteins DRB2 and DRB4 have an antagonistic impact on polymerase IV-dependent siRNA levels in Arabidopsis. RNA 2011, 17, 1502–1510. [Google Scholar] [CrossRef]
  41. Lu, C.; Fedoroff, N. A mutation in the Arabidopsis HYL1 gene encoding a dsRNA binding protein affects responses to abscisic acid, auxin, and cytokinin. Plant Cell 2000, 12, 2351–2366. [Google Scholar] [CrossRef]
  42. Curtin, S.J.; Watson, J.M.; Smith, N.A.; Eamens, A.L.; Blanchard, C.L.; Waterhouse, P.M. The roles of plant dsRNA-binding proteins in RNAi-like pathways. FEBS Lett. 2008, 582, 2753–2760. [Google Scholar] [CrossRef] [Green Version]
  43. Luo, Q.J.; Mittal, A.; Jia, F.; Rock, C.D. An autoregulatory feedback loop involving PAP1 and TAS4 in response to sugars in Arabidopsis. Plant Mol. Biol. 2012, 80, 117–129. [Google Scholar] [CrossRef]
  44. Williamson, L.C.; Ribrioux, S.; Fitter, A.H.; Leyser, H.M.O. Phosphate availability regulates root system architecture in Arabidopsis. Plant Physiol. 2001, 126, 875–882. [Google Scholar] [CrossRef]
  45. Schachtman, D.P.; Reid, R.J.; Ayling, S.M. Phosphorus Uptake by Plants: From Soil to Cell. Plant Physiol. 1998, 116, 447–453. [Google Scholar] [CrossRef] [Green Version]
  46. Yang, X.J.; Finnegan, P.M. Regulation of phosphate starvation responses in higher plants. Ann. Bot. 2010, 105, 513–526. [Google Scholar] [CrossRef] [Green Version]
  47. Remy, E.; Cabrito, T.R.; Batista, R.A.; Teixeira, M.C.; Sá-Correia, I.; Duque, P. The Pht1;9 and Pht1;8 transporters mediate inorganic phosphate acquisition by the Arabidopsis thaliana root during phosphorus starvation. New Phytol. 2012, 195, 356–371. [Google Scholar] [CrossRef]
  48. Vazquez, F.; Vaucheret, H.; Rajagopalan, R.; Lepers, C.; Gasciolli, V.; Mallory, A.C.; Hilbert, J.L.; Bartel, D.P.; Crété, P. Endogenous trans-acting siRNAs regulate the accumulation of Arabidopsis mRNAs. Mol. Cell 2004, 16, 69–79. [Google Scholar] [CrossRef]
  49. Kurihara, Y.; Takashi, Y.; Watanabe, Y. The interaction between DCL1 and HYL1 is important for efficient and precise processing of pri-miRNA in plant microRNA biogenesis. RNA 2006, 12, 206–212. [Google Scholar] [CrossRef]
  50. Jiang, C.; Gao, X.; Liao, L.; Harberd, N.P.; Fu, X. Phosphate starvation root architecture and anthocyanin accumulation responses are modulated by the gibberellin-DELLA signaling pathway in Arabidopsis. Plant Physiol. 2007, 145, 1460–1470. [Google Scholar] [CrossRef]
  51. Shin, H.; Shin, H.S.; Dewbre, G.R.; Harrison, M.J. Phosphate transport in Arabidopsis: Pht1;1 and Pht1;4 play a major role in phosphate acquisition from both low- and high-phosphate environments. Plant J. 2004, 39, 629–642. [Google Scholar] [CrossRef] [PubMed]
  52. Reis, R.S.; Hart-Smith, G.; Eamens, A.L.; Wilkins, M.R.; Waterhouse, P.M. Gene regulation by translational inhibition is determined by Dicer partnering proteins. Nat. Plants 2015, 1, 14027. [Google Scholar] [CrossRef]
  53. Yang, L.; Wu, G.; Poethig, R.S. Mutations in the GW-repeat protein SUO reveal a developmental function for microRNA-mediated translational repression in Arabidopsis. Proc. Natl. Acad. Sci. USA 2012, 109, 315–320. [Google Scholar] [CrossRef] [PubMed]
  54. Xu, M.; Hu, T.; Zhao, J.; Park, M.Y.; Earley, K.W.; Wu, G.; Yang, L.; Poethig, R.S. Developmental Functions of miR156-Regulated SQUAMOSA PROMOTER BINDING PROTEIN-LIKE (SPL) Genes in Arabidopsis thaliana. PLoS Genet. 2016, 12, e1006263. [Google Scholar] [CrossRef]
  55. Adenot, X.; Elmayan, T.; Lauressergues, D.; Boutet, S.; Bouché, N.; Gasciolli, V.; Vaucheret, H. DRB4-Dependent TAS3 trans-Acting siRNAs Control Leaf Morphology through AGO7. Curr. Biol. 2006, 16, 927–932. [Google Scholar] [CrossRef] [PubMed]
  56. Nakazawa, Y.; Hiraguri, A.; Moriyama, H.; Fukuhara, T. The dsRNA-binding protein DRB4 interacts with the Dicer-like protein DCL4 in vivo and functions in the trans-acting siRNA pathway. Plant Mol. Biol. 2007, 63, 777–785. [Google Scholar] [CrossRef] [PubMed]
  57. Lichtenthaler, H.K.; Wellburn, A.R. Determination of total carotenoids and chlorophylls a and b of leaf extracts in different solvents. Biochem. Soc. Trans. 1983, 11, 591–592. [Google Scholar] [CrossRef]
Figure 1. The aerial tissue phenotypes displayed by 15-day old Arabidopsis plant lines Col-0, drb1, drb2 and drb4 post exposure to a 7-day period of PO4 starvation. (A) The aerial tissue phenotypes expressed by non-stressed (top row of panels) and PO4-stressed (bottom row of panels) 15-day old Col-0, drb1, drb2 and drb4 plants. Scale bar = 1cm. (B) Quantification of the shoot mass of 8-day old Col-0, drb1, drb2 and drb4 seedlings germinated and cultivated under standard growth conditions. (C) The shoot mass of non-stressed and PO4-stressed 15-day old Col-0, drb1, drb2 and drb4 plants. (D) The rosette area of non-stressed and PO4-stressed 15-day old Arabidopsis lines, Col-0, drb1, drb2 and drb4. (E) Anthocyanin accumulation in the shoot tissues of 15-day old Col-0, drb1, drb2 and drb4 plants cultivated under standard growth conditions, or for 7-days under PO4 starvation. (F and G) Chlorophyll a (F) and chlorophyll b (G) abundance in the aerial tissues of non-stressed and PO4-stressed Col-0, drb1, drb2 and drb4 plants. (B-G) Error bars represent the standard deviation of four biological replicates and each biological replicate consisted of a pool of twelve individual plants. The presence of an asterisk above a column represents a statistically significant difference either between non-stressed Col-0 plants and each assessed drb mutant post cultivation under either a non-stressed or stressed growth regime (B) or between the non-stressed and PO4-stressed sample of each plant line (C-G) (p-value: * < 0.05; ** < 0.005; *** < 0.001).
Plants 08 00124 g001
Figure 2. Molecular profiling of the miR399/PHO2 expression module in the aerial tissues of non-stressed and PO4-stressed Col-0, drb1, drb2 and drb4 plants. (A) RT-qPCR assessment of the expression of the PO4 responsive transcription factor PHR1 in the aerial tissues of non-stressed and PO4-stressed Col-0, drb1, drb2 and drb4 plants. (B to F) RT-qPCR profiling of miR399 precursor transcript abundance in the aerial tissues of non-stressed and PO4-stressed Col-0, drb1, drb2 and drb4 plants, including precursors PRE-MIR399A (B), PRE-MIR399C (C), PRE-MIR399D (D), PRE-MIR399E (E) and PRE-MIR399F (F). (G) Quantification of miR399 abundance in the aerial tissues of non-stressed and PO4-stressed Col-0, drb1, drb2 and drb4 plants. (H) Assessment of the expression of the non-cleavable decoy of miR399 activity, IPS1, via RT-qPCR in the aerial tissues of non-stressed and PO4-stressed Arabidopsis lines, Col-0, drb1, drb2 and drb4. (I) RT-qPCR analysis of the expression of the miR399 target gene, PHO2, in the aerial tissues of non-stressed and PO4-stressed Arabidopsis lines, Col-0, drb1, drb2 and drb4. (A–I) Error bars represent the standard deviation of four biological replicates and each biological replicate consisted of a pool of twelve individual plants. Due to the vastly different levels of each assessed transcript, the relative expression value for each plant line/growth regime is provided above the corresponding column. The presence of an asterisk above a column represents a statistically significant difference between non-stressed Col-0 plants and each of the assessed drb mutant lines, post cultivation under either a standard or stressed growth regime (p-value: * < 0.05; ** < 0.005; *** < 0.001).
Plants 08 00124 g002
Figure 3. The root system phenotypes displayed by 15-day old Arabidopsis plant lines Col-0, drb1, drb2 and drb4 post exposure to a 7-day period of PO4 starvation. (A) The root system phenotypes expressed by non-stressed (top row of panels) and PO4-stressed (bottom row of panels) 15-day old Col-0, drb1, drb2 and drb4 plants. Scale bar = 1cm. (B) Quantification of the root mass of 8-day old Col-0, drb1, drb2 and drb4 seedlings cultivated under standard growth conditions. (C) The root mass of non-stressed and PO4-stressed 15-day old Col-0, drb1, drb2 and drb4 plants. (D) The primary root length of non-stressed and PO4-stressed 15-day old Arabidopsis lines, Col-0, drb1, drb2 and drb4. (E) The number of lateral roots formed from the primary root of 15-day old Col-0, drb1, drb2 and drb4 plants cultivated under standard growth conditions, or post the 7-day PO4 starvation period. (B–E) Error bars represent the standard deviation of four biological replicates and each biological replicate consisted of a pool of twelve individual plants. The presence of an asterisk above a column represents a statistically significant difference either between non-stressed Col-0 plants and each assessed drb mutant post cultivation under either a non-stressed or stressed growth regime (B) or between the non-stressed and PO4-stressed sample of each plant line (C-E) (p-value: * < 0.05; ** < 0.005; *** < 0.001).
Plants 08 00124 g003
Figure 4. Molecular profiling of the miR399/PHO2 expression module in the root system of non-stressed and PO4-stressed Col-0, drb1, drb2 and drb4 plants. (A) RT-qPCR assessment of the expression of the PO4 responsive transcription factor PHR1 in the roots of non-stressed and PO4-stressed Col-0, drb1, drb2 and drb4 plants. (B–D) RT-qPCR profiling of miR399 precursor transcript abundance in the root system of non-stressed and PO4-stressed Col-0, drb1, drb2 and drb4 plants, including precursors PRE-MIR399A (B), PRE-MIR399C (C) and PRE-MIR399D (D). (E) Quantification of miR399 abundance in the roots of non-stressed and PO4-stressed Col-0, drb1, drb2 and drb4 plants. (F) Assessment of IPS1 transcript abundance in the roots of non-stressed and PO4-stressed Arabidopsis lines, Col-0, drb1, drb2 and drb4. (G) RT-qPCR analysis of PHO2 expression, the target gene of miR399, in the root system of non-stressed and PO4-stressed Arabidopsis lines, Col-0, drb1, drb2 and drb4. (A–G) Error bars represent the standard deviation of four biological replicates and each biological replicate consisted of a pool of twelve individual plants. Due to the vastly different level of each assessed transcript, the relative expression value for each plant line/growth regime is provided above the corresponding column. The presence of an asterisk above a column represents a statistically significant difference between non-stressed Col-0 plants and each of the assessed drb mutant lines, post cultivation under either a standard or stressed growth regime (p-value: * < 0.05; ** < 0.005; *** < 0.001).
Plants 08 00124 g004
Figure 5. Pi content and PO4 transporter gene expression in the shoot and root tissue of 15-day old Arabidopsis plant lines Col-0, drb1, drb2 and drb4 cultivated under either a standard growth regime or post-exposure to a 7-day period of PO4 starvation. (A,B) Comparison of the Pi content of the shoots (A) and roots (B) of 15-day old non-stressed and PO4-stressed Col-0, drb1, drb2 and drb4 plants. (C) Pi content shoot (light blue) to root (dark blue) ratio of 15-day old Col-0, drb1, drb2 and drb4 plants cultivated under standard growth conditions. (D) Pi content shoot (light gold) to root (dark gold) ratio of 15-day old Col-0, drb1, drb2 and drb4 plants post 7-days of PO4 starvation. (E,F) Quantification of PHT1;4 expression in the shoot (E) and root (F) tissues of 15-day old Col-0, drb1, drb2 and drb4 plants cultivated under standard growth conditions or post a 7-day period of PO4 starvation. (G,H) RT-qPCR assessment of PHT1;8 transcript abundance in the shoots (G) and roots (H) of 15-day old Col-0, drb1, drb2 and drb4 plants cultivated under either standard or PO4 stress conditions. (I,J) PHT1;9 expression in the shoot (I) and root (J) material of non-stressed or PO4-stressed Col-0, drb1, drb2 and drb4 plants at 15 days of age. (A,B,E–J) Error bars represent the standard deviation of four biological replicates and each biological replicate consisted of a pool of twelve individual plants. Due to the vastly different levels of each assessed transcript, the relative expression value for each plant line/growth regime is provided above the corresponding column. The presence of an asterisk above a column represents a statistically significant difference between the non-stressed and PO4-stressed sample of each plant line (A,B) or between non-stressed Col-0 plants and each drb mutant line, post cultivation under either a standard or stressed growth regime (E–J) (p-value: * < 0.05; ** < 0.005; *** < 0.001).
Plants 08 00124 g005

