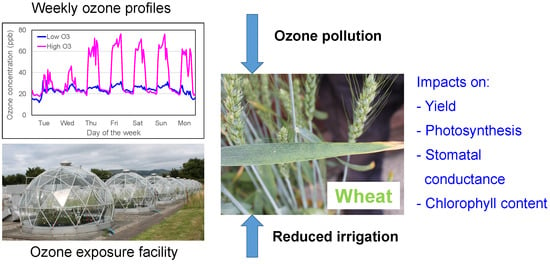
Can Reduced Irrigation Mitigate Ozone Impacts on an Ozone-Sensitive African Wheat Variety?


Centre for Ecology & Hydrology, Environment Centre Wales, Deiniol Road, Bangor, Gwynedd LL57 2UW, UK
*
Author to whom correspondence should be addressed.
Plants 2019, 8(7), 220; https://doi.org/10.3390/plants8070220
Submission received: 10 June 2019
/
Revised: 5 July 2019
/
Accepted: 10 July 2019
/
Published: 12 July 2019
(This article belongs to the Special Issue Ozone Tolerance Mechanisms)
Abstract
:Ground-level ozone (O3) pollution is known to adversely affect the production of O3-sensitive crops such as wheat. The magnitude of impact is dependent on the accumulated stomatal flux of O3 into the leaves. In well-irrigated plants, the leaf pores (stomata) tend to be wide open, which stimulates the stomatal flux and therefore the adverse impact of O3 on yield. To test whether reduced irrigation might mitigate O3 impacts on flag leaf photosynthesis and yield parameters, we exposed an O3-sensitive Kenyan wheat variety to peak concentrations of 30 and 80 ppb O3 for four weeks in solardomes and applied three irrigation regimes (well-watered, frequent deficit, and infrequent deficit irrigation) during the flowering and grain filling stage. Reduced irrigation stimulated 1000-grain weight and harvest index by 33% and 13%, respectively (when O3 treatments were pooled), which compensated for the O3-induced reductions observed in well-watered plants. Whilst full irrigation accelerated the O3-induced reduction in photosynthesis by a week, such an effect was not observed for the chlorophyll content index of the flag leaf. Further studies under field conditions are required to test whether reduced irrigation can be applied as a management tool to mitigate adverse impacts of O3 on wheat yield.
1. Introduction
Tropospheric ozone (O3) is a secondary pollutant formed in the atmosphere by chemical reactions between the O3 precursors carbon monoxide, nitrogen oxides, methane, and non-methane volatile organic compounds in the presence of solar radiation [1,2]. Since the industrial revolution, concentrations over much of the Earth’s land surface have more than doubled due to anthropogenic emissions from vehicles, industry, and agriculture [1,2,3,4,5]. Since 2000, concentrations have started to decline in the eastern United States and parts of Europe due to precursor emission controls. However, O3 concentrations have been increasing rapidly in developing regions such as south and east Asia [6,7] and are predicted to continue to increase in the coming decades unless more stringent air pollution and climate change controls are implemented in those regions [8]. Global modelling simulation and satellite data also reveal increases in the last four decades over central Africa [7]. During biomass burning season, surface O3 concentrations can reach peaks up to 70 ppb in Rwanda [9] and 80 ppb in South Africa [10].
O3 is absorbed into leaves via the stomatal pores and is a powerful oxidant. Once inside the leaves, it reacts with biomolecules to form reactive oxygen species (ROS), triggering various cellular responses [11]. Ascorbate/ascorbic acid is thought to play a central role in scavenging ROS and signal transduction pathways, but the exact mechanism is still not fully understood [12]. Cellular and signalling responses to O3 vary with concentration, differ for chronic and acute O3 exposure, and vary among species [11]. Once defence mechanisms are overwhelmed, this can ultimately lead to programmed cell death and a reduced extent and duration of functional green leaf area, producing less photosynthate for seed fill [11]. O3 pollution reduces the yield of many crops, including the staple crops wheat, rice, and soybean [13,14,15], and therefore contributes to the yield gap [16]. Recently, it was estimated that O3 reduces the annual global yield of soybean (12.4%), wheat (7.1%), maize (6.1%), and rice (4.4%), adding up to 227 Tg of lost yield [16]. Areas at high risk of yield losses due to O3 are often also at risk of high losses from other biotic and abiotic stresses [16].
Producing adequate food to meet future global demand is a major challenge [17,18,19]. There is a need to develop crop cultivars or varieties that have both high productivity in future climates and high tolerance of biotic and abiotic stresses [16,19,20]. O3 is currently not one of the abiotic stresses included in crop breeding programmes [11,16,21], but crop ideotypes with tolerance of multiple stresses including O3 have been described to highlight how O3 effects should be included [16]. Sub-Saharan Africa (SSA) is the region at greatest food security risk in the future because, by 2050, its population will increase 2.5-fold, and demand for cereals will approximately triple [19].
Whilst improved irrigation is expected to improve crop yield in water-limited regions, it will also stimulate the stomatal uptake of O3 in those regions, as the leaf pores tend to be wide open in well-irrigated plants, resulting in enhanced yield loss due to O3 pollution [22]. For example, expanding irrigation in India and China will increase wheat yield losses due to O3 in major wheat growing areas of these countries at current O3 levels, with effects potentially even higher as O3 concentrations rise in coming decades [22]. The stomatal uptake of O3 (or Phytotoxic O3 Dose) is highest when soil moisture, climate conditions such as light intensity, vapour pressure deficit, and temperature are not limiting the aperture of the stomata [23,24,25]. The challenge will be to manage the amount of irrigation sustainably such that drought stress can be alleviated without significant enhancement of O3 stress [16]. In rice-growing areas, alternate wetting and drying irrigation (AWD) has been implemented in an attempt to reduce water usage and methane emissions [26,27]. AWD with moderate water stress increased the growth and yield of rice and reduced stomatal conductance (gs) compared to continuously flooded crops [28]. Reduced gs will lead to a reduced O3 uptake, hence AWD might also be beneficial for mitigating the adverse impacts of O3 on rice yield. Similarly, reduced irrigation of wheat either stimulated both yield and crop water use efficiency (WUE) [29,30,31] or stimulated WUE without a yield penalty [32,33].
Other methods applied to enhance the sustainable use of water in agriculture include deficit irrigation (DI) or partial root-zone drying (PRD) [34,35]. With DI, the entire root zone receives less water than the potential evapo-transpiration. With PRD, only part of the root zone is irrigated, and the other part is left to dry to a predetermined level before the next irrigation. PRD enhances WUE of plants, potentially due to increased root–shoot surface ratio and the root hydraulic conductivity [34]. With PDR, the induction of ABA-based root-to-shoot chemical signalling might be responsible for the increase in WUE [36,37,38,39,40]. However, ABA-induced stomatal closure may not always lead to increased WUE at the whole plant level, hence growers must adapt their irrigation scheduling according to crop requirements [41]. Determining the cause of enhanced crop yields under deficit irrigation (AWD, DI or PRD) remains challenging [42].
The aim of the current study was to test whether reduced irrigation (i.e., DI) can potentially be used as a management tool to reduce the adverse impact of O3 on wheat. We hypothesised that reduced irrigation will reduce gs and therefore the accumulated uptake of O3, resulting in a delay in an O3-induced decline in flag leaf photosynthesis and an improved yield compared to full irrigation. An O3-sensitive African variety of wheat [43] was exposed to low (daylight mean O3 concentration of 25 ppb, with peak concentrations aimed at 30 ppb) and high O3 (daylight mean O3 concentration of 45 ppb, with peak concentrations aimed at 80 ppb) for five days a week in hemi-spherical glasshouses for four weeks during flowering and grain fill. The high O3 treatment represents surface peak O3 concentrations observed in South Africa during periods of biomass burning [10]. Plants were either well-watered every day or received a reduced amount of water, either reduced every day (frequent deficit) or much reduced water every other day and well-watered the other day (infrequent deficit). Gas exchange and chlorophyll content index of the flag leaf were monitored weekly, and yield parameters were determined on maturity. In this study, reduced irrigation delayed the O3-induced reduction of photosynthesis of the flag leaf. Reduced irrigation did not significantly affect grain yield. However, it stimulated 1000-grain weight and harvest index, which compensated for the O3-induced reductions in 1000-grain weight and harvest index observed in well-watered plants. Potentially, reduced irrigation can be used as crop management tool to reduce the adverse impacts of O3 on wheat yield parameters. However, application and further validation is required under field conditions.
2. Results
2.1. Soil Moisture
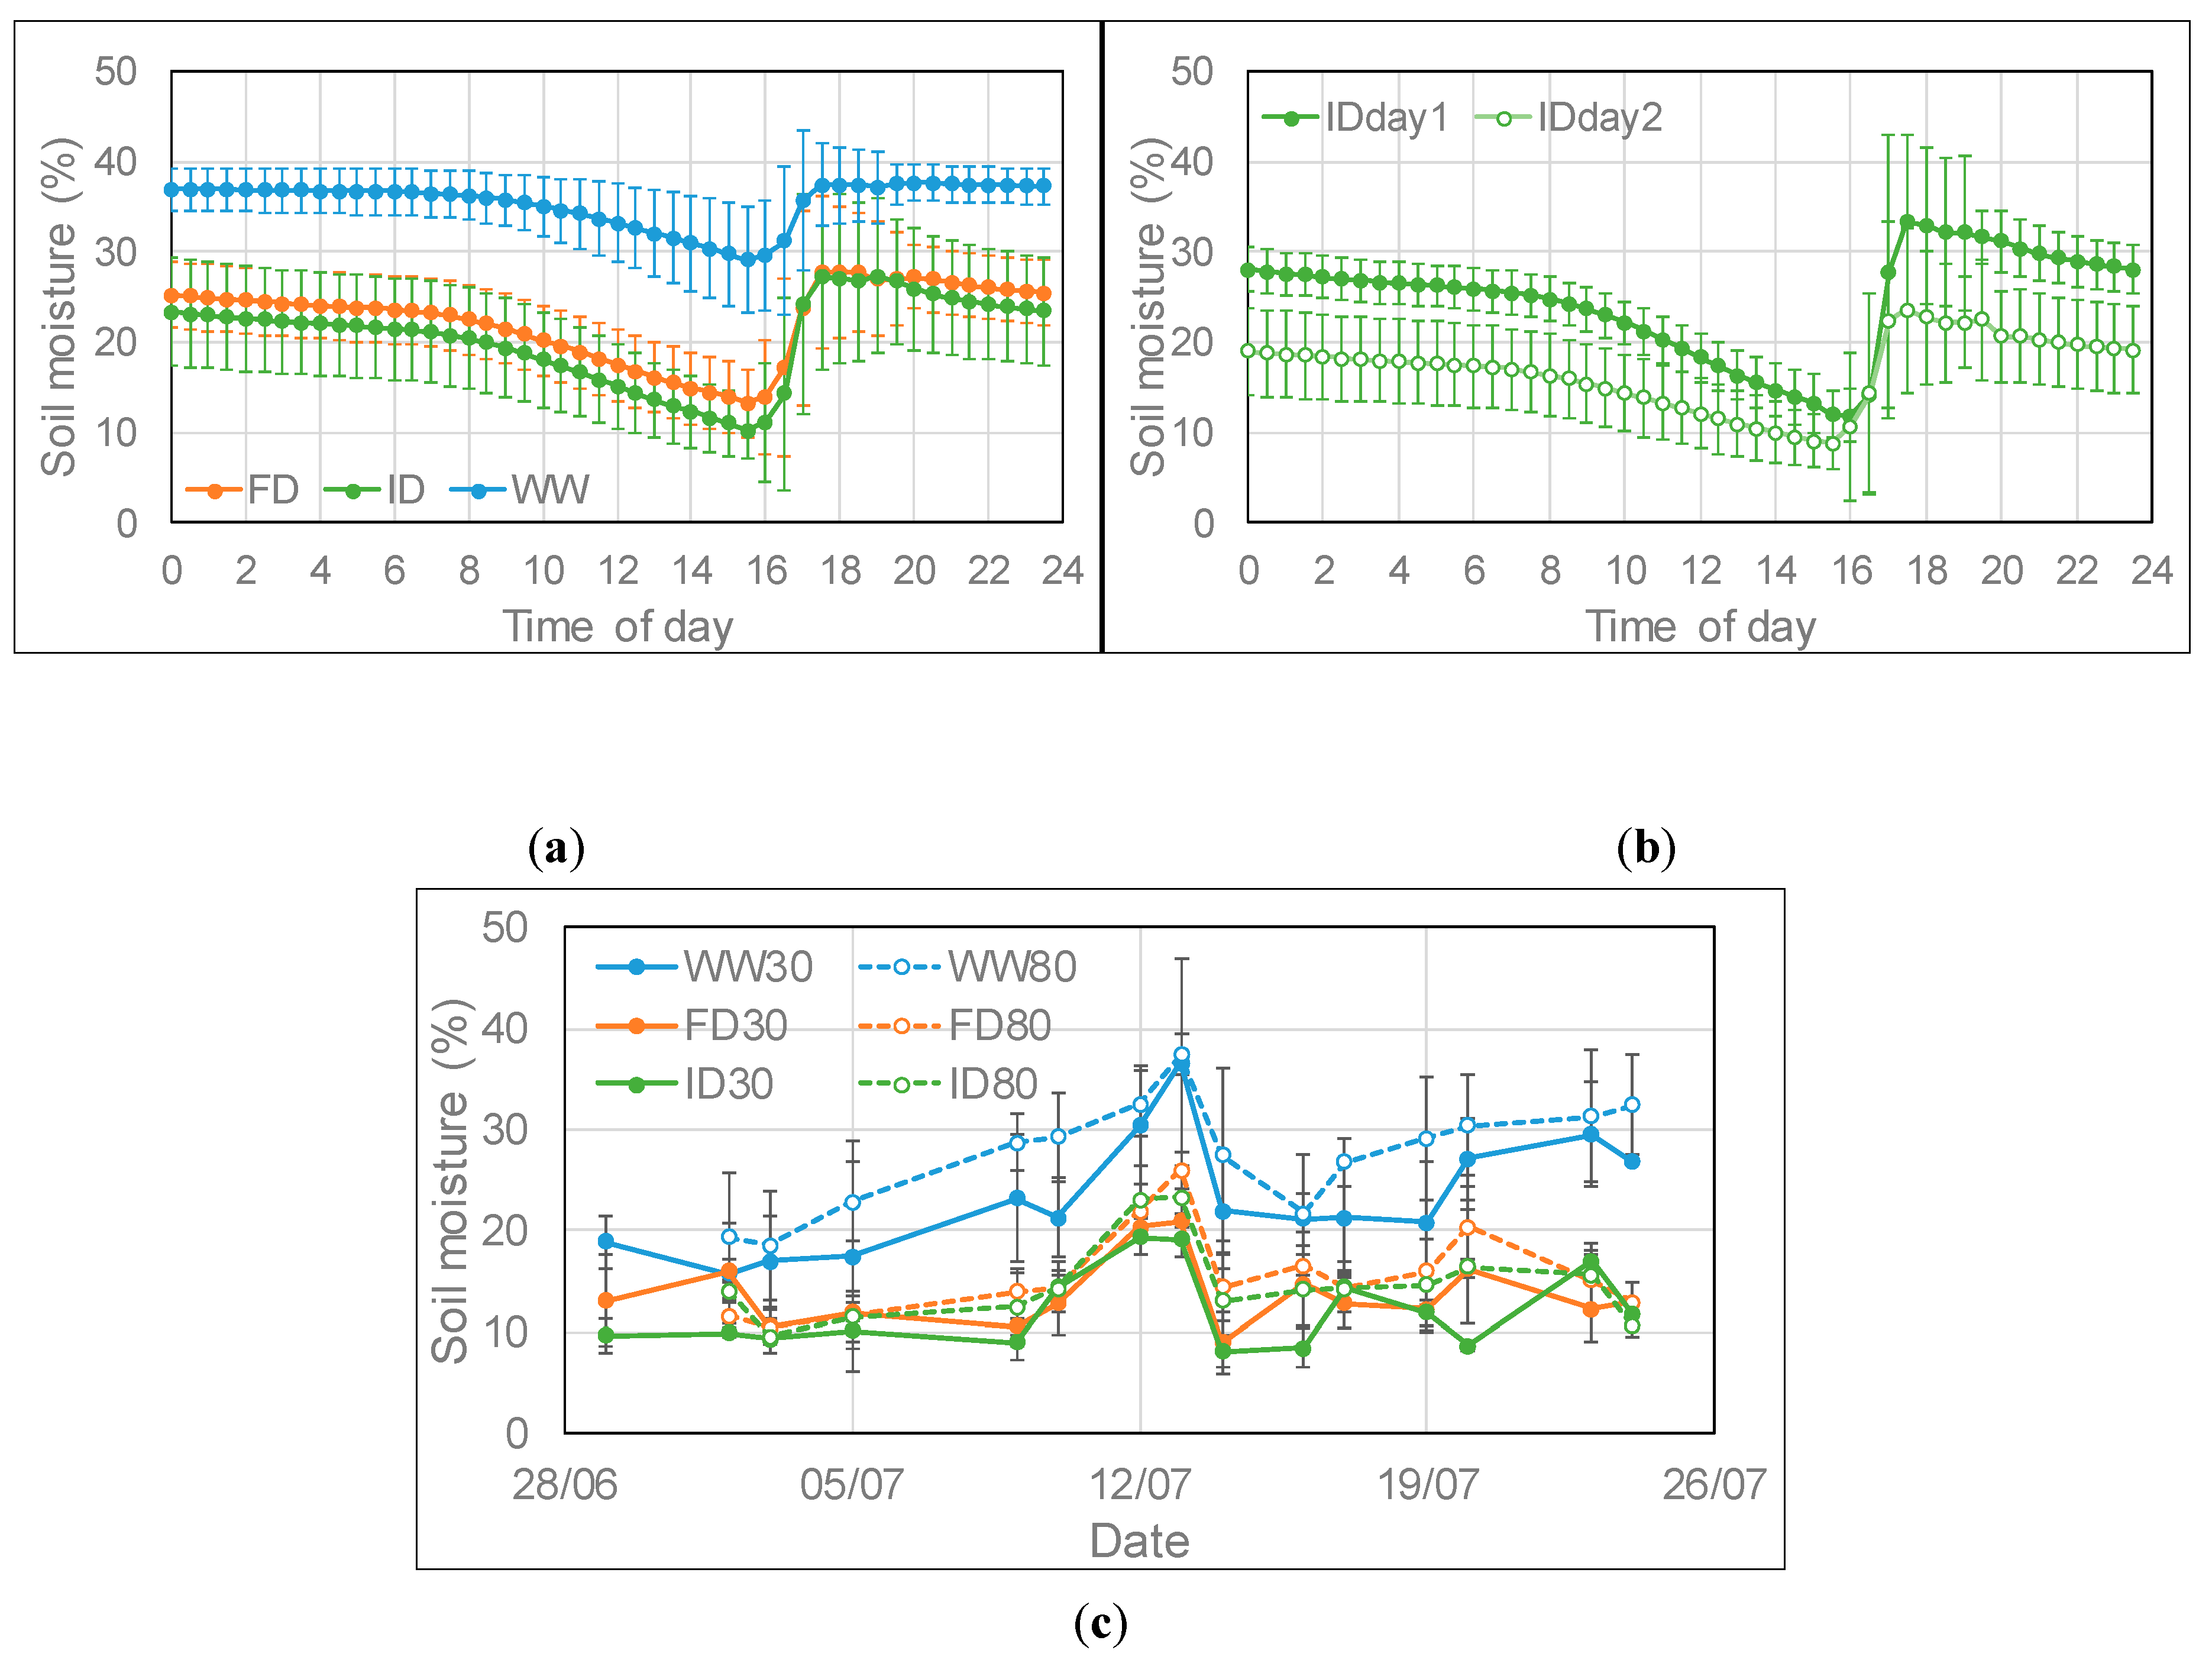
After watering in the well-watered (WW) treatment at low O3, the soil moisture remained rather constant throughout the evening and night and then declined steadily during the day from 8:00 onward until the following watering event (Figure 1a). Field capacity was reached at a soil moisture of about 38% as indicated by the saturation level in WW plants, a level at which water was starting to drain from the bottom of the containers. In the reduced watering treatments at low O3, the soil moisture declined slightly during the evening and night and then on average declined linearly at a higher rate than in the WW treatment (Figure 1a). The average decline in the WW, frequent deficit (FD) and infrequent deficit (ID) irrigation regimes was 0.97%, 1.27% and 1.39% per hour respectively between 8:00 and 15:30; for the ID irrigation the average decline was 1.75% on day 1 and 1.05% per hour on day 2 after full watering (Figure 1b). Between 14:30 and 15:00, the average measured soil moisture of the FD and ID treatment for the combined O3 treatments was 59% and 54% respectively of the WW treatment (Figure 1c), with respectively 29% and 20% less water being supplied than in the WW treatment. The first two weeks of the irrigation period were marked by unusually warm weather, hence some watering was required on the second day after full watering in the ID treatment to prevent drought stress occurring. From 11–13 July, it was rather cool, hence much less watering was required and a peak in soil moisture content was observed (Figure 1c). On average, the soil moisture was higher in high than low O3 containers due to the development of visible leaf damage and early senescence at high O3 (as indicated below by the early decline in chlorophyll content of the flag leaf at high compared to low O3). At mid-afternoon, the soil moisture content was on average 17%, 14%, and 22% higher at high compared to low O3 for the WW, FD, and ID treatment, respectively (Figure 1c), with less watering being required at high O3 as leaf injury started to develop. On average during the experimental period, 7%, 5%, and 9% less water was supplied to WW, FD, and ID containers, respectively, at high compared to low O3.
2.2. Stomatal Conductance (gs) of the Flag Leaf
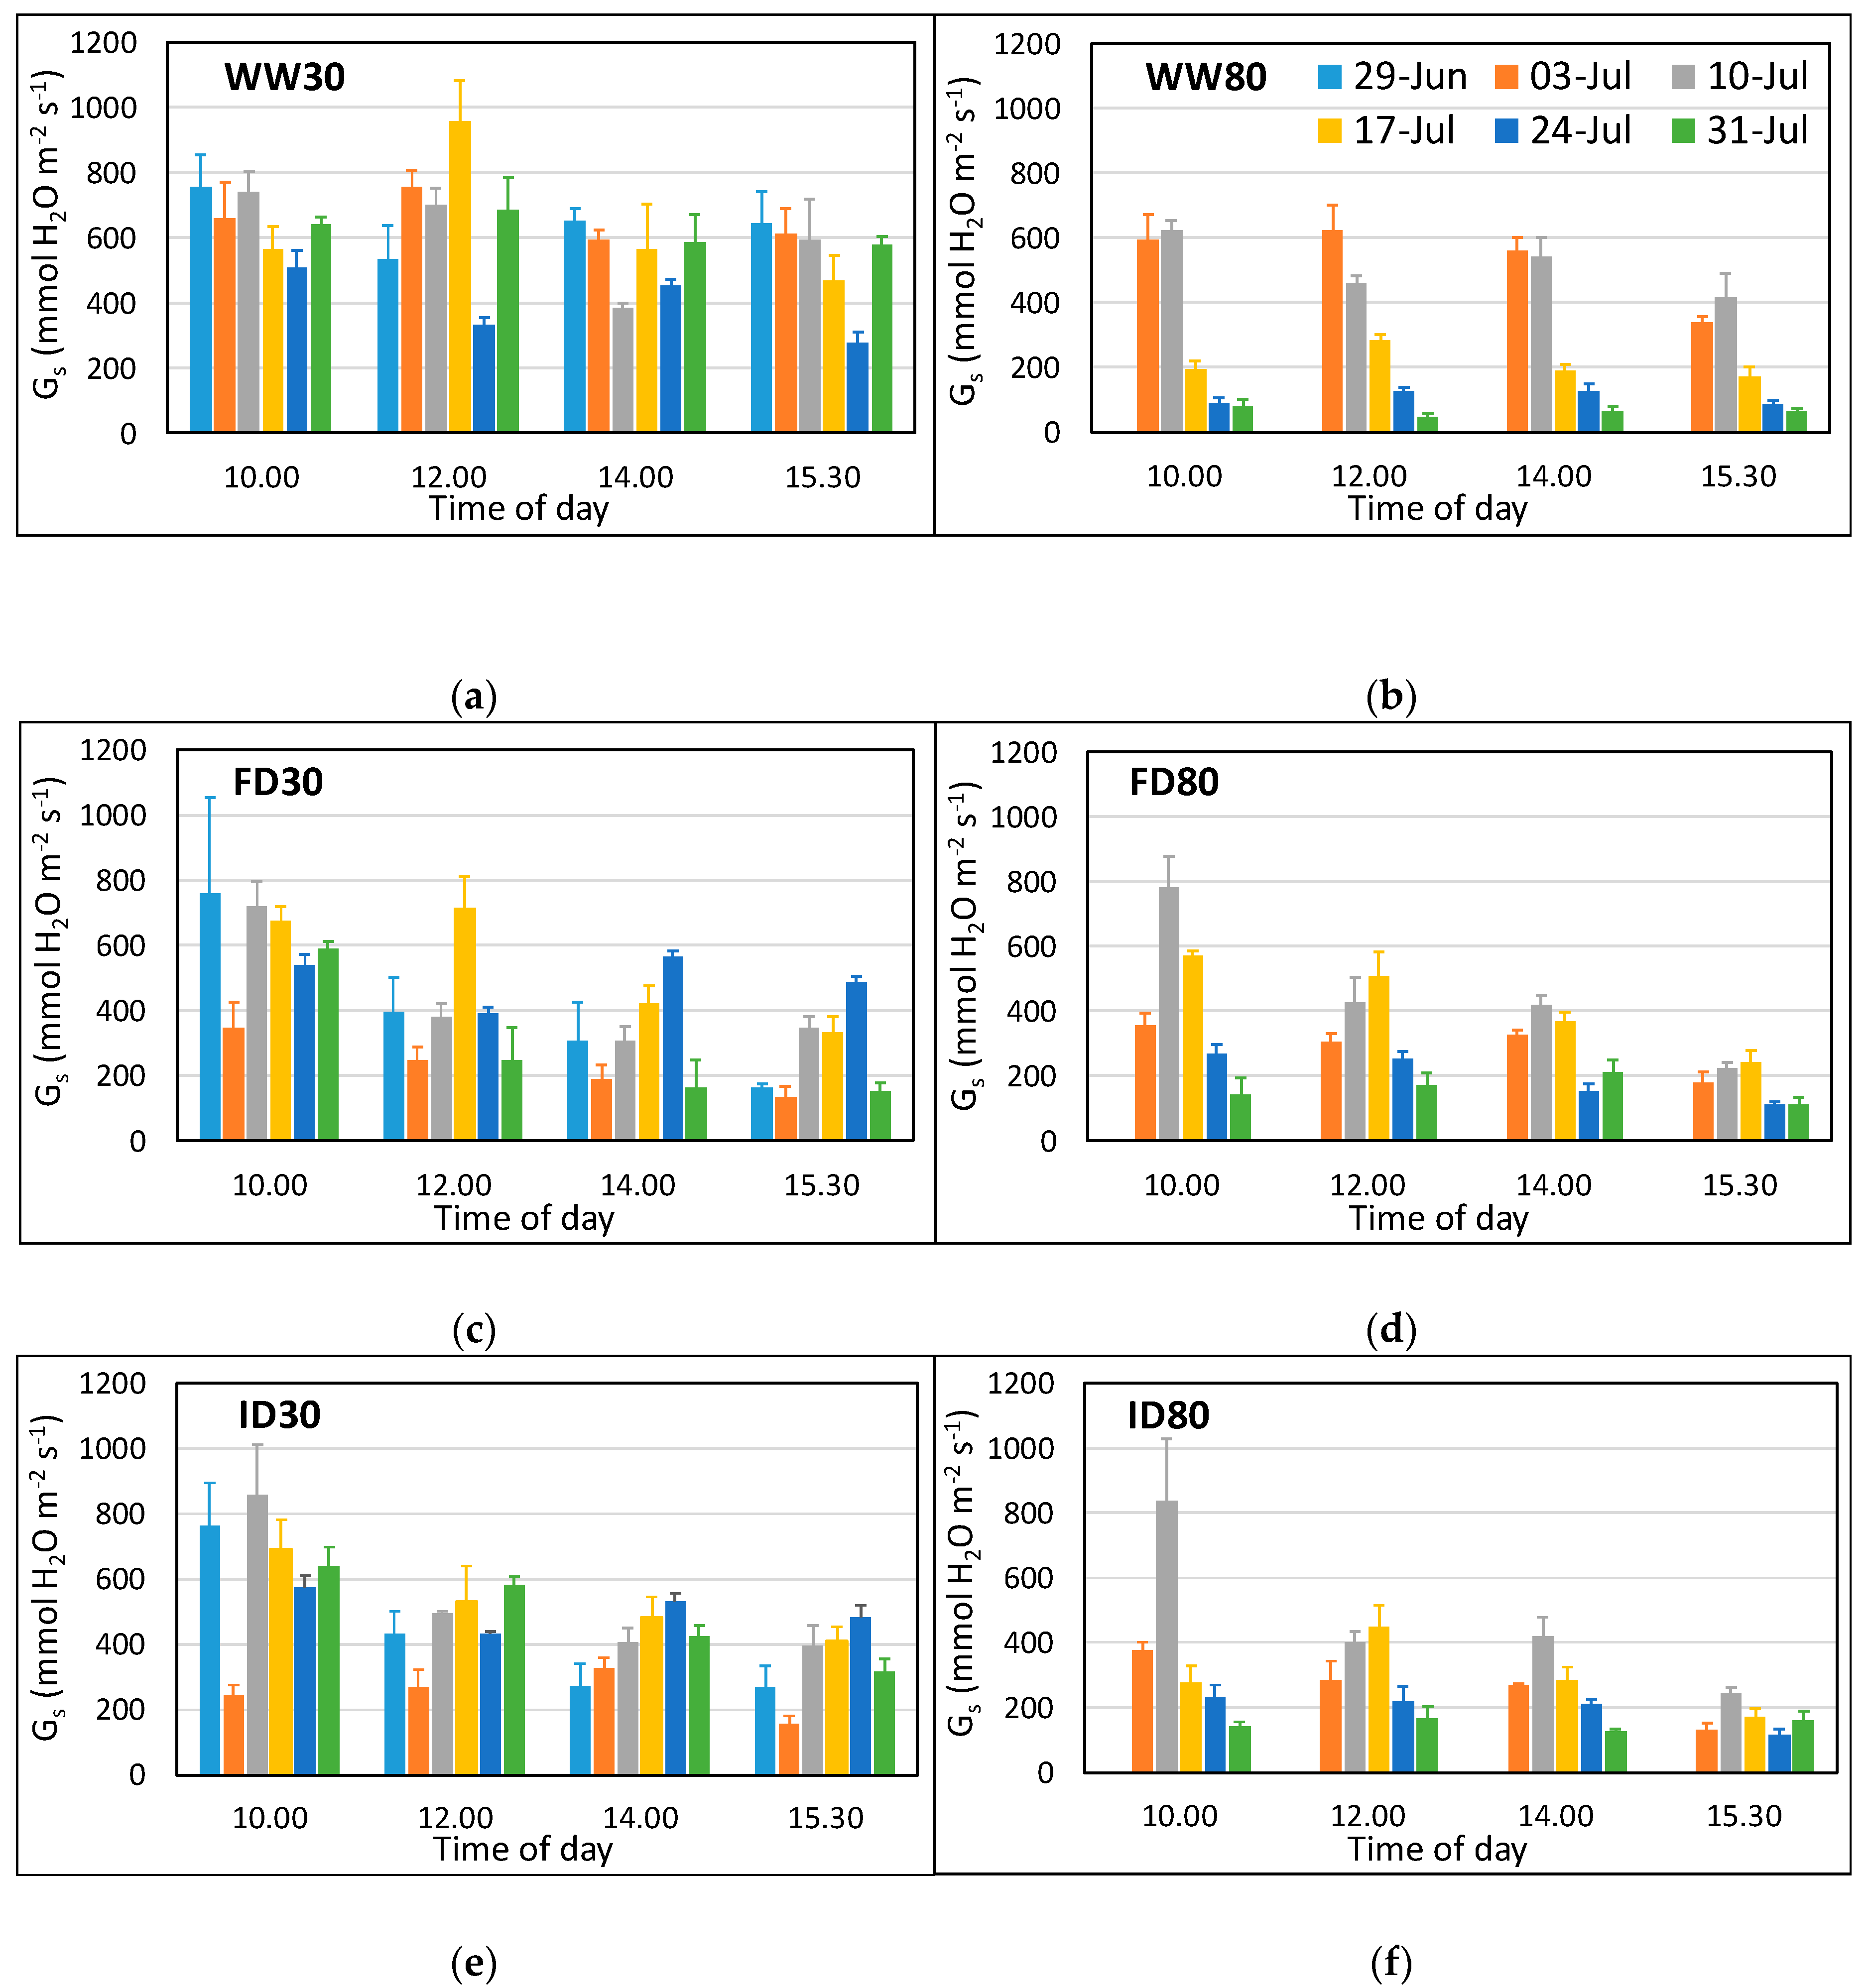
Stomatal conductance (gs) of the flag leaf measured using a porometer showed a significant 4-way interaction (p < 0.001) between O3, irrigation regime, time, and time of day (Figure 2). High O3 resulted in a decrease in gs, particularly with increasing time of exposure (strong O3 * time effect, p < 0.0001), reflecting the fact that impacts are determined by the accumulated stomatal flux of O3. The low O3 well-watered plants showed some fluctuation for gs over time, but there was no difference between gs values for 3 and 31 July, at any time of the day (Figure 2a, Table S1a). Overall, they maintained a high gs throughout, with the lowest values observed on 24 July due to cloudy conditions (average photosynthetic photon flux density (PAR) was 354 µmol m−2 s−1 and average leaf temperature was 21 °C, with PAR and leaf temperature being above 1200 µmol m−2 s−1 and 25 °C respectively on other days). In contrast, in the high O3 well-watered treatment, gs declined sharply from the third week of measurements onwards, at all times of day, reflecting adverse O3 impacts (Figure 2b, Table S1a). FD and ID plants at low O3 showed increases between 10th and 24th July, and then (depending on the time of day), declining again by 31 July. In the low O3 ID treatment, gs remained high on 31 July for the morning measurements (Figure 2e). FD and ID plants behaved similarly at high O3, with gs first increasing with time, reflecting the change in soil moisture conditions, and then decreasing again (to values less than those on 3 July), reflecting the onset of early senescence (Figure 2d,f, Table S1b,c). Overall, gs declined during the day in plants with reduced irrigation (FD and ID; Table S2b,c).
2.3. Light-Saturated Photosynthesis (Asat) and Chlorophyll Content Index (CCI) of the Flag Leaf
Whilst the light-saturated rate of photosynthesis (Asat) and chlorophyll content index (CCI) of the flag leaf were maintained at low O3 throughout the experimental period (with minor differences between irrigation treatments), both parameters started to decline after a short lag time at high O3 (Figure 3). The statistical analysis showed a significant 3-way interaction (p < 0.001) between O3 level, irrigation regime, and time for both parameters. For Asat, a sharp decline was first observed in WW plants between 4 and 11 July, i.e., between 6 and 13 days after starting the high O3 exposure, with a sharp decline at reduced irrigation occurring a week later. For CCI, plants in all irrigation treatments showed a sharp decline between 11 and 18 July, i.e., between 13 and 20 days after starting the high O3 exposure. On 11 July at high O3, Asat had declined more (45%) than CCI (17%) in WW plants compared to low O3. On 18 July, both Asat and CCI had declined by approximately 70% at high compared to low O3 in WW plants; at reduced irrigation, both parameters had declined by approximately 40% at high compared to low O3. The decline in both parameters indicated the onset of early senescence. There was no clear impact of irrigation treatment on the intrinsic (i.e., Asat/gs) or instantaneous (i.e., Asat/evapotranspiration) water use efficiency (WUE) of the flag leaf of wheat (data not shown).
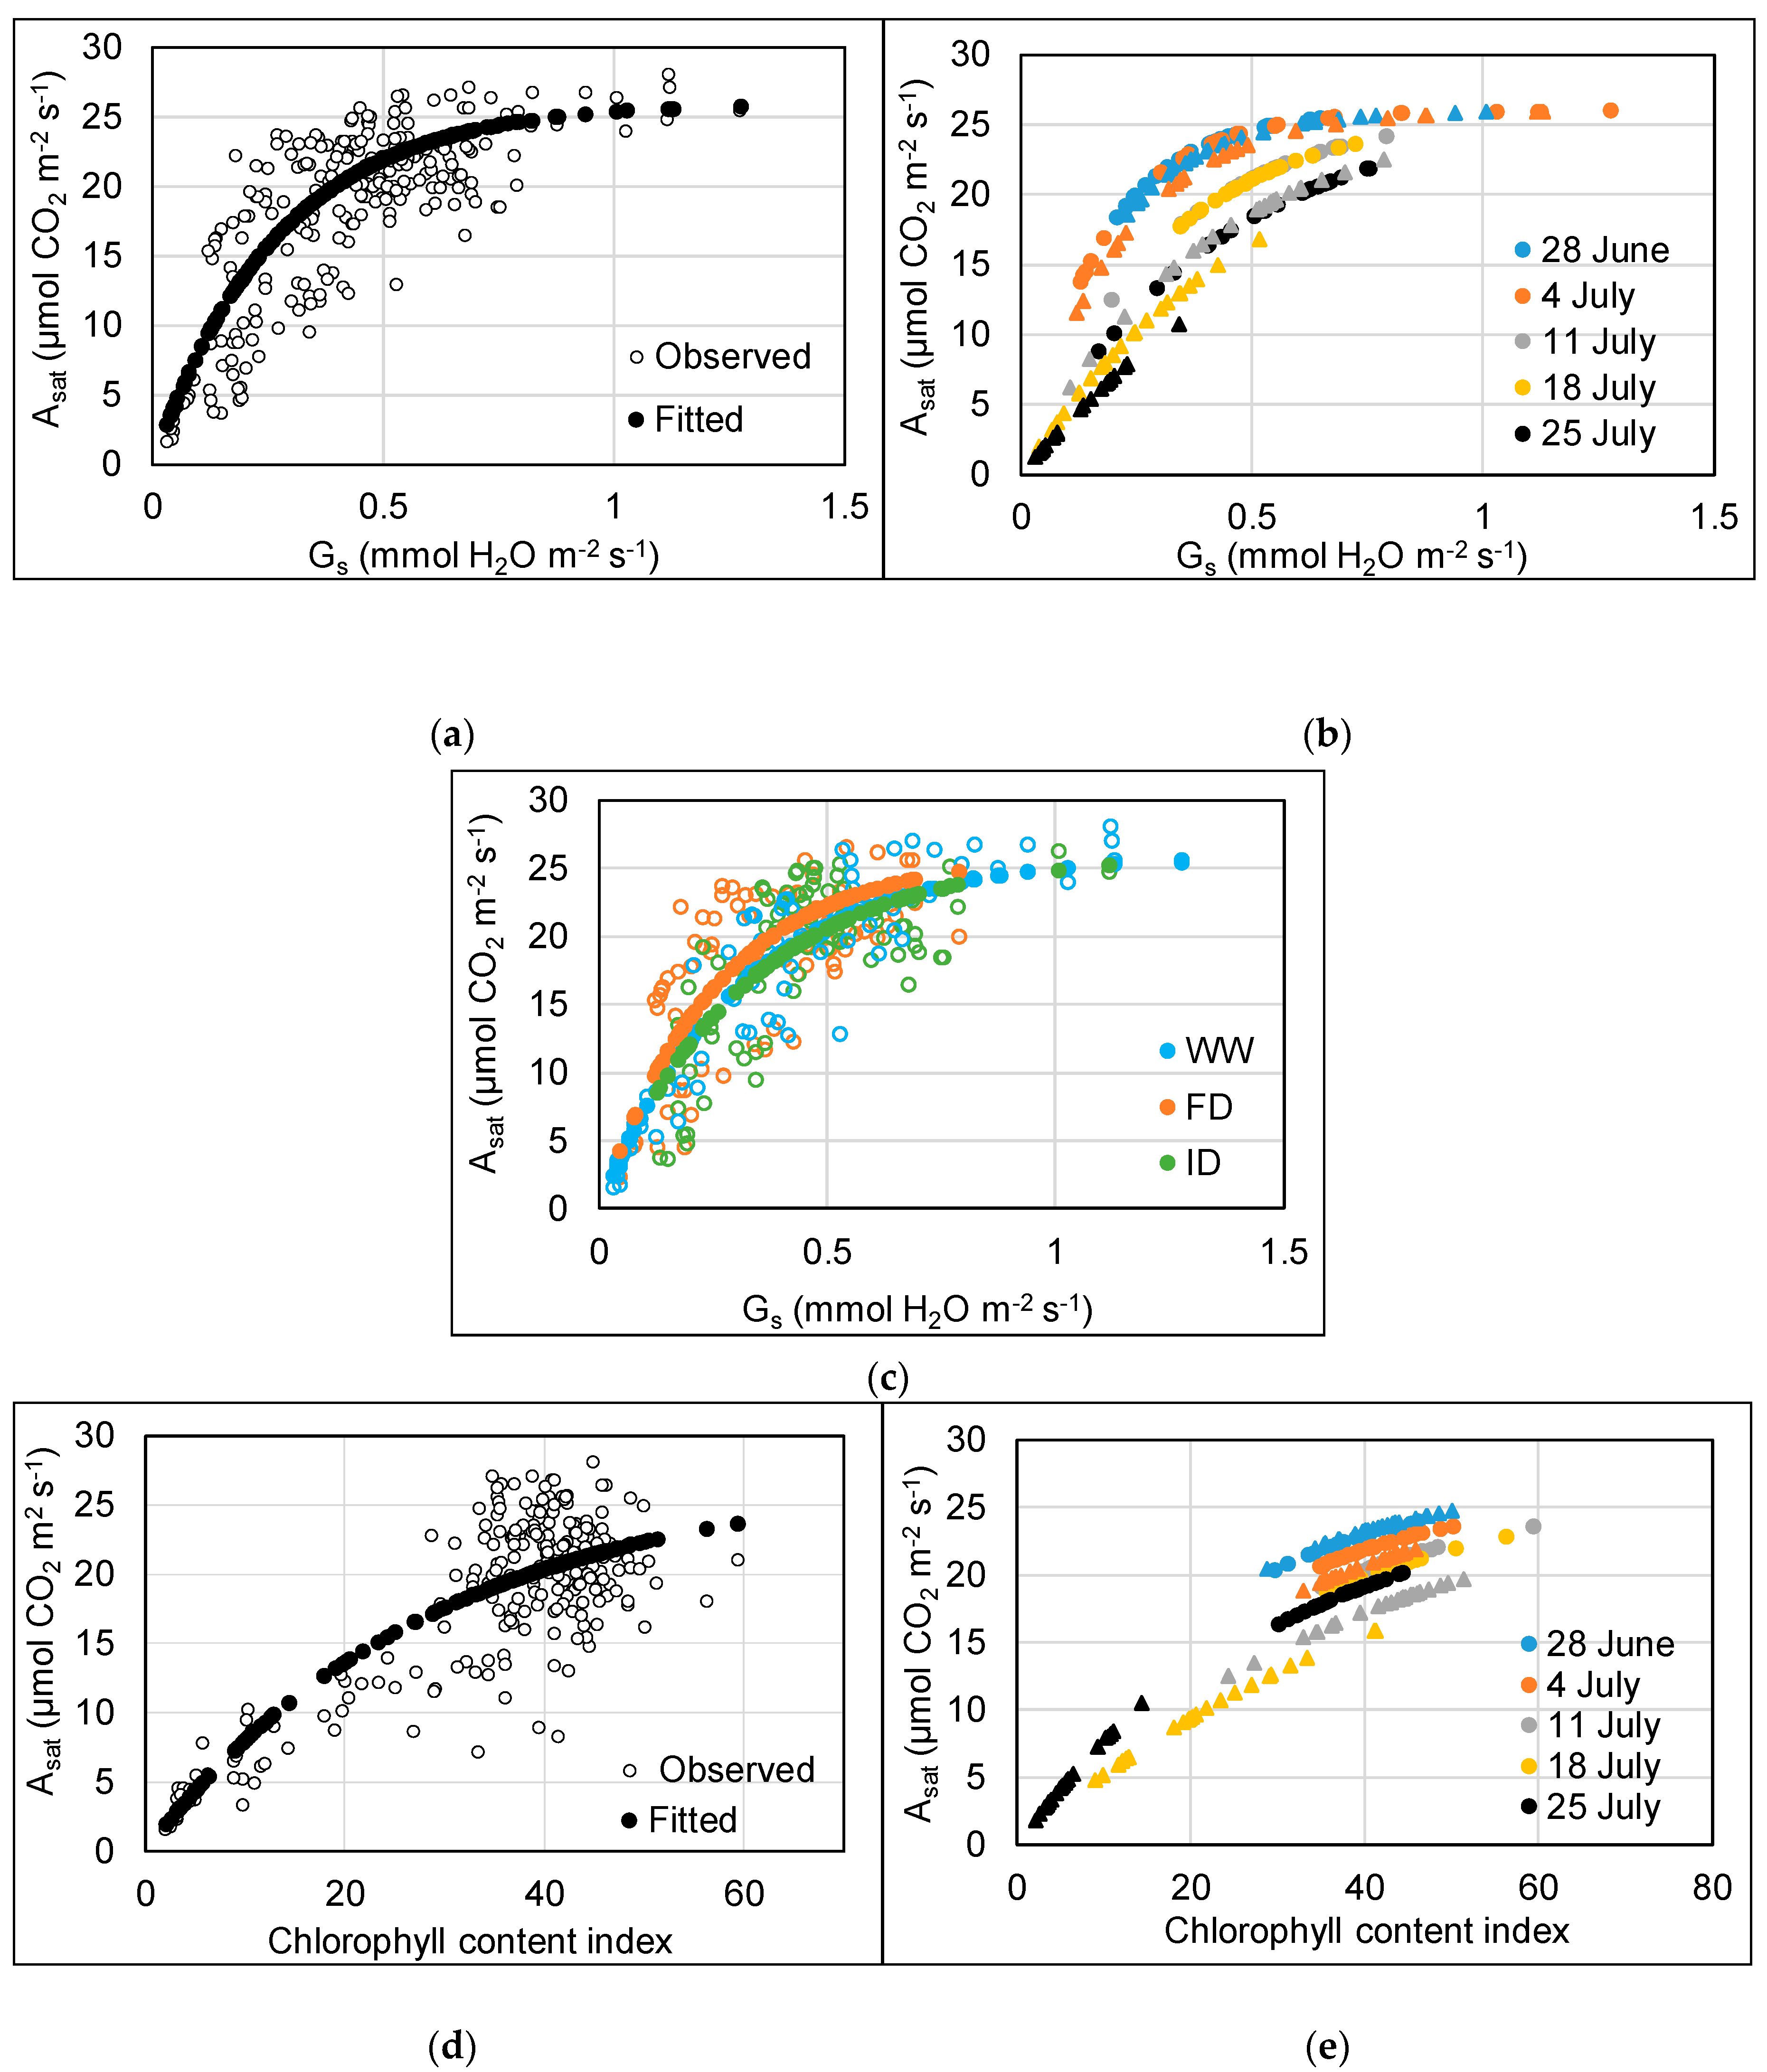
Asat showed a significant (p < 0.001) non-linear (3-parameter asymptotic exponential) relationship with both gs (y = 26 – 26e−3.4x) and CCI (y = 27 – 27e−0.035x) (Figure 4). Asat increased with increasing gs and CCI, for the former up till approximately 0.75 mmol H2O m−2 s−1, after which no further increase of Asat was observed (Figure 4a,d). The optimal models explained 90% (gs) and 81% (CCI) of the total variation in Asat and contained the additional fixed effect of an O3 and time interaction. The rate constant (c) gradually decreased with time for both the gs and CCI models (Figure 4b,e). Asat also increased at a quicker rate with increasing gs at low compared to high O3 between 11 and 25 July (p < 0.001), and the drop in rate was more evident for the high O3 treatment (Figure 4b). Similarly, Asat increased with increasing CCI at a faster rate at low O3 compared to high O3 between 11 and 18 July (p = 0.001). For 25 July, however, there was no difference in the rate of change between low and high O3 in the CCI model (p = 0.50). These differences between low and high O3 exposure in later weeks likely reflect the detrimental impact of the accumulated O3 uptake on functioning of the stomata and the photosynthetic machinery, inducing early senescence.
The Asat vs. gs rate constant was greater for the FD than the WW (p = 0.02) and ID treatment (p < 0.01) (Figure 4c). There was no effect of water treatment on the relationship between Asat and CCI (p = 0.30). The sometimes relatively high CCI compared to Asat at a CCI above 26 (Figure 4d) reflects the earlier decline in Asat compared to CCI in the WW treatments at 80 ppb O3. At low O3, there were no CCI values below 30.
2.4. Yield and Harvest Index
High O3 significantly (p = 0.001) reduced grain yield by 24% on average. However, grain yield was not significantly (p = 0.27) affected by the irrigation regime, and there was no significant (p = 0.90) interaction between O3 concentration and irrigation regime (Figure 5a). On the other hand, 1000-grain weight was significantly (p < 0.001) reduced (20%) by high O3 and stimulated (33%) by reduced irrigation; there was no significant (p = 0.38) interaction between O3 concentration and irrigation regime (Figure 5b). The average number of grains was not significantly affected by treatments. Although the average grain number was lower for the reduced irrigation treatments, the effect of irrigation was not significant (p = 0.11) due to considerable variation between replicates (Figure 5c). Whereas high O3 significantly (p < 0.001) reduced (12%) the harvest index (Figure 5d), reduced irrigation significantly (p = 0.006) stimulated (13%) the harvest index. For the harvest index, there was no significant difference between FD and ID (p = 0.70), but a significant difference between WW and FD (p < 0.001) and WW and ID (p = 0.02).
3. Discussion
To our knowledge, this study demonstrates for the first time that deficit irrigation potentially can be applied as a management tool to mitigate adverse impacts of O3 on crop yield. High O3 significantly reduced grain yield, 1000-grain weight and harvest index but not grain number, as recently reported too for wheat in a meta-analysis from 33 experiments assessing the impact of current ambient vs. preindustrial O3 levels [44]. Deficit irrigation (both FD and ID) enhanced 1000-grain weight and the harvest index. However, irrigation did not significantly affect grain yield, most like due to a tendency (p = 0.11) to reduce grain number. Results therefore suggest that deficit irrigation has the potential to compensate for the adverse impact of O3 on 1000-grain weight and harvest index observed at full irrigation.
The results of our study support the concept that O3 flux represents a more biologically relevant metric of O3 exposure than ambient O3 concentration and that O3 flux should be the preferred metric of exposure in O3 effect model functions [45]. Reduced irrigation resulted in a reduction of gs of the flag leaf driven by a reduction in soil moisture content and therefore a reduction in O3 uptake. A delay in adverse impacts of high O3 on flag leaf photosynthesis (Asat) implies that the accumulated stomatal uptake of O3 was lower at reduced compared to full irrigation. As the current experiment was conducted only at two levels of O3 exposure and over a short period, it was not feasible to develop robust O3 flux-effect relationships for yield parameters. Further research at a range of O3 concentrations during the whole growing season is needed to develop robust O3 flux-yield relationship and assess whether mitigation of adverse impacts of O3 on wheat yield at reduced irrigation can simply be explained by a reduction in the phytotoxic O3 dose [46]. Developing such a flux–yield relationship for the Kenyan wheat variety Korongo, a very O3-sensitive variety [43], would also allow comparison of the O3-sensitivity of an African wheat variety to those from other continents. Preferably, further research with Korongo should be conducted under Kenyan growth conditions as Korongo might perform differently under local conditions compared to the environmental conditions at the UK study site. However, currently, we are not aware of the existence of sophisticated O3 exposure facilities in Kenya.
The interactions between impacts of O3 level, irrigation regime, and time for flag leaf parameters such as gs, Asat, and CCI can be explained by the fact that adverse impacts of O3 are determined by the accumulated leaf uptake of O3 and only become apparent after a threshold has been reached. At the start of high O3 exposure, leaf gs was highest in WW plants, resulting in the threshold for O3 impacts being reached first, hence an earlier decline (by about a week) in gs and Asat was observed in WW compared to DI plants. By the end of the high O3 exposure period, flag leaves in all irrigation treatments were significantly damaged and at various stage of senescence, resulting in different physiological responses to treatments compared to the healthy leaves at the start of the O3 exposure period. Previous research indicated that accelerated senescence might be the dominant O3 effect influencing wheat yield with O3 effects on photosynthesis only observed alongside O3-induced leaf senescence, monitored as CCI [47]. However, the earlier significant decline in Asat compared to CCI in WW plants in the current study (resulting in a sometimes relatively high CCI compared to Asat at a CCI above 26 (Figure 4d)) suggests that a decline in photosynthesis might already occur before the onset of O3-induced leaf senescence. Therefore, an instantaneous effect of O3 on photosynthesis through a reduction in the carboxylation capacity of rubisco above a critical rate of O3 uptake cannot be ruled out [48,49].
There is also a need to further investigate the role and mechanism of stomatal control at reduced irrigation and high O3 exposure on crop growth and yield. Whilst ABA appears to play a central role in root-to-shoot chemical signalling to regulate growth and water use at reduced irrigation [36,37,38,39,40], elevated O3 might reduce the sensitivity of stomatal closure to ABA in the presence of O3-induced emissions of ethylene [50,51,52]. Incomplete understanding of the physiological mechanisms driving O3-induced yield reduction hamper integration of O3 effects in crop modelling [47,53,54]. It is not fully understood yet which processes affected by O3 uptake at the leaf level are most important in driving ultimate yield loss. In crop modelling, there is a need to use a dynamic approach [47,55] and to improve the understanding of leaf-area dynamics in response to O3 [54].
There was no clear impact of irrigation treatment on the intrinsic (i.e., Asat/gs) or instantaneous (i.e., Asat/evapotranspiration) water use efficiency (WUE) of the flag leaf of wheat (data not shown) as again there was a significant interaction with time (i.e., date of measurement). WUE of the flag leaf was generally quite stable in WW plants, but variation in flag leaf WUE in reduced irrigation plants meant that in some weeks their WUE was higher than in WW plants, whereas the opposite was true for other weeks. It should be noted, however, that it is difficult to upscale impacts of treatments on WUE of the flag leaf to whole plant WUE and consequences for crop yield without detailed information on other important variables such as leaf position (affecting light environment) and dark respiration [56].
Although the current study did not show a significant impact of DI on grain yield (but a significant stimulation of 1000-grain weight and harvest index), some field studies have shown a positive impact of DI on wheat yield. Maximum wheat yield and a high crop WUE was achieved using drip irrigation to maintain a soil moisture content of 60% of field capacity in the North China Plain [29]. Another study reported maximum wheat yield and irrigation WUE for the North China Plain at a relative soil water content of 75% [30]. High-level irrigation made wheat produce tillers for a longer period, delaying the time it reaches maturity, resulting in an increase in biomass allocation to straw [29] and a reduction in biomass allocation to grains [29,30]. Whilst full irrigation showed a tendency to reduce grain weight and stimulate straw weight in our study (data not shown), a significant difference (p ≤ 0.05) in straw weight was only found between WW and FD plants (when O3 treatments were pooled; O3 did not affect straw weight). Under semi-arid environmental conditions in Pakistan, 20% DI in combination with raised bed cultivation and mulching improved wheat yield [31]. Other field studies have shown that wheat yield [32,33] was not significantly affected at 25–30% DI compared to full irrigation. However, the crop WUE was much higher at DI, and water saving could be achieved without a yield penalty. There is a clear need to repeat the current study under field conditions where the dynamics of the soil water content will be different from container studies, as the soil water content declines quickly in containers on a daily basis, and daily watering is required to prevent drought stress. When conducting such field studies, we recommend exposing wheat to a range of elevated O3 concentrations throughout the growing season—for example, using free air O3 exposure systems, with DI applied at different stages of development. Previous studies have shown that the impact of DI on wheat yield and quality varies with the developmental stage of wheat [57,58].
Such field studies should test the hypothesis that reduced irrigation will mitigate adverse impacts of O3 on wheat yield in areas with high ambient O3 concentrations, such as large regions in South and East Asia, including China and India [16,22,55]. Whilst a more sustainable water use in irrigated crops through reduced irrigation provides a feasible crop management solution to reduce the yield gap in crops, there is a need as well to improve the resilience of crops to environmental stresses such as drought, heat, pest and diseases, and O3 pollution in the long term through crop breeding programmes [20,22,59]. It might not be feasible to meet future SSA cereal demand on existing production area by decreasing the yield gap alone. However, any attempts to promote the sustainable expansion of irrigated production areas [19] should bear in mind that rising O3 concentrations in SSA [7] are likely to reduce the yield potential when soil moisture becomes less of a limiting factor in the stomatal uptake of O3 in (semi-)arid areas.
4. Materials and Methods
4.1. Plant Material, Experimental Site and Treatments
The experiment was conducted in 2018 at the Centre for Ecology & Hydrology (CEH) air pollution facility at Abergwyngregyn, North Wales (53.2°N, 4.0°W). On 10 May, seeds of the Kenyan wheat (Triticum aestivum L.) variety ‘Korongo’ (Kenya Agricultural Research Institute, Njoro, Kenya) were sown in 24 containers (0.3 m × 0.3 m × 0.3 m) filled to 25 litres with John Innes No. 3 compost (J. Arthur Bowers, LBS Horticulture, Colne, UK). Korongo is a high-yielding Kenyan wheat variety (yield potential of 8.5 tonnes ha−1) and is outstanding for baking and confectionery qualities [60]. Seeds were sown in four rows 7 cm apart, resulting in a seedling density of approximately 330 seedlings per m2. The containers were randomly distributed in one hemispherical glasshouse (solardomes; 3 m diameter, 2.1 m height) at a low O3 profile with weekly maximum peaks up till 31 ppb and a daylight mean O3 concentration of 19 ppb (Table 1) until 26 June. Climatic conditions in the solardome fluctuated with the outside ambient climatic conditions; a summary of the climatic conditions is provided in Table 1. The containers were well-watered to maintain soil moisture near field capacity.
On Tuesday 26 June at approximately mid-anthesis stage, randomly half of the containers were transferred to one solardome at a high O3 profile for four weeks with weekly maximum peaks up till 93 ppb (Table 1) and an average hourly O3 concentration up to 76 ppb (Figure 6). The other half of the containers remained in the solardome with the low O3 profile. This period represents the most O3-sensitive developmental stage of wheat [14]. The wheat was exposed to peak O3 concentrations five consecutive days a week (Thu–Mon) between 8 am and 8 pm (starting two days after transfer on 28 June, representing an O3 episode at the high O3 exposure) with lower peaks during the other two days (Tue–Wed). During ‘night’ time average hourly O3 concentrations were kept between 18–25 ppb, peaking at 46 ppb during daytime on the other two days of the week (Figure 6). At low O3, the average hourly concentration reached values up to 32 ppb between 26 June and 23 July. During the four weeks that wheat was exposed to low and high O3, three irrigation regimes were applied (four replicate containers per irrigation regime per O3 concentration): well-watered every day (WW: well-watered), reduced watering every day (FD; frequent deficit), well-watered every other day with limited watering on the other day to prevent drought stress (ID: infrequent deficit). For the remainder of the experiment, all containers were kept in the low O3 solardome again and well-watered until harvest. Hence, apart from during the four weeks of different irrigation regimes and high O3 treatment, all plants were grown in the same solardome. As previous assessments had shown that climatic conditions do not vary significantly between the solardomes [61] and in order not to disturb the plants too much during the four weeks, it was decided not to swap the O3 treatments and plants between the two solardomes.
The solardomes were ventilated at a rate of two air changes per minute, and charcoal-filtered air was injected with controlled amounts of O3. O3 was provided by a G11 O3 generator (Ozone Industries, Andover, UK) equipped with a Sequal 10 oxygen concentrator (Pure O2, Manchester, UK). Concentrations were determined by a computer-controlled O3 injection system (Lab VIEW version 2012, National Instruments, Austin, Texas, US). O3 was distributed to each solardome via PTFE tubing, with the concentration inside each solardome measured for 5 min every 30 min using two O3 analyzers (400a, Enviro Technology Services, Stroud, UK; 49i, Thermo Fisher Scientific, Franklin, Massachusetts, USA) of matched calibration. In one solardome, ambient air temperature, photosynthetically active radiation (PAR), temperature and relative humidity were continuously monitored by an automatic weather station (Skye Instruments Ltd., Llandrindod Wells, UK) and recorded every five minutes.
4.2. Watering and Soil Moisture Measurements
The containers were watered daily with different volumes of water during the period of differential irrigation and exposure to low and high O3 concentrations. The soil moisture was monitored on weekdays between 14:30–15:00 pm in the top 6 cm near the middle of the container with a handheld soil moisture sensor (Theta Probe ML3, AT Delta-T Devices Ltd., Burwell, UK). Depending on measured soil moisture and predicted weather conditions for the next day, the volume of water to be added per container between 15:30–17:30 was determined. The aim of the WW treatment was to maintain soil moisture above 20%, the aim of the reduced irrigation treatments was not to drop soil moisture below 10%, with ID being in the range of 10–15% 2 days after being well-watered and FD being around 15% when monitoring soil moisture. In the low O3 treatment, permanent soil moisture sensors of the same make were installed in two containers of each watering regime, and the soil moisture was logged (GP2 Data Logger, AT Delta-T Devices Ltd., Burwell, UK) every half an hour to obtain daily profiles of soil moisture changes.
4.3. Leaf Gas Exchange and Chlorophyll Context Index
Between 29 June (low O3) or 3 July (high O3) and 31 July, stomatal conductance of the flag leaf was measured weekly under ambient conditions on Tuesdays between 10.00–10.45, 12.00–12.45, 14.00–14.45, and 15.30–16.15 using a porometer (AP4 Poromoter, Delta T Devices Ltd., Burwell, UK) to determine the daily profile. The leaf temperature and ambient light levels were recorded too. At the start of the high O3 exposure (28th July) and weekly thereafter on Wednesdays until 25th July, the light-saturated rate of photosynthesis (Asat) and stomatal conductance (gs) of the flag leaf were measured weekly between 10.30 and 14.00 using a portable infrared gas analyser (LI-6400XT, LI-COR, Lincoln, Nebraska, USA). The mean environmental conditions in the leaf chamber were as follows: air temperature of 25 °C, CO2 concentration of incoming air of 400 µmol mol−1, light of 1500 µmol m−2 s−1 (6400 LED light source), relative humidity of outgoing air of 68% on average, leaf vapour pressure deficit leaf of 1.2 kPa on average. At the same time, the chlorophyll content index (CCI) of the flag leaf was measured using a CCM200 (ADC, UK). The CCM200 measures non-destructively the ratio of optical transmission at 931 nm to optical transmission at 653 nm waveband.
4.4. Wheat Yield and Harvest Index
Ripening of the ears occurred at a different rate in the different treatments, hence it was decided to harvest individual ears when they had ripened to prevent loss of ripened seeds. On average, 75% or more of the ears were harvested between 10 (FD80 treatment) and 19 August (WW30 treatment). The ears were stored at room temperature. When all the ears were harvested, straw (leaves and stems) was harvested too, dried at 60 °C and weighed. Ears were threshed (Minibatt+, Godé, France), the grains were weighed, and the harvest index was calculated as the ratio of the grain weight and ‘grain weight plus straw weight’. In addition, the weight of 100 grains per container was determined to calculate the 1000-grain weight.
4.5. Statistical Analyses
All statistical analyses were run using R [62]. To investigate the effect of O3 and irrigation treatments on gs, Asat and CCI, the R package ‘lme4′ [63] was used to run linear mixed effects models, including the fixed effects of O3 level, irrigation treatment, time (categorical), where relevant time of day (categorical, only relevant for gs as shown in Figure 2), and interactions between these variables. A random effect of container number was also included. For the gs model, based on the porometer measurements, continuous variables for leaf temperature (quadratic term) and ambient light were also added. As CCI was generally stable for the first three weeks (irrespective of the treatments), values for 28 June, 4 and 11 July were included in one category (level 0), values for 18 July were put into a second category (level 1), and values for 25 July were put into a third category (level 2). Therefore, the ‘time’ variable in the CCI model was categorical, with 3 levels. The R package ‘emmeans’ [64] was used to investigate differences between the treatments. To determine the relationship between Asat vs. gs and Asat vs. CCI, non-linear mixed effects models were run using the R package (‘nlme’) [65]. A 3-parameter asymptotic function of the form y = a –be –cx was used. The asymptote (a) was derived from the plot of the observed data, and b was calculated using a set intercept of 0, following ‘a – b = intercept.’ The rate constant ‘c’ was calculated as
where ‘x,y’ are the coordinates for the point on the plot of the observed data where the curve is rising most steeply [66]. Model sets were created, including CCI or gs as a fixed effect, and container number as a random effect, with additional models including time, O3 treatment, and/or irrigation treatment as fixed effects. The variation explained by the final models (r2) was calculated by comparing the residual variance with the total variation in the models.
c = −(log((a − y)/b)/x)
For all mixed models (linear and non-linear), the optimal model was chosen by examination of Akaike’s Information Criterion (AIC) and the Bayesian Information Criterion (BIC). The model with the lowest AIC value is the optimal model, while models differing in <2, 4–7, >10 AIC from the top model have substantial, considerably less and no empirical support respectively [67]. The BIC provides a more conservative estimate, penalising models with many parameters [68]. Likelihood ratio tests were then used to determine p-values for the fixed effects. To investigate the effect of O3 and irrigation treatments on yield and harvest index, linear models with normal error including the categorical predictor O3 and irrigation (and their interaction) were run. For the grain weight and grain number models, number of plants per pot was included as an additional covariate as the germination rate was not 100% in all the containers. Post-hoc Tukey tests were used to investigate differences between irrigation treatments. For all linear models, residual plots were examined for uneven spread and non-normality. Data transformations were carried out if necessary, e.g., square root or log transformation.
5. Conclusions
Our study indicates that reduced irrigation can be applied as a management tool to partially or fully mitigate (depending on yield parameter) the adverse impacts of O3 on wheat yield. Reduced irrigation reduces gs and therefore the stomatal uptake of O3, resulting in a delay in adverse impacts of O3 on flag leaf photosynthesis during flowering and grain filling. Hence, reduced irrigation enables wheat plants to maintain photosynthate production for longer during the grain-filling period at elevated levels of O3. The mechanism of the interactive impacts of reduced irrigation and O3 on gs and subsequent wheat yield require further investigation and validation under field conditions. Field experiments should be conducted at various O3 concentrations to enable the development of robust O3 flux-effect relationships for wheat yield at various irrigation regimes.
Supplementary Materials
The following are available online at https://www.mdpi.com/2223-7747/8/7/220/s1, Table S1: Post-hoc test results (p-values) for mixed model investigating the effect of varying water treatments (WW: well-watered; FD: frequent deficit; ID: infrequent deficit) and O3 treatments (low O3 = 30 ppb, high O3 = 80 ppb) on stomatal conductance (gs; mmol H2O m−2 s−1), Table S2: Post-hoc test results (p-values) for mixed model investigating the effect of varying water treatments (WW: well-watered; FD: frequent deficit; ID: infrequent deficit) and O3 treatments (low O3 = 30 ppb, high O3 = 80 ppb) on stomatal conductance (gs; mmol H2O m−2 s−1).
Author Contributions
Conceptualization, methodology, resources—H.H., F.H., G.M.; investigation—H.H., F.H., A.R.; formal analysis—H.H., F.H., K.S., A.R.; data curation—H.H., F.H., K.S.; writing—original draft preparation—H.H. and K.S.; writing—review and editing—H.H., F.H.; K.S.; supervision, H.H.; project administration, funding acquisition—H.H., G.M.
Funding
This research was carried out as part of the Centre for Ecology & Hydrology Long-Term Science–Official Development Assistance ‘SUNRISE’ project (NEC06476) funded by the Natural Environment Research Council of UK Research (NERC-UKRI), NERC grant number NE/R000131/1.
Acknowledgments
We thank Aled Williams (Aled William Mechatronics) for technical support for the O3 exposure facility and the students Lulu Dai and Clare Brewster for watering the plants and checking the facility during some of the weekends. We are grateful to David Cooper (CEH Bangor) for providing advice on the statistical analyses.
Conflicts of Interest
The authors declare no conflict of interest. The funders had no role in the design of the study; in the collection, analyses, or interpretation of data; in the writing of the manuscript, or in the decision to publish the results.
References
- Monks, P.S.; Archibald, A.T.; Colette, A.; Cooper, O.; Coyle, M.; Derwent, R.; Fowler, D.; Granier, C.; Law, K.S.; Mills, G.E.; et al. Tropospheric ozone and its precursors from the urban to the global scale from air quality to short-lived climate forcer. Atmos. Chem. Phys. 2015, 15, 8889–8973. [Google Scholar] [CrossRef] [Green Version]
- Royal Society. Ground-Level Ozone in the 21st Century: Future Trends, Impacts and Policy Implications; Science Policy Report 15/08; Royal Society: London, UK, 2008. [Google Scholar]
- Vingarzan, R. A review of surface ozone background levels and trends. Atmos. Environ. 2004, 38, 3431–3442. [Google Scholar] [CrossRef]
- Parrish, D.D.; Law, K.S.; Staehelin, J.; Derwent, R.; Cooper, O.R.; Tanimoto, H.; Volz-Thomas, A.; Gilge, S.; Scheel, H.-E.; Steinbacher, M.; et al. Long-term changes in lower tropospheric baseline ozone concentrations at northern mid-latitudes. Atmos. Chem. Phys. 2012, 12, 11485–11504. [Google Scholar] [CrossRef] [Green Version]
- Cooper, O.R.; Parrish, D.D.; Ziemke, J.; Cupeiro, M.; Galbally, I.E.; Gilge, S.; Horowitz, L.; Jensen, N.R.; 518 Lamarque, J.F.; Naik, V.; et al. Global distribution and trends if tropospheric ozone: An observation-based review. Elem. Sci. Anthr. 2014, 2, 29. [Google Scholar] [CrossRef]
- Chang, K.-L.; Petropavlovskikh, I.; Cooper, O.R.; Schultz, M.G.; Wang, T. Regional trend analysis of surface ozone observations from monitoring networks in eastern North America, Europe and East Asia. Elem. Sci. Anthr. 2017, 5, 50. [Google Scholar] [CrossRef]
- Ziemke, J.R.; Oman, L.D.; Strode, S.A.; Douglass, A.R.; Olsen, M.A.; McPeters, R.D.; Bhartia, P.K.; Deland, M.T.; Taylor, S.L. Trends in global tropospheric ozone inferred from a composite record of TOMS/OMI/MLS/OMPS satellite measurements and the MERRA-2 GMI simulation. Atmos. Chem. Phys. 2019, 19, 3257–3269. [Google Scholar] [CrossRef] [Green Version]
- Turnock, S.T.; Wild, O.; Dentener, F.J.; Davila, Y.; Emmons, L.K.; Flemming, J.; Folberth, G.A.; Henze, D.K.; Jonson, J.E.; Keating, T.J.; et al. The impact of future emission policies on tropospheric ozone using a parameterised approach. Atmos. Chem. Phys. 2018, 18, 8953–8978. [Google Scholar] [CrossRef] [Green Version]
- DeWitt, H.L.; Gasore, J.; Reupakheti, M.; Potter, K.E.; Prinn, R.G.; De Dieu Ndikubwimana, J.; Nkusi, J.; Safari, B. Seasonal and diurnal varieability in O3, black carbon, and CO measured at the Rwanda Climate Observatory. Atmos. Chem. Phys. 2019, 19, 2063–2078. [Google Scholar] [CrossRef]
- Laban, T.L.; Van Zyl, P.G.; Beukes, J.P.; Vakkari, V.; Jaars, K.; Borduas-Dedekind, N.; Jsipovic, M.; Thomspon, A.M.; Kulmala, M.; Laakso, L. Seasonal influences on surface ozone variability in continental South Africa and implications for air quality. Atmos. Chem. Phys. 2018. [Google Scholar] [CrossRef]
- Ainsworth, E.A. Understanding and improving global crop response to ozone pollution. Plant J. 2016, 90, 886–897. [Google Scholar] [CrossRef]
- Bellini, E.; De Tullio, M.C. Ascorbic acid and ozone: Novel perspectives to explain an elusive relationship. Plants 2019, 8, 122. [Google Scholar] [CrossRef] [PubMed]
- Feng, Z.; Kobayashi, K. Assessing the impacts of current and future concentrations of surface ozone on crop yield with meta-analysis. Atmos. Environ. 2009, 43, 1510–1519. [Google Scholar] [CrossRef]
- Feng, Z.; Kobayashi, K.; Ainsworth, E.A. Impact of elevated ozone concentration on growth, physiology, and yield of wheat (Triticum aestivum L.): A meta-analysis. Glob. Chang. Biol. 2008, 14, 2696–2708. [Google Scholar]
- Mills, G.; Buse, A.; Gimeno, B.; Bermejo, V.; Holland, M.; Emberson, L.; Pleijel, H. A synthesis of AOT40-based response functions and critical levels of ozone for agricultural and horticultural crops. Atmos. Environ. 2007, 41, 2630–2643. [Google Scholar] [CrossRef]
- Mills, G.; Sharps, K.; Simpson, D.; Pleijel, H.; Frei, M.; Burkey, K.; Emberson, L.; Uddling, J.; Broberg, M.; Feng, Z.; et al. Closing the global ozone yield gap: Quantification and co-benefits for multi-stress tolerance. Glob. Chang. Biol. 2018, 24, 4869–4893. [Google Scholar] [CrossRef] [PubMed]
- Alexandratos, N.; Bruinsma, J. World Agriculture Towards 2030/2050: The 2012 Revision; Food and Agriculture Organization of the United Nations: Rome, Italy, 2012; p. 146. [Google Scholar]
- Godfray, H.C.; Beddington, J.R.; Crute, I.R.; Haddad, L.; Lawrence, D.; Muir, J.M.; Pretty, J.; Robinson, S.; Thomas, S.M.; Toulmin, C. Food security: The challenge of feeding 9 billion people. Science 2010, 327, 812–818. [Google Scholar] [CrossRef] [PubMed]
- Van Ittersuma, M.K.; Van Bussel, L.G.J.; Wolf, J.; Grassini, P.; Van Wart, J.; Guilpart, N.; Claessens, L.; De Groot, H.; Wiebe, K.; Mason-D’Croz, D.; et al. Can sub-Saharan Africa feed itself? Proc. Natl. Acad. Sci. USA 2016, 113, 14964–14969. [Google Scholar] [CrossRef] [PubMed] [Green Version]
- Gilliham, M.; Able, J.A.; Roy, S.J. Translating knowledge about abiotic stress tolerance to breeding programmes. Plant J. 2017, 90, 898–917. [Google Scholar] [CrossRef] [PubMed] [Green Version]
- Frei, M. Breeding of ozone resistant rice: Relevance, approaches and challenges. Environ. Pollut. 2015, 197, 144–155. [Google Scholar] [CrossRef]
- Mills, G.; Sharps, K.; Simpson, D.; Pleijel, H.; Broberg, M.; Uddling, J.; Jaramillo, F.; Davies, W.J.; Dentener, F.; Van den Berg, M.; et al. Ozone pollution will compromise efforts to increase global wheat production. Glob. Chang. Biol. 2018, 24, 3560–3574. [Google Scholar] [CrossRef]
- Emberson, L.D.; Ashmore, M.R.; Simpson, D.; Tuovinen, J.P.; Cambridge, H.M. Modelling and mapping ozone deposition in Europe. Water Air Soil Pollut. 2001, 130, 577–582. [Google Scholar] [CrossRef]
- Harmens, H.; Mills, G.; Emberson, L.; Ashmore, M. Implications of climate change for the stomatal flux of ozone: A case study for winter wheat. Environ. Pollut. 2007, 146, 763–770. [Google Scholar] [CrossRef] [PubMed]
- LRTAP Convention. Chapter 3 “Mapping Critical Levels for Vegetation”. LRTAP Convention Modelling and Mapping Manual. 2017. Available online: http://icpvegetation.ceh.ac.uk/ on 20/05/2019 (accessed on 1 May 2019).
- Bouman, B.A.M.; Lampayan, R.M.; Tuong, T.P. Water Management in Irrigated Rice: Coping with Water Scarcity; International Rice Research Institute: Manila, Philippines, 2007; p. 53. [Google Scholar]
- Carrijo, D.R.; Lundy, M.E.; Linquist, B.A. Rice yields and water use under alternate wetting and drying irrigation: A meta-analysis. Field Crops Res. 2017, 203, 173–180. [Google Scholar] [CrossRef]
- Zhang, H.; Xue, Y.; Wang, Z.; Yang, J.; Zhang, J. An alternate wetting and moderate soil drying regime improves root and shoot growth in rice. Crop Sci. 2009, 49, 2246–2260. [Google Scholar] [CrossRef]
- Jha, S.K.; Ramatshaba, T.S.; Wang, G.; Liang, Y.; Liu, H.; Gao, Y.; Duan, A. Response of growth, yield and water use efficiency of winter wheat to different irrigation methods and scheduling in North China Plain. Agric. Water Manag. 2019, 217, 292–302. [Google Scholar] [CrossRef]
- Zhang, Y.; Yu, Z.; Shi, Y.; Gu, S.; Zhang, Y. Effects of supplemental irrigation based on soil water content on water consumption, dry matter and yield of wheat. Chilean J. Agric. Res. 2019, 79, 190–201. [Google Scholar] [CrossRef] [Green Version]
- Razaq, A.; Khan, M.J.; Sarwar, T.; Khan, M.J. Influence of deficit irrigation, sowing methods and mulching on yield components and yield of wheat in semiarid environment. Pak. J. Bot. 2019, 51, 553–560. [Google Scholar] [CrossRef]
- Meena, R.P.; Karnam, V.; Tripathi, S.C.; Jha, A.; Sharma, R.K.; Singh, G.P. Irrigation management strategies in wheat for efficient water use in the regions of depleting water resources. Agric. Water Manag. 2019, 214, 38–46. [Google Scholar] [CrossRef]
- Fahad, M.; Wajid, S.A.; Ahmad, A.; Cheema, M.J.M. Response of wheat cultivars to deficit irrigation under semiarid conditions of Faisalabad, Pakistan. Int. J. Agric. Biol. 2019, 21, 1004–1012. [Google Scholar] [CrossRef]
- Zhenchang, W.; Xiaofei, Y.; Liang, F.; Jianbin, Z. Partial rootzone drying irrigation increase root surface area, root hydraulic conductivity and water use efficiency in maize. Int. J. Environ. Monit. Anal. 2016, 4, 146–153. [Google Scholar] [CrossRef]
- Kang, S.; Hao, X.; Du, T.; Tong, L.; Su, X.; Lu, H.; Li, X.; Huo, Z.; Li, S.; Ding, R. Improving agricultural water productivity to ensure food security in China under changing environment: From research to practice. Agric. Water Manag. 2017, 179, 5–17. [Google Scholar] [CrossRef]
- Stoll, M.; Loveys, B.; Dry, P. Hormonal changes induced by partial rootzone drying of irrigated grapevine. J. Exp. Bot. 2000, 51, 1627–1634. [Google Scholar] [CrossRef] [PubMed] [Green Version]
- Morison, J.I.L.; Baker, N.R.; Mullineaux, P.M.; Davies, W.J. Improving water use in crop production. Philos. Trans. R. Soc. B Biol. Sci. 2008, 363, 639–658. [Google Scholar] [CrossRef] [PubMed]
- Kang, S.; Zhang, J. Controlled alternate partial root-zone irrigation: Its physiological consequences and impact on water use efficiency. J. Exp. Bot. 2004, 55, 2437–2446. [Google Scholar] [CrossRef] [PubMed]
- Liu, F.L.; Shahnazari, A.; Andersen, M.N.; Jacobsen, S.-E.; Jensen, C.R. Physiological responses of potato (Solanum tuberosum L.) to partial root-zone drying: ABA signalling, leaf gas exchange, and water use efficiency. J. Exp. Bot. 2006, 57, 3727–3735. [Google Scholar] [CrossRef] [PubMed]
- Dodd, I.C. Measuring and modelling xylem ABA concentration ([X-ABA]) in tomato plants exposed to deficit irrigation (DI) and partial rootzone drying (PRD). Acta Hortic. 2008, 792, 225–231. [Google Scholar] [CrossRef]
- Boyle, R.K.A.; McAinsh, M.; Dodd, I.C. Daily irrigation attenuates xylem abscisic acid concentration and increases leaf water potential of Pelargonium x hortorum compared with infrequent irrigation. Physiol. Plant. 2016, 158, 23–33. [Google Scholar] [CrossRef] [PubMed]
- Dodd, I.C.; Puertolas, J.; Huber, K.; Perez-Perez, J.G.; Wright, H.R.; Blackwell, M.S.A. The importance of soil drying and re-wetting in crop phytohormonal and nutritional responses to deficit irrigation. J. Exp. Bot. 2015, 66, 2239–2252. [Google Scholar] [CrossRef] [PubMed]
- Hayes, F.; Sharps, K.; Harmens, H.; Roberts, I.; Mills, G. Tropospheric ozone pollution reduces the yield of African crops. J. Agron. Crop Sci. 2019. submitted for publication. [Google Scholar]
- Pleijel, H.; Broberg, M.C.; Uddling, J.; Mills, G. Current surface ozone concentrations significantly decrease wheat growth, yield and quality. Sci. Total Environ. 2018, 613–614, 687–692. [Google Scholar] [CrossRef] [PubMed]
- Mills, G.; Hayes, F.; Simpson, D.; Emberson, L.; Norris, D.; Harmens, H.; Büker, P. Evidence of widespread effects of ozone on crops and (semi-)natural vegetation in Europe (1990–2006) in relation to AOT40-and flux-based risk maps. Glob. Chang. Biol. 2011, 17, 592–613. [Google Scholar] [CrossRef]
- Harmens, H.; Hayes, F.; Mills, G.; Sharps, K.; Osborne, S.; Pleijel, H. Wheat yield responses to stomatal uptake of ozone: Peak vs. rising background ozone conditions. Atmos. Environ. 2018, 173, 1–5. [Google Scholar] [CrossRef]
- Osborne, S.; Pandey, D.; Mills, G.; Hayes, F.; Harmens, H.; Gillies, D.; Büker, P.; Emberson, L. New insights into leaf physiological responses to ozone for use in crop modelling. Plants 2019, 8, 84. [Google Scholar] [CrossRef] [PubMed]
- Farage, P.K.; Long, S.P.; Lechner, E.G.; Baker, N.R. The sequence of change within the photosynthetic apparatus of wheat following short-term exposure to ozone. Plant Physiol. 1991, 95, 529–535. [Google Scholar] [CrossRef] [PubMed]
- Martin, M.J.; Farage, P.K.; Humphries, S.W.; Long, S.P. Can the stomatal changes caused by acute ozone exposure be predicted by changes occurring in the mesophyll? A simplification for models of vegetation response to the global increase in tropospheric elevated ozone episodes. Funct. Plant Biol. 2000, 27, 211–219. [Google Scholar] [CrossRef]
- Wilkinson, S.; Davies, W.J. Drought, ozone, ABA and ethylene: New insights from cell to plant to community. Plant Cell Environ. 2010, 33, 510–525. [Google Scholar] [CrossRef] [PubMed]
- Wilkinson, S.; Davies, W.J. Ozone suppresses soil drying and abscisic acid (ABA)-induced stomatal closure via an ethylene-dependent mechanism. Plant Cell Environ. 2009, 32, 949–959. [Google Scholar] [CrossRef] [PubMed]
- Mills, G.; Hayes, F.; Wilkinson, S.; Davies, W.J. Chronic exposure to increasing background ozone impairs stomatal functioning in grassland species. Glob. Chang. Biol. 2009, 15, 1522–1533. [Google Scholar] [CrossRef]
- Emberson, L.D.; Pleijel, H.; Ainsworth, E.A.; Van den Berg, M.; Ren, W.; Osborne, S.; Mills, G.; Pandey, D.; Dentener, F.; Büker, P.; et al. Ozone effects on crops and consideration in crop models. Eur. J. Agron. 2018, 100, 19–34. [Google Scholar] [CrossRef]
- Ewert, F.; Porter, J.R. Ozone effects on wheat in relation to CO2: Modelling short-term and long-term responses of leaf photosynthesis and leaf duration. Glob. Chang. Biol. 2000, 6, 735–750. [Google Scholar] [CrossRef]
- Schauberger, B.; Rolinksi, S.; Schaphoff, S.; Müller, C. Global historical soybean and wheat yield loss estimates from ozone pollution considering water and temperature as modifying effects. Agric. For. Meteorol. 2019, 265, 1–15. [Google Scholar] [CrossRef]
- Medrano, H.; Tomás, M.; Martorell, S.; Flexas, J.; Hernández, E.; Rosselló, J.; Pou, A.; José-Mariano Escalona, J.-M.; Bota, J. From leaf to whole-plant water use efficiency (WUE) in complex canopies: Limitations of leaf WUE as a selection target. Crop J. 2015, 3, 220–228. [Google Scholar] [CrossRef] [Green Version]
- Tari, A.F. The effects of different deficit irrigation strategies on yield, quality, and water-use efficiencies of wheat under semi-arid conditions. Agric. Water Manag. 2016, 167, 1–10. [Google Scholar] [CrossRef]
- Xu, X.; Zhang, M.; Li, J.; Liu, Z.; Zhao, Z.; Zhang, Y.; Zhou, S.; Wang, Z. Improving water use efficiency and grain yield of winter wheat by optimizing irrigations in the North China Plain. Field Crops Res. 2018, 221, 219–227. [Google Scholar] [CrossRef]
- Gilliham, M.; Chapman, S.; Martin, L.; Jose, S.; Bastow, R. The case for evidence-based policy to support stress-resilient cropping systems. Food Energy Secur. 2017, 6, 5–11. [Google Scholar] [CrossRef]
- Kamwaga, J.; Macharia, G.; Boyd, L.; Chiurugwi, T.; Midgley, I.; Canales, C.; Marcheselli, M.; Maina, I. Kenya Wheat Production Handbook; Kenya Agricultural and Livestock Research Organization: Nairobi, Kenya, 2016; p. 78.
- Hewitt, D.K.L.; Mills, G.; Hayes, F.; Wilkinson, S.; Davies, W. Highlighting the threat from current and near-future ozone pollution to clover in pasture. Environ. Pollut. 2014, 189, 111–117. [Google Scholar] [CrossRef] [PubMed] [Green Version]
- Team, T.C. R: A Language and Environment for Statistical Computing; R Foundation for Statistical Computing: Vienna, Austria, 2018. [Google Scholar]
- Bates, D.; Maechler, M.; Bolker, B.; Walker, S. Fitting linear mixed-effects models using lme4. J. Stat. Softw. 2015, 67, 1–48. [Google Scholar] [CrossRef]
- Lenth, R. Emmeans: Estimated Marginal Means, Aka Least-Squares Means. R Package Version 1.3.3. 2019. Available online: https://CRAN.R-project.org/package=emmeans (accessed on 1 April 2019).
- Pinheiro, J.; Bates, D.; DebRoy, S.; Sarkar, D. Nlme: Linear and Nonlinear Mixed Effects Models. R Package Vers. 2006, 3, 1–73. [Google Scholar]
- Crawley, M.J. The R Book, 2nd ed.; John Wiley & Sons: New York, NY, USA, 2013. [Google Scholar]
- Burnham, K.P.; Anderson, D.R. Model Selection and Multimodel Inference: A Practical Information-Theoretic Approach, 2nd ed.; Springer: New York, NY, USA, 2002. [Google Scholar]
- Lewis, F.; Butler, A.; Gilbert, L.A. unified approach to model selection using the likelihood ratio test. Methods Ecol. Evolut. 2011, 2, 155–162. [Google Scholar] [CrossRef]
Figure 1.
Average (± SD) daily profile of soil moisture content at low ozone (O3) (a) at three irrigation regimes (n = 27 (days)), (b) at ID irrigation on day 1 (full watering; n = 13 (days)) and day 2 (very limited watering; n = 14 (days)) and (c) average (± SD; n = 4) soil moisture content at low and high O3 between 14:30 and 15:00 at three watering regimes for the period 26 June–23 July 2018, with high O3 exposure starting on 28 June. Wheat plants were watered between 15:30 and 17:30; WW = well-watered; FD = frequent deficit irrigation; ID = infrequent deficit irrigation; 30 = peak O3 concentration of 30 ppb; 80 = peak O3 concentration of 80 ppb.

Figure 2.
Stomatal conductance (gs) of the flag leaf wheat at low (a,c,e) and high (b,d,f) O3 concentrations and three irrigation regimes between 29 June (only measured at low O3) and 31 July at four different times of the day. The treatments were applied for the period 26 June–23 July 2018, with high O3 exposure starting on 28 June. Data for 29 June were not included in the statistical analysis as they were only obtained for low O3. WW = well-watered (a,b); FD = frequent deficit irrigation (c,d); ID = infrequent deficit irrigation (e,f), with low volume applied on the day before 29 June, 3 July, and 24 July; 30 = peak O3 concentration of 30 ppb; 80 = peak O3 concentration of 80 ppb. Values are averages (± SE; n = 4).

Figure 3.
Light-saturated rate of photosynthesis (a,c) and chlorophyll content index (b,d) of the flag leaf of wheat at low and high O3 concentrations and three irrigation regimes between 28 June and 25 July. The bottom graphs (c—Asat, d—CCI) show the fraction of the values for both parameters at high compared to low O3. The treatments were applied for the period 26 June–23 July 2018, with high O3 exposure starting on 28 June. WW = well-watered; FD = frequent deficit irrigation; ID = infrequent deficit irrigation (with low volume applied on the day before 11 and 18 July); 30 = peak O3 concentration of 30 ppb; 80 = peak O3 concentration of 80 ppb. Values are averages (± SE; n = 4).

Figure 4.
Relationship between Asat and gs (a–c) and CCI (d,e) of the flag leaf of wheat between 28 June and 25 July. For plots a, c, d, filled circles show the model fitted values (for fixed effects), and empty circles show the observed data. For plots b, e, these are modelled fitted values at different dates; circles = low O3, triangles = high O3.

Figure 5.
Yield ((a) grain yield, (b) 1000-grain weight, (c) grain number), and harvest index (d) of wheat at 30 and 80 ppb peak O3 concentrations and three irrigation regimes applied between 26 June and 23 July 2018. WW = well-watered; FD = frequent deficit irrigation; ID = infrequent deficit irrigation. Values are averages (±SE; n = 4).

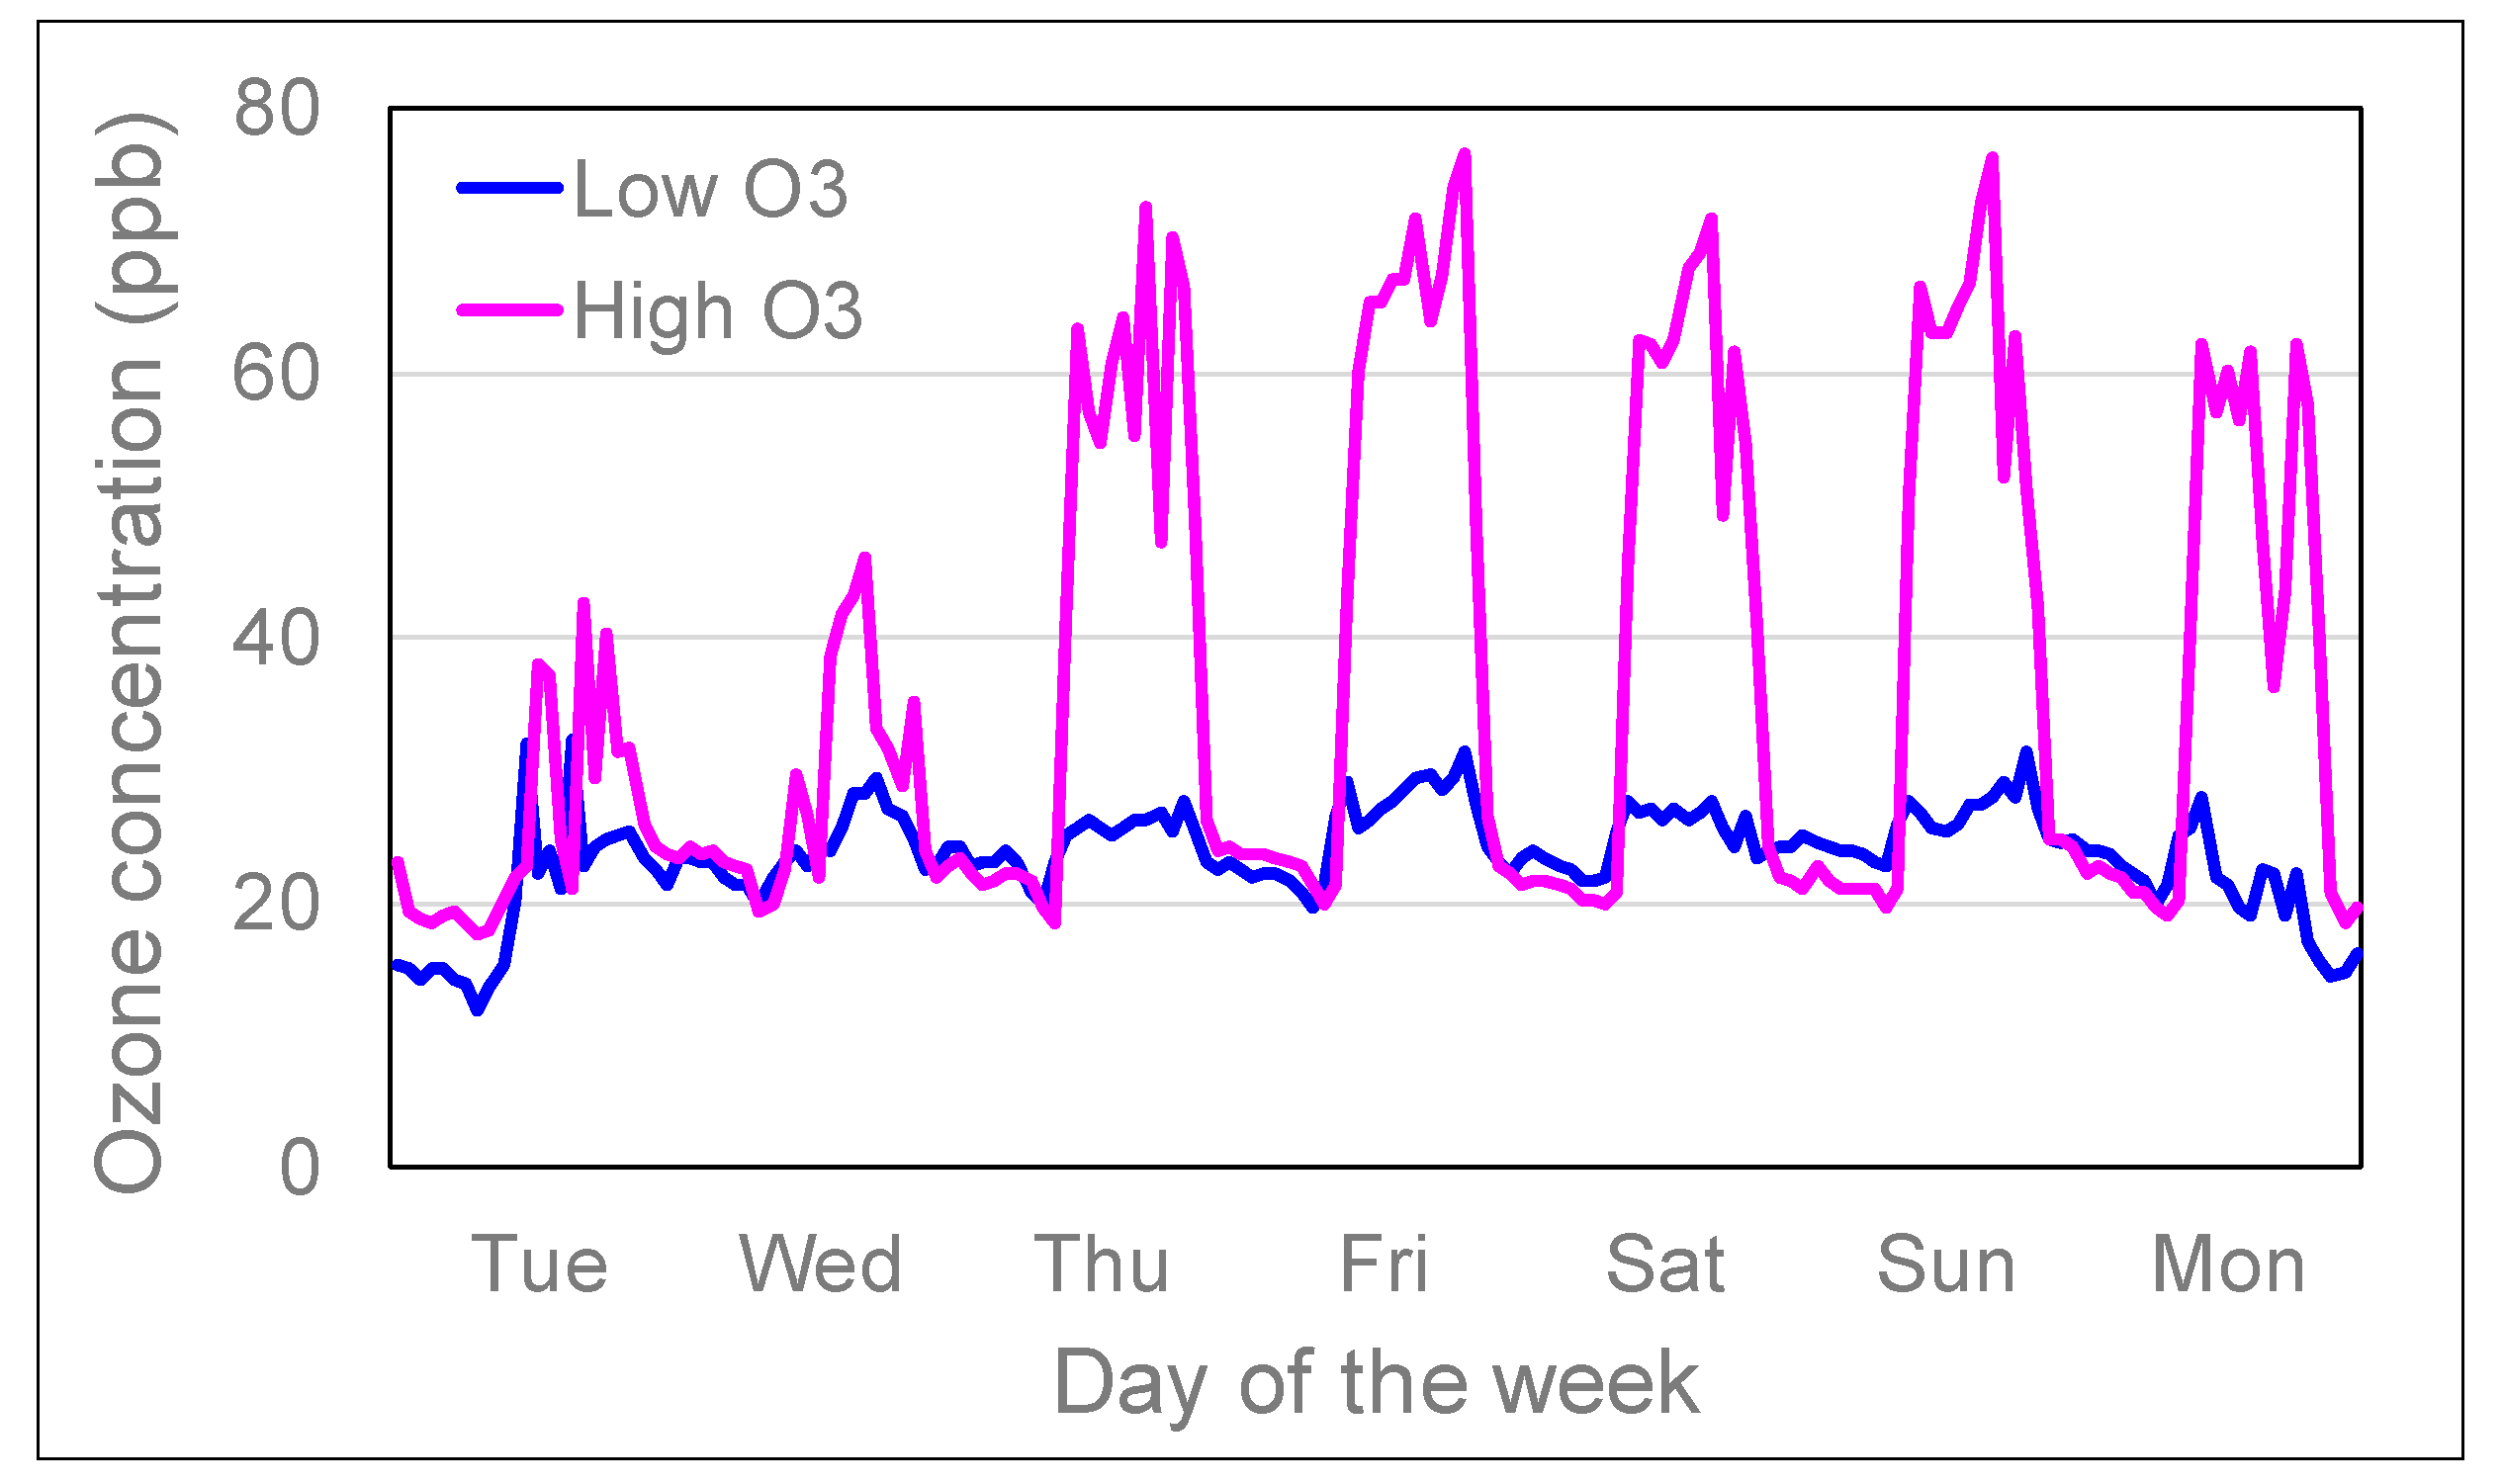
Figure 6.
Average hourly O3 concentrations in ‘low’ and ‘high’ solardomes at Abergwyngregyn, near Bangor, North Wales, between 26 June and 23 July in 2018.
Figure 6.
Average hourly O3 concentrations in ‘low’ and ‘high’ solardomes at Abergwyngregyn, near Bangor, North Wales, between 26 June and 23 July in 2018.


Table 1.
Summary of O3 treatments and climate conditions in the solardomes in 2018.
| Date (2018). | 10/5–25/6 | 26/6–23/7 | 24/7–9/8 | |
|---|---|---|---|---|
| Ozone exposure | Low | Low | High | Low |
| 30.7 | 41.8 | 92.6 | 34.6 |
| 18.9 | 23.7 | 36.5 | 24.5 |
| 19.3 | 24.8 | 45.0 | 27.6 |
| Air temperature | ||||
| 20.1 | 24.9 | 24.9 | 22.2 |
| 24.6 | 31.4 | 31.4 | 25.2 |
| 27.7 | 33.9 | 33.9 | 30.2 |
| Photosynthetically active radiation (PAR) | ||||
| 633 | 725 | 725 | 557 |
| 1033 | 1129 | 1129 | 979 |
© 2019 by the authors. Licensee MDPI, Basel, Switzerland. This article is an open access article distributed under the terms and conditions of the Creative Commons Attribution (CC BY) license (http://creativecommons.org/licenses/by/4.0/).
Share and Cite
MDPI and ACS Style
Harmens, H.; Hayes, F.; Sharps, K.; Radbourne, A.; Mills, G. Can Reduced Irrigation Mitigate Ozone Impacts on an Ozone-Sensitive African Wheat Variety? Plants 2019, 8, 220. https://doi.org/10.3390/plants8070220
AMA Style
Harmens H, Hayes F, Sharps K, Radbourne A, Mills G. Can Reduced Irrigation Mitigate Ozone Impacts on an Ozone-Sensitive African Wheat Variety? Plants. 2019; 8(7):220. https://doi.org/10.3390/plants8070220
Chicago/Turabian StyleHarmens, Harry, Felicity Hayes, Katrina Sharps, Alan Radbourne, and Gina Mills. 2019. "Can Reduced Irrigation Mitigate Ozone Impacts on an Ozone-Sensitive African Wheat Variety?" Plants 8, no. 7: 220. https://doi.org/10.3390/plants8070220
Note that from the first issue of 2016, this journal uses article numbers instead of page numbers. See further details here.