Modeling and Optimisation of a Solar Energy Harvesting System for Wireless Sensor Network Nodes


1
KIET Group of Institutions, APJ Abdul Kalam Technical University (AKTU), Ghaziabad-201206 U.P., India
2
Department of Electrical Engineering, Jamia Millia Islamia, New Delhi-110025, India
*
Author to whom correspondence should be addressed.
J. Sens. Actuator Netw. 2018, 7(3), 40; https://doi.org/10.3390/jsan7030040
Submission received: 29 June 2018
/
Revised: 1 September 2018
/
Accepted: 3 September 2018
/
Published: 7 September 2018
(This article belongs to the Special Issue Wireless Sensor and Actuator Networks for Smart Cities)
Abstract
:The Wireless Sensor Networks (WSN) are the basic building blocks of today’s modern internet of Things (IoT) infrastructure in smart buildings, smart parking, and smart cities. The WSN nodes suffer from a major design constraint in that their battery energy is limited and can only work for a few days depending upon the duty cycle of operation. The main contribution of this research article is to propose an efficient solar energy harvesting solution to the limited battery energy problem of WSN nodes by utilizing ambient solar photovoltaic energy. Ideally, the Optimized Solar Energy Harvesting Wireless Sensor Network (SEH-WSN) nodes should operate for an infinite network lifetime (in years). In this paper, we propose a novel and efficient solar energy harvesting system with pulse width modulation (PWM) and maximum power point tracking (MPPT) for WSN nodes. The research focus is to increase the overall harvesting system efficiency, which further depends upon solar panel efficiency, PWM efficiency, and MPPT efficiency. Several models for solar energy harvester system have been designed and iterative simulations were performed in MATLAB/SIMULINK for solar powered DC-DC converters with PWM and MPPT to achieve optimum results. From the simulation results, it is shown that our designed solar energy harvesting system has 87% efficiency using PWM control and 96% efficiency by using the MPPT control technique. Finally, an experiment for PWM controlled SEH-WSN is performed using Scientech 2311 WSN trainer kit and a Generic LM2575 DC-DC buck converter based solar energy harvesting module for validation of simulation results.
1. Introduction
In the 21st century, the design of efficient renewable energy harvesting system is the most important technological challenge due to the increase in global warming and other environmental issues. Recently, in August 2016, the ZigBee Alliance, USA has announced the new standard for Energy harvesting wireless sensor networks (EHWSNs) which is known as ZigBee Green Power (GP) [1]. The amendments in the IEEE 802.15.4 communication standard protocol for low data rate wireless networks and the ZigBee Green Power (GP) standard for EHWSNs facilitate the use of the Green Power feature for ZigBee applications running on the low power wireless microcontroller platforms [2]. Nowadays, the commercial companies like Texas Instruments, ST Microelectronics, and Linear Technology, USA are proposing the renewable energy harvesting based power management solutions for wireless sensor networks (WSN). The design of an efficient solar energy harvesting systems is necessary for long network lifetime solar energy harvesting wireless sensor networks. In SEH-WSN nodes, the harvester system takes the input from solar photovoltaic energy and converts it into electrical energy. Then, this electrical energy is used to charge the WSN node battery and provides the operating voltage to the sensor node. The advantage of using energy harvesting in WSN nodes is that it reduces the human efforts required to replace the battery of hundreds or thousands of sensor nodes by going out into remote areas for volcano monitoring, glacier monitoring, forest monitoring and battlefield monitoring applications. The energy harvesting enabled WSN nodes increases the overall sensor network operation lifetime. The SEH-WSN node is powered by ambient solar photovoltaic (PV) energy and can measure the temperature, light, humidity, and pressure simultaneously. Then, it sends the measured data to the remote WSN node wirelessly using Zigbee wireless communication protocol. The theoretical maximum distance limit in ZigBee (IEEE 802.15.4 standard) is up to 100 m with a maximum data rate of 250 kbps. The main contributions and innovations of this research article are as follows:
- (1)
- A novel solar energy harvesting 3.6 volts battery charger using Pulse Width Modulation (PWM) control technique using MATLAB/Simulink.
- (2)
- A novel solar energy harvesting 3.6 volts battery charger using Perturb & Observation (P&O) type Maximum Power Point Tracking (MPPT) control technique using MATLAB/Simulink.
- (3)
- A novel hardware implementation of a solar battery charger using PWM control technique Solar Panel, DC-DC Buck Converter, and Scientech 2311 WSN trainer kit.
- (4)
- The innovation claim entails the integration of a Commercial WSN trainer Kit (Scientech 2311) with a solar panel and a PWM controlled DC-DC converter, and showing the output on Digital Storage Oscilloscope (DSO).
- (5)
- Another innovation claim made here involves the MATLAB/Simulink based implementation of solar energy harvester system to charge 3.6 volts battery using MATLAB/Simulink. This rechargeable battery is used to provide power to the WSN node.
In 2008, Ref. [3] proposed the modeling and optimization of a solar energy harvester system for self-powered wireless sensor networks. They proposed a Boost Converter model with MPPT. In this model, they considered variations in irradiance (W/m2) and variations in Inductor (L) and capacitor (C) values to observe the effect on output efficiency. The maximum achieved efficiency is only 85% using theoretical simulation results. In 2009, Ref. [4] proposed the design of a solar-harvesting circuit for battery-less Embedded Systems. In this paper, the simulation results show that by using efficient solar energy harvester circuits, the sensor network lifetime can be increased from a few days to 20–30 years and higher. Section 1 provides an overview of a basic Solar Energy Harvesting System. Section 2 presents the operation of a SEH-WSN Node. Section 3 provides two types of solar energy harvester systems, i.e., pulse width modulation (PWM) controlled and P&O MPPT controlled. Section 4 presents the modeling of the solar cell and solar panels. Section 5 provides modeling of DC-DC Buck converters, and Section 6 provides modeling of maximum power point tracking techniques (MPPTs). The Section 7 provides simulation parameters and Section 8 provides simulation results. In Section 9, Energy harvester systems efficiency calculations are shown, and in Section 10, a hardware experiment is performed for SEH-WSN nodes. Finally, Section 11 provides the conclusion for simulation results and hardware experiment validation.
2. Operation of an SEH-WSN Node
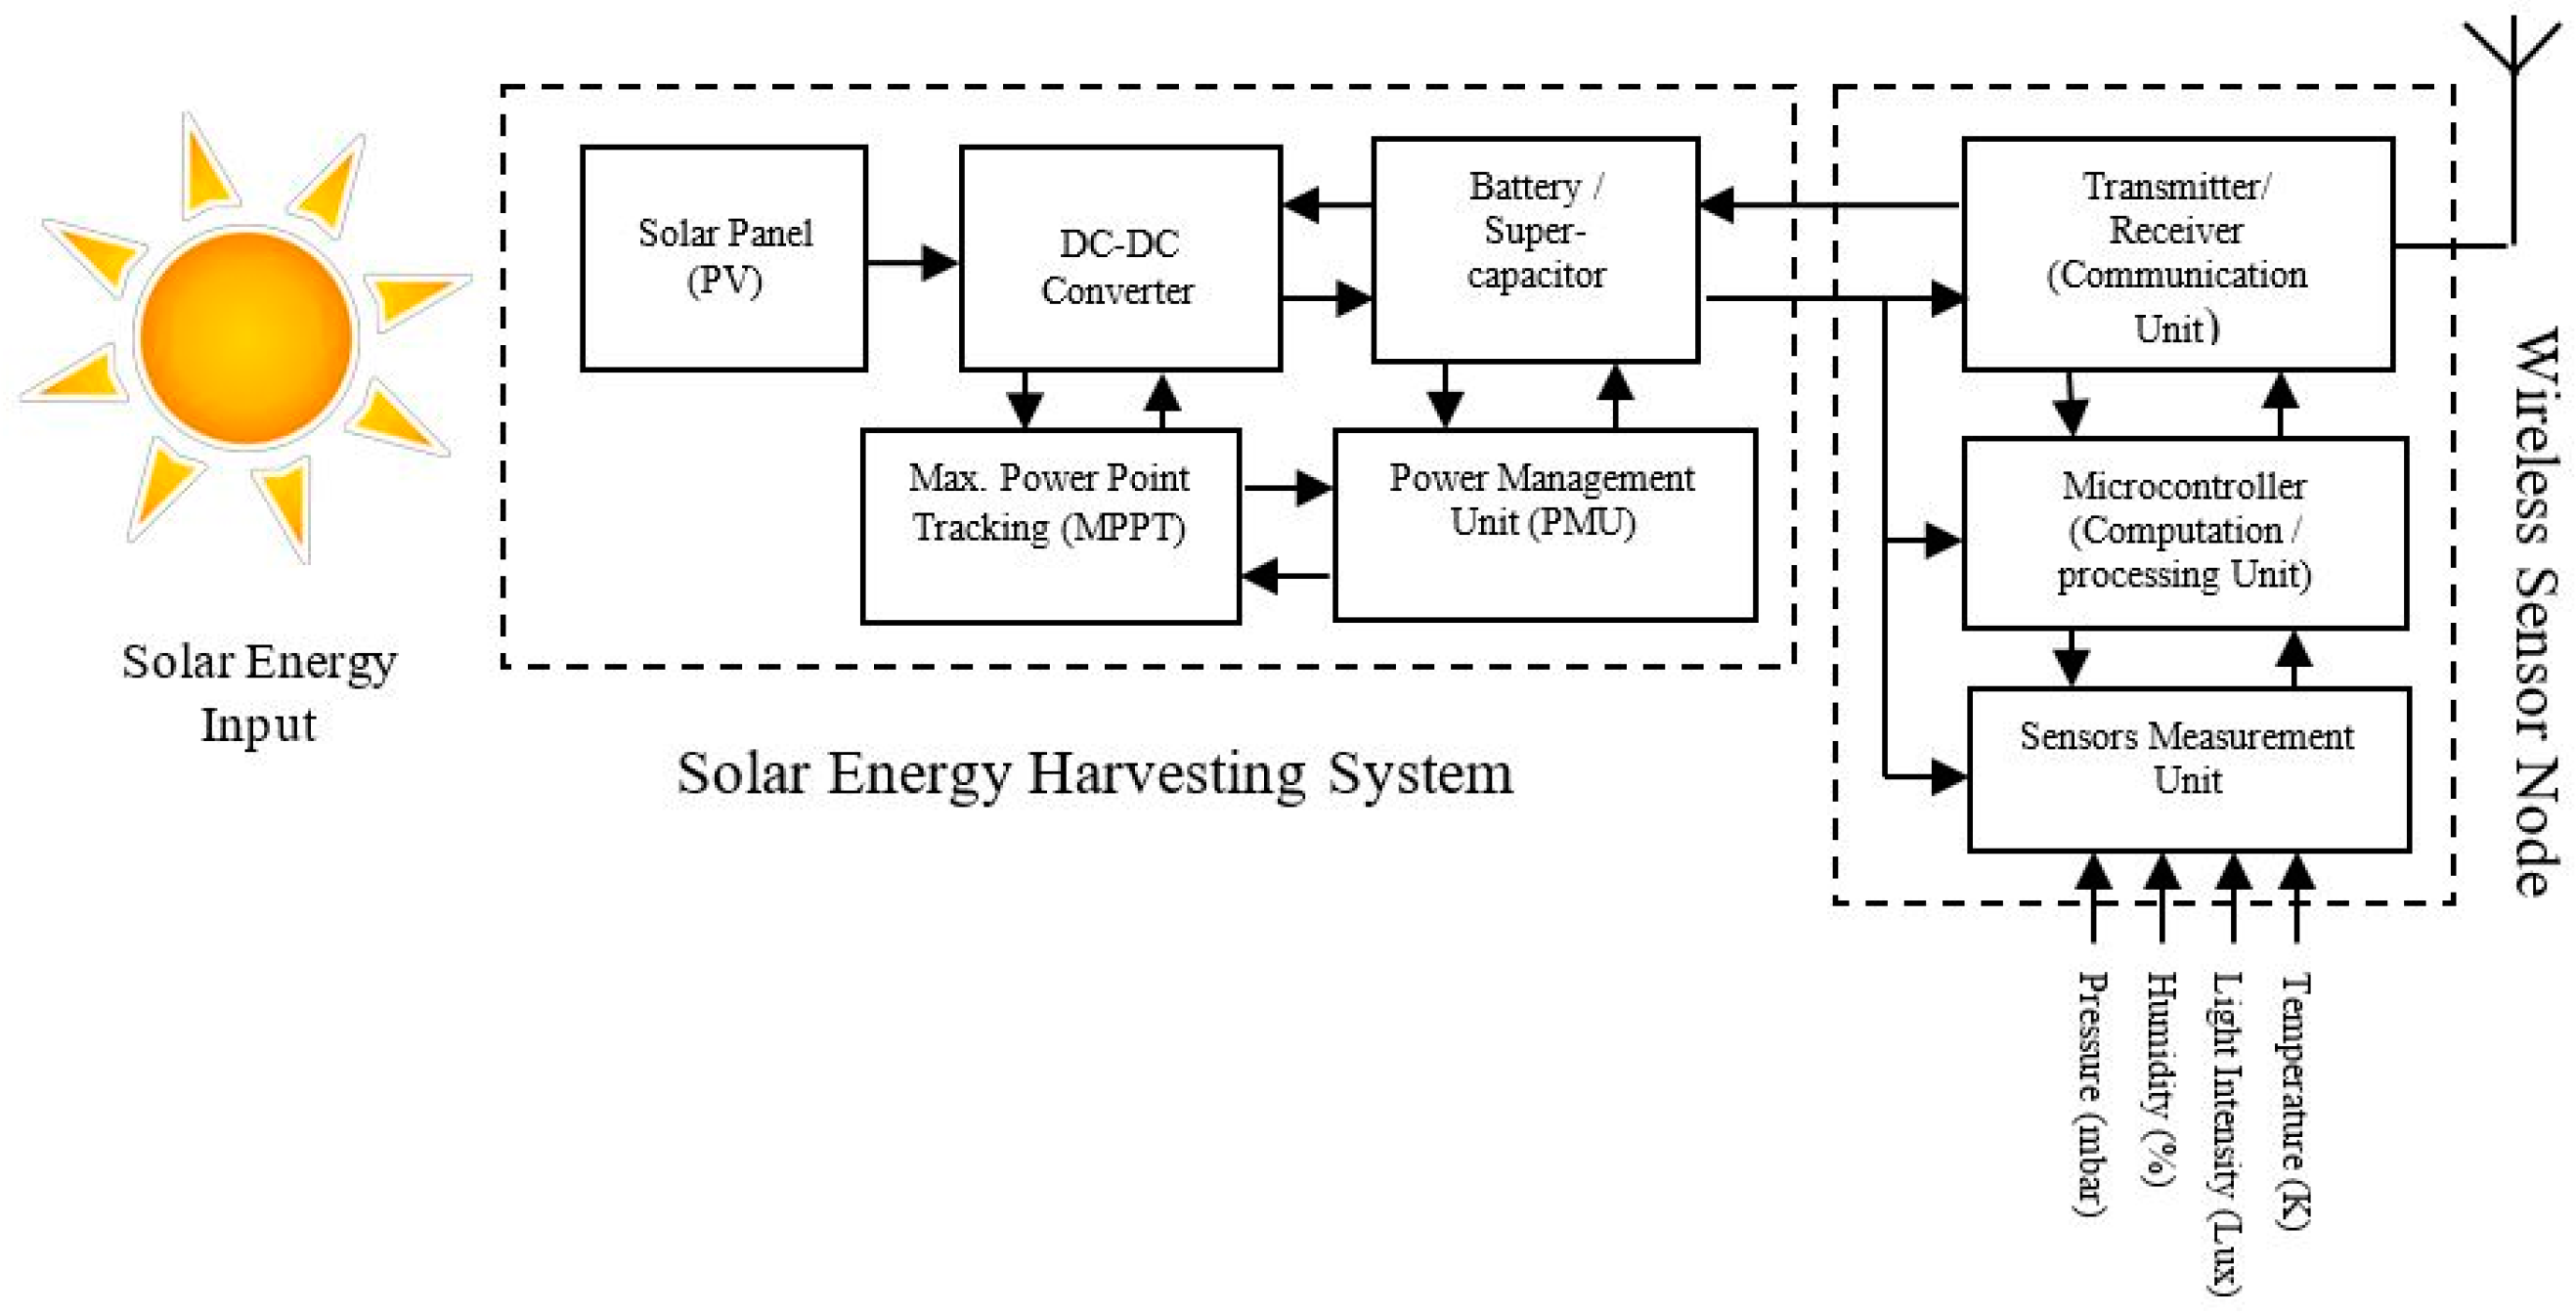
The internal block diagram of an SEH-WSN node is shown in Figure 1. The solar energy-harvesting system provides a DC power supply (3.6 volts, Tektronix, Inc., Beaverton, OR, USA) to the WSN node. This voltage is harvested from the ambient sunlight by using the solar panels [5]. The solar panel converts light energy directly into the DC electrical energy. The DC-DC converter regulates this DC voltage to charge the battery. The rechargeable battery powers the WSN node. The WSN node measures the desired physical quantity (e.g., temp., light, humidity, and pressure) by using the sensor measurement unit. A microcontroller in computation unit processes this sensed data.
The measured or sensed data is sent to the nearby network node wirelessly, in the form of data packets using the transmitter unit. The information is sent to the USB gateway node via cluster head nodes [6] from the end nodes. Finally, the user can remotely monitor & control the application process e.g., temperature monitoring, control of an industrial boiler plant, volcano monitoring, glacier monitoring, forest monitoring, battlefield monitoring applications, air conditioner cooling system control, traffic light management in a smart city.
3. Solar Energy Harvesting System
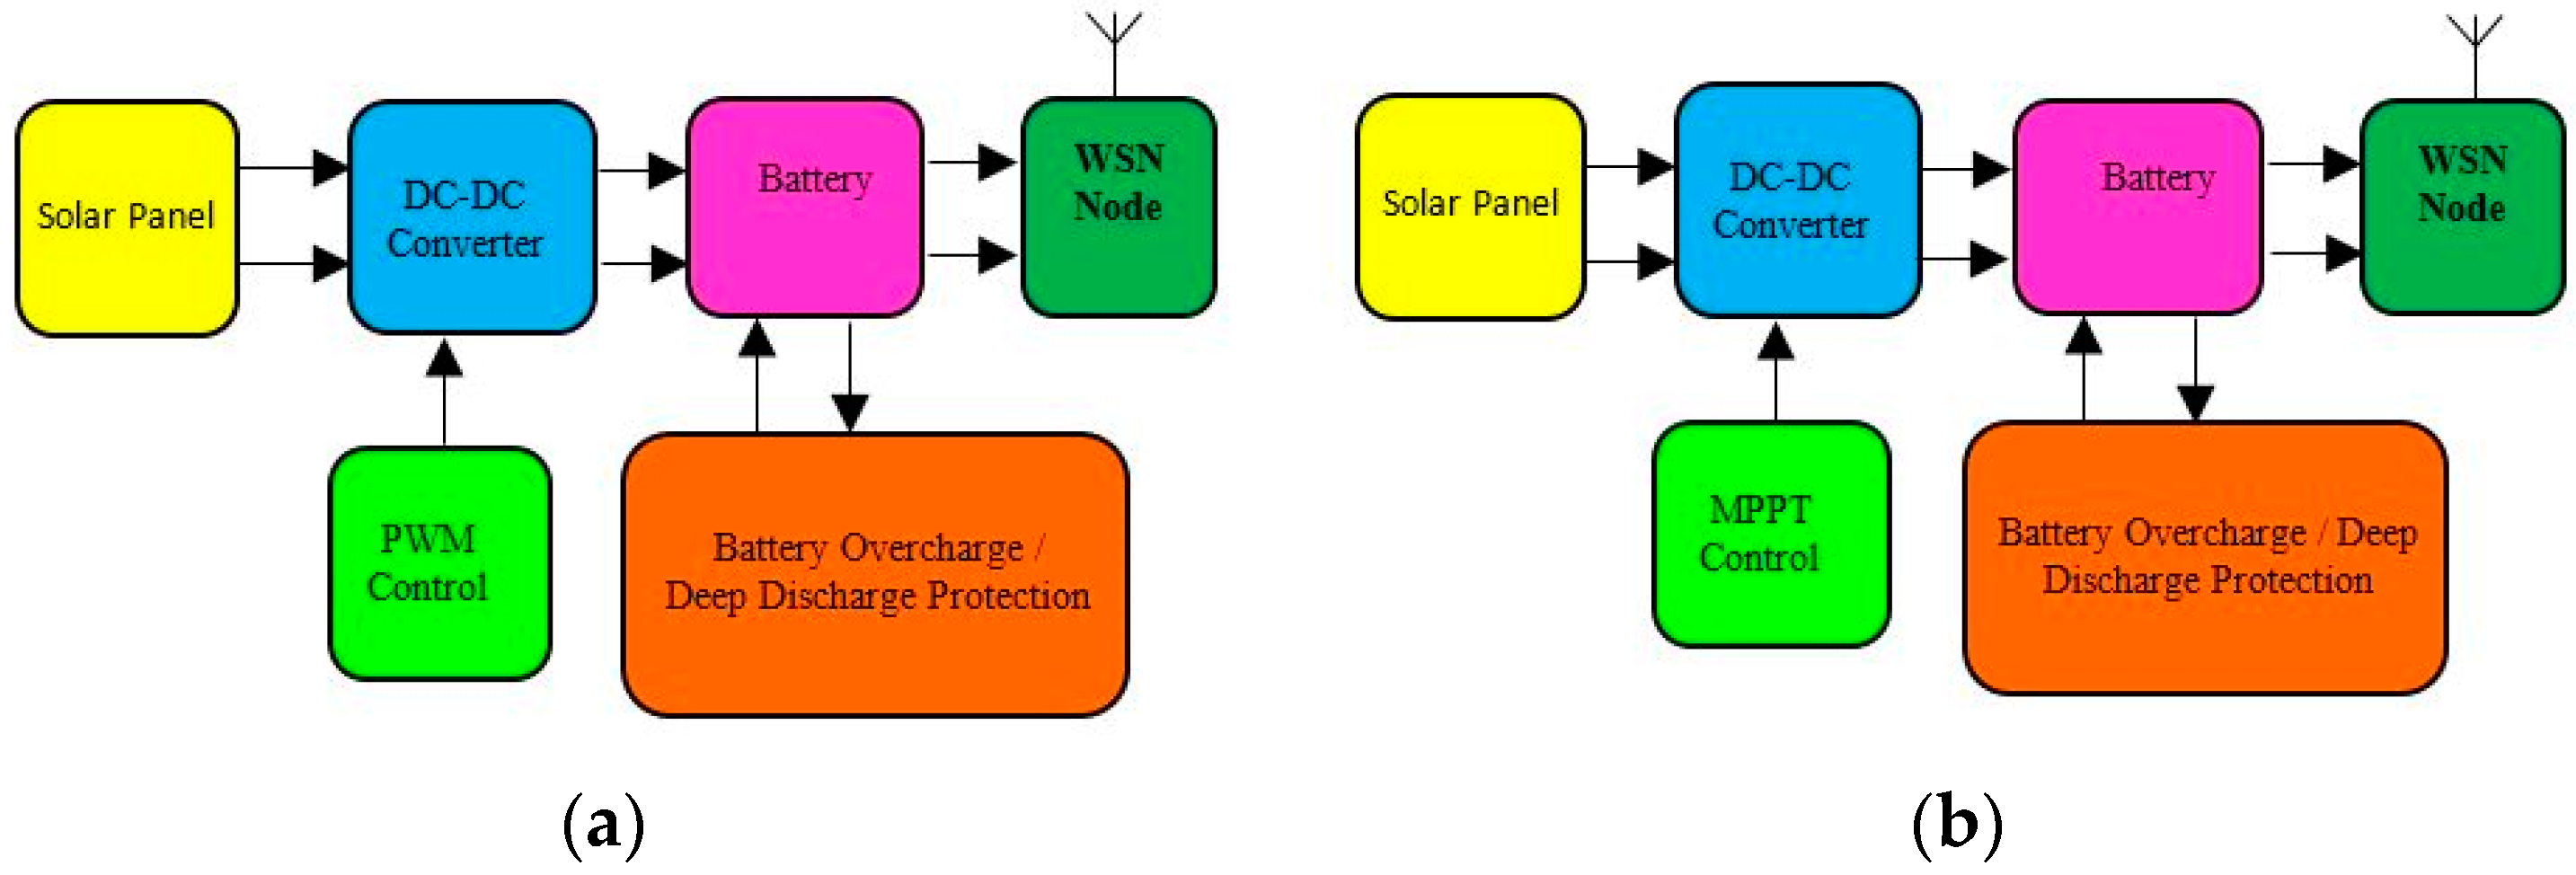
A basic solar energy harvesting system consists of a Solar Panel, DC-DC converter, rechargeable battery, a battery charge protection circuit called battery management system (BMS) and DC-DC converter control unit. Generally, there are two types of DC-DC converter control methods: (1) Pulse width modulation (PWM) control and (2) Maximum power point tracking (MPPT) control. The Figure 2a shows a block diagram of a pulse width modulation (PWM) controlled DC-DC buck converter. Similarly, the Figure 2b shows the block diagram of Perturb & Observation (P&O) maximum power point tracking (MPPT) controlled solar energy harvester (SEH) system. In Figure 2b, the SEH system consists of a solar panel, a DC-DC buck converter, a rechargeable battery, a maximum power point (MPPT) controller, and a WSN sensor node connected as a DC load. The ambient solar light energy is harvested using the solar panel and converted into the electrical energy. The DC-DC Buck converter steps down and regulates the magnitude of this harvested voltage, and supplied to the rechargeable battery. The MPPT controller tracks the voltage and current from the solar panel and adjusts the duty cycle accordingly for the MOSFET of DC-DC Buck converter [7]. Finally, the battery voltage is utilized to operate the wireless sensor node. The WSN performs the function of sensing, computation, and communication with other similar characteristics nodes. Thus, autonomous operation of monitoring and control of any physical phenomenon such as temperature, humidity, pressure or acceleration can be achieved using the SEH-WSN nodes. In this whole scenario, the efficiency of the solar energy harvester circuit plays a very important role. If the efficiency of the solar energy harvester system is poor, then the battery will not get recharged properly and hence the wireless sensor network lifetime will reduce.
4. Modeling of a Solar PV Panel
A solar cell (also called photovoltaic cell) is a semiconductor device, which converts the light energy into electrical energy [8]. When a photon of light energy (hv > Eg) is incident over a solar cell the electron-hole pair (EHP) is generated. This newly generated EHP contributes to the electric current called a light generated current denoted by (IL). The ideal theoretical current-voltage (I–V) equation of a solar cell is given as
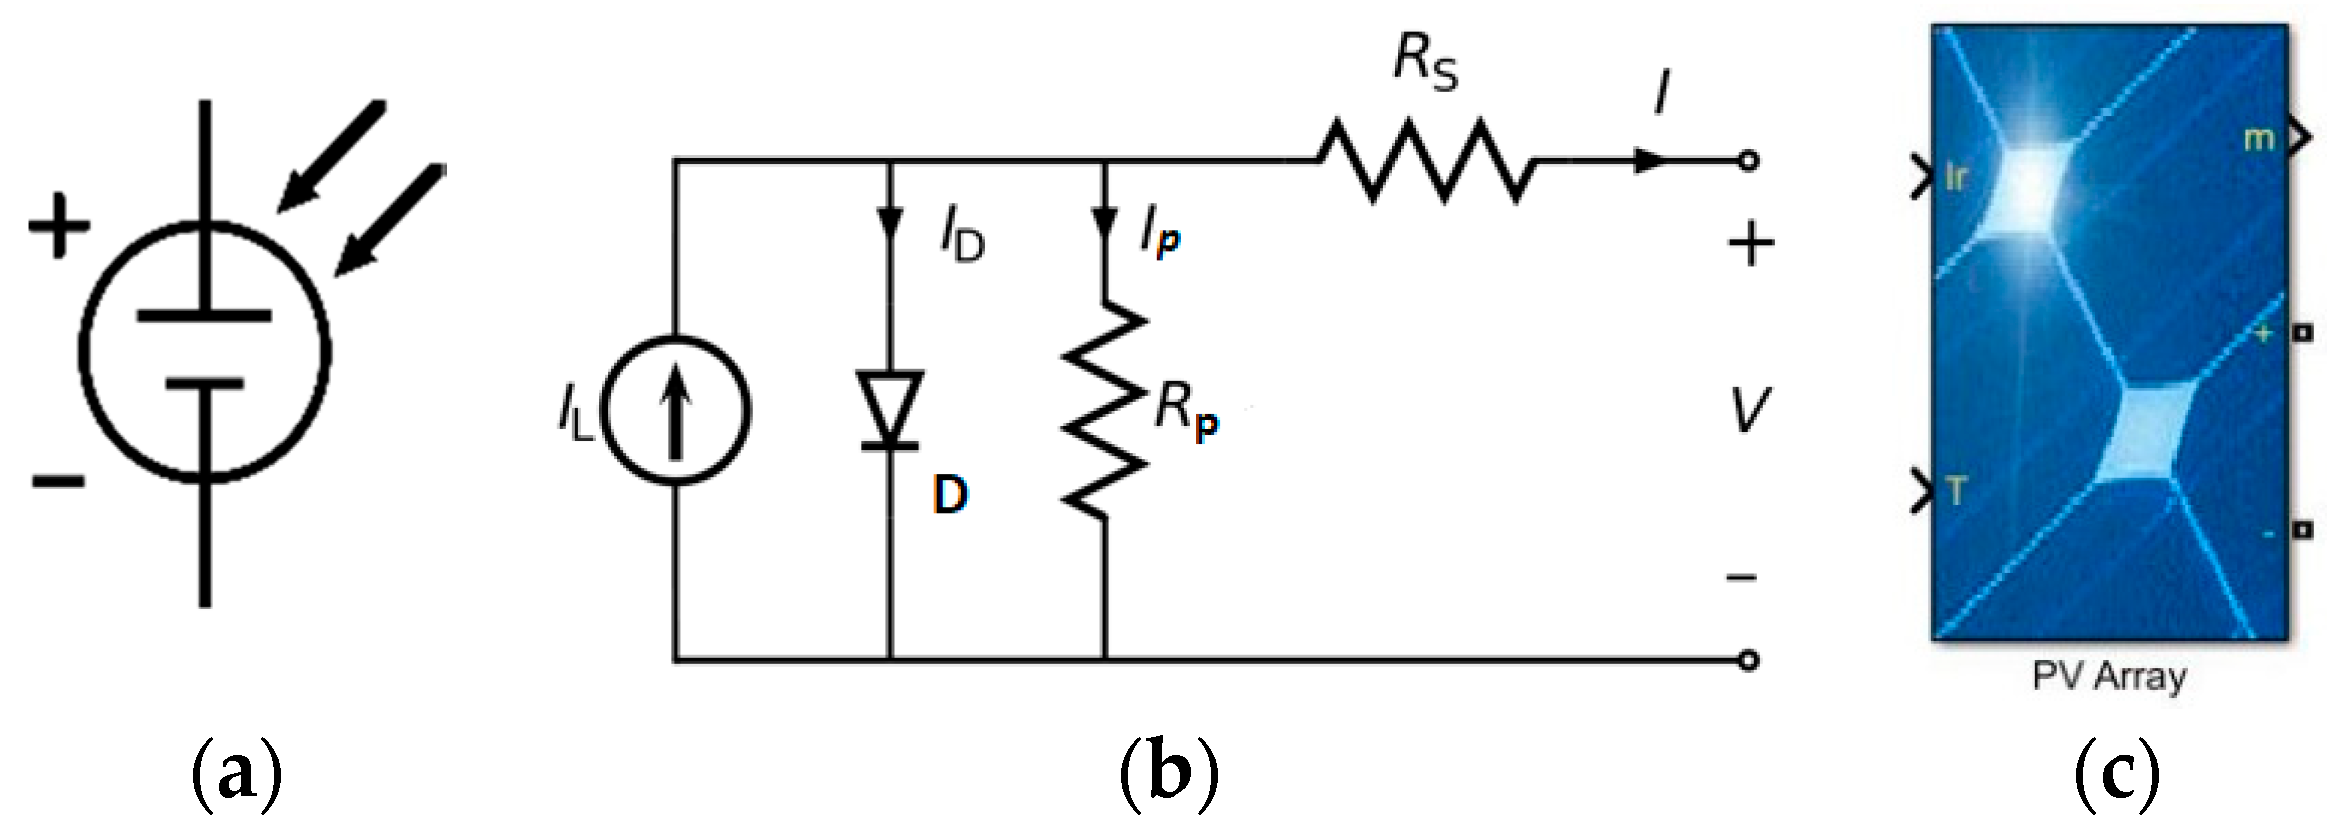
where, I = total output current of solar cell, IL = Light generated current by the solar cell, Io = Reverse Saturation current due to recombination, q = charge of electron (1.6 × 10⁻¹⁹ C), V = open circuit voltage of solar cell, k = Boltzmann’s constant (1.38 × 10⁻²³ J/K), T = Temperature of Solar cell (300 K). The symbol of the solar cell is shown in Figure 3a. The solar cell equivalent circuit model can be represented as shown in Figure 3b. It consists of a light generated current source (IL), a diode (D) modeled by Shockley equation, and two series and parallel resistances. A MATLAB Simulink model for a solar panel is shown in Figure 3c. In Figure 3b, Kirchhoff’s current law (KCL) can give the characteristic current equation for this equivalent circuit:
where, Ip = current in parallel resistance, IL = Light generated current, and ID = diode current.
where, Io = Reverse Saturation current due to recombination, V = open circuit voltage of solar cell, I = solar cell output current, Rs = series resistance, n = diode ideality factor, (1 for ideal, 2 for practical diode), VT = Thermal voltage (kT/q), k = Boltzmann’s constant (1.38 × 10⁻²³ J/K), T = Temperature of Solar cell (300 K). q = charge of electron (1.6 × 10⁻¹⁹ C). The current in parallel resistance is given as:
Output Current of Equivalent Cell Model (I) = IL − ID − Ip
Now, putting the value of ID and Ip in current Equation (2), we get the complete IV equation of the equivalent circuit of a single solar Cell, for which related all parameters with output current and voltage are given as [9]:
where, Rp = Parallel Resistance and remaining parameters IL, Io, q, V, I, Rs, n, k, T have been already defined in Equation (3). The efficiency (η) of the solar cell is given as:
where, Voc is called Open Circuit Voltage, Isc is Short Circuit Current, FF is Fill Factor and Pin = incident optical power. The Fill Factor (FF) of a solar cell is given as
where, Im is called maximum current and Vm is the maximum voltage of the solar cell. Practically, there are many types of solar cells, such as monocrystalline silicon solar cell (c-Si), Amorphous Silicon solar cell (a-Si), Polycrystalline solar cell (multi-Si), Thin-film solar cell (TFSC) etc. However, the efficiency of a-Si solar cells is more than all others up to 18% efficiency [10].
4.1. Effect of Solar Radiation (G)
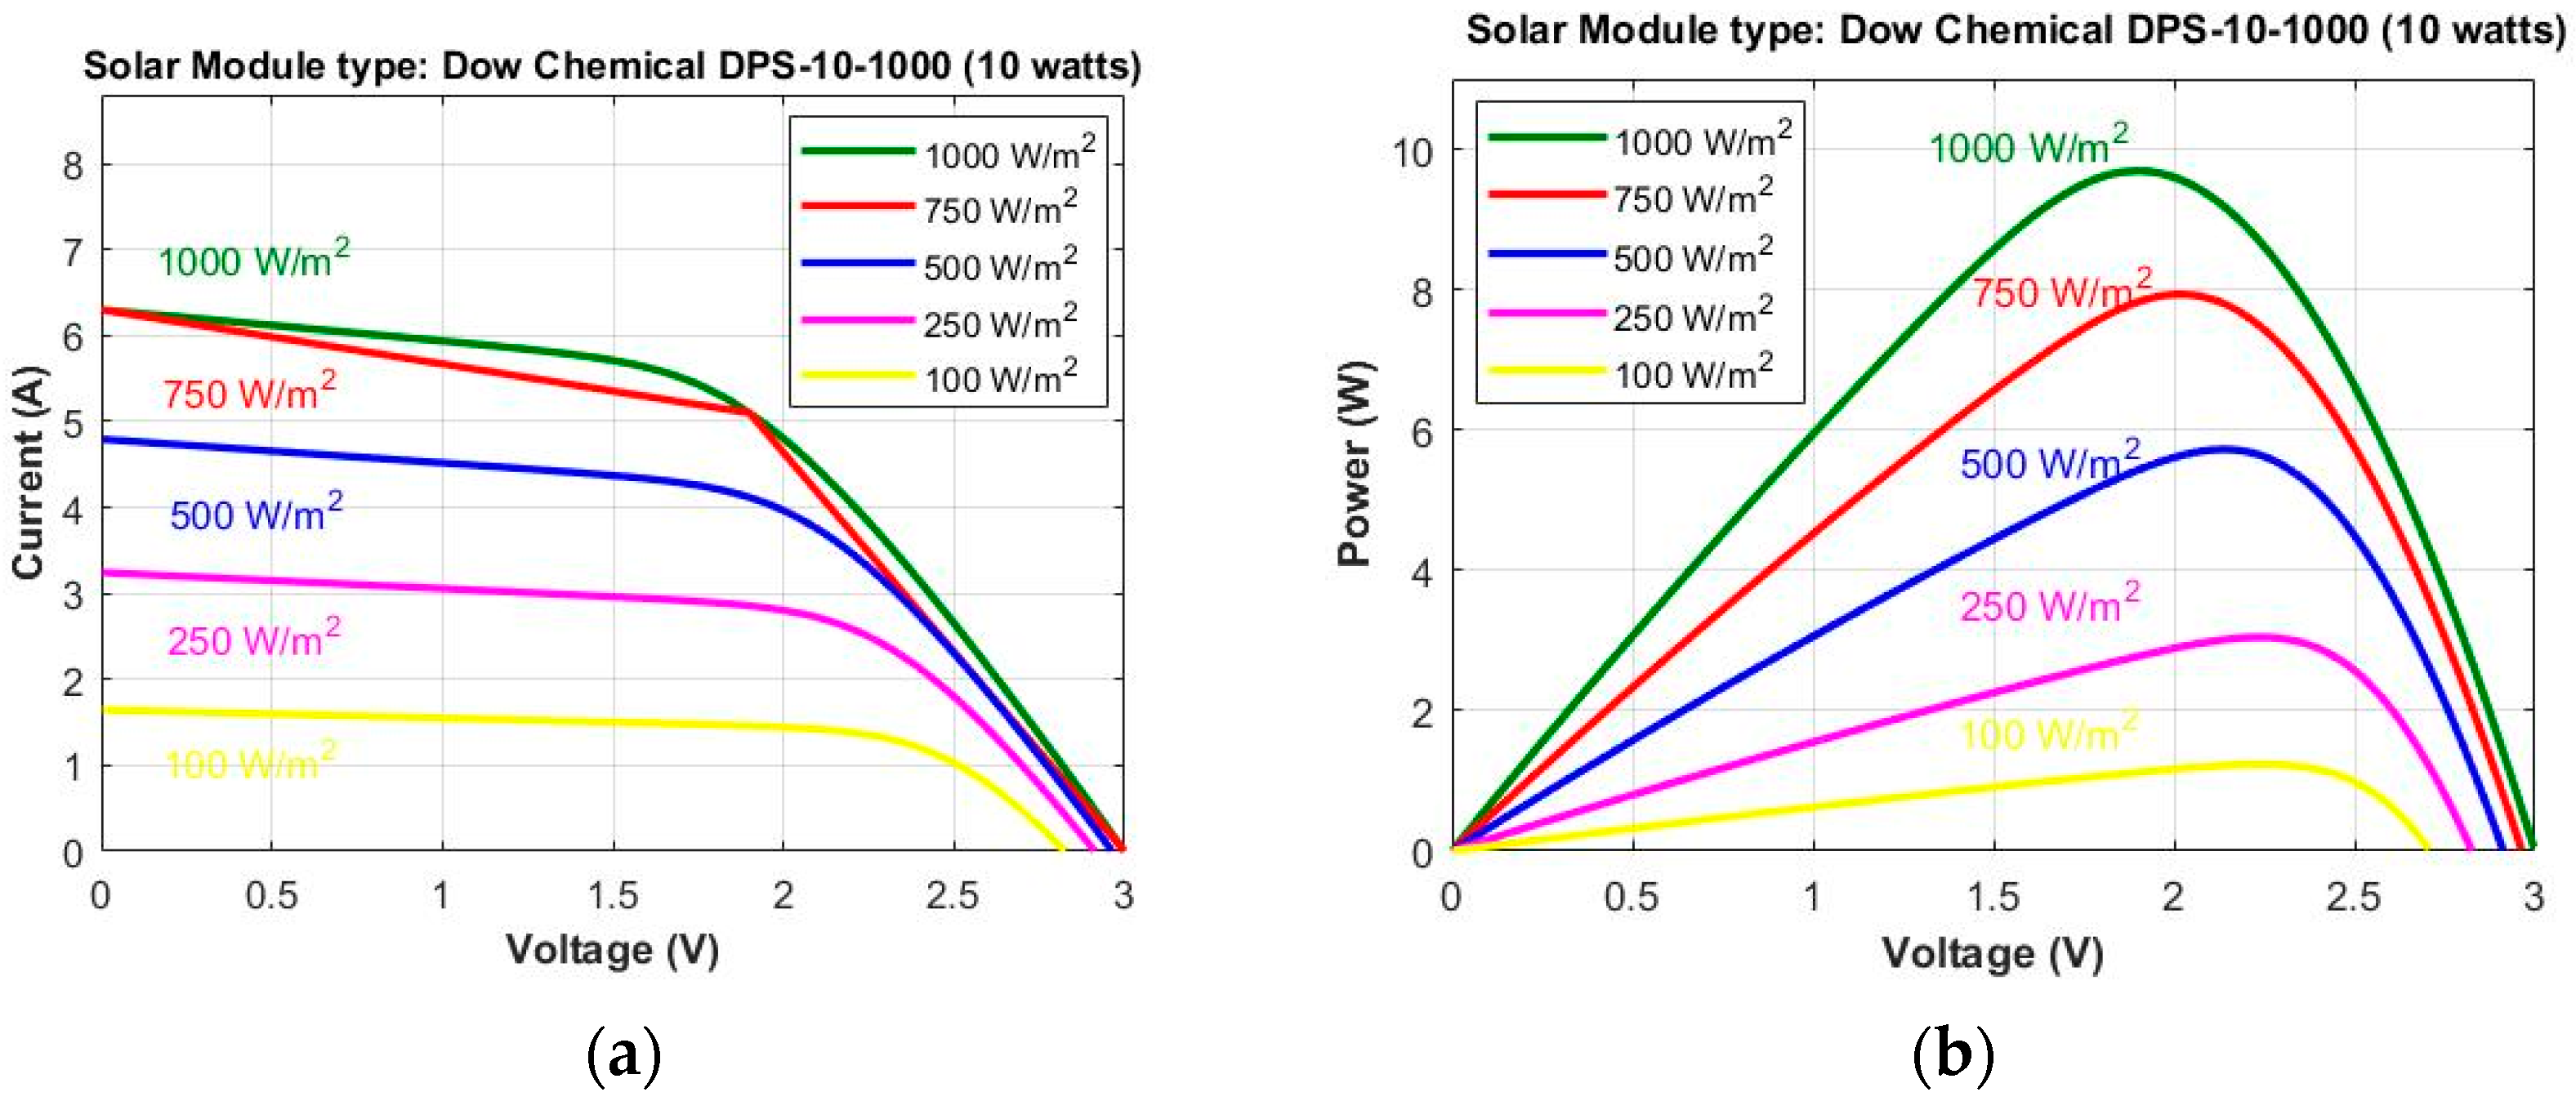
The solar cell efficiency () is directly proportional to variations in solar radiations. If solar radiation increases, then the solar cell efficiency () also increases and vice versa. The Figure 4a shows Current-Voltage (I–V) characteristics of a commercial 10 watts solar panel (Dow Chemical DPS 10–1000) with varying irradiance levels. The 10 watts (Dow Chemical DPS 10–1000) Solar panel has a size of 546 mm × 232 mm with a module area of 0.13 m2. From Figure 4a, it is observed that the current in solar panel increased with an increase in the irradiance level [11]. Here, the solar cell current is maximum (6.2 A) for solar irradiance of 1000 W/m2. The Power-Voltage characteristics of a Solar Panel under different radiations levels is shown in Figure 4b. Here, the harvested power is the maximum (9.8 W) for the highest solar irradiance i.e., 1000 W/m2.
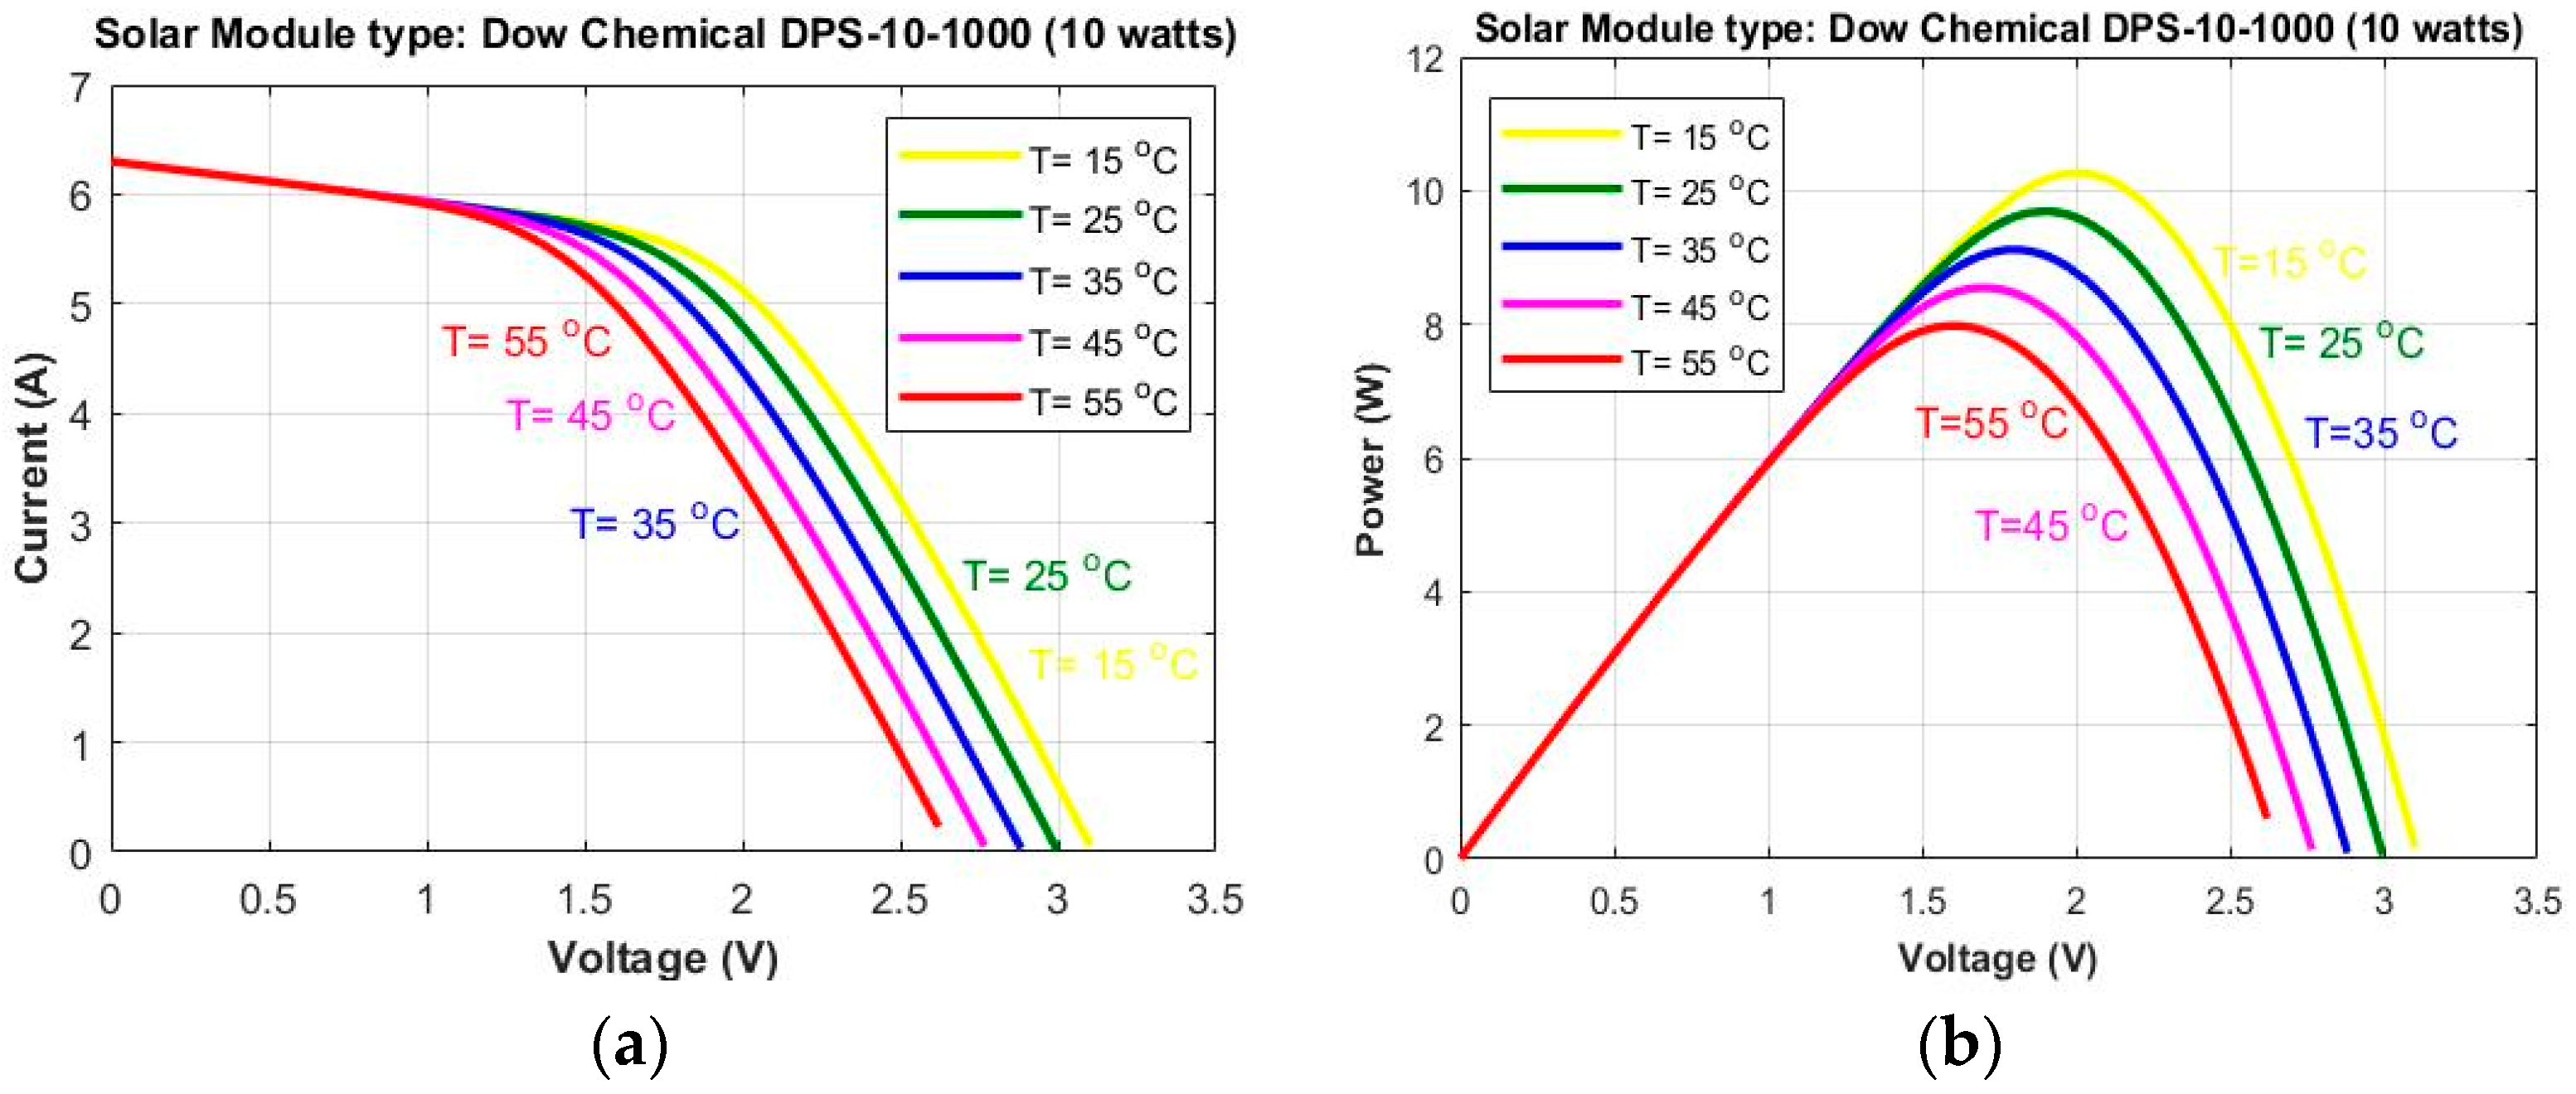
4.2. Effect of Temperature (T)
As seen in Figure 5a, if the solar panel temperature is increased, then the output current decreases and vice versa. Thus, the output current is inversely proportional to temperature variations. Similarly, in Figure 5b if the temperature is increased, then output power decreases and vice versa. Thus, output power is also inversely proportional to variations in temperature.
The Figure 4 and Figure 5 show I-V and P-V characteristics of a 10 watts solar module DPS-10-1000 of Dow Chemical Company (Midland, Michigan, United States) simulated in MATLAB/Simulink simulation software. In Ref. [12,13,14] some more simulation software are provided for energy harvesting wireless sensor networks.
5. Modeling of DC-DC Converter
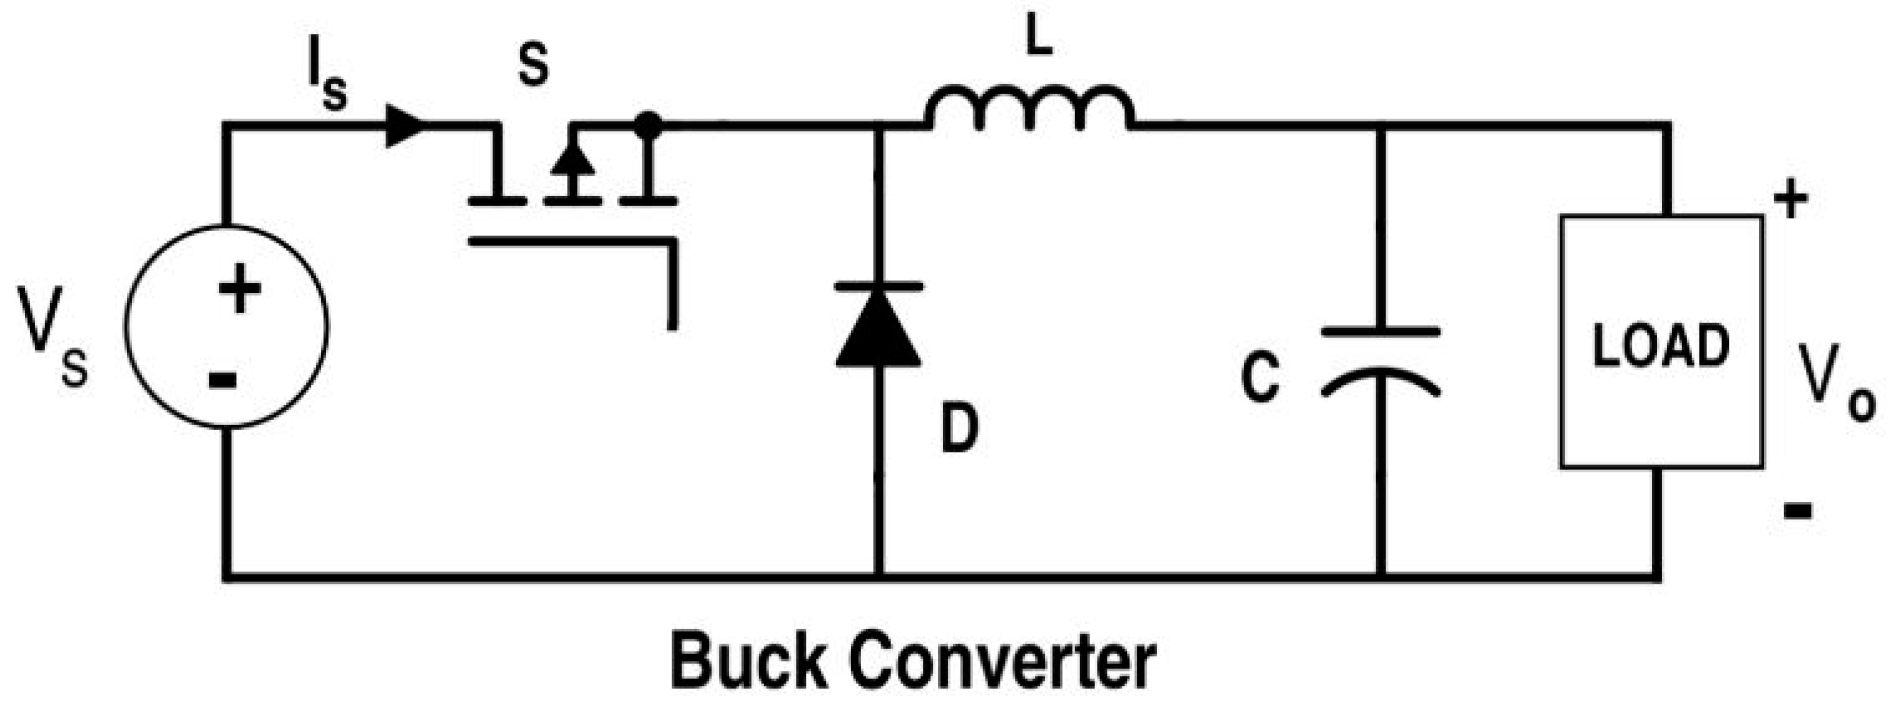
There are generally three types of DC-DC converters [15] used in the design of a photovoltaic system: Buck Converter, Boost Converter, and Buck-Boost Converter. Here, we have used a DC-DC Buck converter because its efficiency is high as compared to Boost and Buck-Boost converters. A DC-DC buck converter is a power electronics converter in which the output voltage is always less than the input voltage. The Buck converter consists of a DC voltage source (Vdc), an inductor (L), a switch (MOSFET), a diode (D) and a capacitor (C) as shown in Figure 6. When MOSFET switch (S) is closed at time t1, the input voltage Vs appears across the load resistor. If the MOSFET switch remains OFF for the time t2, then the voltage across the load resistor is zero. The amplitude of output voltage (V0) is less than the input voltage Vo. The Duty Cycle (D) can be varied from 0 to 1 by varying time period t1. The duty cycle of the Buck converter is D = Vo/Vin. The average output voltage of the buck converter is given as:
where, V0 is output voltage, Vin is input voltage, t1 = MOSFET switch ON time duration, T = Total Time period, f is the frequency of operation, D is the duty cycle.
The average load current at output is given as:
where, T = chopping period, D = t1/T is duty cycle, f = chopping frequency.
Power Losses in DC-DC Buck Converter
There are three main sections of power dissipation in DC-DC buck converter [16]: Inductor conduction losses, MOSFET conduction losses, and MOSFET switching losses.
In all types of DC-DC converters, the Inductor is the main sink for power consumption. The value of MOSFET switching loss and diode conduction losses are very small and as compared to inductor losses, can be neglected practically. The inductor power consumption loss is given as:
where, PL = Power loss in Inductor (mW), IL(rms) = Inductor RMS current, RL(dc) = DC resistance of the Inductor.
6. Modeling of Maximum Power Point Tracking (MPPT) Technique
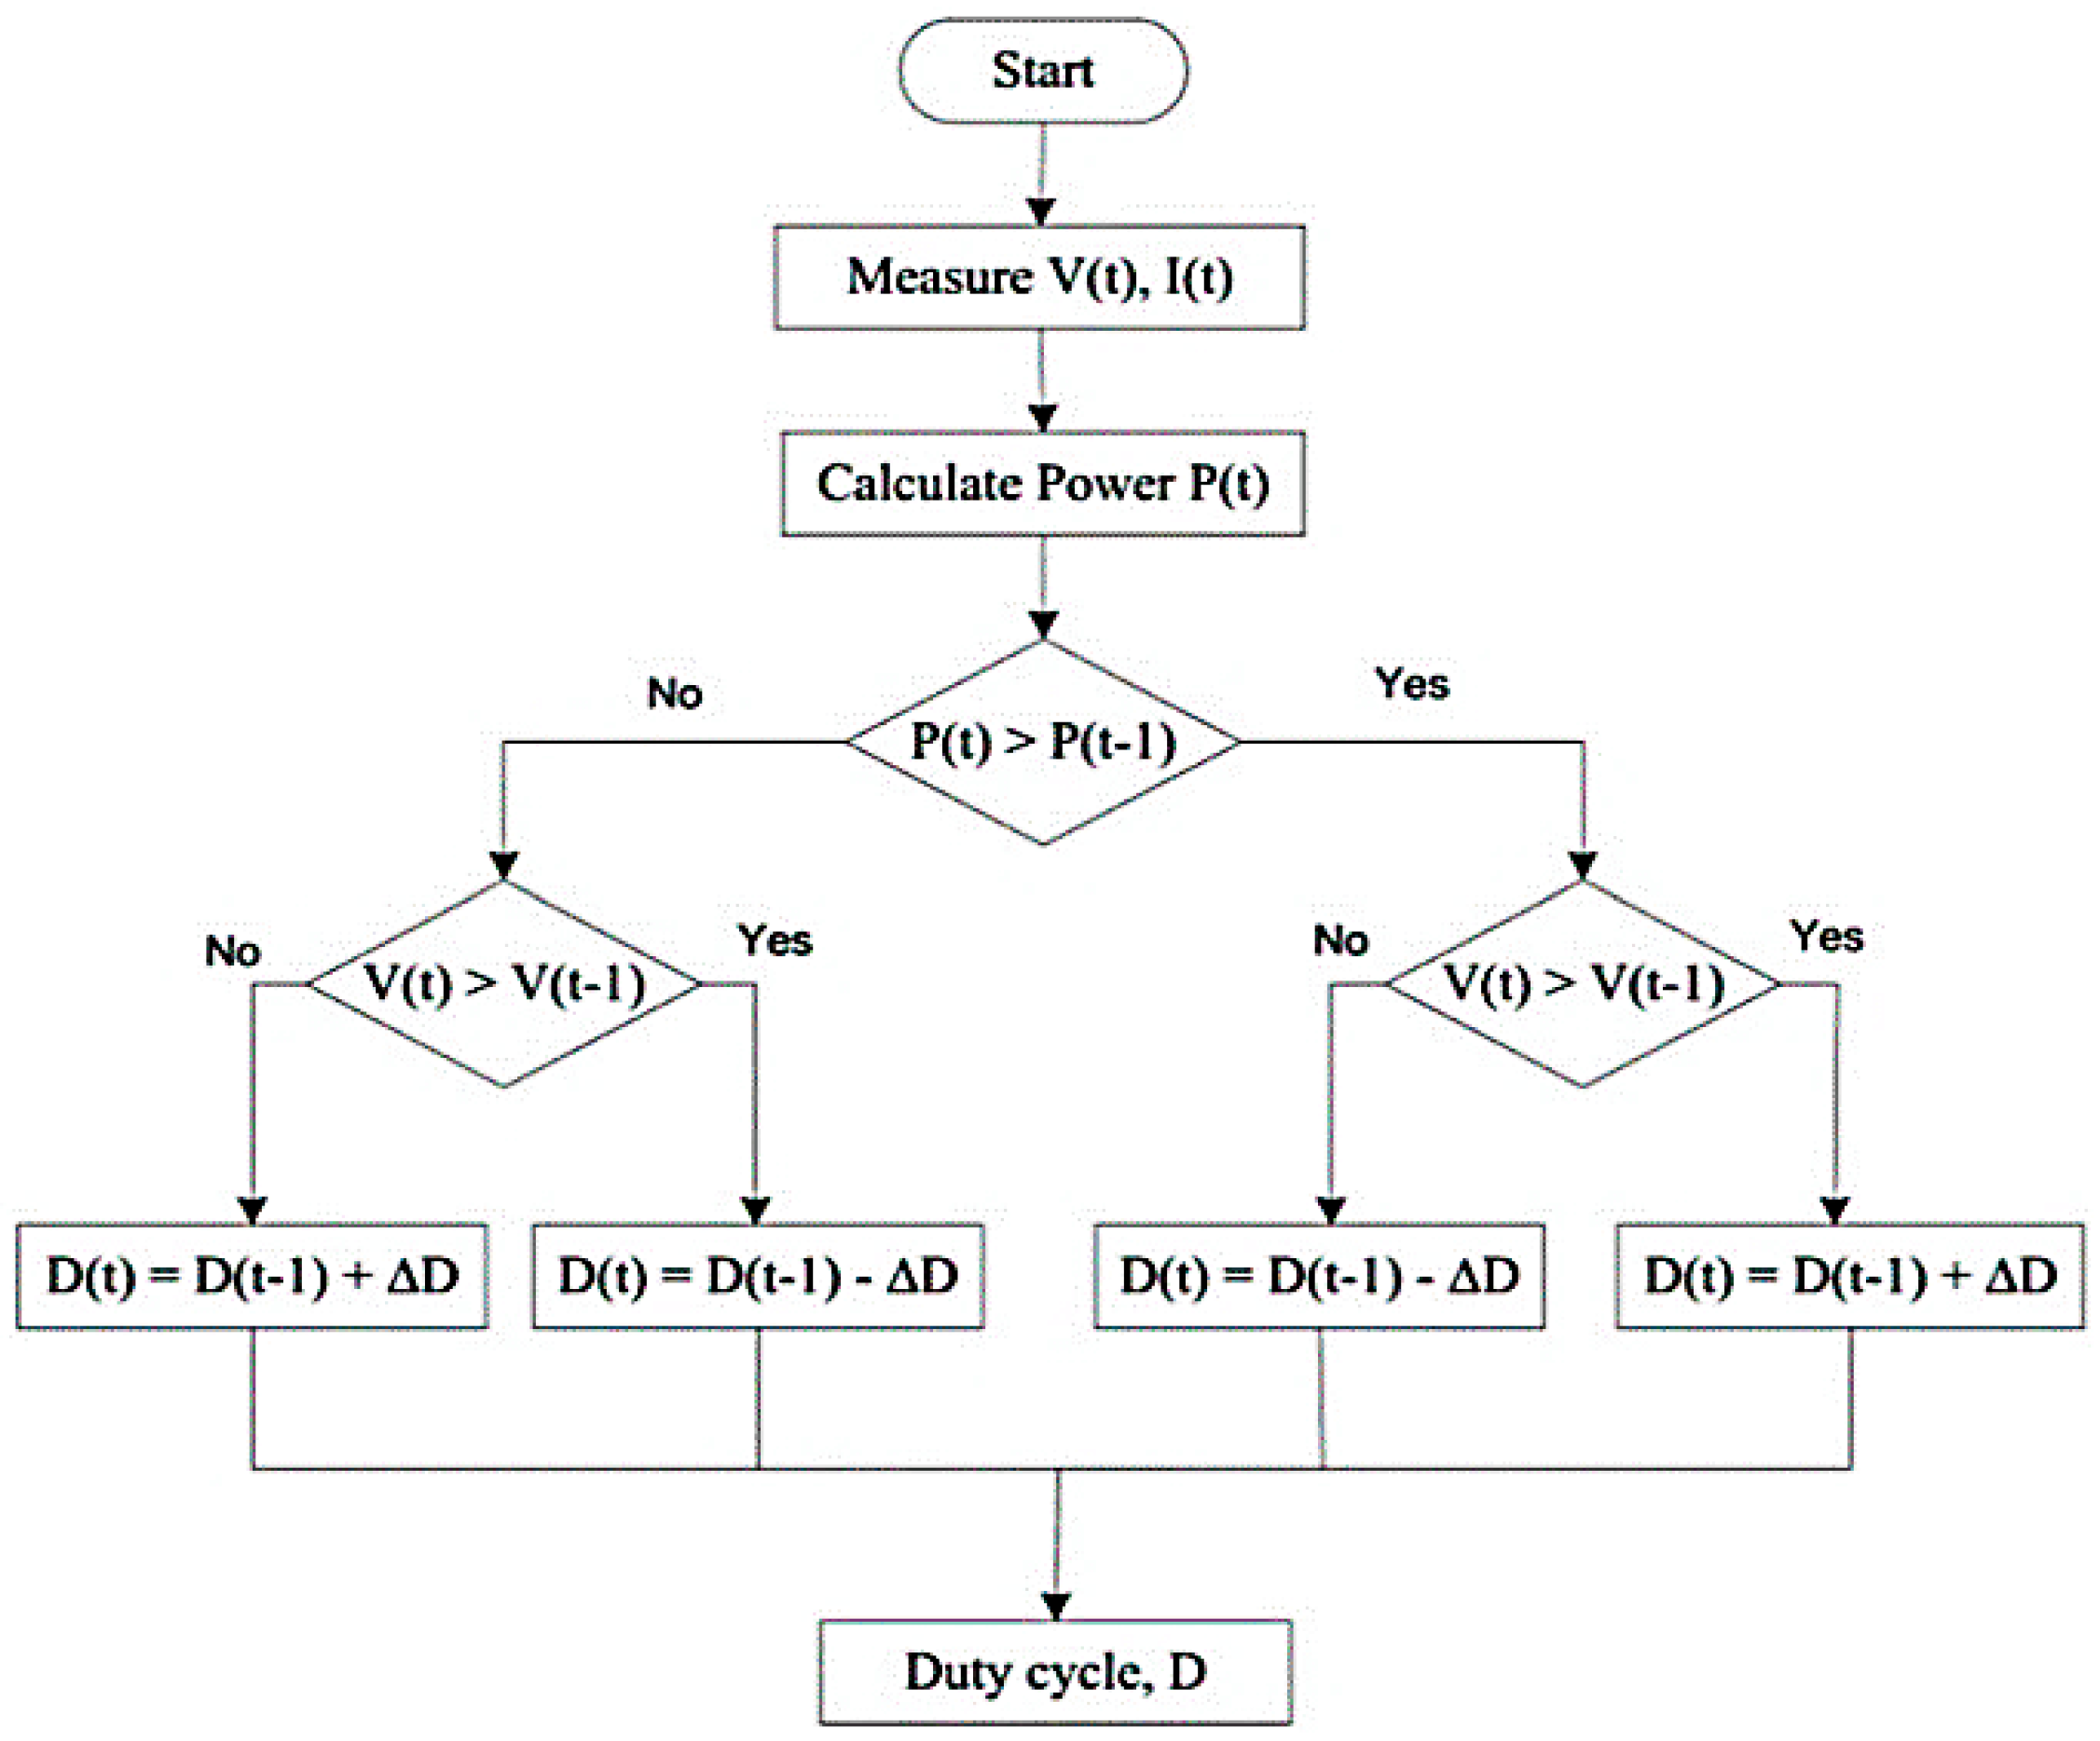
The MPPT techniques [17] are widely used in the design of photovoltaic (PV) solar systems to maximize power extraction from the Sun under varying solar irradiance conditions. It is an algorithm, which continuously measures the voltage (Vpv) and current (Ipv) from the solar panel and calculates the amount of duty cycle (D) to be fed to the MOSFET switch of the DC-DC buck converter. The following algorithms are generally used in photovoltaic applications as [18]:
- Perturbation and Observation (P&O) technique,
- Incremental Conductance (INC) technique and
- Fraction Open Circuit Voltage (OCV).
The P&O technique is mostly used in all types of solar energy harvester systems. A flow chart for the P&O algorithm is shown in Figure 7. The output of this algorithm is a varying duty cycle (ΔD) which depends on input solar irradiance (W/m2). When solar irradiance changes then a change in duty cycle occurs and the solar panel voltage and current changes [19]. The MPPT algorithm senses these changes and adjusts the impedance of the solar panel to the maximum power point. Thus, maximum power (P) can still be extracted from the solar panel even if the irradiance changes. It generates a PWM waveform whose initial duty cycle (D) is 0.7 provided arbitrarily (in the range of 0 to 1) as a seed value during the simulation.
The P& O algorithm works on the principle of impedance matching between the load and the solar panel. For maximum power transfer, the impedance matching is necessary. This impedance matching is achieved by using a DC-DC converter. By using a DC-DC converter, the impedance is matched by changing the duty cycle (ΔD) of the MOSFET switch. The relation between the input voltage(Vin), the Output voltage (Vo) and duty cycle (D) is given as
and,
Therefore, if the duty cycle changes (ΔD), then the solar energy harvester output voltage (Vo) changes. If the duty cycle (D) is increased the output voltage (Vo) also increases and vice-versa. By changing the duty cycle (D), the impedance of the load resistance (RL) can be matched with input solar panel impedance for maximum power transfer to the load for optimum performance. The steps in the P&O algorithm are shown by a flowchart and MATLAB codes [17,18,19] are shown in Algorithm 1 respectively.
| Algorithm 1. P&O MPPT Algorithm. |
| function D = PandO(Vpv,Ipv) persistent Dprev Pprev Vprev if is empty (Dprev) Dprev = 0.7; Vprev = 190; Pprev = 2000; end deltaD = 0.0025; Ppv = Vpv*Ipv; if (Ppv-Pprev) ~= 0 if (Ppv-Pprev) > 0 if (Vpv-Vprev) > 0 D = Dprev - deltaD; else D = Dprev + deltaD; end else if (Vpv-Vprev) > 0 D = Dprev + deltaD; else D = Dprev - deltaD; end end else D = Dprev; end Dprev = D; Vprev = Vpv; Pprev = Ppv; |
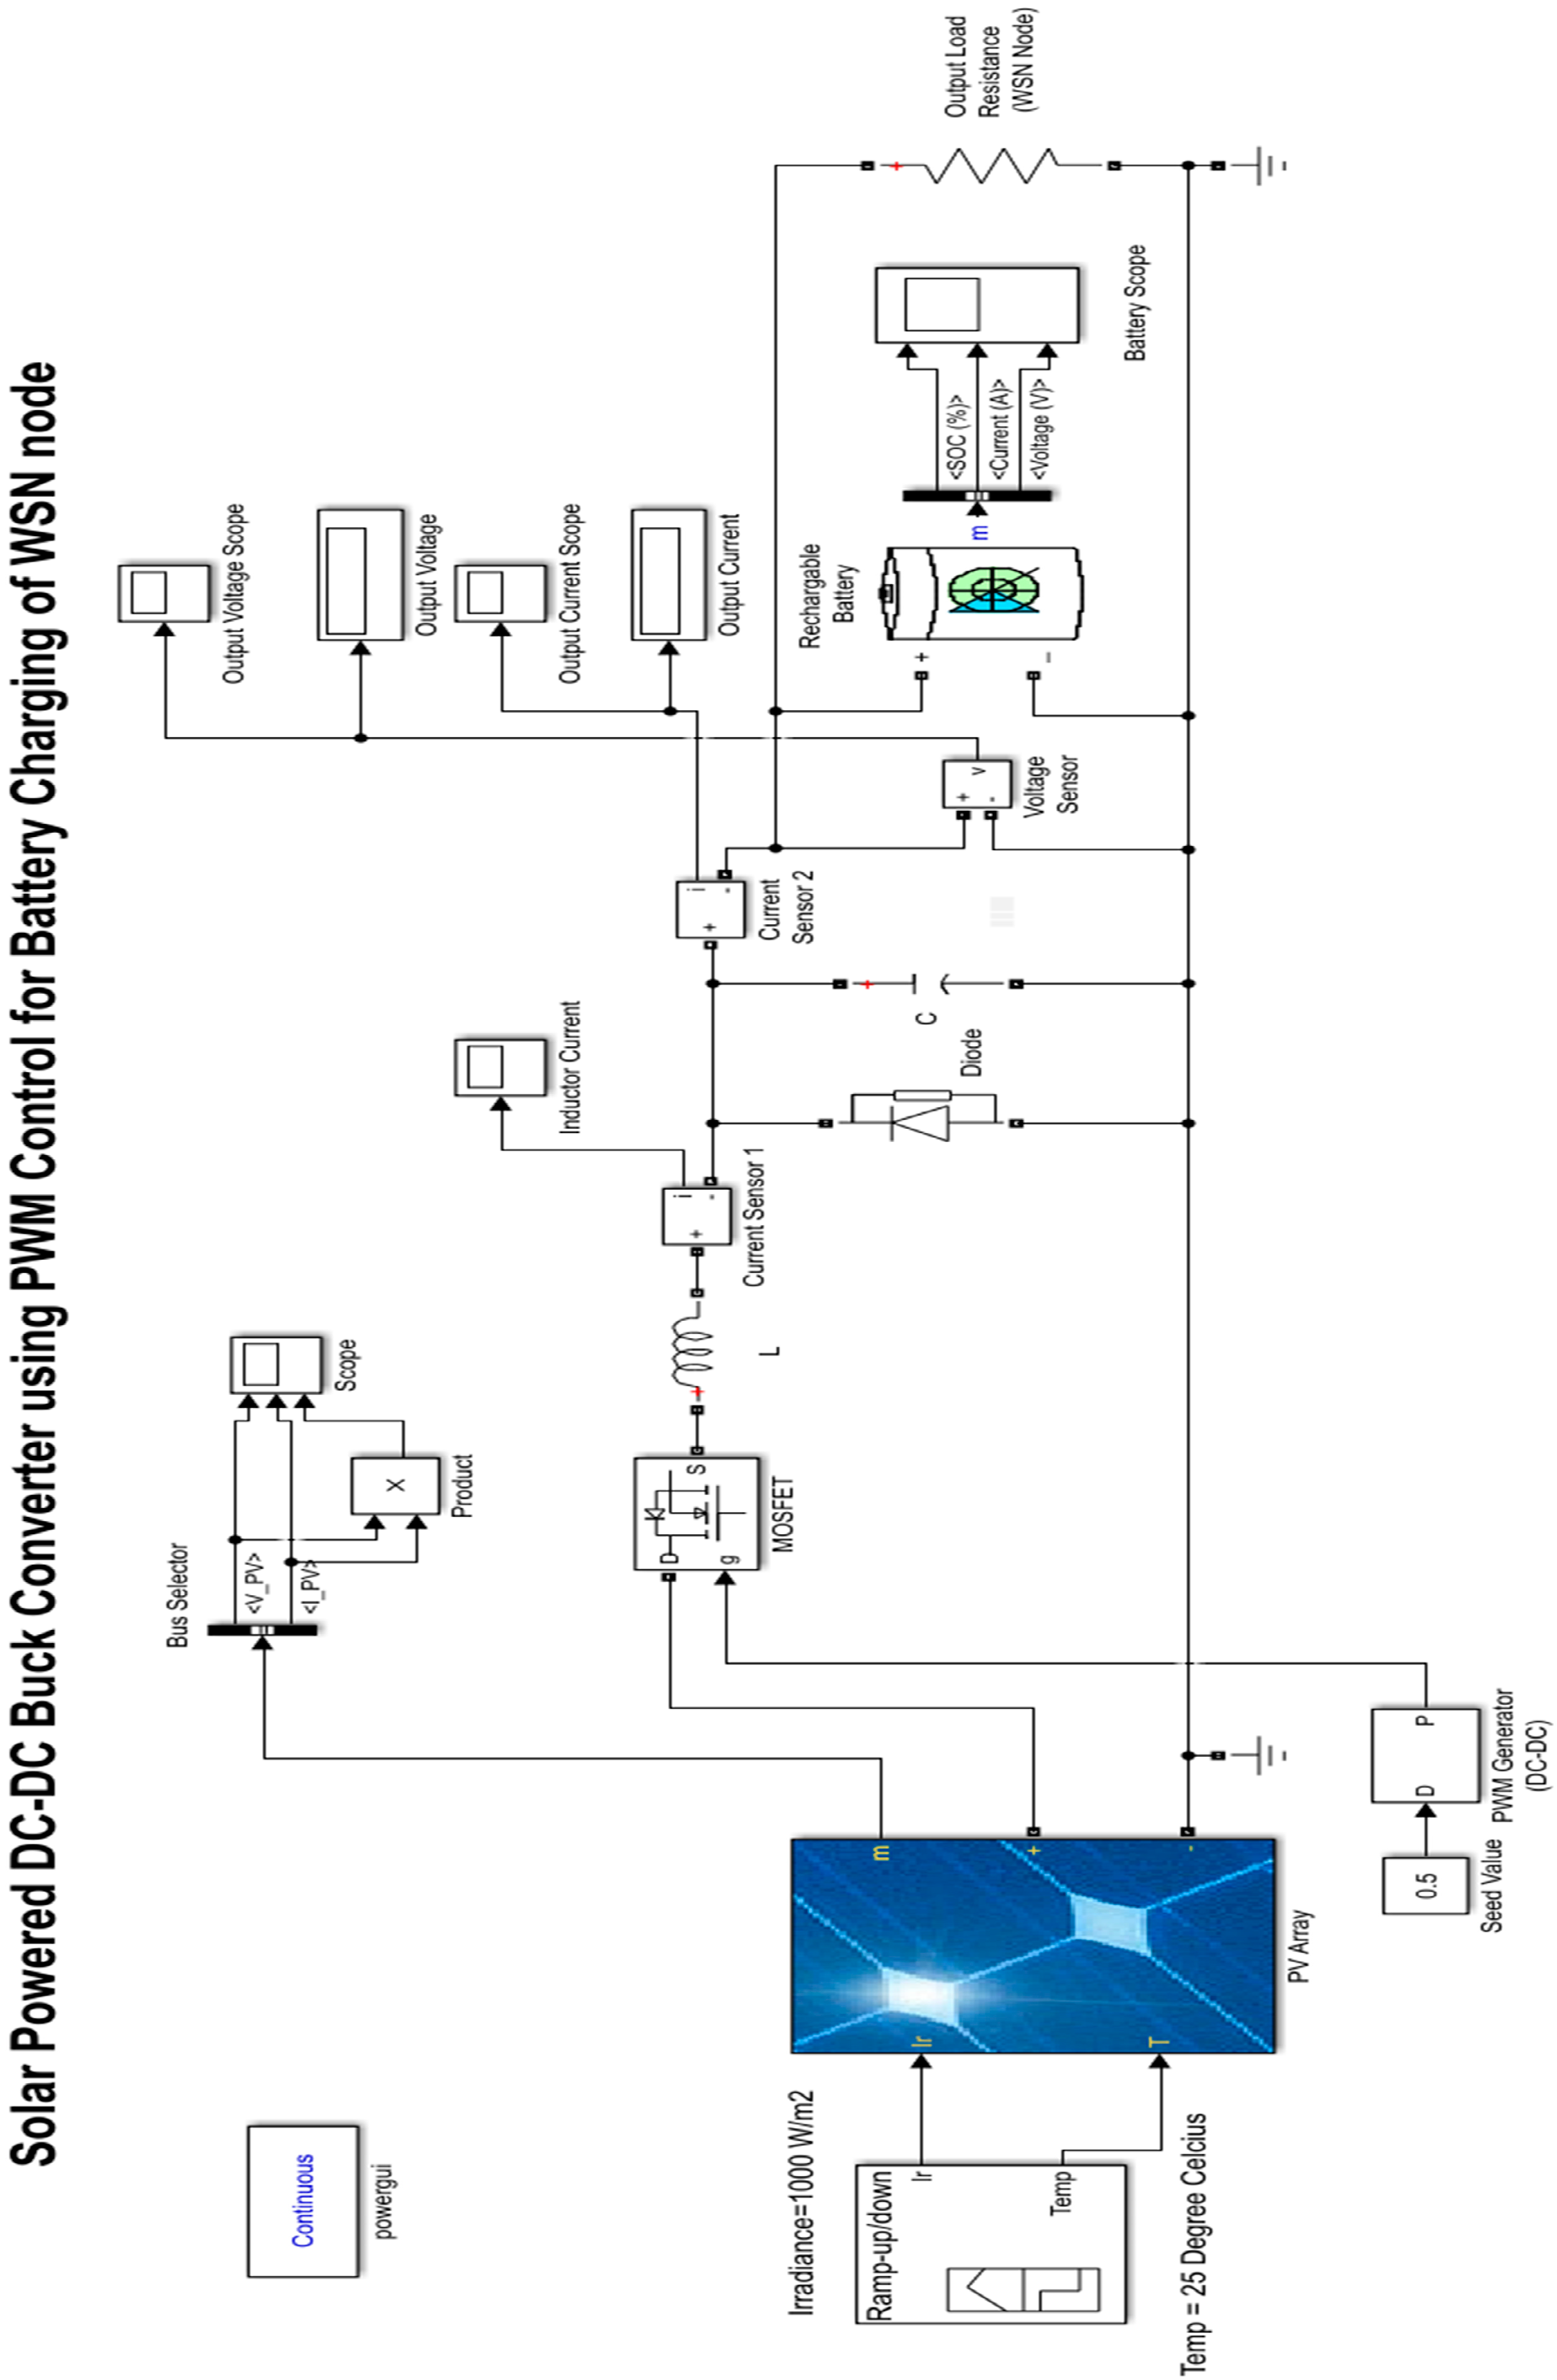
7. Simulation Experiment Setup
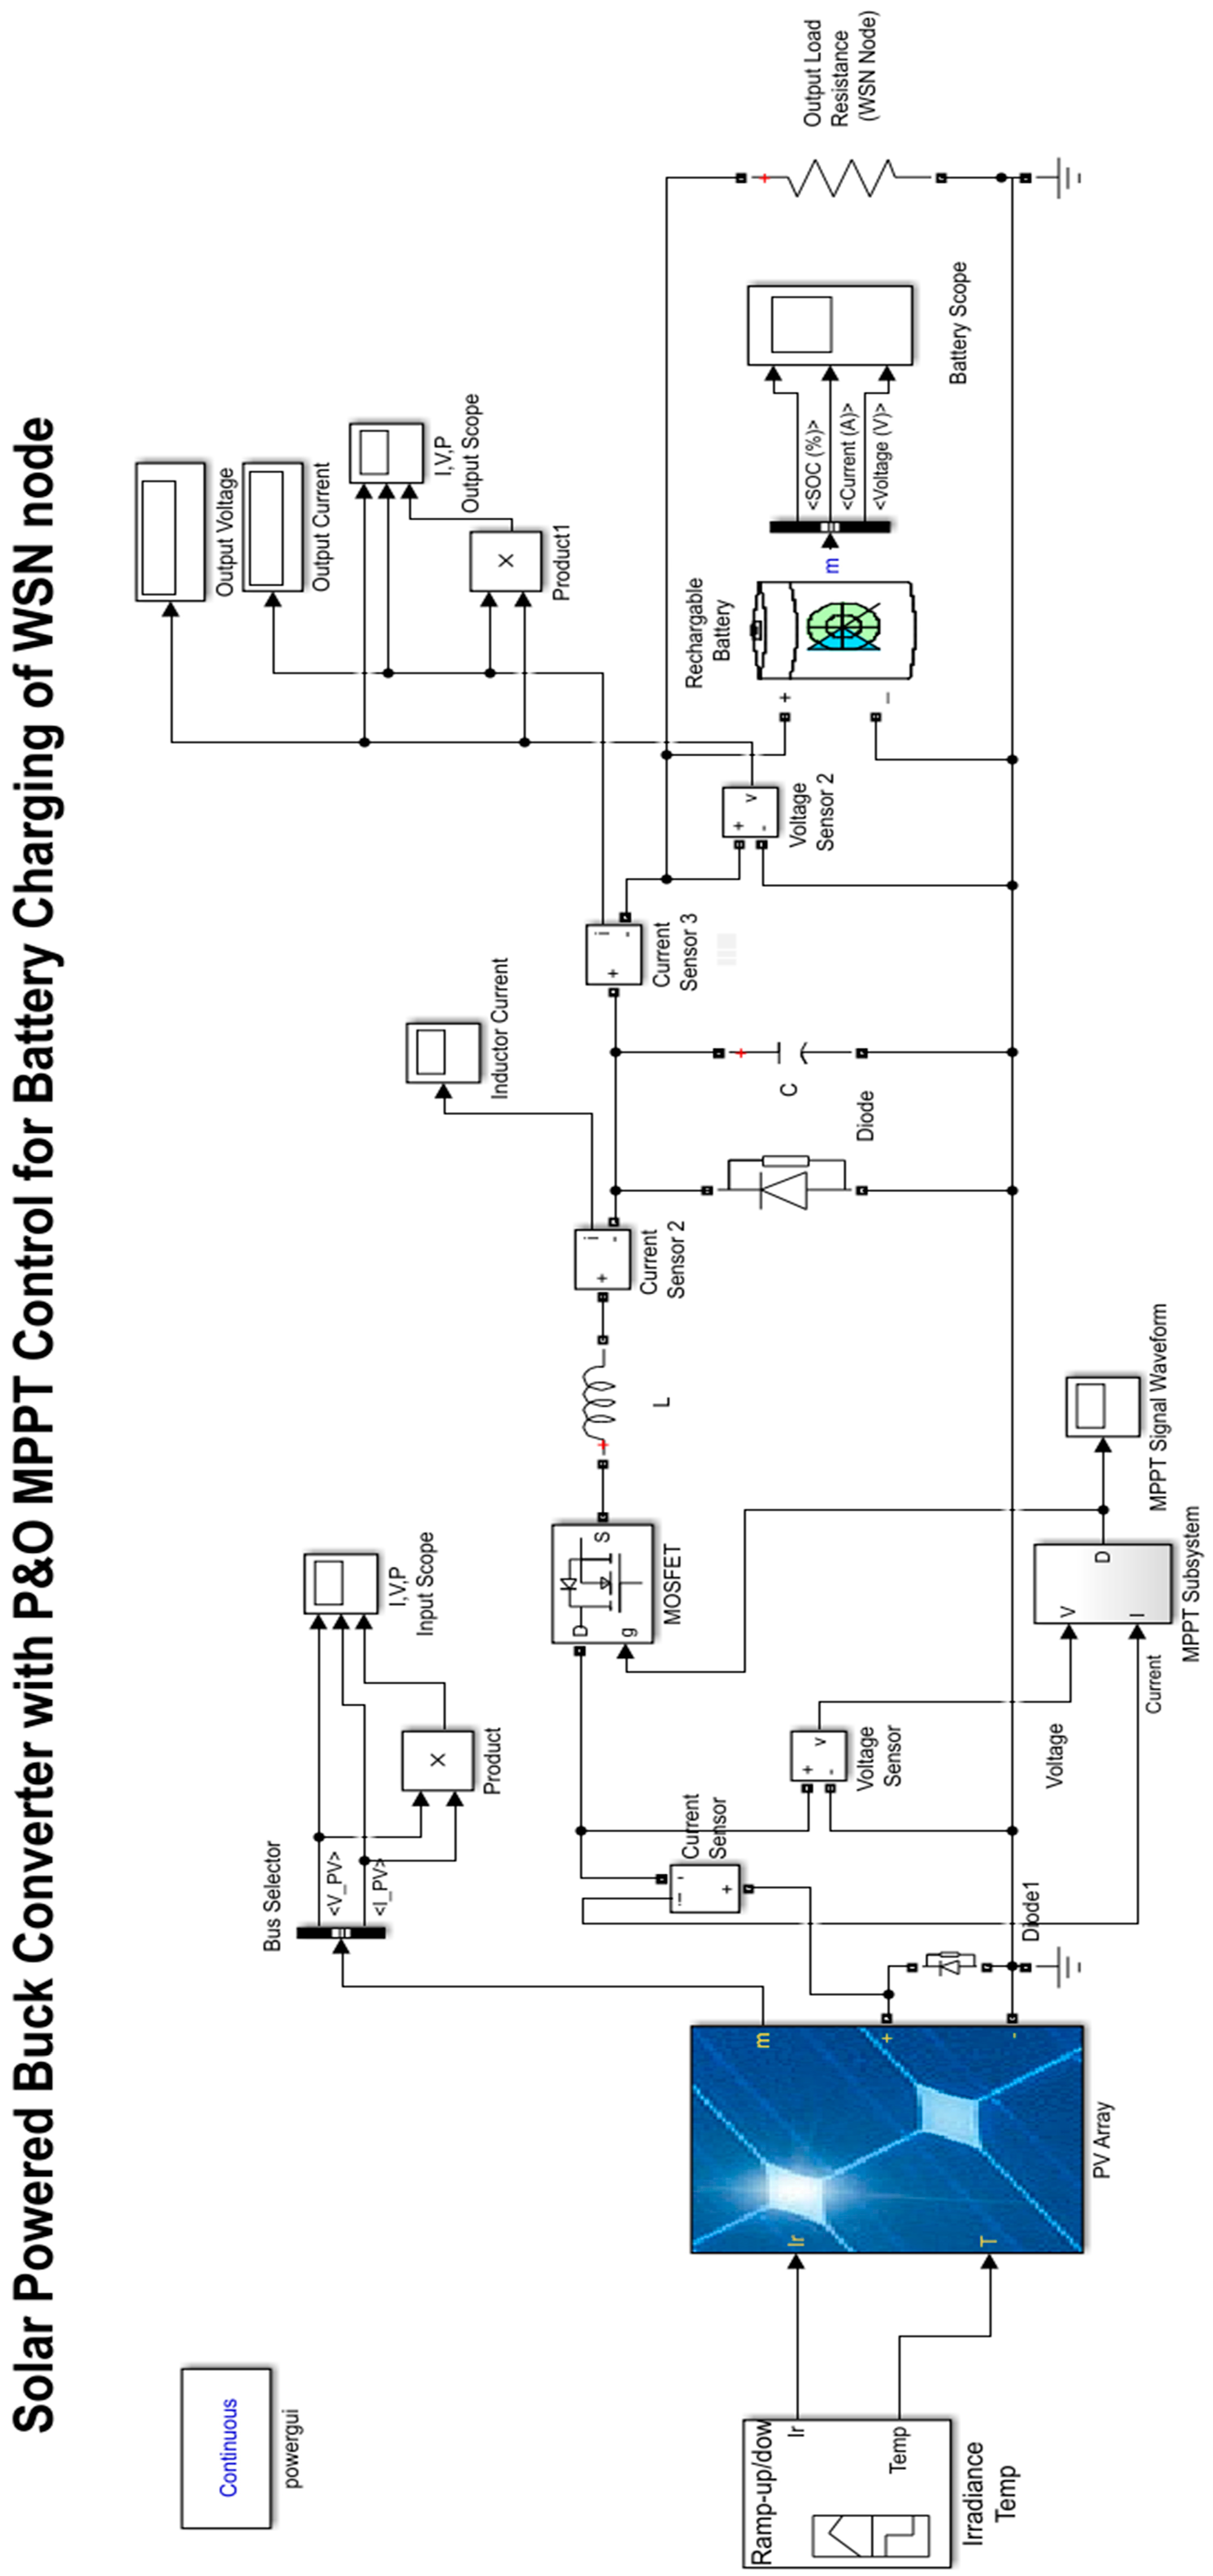
The simulation parameters for a solar energy harvesting system are shown in Table 1. We used MATLAB Simulink 2017 for simulation of a solar-powered Boost converter with PWM control for battery charging of a WSN node as shown in Figure 8. The Figure 9 shows MATLAB Simulink model of solar energy harvester system using MPPT control. The solar irradiance of 1000 watts/cm2 is incident on the solar panel with a constant temperature of 25-degree Celsius [20]. The Solar panel can extract only this solar energy into 15 mW/cm2 with 15% efficiency [21]. For full irradiance on the simulated solar panel, the output voltage of the solar panel is 6 volts, 500 mA, and 3 watts. Now, this electrical energy from the solar cell is fed to the DC-DC boost converter, which increases the output voltage. The Boost converter output voltage is used to charge the rechargeable battery. The rechargeable battery is used to operate the WSN node. Here, the WSN load is modeled as output with a DC load resistance of 100 ohms. Table 1 shows various simulation parameters i.e. irradiance, temperature, DC-DC converter type, Solar panel current, voltage and power, battery type ad battery voltage, duty cycle, WN load model and power losses.
8. Simulation Results
The simulation results with comparisons of Battery State of Charge (SoC), battery Current (IB) and battery voltage (VB) using PWM controlled and P&O MPPT controlled solar energy harvesting (SEH) system are shown in Figure 10, Figure 11 and Figure 12.
Comparison of Battery State of Charge (SoC), Voltage and Current during Charging Using PWM and MPPT Control Techniques
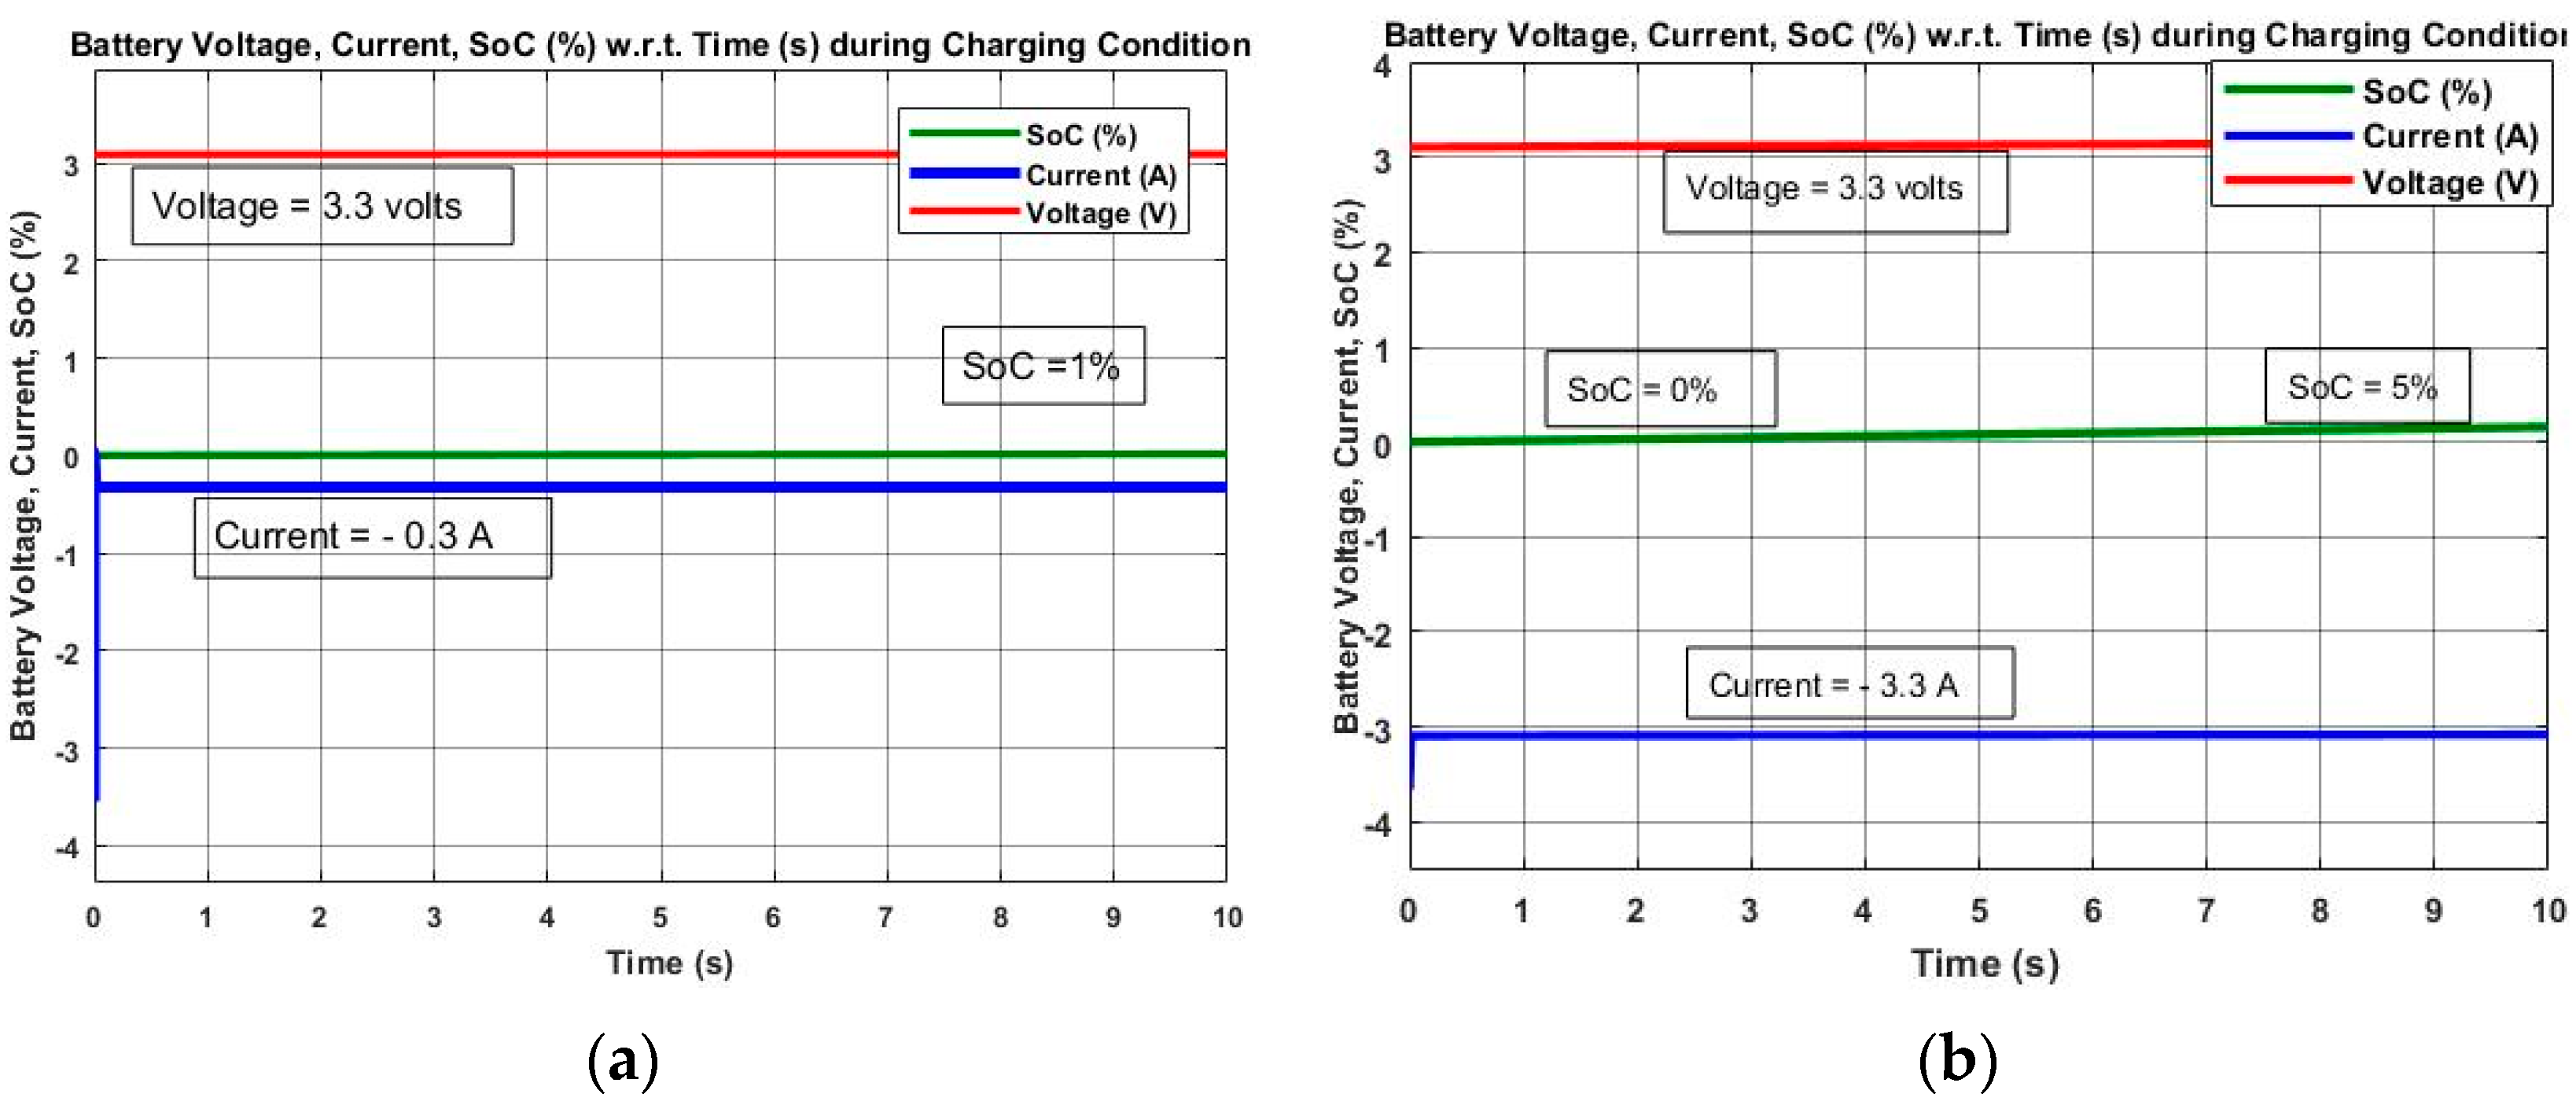
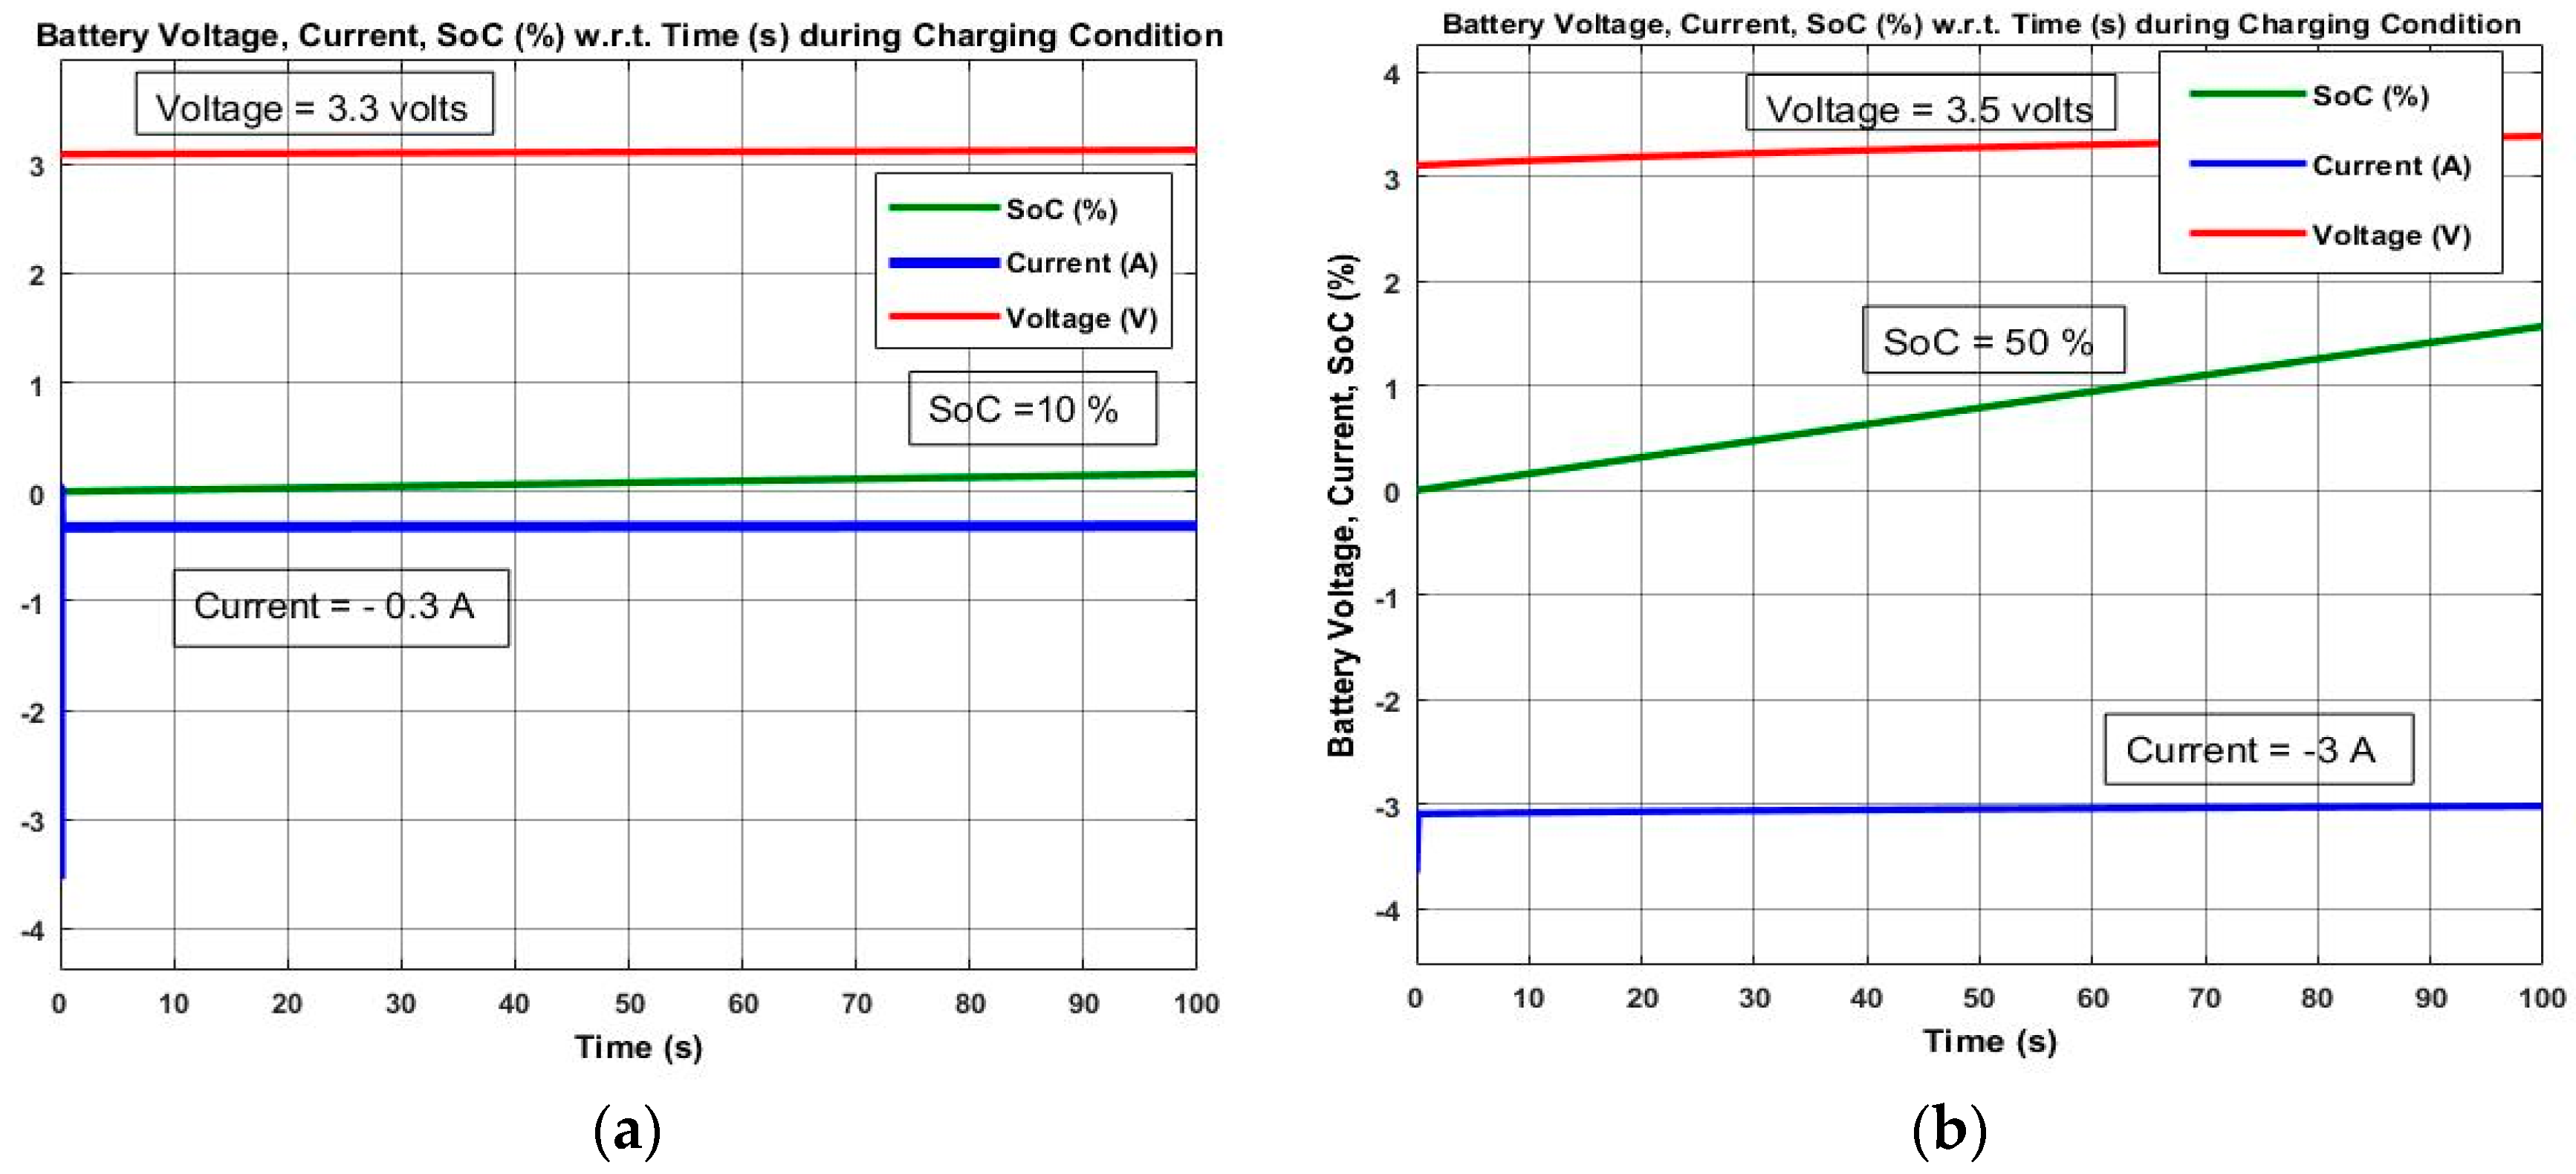
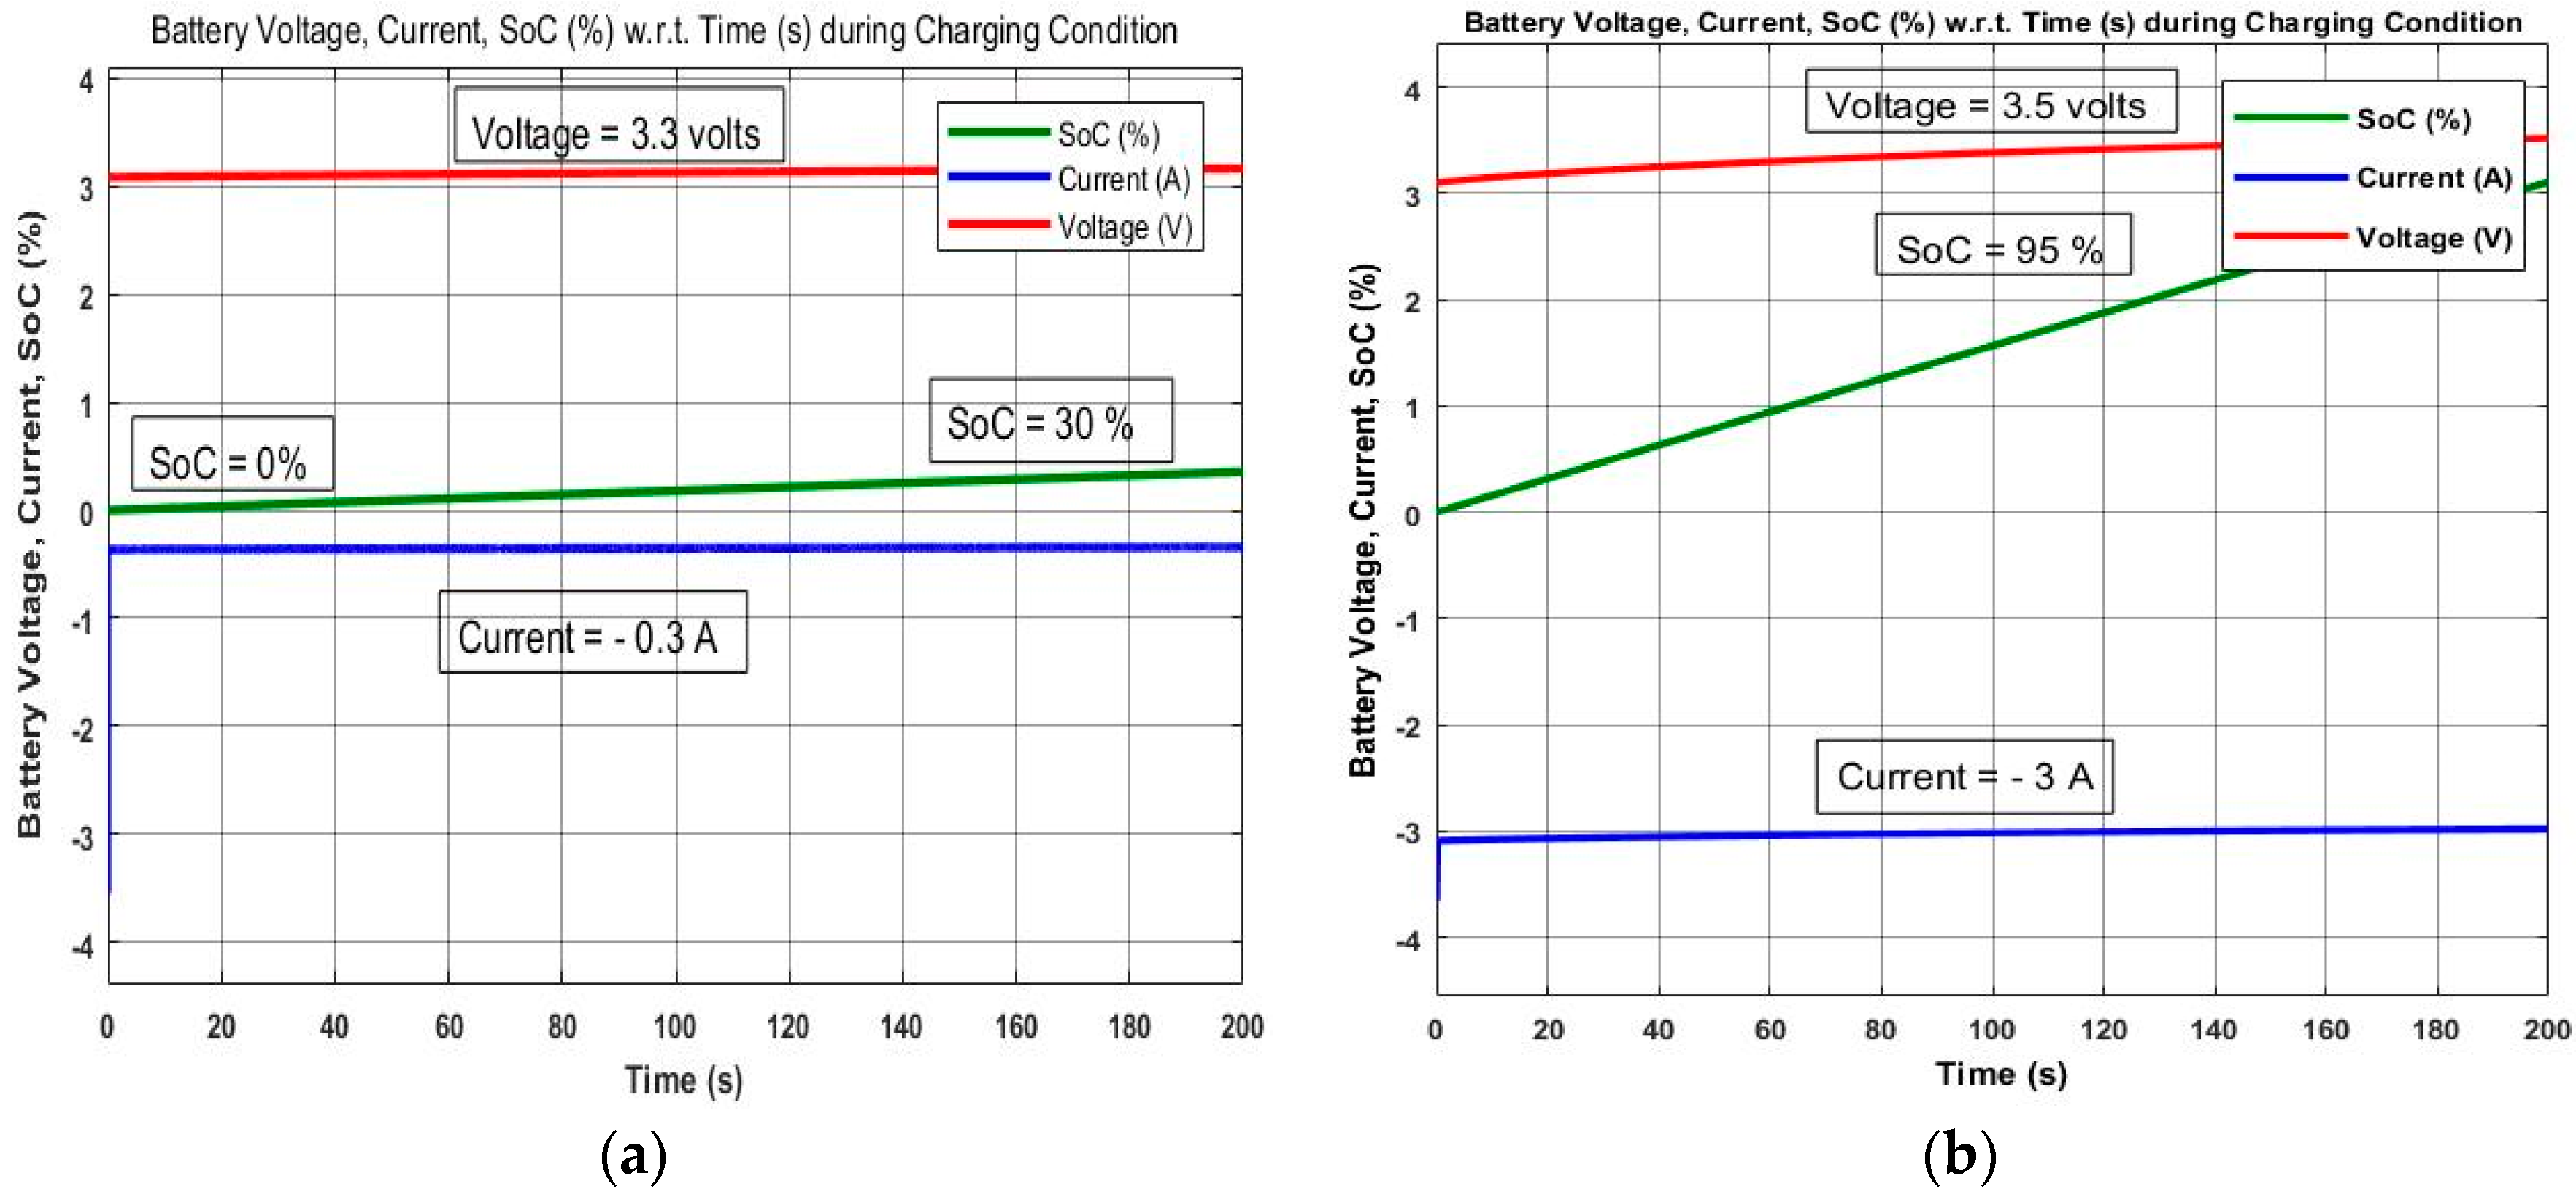
In Figure 10a, three parameters of the PWM controlled solar energy harvesting battery charger (i.e., Battery State of Charge (SoC), battery Current and Voltage) are shown for a simulation time of 10 s. The battery SoC reaches from zero to 1%. On the other hand, in Figure 10b, the MPPT controlled solar energy harvesting battery charger SoC, battery Current and Voltages are shown for a simulation time of 10 s. Here, the battery SoC reaches from 0 to 5%, which is greater as compared to PWM controlled results for 10 s (i.e., 1% only). In Figure 11a, for increased simulation time (T = 100 s), the battery SoC reaches 10% of its final value. However, in Figure 11b, the MPPT results for 100 s simulation time have battery SoC to 50% as compared to the results obtained in Figure 11a for PWM control (i.e., 10% only). The Battery current is negative while charging, which represents the oxidation process in the electrochemical cells of the battery. However, during discharging, the battery current is positive, which represents the reduction process in the electrochemical cell of the battery. Finally, in Figure 12a the battery SoC could reach only 30% in 200 s simulation time in the figure. But, in Figure 12b the battery SoC reaches 95% in just 200 s simulation time. Thus, the battery charging time is dynamically increased by using MPPT controlled solar energy harvesting systems for WSN nodes. The MPPT controlled SEH system shows better charging efficiency because it can extract the maximum solar power from the solar cells as compared to the ordinary PWM controlled system.
9. Energy Harvester Systems Efficiency Calculations
The energy harvester system efficiency is calculated for PWM control and MPPT control methods separately as:
9.1. PWM Efficiency
In our simulation, the solar panel was selected to have a maximum power of 3 watts. By using PWM control, the max. power available from that solar panel is only 2.5 watts. Therefore, the PWM efficiency is calculated as:
The PPWM is 2.5 watts but the rated max. power is 3 watts. Thus PWM efficiency is calculated as 2.5 w/3 w = 83.34%. Furthermore, the buck converter reduces (or regulates) this 2.5 watts power to 650 mW. The buck converter efficiency is defined as output power (P0) divided by the power losses (Ploss). Mathematically,
where, Ploss is the sum of MOSFET switching loss (Psw) and the Inductor conduction loss (PL). From the simulation results table, the output power (P0) is 650 mW and MOSFET switching losses are 5 mW and inductor power loss is 50 mW. Thus buck converter efficiency is calculated as 650 mW/(650 + 55 mW) = 92.19%. The overall harvester efficiency is the average of PWM efficiency and DC-DC buck converter efficiency. Thus
From the formula of Equation (15), the calculated overall energy harvester system efficiency using PWM () is (92.19% + 83.34%)/2 = 87.76%. Thus, by using PWM controlled buck converter, the overall solar energy harvester efficiency () is 87.76%.
9.2. P&O MPPT Efficiency
By using P&O MPPT the max. power available from the solar panel is 2.8 watts. Now the P&O MPPT efficiency is calculated as:
From the simulation parameter table, the (PMPP) is 2.8 watts and the maximum theoretical power (Pm) is 3 watts. Thus P&O MPPT efficiency is calculated as 2.8 w/3 w = 93.33%. Here, the Ploss also changes due to variations in P&O MPPT of DC-DC buck converter. The Ploss is the sum of MOSFET switching loss (Psw) and Inductor conduction loss (PL). From the simulation results table, the output power (Po) is 1.8 W and MOSFET switching losses are 2 mW and inductor power loss is 20 mW. Thus buck converter efficiency is calculated as 1.8 W/1.8 W+ 22 mW = 98.79%. Finally, the overall energy harvester circuit efficiency (ηsys) is the average of Buck converter efficiency and P&O MPPT efficiency.
From the formula of Equation (17), the calculated overall energy harvester system efficiency () using P&O MPPT is (98.79% + 93.33%)/2 = 96.06%. Thus, the overall solar energy harvester efficiency () using P&O MPPT is 96.06%.
The Table 2 shows the simulation results for PWM and MPPT controlled SEH systems. Here, the maximum solar power output power (Pm), average buck converter output voltage (Vm), average buck converter output current (Im), buck converter output power, inductor loss, MOSFET switching loss, and harvester system efficiency (%) are shown. Clearly, from Table 2, the P&O MPPT controlled method gives better results as compared to PWM control in terms of output voltage, current, power, losses and efficiency.
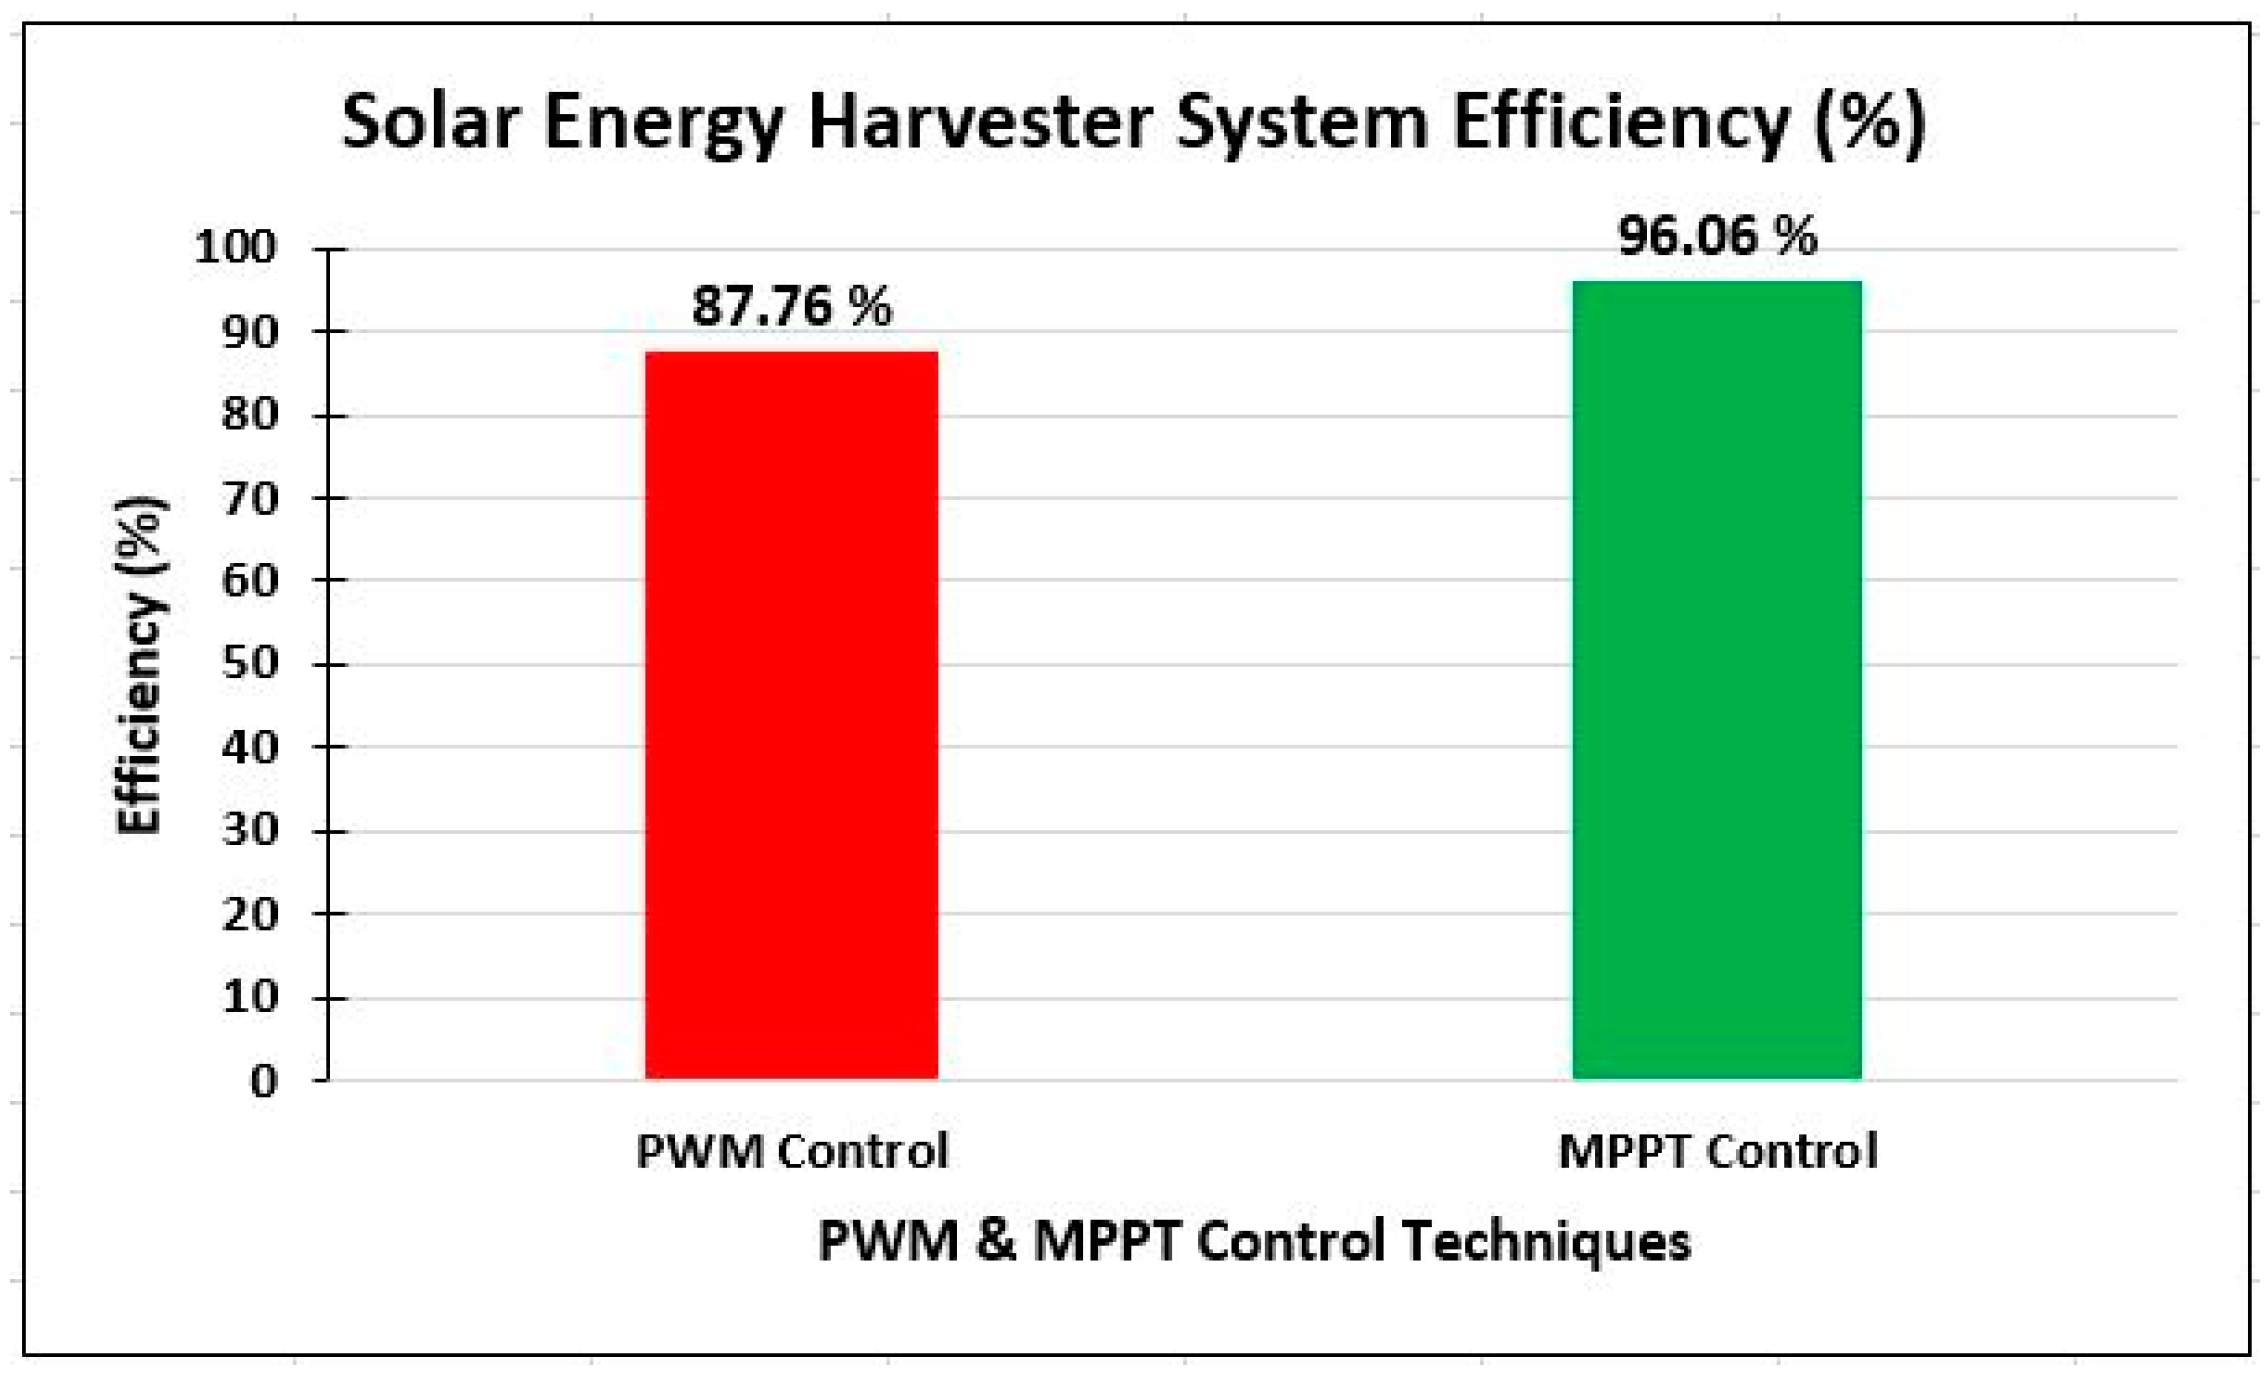
In Figure 13, a comparision graph of PWM and P&O MPPT harvesting system efficiency is shown. Here, the PWM efficiecny 87.76% and P&O MPPT efficiency is 96.06% which is better than PWM control method.
10. Hardware Experiment
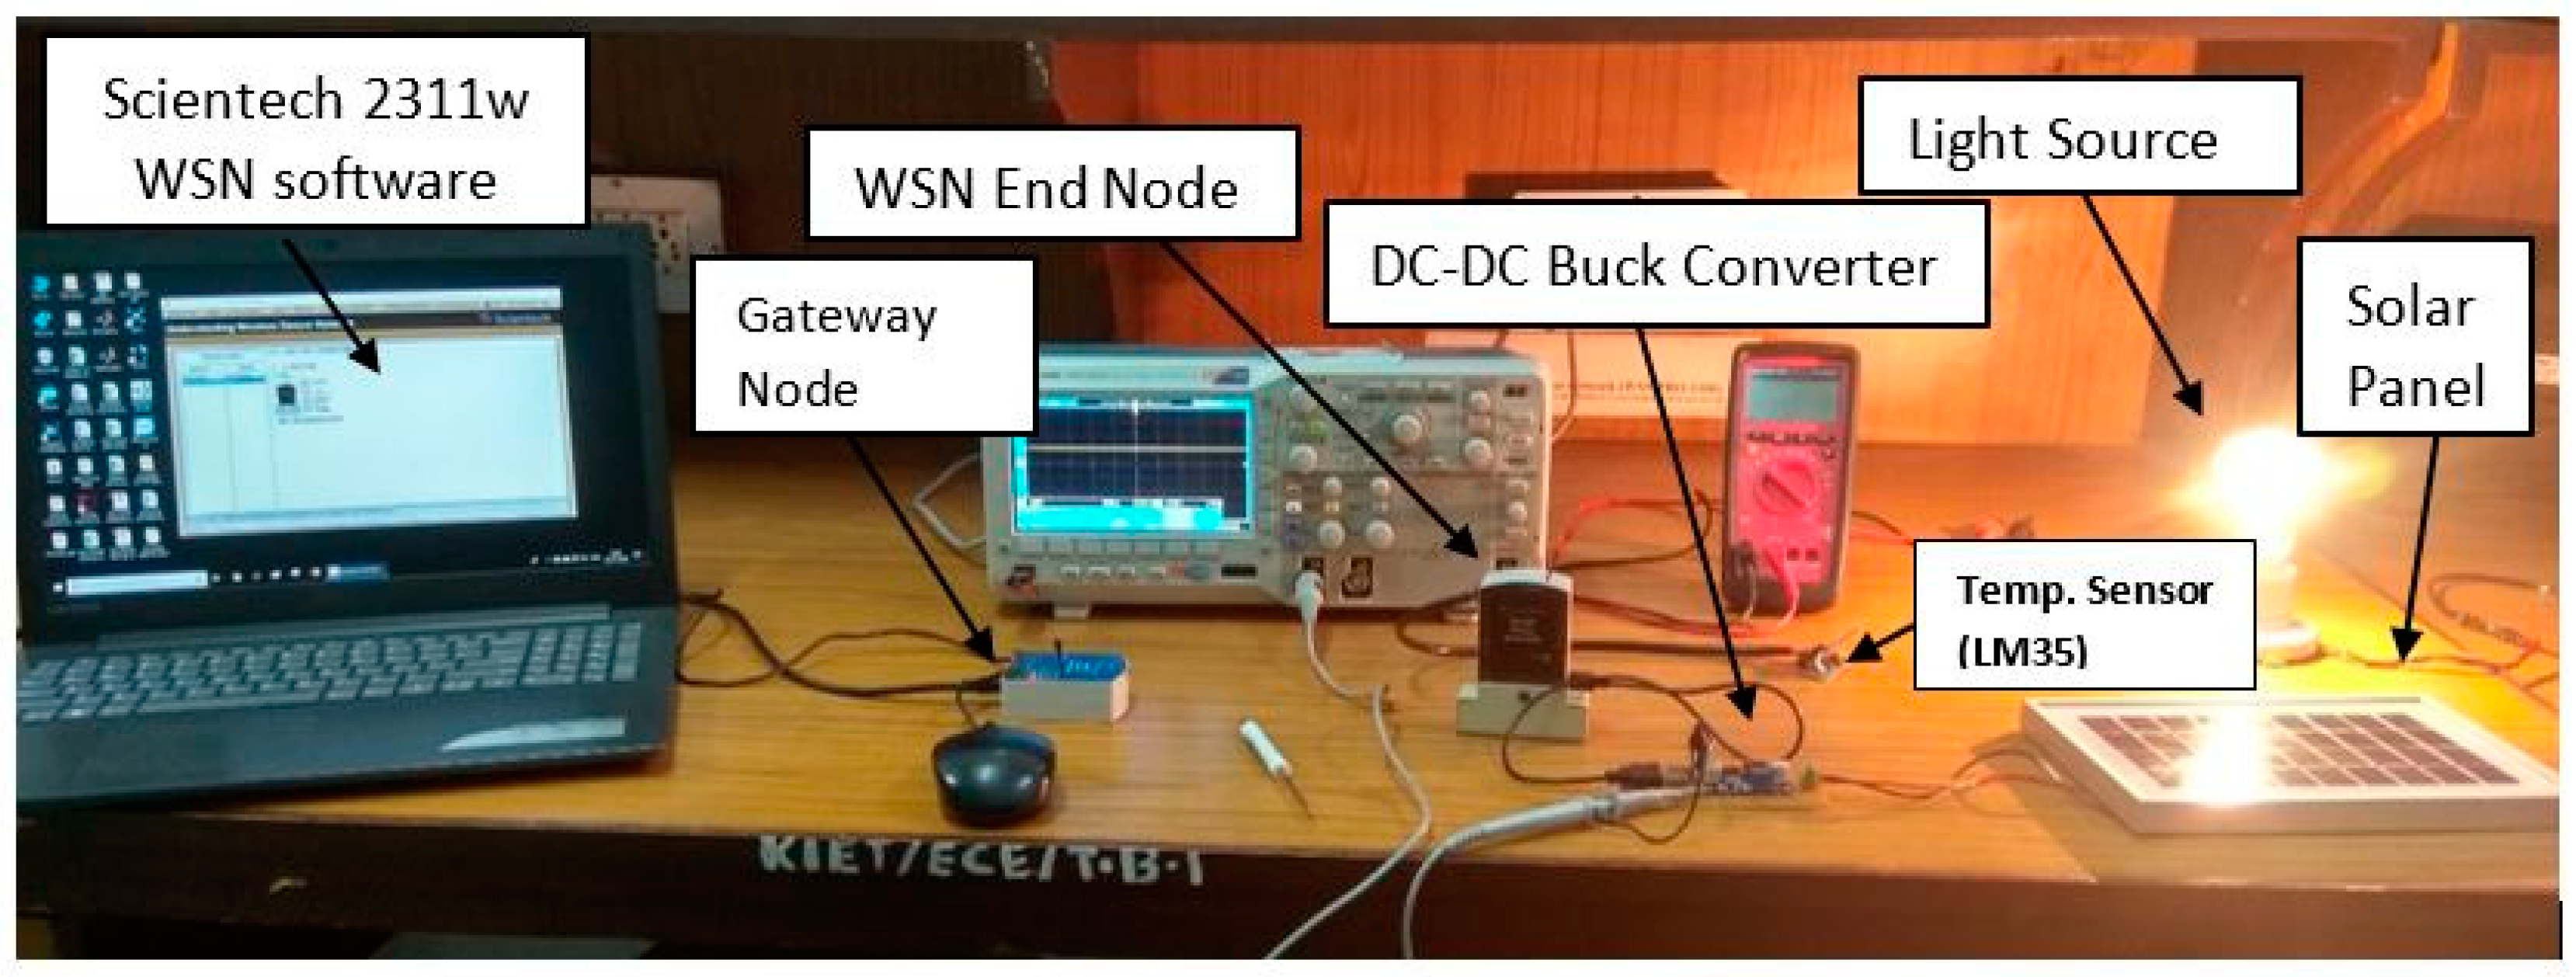
A hardware experiment for the SEH-WSN scenario is performed to monitor the room temperature wirelessly using a highly efficient of energy harvester system as shown in Figure 14. The complete SEH-WSN system is divided into two parts i.e., WSN system and an Energy harvesting system. The Scientech Technologies Private Limited, (New Delhi, India) made WSN trainer kit (Scientech 3211) is used for the WSN system and a commercial Buck converter (LM2575, Texas Instruments Inc., Dallas, TX, USA) with a solar panel is used for the solar energy harvesting system.
10.1. Scientech 2311 WSN System
It consists of a temperature sensor (LM35, Texas Instruments Inc., Dallas, TX, USA), WSN end node, a WSN USB gateway node and a WSN monitoring software installed on a laptop PC. The temperature-sensing module (LM35) is connected to the Input-Output (I/O) port 1 of the end WSN node. The end WSN node measures the temperature and sends data wirelessly to the remote gateway. The measured data is sensed by the WSN node and sent to the remote gateway node. The gateway node is connected via USB cable to the computer system. At the computer system, a software Scientech-2311w is installed which can show the visual representation of the sensor nodes topology and measured temperature (in degrees Celsius) as shown in Figure 15. In our experimental setup, the maximum distance between the remote end WSN node and the gateway WSN node is less than 10 m. The maximum distance between the gateway node and the sensor node can be up to 100 m using ZigBee communication protocols.
10.2. LM2575 Buck Converter Based Energy Harvesting System
A 5 watts solar panel and a commercial PWM controlled buck converter module is used as an energy harvesting system for the Scientech 2311W node. The output voltage from the solar panel is fed to buck converter, which removes ripples and regulates the output voltage. This ripple-free and purified dc voltage (3.3 v) is used to charge the rechargeable battery of the WSN node. The LM2575 MOSFET is used for switching action in the PWM controlled buck converter. It provides regulated dc output of 3.3 volts, 1 A to the WSN node. The maximum efficiency of the LM2575 buck converter using PWM control is only 80% as specified by manufacturer data sheets in [22]. Therefore, the actual hardware efficiency of a real-life PWM controlled LM2575 buck converter is less (i.e., 80%) as compared to theoretical simulation results (i.e., 87.76%). This validates our simulation results by comparing with a hardware experiment. Table 3 shows various hardware experiment parameters i.e. Scientech 2311w WSN system parameters, energy harvesting system parameters, and measuring instruments details.
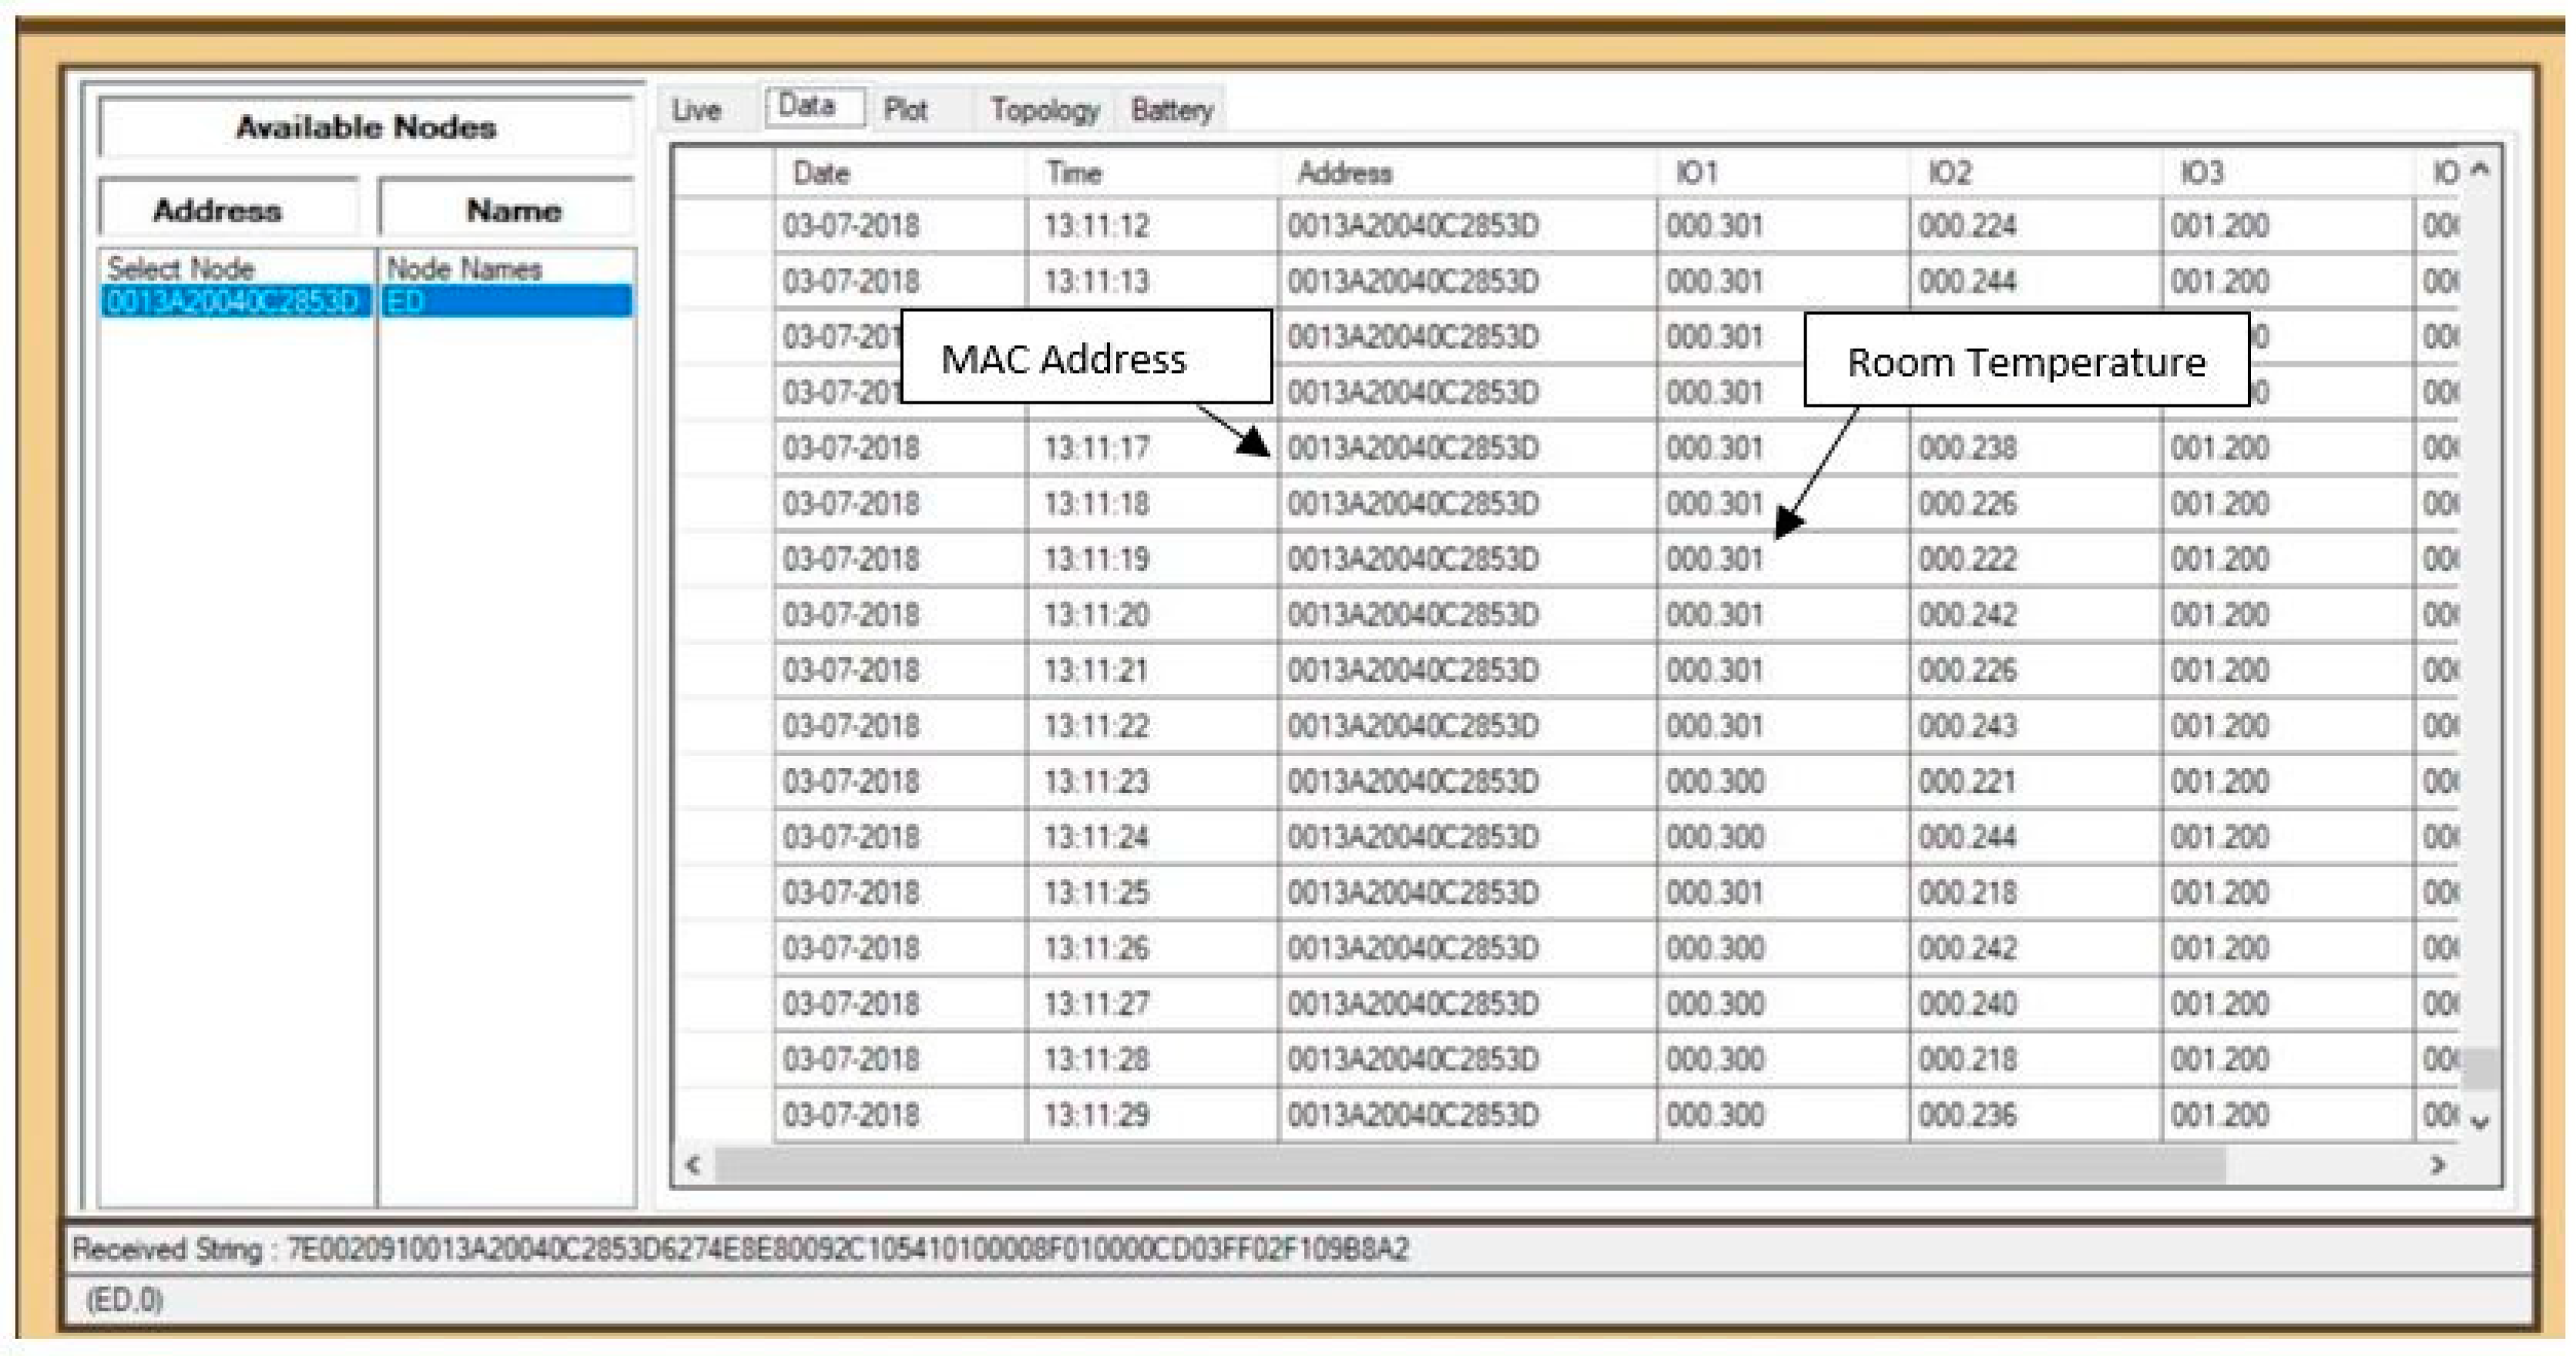
The measured room temperature is 0.301 × 100 = 30.1 degree Celsius, as shown in the Scientech 2311 WSN monitoring software in Figure 15. The MAC address of the end WSN node is also shown with the actual date (3 July 2018) and time (13:11:12 p.m.) of the reporting of the WSN end node to the gateway node.
A comparison of various existing solar energy harvesting models for WSN nodes is shown in Table 4. Similarly, other researchers in Refs. [23,24] have proposed their solar energy harvesting models with various simulation parameters considered as shown in Table 4. Finally, our proposed solar energy-harvesting model has the highest efficiency of 96.06% as compared to the other simulation works reported by the various authors as presented in Table 4.
11. Conclusions
In this paper, Modeling, Simulation, Optimization and a hardware experiment are performed for SEH-WSN nodes. Two control techniques for solar energy harvester system i.e., PWM and MPPT have been analyzed and compared using the MATLAB simulation. The efficiency of the MPPT controlled buck converter is shown to be better than the PWM controlled counterpart. The battery SoC and Terminal voltage graphs have been shown. The overall energy harvester circuit efficiency (ηsys) is calculated by adding Buck converter efficiency and, PWM efficiency and MPPT efficiency. From the comparison of simulation results, as shown in Figure 14 that the MPPT based Solar Energy Harvester system efficiency (96.06%) is better than PWM controlled system efficiency (87.76%) in the MATLAB/SIMULINK simulation. The practical hardware experiment of the SEH-WSN node is used to monitor the room temperature wirelessly using a PWM controlled buck converter. The maximum efficiency of the practical LM2575 based PWM controlled buck converter is 80%, which is less than theoretical simulation results (i.e., 87.76%). In the future, the simulation and hardware experimental work presented in this paper for SEH-WSN systems can be extended to various advanced MPPT algorithms like neural networks, fuzzy logic, and machine learning algorithms.
Author Contributions
H.S. contributed to the most of the modelling, optimization, simulation and hardware experiments work. A.H. and Z.A.J. guided the overall work as supervisor and co-supervisors respectively.
Funding
This research received no external funding.
Acknowledgments
The authors are thankful for the Advanced Power Electronics Lab, Electrical Engineering Department, Jamia Millia Islamia, (a Central Government University), New Delhi, India. This lab is supported by the Ministry of New & Renewable Energy (MNRE), Government of India, New Delhi, India.
Conflicts of Interest
The authors declare no conflict of interest.
References
- IEEE 802.15.4. IEEE Standard for Low-Rate Wireless Networks, Amendment 2: Ultra-Low Power Physical Layer; IEEE Standards Association: Piscataway, NJ, USA; IEEE Computer Society: Washington, DC, USA, 2016. [Google Scholar]
- ZigBee Pro with Green Power User Guide. Revision 1.4. Available online: www.nxp.com/documents/user_manual/JN-UG-3095.pdf (accessed on 28 June 2018).
- Dondi, D.; Bertacchini, A.; Brunelli, D. Modelling and optimization of a solar energy harvester system for self-powered wireless sensor networks. IEEE Trans. Ind. Electron. 2008, 55, 2759–2766. [Google Scholar] [CrossRef]
- Brunelli, D.; Moser, C.; Thiele, L. Design of a solar-harvesting circuit for batteryless embedded systems. IEEE Trans. Circuits Syst. 2009, 56, 2519–2528. [Google Scholar] [CrossRef]
- Mathews, I.; King, P.J.; Stafford, F.; Frizzell, R. Performance of III–V solar cells as indoor light energy harvesters. IEEE J. Photovolt. 2016, 6, 230–236. [Google Scholar] [CrossRef]
- Liu, X.; Sánchez-Sinencio, E. A highly efficient ultralow photovoltaic power harvesting system with MPPT for internet of things smart nodes. IEEE Trans. VLSI Syst. 2015, 23, 3065–3075. [Google Scholar] [CrossRef]
- Shiau, J.-K.; Ma, C.-W. Li-Ion battery charging with a buck-boost power converter for a solar powered battery management system. Energies 2013, 6, 1669–1699. [Google Scholar] [CrossRef]
- Sivakumar, S.; Jagabar Sathik, M.; Manoj, P.S.; Sundararajan, G. An assessment on performance of DC-DC converters for renewable energy applications. Renew. Sustain. Energy Rev. 2016, 58, 1475–1485. [Google Scholar] [CrossRef]
- Shin, M.; Joe, I. Energy management algorithm for solar-powered energy harvesting wireless sensor node for Internet of Things. IET Commun. 2016, 10, 1508–1521. [Google Scholar] [CrossRef]
- Sharma, H.; Haque, A.; Jaffery, Z.A. Solar energy harvesting wireless sensor network nodes: A survey. J. Renew. Sustain. Energy 2018, 10, 023704. [Google Scholar] [CrossRef] [Green Version]
- Sharma, H.; Haque, A.; Jaffery, Z.A. Design challenges in solar energy harvesting wireless sensor networks. In Proceedings of the 3rd IEEE International Conference on Nanotechnology for Instrumentation and Measurement (NANOFIM) Workshop, Greater Noida, India, 16–17 November 2017; pp. 442–448. [Google Scholar]
- Didioui, A.; Bernier, C.; Morche, D.; Sentieys, O. HarvWSNet: A co-simulation framework for energy harvesting wireless sensor networks. In Proceedings of the IEEE International Conference on Computing, Networking and Communications, Wireless Ad Hoc and Sensor Networks Symposium, San Diego, CA, USA, 28–31 January 2013; pp. 808–812. [Google Scholar]
- Yi, J.M.; Kang, M.J.; Noh, D.K. SolarCastalia: Solar energy harvesting wireless sensor network simulator. In Proceedings of the IEEE International Conference on Information and Communication Technology Convergence (ICTC), Busan, Korea, 22–24 October 2014. [Google Scholar]
- Sanchez, A.; Blanc, S.; Climent, S.; Yuste, P.; Ors, R. SIVEH: Numerical computing simulation of wireless energy-harvesting sensor nodes. Sensors 2013, 13, 11750–11771. [Google Scholar] [CrossRef] [PubMed]
- Texas Instruments Application Report on “Basic Calculation of a Boost Converter’s Power Stage”. Available online: www.ti.com (accessed on 28 June 2018).
- Texas Instruments Application Report on “Calculating Efficiency of PMP-DC-DC Controllers”. Available online: www.ti.com (accessed on 28 June 2018).
- Haque, A. Maximum Power Point Tracking (MPPT) for Scheme for Solar Photovoltaic System. J. Energy Policy Res. 2014, 1, 115–122. [Google Scholar] [CrossRef]
- Ibrahima, R.; Chung, T.D. Solar energy harvester for industrial wireless sensor nodes. In Proceedings of the IEEE International Symposium on Robotics and Intelligent Sensors, IRIS 2016, Tokyo, Japan, 17–20 December 2016; pp. 111–118. [Google Scholar]
- Li, Y.; Shi, R. An intelligent solar energy-harvesting system for wireless sensor networks. EURASIP J. Wirel. Commun. Netw. 2015, 179. [Google Scholar] [CrossRef]
- Praveen, K.; Pudipeddi, M.; Sivaramakrishna, M. Design, development and analysis of energy harvesting system for wireless pulsating sensors. In Proceedings of the IEEE Annual India Conference (INDICON), Bengaluru, India, 16–18 December 2016. [Google Scholar]
- Win, K.K.; Wu, X.; Dasgupta, S.; Wen, W.J.; Kumar, R.; Panda, S.K. Efficient solar energy harvester for wireless sensor nodes. In Proceedings of the IEEE International Conference on Communication Systems, Singapore, 17–19 November 2010; pp. 289–294. [Google Scholar]
- LM2575, 1 A, 3.3v-15v Adjustable Output Voltage, Step-Down Switching Regulator. ON Semiconductor Company Datasheets. 2009. Available online: http://onsemi.com (accessed on 28 June 2018).
- Castagnetti, A.; Pegatoquet, A.; Auguin, M. A framework for modeling and simulating energy harvesting WSN nodes with efficient power management policies. EURASIP J. Embed. Syst. 2012, 8. [Google Scholar] [CrossRef] [Green Version]
- Weddell, A.S.; Merrett, G.V.; Al-Hashimi, B.M. Ultra low-power photovoltaic MPPT technique for indoor and outdoor wireless sensor nodes. In Proceedings of the IEEE conference on Design, Automation & Test in Europe (DATE), Grenoble, France, 14–18 March 2011. [Google Scholar]
Figure 1.
Block diagram of Solar Energy Harvesting Wireless Sensor Network Node (SEH-WSN).

Figure 2.
Block diagram of solar energy harvesting system using PWM and MPPT control. (a) Using PWM control; (b) using MPPT control.
Figure 2.
Block diagram of solar energy harvesting system using PWM and MPPT control. (a) Using PWM control; (b) using MPPT control.

Figure 3.
Modelling of Solar cell (a) Symbol; (b) Equivalent circuit of Solar Cell; (c) Solar Panel.
Figure 3.
Modelling of Solar cell (a) Symbol; (b) Equivalent circuit of Solar Cell; (c) Solar Panel.

Figure 4.
Solar Panel characteristics with variations in Irradiance level (Watts/m2). (a) I–V Characteristics; (b) P–V Characteristics.
Figure 4.
Solar Panel characteristics with variations in Irradiance level (Watts/m2). (a) I–V Characteristics; (b) P–V Characteristics.

Figure 5.
Solar Panel characteristics with variations in Temperature (oC). (a) I–V Characteristics; (b) P–V Characteristics.
Figure 5.
Solar Panel characteristics with variations in Temperature (oC). (a) I–V Characteristics; (b) P–V Characteristics.

Figure 6.
Circuit Model of a DC-DC Buck Converter.

Figure 7.
Flowchart of Perturb and Observation (P&O) Algorithm for MPPT.

Figure 8.
MATLAB/SIMULINK model for PWM controlled solar energy harvesting (SEH) system for WSN Node.
Figure 8.
MATLAB/SIMULINK model for PWM controlled solar energy harvesting (SEH) system for WSN Node.

Figure 9.
MATLAB/SIMULINK model for P&O MPPT controlled SEH system for WSN Node.

Figure 10.
Simulation results of PWM controlled and P&O MPPT controlled solar energy harvesting (SEH) system for 10 s. (a) Battery SoC, Voltage and Current during Charging using PWM control; (b) Battery SoC, Voltage and Current during Charging using P&O MPPT control.
Figure 10.
Simulation results of PWM controlled and P&O MPPT controlled solar energy harvesting (SEH) system for 10 s. (a) Battery SoC, Voltage and Current during Charging using PWM control; (b) Battery SoC, Voltage and Current during Charging using P&O MPPT control.

Figure 11.
Simulation results of PWM controlled and P&O MPPT controlled solar SEH system for 100 s. (a) Battery SoC, Voltage and Current during Charging using PWM control; (b) Battery SoC, Voltage and Current during Charging using P&O MPPT control.
Figure 11.
Simulation results of PWM controlled and P&O MPPT controlled solar SEH system for 100 s. (a) Battery SoC, Voltage and Current during Charging using PWM control; (b) Battery SoC, Voltage and Current during Charging using P&O MPPT control.

Figure 12.
Simulation results of PWM controlled and P&O MPPT controlled solar SEH system for 200 s. (a) Battery SoC, Voltage and Current during Charging using PWM control; (b) Battery SoC, Voltage and Current during Charging using P&O MPPT control.
Figure 12.
Simulation results of PWM controlled and P&O MPPT controlled solar SEH system for 200 s. (a) Battery SoC, Voltage and Current during Charging using PWM control; (b) Battery SoC, Voltage and Current during Charging using P&O MPPT control.

Figure 13.
Comparison of PWM and P&O MPPT Harvesting System Efficiency .

Figure 14.
Hardware Experiment setup of SEH-WSN system.

Figure 15.
Temperature monitoring readings of the SEH-WSN node on a personal computer.


Table 1.
Simulation Parameters.
| Parameters | Value | Parameters | Value |
|---|---|---|---|
| Irradiance (W/m2) | 1000 Watts/m2 | Capacitor (C) | 100 uF |
| Temperature (T) | 25 degree Celsius | Inductor (L) | 200 uH |
| DC-DC Converter | Boost Converter | MOSFET Switching Frequency (f) | 5 KHz |
| Max. Solar Panel output voltage (Vm) | 6 volts | Initial duty Cycle | 0.5 |
| Max. Solar Panel output current (Im) | 500 mA | MOSFET Switching Power Losses (Psw) | 0.5 mW |
| Max. Power from Solar Cell (Pm) | 3 watts | Switching Voltage Loss (Vsw) | 0.2 volts |
| Rechargeable Battery Type | NiCd | WSN Load Model | 10-ohm resistor |
| Battery Voltage | 3.6 volts | Inductor conduction Power Loss (PL) | 50 mW |
Table 2.
Simulation Results for PWM and MPPT Controlled SEH systems.
| Energy Harvester Parameters | PWM Control | P&O MPPT Control |
|---|---|---|
| Max. Solar Panel output Power (Pm) | 2.5 watts | 2.8 watts |
| Average Buck Converter Output Voltage (Vm) | 3.3 volts | 3.5 volts |
| Average Buck Converter Output Current (Im) | 260 mA | 500 mA |
| Buck Converter Output Power | 650 mW | 1.8 watts |
| Inductor Loss | 50 mW | 20 mW |
| MOSFET Switching Loss | 5 mW | 2 mW |
| Harvester System Efficiency (%) | 87.76% | 96.06% |
Table 3.
Hardware Experiment Parameters.
| Hardware Experiment Parameters | Number of Components and Details |
|---|---|
| Scientech 2311w WSN system: | |
| WSN Gateway Node | 1 |
| WSN End node | 1 |
| Temperature Sensor Module (LM35) | 1 |
| Scientech 2311w WSN monitoring software installed on a Laptop PC | 1 |
| Energy Harvesting System: | |
| Solarcraft Solar Panel | 5 w, 8 V, 0.65 A |
| Generic LM2576, 80% efficient, PWM controlled DC-DC Buck Converter | 3.6 V–40 V, 2 A |
| Measuring Instruments: | |
| Tektronix 200MHz Digital Storage Oscilloscope (DSO) | 1 |
| Multimeter | 1 |
Table 4.
Comparison of existing Solar Energy Harvesting models for WSN nodes.
| Author & Year | Proposed Solar Energy Harvester Model | Irradiance (W/m2) Consider | Temperature (°C) Consider | Inductor and Capacitor Loss Consider | (PWM/MPPT) Consider | Super Capacitor/Battery Consider | Power Consumption of Harvester Circuit Consider | Maximum Efficiency | Model Validation Consider |
|---|---|---|---|---|---|---|---|---|---|
| Denis Dondi et al. [3], 2008 | Boost Converter with MPPT | Yes (20–1000 W/m2) | No | Yes | MPPT only | Battery | No | 85% | No |
| Davide Brunelli et al. [4], 2009 | Boost Converter with MPPT | No | No | No | MPPT only | Both | Yes | 80% | Yes |
| Andrea Castagnetti et al. [23], 2012 | Boost Converter | No | No | No | Not Reported | Battery | Yes | Not Reported | yes |
| Alex S. Weddell et al. [24], 2012 | Buck-Boost Converter with MPPT | Yes (200–5000 W/m2) | No | No | MPPT | Battery | Yes | Not reported | Yes |
| Our Proposed Model | Buck Converter with PWM & MPPT both | Yes | Yes | No | PWM & MPPT both | Both | Yes | 96.06% | Yes |
© 2018 by the authors. Licensee MDPI, Basel, Switzerland. This article is an open access article distributed under the terms and conditions of the Creative Commons Attribution (CC BY) license (http://creativecommons.org/licenses/by/4.0/).
Share and Cite
MDPI and ACS Style
Sharma, H.; Haque, A.; Jaffery, Z.A. Modeling and Optimisation of a Solar Energy Harvesting System for Wireless Sensor Network Nodes. J. Sens. Actuator Netw. 2018, 7, 40. https://doi.org/10.3390/jsan7030040
AMA Style
Sharma H, Haque A, Jaffery ZA. Modeling and Optimisation of a Solar Energy Harvesting System for Wireless Sensor Network Nodes. Journal of Sensor and Actuator Networks. 2018; 7(3):40. https://doi.org/10.3390/jsan7030040
Chicago/Turabian StyleSharma, Himanshu, Ahteshamul Haque, and Zainul Abdin Jaffery. 2018. "Modeling and Optimisation of a Solar Energy Harvesting System for Wireless Sensor Network Nodes" Journal of Sensor and Actuator Networks 7, no. 3: 40. https://doi.org/10.3390/jsan7030040
Note that from the first issue of 2016, this journal uses article numbers instead of page numbers. See further details here.