Activity Classification Feasibility Using Wearables: Considerations for Hip Fracture


1
School of Engineering and Mathematical Sciences, Auckland University of Technology (AUT), Auckland 1142, New Zealand
2
School of Clinical Sciences, Auckland University of Technology (AUT), North Shore Campus, Auckland 1142, New Zealand
*
Author to whom correspondence should be addressed.
J. Sens. Actuator Netw. 2018, 7(4), 54; https://doi.org/10.3390/jsan7040054
Submission received: 21 November 2018
/
Revised: 5 December 2018
/
Accepted: 11 December 2018
/
Published: 17 December 2018
(This article belongs to the Special Issue Sensor and Actuator Networks: Feature Papers)
Abstract
:Falls in the elderly are a common health issue that can involve severe injuries like hip fractures, requiring considerable medical attention, and subsequent care. Following surgery, physiotherapy is essential for strengthening muscles, mobilizing joints and fostering the return to physical activities. Ideally, physiotherapy programmes would benefit from active home-based monitoring of the elderly patients’ daily activities and exercises. This paper aims at providing a preliminary analysis addressing three key research questions. First, what are the key involved activities (at-hospital, home exercises, and activities of daily living) during the post-operative hip fracture rehabilitation process? Second, how can one monitor and identify a range of leg exercises accurately? Last, what is the most suitable sensor location that can categorize the majority of the physical activities thought to be important during the rehabilitation programme? During preliminary testing, it was noted that a standard deviation of the acceleration signal was suitable for classification of static activities like sitting, whereas classification of the ambulatory activities like walking, both the frequency content and related amplitude of the acceleration signal, plays a significant role. The research findings suggest that the ankle is an appropriate location for monitoring most of the leg movement physical activities.
1. Introduction
Hip fracture is a common event among the elderly population. This often leads to loss of independence with high morbidity and mortality rates [1]. It is a common health issue arising from osteoporosis. It is normally combined with a fall and is anticipated to become the forefront in terms of demand for healthcare and social welfare services [2].
The effect of physical therapy following surgery has been presented previously [3,4] and shows its potential to increase strength, range of motion, and mobility. Despite continual therapy, some analysis [4,5] reveals that there is considerable variability in responses to rehabilitation, and it becomes challenging for healthcare professionals to keep a close track of the patient’s daily activities/exercise and hence health progress.
It has been expressed that following hip fracture surgery, the patient should be provided with an optimal, well-coordinated, and organized rehabilitation programme [6]. In order to be able to achieve such a program, we require active tracking. This will support the needs for the well-coordinated and organized rehabilitation programme. The patient can be tracked actively and in real time through wearable sensors attached on the body, remote communication, and the activity recognition approach.
In fact, wearable sensor-based activity monitoring has been considered quite effective for clinical applications in activity or movement measurement and classification [7,8]. The use of wearable sensors supports patients to live an independent life safely. It also helps healthcare professionals in actively tracking a patient’s activity levels on a regular basis once discharged from hospital [7,9].
Understanding the recovery progression stages and the activities involved during the hip fracture rehabilitation process is essential for planning the sensor-based monitoring system. No specific guidelines are accessible pertaining to the key activities involved at different stages of rehabilitation following hip fracture. Based on the information provided from the literature [10,11], it is apparent that there are different activities at each stage of treatment that occur for hip fracture patients. The post-operative hip fracture healing progressive stages involve a number of stages. These stages cover the rehabilitation requirements at hospital, indoor at-home activities, and outdoor activities. At hospital, bed-mobility, which involves turning and bridging activities, is the first stage of the rehabilitation. This is followed by the second stage, which is the functional tasks, range of motion, and strengthening exercises. The activity types associated here are:
- The transitions, like lying to sitting and sitting to standing.
- The ambulatory activities, like climbing the stairs and walking with walking aids.
- Minimizing impairments, like walking with weights, exercycle, and stretching routines.
Rehabilitation in the indoor environment that encourages independent living covers the third stage. The focus here is on the lower extremity physical daily assisted living. This involves four groups of activities:
- Stationary exercise while lying on the back and stomach.
- Stationary exercise while sitting, i.e., straightening the knee from 90-degree flexion to fully extended and then returning to flexed.
- Stationary exercise while standing, like lifting the thigh upwards in front of the body, swinging a leg side to side, stepping up, and squats.
- Exercycle, i.e., time spent cycling on a stationary bike.
Apart from the continued improvement in activities described above, rehabilitation in the outdoor environment that helps the patient go out of the home and maintain as much independence as possible covers the final stage of rehabilitation. The focus here is on gait-related activity. This includes mostly walking and knowing the distance travelled, and speed is the key aspect here.
The post-operative effects of physiotherapeutic exercises and mobility training during the hip fracture rehabilitation process for elderly patients have been discussed by a number of scholars [12,13,14,15]. Limited information is available that accurately describes the physical activities undertaken at key stages during the post-operative rehabilitation, particularly those stages that occur when the patient is at home. Appreciating the number of sets of different exercises and the time spent by the patient when sitting, standing, or walking during the course of the day is of significance as it has not been addressed sufficiently by other researchers.
As a result, the development of a new active monitoring system that can monitor the different key activities like sitting, standing, climbing stairs, walking, exercycle, leg movement, and swinging the leg to the side as described above is valuable for monitoring physical activity during independent living [16].
2. Wearable Data Collection and Analysis Method
This section discusses the wearable device used for activity data collection. It also discusses the approach for activity data analysis, presentation, and recognition. The subject used for this research is a healthy young individual. Although this does not offer precise representation of a post-operative hip fracture elderly patient, it does satisfy the early stages of studying the feasibility for the approach before proceeding with trials on elderly people and then elderly patients.
2.1. Wearable Activity Sensing Device System Used
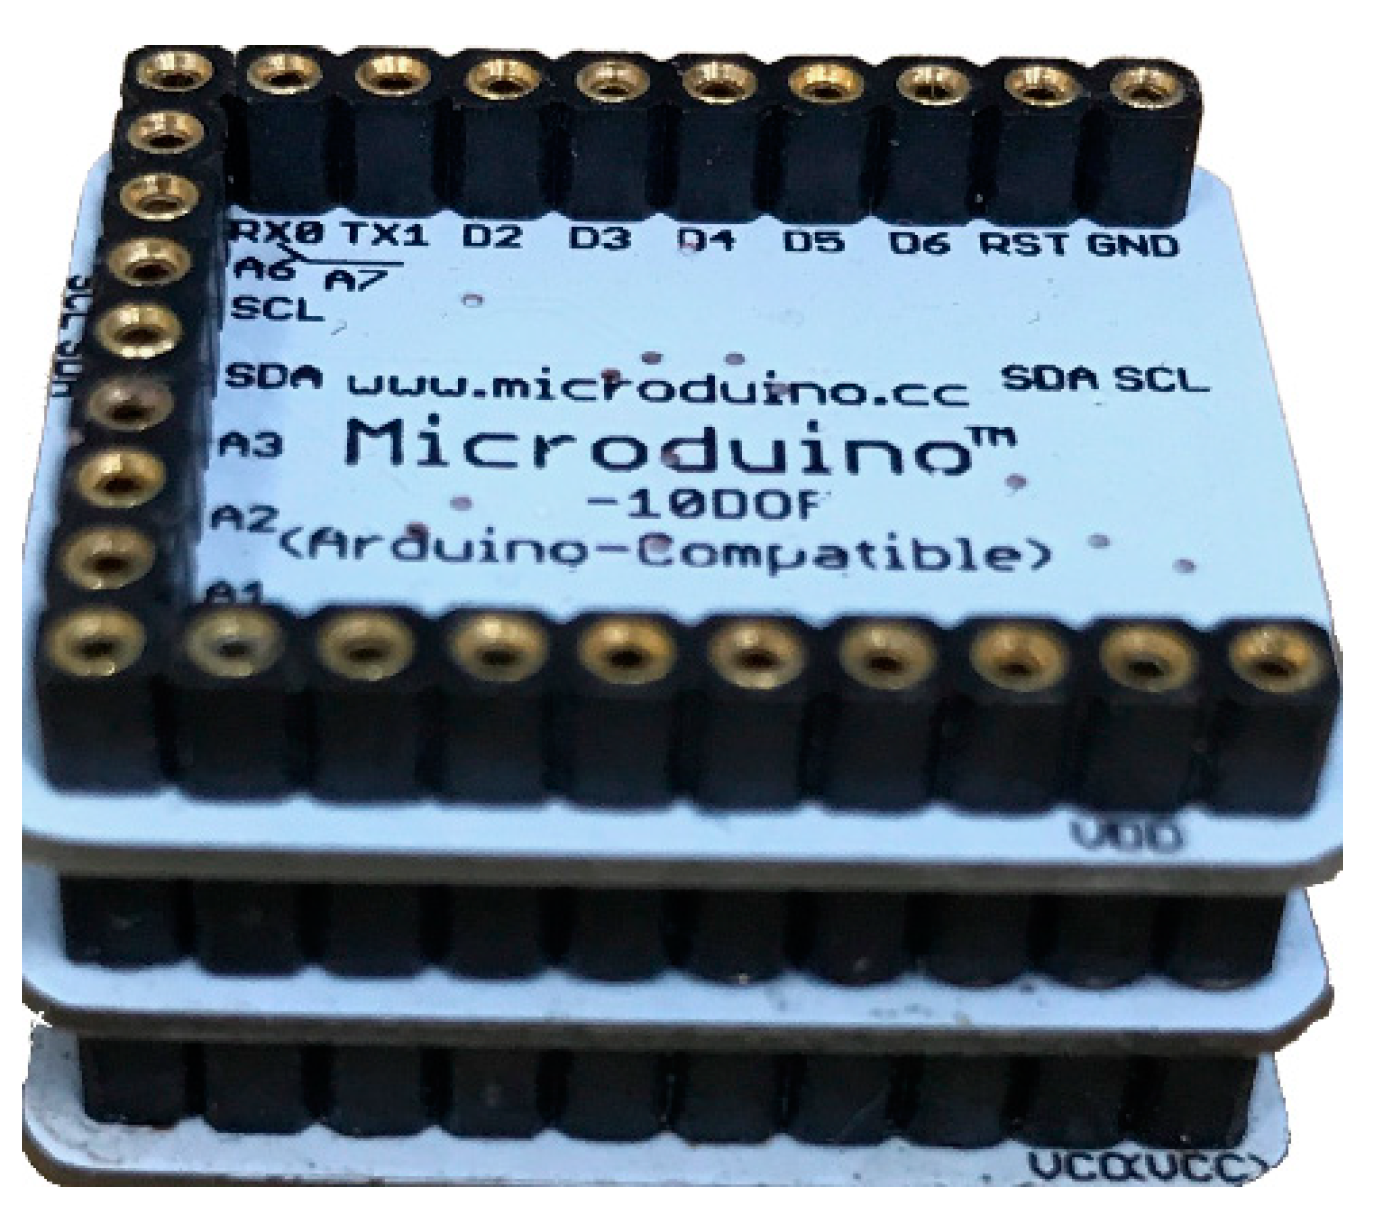
Acceleration-based sensing has been considered predominant for activity classification [17]. As a result, the wearable sensor hardware used is the micro-electromechanical sensor (MEMS) triaxial accelerometer MPU6050 (InvenSense Inc., San Jose, CA, USA). It offers four different ranges of acceleration: ±2 g, ±4 g, ±8 g, ±16 g, where g is the acceleration due to gravity in m/s2. The acceleration range of ±2 g is considered sufficient to detect ambulation activities [18]. The three layers as shown in Figure 1 below represent the wireless controller (Microduino Core+), the triaxial accelerometer, and the SD card. The stored test data are then processed off-line using MATLAB FFT software (8.6.0.267246 (R2015b), Mathworks, Natick, MA, USA. This software identifies the dominant spectrum relevant to each of the activities.
2.2. Activity Data Collection Process
Real-time triaxial accelerometer data are collected at a sampling frequency of 128 Hz for each activity (i.e., static, ambulatory, and hip fracture activities) over a five-minute period. Five minutes is selected as the preference for the data collection due to the following reasons.
First, it will provide a sufficient number of activity samples. Second, it offers good coverage for the range of activities especially for slow movement activities like leg movement while sitting, slow walking, and swinging the leg to the side while standing. It will also help in analysing the dynamic switching from one activity to the other.
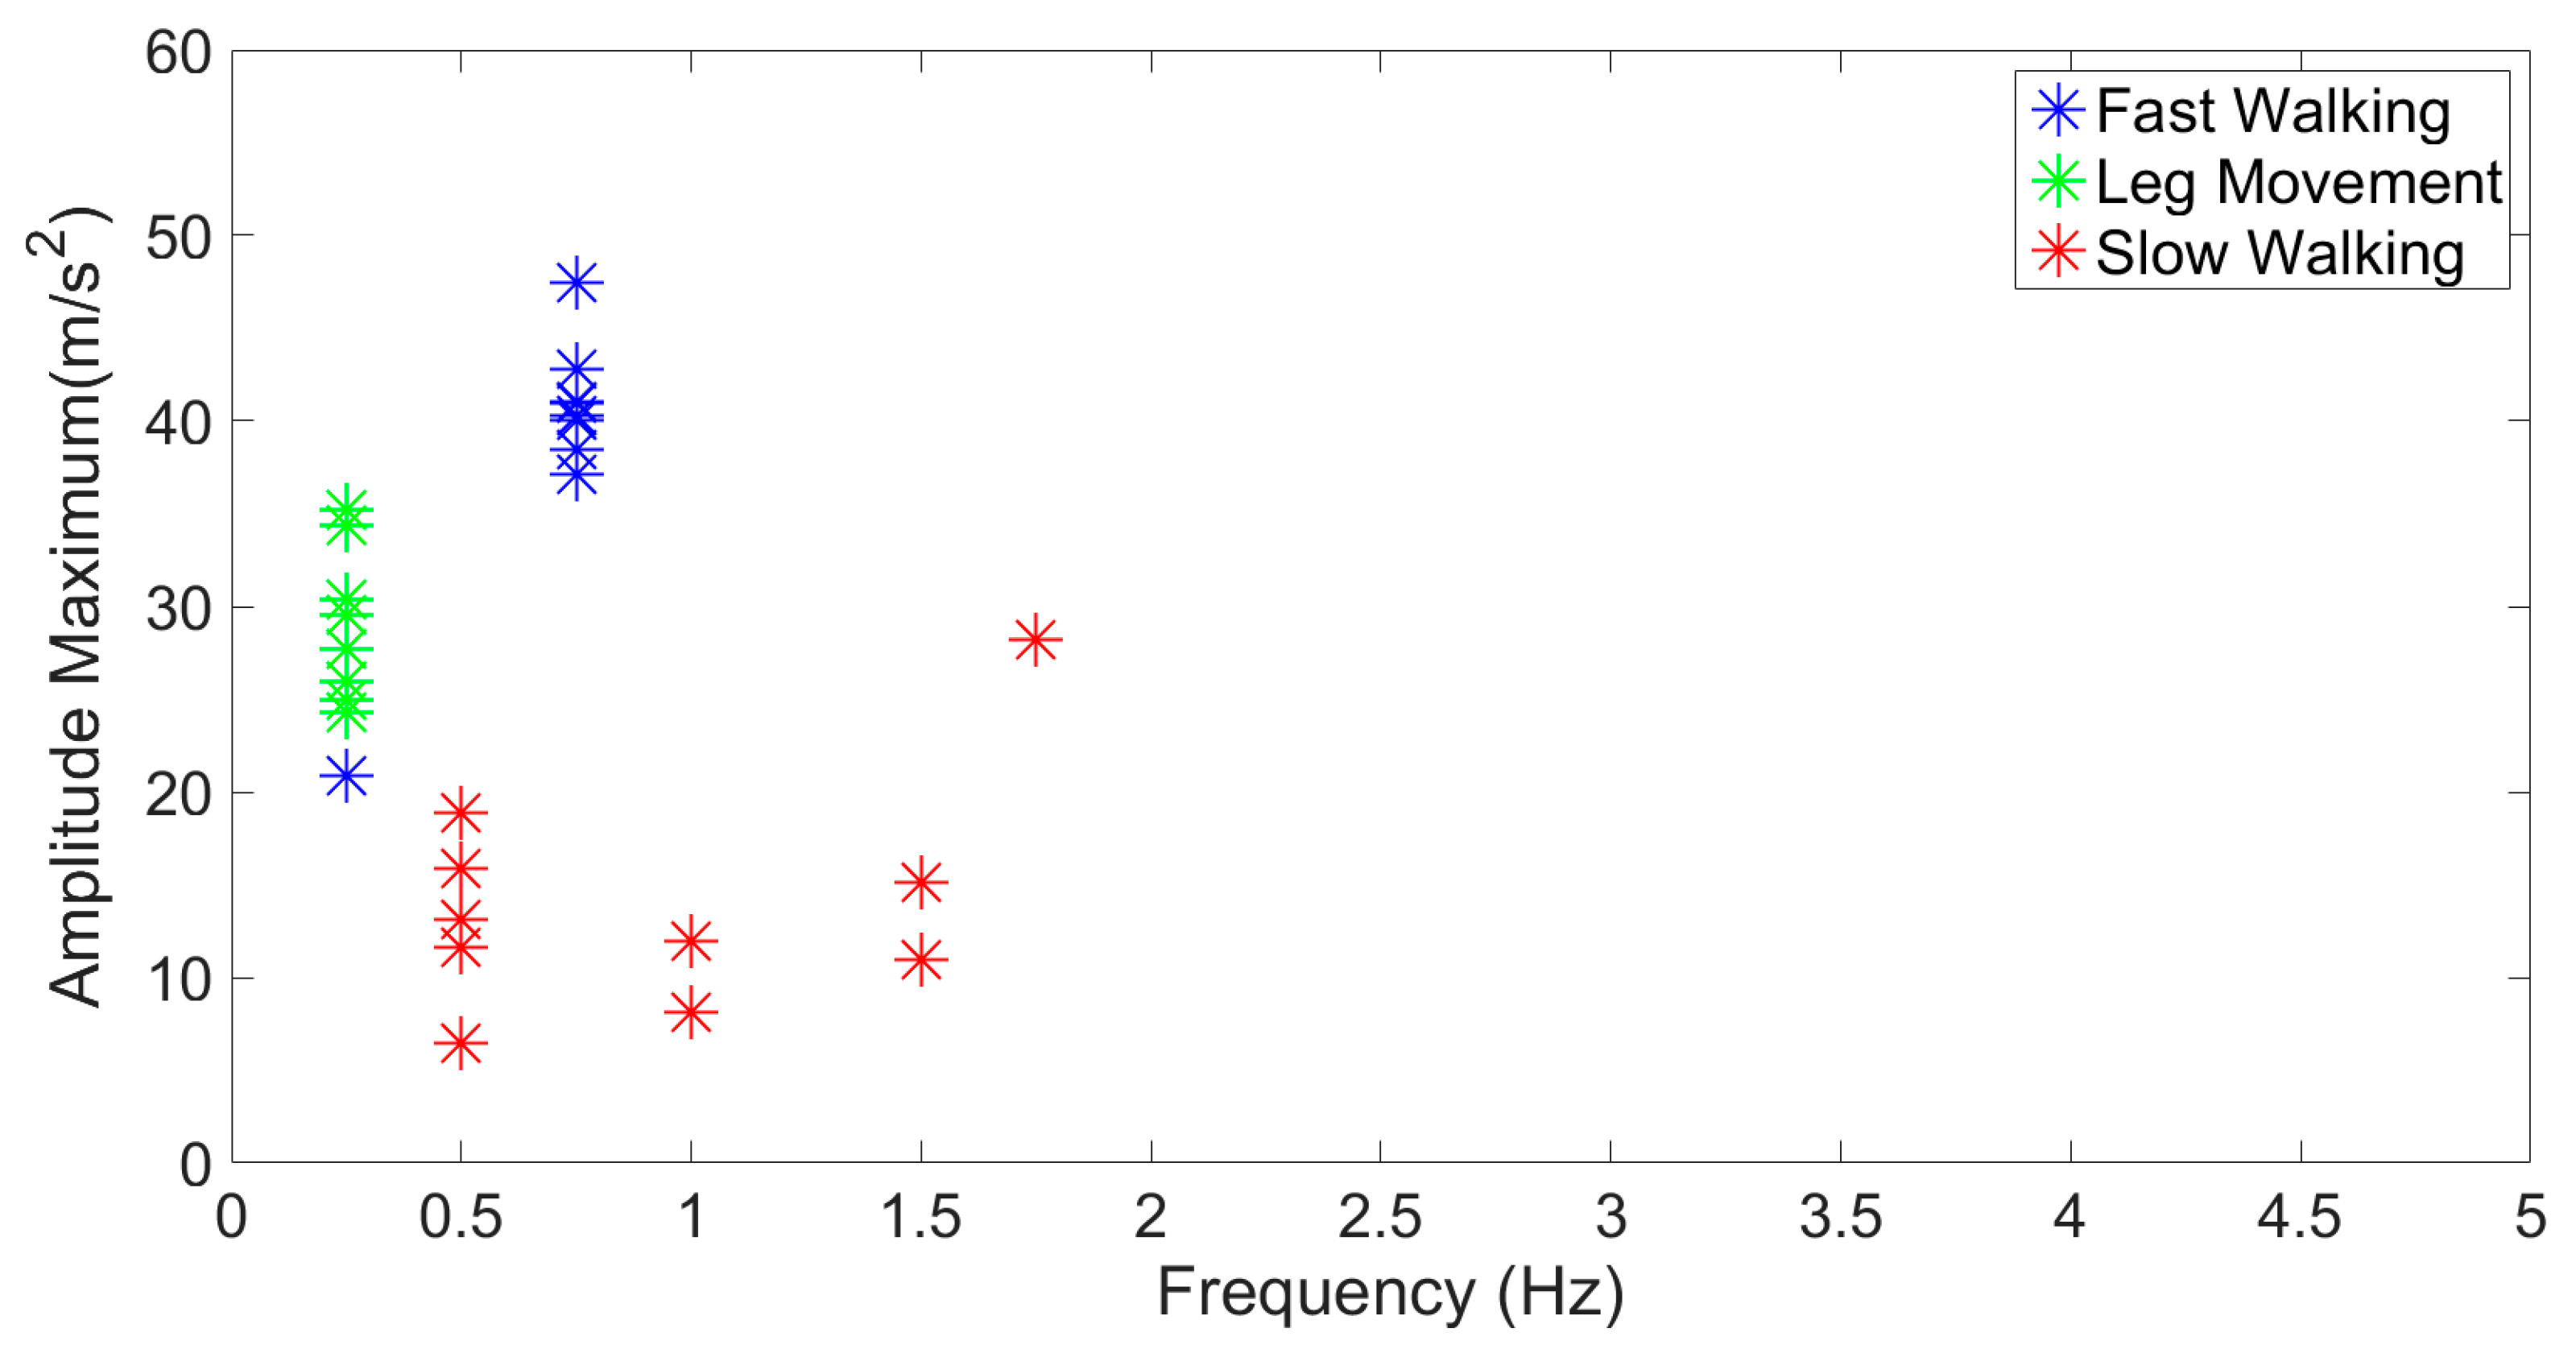
The structure of the five-minute period is divided into 10 data collection tests where each test collects data for 24 s followed by a 6-s halt. The test is subsequently repeated until the required time is completed. The 24-s epochs with 6-s rest are chosen ad-hoc. However, five other different times (1, 3, 6, 12, and 18 s) are also explored on a given case. After three activities are analysed (leg movement, slow, and fast walking at the ankle location only), the findings show that no difference was observed on reducing the data collection time to 6, 12, or 18 s for each set, as the activity recognition results are the same. In fact, for three seconds, as shown in Figure 2, it is observed that for fast walking and leg movement activities, both maximum frequency and amplitude data seem to be more consistent compared to slow walking. Moreover, on reducing to one second, data inconsistency is observed for both maximum amplitude and frequency across all activities.
2.3. Activity Data Processing Model
This section describes the mathematical expressions used for the: mean (m), standard deviation (σ), skewness (S), kurtosis (K), amplitude (A), and frequency peak (FP) involved in data processing algorithm techniques for activity classification. These are as follows [19]:
where N represents the number of total data samples, ci is the centre value for the ith interval of the histogram, ni = the data sample number at interval i, K is the number of intervals, α128 represents every fourth sample of the total FFT sample dataset, l = 1:(5/FS), and Frequency Scalar (FS) = (sampling frequency/N4)/128. N4 is equal to a value of four. It takes every fourth sample from the collected accelerometer data. The value of 128 represents the length of α128.
A frequency range of 20 Hz was considered sufficient to capture everyday activities [20]. With respect to this point, the proposed sampling frequency is down-sampled to 32 Hz by taking every fourth sample. This is represented in Equation 5 as α128.
Some of the activities investigated are part of a daily life routine, such as sitting, standing, and walking. Categorizing each of these activities is important to associate or discriminate posture within the context of the exercises prescribed by a physiotherapist. For example, if a physiotherapist needs to monitor the leg movement of a person while sitting, categorizing the posture irrespective of the limb movement is important.
It has been acknowledged that, based on sensor orientation, it is possible to classify some static activities [19]; however, this alone is not enough to discriminate all types of activities. However, for a detailed classification of static activity behaviour, Baek et al. [19] used four parameters, skewness, kurtosis, mean, and standard deviation, and categorized the activity based on a single-axis sensor orientation.
This paper combines the three-axis raw accelerometer data and subsequently categorises static exercises (i.e., sitting and standing) based on these parameters. The purpose of combining the sensor axes is to make the algorithm immune to potential errors in aligning the sensors with body or anatomical axes.
In fact, for ambulatory and hip fracture-related activities categorisation, the combined three-axis raw accelerometer data are subjected exclusively to FFT. This is to identify the dominant frequency peak corresponding to the maximum amplitude. Identification of the maximum amplitude and frequency would help in comparing and classifying each activity accurately, as discussed more in the Results Section.
2.4. Considerations for the Body-Worn Sensor
The location of a sensor on the human body is significant from the perspective of human comfort, obtaining precise and accurate data, communication optimization, usability, and adaptability. It is acknowledged that sensor placement is highly dependent on the type of activity monitored and is application specific [21,22].
Sensors with single and multiple accelerometer sensors have been placed at different locations to explore the optimal sensor location for a range of activities [21,22,23,24,25]. Cleland et al. [21] investigated six different body locations to determine the optimal placement of an accelerometer sensor for recognition of basic everyday activities. Their analyses showed that sitting and standing results were poor when the sensor was on the foot. This, however, was more accurate for lying and jogging. Notably, the lower back is not considered suitable for classification, as the accelerometer tends to twist and causes irregularities in the data. Hence, Cleland et al. [21] concluded that the left hip (sensor located at the iliac crest) is the ideal location for classifying everyday activities.
Atallah et al. [24] focused on investigating the ideal sensor location for a varied group of activities involving upper and lower limbs. Results showed that wrist location provided good precision and identification rates for activities like preparing food and eating, whereas a waist-mounted sensor showed good results for lower limb activities like walking and sitting. Unlike Cleland et al. [21], Atallah et al. [24] did not investigate the effect of combining accelerometer data on classification accuracy.
Overall, there are limited evidence and information available about sensor placement in general. No one location can be viewed as perfect, and this factor is still a subject of debate that needs to be addressed [16,26]. Since hip fracture exercises and physical activities focus on lower limb activities, an ankle location was considered as it has the potential to quantify most exercises and particularly gait-related activities and related features like walking, energy expenditure, and distance.
An important feature related to localization is sensor orientation. It may be directly attached to the skin by glue or tape or be placed within a strap. This becomes more complicated if developing a user-independent sensing device [27]. This is because it gives the user the freedom to adjust the sensor position and its placement to fit with their clothing choice [22]. Allowing such adjustments could alter signals from sensors like accelerometers quite dramatically, leading to erroneous categorisation of exercise and activities.
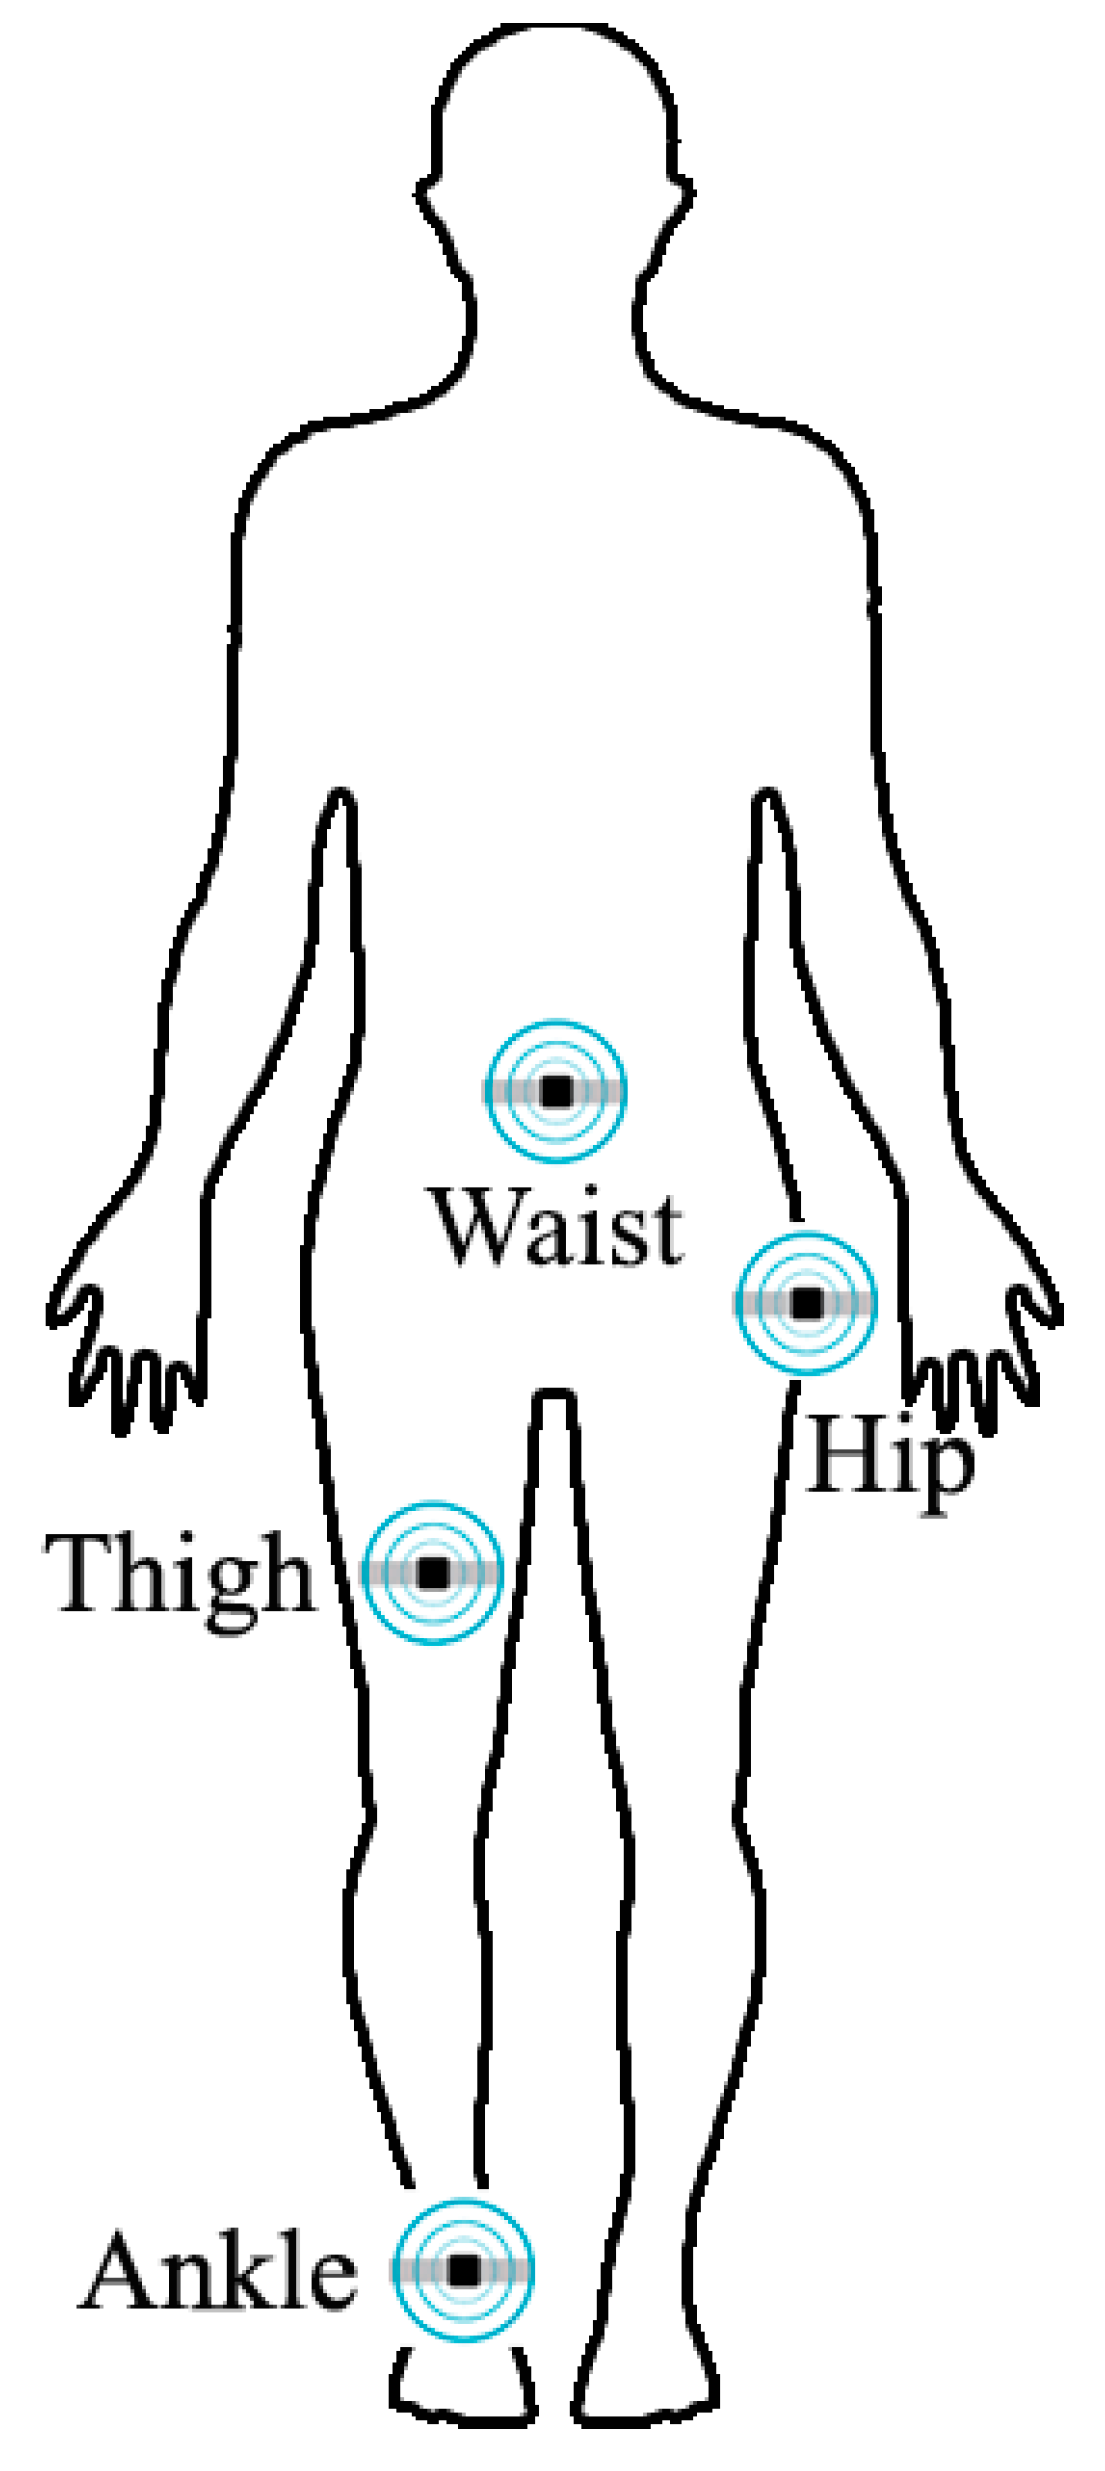
In our study, as part of the preliminary testing, four different sensor locations (waist, hip, thigh, and ankle) were considered, as shown in Figure 3 below. Hip, thigh, and ankle sensors were attached on the right side of the body, whereas a waist sensor was located at the centre of the body.
3. Results
This section represents the experimental data analysis of various activities with respect to sensor localization. The description of each of the activities is as follows.
3.1. Static Activities
Sitting vs. Standing
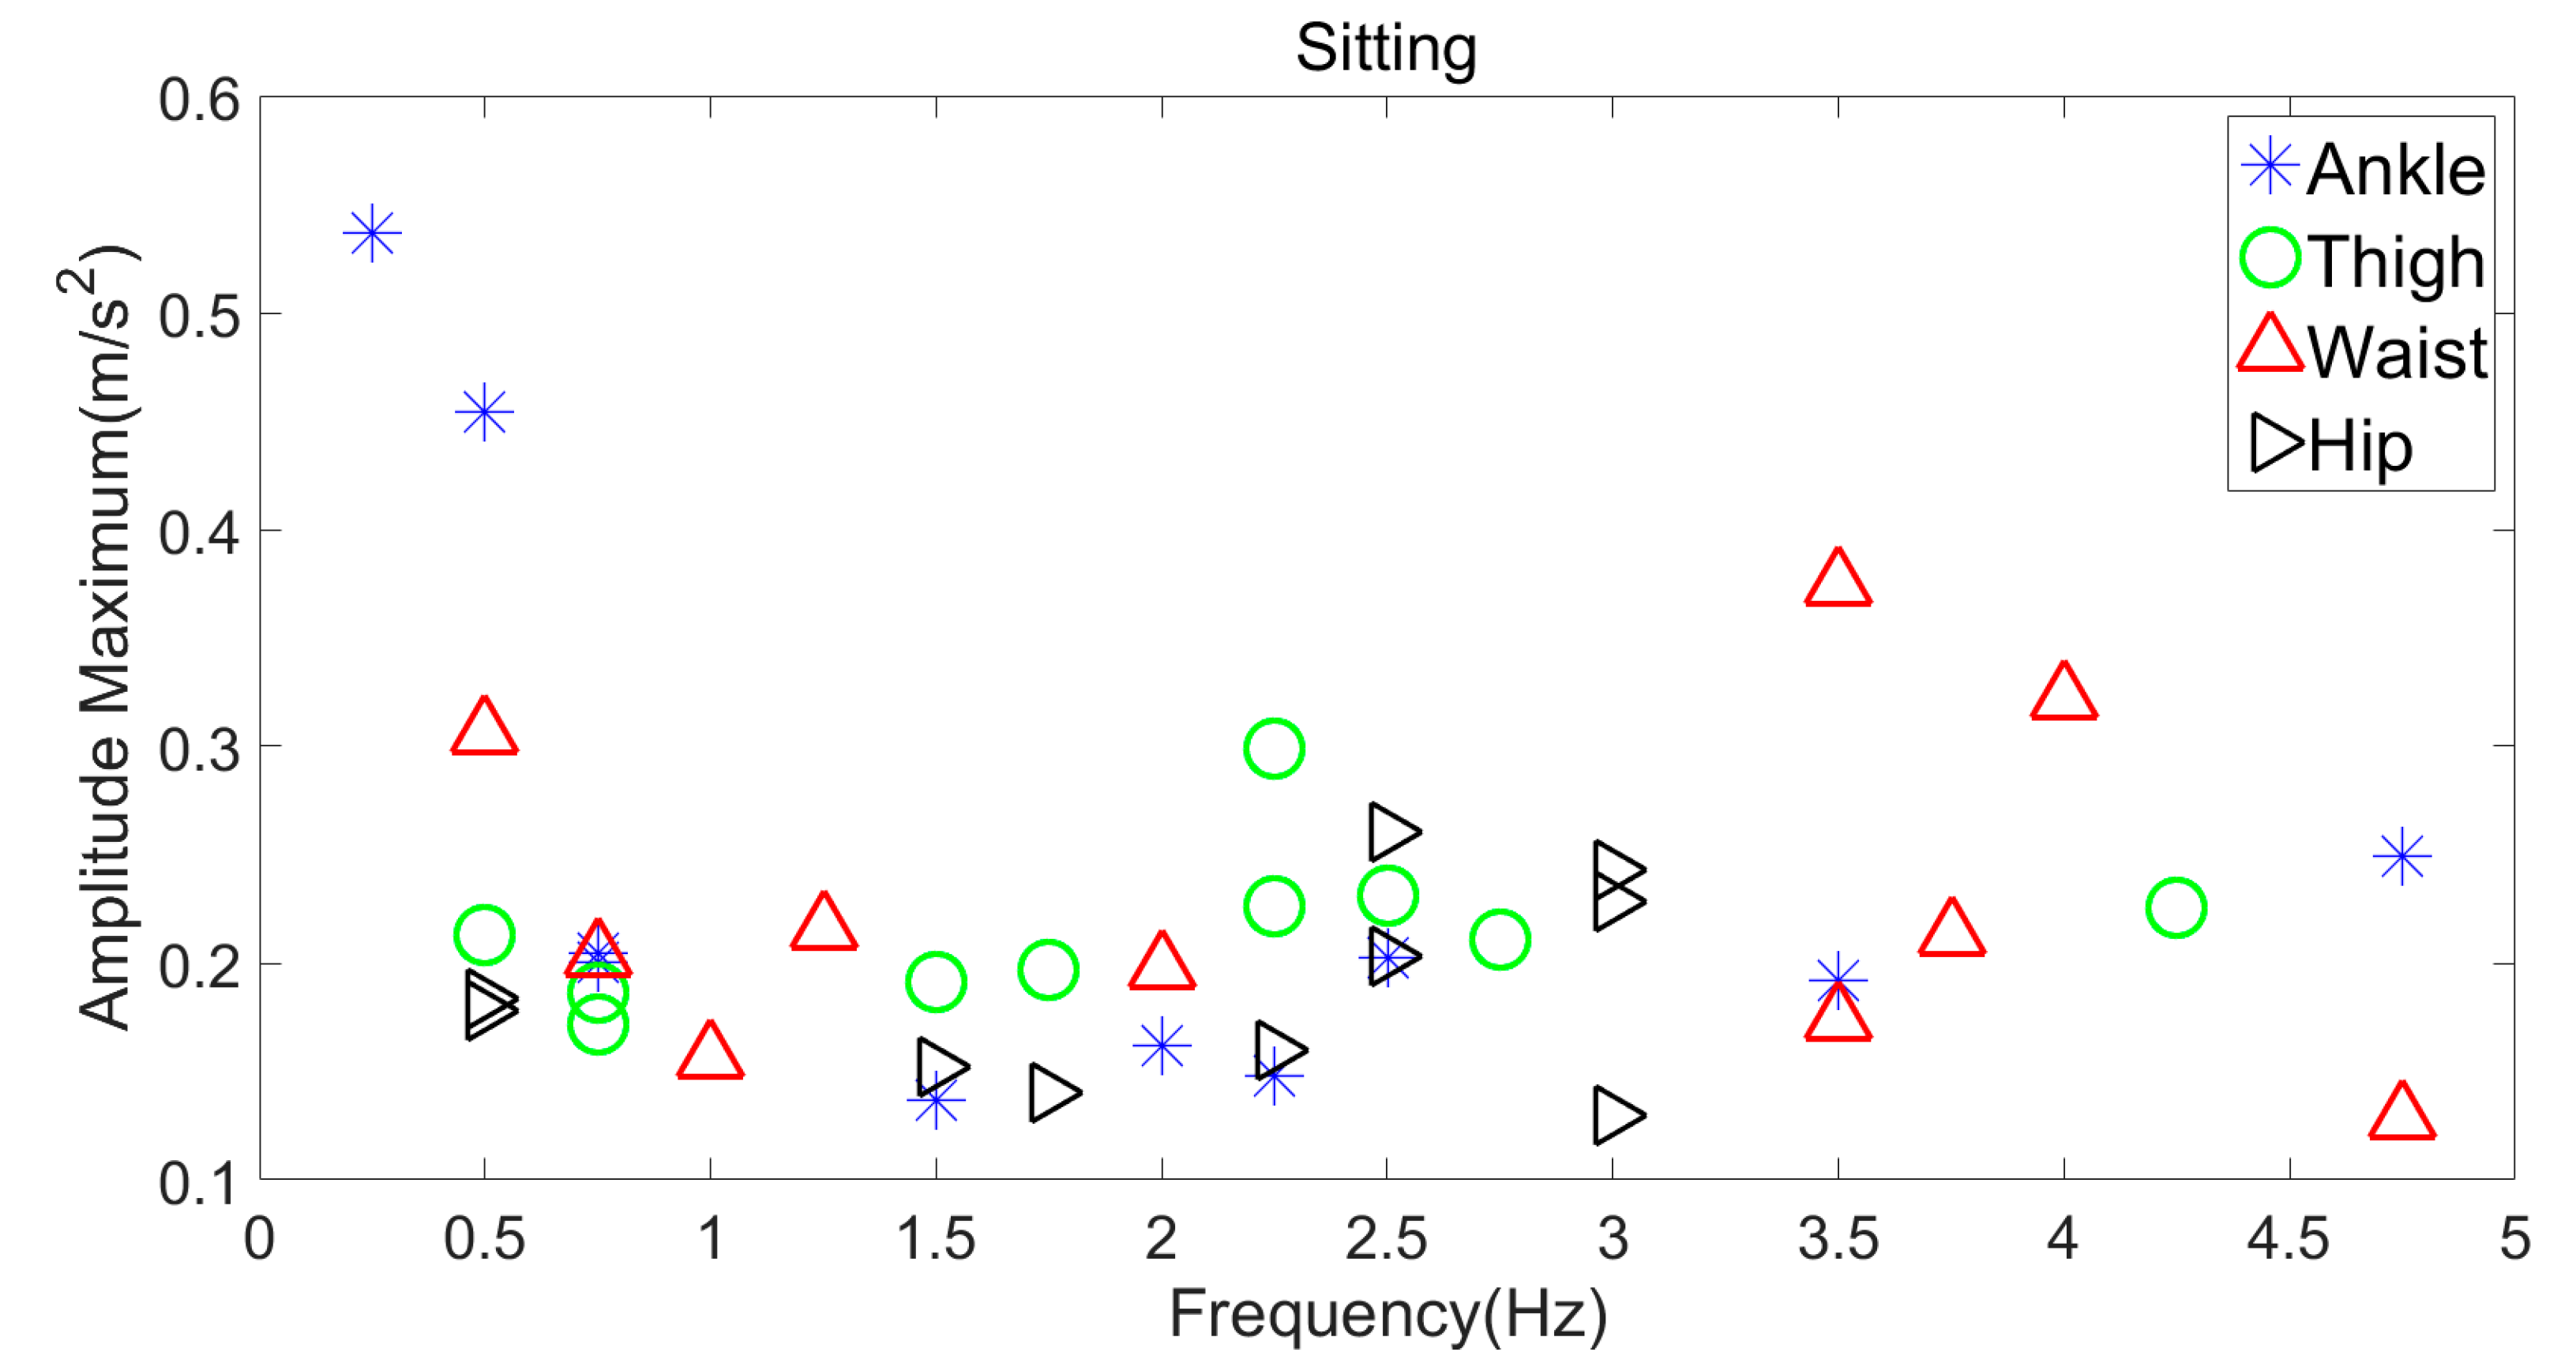
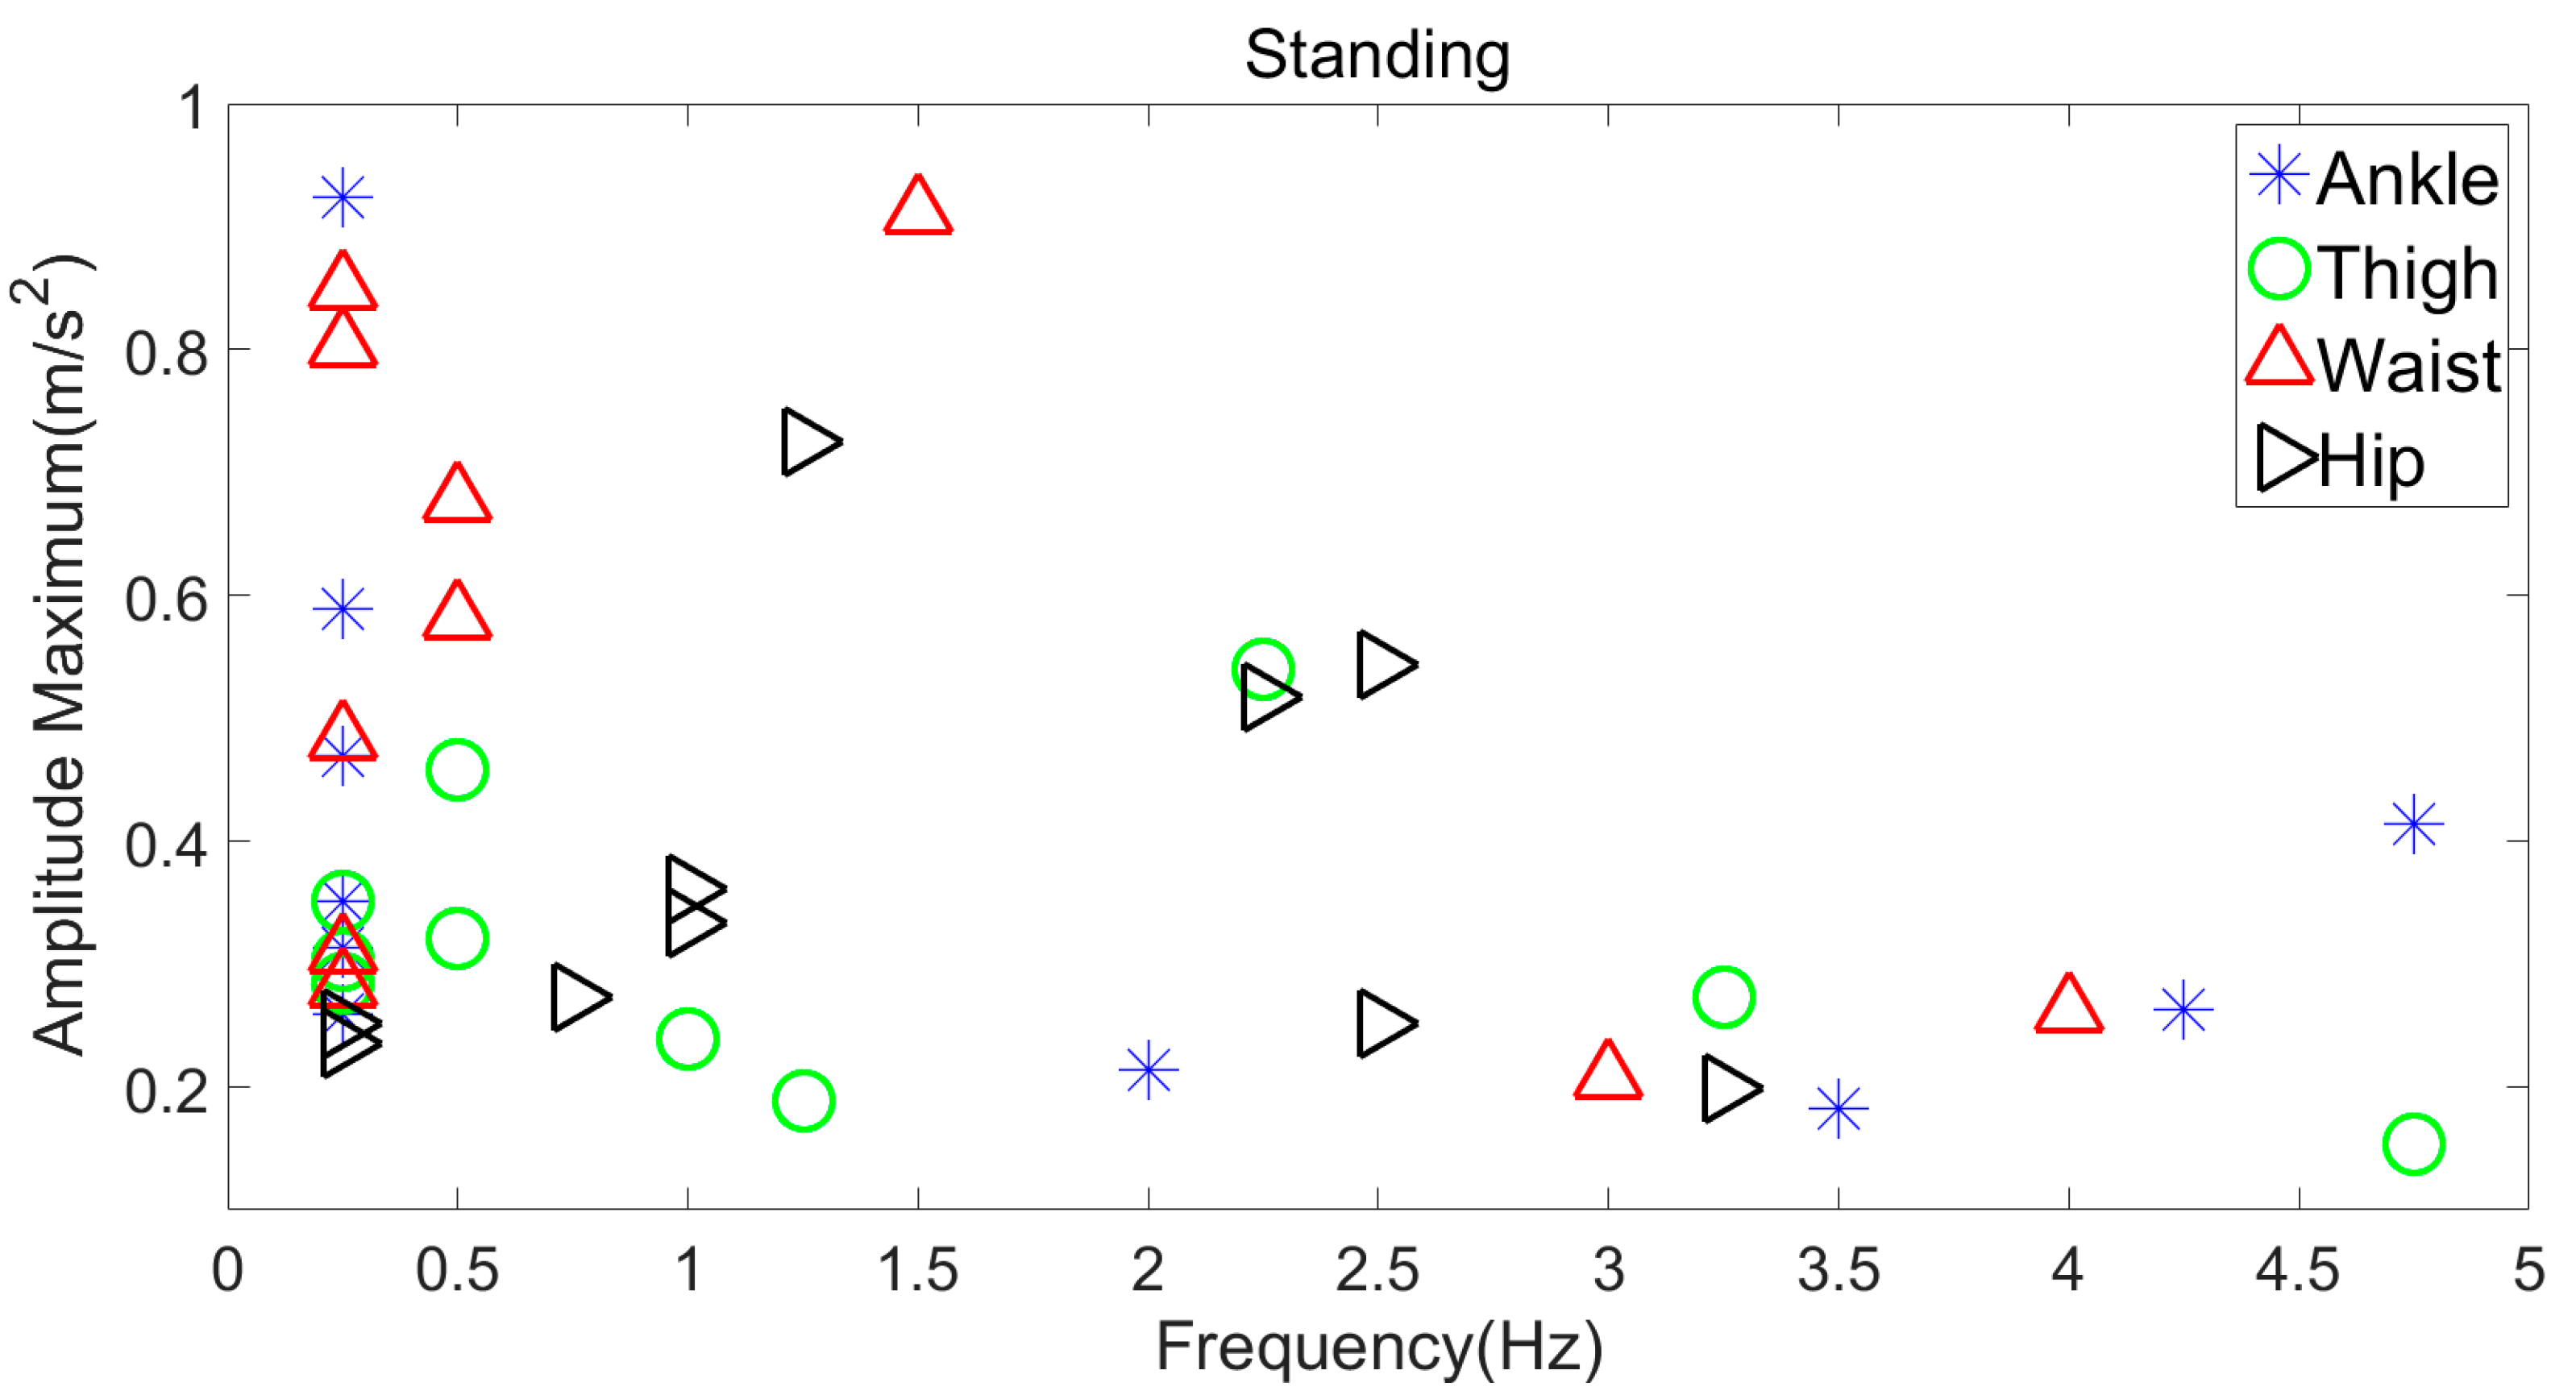
Data for two static activities, sitting and standing, are shown in Figure 4 and Figure 5. Little difference is seen in the amplitude across the dominant frequencies observed for these activities. However, across sensor locations, there were notable differences in the dominant frequencies. Because the frequency was quite different and the amplitude was minimal, these parameters cannot be considered together for categorisation of sitting and standing.
It seems appropriate that a low amplitude (value < 1.0 m/s2) can be utilized to categorise the static state of the person.
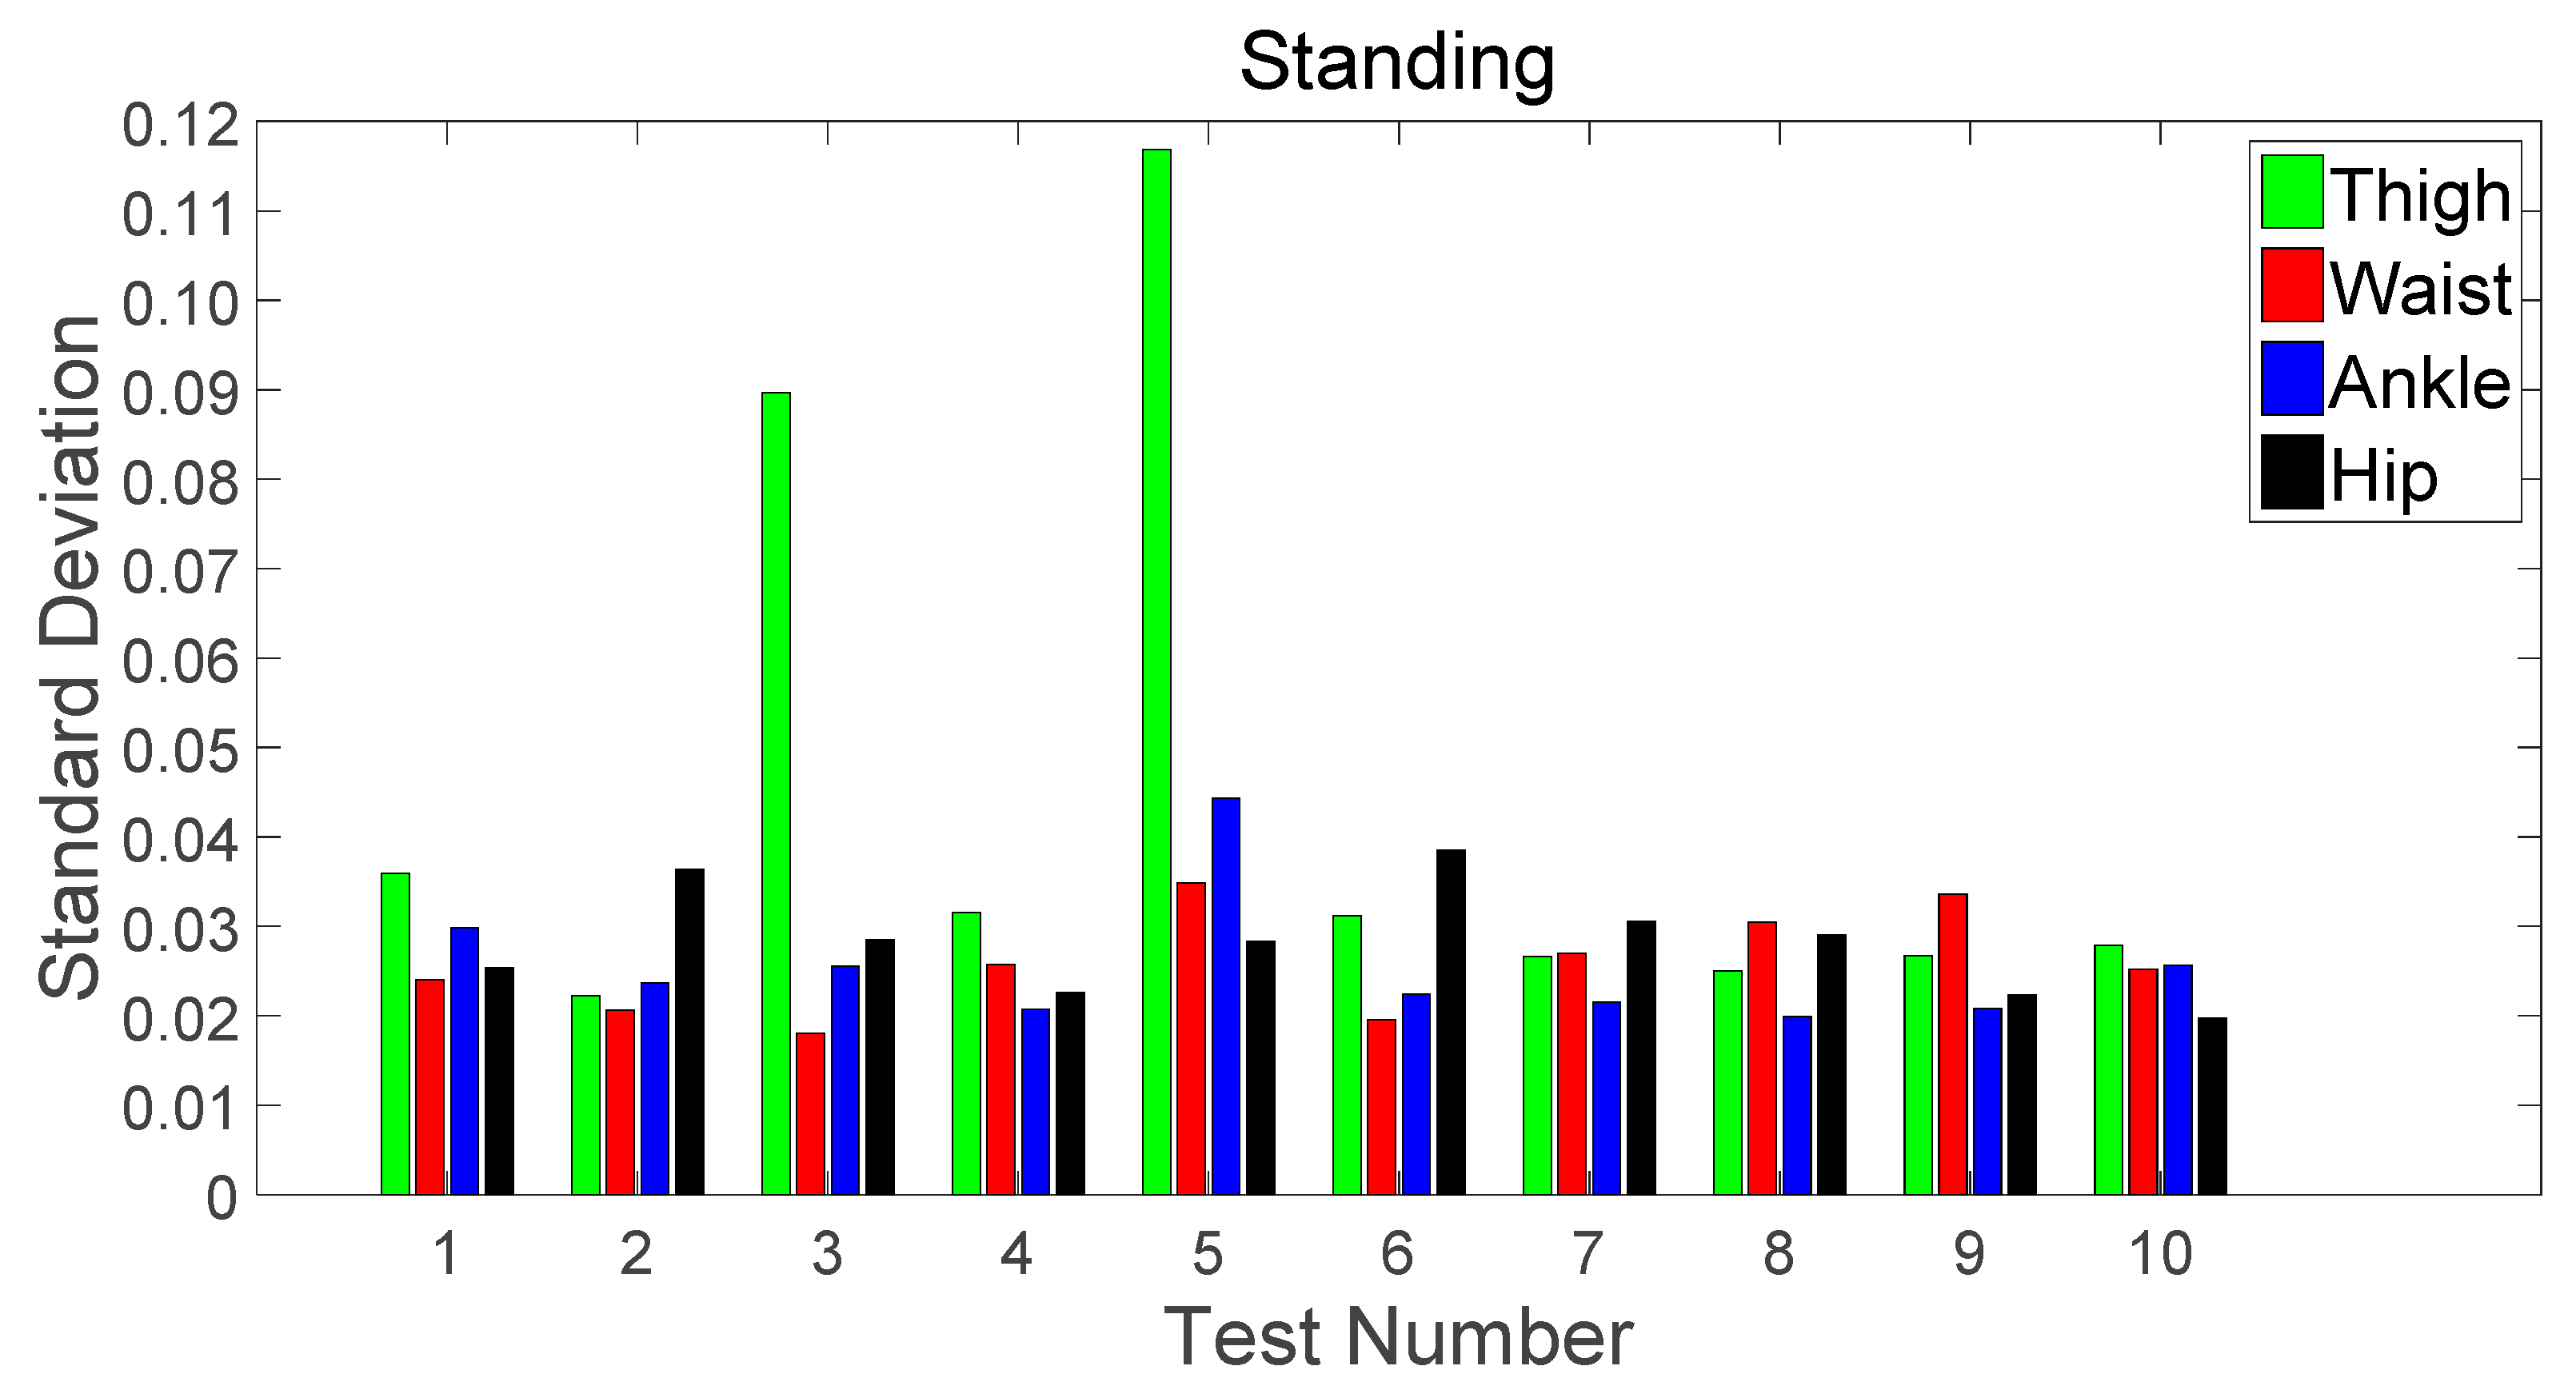
Figure 6 and Figure 7 provide evidence that the standard deviation parameter is suitable for sitting and standing activity categorisation. In Figure 7, standard deviation values in Test 3 and Test 5 using the thigh sensor are high. This might be due to the medium or large shifts in forward and backward thigh movement generated by the individual while maintaining the position, as observed during data collection. As a result, the ankle location was considered more suitable for categorization where standard deviation values for sitting and standing were 0.015–0.0187 and 0.020–0.0440, respectively.
3.2. Ambulatory Activities
3.2.1. Fast Walking in a Free-Living Environment versus a Corridor Environment
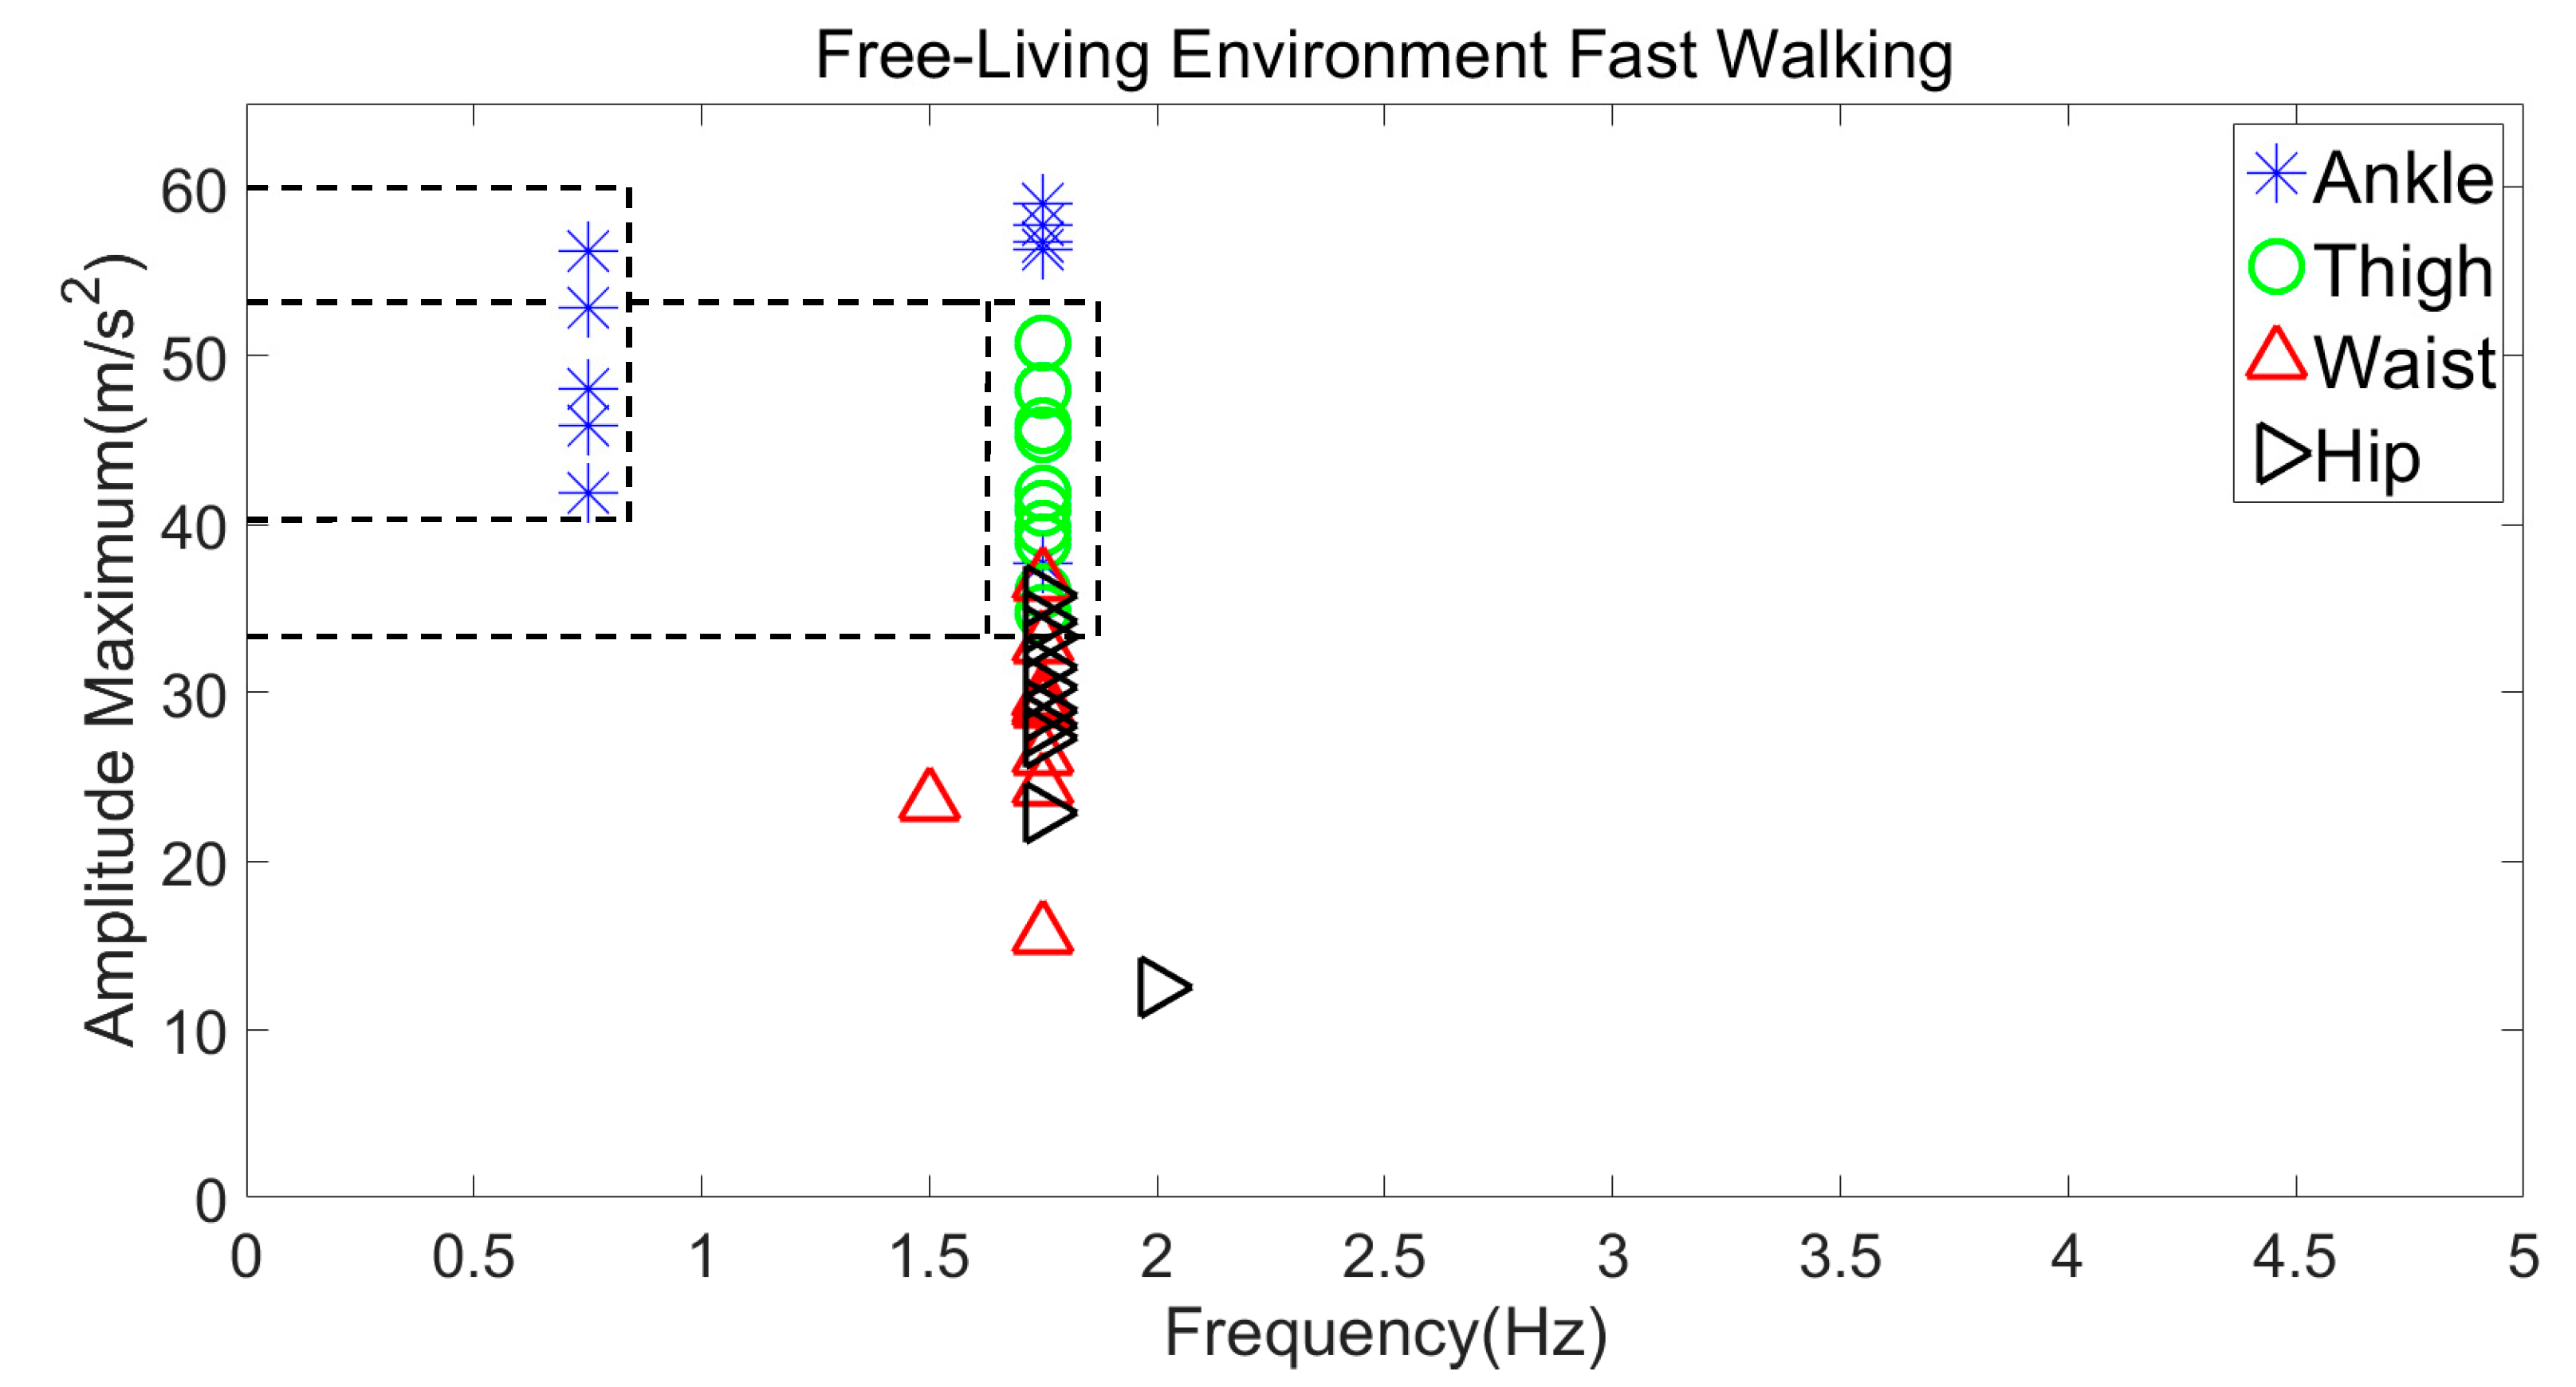
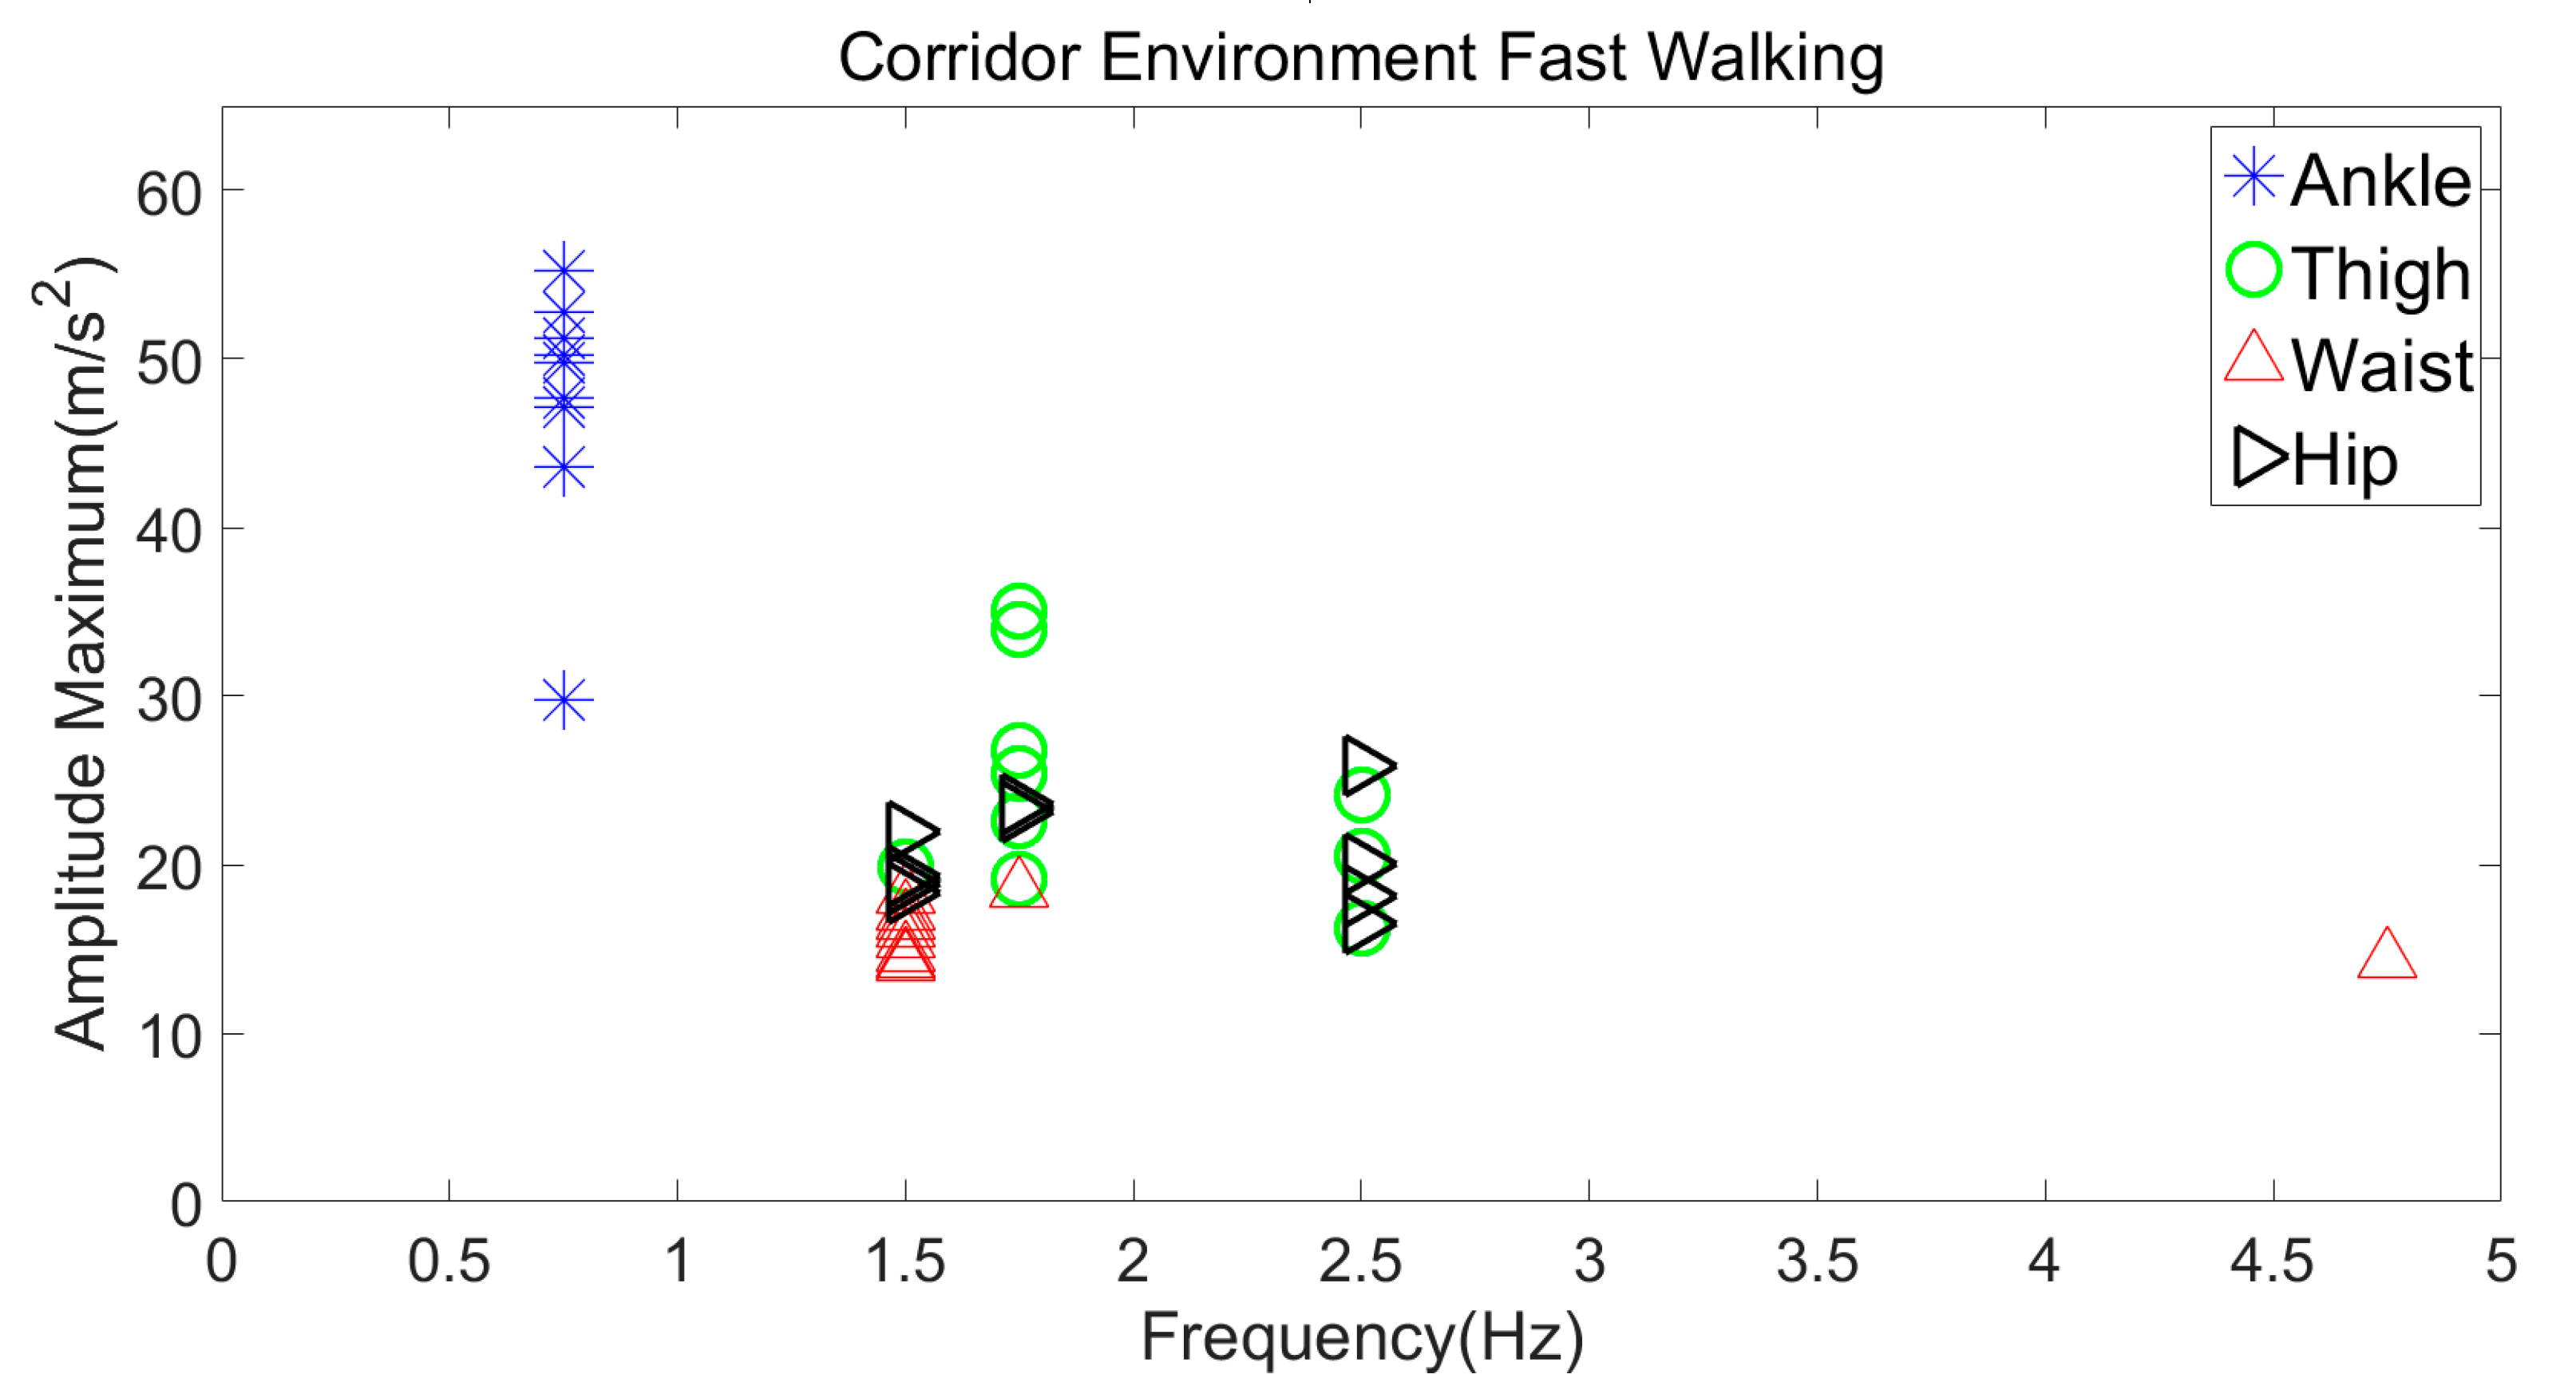
Figure 8 and Figure 9 represent a comparison of fast walking in a free-living environment like a large park and a corridor environment with obstacles such as the presence of people and objects. For the free-living environment, the FFT data points for the three locations of thigh, waist, and hip reflected a frequency range of 1.5–2 Hz, but with a varying amplitude. In contrast, at the ankle location, frequency was notably lower, although at a similar amplitude to the thigh. The ankle location reflected small variations across the free-living and corridor environments.
Considering the corridor environment, data points for the ankle location lied within a frequency range of 0–1 Hz with a slight variation in amplitude. For thigh, waist, and hip location, the frequency was notably higher, between 1.5 and 2.5 Hz.
There are two key reasons for the change in frequency and amplitude observed between footfalls. First, there will be times when footfall impact is high during initial ground contact that may increase the amplitude of the acceleration. Second, at times the foot is still on the ground (magnitude ≈ 1 g having no impact), it is likely producing low frequency data.
Considering the above comparative analysis, it was concluded that for fast walking in free-living and corridor environments, the thigh and ankle could be considered as the best locations. This is because the data points lied within a certain frequency range and had overlapping amplitude values. The ankle location could be of merit to extract foot impact data.
3.2.2. Slow Walking in a Free-Living Environment vs. Corridor Environment
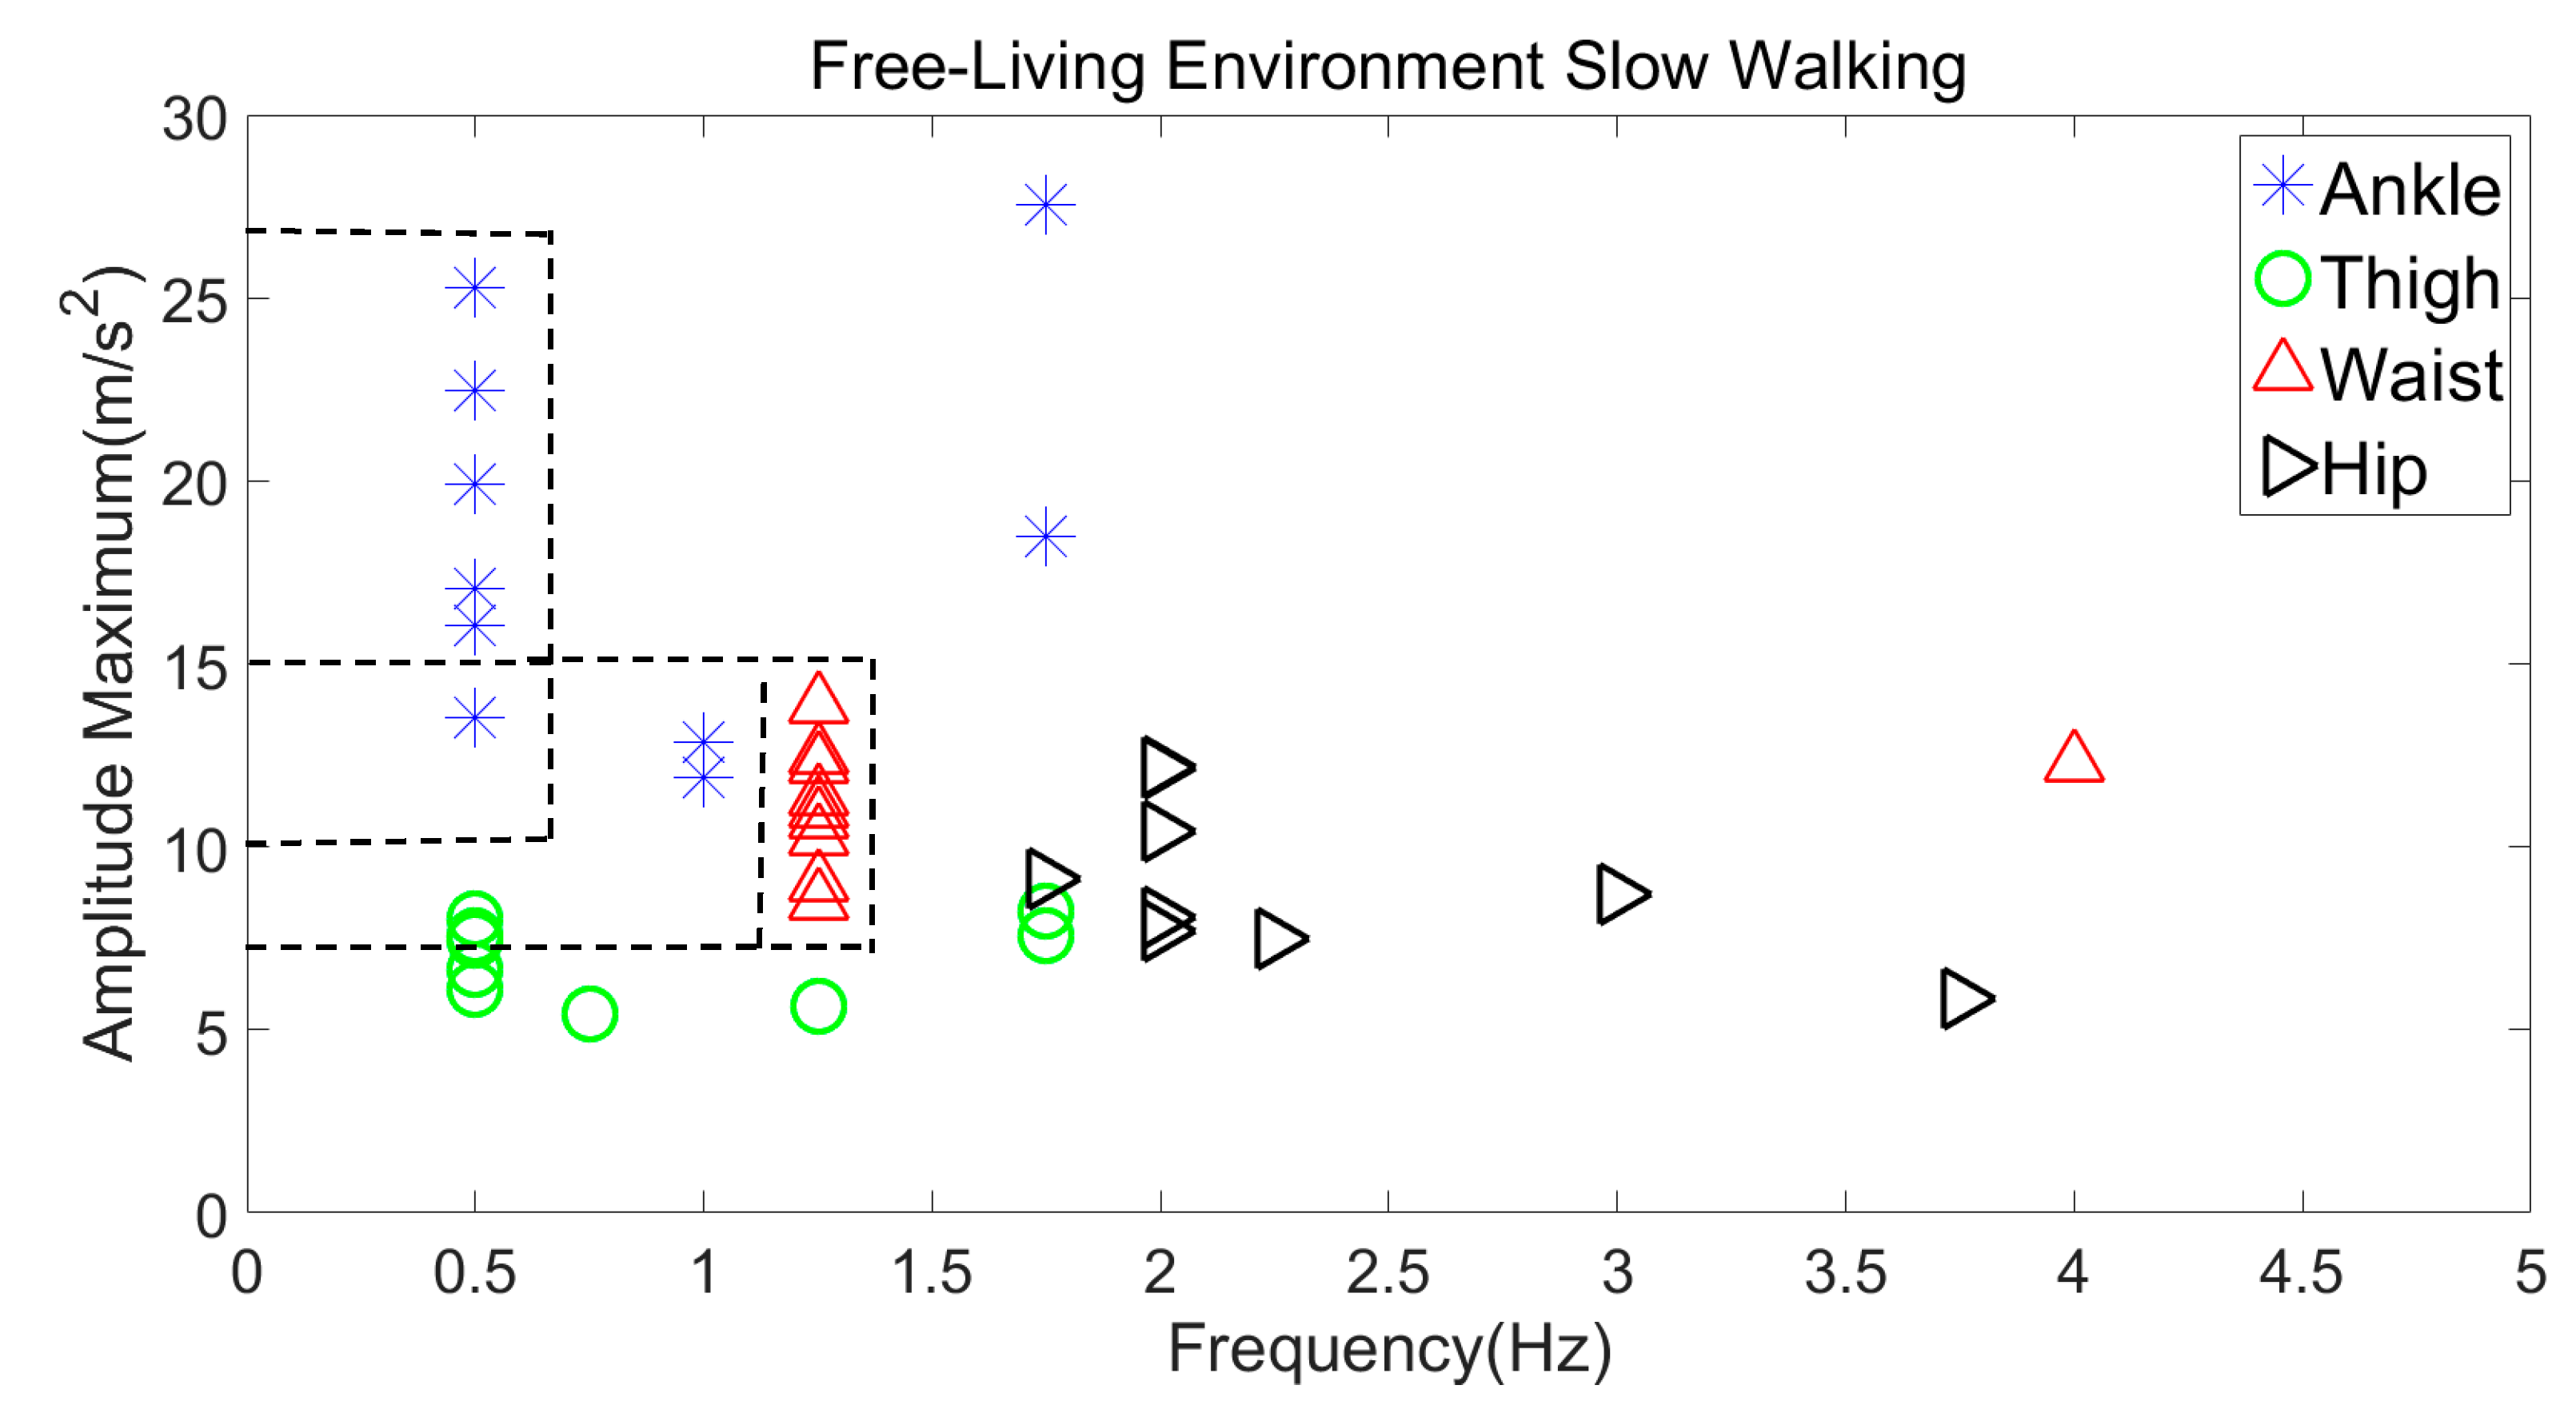
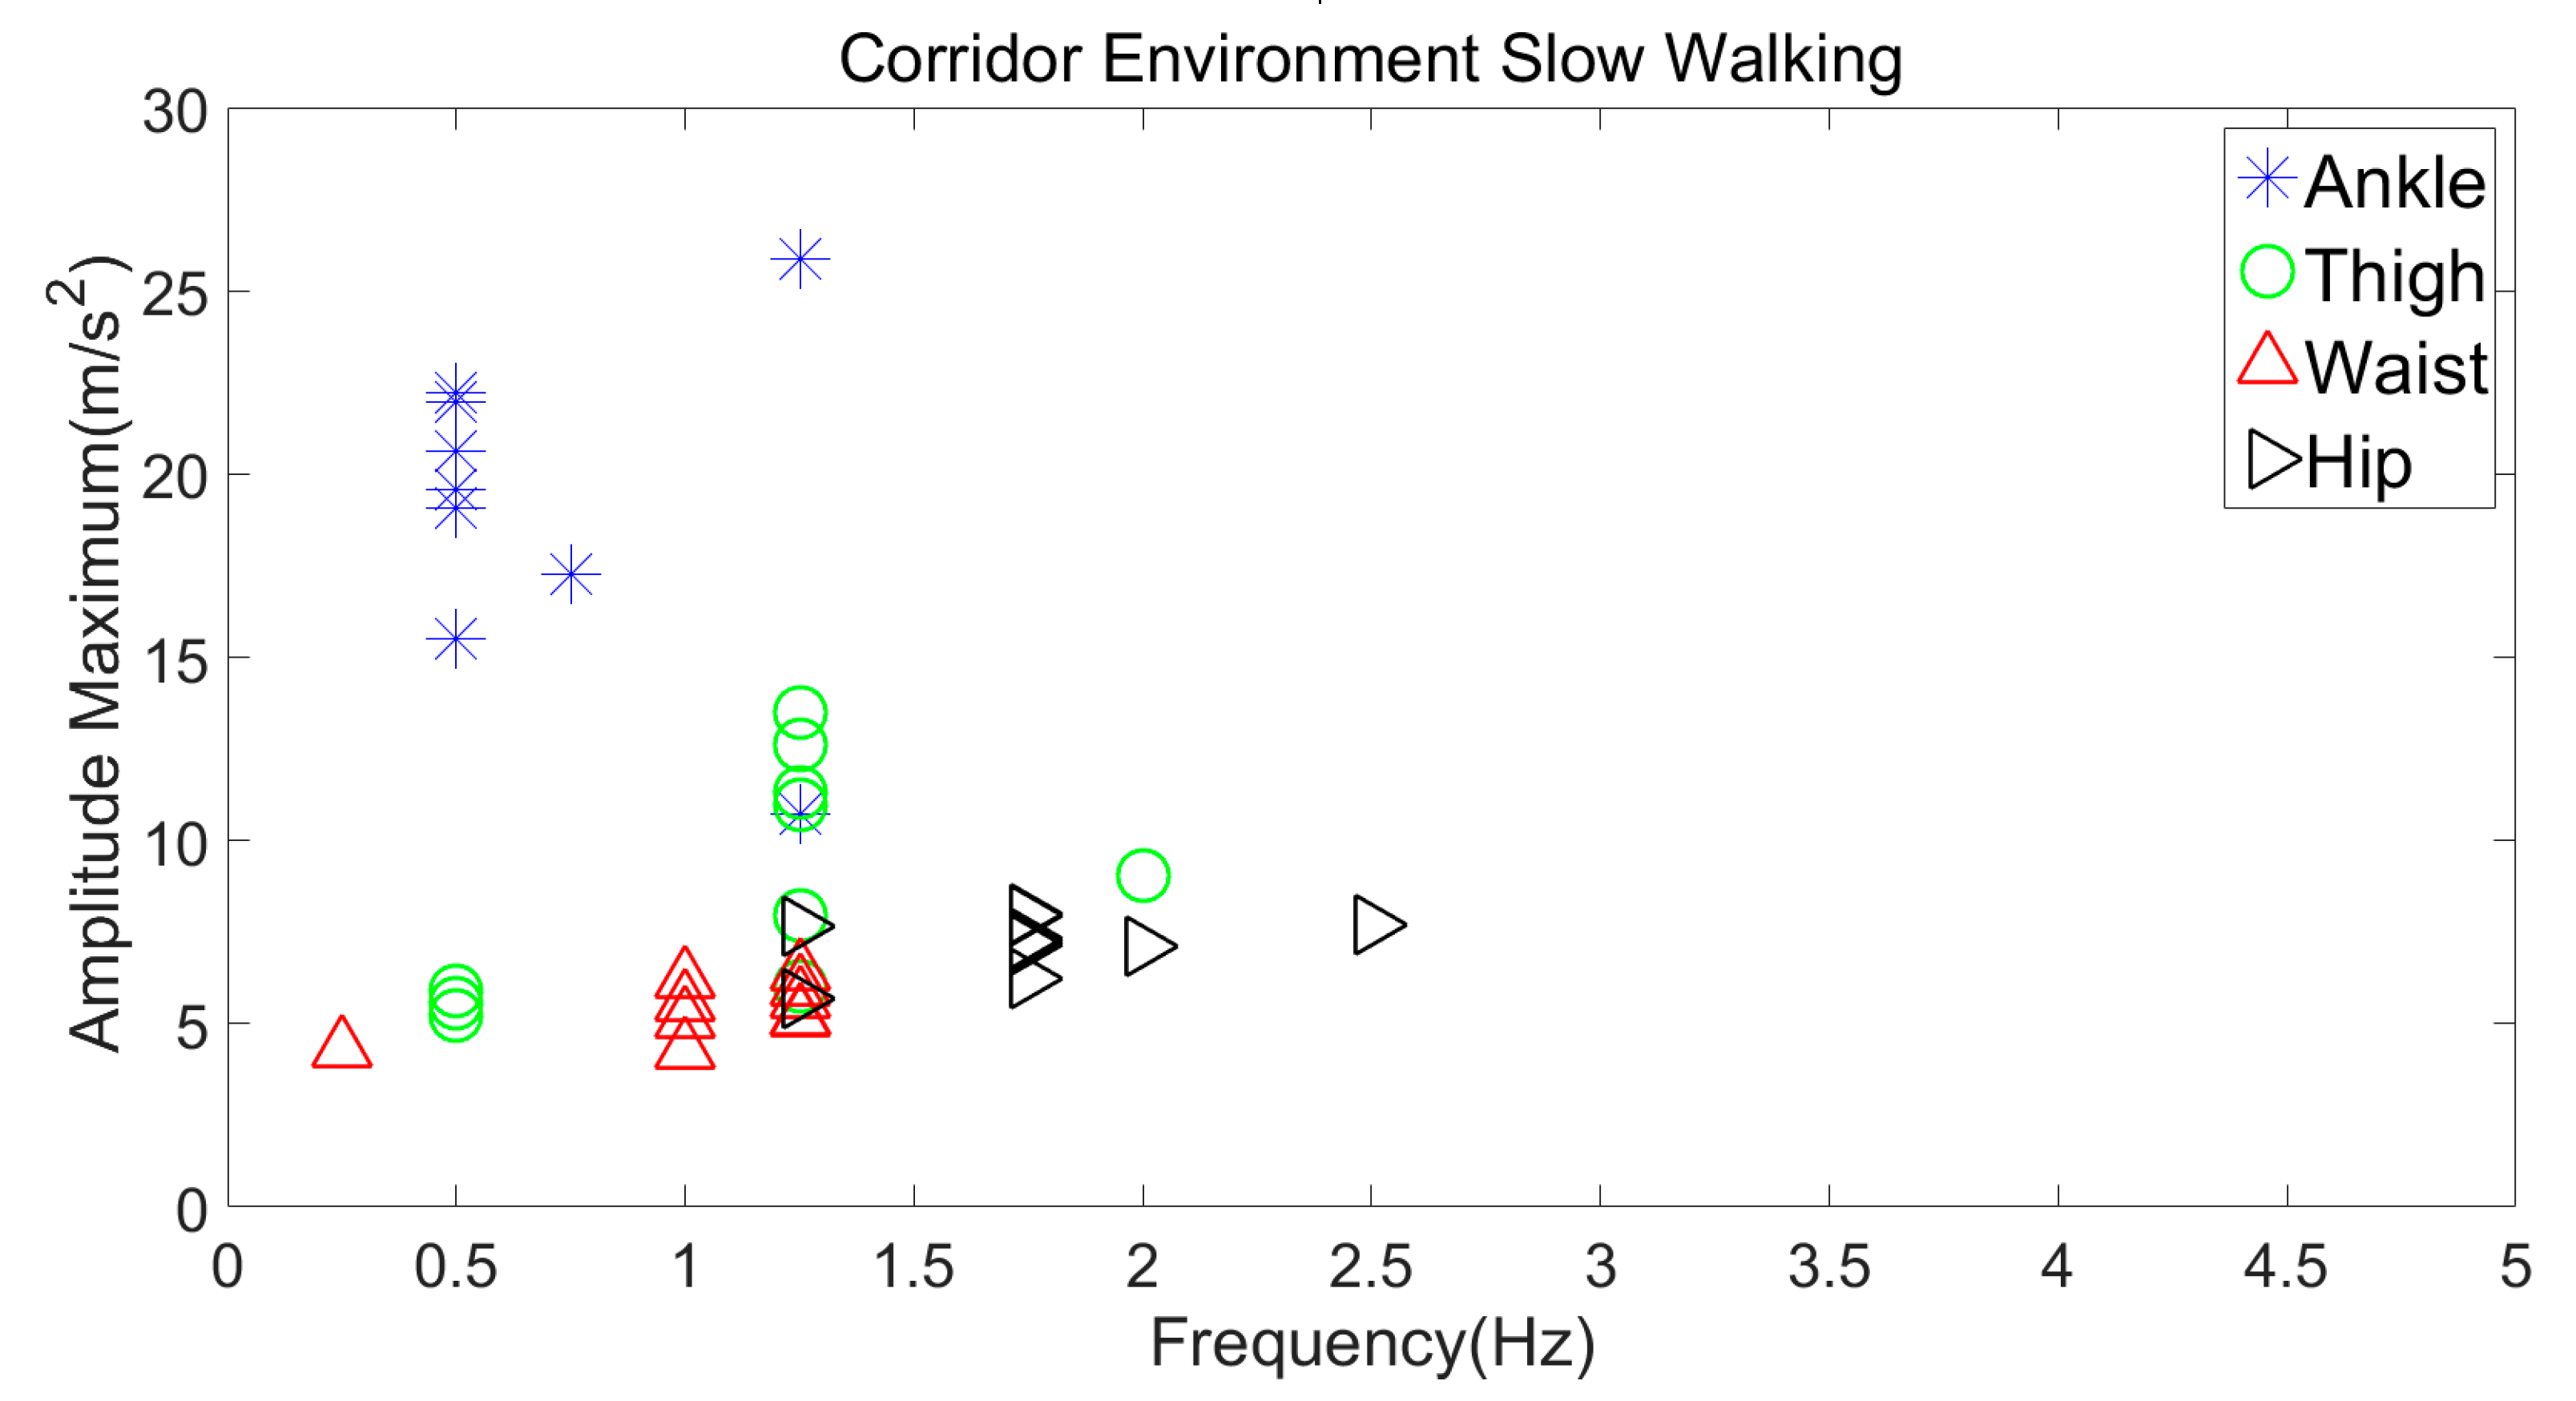
Figure 10 and Figure 11 represent the comparison of slow walking in free-living and corridor environments. In the free-living environment, data points of the ankle and thigh locations were within the same frequency range (0–1.8 Hz) with different amplitude values, whereas for the waist, the accuracy was much higher, as 90% of the data points lied within a frequency range of 1–1.5 Hz. However, for the hip, data points were randomly distributed across a wide frequency range. For the corridor environment, data points for the thigh, waist, and hip locations were also widely distributed; however, the ankle location lied within a frequency range of 0.5–1.25 Hz. Two different locations (waist and ankle) were suitable for slow-walking activity categorisation in both environments.
Recognizing both fast and slow walking is a concern, as they differ in amplitude and frequency across the walking environments unless different locations are utilized. This is problematic. First, placing the sensors at two different locations to recognize these walking activities in two different environments would be cumbersome for the user wearing the sensors. Secondly, recognizing activity based on the frequency threshold only would not be suitable, as it overlaps with both slow and fast walking.
It is apparent that amplitude is one of the distinguishing parameters that can help in categorizing both slow and fast walking when the sensor is located at the ankle. From Figure 8, Figure 9, Figure 10 and Figure 11, it is evident that for both environments, the amplitude for slow walking ranged from 10–28 m/s2, whereas for fast walking, it was notably higher, i.e., 40–60 m/s2. As a result, setting an amplitude threshold would be significant in classifying these two walking activities.
3.3. Hip Fracture Activities
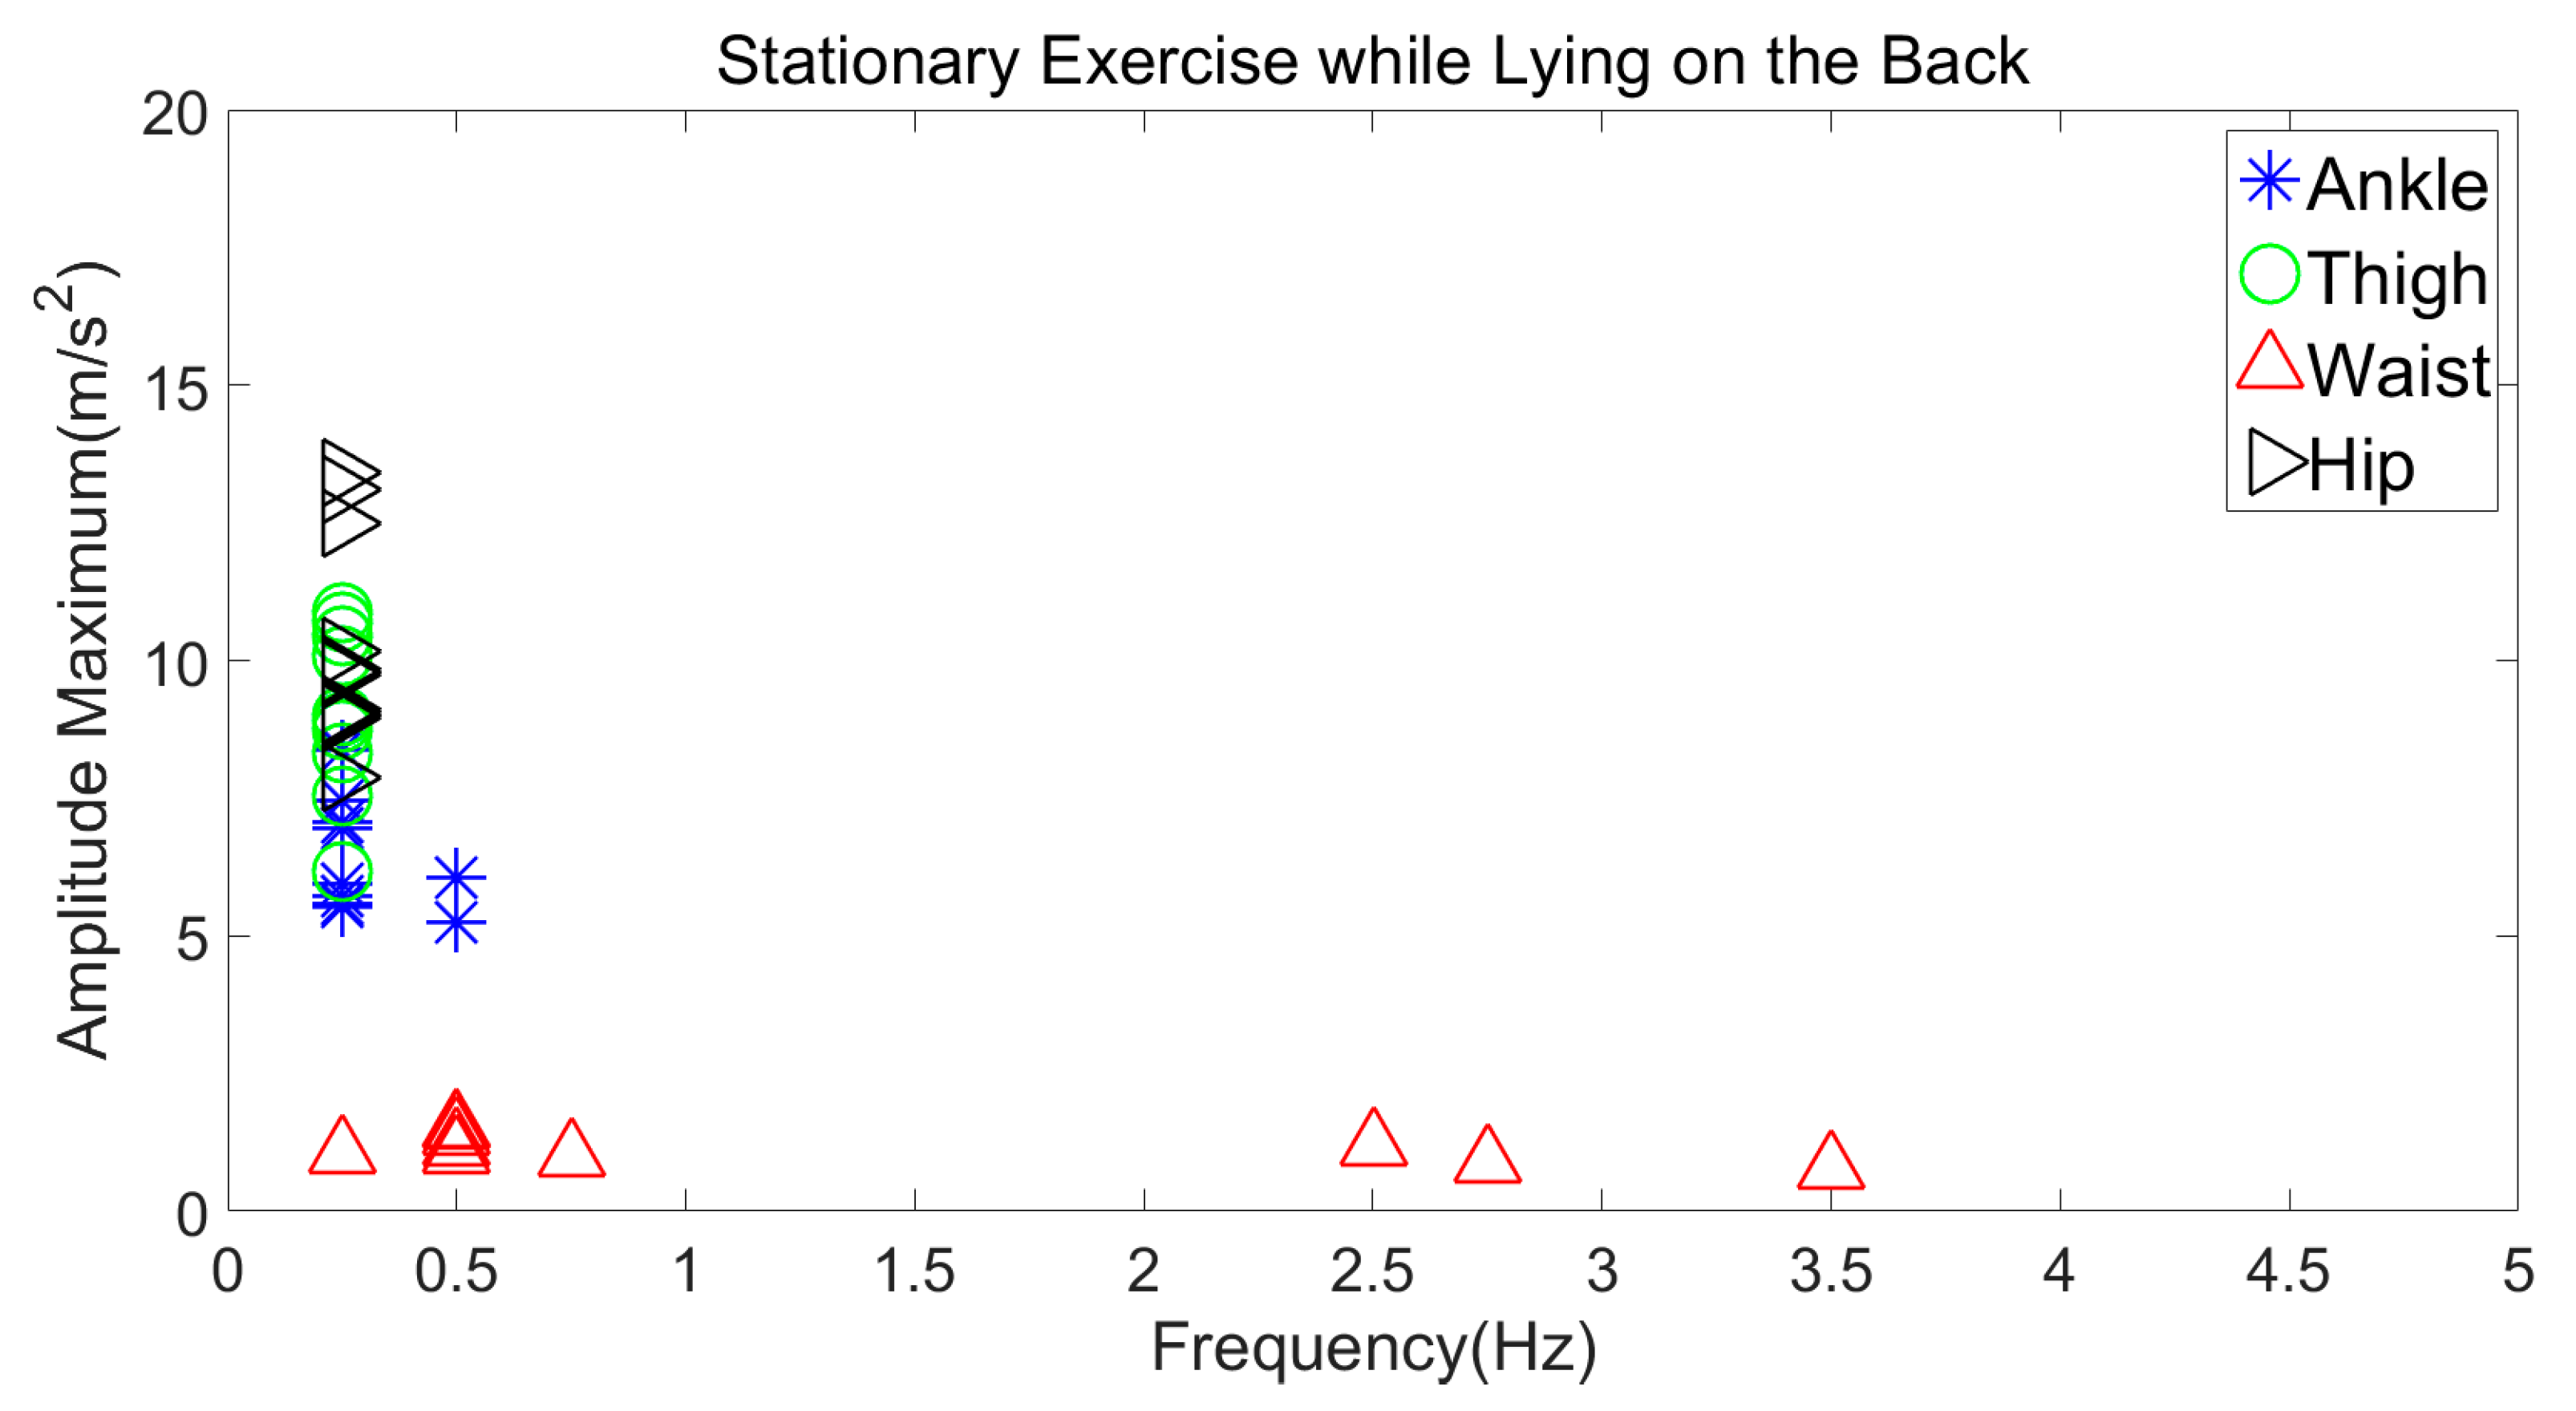
3.3.1. Stationary Exercise while Lying on the Back
From Figure 12, data points for hip, thigh, and ankle locations lied within a specific frequency range of 0–0.4 Hz, whereas for the waist location, it was more widely spread. However, both hip and thigh locations can be considered as a suitable location for classification, as they have a similar range of amplitude and frequencies. Considering these locations, the frequency and amplitude threshold values that could be used for classification would lied from 0–0.4 Hz and from 5–14 m/s2.
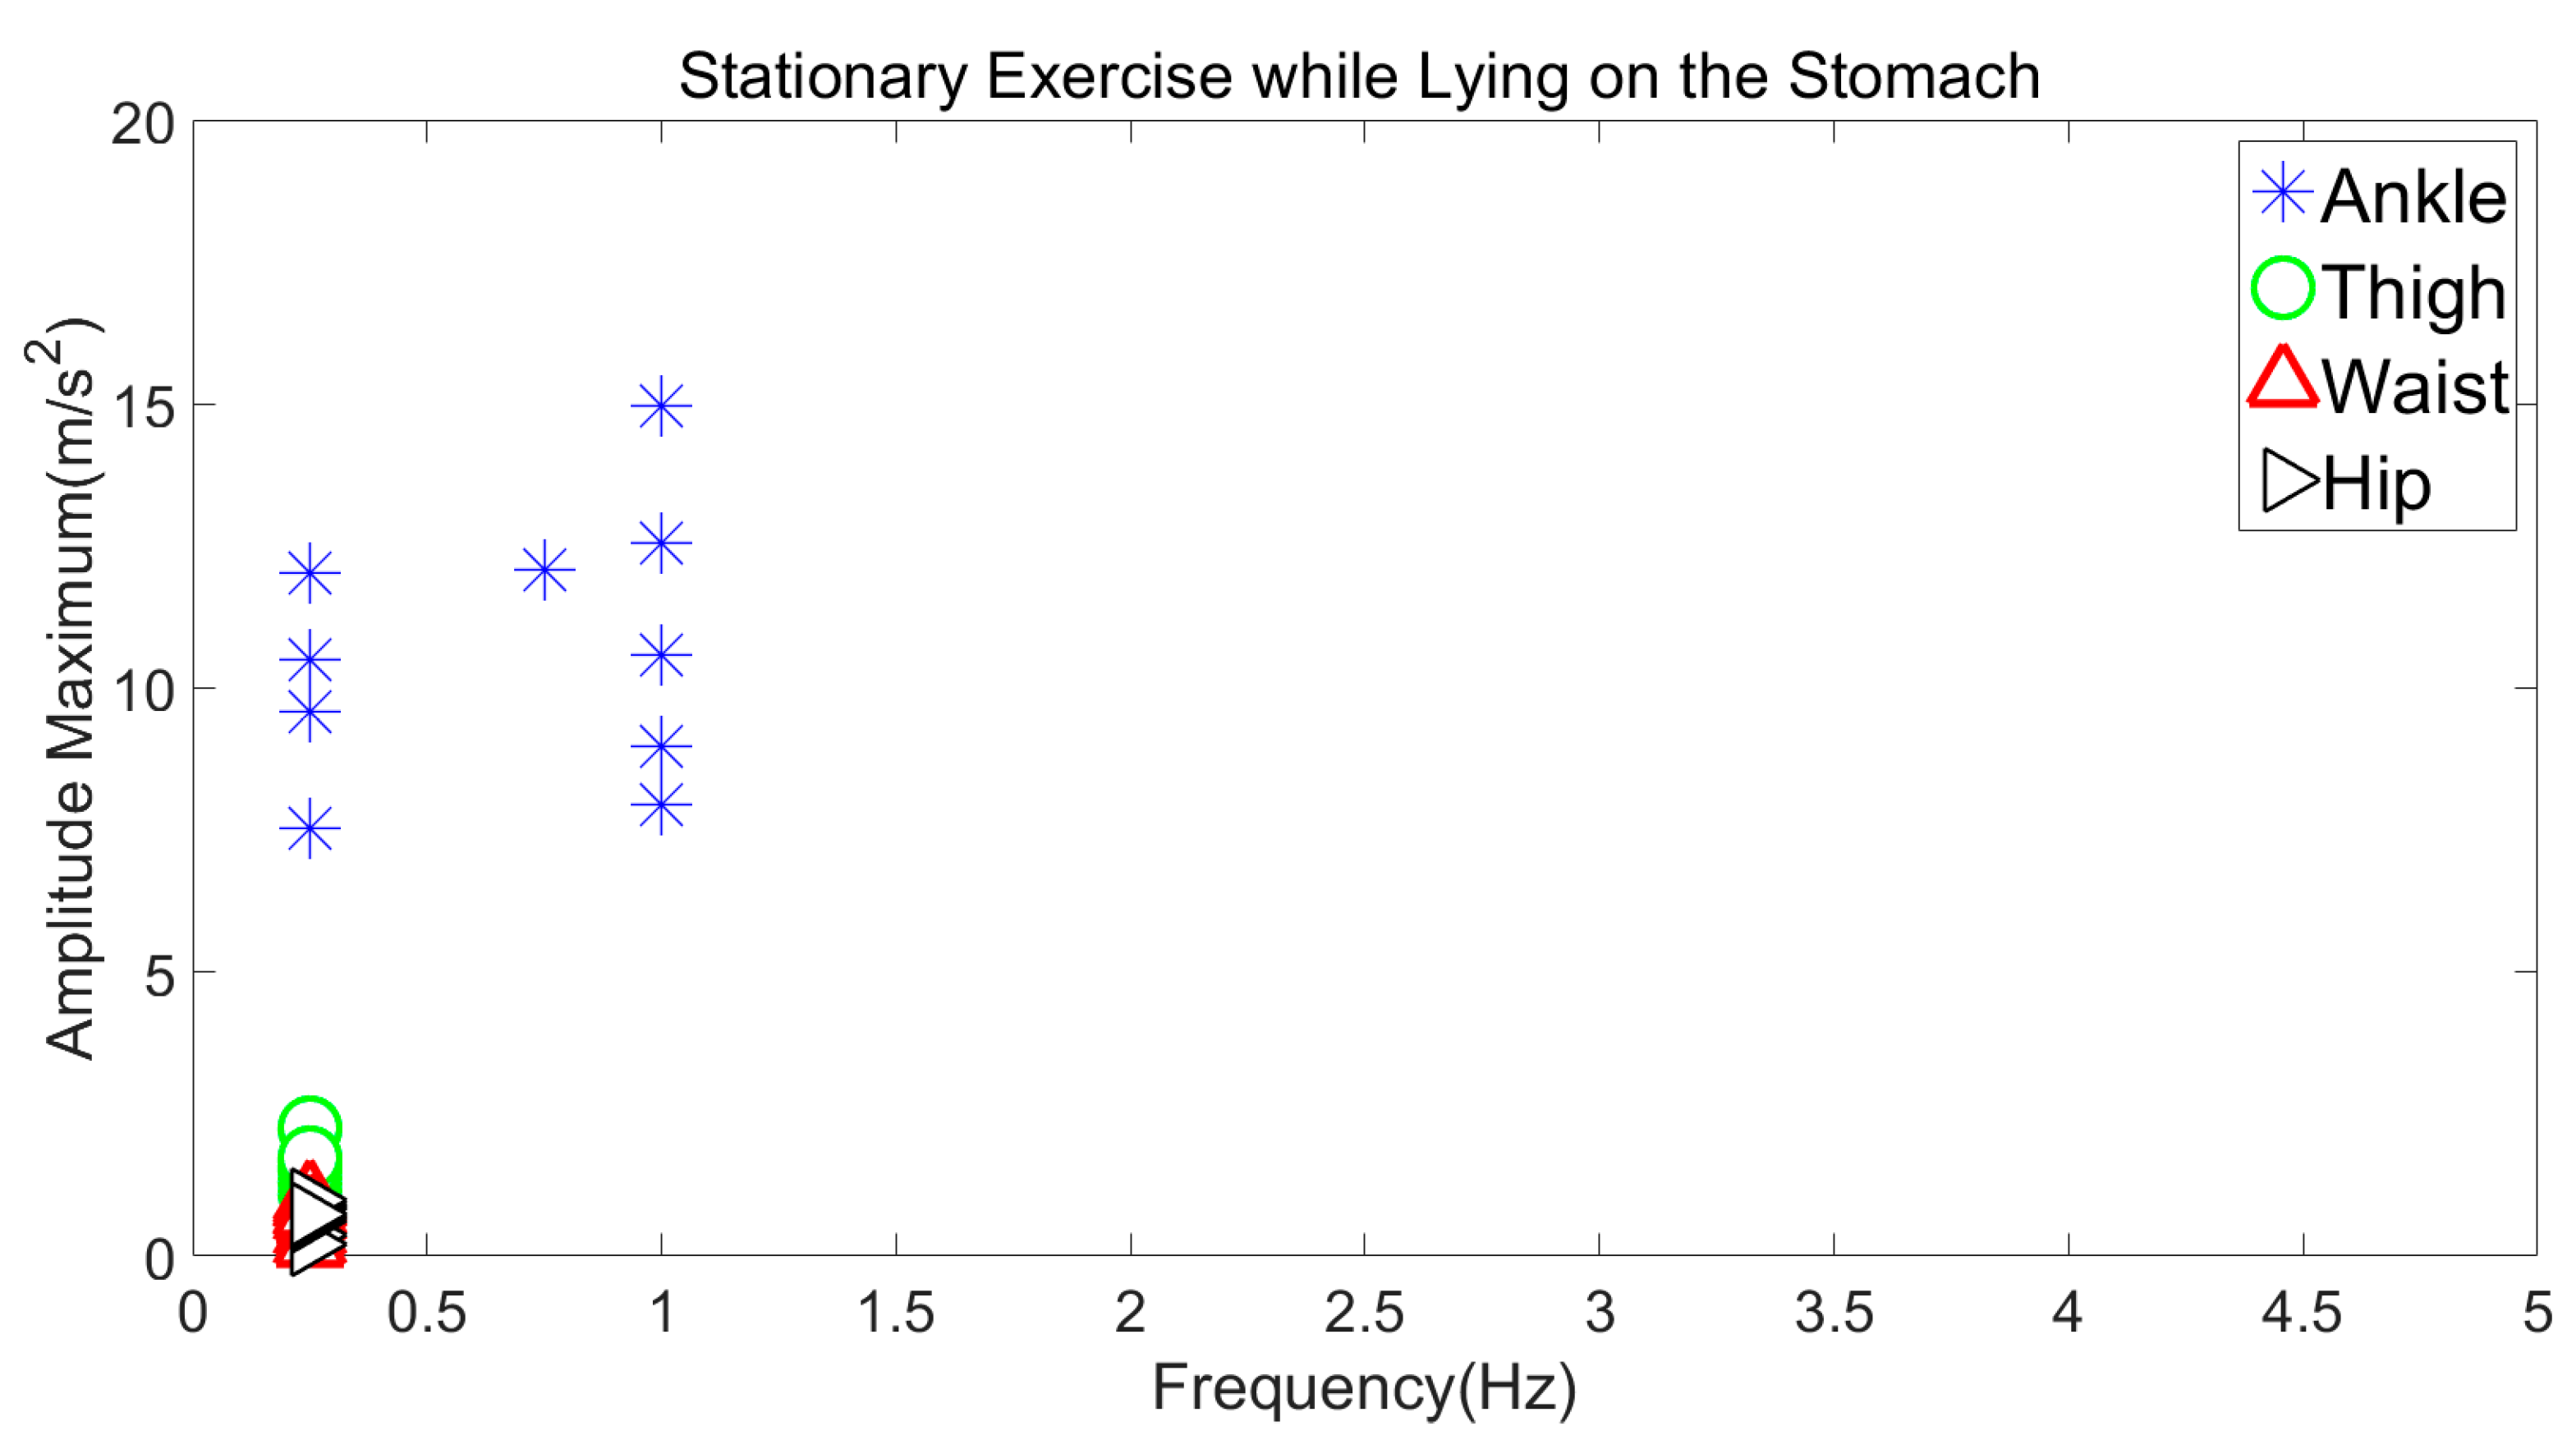
3.3.2. Stationary Exercise while Lying on the Stomach
Figure 13 shows the analysis of a stationary leg exercise (flexing and extending the knee) when lying on the stomach with a sensor on four different locations.
Hip, waist and thigh location data points lies within a frequency range of 0 to 0.3 Hz with similar low amplitudes. As for ankle location, the data points are placed in a slightly wider frequency range but are in a distinct amplitude range. Hence, any of these locations could be utilized for categorization of exercise on the stomach.
When comparing locations for exercise on the stomach and back, the thigh would be a suitable location to consider as the amplitude value range was between 1 and 3 m/s2; and did not overlap in this range.
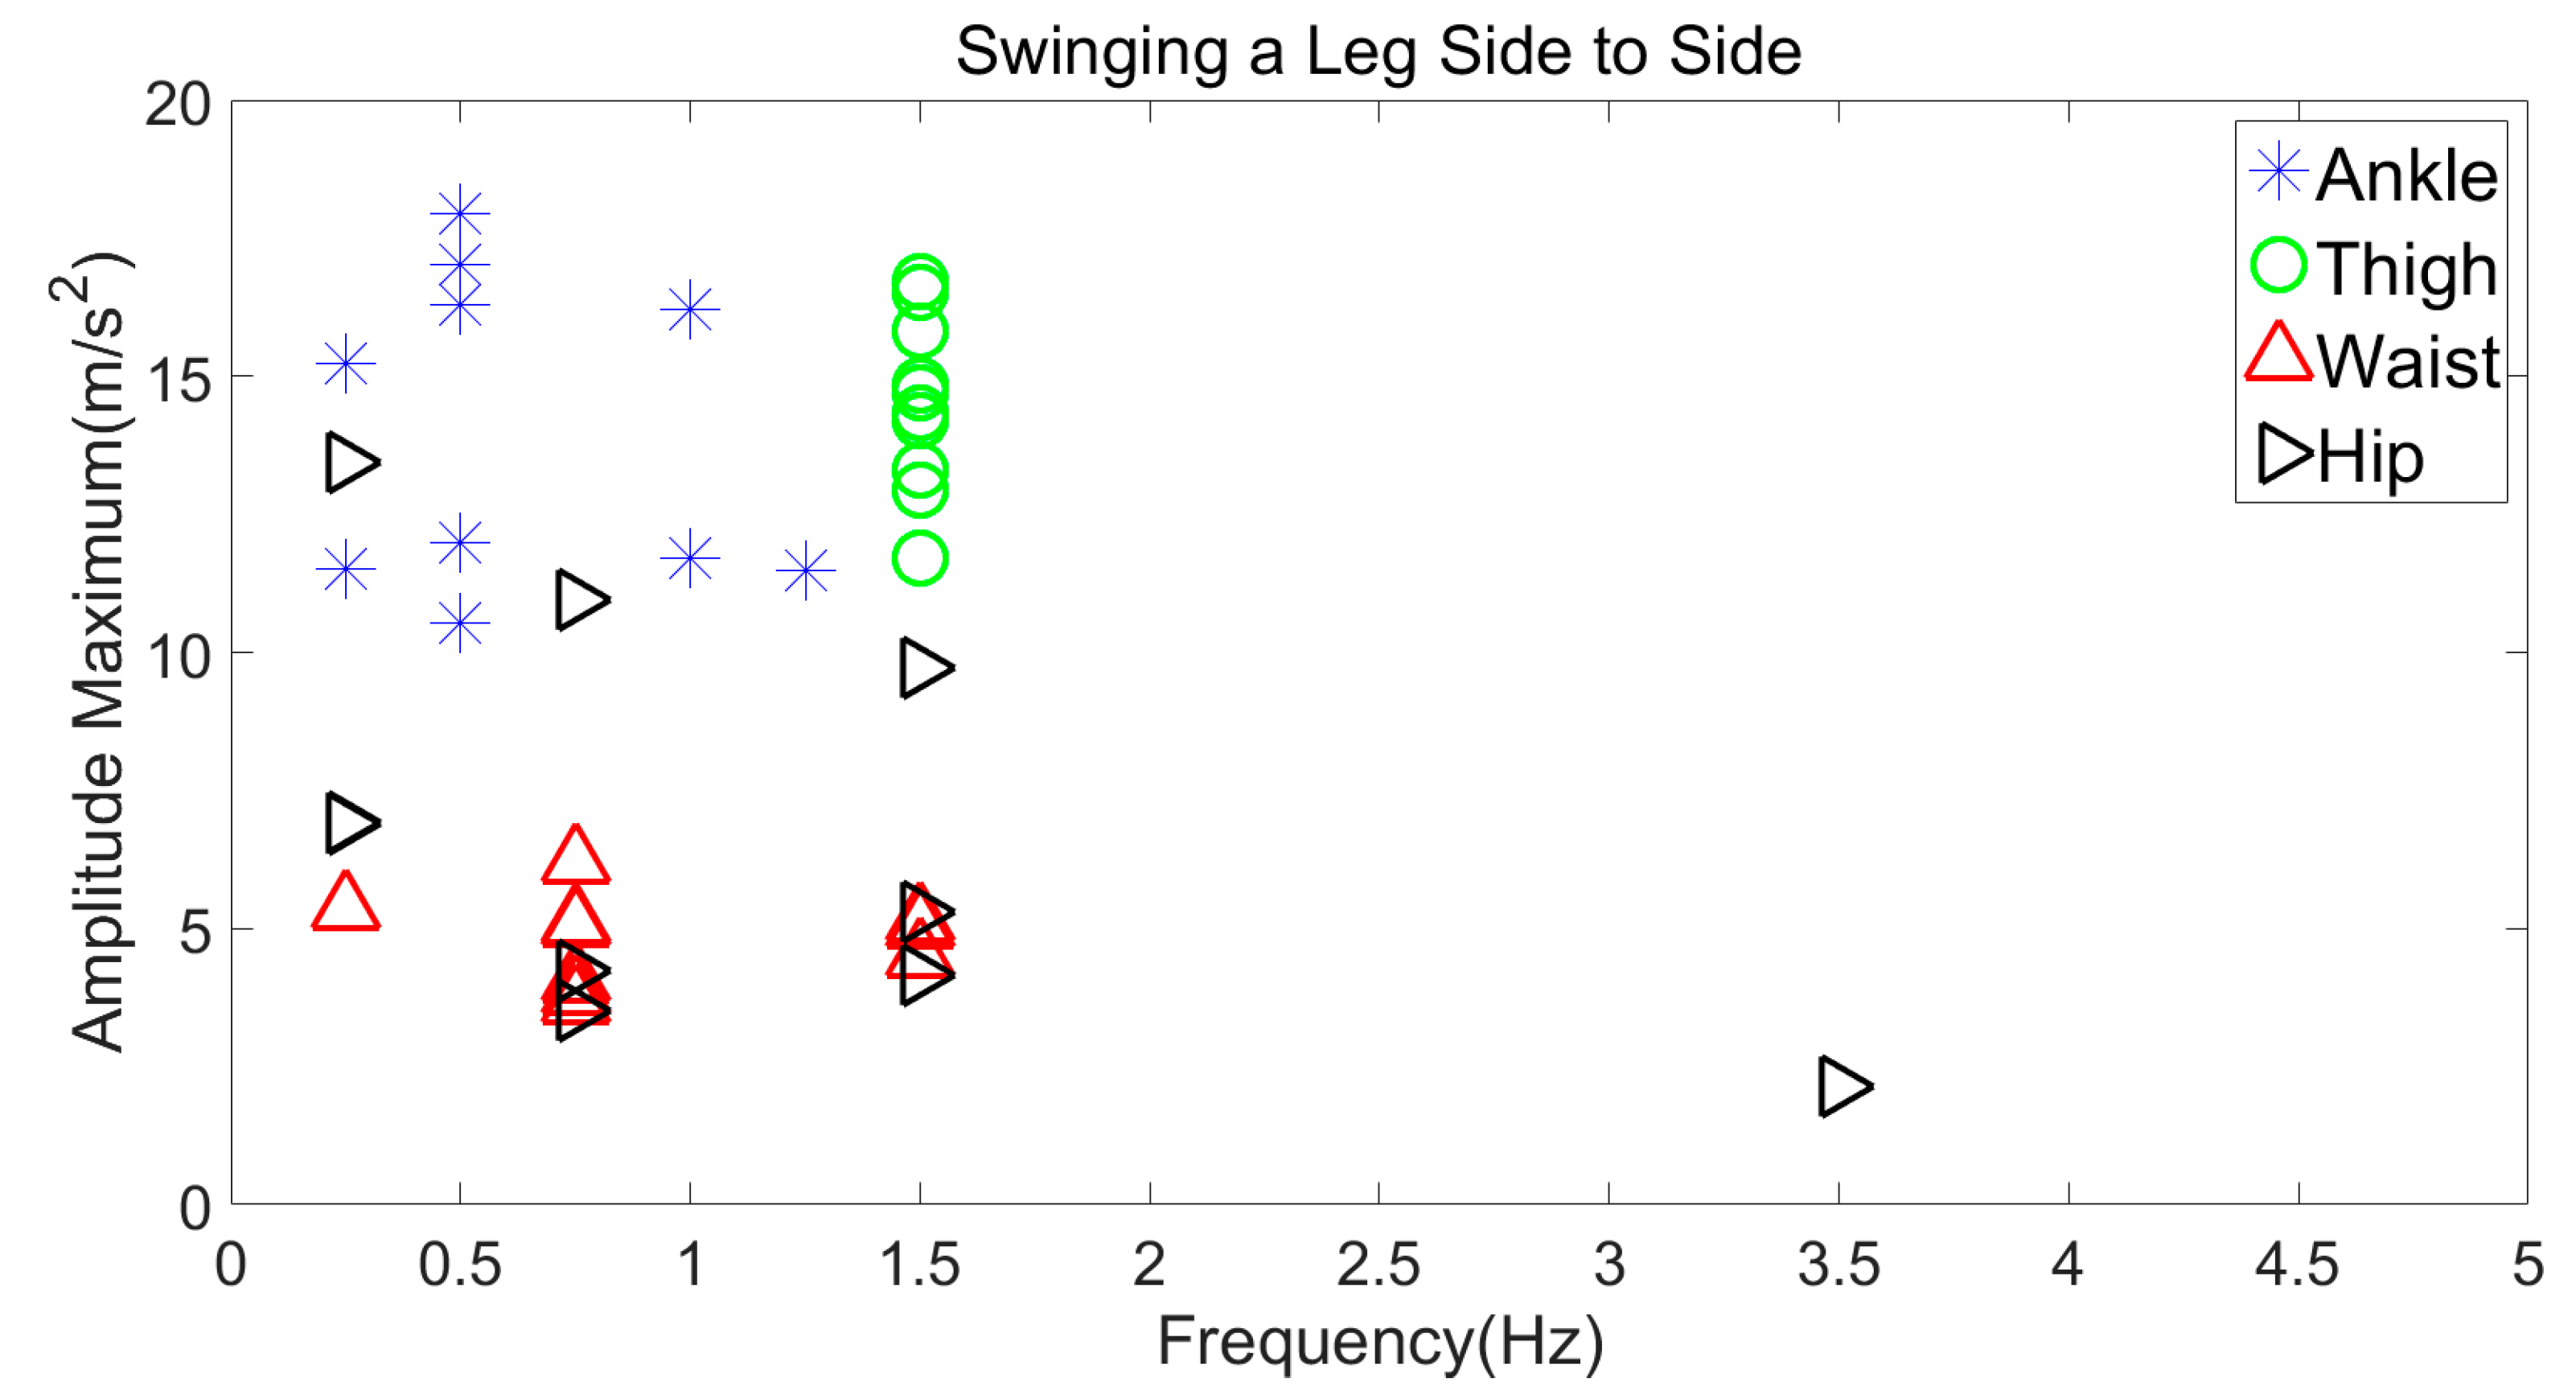
3.3.3. Swinging a Leg Side to Side
Figure 14 shows the analysis of swinging a leg to the side with four different sensor locations. Data points for ankle, hip, and waist location had a varying frequency range. This negatively affects the level of accuracy for categorisation. However, the thigh location would be best as it lied within a frequency range of only 1.4–1.6 Hz and the amplitude range was from 11 to 17 m/s2.
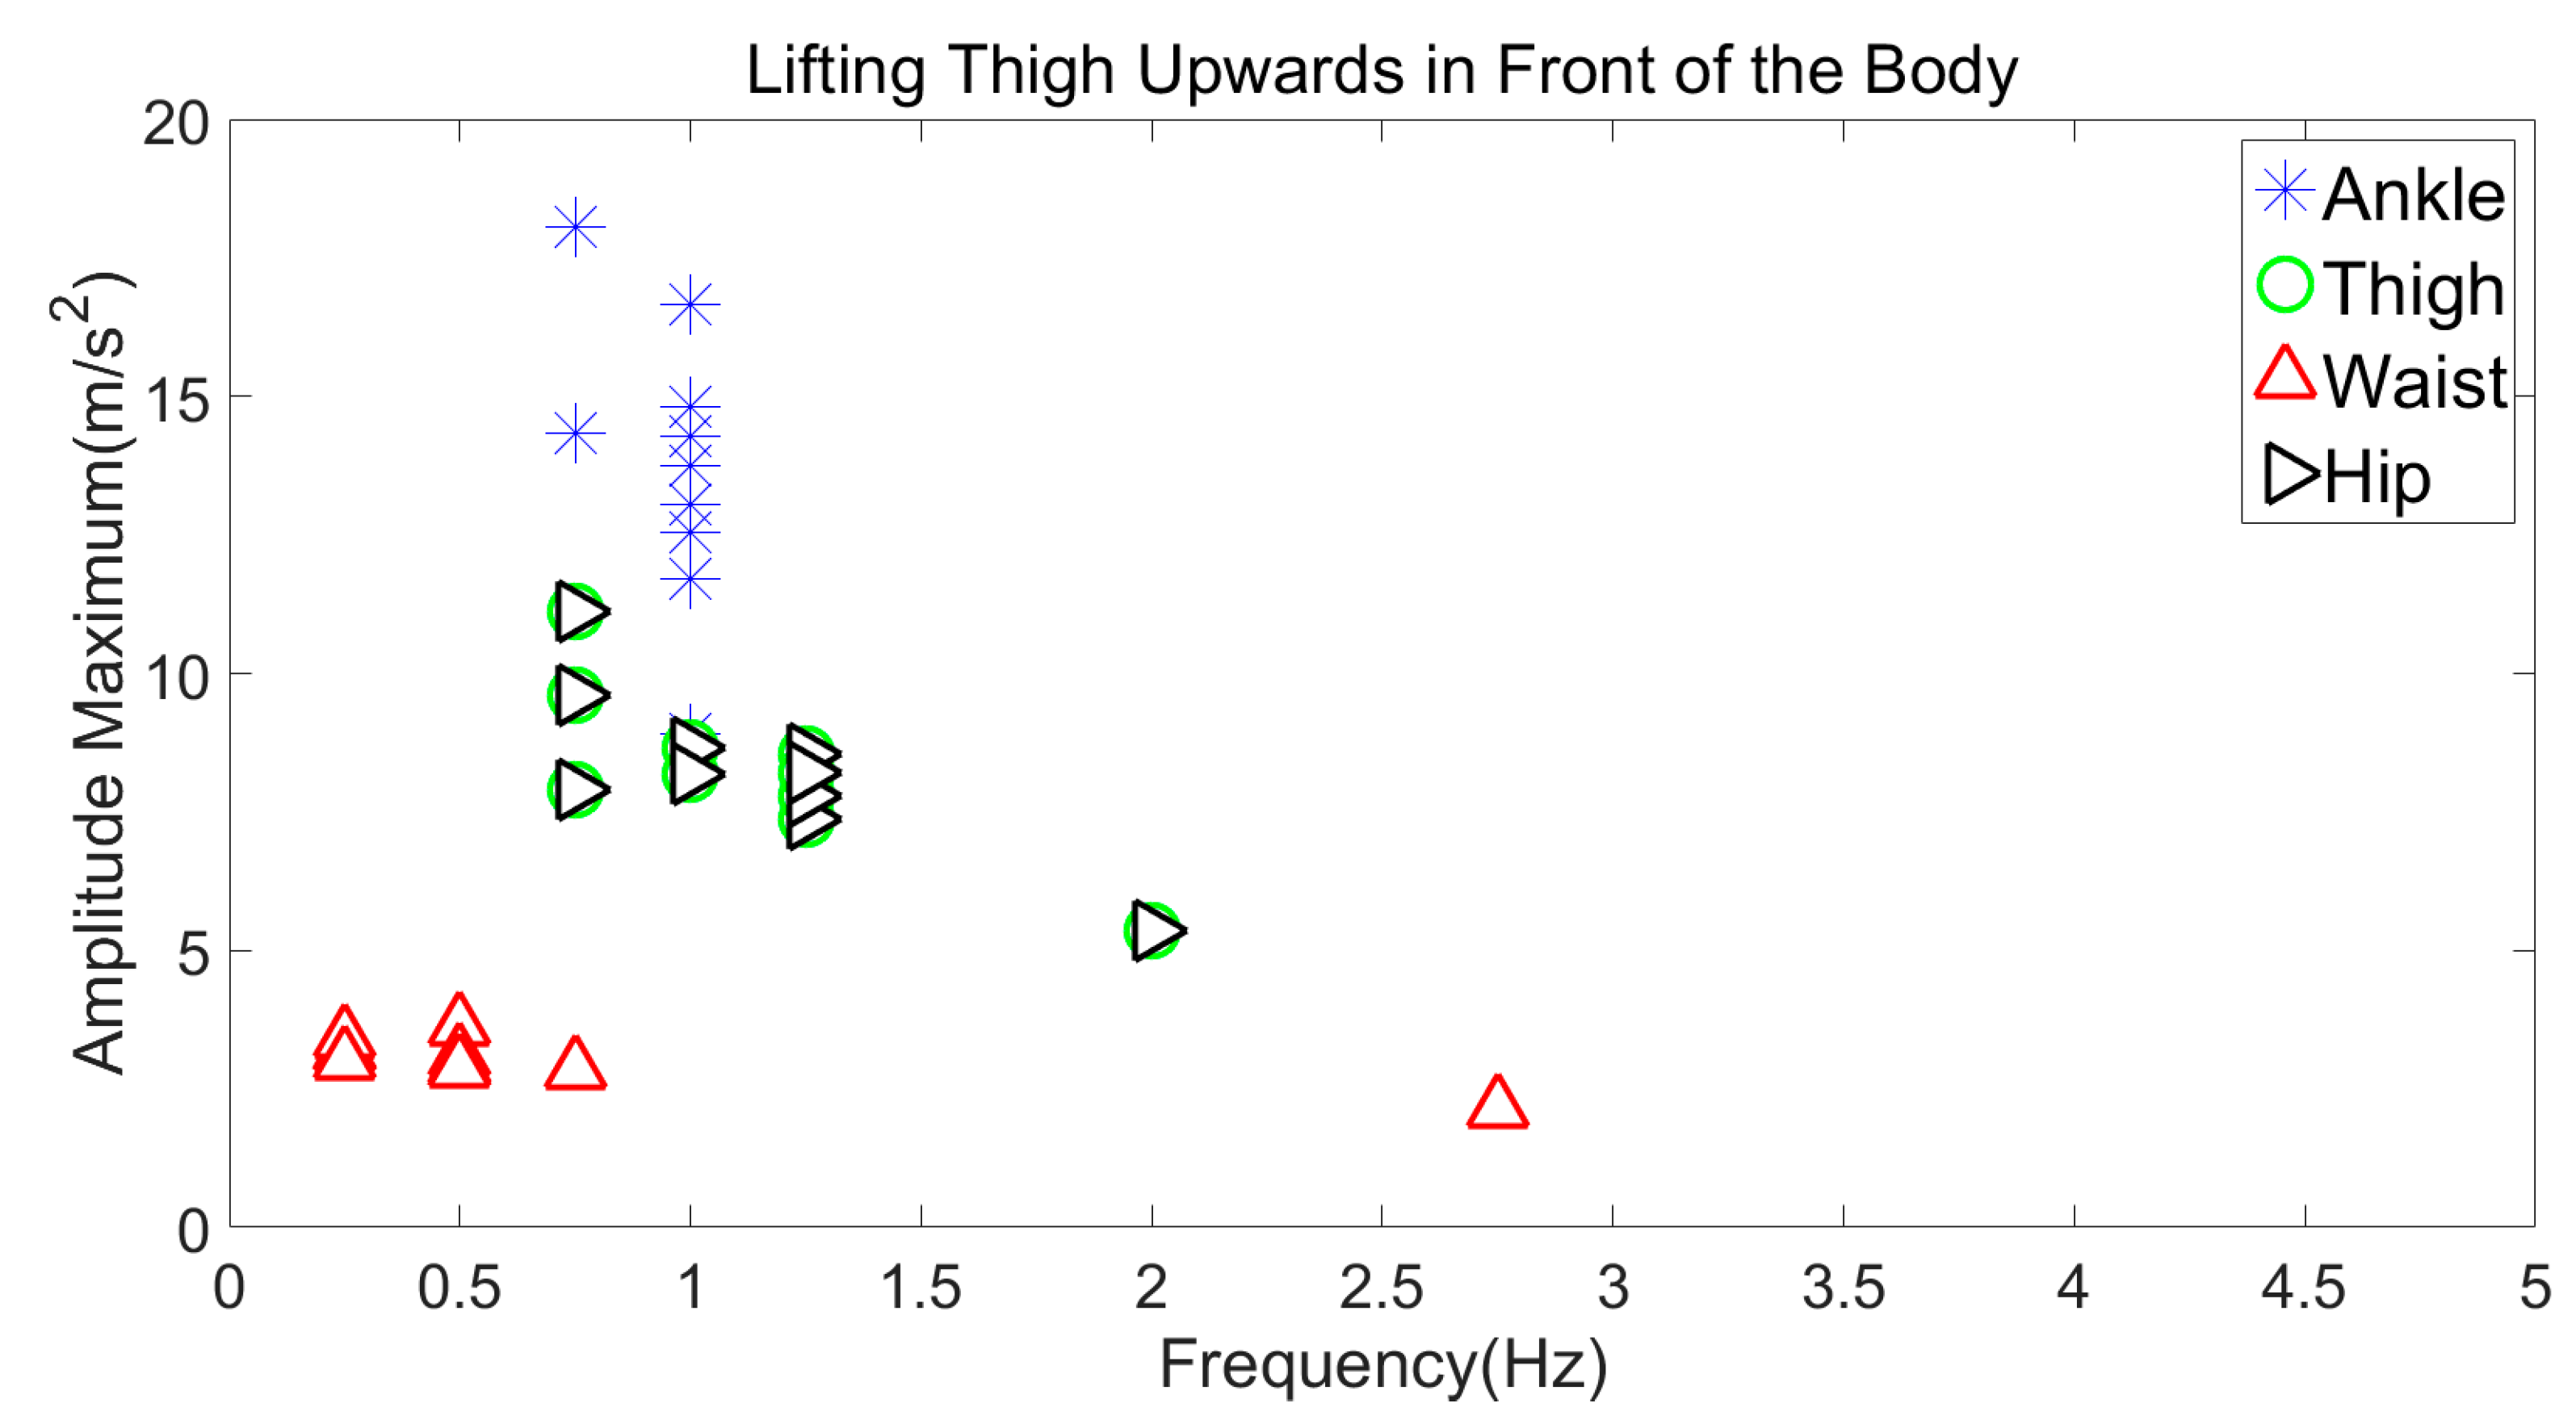
3.3.4. Lifting Thigh Upwards in Front of the Body
Figure 15 represents the analysis of lifting the thigh upwards in front of the body at four different sensor locations. Frequency data for thigh, hip, and waist location were widely distributed, compared to the ankle location, where data points were focused at a frequency range that lied within 0.9 and 1.1 Hz and the amplitude was between 11 and 19 m/s2. Hence, the ankle location was favoured for categorisation.
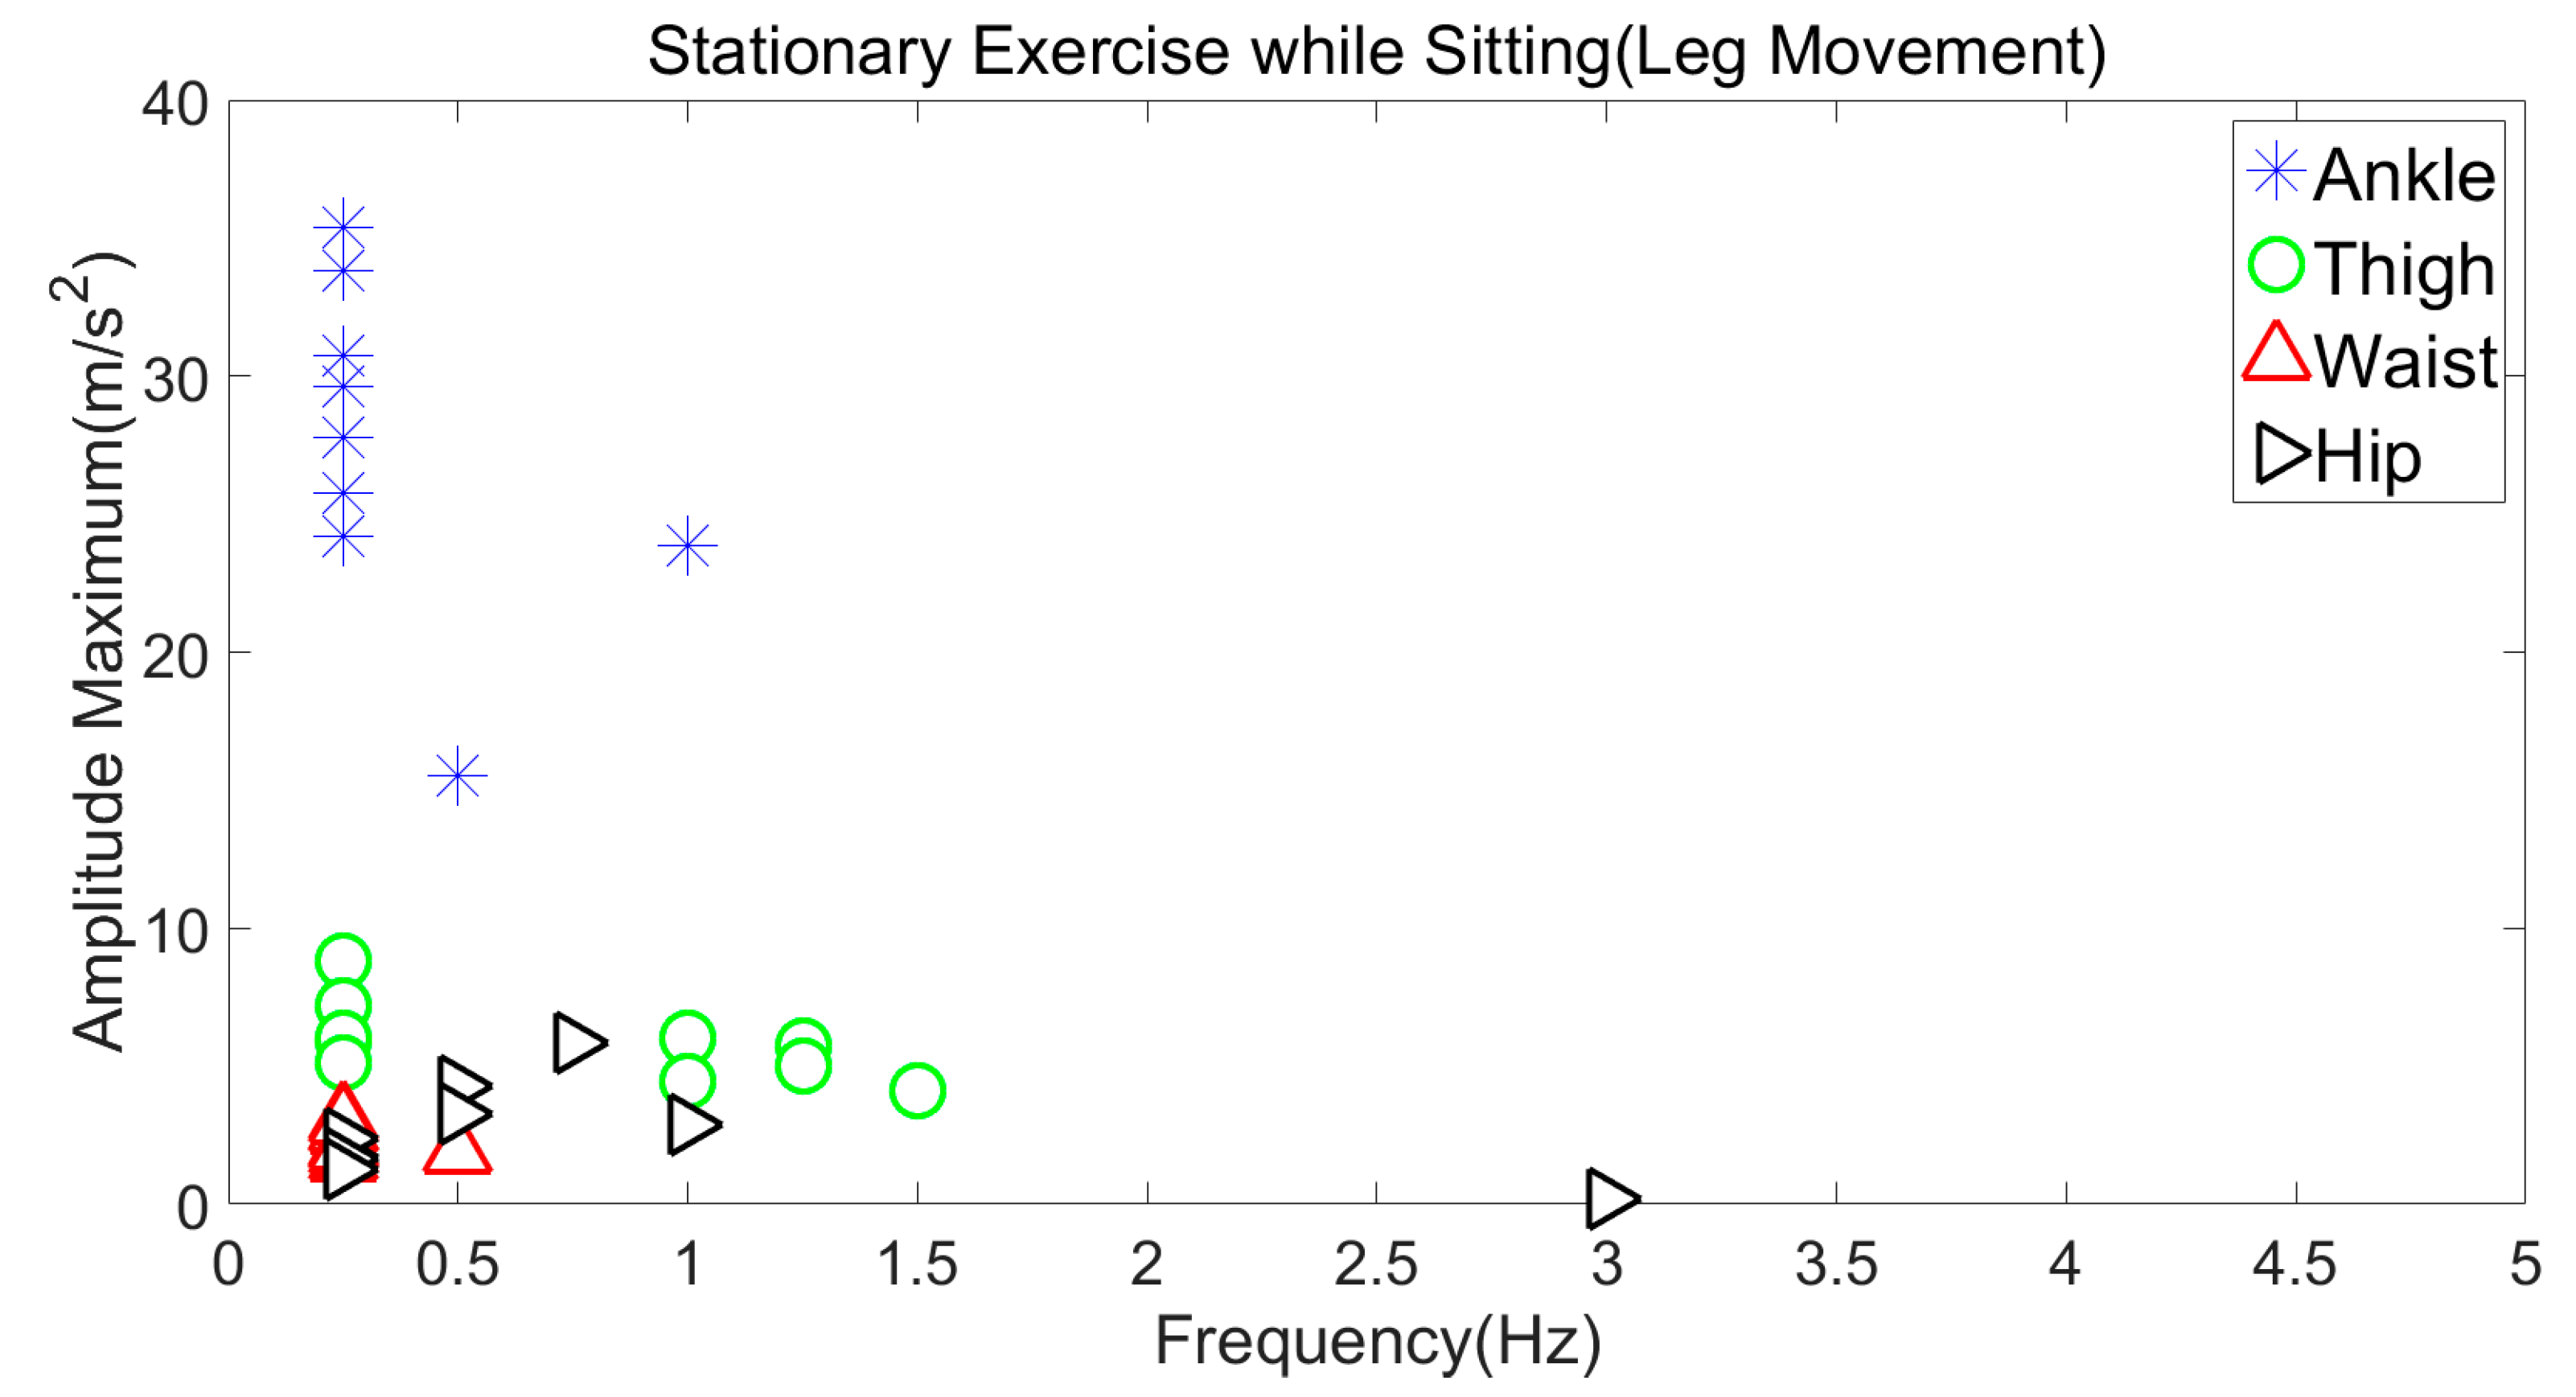
3.3.5. Stationary Exercise while Sitting (Leg Movement)
Figure 16 represents the analysis of stationary exercise while sitting (hip and knee flexion and extension) at four different sensor locations. The ankle location was favoured for categorisation as the frequency range was low (0–0.4 Hz) and the amplitude was distinctive, lying between 23 and 37 m/s2.
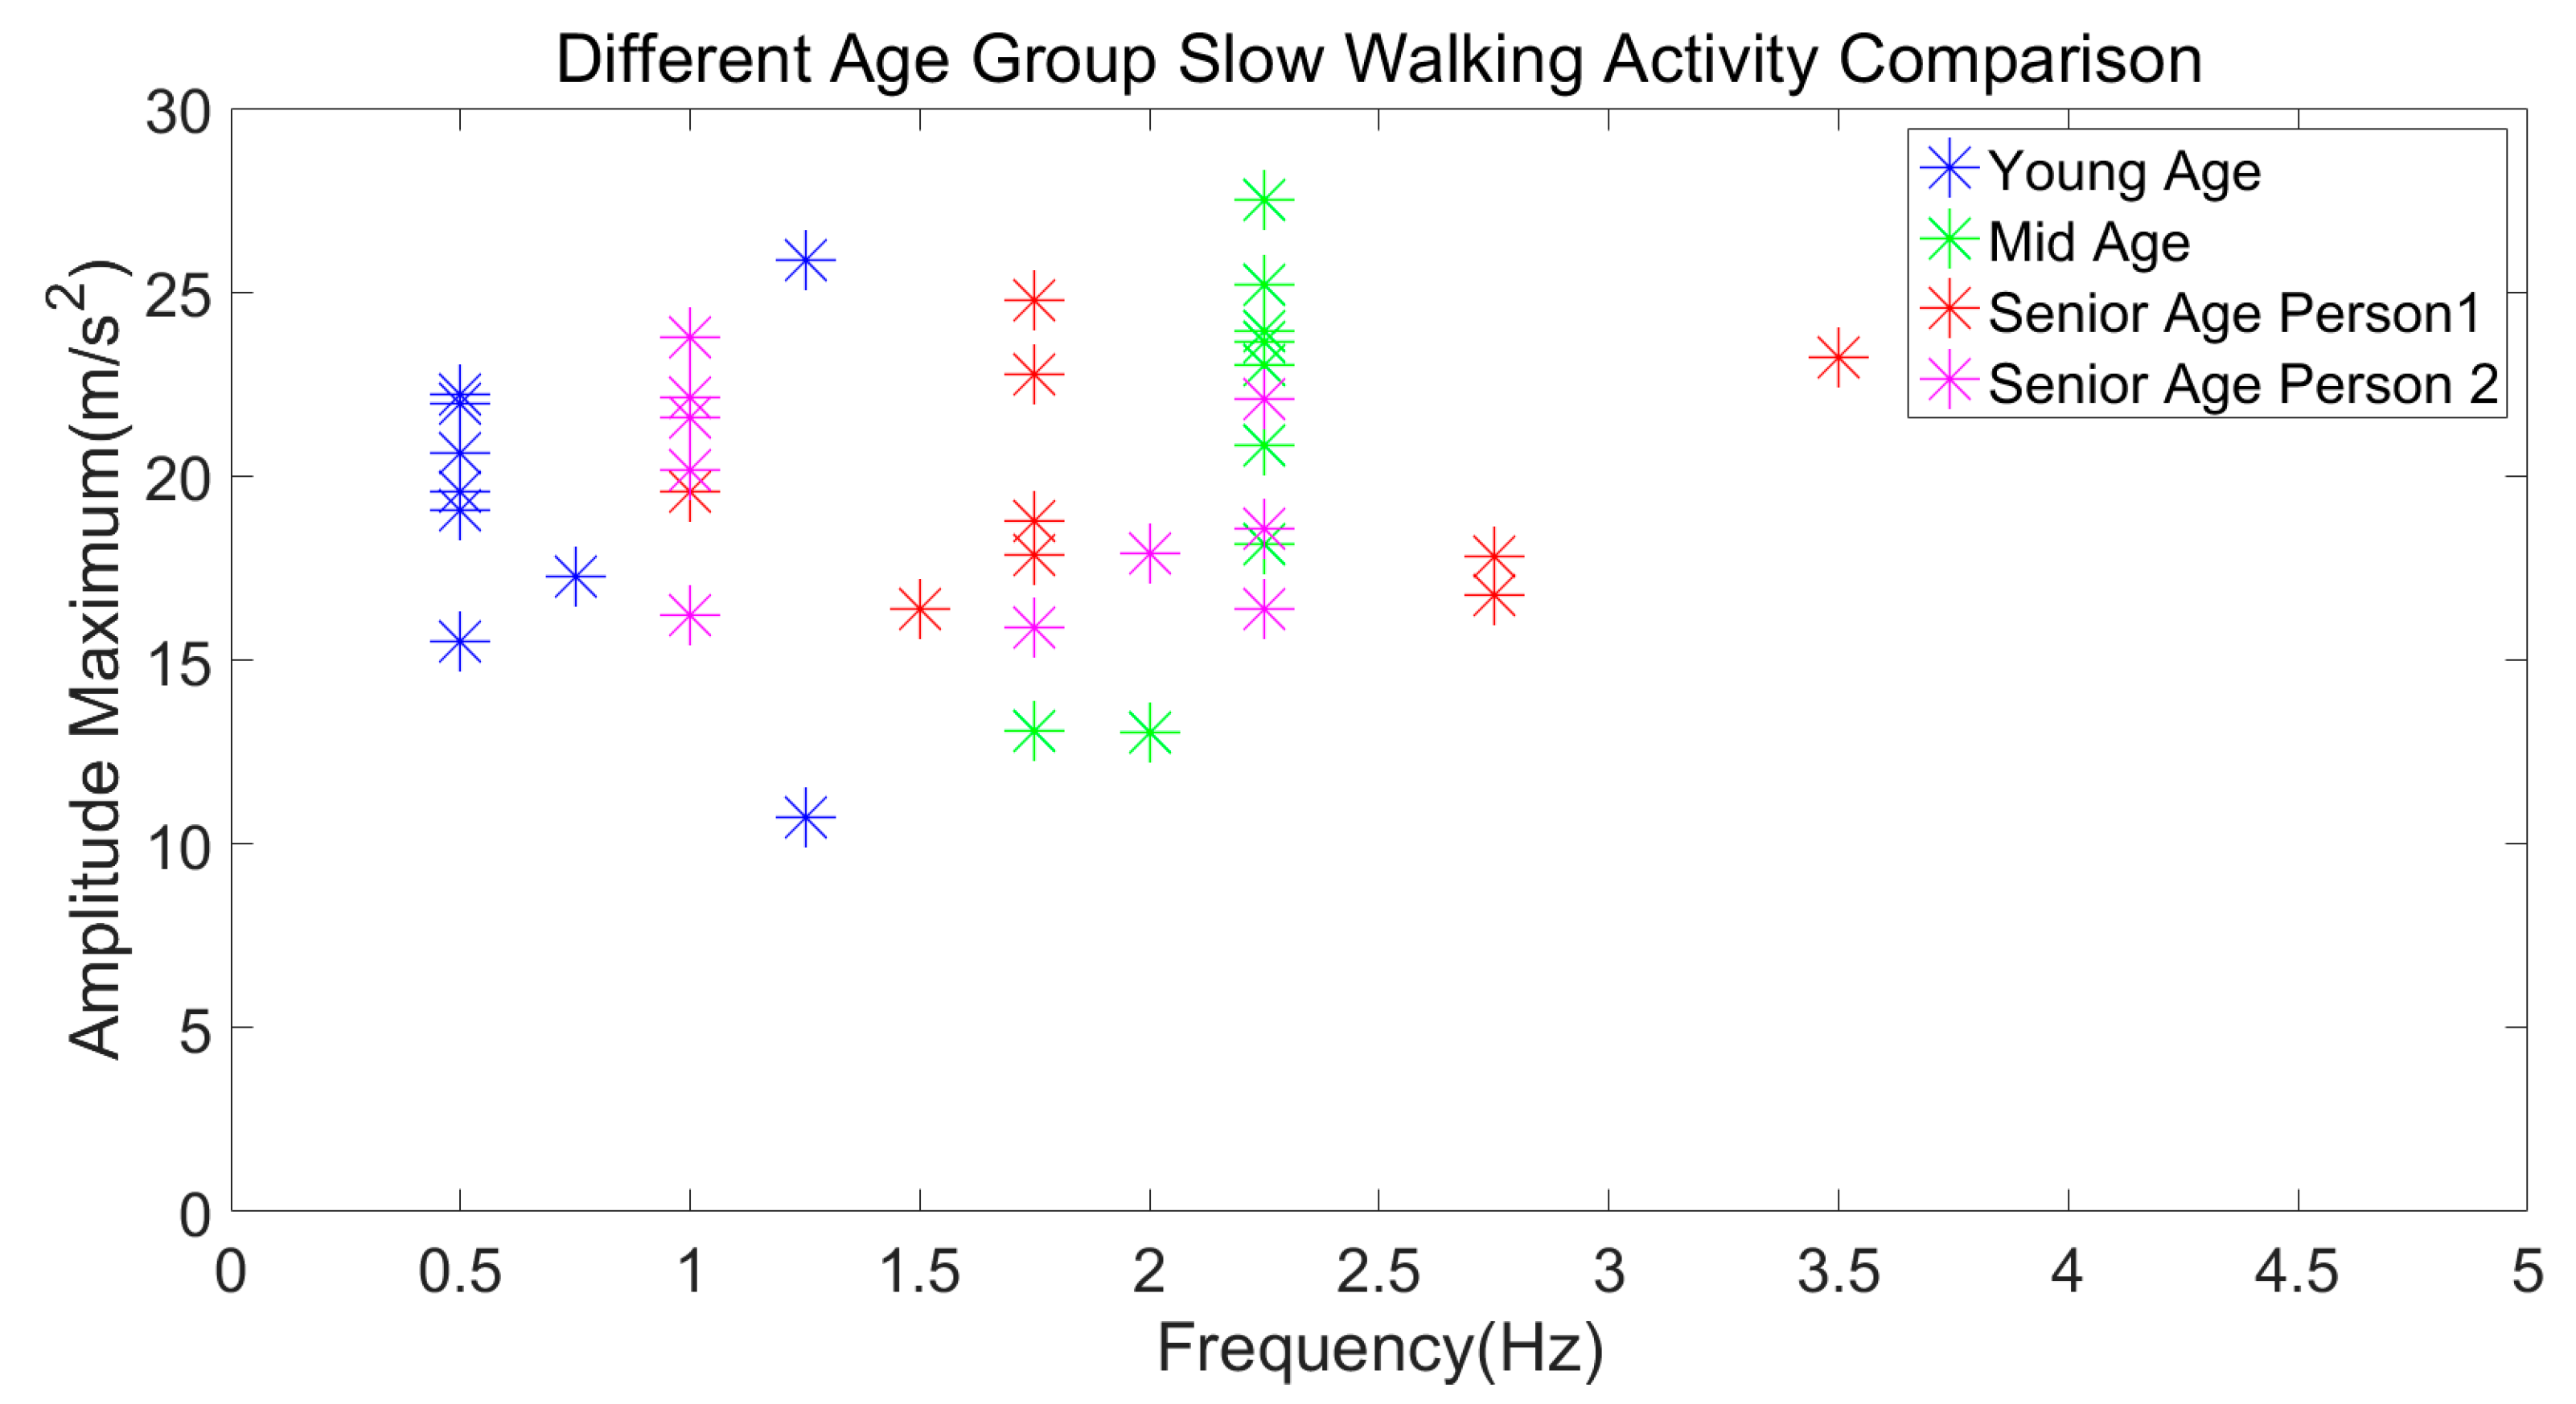
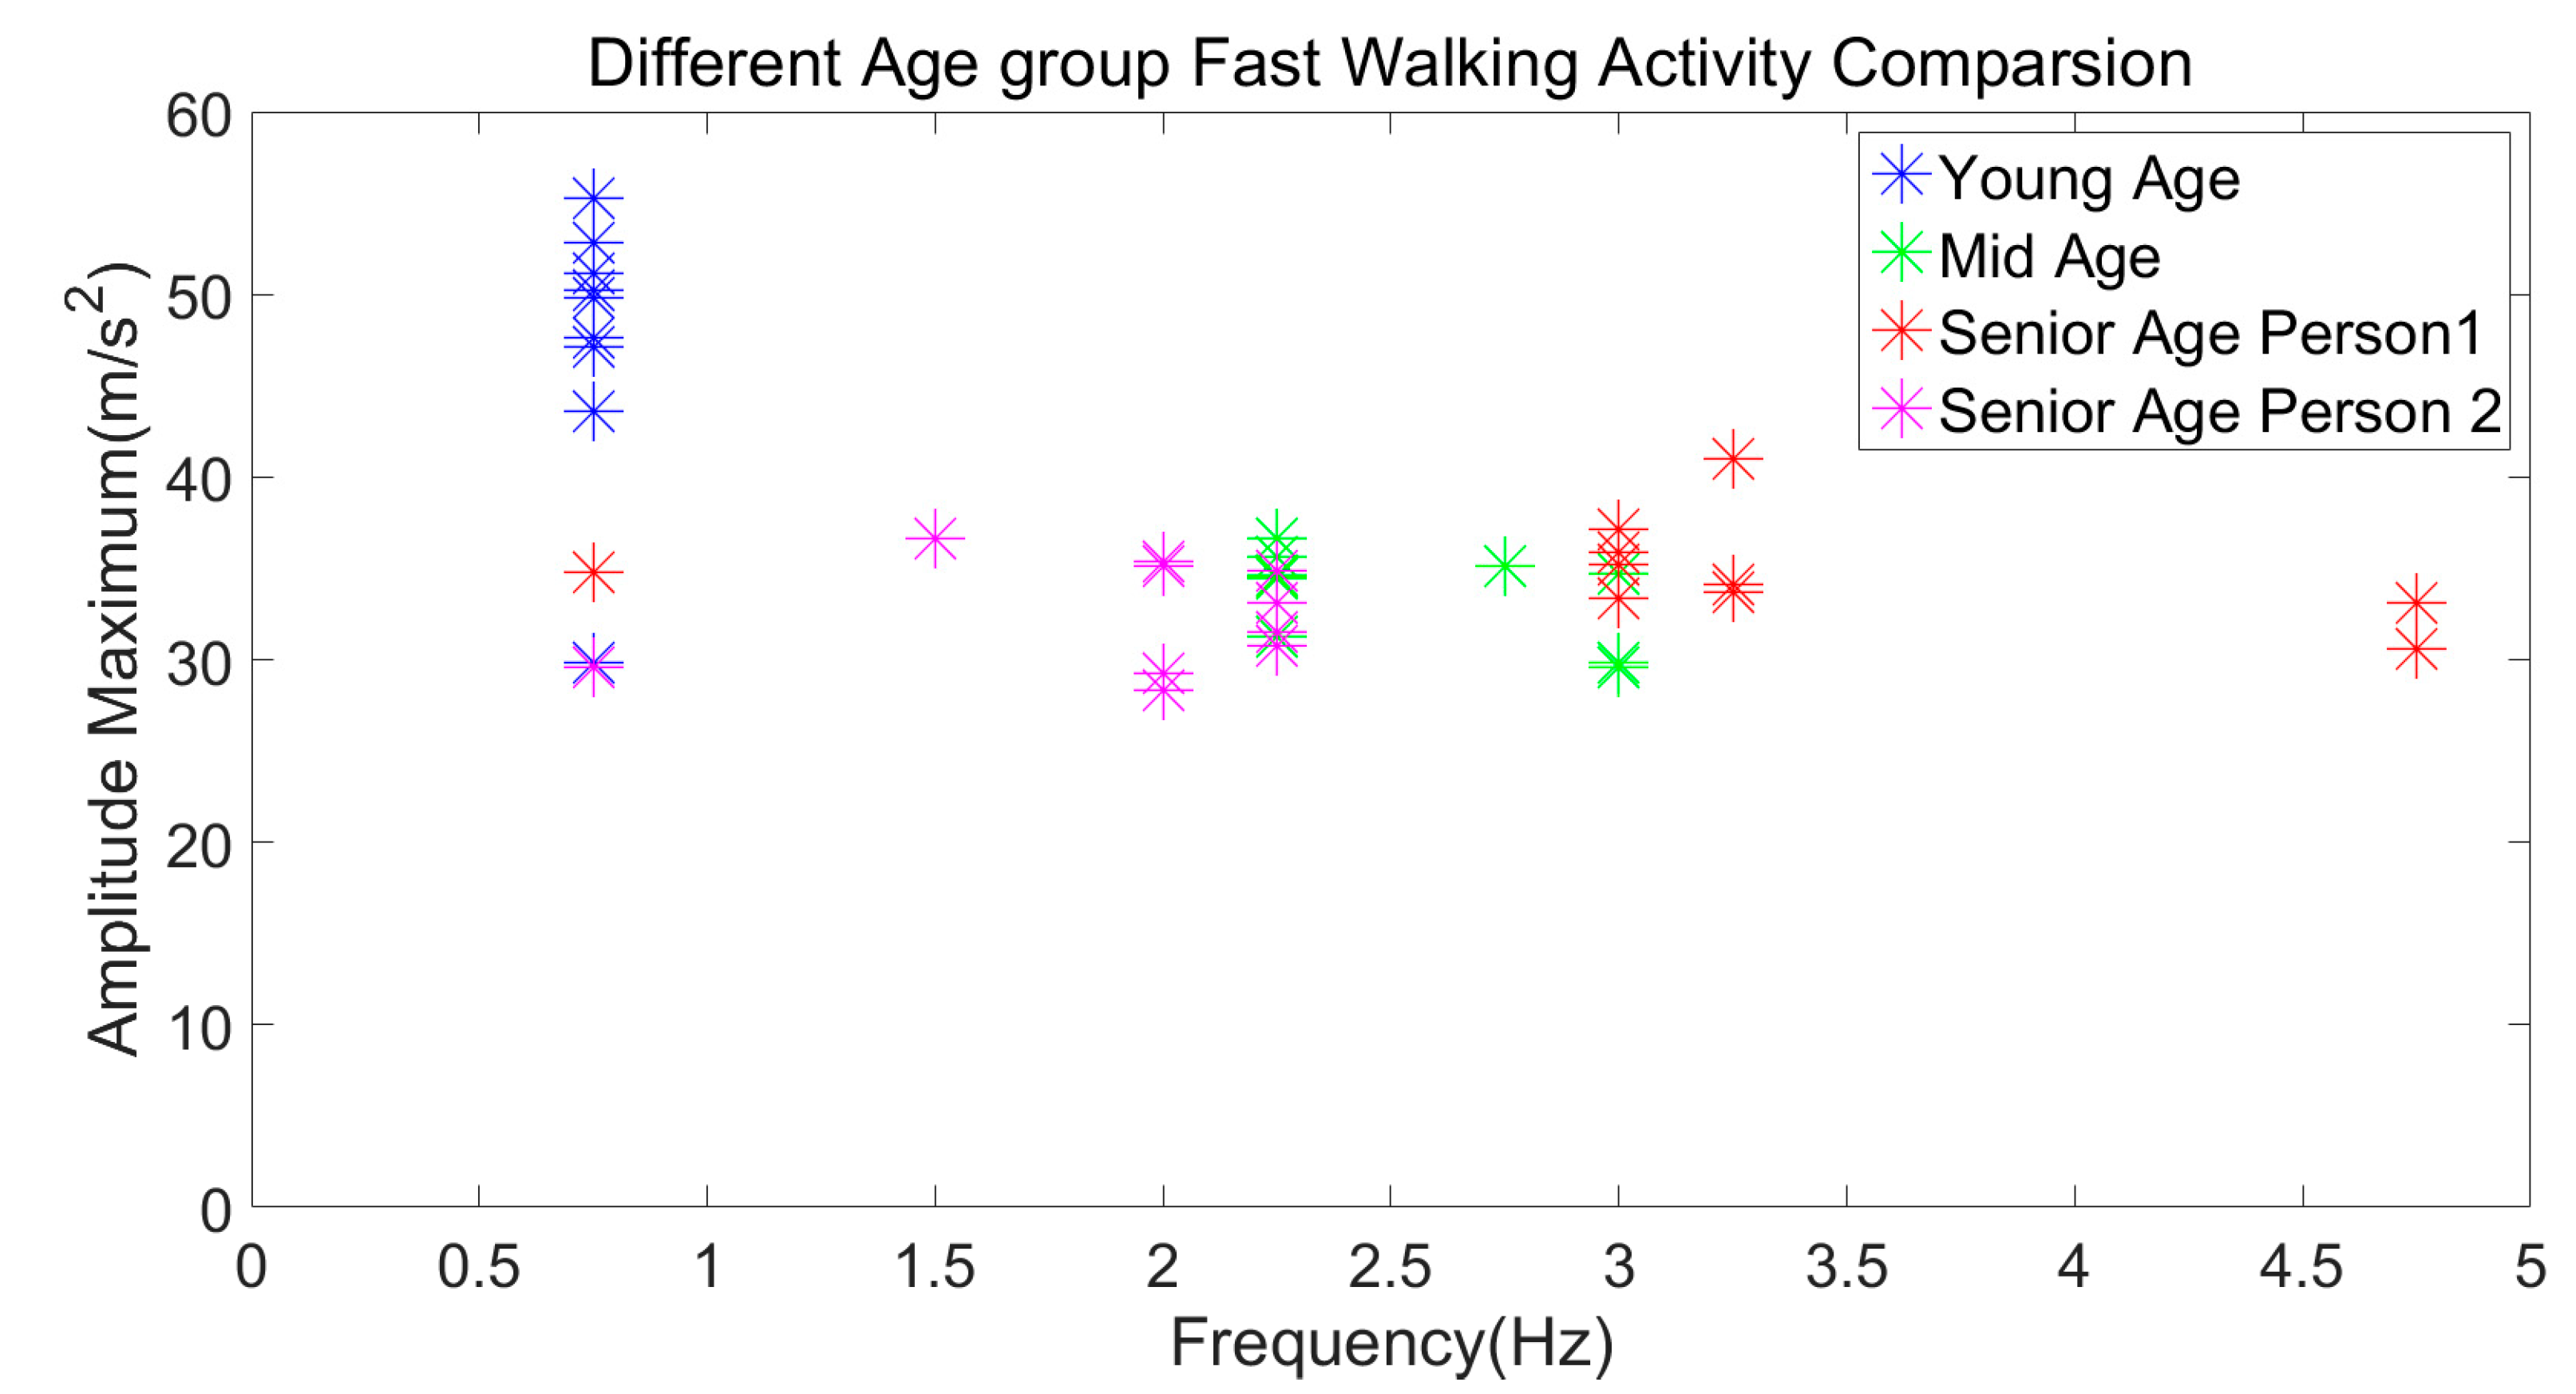
3.3.6. Different Age Group Subjects’ Slow and Fast Walking Activity Comparison
Figure 17 and Figure 18 represent the slow and fast walking activity comparison among different age group subjects (one young subject in his/her mid-twenties, his/her one middle age subject in forties, and two senior age subjects in their sixties).
During the slow walking analysis, it was observed that the amplitude values among all age groups lied within the 10- and 28-m/s2 range. However, there were notable differences observed in the dominant frequency (young age: 0.5 Hz, mid-age: 2–2.5 Hz, senior age Person 1: 1.5–2.75 Hz, and senior age Person 2: 1–2.25 Hz).
For fast walking, the amplitude for the young age mostly lies between 40 and 60 m/s2, whereas for middle age and senior age persons, it ranged between 29 and 42 m/s2. However, again, notable differences were observed in the dominant frequency (young age: 0.75 Hz, mid-age: 2.25–3 Hz, senior age Person 1: 0.75–4.75 Hz, and senior age Person 2: 0.75–2.25 Hz).
From the above comparison analysis, it was concluded that based on the amplitude, we can categorize different age groups’ slow and fast walking activity.
4. Discussion
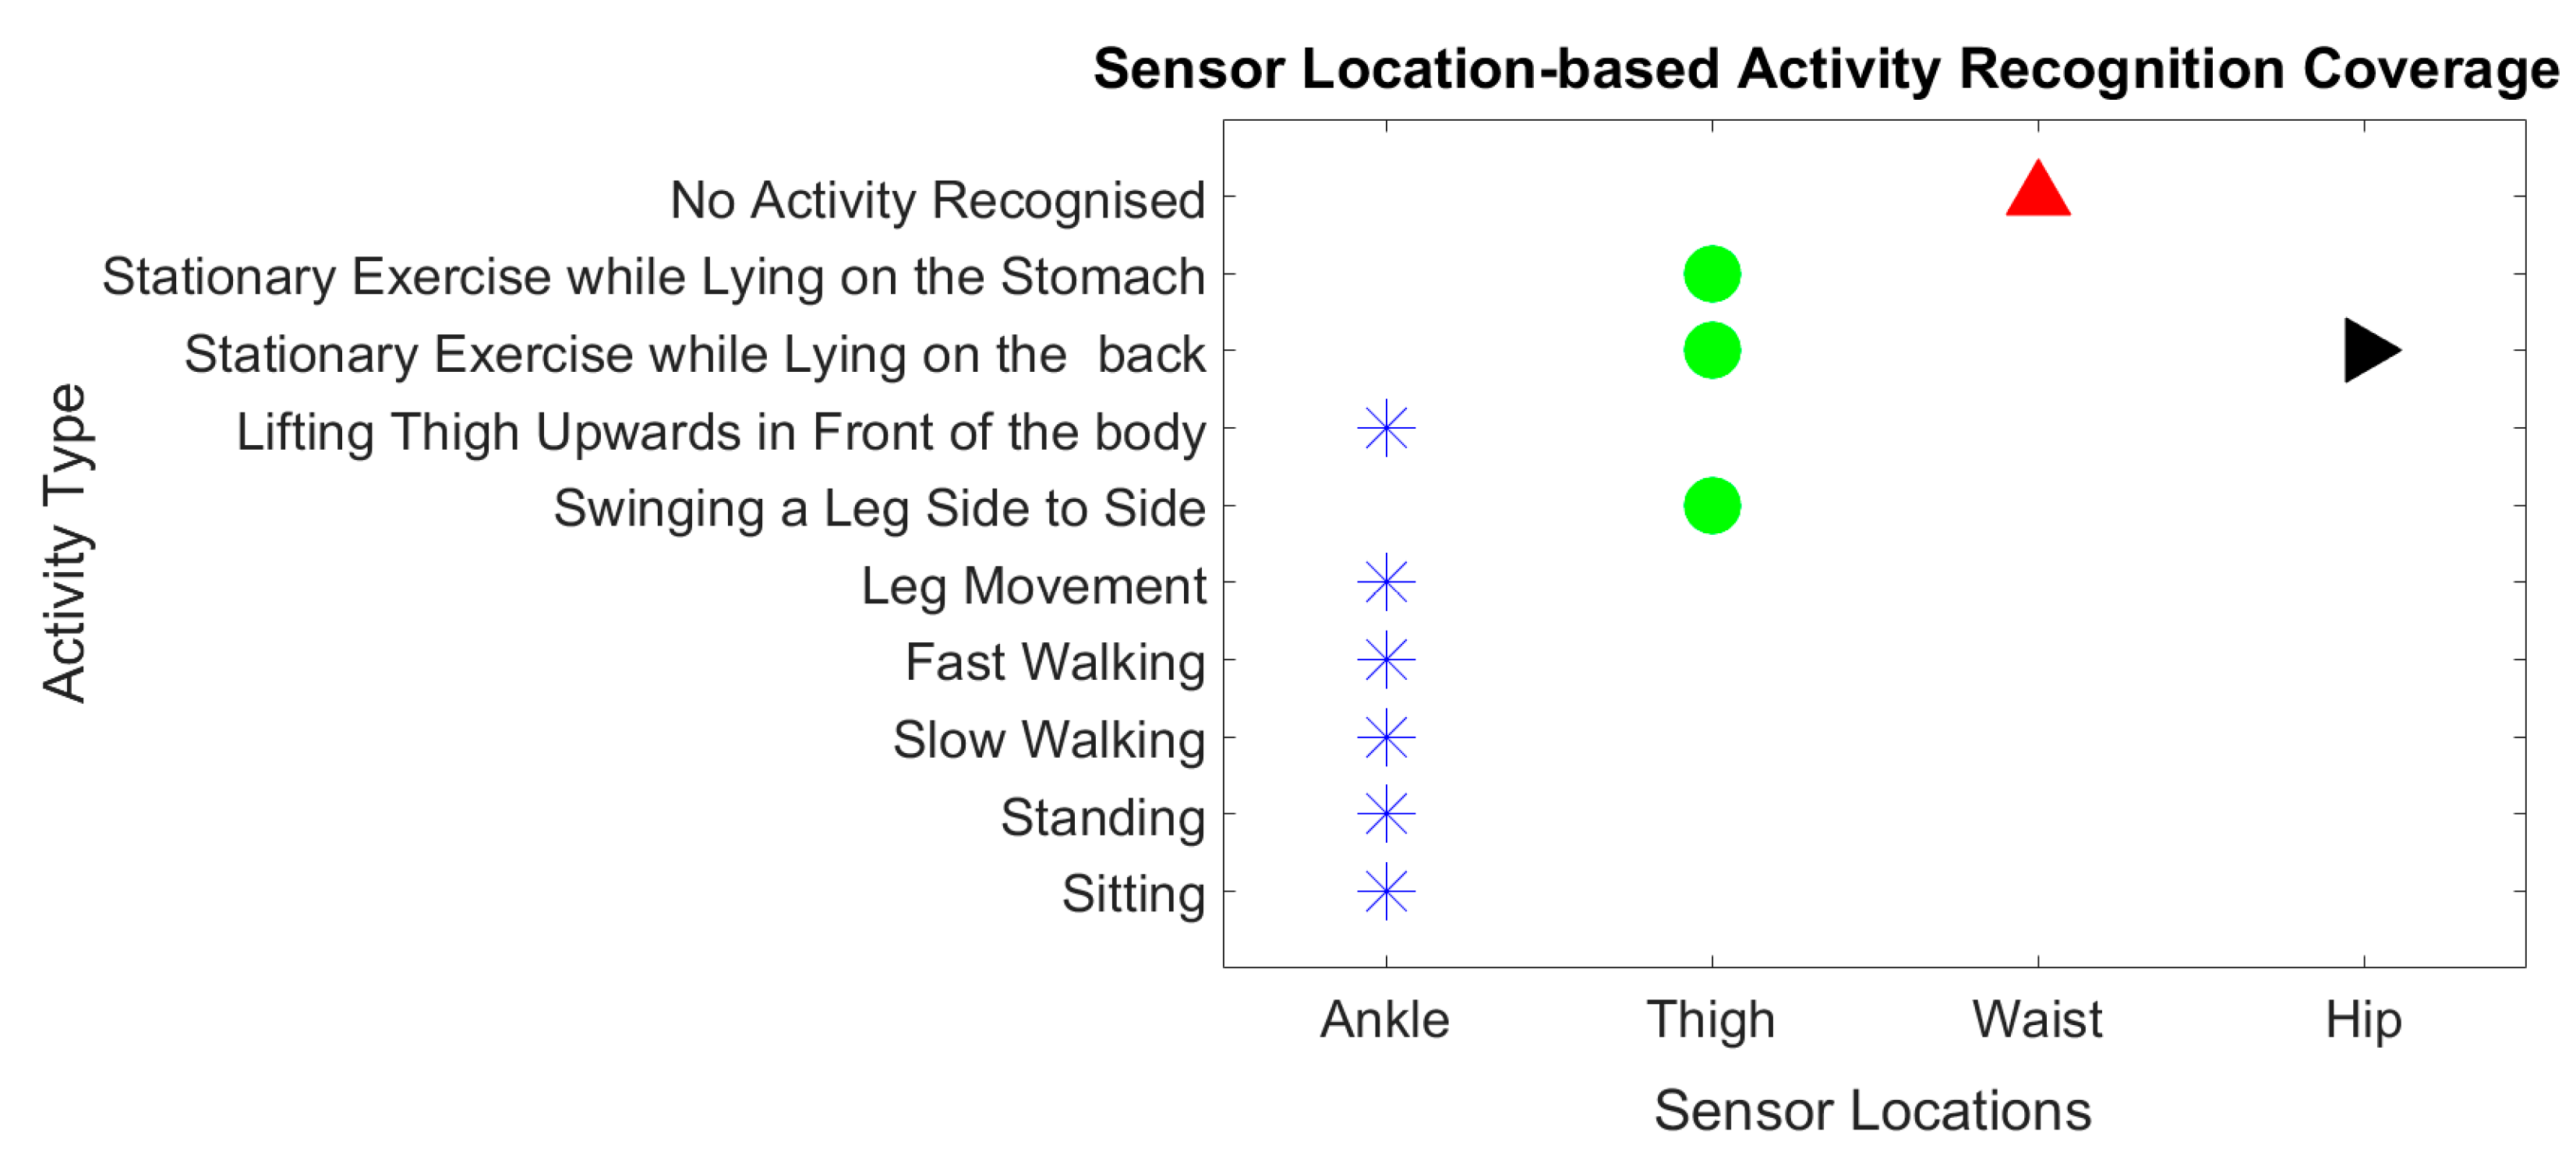
The proposed activity recognition model proved to be effective at categorizing most of the exercises and activities that were practised in the process of the rehabilitation of hip fracture patients. The results of implementing the recognition model on the collected data reveal that the standard deviation plays a key role in static activities. Furthermore, the maximum amplitude of the activities acceleration signal’s frequency content is associated with ambulatory activities’ recognition and both maximum frequency and amplitude for hip fracture-related activities. Figure 19 provides a summary of the extent to which a particular sensor location could identify or categorize activities. Based on this figure, it is apparent that the ankle joint is the location of choice.
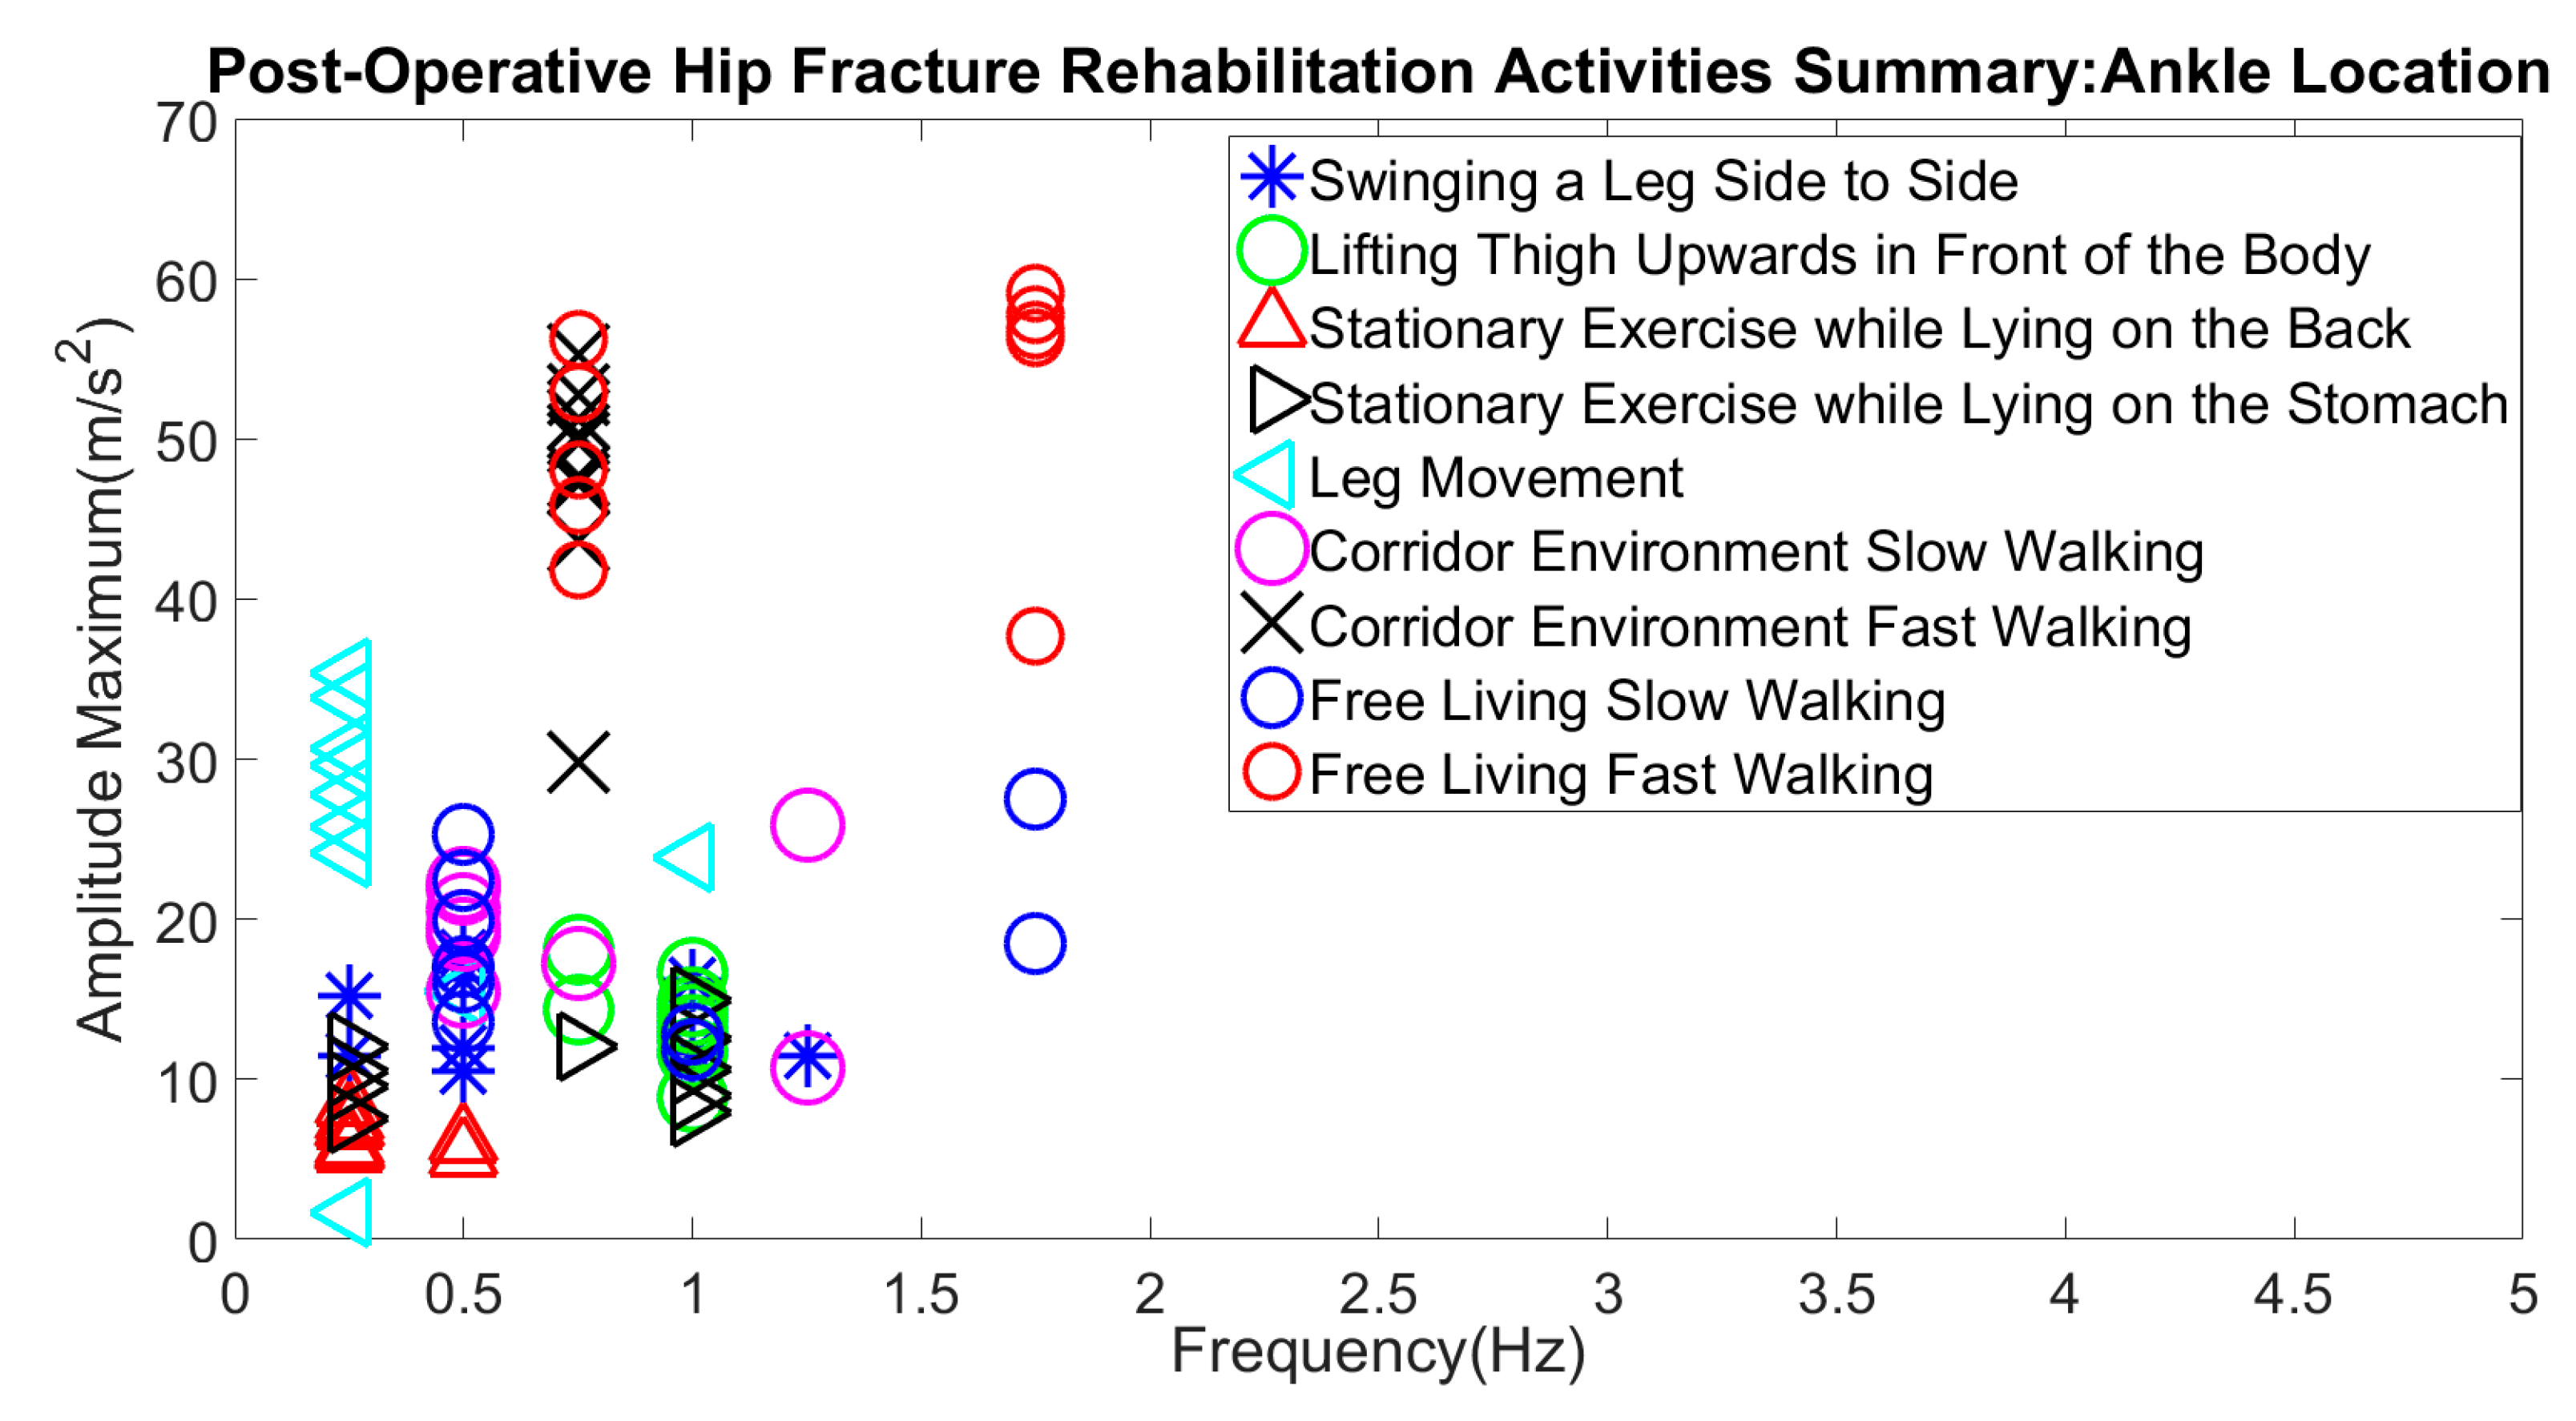
The specific parameters, that is frequency and amplitude, across all the activities are shown graphically in Figure 20, while Table 1 provides the precise values relevant to this figure. Notably, all the activities fell under a frequency of 2 Hz and an amplitude of 60 m/s2. For dynamic physical activities, amplitude values of corridor fast walking overlapped with free-living fast walking. In addition, corridor slow walking overlapped with free-living slow walking. However, the frequency content values remained the same for both slow and fast walking. The amplitude values offer a good indicator for recognizing walking activity irrespective of the environment. For stationary exercise while lying on the back and stationary exercise while sitting, frequency values almost overlapped, but amplitude values showed large variations, allowing for better categorization. It becomes difficult to differentiate the exercise of lying on the stomach and swinging a leg to the side when the wearable sensor is at the ankle location. This is because both the amplitude and frequency ranges almost overlapped with each other. Additionally, the amplitude and frequency for lifting the thigh upwards and swinging the leg to the side overlapped.
These potential limitations require further indicators and possible investigation over a wide spectrum of subjects. Here, artificial intelligence and machine learning could play an important role in increasing the precision of activity identification.
In this paper, a specific duration of 24 s of active data collection and 6-s halts were used. Excessive time was allowed to accommodate covering all key frequencies generated by the various activities. Preliminary tests on the validity of this selection on the fast walk activity for example reflected that we could still detect the activity even when the data collection duration was reduced to 6 s. This means that for long-term monitoring, the selection of data collection time could be made adaptive to suit the type of activity requirement. This could allow for more rapid and better precision on dynamic recognition. Further deep study of the data content of a long-term continuous data collection will involve analysing the best transition time for a particular activity or during dynamic switching from one activity to another. Apart from the time selection, recognition parameters like the standard deviation, maximum amplitude, and frequency threshold should be tested across patients of different age groups and physical fitness.
This raises the importance of artificial intelligence in facilitating learning and adaptivity. One further involvement that needs to be looked at carefully is that of the distribution of intelligence over the key functional players of the wireless sensor, Internet gateway, and remote computational resources. This brings about the importance of cloud, fog, and edge computing with relevance to these types of exercises.
Future work would cover the data collection and analysis of elderly patients who have undergone hip fracture surgery. Upon an encouraging outcome of the implementation of the approach suggested above on elderly people, hospitalized people should be approached for testing and validating the method used. This will offer more insight into the key data and variance of the subject of focus within this area of research.
5. Conclusions
This paper provides an examination of key factors that are considered in the design of an active monitoring system for patients requiring rehabilitation following hip fracture operation. Key activities involved at different stages of the rehabilitation programme are discussed. Preliminary experimental results on a single subject show that the proposed activity recognition model proved to be feasible and effective at recognizing most of the proposed activities. The ankle is considered the best location for categorizing the majority of the monitored activities. The results reflect the need for learning and adaptivity in dealing with the demands of various activities for the sampling duration, as well as the variances in the manifestation of activities for different subjects.
Author Contributions
All the three authors have significantly contributed to the work presented in this paper. A.G. has been fully involved in the analysis and implementation. He has been involved in developing the sensors, the classification algorithms and testing the subjects. P.M. has presented the hip-fracture case and associated activities that are needed for rehabilitation. A.A.-A. is the driver of the concept for ubiquitous monitoring of the rehabilitation process and associated process and technical requirements.
Funding
This research received no external funding.
Acknowledgments
The authors would like to acknowledge the school of Engineering, Computer and Mathematical Sciences of Auckland University of Technology, New Zealand for partially funding the research requirements.
Conflicts of Interest
The authors declare no conflict of interest.
References
- Beaupre, L. Functional Recovery of Hip Fracture Patients. Available online: boneandjointcanada.com/wp-content/uploads/2014/05/Functional-Recovery_Final.pdf (accessed on 7 July 2017).
- Health Quality & Safety Commission New Zealand. Topic 7—Why Hip Fracture Prevention and Care Matter. Available online: https://www.hqsc.govt.nz/our-programmes/reducing-harm-from-falls/publications-and-resources/publication/2877/ (accessed on 10 June 2017).
- Donohue, K.; Hoevenaars, R.; McEachern, J.; Zeman, E.; Mehta, S. Home-based multidisciplinary rehabilitation following hip fracture surgery: What is the evidence? Rehabil. Res. Pract. 2013, 2013, 875968. [Google Scholar] [CrossRef] [PubMed]
- MCarneiro, B.; Alves, D.P.L.; Mercadante, M.T. Physical therapy in the post-operative of proximal femur fracture in elderly: Literature review. Acta Ortop. Bras. 2013, 21, 175–178. [Google Scholar]
- Magaziner, J.; Hawkes, W.; Hebel, J.R.; Zimmerman, S.I.; Fox, K.M.; Dolan, M.; Felsenthal, G.; Kenzora, J. Recovery from hip fracture in eight areas of function. J. Gerontol. Ser. A-Biol. Sci. Med. 2000, 55, M498–M507. [Google Scholar] [CrossRef]
- Dyer, S.; Diong, J.; Crotty, M.; Sherrington, C. Rehabilitation following hip fracture. In Orthogeriatrics; Springer: Berlin, Germany, 2017; pp. 145–163. [Google Scholar]
- Mukhopadhyay, S.C. Wearable sensors for human activity monitoring: A review. IEEE Sens. J. 2015, 15, 1321–1330. [Google Scholar] [CrossRef]
- Hadjidj, A.; Souil, M.; Bouabdallah, A.; Challal, Y.; Owen, H. Wireless sensor networks for rehabilitation applications: Challenges and opportunities. J. Netw. Comput. Appl. 2013, 36, 1–15. [Google Scholar] [CrossRef] [Green Version]
- Pol, M.C.; Riet, G.T.; van Hartingsveldt, M.; Kröse, B.; de Rooij, S.E.; Buurman, B.M. Effectiveness of sensor monitoring in an occupational therapy rehabilitation program for older individuals after hip fracture, the SO-HIP trial: Study protocol of a three-arm stepped wedge cluster randomized trial. BMC Health Serv. Res. 2017, 17, 3. [Google Scholar] [CrossRef] [PubMed]
- Alberta Health Services. Bone and joint health strategic clinical network. In Your Guide After a Hip Fracture; Alberta Bone and Joint Health Institute: Calgary, AB, Canada, 2015. [Google Scholar]
- Baylor Health Care System. Hip Fracture Guide. Available online: https://www.baylorhealth.com/PhysiciansLocations/Dallas/SpecialtiesServices/Orthopaedics/Documents/Hip%20Fractures%20Guide_Web.pdf (accessed on 10 August 2017).
- Benzinger, P.; Lindemann, U.; Becker, C.; Aminian, K.; Jamour, M.; Flick, S.E. Geriatric rehabilitation after hip fracture. Role of body-fixed sensor measurements of physical activity. Z. Gerontol. Geriatr. 2014, 47, 236–242. [Google Scholar] [CrossRef] [PubMed]
- Schwachmeyer, V.; Damm, P.; Bender, A.; Dymke, J.; Graichen, F.; Bergmann, G. In vivo hip joint loading during post-operative physiotherapeutic exercises. PLoS ONE 2013, 8, e77807. [Google Scholar] [CrossRef] [PubMed]
- Thingstad, P.; Taraldsen, K.; Saltvedt, I.; Sletvold, O.; Vereijken, B.; Lamb, S.E.; Helbostad, J.L. The long-term effect of comprehensive geriatric care on gait after hip fracture: The Trondheim Hip Fracture Trial—A randomised controlled trial. Osteoporos. Int. 2016, 27, 933–942. [Google Scholar] [CrossRef] [PubMed]
- Tsukagoshi, R.; Tateuchi, H.; Fukumoto, Y.; Ibuki, S.; Akiyama, H.; So, K.; Kuroda, Y.; Okumura, H.; Ichihashi, N. Functional performance of female patients more than 6 months after total hip arthroplasty shows greater improvement with weight-bearing exercise than with non-weight-bearing exercise. Randomized controlled trial. Eur. J. Phys. Rehabil. Med. 2014, 50, 665–675. [Google Scholar] [PubMed]
- Moschetti, A.; Fiorini, L.; Esposito, D.; Dario, P.; Cavallo, F. Recognition of Daily Gestures with Wearable Inertial Rings and Bracelets. Sensors 2016, 16, 1341. [Google Scholar] [CrossRef] [PubMed]
- Cornacchia, M.; Ozcan, K.; Zheng, Y.; Velipasalar, S. A survey on activity detection and classification using wearable sensors. IEEE Sens. J. 2017, 17, 386–403. [Google Scholar] [CrossRef]
- Lara, O.D.; Labrador, M.A. A survey on human activity recognition using wearable sensors. IEEE Commun. Surv. Tutor. 2013, 15, 1192–1209. [Google Scholar] [CrossRef]
- Baek, J.; Lee, G.; Park, W.; Yun, B.-J. Accelerometer signal processing for user activity detection. In Proceedings of the International Conference on Knowledge-Based and Intelligent Information and Engineering Systems, Wellington, New Zealand, 20–25 September 2004; pp. 610–617. [Google Scholar]
- Sharma, A.; Purwar, A.; Lee, Y.-D.; Lee, Y.-S.; Chung, W.-Y. Frequency based classification of activities using accelerometer data. In Proceedings of the MFI 2008: IEEE International Conference on Multisensor Fusion and Integration for Intelligent Systems, Seoul, Korea, 20–22 August 2008; pp. 150–153. [Google Scholar]
- Cleland, I.; Kikhia, B.; Nugent, C.; Boytsov, A.; Hallberg, J.; Synnes, K.; McClean, S.; Finlay, D. Optimal placement of accelerometers for the detection of everyday activities. Sensors 2013, 13, 9183–9200. [Google Scholar] [CrossRef] [PubMed]
- Amini, N.; Sarrafzadeh, M.; Vahdatpour, A.; Xu, W. Accelerometer-based on-body sensor localization for health and medical monitoring applications. Pervasive Mob. Comput. 2011, 7, 746–760. [Google Scholar] [CrossRef] [PubMed] [Green Version]
- Gjoreski, H.; Gams, M. Activity/Posture recognition using wearable sensors placed on different body locations. In Proceedings of the (738) Signal and Image Processing and Applications, Crete, Greece, 22–24 June 2011. [Google Scholar]
- Atallah, L.; Lo, B.P.; King, R.C.; Yang, G.-Z. Sensor Placement for Activity Detection Using Wearable Accelerometers. In Proceedings of the International Conference on Body Sensor Networks, Singapore, Singapore, 7–9 June 2010; pp. 24–29. [Google Scholar]
- Sriwan, J.; Suntiamorntut, W. Human activity monitoring system based on WSNs. In Proceedings of the 12th International Joint Conference on Computer Science and Software Engineering (JCSSE), Hatyai, Thailand, 22–24 July 2015; pp. 247–250. [Google Scholar]
- McAdams, E.T.; Gehin, C.; Noury, N.; Ramon, C.; Nocua, R.; Massot, B.; Oliveira, A.; Dittmar, A.; Nugent, C.D.; McLaughlin, J. Biomedical sensors for ambient assisted living. In Advances in Biomedical Sensing, Measurements, Instrumentation and Systems; Mukhopadhyay, S.C., Lay-Ekuakille, A., Eds.; Springer: Berlin, Germany, 2010; pp. 240–262. [Google Scholar]
- Ustev, Y.E.; Incel, O.D.; Ersoy, C. User, device and orientation independent human activity recognition on mobile phones: Challenges and a proposal. In Proceedings of the 2013 ACM conference on Pervasive and ubiquitous computing adjunct publication, Zurich, Switzerland, 8–12 September 2013; pp. 1427–1436. [Google Scholar]
Figure 1.
Wearable activity sensing device system.

Figure 2.
Three-second data collection time comparison of three activities using the frequency spectrum with the maximum amplitude.
Figure 2.
Three-second data collection time comparison of three activities using the frequency spectrum with the maximum amplitude.

Figure 3.
Sensor placement locations.

Figure 4.
Frequency vs. amplitude maximum: sitting.

Figure 5.
Frequency vs. amplitude maximum: standing.

Figure 6.
Standard deviation: sitting.

Figure 7.
Standard deviation: standing.

Figure 8.
Free-living environment: fast walking.

Figure 9.
Corridor environment: fast walking.

Figure 10.
Free-living environment: slow walking.

Figure 11.
Corridor environment: slow walking.

Figure 12.
Stationary exercise while lying on the back.

Figure 13.
Stationary exercise while lying on the stomach.

Figure 14.
Swinging a leg side to side.

Figure 15.
Lifting thigh upwards in front of the body.

Figure 16.
Leg movement while sitting.

Figure 17.
Different subjects’ slow walking activity comparison.

Figure 18.
Different subjects’ fast walking activity comparison.

Figure 19.
Sensor location-based activity recognition coverage.

Figure 20.
All activities’ manifestation with the senor placed at the ankle location.


Table 1.
Activities’ classification overall summary at the ankle location.
| Activity Type | Amplitude | Frequency |
|---|---|---|
| Slow Walking | 12–28 m/s2 | 0.5–1.75 Hz |
| Fast Walking | 40–60 m/s2 | 0.5–1.75 Hz |
| Lying on Back | 5–9 m/s2 | 0–0.5 Hz |
| Lying on Stomach | 7–15 m/s2 | 0–1 Hz |
| Swinging Leg to Side | 10–18 m/s2 | 0–1.3 Hz |
| Lifting Thigh Upwards | 11–19 m/s2 | 0.9–1.1 Hz |
| Sitting (Leg Movement) | 23–37 m/s2 | 0–0.4 Hz |
© 2018 by the authors. Licensee MDPI, Basel, Switzerland. This article is an open access article distributed under the terms and conditions of the Creative Commons Attribution (CC BY) license (http://creativecommons.org/licenses/by/4.0/).
Share and Cite
MDPI and ACS Style
Gupta, A.; Al-Anbuky, A.; McNair, P. Activity Classification Feasibility Using Wearables: Considerations for Hip Fracture. J. Sens. Actuator Netw. 2018, 7, 54. https://doi.org/10.3390/jsan7040054
AMA Style
Gupta A, Al-Anbuky A, McNair P. Activity Classification Feasibility Using Wearables: Considerations for Hip Fracture. Journal of Sensor and Actuator Networks. 2018; 7(4):54. https://doi.org/10.3390/jsan7040054
Chicago/Turabian StyleGupta, Akash, Adnan Al-Anbuky, and Peter McNair. 2018. "Activity Classification Feasibility Using Wearables: Considerations for Hip Fracture" Journal of Sensor and Actuator Networks 7, no. 4: 54. https://doi.org/10.3390/jsan7040054
Note that from the first issue of 2016, this journal uses article numbers instead of page numbers. See further details here.