
Embodied Carbon Emissions of the Residential Building Stock in the United States and the Effectiveness of Mitigation Strategies


School of Architecture, Planning, Preservation, University of Maryland, College Park, MD 20742, USA
Climate 2022, 10(10), 135; https://doi.org/10.3390/cli10100135
Submission received: 9 August 2022
/
Revised: 1 September 2022
/
Accepted: 2 September 2022
/
Published: 20 September 2022
(This article belongs to the Special Issue The Built Environment in a Changing Climate: Interactions, Challenges and Perspectives: Part II)
Abstract
:According to the 2021 Global Status Report for Buildings and Construction published by the United Nations Environment Programme, global carbon emissions from the building sector in 2019 were nearly 14 gigatons (Gt), representing 38% of total global carbon emissions, including 10% from building construction. In the United States, the largest knowledge gap regarding embodied carbon in buildings exists at the whole-building level. The first step in creating informative policy to reduce embodied carbon emissions is to map the existing building stock emissions and changes over time to understand the primary contributing building types and hot spots (states), and then to compare and analyze mitigation scenarios. To fill this knowledge gap, this study first developed a bottom-up model to assess the embodied carbon of the US residential building stock by using 64 archetypes to represent the building stock. Then, the embodied carbon characteristics of the current building stock were analyzed, revealing that the primary contributor was single-family detached (SD) houses. The results indicated that the exterior wall was a major contributor, and that small multifamily housing was the most embodied carbon-intense building type. Two scenarios, the baseline scenario and progressive scenario, were formed to evaluate the effectiveness of six mitigation strategies. The progressive scenario with all mitigation strategies (M1–M6) applied produced a total reduction of 33.13 Gt CO2eq (42%) in the cumulative residential building stock related to carbon emissions during 2022–2050, and a total reduction of 88.34 Gt CO2eq (80%) during 2022–2100. The results show that with an embodied carbon emissions reduction in the progressive scenario (42% by 2100), the total embodied carbon emissions comply with the carbon budget of a 2 °C pathway, but will exceed the budget for a 1.5 °C pathway.
1. Introduction
According to the US Department of Housing and Urban Development’s National Comprehensive Housing Market Analysis, from 2020 to 2023, the national housing demand for new units is around 2.65 million units, which aligns with the US National Association of Home Builders’ forecast of an annual housing increase rate of 3.94% [1,2]. To achieve the Paris Agreement goals, under the United Nations Framework Convention on Climate Change, the Marrakech Partnership for Global Climate Action’s Human Settlements Pathway set a goal that included reduced embodied carbon emissions as follows: “By 2030, the built environment should halve its emissions, whereby 100 per cent of new buildings must be net-zero carbon in operation, with widespread energy efficiency retrofit of existing assets well underway, and embodied carbon must be reduced by at least 40 per cent, with leading projects achieving at least 50 per cent reductions in embodied carbon.” By 2050, at the latest, all new and existing assets must be net zero across the whole life cycle, including operational and embodied emissions [3]. It is imperative to create effective policy and development strategies to reduce embodied carbon and mitigate the climate emergency. The first step in making informative policy is to map the existing building stock emissions to understand the primary contributing building types and hot spots (state) and then to compare and analyze the mitigation scenarios.
In the United States, the largest knowledge gap concerning embodied carbon in buildings exists at the whole-building level, due to a lack of building-level data at the national level and an absence of methodology. In the past two decades, there has been increasing global interest in the analysis of characteristics and the related embodied carbon of large building stocks. However, compared to the large body of studies on the energy efficiency improvement of building stock [4,5,6], limited studies have been conducted to understand the embodied carbon reduction potential at a whole-building stock scale. To the author’s knowledge, no previous studies have examined the embodied carbon reduction in US building stock. Two causes contribute to the lack of research on this topic: The first is the perception of embodied carbon being negligible, which is outdated. Early literature showed that the ratio of embodied carbon to operational carbon for an average building was around 1:10, and thus embodied carbon appeared secondary to the main problem [7]. However, with the improvement in operational energy efficiency, in the past five years, a large body of studies has shown the increased importance of embodied carbon. Rock and colleagues studied 238 cases, which revealed an increase in the relative and absolute embodied carbon emissions of buildings, with the increase mainly related to the manufacturing and processing of building materials. The percentage of embodied carbon ranges between 20% and 90% of the life cycle carbon from buildings [8]. Second, there is a paucity of data on the embodied carbon of the existing building stock due to the heterogeneous and complex stock of existing buildings at the national scale. Unlike operational energy, which has sufficient data collected from a variety of building types, embodied carbon has fewer case studies and collects data from different building types for comparisons and target setting [9].
As stated in the most recent UN report (Global Status Report for Buildings and Construction), building stock characteristics at a global scale and national level are mostly unavailable, making it highly difficult to track changes in emissions [3]. The residential sector has been referred to as a less defined opportunity, partially because of an insufficient data set and an unreliable assessment of embodied carbon characteristics of the existing building stock. To this extent, this study aims to fill the knowledge gap by (i) assessing the embodied carbon of the existing residential building stock in the United States, (ii) understanding the embodied carbon intensity per building type and the primary building assembly’s contribution to embodied carbon, and (iii) evaluating the emission mitigation strategies for residential buildings along with their reduction potential. A progressive scenario was established with employed mitigation strategies to be compared to the baseline scenario.
The first contribution of this work is the development of an assessment process and framework that represents the US residential building stock for estimating embodied carbon emissions, and addresses the first limitation encountered in the data sets: the lack of variety of residential building unit types. No comprehensive embodied carbon data for any US residential building types have been published, from single-family detached (SD) houses to large-scale multiple-family apartments. The second contribution of this work addresses the limitation of assessing embodied carbon at the national level as the building stock changes over time. In addition to annual construction, existing building retrofits need to be considered, since renovation activities will increase the embodied carbon. In the United States, around 160 billion ft2 of existing buildings were constructed prior to 1980, meaning those buildings are more than 40 years old and will reach their end of life by 2025 [10]. In the next 5–10 years, the US residential building stock will continue to undergo multiple activities, including renovation, demolition, and new construction. This study provides the first-ever estimation of embodied carbon emission reduction potential using a dynamic building stock.
The paper is organized as follows: Section 2 outlines the existing literature on the embodied carbon of buildings, and the research gaps and needs are identified. Section 3 introduces the research materials and methodology, followed by an explanation of the findings in Section 4. A discussion is provided in Section 5, and conclusions are drawn in Section 6.
2. Research Needs
Early studies focused on the embodied energy of building materials, such as the steel and concrete of actual buildings [11], or of building components and assemblies, such as precast concrete wall panels in Malaysia [12]. Studies on embodied carbon at the whole-building level have been mainly published as case studies on a single building or group of buildings globally. For example, a study of a three-story office building in India found total life cycle carbon emissions to be 450 kgCO2eq/m2 (50 years) [13], which is much lower than previous studies, with emissions of 1300–1510 kgCO2eq/m2 in Sweden, 3010 kgCO2eq/m2 in Finland [14], 930 kgCO2eq/m2 in Thailand [15], and 3340 kgCO2eq/m2 in Italy [16]. This wide range is also reflected in one of the most comprehensive reviews on embodied carbon research, formulted by Chastas and colleagues in 2018, which included 95 case projects globally, with 13% of the cases in the United States [17]. The results showed that normalized embodied carbon emissions of residential buildings varied between 179.3 kgCO2eq/m2 and 1050 kgCO2eq/m2, with emissions related to the operational phase ranging from 156 kgCO2eq/m2 to 4049.9 kgCO2e/m2. Embodied carbon varies from 9% to 80% of the whole life cycle carbon emissions. This wide variation is mainly due to differences in system boundaries [18], life spans, and sources of data used in previous studies [19]. The expansive range of carbon emissions from buildings is not only influenced by the geographic differences across countries, but also by building scale and building construction types, with these differences being reflected within a country.
Table 1 lists the studies that focused on the life cycle carbon emissions of US buildings, with the earliest study being in 1998. Among the studies, five cases concentrated on SDs, and only three were whole-building life cycle studies. The embodied carbon emission intensities of the three studies were 42, 89, and 92 kgCO2eq/m2/yr, respectively, and the studied life spans were 50 and 65 years. However, there are significant limitations affecting the reliability of the results, mainly due to the life cycle inventory data used in the studies. The database used for the three studies are European focused, including ecoinvent and DEAM. To the author’s knowledge, no life cycle carbon studies on other US residential building types exist, including single-family attached houses (townhouses) and multifamily houses. A recently published study on a multistory mixed-use apartment and office building in Oregon only includes life stage A [20]. This extreme lack of studies on the whole-building life cycle embodied carbon (LCEC) of residential buildings reflects an urgent research gap that impacts the effectiveness of US policy on embodied carbon reduction.
An explanation of the life cycle stages (A,B,C and D) of the embodied carbon scope is included in Section 3.1. There are six commonly used pieces of software for embodied carbon assessment: Athena, Gabi, Tally, SimaPro, BEES, EC3, and OneClickLCA. In a previously published paper by the author, detailed information about each program was provided [30]. In general, Athena and Tally provide whole-building assessments and are mostly used by building designers and professional consultants [31].
3. Materials and Methodology
A bottom-up modeling approach is used in this study to create a calculation model that assesses the US residential building stock’s embodied carbon. There are many ways to develop a bottom-up building stock model, with the most common being an archetype approach, where an average building is modeled to represent a segment of the building stock [26], and then a single embodied carbon model is developed for that archetype. This type of approach and model development is well suited to typology studies and building sector-wide studies, since it can link a high-resolution detailed assessment at an individual building level, scale it up, and apply the archetype data to a segment of the building stock. This approach is widely used to model building stock energy consumption [31].
In this study, a three-step approach is used to assess the embodied carbon of the residential building stock in the United States. The first step is to segment the building stock, and the second step is to develop the archetypes representing variations in the segment. The embodied carbon of each archetype is calculated using a life cycle assessment tool (Athena Impact Estimator for Buildings). In the third step, the archetype embodied carbon is then merged with a segment model developed for this study, which is used to assess the embodied carbon for the whole-building stock. Details of each step are discussed in the following sections.
3.1. Definition and System Boundary of Embodied Carbon Study
In this study, the embodied carbon of a building is defined as life cycle embodied carbon (LCEC), also referred to as cradle-to-grave carbon emissions. It includes embodied carbon associated with constructing and maintaining a building during all phases of production (A1–A3), on-site construction (A4–A5), the building in use (B, except utilities in B6 and B7), and the final demolition and disposal (C1–C4) [32,33]. B6 and B7 are operational carbon associated with the energy used to keep the building operating. Other types of embodied carbon definitions and assessments exist in research and practice, which results in different assessments for the same building. As included in Figure 1, two other common definitions of embodied carbon are “cradle to gate” (A1–A3) and “cradle to site” (A1–A5). In addition, there is “gate to gate” (A2–A3), which refers to the life cycle stages from the reception of the raw material at the factory entry gate to the completion of the product at the exit gate [34]. The cradle-to gate analysis often includes a gate-to-gate scope, as well as other life cycle stages [35].
LCEC (cradle to grave) consists of three primary categories: initial embodied carbon (IEC), recurring embodied carbon (REC), and end-of-life embodied carbon (EEC). IEC is the carbon emitted on-site and off-site for building activities, such as construction, on-site prefabrication, transportation, and other related activities (such as site preparation). IEC spans life cycle stages A1–A5. IEC accounts for a significant portion of the total life cycle carbon and can be reduced by decreasing the building’s area, using fewer energy-intensive materials, and optimizing other design strategies (e.g., use of lightweight instead of heavy structure systems) [36]. REC is the carbon emitted during the use stage and is associated with the repair, replacement, refurbishment, and maintenance of the building. REC spans life cycle stages B1–B5. EEC is the carbon emitted during the demolition, deconstruction, transport of deconstructed building assemblies, waste processing, and material disposal. EEC is a type of embodied carbon that today is mainly neglected in tracking and counting mechanisms. IEC and EEC occur once over a building’s lifetime, and REC is influenced and modified by multiple factors (i.e., climatic condition of building site, use condition, and maintenance frequency).
The LCEC can be calculated using Equation (1) [37]:
where LCECb is the cradle-to-grave life cycle embodied carbon of a building, IECb is the initial embodied carbon, and is the recurring carbon of a building product or material (maintenance and repair). is the building type factor: certain building types need more frequent maintenance and repair than others, such as those with swimming pools. is the location (climatic) condition, and EECb is the end-of-life embodied carbon.
3.2. Data and Process
A large building stock is typically heterogeneous, so it is possible to split buildings into segments according to climatic area, dimension, age, or other categories [38]. The data used in this study were downloaded from the 2015 Residential Energy Consumption Survey (RECS) and 2019 American Housing Survey (AHS) [39]. RECS collected data representing 118.2 million housing units in the United States [40]. RECS has information on building physical characteristics, such as building types (e.g., SDs), foundation types, number of stories, wall materials, and roof materials. AHS has information on housing floor area and the number of bedrooms, among others. The data extracted from the two sources were then used to create the embodied carbon profile for the 64 archetypes.
3.2.1. Step One: Segment the Building Stock
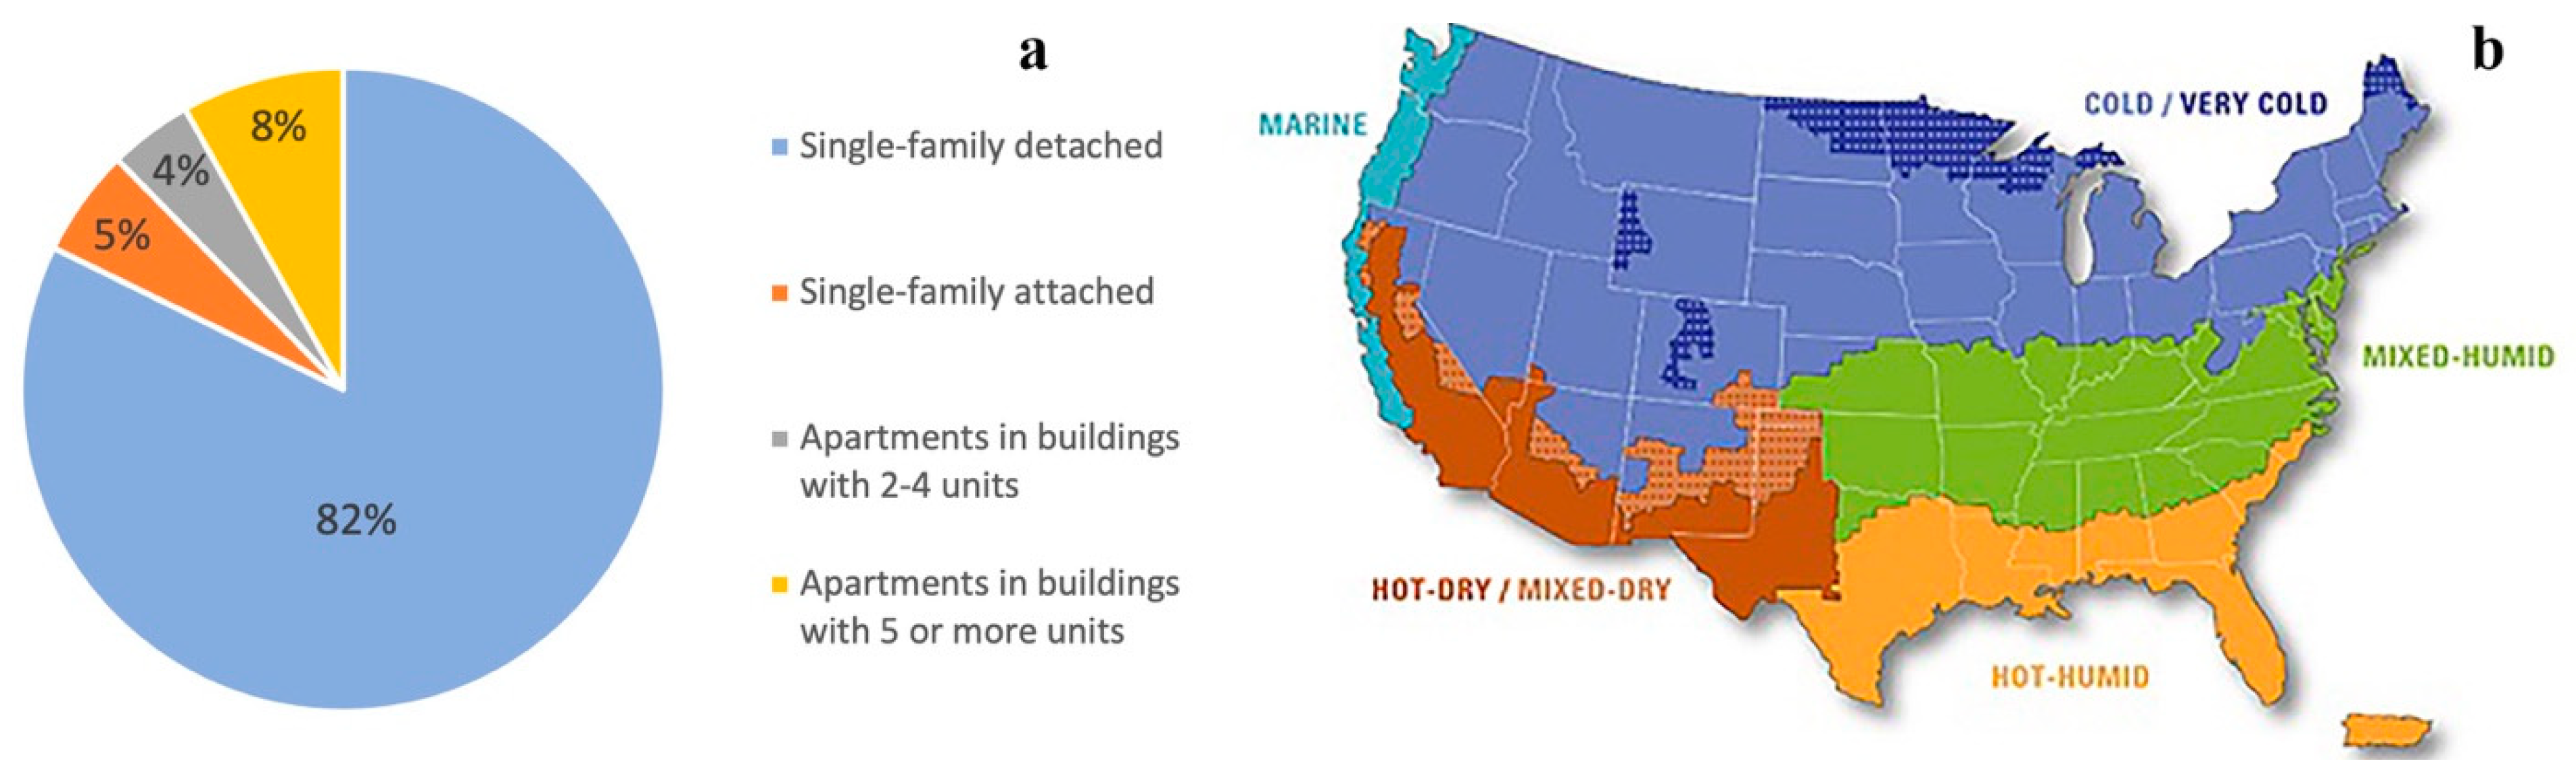
The building stock was first divided into four segments based on building types according to the RECS definitions: single-family detached (SD), single-family attached (SA), multifamily with 2–4 units (MFS), and multifamily with ≥5 units (MFB). Mobile houses were excluded in this study. As illustrated in Figure 2a, SD has the largest share, at 82%. SA, MFS, and MFB account for 6%, 4%, and 8%, respectively. Figure 2b is the climate region map that was published by the US Department of Energy in 2009.
3.2.2. Step Two: Develop the Archetypes
Next, each segment was divided into two subgroups based on the major building construction types: masonry (S1) and wood (S2) for the primary structure. Then, each subgroup was further categorized into eight archetypes based on the eight different exterior wall materials: W1—siding (e.g., aluminum, vinyl, or steel), W2—brick, W3—wood, W4—stucco, W5—concrete or concrete block, W6—shingles, W7—stone, and W8—other materials. Altogether, 64 archetypes were developed to represent building stock physical characteristics. This segmentation does not capture every building characteristic significant to embodied carbon; however, based on the literature and the author’s own assessment experience, these archetypes and characteristics are highly important to embodied carbon counting for two reasons [41,42]. First, the chosen parameters (e.g., masonry vs. wood) were used in many previous studies to specify the embodied carbon profile of buildings [43,44]. Second, those parameters were highly correlated with other important characteristics (e.g., age of the building).
3.2.3. Step Three: Assess the Embodied Carbon of the Building Segment
Two main software tools were used to complete the LCEC calculations for individual archetypes: the Autodesk Revit model to extract the material data and the Athena Impact Estimator for Buildings (IE4B) to assess embodied carbon emissions. IE4B was selected because it is a widely used tool for whole-building life cycle assessment in North America, and IE4B reports carbon emission data that are consistent with the latest US EPA TRACI methodology and comply with the ISO standard for life cycle assessment [45,46]. A process used by the researcher in a previous study was employed in this project [14]. First, three-dimensional virtual models were created in Autodesk Revit for each archetype building based on the information presented in Table 2. Next, a material schedule was created within the Revit model and then exported into an Excel format file. The schedule was simplified to edit out the non-pertinent information and make a clear spreadsheet. The data that were useful to this study included primary and secondary structure systems (e.g., interior walls, columns, floors, and foundations) and the building envelope (e.g., external walls and roof). After the data were brought into the IE4B, the program calculated the LCEC and other environmental impact categories, such as ozone depletion potential and smog formation potential. Once the LCEC of an individual archetype was obtained, the data were then merged with building stock segmentation data. The tool used was MS Excel.
3.3. Scenario Development
Two scenarios were set up with the same baseline socioeconomic growth rate (population growth and built floor area growth) but with different embodied carbon mitigation intervention strategies. Both scenarios explored the embodied carbon emissions between 2022 and 2050, and between 2022 and 2100. Notably, 2050 was chosen according to the Paris Agreement, as the global building and construction sector must almost completely decarbonize by 2050 (including operational carbon and embodied carbon) [47]. Furthermore, 2100 was used based on the scenario described in IPCC’s overshoot pathway: pathways limiting median warming to below 1.5 °C in 2100m and with a 50–67% probability of temporarily overshooting that level earlier, generally imply less than 0.1 °C higher peak warming than below 1.5 °C pathways [48].
The baseline scenario assumes a continuous increase in housing stock and related carbon emissions without mitigation intervention and serves as a reference for understanding the reduction potential of mitigation strategies. The baseline socioeconomic scenario is based on a US Census Bureau report for 2010–2020 [49]. Between 2010 and 2020, the national population growth was 7.4%, and housing units increased by 6.7%. Washington, D.C. was the fastest-growing place for housing growth (18%), followed by Utah (17.5%) and North Dakota (16.7%) [50]. The state- and county-level growth rates were then aggregated by climate region levels for later calculations of embodied carbon distribution in the building stock. The same growth rate described in Table 3 is assumed to continue between 2021 and 2100.
For building stock change over time, the following references were used for the baseline scenario. The rate of new construction remains consistent for all states between 2010 and 2020. The existing building renovation rate is the same as the European Union’s target. It was estimated that the pace of retrofit activities in the United States had to exceed those undertaken in Europe due to the size of the US building stock. However, in the baseline scenario, a conservative target retrofit rate based on the 2010 Energy Performance of Buildings Directive for EU member states was adopted at 3%. For the demolition rate, the building retirement distribution data were extracted from a study sponsored by the Department of Energy and used for the assessment. The demolition rates of single-family and multifamily homes were calculated based on the probability that the retirement of a housing unit occurs after the housing unit has reached a certain age. The following numbers and percentages were used to calculate the demolition rate. For a single-family building, the probability of retirement reaches 50% when the building is over 60 years old, 60% when the building is over 75 years old, 70% when the building is over 85 years old, and 80% when the building is over 100 years old. For multifamily buildings, the probability of retirement reaches 50% when the building is over 35 years old, 60% when the building is over 38 years old, and 80% when the building is over 40 years old [51].
The progressive scenario represents a deep embodied emissions cut through employing all mitigation strategies (refer to the following section for mitigation strategy descriptions) with a higher renovation rate to achieve the overall carbon neutral goal. In the progressive scenario, the new construction growth rate is the same as the baseline scenario, with a renovation rate of 5%. The demolition rate is 5% less than the baseline scenario in all archetypes in all locations.
3.4. Estimation of the Mitigation Rate Consistent with Temperature Rise Prediction
To understand the effectiveness of embodied carbon reduction interventions, six mitigation strategies extracted from previous studies were adopted for this study (refer to Table 4). The mitigation strategies’ effectiveness can be quantified by carbon budget approaches that relate cumulative emissions to the global mean temperature rise [52]. Those strategies are in line with the pathway toward 1.5 °C and 2 °C temperature rise targets.
The mitigation effect was calculated according to the carbon budget (the remaining carbon can be released earlier to achieve carbon neutrality) of the US residential building sector. To determine a sectoral target consistent with the 1.5 °C and 2 °C carbon budgets, four steps were taken. First, the global carbon budget was extracted from the IPCC 1.5 °C special report [56]. This report specifies the remaining carbon budget from 2018 to the time carbon neutrality can be reached (assumedly 2100) to cap the temperature rise at 1.5 °C and 2 °C. The carbon budget for 1.5 °C is estimated for the 33rd (840 Gt CO2), 50th (580 Gt CO2), and 67th (420 Gt CO2) percentiles of transient climate response to cumulative emissions of carbon [14,56]. The carbon budget for 2 °C is estimated for the 33rd (2030 Gt CO2), 50th (1500 Gt CO2), and 67th (1170 Gt CO2) percentiles. Second, the carbon budget for 2018 through 2021 was excluded to obtain the carbon budget from 2022 to 2100. Between 1750 and 2020, the United States contributed 24.5% of total global carbon emissions [57], and in this study, this percentage is assumed to remain until 2100. Third, the building sector’s embodied carbon contribution to global carbon is assumed to continue at the 2021 value (10%), according to the United Nations Environment Programme 2021 report [58]. Residential buildings account for 60% of the total building stock [59]. Therefore, the carbon budget for the US building sector by 2100 can be calculated using Equation (2) listed below. Fourth, mitigation rates were calculated under the determined carbon budgets using the method proposed by Raupach et al. (using Equation (4)). Equation (4) was used to assess persistent carbon emission growth by representing the future emissions of a country or region with an analytic capped-emission trajectory that blends an initially linear growth at a constant rate with an eventual exponential decline at a mitigation rate [60].
where A represents the carbon budget for the US residential building stock, and B signifies the global carbon budget.
A = B × 24.5% × 10% × 60%
4. Results and Findings
4.1. Existing Building Stock Descriptive Statistics
As illustrated in Figure 3a, the largest portion (18%) of housing was built before 1950. More than half (53%) of the buildings were built before 1980, and those buildings are near the end of their service life (without major renovations or upgrades). Regarding construction type (Figure 3b), around 68% of buildings were built with a wood frame, and the ratio is similar among older (<1980s) and newer (>1980s) buildings.
As shown in Figure 3c, a large portion (37%) of the residential building stock is in the cold and very cold climate region (refer to Figure 2b for climate region map). Figure 3d shows that different climate regions have varied combinations of exterior wall construction types, regardless of similarities in the primary construction type (masonry and wood). For example, in the cold and very cold region, most of the exterior wall type is siding, while in the hot–humid region, brick is the primary wall type. These differences can potentially be explained by the climatic conditions and traditions of local construction and material availability.
4.2. Embodied Carbon from the Existing Residential Building Stock
As illustrated in Figure 4a, among the four housing segmentations, SD has the lowest median-normalized carbon emission value (2,221 kg CO2eq/m2), and MFS has the highest value (21,515 kg CO2eq/m2). Within MFS, there is a larger variance of emissions compared to other residential building types, which indicates that a variety of exterior wall and roofing materials were used since the primary construction types of MFS are similar to those of other building types. Although MFS has a high emission value per floor area, the built area is relatively small—only 4% of the total US residential building stock. Therefore, when studying the total carbon emissions by building type (segmentation), MFS accounts for 26%, following SD at 47% (refer to Figure 4b). Furthermore, despite MFB only accounting for 8% of total floor areas, it comprises 24% of total carbon emissions.
Three observations can be drawn from Figure 4b regarding the total LCEC of archetypes in the existing residential building stock. First, the majority of embodied carbon resides in SDs. Among the 16 different archetypes, SD–S2W1 (wood frame with siding) contributes the most emissions, followed by SD–S2W2 (wood frame with exterior brick wall). These two types together represent 45% of SDs’ LCEC, equal to 21% of the total LCEC of the US residential building stock. Second, S1W2 (masonry frame with exterior brick wall) is the primary archetype with the highest carbon emissions for multifamily housing: 24% for MFS and 30% for MFB. When adding up the S1W2 in all building types, this archetype contributes to 18% of the total LCEC of the residential building stock; therefore, it is ranked as the first archetype, with the highest contribution to embodied carbon. S1W2 is followed by S2W2 (16%) and S2W1 (15%). Third, the embodied carbon of SA is negligible compared to other building types. In addition, archetypes S1W6, S1W7, S1W8, S2W6, S2W7, and S2W8 each account for about 1%, due to the small built floor areas.
As illustrated in Figure 5a, when examining the embodied carbon during the whole building’s life span, across all building segments (all archetypes), the product stage (A1–A3) is the primary hot spot: 73–83% of embodied carbon is produced in this stage. Figure 5b shows that the top five archetypes contributing to A1–A3 embodied carbon are MFS-S1W8, MFS-S1W7, MFS-S1W5, MFS-S1W6, and MFS-S1W4. It is essential to understand the building assemblies’ and components’ contribution to embodied carbon so that relative mitigation strategies can be applied in new construction. Instead of investigating all the archetypes, the researcher focused on the archetypes with the highest normalized embodied carbon intensity (kg CO2eq/m2): MFS. Figure 5c reveals that the exterior wall in the building assembly contributes the most carbon emissions, followed by the foundation and floors.
4.3. Baseline Emissions
The baseline scenario sees a continuous increase in building-related carbon emissions because of the growth of the building stock. The trend varies across different building segments (see Figure 6a). MFB sees the largest emissions increase (22%): from 14.93 Gt CO2eq in 2020 to 181.79Gt CO2eq in 2050. SD has the lowest increase (3%): from 2.3 Gt CO2eq in 2020 to 3.37 Gt CO2eq in 2050 (see Figure 6a). Figure 6b indicates the marine region will see the highest increase in embodied emissions from the residential building stock, from a 32% increase from 2020 to 2050, followed by the mixed–dry/hot–dry region (25% increase), cold/very cold region (23% increase), hot–humid region (19% increase), and mixed–humid region (17% increase). In the baseline scenario, SD continues as a dominating segment contributing to embodied emissions. SD-S2W1, SD-S2W2, and MFB-S1W2 are ranked as the top three emitter archetypes due to the large built areas (refer to Figure 6c). The top 10 archetype emitters belong to SD and MFS.
4.4. Carbon Emission Mitigation Strategies
The mitigation potential of a variety of strategies depends on the construction method (practice), the use of building materials, and the use of buildings in different building stock segments. Table 5 shows the reduction potential for each strategy in the progressive scenario (in comparison with the baseline scenario).
Overall, using more lightweight building materials (M3) produces the highest potential cumulative reduction: 26.57 Gt CO2eq. This reduction can be achieved by the adoption of emerging building materials and technologies, such as lightweight structural design (e.g., bamboo) [60], other lightweight materials [61], and the use of high-strength steel and aluminum [62]. The adoption of M3 requires adjustments to and revisions of building codes and requirements to allow the emerging system and materials to be used. Consequently, the effectiveness of M3 hinges on how quickly regulations and codes can catch up.
The use of wood products (e.g., timber) (M4) would result in the second highest carbon reduction potential: 20.19 Gt CO2eq. Wood products are made from low embodied carbon materials and can also provide long-term carbon storage functions [63]. This carbon storage can offset the carbon emitted in life stages A through C. However, the employment of these strategies will vary across regions (state to state) depending on the availability of wood products. The use of timber can be easily adopted in single-family building segments. The newest International Building Code (IBC 2021) has already allowed the use of timber as a primary construction material in high-rise buildings up to 18 stories (Type IV-A) [64]. The adoption will take time as contractors and designers must learn how to design and build all-timber high-rise buildings.
Reducing the built area (M1) has the third highest potential for lowering embodied carbon (15.16 Gt CO2eq), as it simultaneously avoids carbon emissions across all life cycle stages. Reducing the built area can be implemented through increasing multifunctional spaces and efficiently using the existing space. As a consumption-oriented strategy, the efficient use of the existing built stock represents the possibility to decouple the growth of building demand from economic development [65,66].
Extending the useful life span of buildings (M2) yields lower demand for new construction and can result in a total carbon reduction of 13.91 Gt CO2eq (most from SDs). The opportunities for life span extension will not be heterogeneous because the service life of buildings is influenced by many external factors. For example, in harsh climatic regions, the need for repair and replacement is more frequent than in mild conditions.
Recycling and reusing building materials (M5) has the potential to reduce carbon emissions and related environmental impacts (8.78 Gt CO2eq). Recycling and reusing materials can significantly reduce energy use and emissions, avoiding raw material extraction and other early manufacturing emissions. To maximize the potential for recycling, rapid upfront industrial investment is needed to improve the recycling capacity and speed [67,68].
Replacing in situ construction with prefabrication (M6) has been an effective way to reduce carbon emissions at the individual building level [69]; it can lead to a cumulative reduction of 3.73 Gt CO2eq. Prefabrication is defined as a manufacturing process conducted in an off-site (construction site) facility, where various materials are made to form a building assembly for final installation on-site [70]. Prefabrication is suitable for building types with repetitive units (e.g., classrooms). To maximize the adoption of prefabrication, the building design needs to become more modular, which is not applicable to all buildings. Consequently, the extended effectiveness of M6 may be limited.
4.5. Progressive Scenario
The progressive scenario with all mitigation strategies (M1–M6) applied produced a total reduction of 33.13 Gt CO2eq (42%) in the cumulative residential building stock-related carbon emissions for 2022–2050, and a total reduction of 88.34 Gt CO2eq (80%) for 2022–2100 (Figure 7). However, the total reduction in the progressive scenario will not be equivalent to the aggregation of reductions from each of the independent mitigation strategies, since some strategies can be mutually exclusive. For example, if one project decided to use wood products (M4) for the primary structure, then the use of high-strength steel as a primary structure material becomes impossible, and hence M4 and M3 become mutually exclusive. The calculation of a cumulative reduction may avoid double counting. With M1–M6, the progressive scenario will reach a saturation point around 2070, and further revisions are needed to stay consistent with the 2 °C pathway. This saturation point may be caused by a bottleneck of carbon emissions. For instance, using lightweight materials can produce carbon emission reduction to a certain extent, but the ultimate reduction will heavily depend on the type of energy used to produce the materials. As previous studies have indicated, it has been difficult for the energy sector to decarbonize.
Figure 7 shows that for the progressive scenario to be consistent with a 1.5 °C compatible pathway, the US residential building sector needs to investigate additional mitigation strategies since the identified six strategies are not sufficient. To bridge the reduction gap between the 1.5 °C pathway and the progressive scenario, a potential solution involves the combination of new strategies and intensifying the use of identified strategies; for instance, further increasing the percentage of recycled and reused materials. Additional strategies include (i) limiting permits for new construction to further reduce the overall floor space by another 20% [71], (ii) requiring a certain number of modular components for all building types, and (iii) using new types of building materials. For example, building materials with a carbon storage function and potential carbon capture function can help to offset the emitted carbon during production and construction phases [72,73].
5. Discussion
Several major conclusions can be drawn from this study. First, in the United States, most embodied carbon resides in SDs. Strategies to reduce the added embodied carbon of this building type include investigating the need for building new SDs and then determining the appropriate size of the houses. In 2020, the median size of an SD was 2,261 ft2 [74], which is 50% larger than its 1970 counterpart. Meanwhile, household size has decreased by 16% since 1940 [75]. As demonstrated in the progressive scenario, the mitigation strategy M1 (reduce the built area) is an effective strategy; therefore, altering the trend of the growing size of SDs can play an important role.
Second, differences in climate regions contribute to the embodied carbon. The largest portion (37%) of the US residential building stock is located in the cold and very cold climate region, and the projected growth rate for the following decades is 23%. If the trend continues, then implementation policies and incentives in this region that promote the adoption of mitigation strategies can be a potential focus of local jurisdictions to avoid exceeding the carbon budget.
Third, in the future, the focus should be on creating a regulatory environment that can promote carbon emission reduction through choosing less carbon-intense materials. Among the six mitigations included in the progressive scenarios, the top two (M3,M4) are related to building materials. Replacing embodied carbon-intensive buildings with low-embodied carbon materials (e.g., wood, lightweight steel) is a solution that aligns with previous studies [35]. Utilizing different building materials requires regulatory support as well (e.g., building codes and standards). For instance, wood construction is not widely allowed for high-rise buildings, and lightweight steel and concrete are not widely accepted as an alternative construction method.
Fourth, the most carbon emission-intense residential building type is small multifamily housing with 2–4 units. Furthermore, the building exterior wall is the building assembly contributing the most carbon emissions across all building types. This finding can be used by building design professionals and regulators to create targeted solutions.
The contributions of this study can be described in three areas: (a) at the data level, the archetypes created in this study can be used by researchers for a further examination of customized carbon emission mitigation for different residential building types; (b) at the methodology level, the proposed process and model created can be utilized for studying other building stocks; and (c) at the empirical evidence level, the findings can be adopted to help policy makers and regulators make informative decisions in pursuit of embodied carbon emission reduction.
This study has three major limitations. First, mobile homes were excluded from the study, and thus the results do not present a complete depiction of the residential building stock. Aligned with the limitation of building types included, the archetypes created for this study present the general conditions of the building stock and may miss unique building types. Second, the building assemblies’ data used to assess the embodied carbon of each archetype had low resolution. Assumptions have been made about the construction types and materials used, which may lead to miscounting. Third, the author assumed the following to be constant for the next decades: the percentage of the United States’ contribution to global emissions, the percentage of the building sector’s contribution to carbon emissions, and the percentage of residential buildings’ contribution to building sector emissions. Therefore, further sensitivity analyses should be conducted to study different scenarios.
6. Conclusions
This research establishes a method and model to assess the embodied carbon of the residential building stock in the United States. Sixty-four archetypes were created to present the residential building stock, and two scenarios were established to assess the effectiveness of six carbon emission mitigation strategies that align with the 1.5 °C and 2 °C pathways. Findings indicate that SDs are the top contributor to embodied carbon in the United States, and small multifamily houses are the most embodied carbon-intense building type. Overall, the findings show that additional mitigation strategies or a large reduction from the identified strategies are needed. While the progressive scenario produces a carbon emission reduction of 42%, it still exceeds the carbon budget for a 1.5 °C pathway.
The proposed method supports the development of a statistically representative data set of the whole-building LCEC results of a large building stock. With the created archetypes and assessment model, the analysis of embodied carbon trends and the effectiveness of mitigation strategies can be performed, allowing more detailed policies to be made based on the analysis results. The baseline and progressive scenario results can be used as a foundation to form a practical goal to achieve the carbon emission reduction budget.
Funding
This research received no external funding.
Institutional Review Board Statement
Not applicable.
Informed Consent Statement
Not applicable.
Data Availability Statement
Data is available upon request.
Conflicts of Interest
The author declares no conflict of interest.
Nomenclature
| RECS | Residential Energy Consumption Survey |
| SD | Single-family detached |
| SA | Single-family attached |
| MFS | Multifamily 2–4 units |
| MFB | Multifamily ≥ 5 units |
| AHS | American Housing Survey |
| LCEC | Life cycle embodied carbon |
References
- U.S. Department of Housing and Urban Development. National Comprehensive Housing Market Analysis. Available online: https://www.huduser.gov/PORTAL/ushmc/chma_archive.html (accessed on 20 June 2022).
- The National Association of Home Builders. Housing Economics Forecasts. Available online: https://www.nahb.org/news-and-economics/housing-economics/forecasts (accessed on 20 June 2022).
- United National Environment Programme. 2021 Global status report for buildings and construction. Available online: https://globalabc.org/sites/default/files/2021-10/2021%20Buildings-GSR%20-%20Executive%20Summary%20ENG.pdf (accessed on 20 June 2022).
- Mata, É.; Kalagasidis, A.S.; Johnsson, F. Building-stock aggregation through archetype buildings: France, Germany, Spain and the UK. Build. Environ. 2014, 81, 270–282. [Google Scholar] [CrossRef]
- Streicher, K.N.; Padey, P.; Parra, D.; Bürer, M.C.; Patel, M.K. Assessment of the current thermal performance level of the Swiss residential building stock: Statistical analysis of energy performance certificates. Energy Build. 2018, 178, 360–378. [Google Scholar] [CrossRef]
- Alves, T.; Machado, L.; de Souza, R.G.; de Wilde, P. Assessing the energy saving potential of an existing high-rise office building stock. Energy Build. 2018, 173, 547–561. [Google Scholar] [CrossRef]
- Röck, M.; Saade, M.R.M.; Balouktsi, M.; Rasmussen, F.N.; Birgisdottir, H.; Frischknecht, R.; Habert, G.; Lützkendorf, T.; Passer, A. Embodied GHG emissions of buildings–The hidden challenge for effective climate change mitigation. Appl. Energy 2020, 258, 114107. [Google Scholar] [CrossRef]
- Hu, M.; Esram, N.W. The Status of Embodied Carbon in Building Practice and Research in the United States: A Systematic Investigation. Sustainabilty 2021, 13, 12961. [Google Scholar] [CrossRef]
- US Energy Information Administration. Residential Energy Consumption Survey (RECS). May 2018. Available online: https://www.eia.gov/consumption/residential/data/2015/hc/php/hc10.1.php (accessed on 31 March 2021).
- US Energy Information Administration. Commercial Buildings Energy Consumption Survey (CBECS). May 2016. Available online: https://www.eia.gov/consumption/commercial/data/2012/bc/cfm/b34.php (accessed on 12 June 2022).
- Lee, B.; Trcka, M.; Hensen, J.L. Embodied energy of building materials and green building rating systems—A case study for industrial halls. Sustain. Cities Soc. 2011, 1, 67–71. [Google Scholar] [CrossRef]
- Omar, W.M.; Doh, J.H.; Panuwatwanich, K.; Miller, D. Assessment of the embodied carbon in precast concrete wall panels using a hybrid life cycle assessment approach in Malaysia. Sustain. Cities Soc. 2014, 10, 101–111. [Google Scholar] [CrossRef]
- Sharma, A.; Shree, V.; Nautiyal, H. Life cycle environmental assessment of an educational building in Northern India: A case study. Sustain. Cities Soc. 2012, 4, 22–28. [Google Scholar]
- Junnila, S.; Horvath, A.; Guggemos, A.A. Life-cycle assessment of office buildings in Europe and the United States. J. Infrastruct. Syst. 2006, 12, 10–17. [Google Scholar] [CrossRef]
- Kofoworola, O.F.; Gheewala, S.H. Environmental life cycle assessment of a commercial office building in Thailand. Int. J. Life Cycle Assess. 2008, 13, 498–511. [Google Scholar] [CrossRef]
- Blengini, G.A. Life cycle of buildings, demolition and recycling potential: A case study in Turin, Italy. Build. Environ. 2009, 44, 319–330. [Google Scholar] [CrossRef]
- Chastas, P.; Theodosiou, T.; Kontoleon, K.J.; Bikas, D. Normalising and assessing carbon emissions in the building sector: A review on the embodied CO2 emissions of residential buildings. Build. Environ. 2018, 130, 212–226. [Google Scholar] [CrossRef]
- Islam, H.; Jollands, M.; Setunge, S. Life cycle assessment and life cycle cost implication of residential buildings—A review. Renew. Sustain. Energy Rev. 2015, 42, 129–140. [Google Scholar] [CrossRef]
- Plank, B.; Streeck, J.; Virág, D.; Krausmann, F.; Haberl, H.; Wiedenhofer, D. From resource extraction to manufacturing and construction: Flows of stock-building materials in 177 countries from 1900 to 2016. Resour. Conserv. Recycl. 2022, 179, 106122. [Google Scholar] [CrossRef]
- Liang, S.; Gu, H.; Bergman, R.; Kelley, S.S. Comparative life-cycle assessment of a mass timber building and concrete alternative. Wood Fiber Sci. 2020, 52, 217–229. [Google Scholar] [CrossRef]
- Blanchard, S.; Reppe, P. Life Cycle Analysis of a Residential Home in Michigan; Technical Report No. CSS98-05; Center for Sustainable Systems-University of Michigan: Ann Arbor, MI, USA, 1998. [Google Scholar]
- Keoleian, G.A.; Blanchard, S.; Reppe, P. Life-cycle energy, costs, and strategies for improving a single-family house. J. Ind. Ecol. 2000, 4, 135–156. [Google Scholar] [CrossRef]
- Marceau, M.L.; Gajda, J.; VanGeem, M.G.; Gentry, T.; Nisbet, M.A. Partial environmental life cycle inventory of a concrete masonry house compared to a wood frame house. RD Ser. 2002, 2465–2466. [Google Scholar]
- Scheuer, C.; Keoleian, G.A.; Reppe, P. Life cycle energy and environmental performance of a new university building: Modeling challenges and design implications. Energy Build. 2003, 35, 1049–1064. [Google Scholar] [CrossRef]
- Kahhat, R.; Crittenden, J.; Sharif, F.; Fonseca, E.; Li, K.; Sawhney, A.; Zhang, P. Environmental impacts over the life cycle of residential buildings using different exterior wall systems. J. Infrastruct. Syst. 2009, 15, 211–221. [Google Scholar] [CrossRef]
- Bilec, M.M.; Ries, R.J.; Matthews, H.S. Life-cycle assessment modeling of construction processes for buildings. J. Infrastruct. Syst. 2010, 16, 199–205. [Google Scholar] [CrossRef]
- Thiel, C.L.; Campion, N.; Landis, A.E.; Jones, A.K.; Schaefer, L.A.; Bilec, M.M. A materials life cycle assessment of a net-zero energy building. Energies 2013, 6, 1125–1141. [Google Scholar] [CrossRef]
- Mosteiro-Romero, M.; Krogmann, U.; Wallbaum, H.; Ostermeyer, Y.; Senick, J.S.; Andrews, C.J. Relative importance of electricity sources and construction practices in residential buildings: A Swiss-US comparison of energy related life-cycle impacts. Energy Build. 2014, 68, 620–631. [Google Scholar] [CrossRef]
- Meneghelli, A. Whole-building embodied carbon of a North American LEED-certified library: Sensitivity analysis of the environmental impact of buildings materials. Build. Environ. 2018, 134, 230–241. [Google Scholar] [CrossRef]
- Rodriguez, B.X.; Huang, M.; Lee, H.W.; Simonen, K.; Ditto, J. Mechanical, electrical, plumbing and tenant improvements over the building lifetime: Estimating material quantities and embodied carbon for climate change mitigation. Energy Build. 2020, 226, 110324. [Google Scholar] [CrossRef]
- Reyna, J.; Wilson, E.; Satre-Meloy, A.; Egerter, A.; Bianchi, C.; Praprost, M.; Speake, A.; Liu, L.; Parker, A.; Horsey, R.; et al. US Building Stock Characterization Study: A National Typology for Decarbonizing US Buildings. Part. 1: Residential Buildings; Technical Report No. NREL/TP-5500-81186; National Renewable Energy Lab. (NREL): Golden, CO, USA, 2021.
- Kavgic, M.; Mavrogianni, A.; Mumovic, D.; Summerfield, A.; Stevanovic, Z.; Djurovic-Petrovic, M. A review of bottom-up building stock models for energy consumption in the residential sector. Build. Environ. 2010, 45, 1683–1697. [Google Scholar] [CrossRef]
- Tuominen, P.; Holopainen, R.; Eskola, L.; Jokisalo, J.; Airaksinen, M. Calculation method and tool for assessing energy consumption in the building stock. Build. Environ. 2014, 75, 153–160. [Google Scholar] [CrossRef]
- Wang, D.; Landolt, J.; Mavromatidis, G.; Orehounig, K.; Carmeliet, J. CESAR: A bottom-up building stock modelling tool for Switzerland to address sustainable energy transformation strategies. Energy Build. 2018, 169, 9–26. [Google Scholar] [CrossRef]
- Hu, M. A Building life-cycle embodied performance index—The relationship between embodied energy, embodied carbon and environmental impact. Energies 2020, 13, 1905. [Google Scholar] [CrossRef]
- Hu, M. Net Zero Energy Building: Predicted and Unintended Consequences; Routledge: Abingdon, UK, 2019. [Google Scholar]
- Kavitha, S.; Banu, J.R.; Arulazhagan, P.; Gunasekaran, M. Environmental impacts and sustainability assessment of food loss and waste valorization: Value chain analysis of food consumption. In Food Waste to Valuable Resources; Academic Press: Cambridge, MA, USA, 2020; pp. 359–388. [Google Scholar]
- Li, M.; Subramaniam, B. LCA for Green Chemical Synthesis—Terephthalic Acid. 2017, pp. 387–396. Available online: https://www.researchgate.net/publication/315854215_LCA_for_Green_Chemical_Synthesis-Terephthalic_Acid (accessed on 9 August 2022).
- Pomponi, F.; Moncaster, A. Embodied carbon mitigation and reduction in the built environment—What does the evidence say? J. Environ. Manag. 2016, 181, 687–700. [Google Scholar] [CrossRef]
- Ballarini, I.; Corgnati, S.P.; Corrado, V. Use of reference buildings to assess the energy saving potentials of the residential building stock: The experience of TABULA project. Energy Policy 2014, 68, 273–284. [Google Scholar] [CrossRef]
- United States Census Bureau. American Housing Survey. Available online: https://www.census.gov/programs-surveys/ahs.htmlv (accessed on 9 February 2022).
- U.S. Energy Information Administrative. Residential Energy Consumption Survey (2015). Available online: https://www.eia.gov/consumption/residential/about.php (accessed on 10 February 2022).
- Department of Energy. Building Science-Based Climate Maps. Available online: https://www.energy.gov/sites/default/files/2014/01/f6/4_3a_ba_innov_buildingscienceclimatemaps_011713.pdf (accessed on 30 January 2022).
- Langevin, J.; Reyna, J.L.; Ebrahimigharehbaghi, S.; Sandberg, N.; Fennell, P.; Nägeli, C.; Laverge, J.; Delghust, M.; Mata, É.; Van Hove, M.; et al. Developing a common approach for classifying building stock energy models. Renew. Sustain. Energy Rev. 2020, 133, 110276. [Google Scholar] [CrossRef]
- Shimoda, Y.; Sugiyama, M.; Nishimoto, R.; Momonoki, T. Evaluating decarbonization scenarios and energy management requirement for the residential sector in Japan through bottom-up simulations of energy end-use demand in 2050. Appl. Energy 2021, 303, 117510. [Google Scholar] [CrossRef]
- De Wolf, C.; Pomponi, F.; Moncaster, A. Measuring embodied carbon dioxide equivalent of buildings: A review and critique of current industry practice. Energy Build. 2017, 140, 68–80. [Google Scholar] [CrossRef]
- Vigon, B.W.; Vigon, B.W.; Harrison, C.L. Life-Cycle Assessment: Inventory Guidelines and Principles; US Environmental Protection Agency: Cincinnati, OH, USA, 1993.
- Hu, M.; Cunningham, P.; Gilloran, S. Sustainable design rating system comparison using a life-cycle methodology. Build. Environ. 2017, 126, 410–421. [Google Scholar] [CrossRef]
- Zhong, X.; Hu, M.; Deetman, S.; Steubing, B.; Lin, H.X.; Hernandez, G.A.; Harpprecht, C.; Zhang, C.; Tukker, A.; Behrens, P. Global greenhouse gas emissions from residential and commercial building materials and mitigation strategies to 2060. Nat. Commun. 2021, 12, 1–10. [Google Scholar] [CrossRef] [PubMed]
- Rogelj, J.; Shindell, D.; Jiang, K.; Fifita, S.; Forster, P.; Ginzburg, V.; Handa, C.; Kheshgi, H.; Kobayashi, S.; Kriegler, E.; et al. 2018: Mitigation Pathways Compatible with 1.5 °C in the Context of Sustainable Development. In Global Warming of 1.5 °C. An IPCC Special Report on the Impacts of Global Warming of 1.5 °C above Pre-Industrial Levels and Related Global Greenhouse Gas Emission Pathways, in the Context of Strengthening the Global Response to the Threat of Climate Change, Sustainable Development, and Efforts to Eradicate Poverty; Masson-Delmotte, V., P. Zhai, H.-O., Pörtner, D., Roberts, J., Skea, P.R., Shukla, A., Pirani, W., Moufouma-Okia, C., Péan, R., Pidcock, S., et al., Eds.; Available online: https://pure.iiasa.ac.at/id/eprint/15716/1/SR15_TS_High_Res.pdf (accessed on 9 February 2022).
- United States Census Bureau. 2020 Population and Housing State Data. Available online: https://www.census.gov/library/visualizations/interactive/2020-population-and-housing-state-data.html (accessed on 9 February 2022).
- United States Census Bureau. Growth in Housing Units Slowed in the Last Decade. Available online: https://www.census.gov/library/stories/2021/08/growth-in-housing-units-slowed-in-last-decade.html (accessed on 9 February 2022).
- Moura, M.C.P.; Smith, S.J.; Belzer, D.B. 120 years of US residential housing stock and floor space. PLoS ONE 2015, 10, e0134135. [Google Scholar]
- Rogelj, J.; Shindell, D.; Jiang, K.; Fifita, S.; Forster, P.; Ginzburg, V.; Handa, C.; Kheshgi, H.; Kobayashi, S.; Kriegler, E.; et al. Mitigation pathways compatible with 1.5 C in the context of sustainable development. In Global Warming of 1.5 °C; Intergovernmental Panel on Climate Change: Geneva, Switzerland, 2018; pp. 93–174. [Google Scholar]
- Hertwich, E.; Lifset, R.; Pauliuk, S.; Heeren, N.; Ali, S.; Tu, Q.; Ardente, F.; Berrill, P.; Fishman, T.; Kanaoka, K.; et al. Resource Efficiency and Climate Change: Material Efficiency Strategies for a Low-Carbon Future; United Nations International Resource Panel (IRP): Nairobi, Kenya, 2020. [Google Scholar]
- Milford, R.L.; Pauliuk, S.; Allwood, J.M.; Muüller, D.B. The roles of energy and material efficiency in meeting steel industry CO2 targets. Environ. Sci. Technol. 2013, 47, 3455–3462. [Google Scholar] [CrossRef]
- Hao, J.L.; Cheng, B.; Lu, W.; Xu, J.; Wang, J.; Bu, W.; Guo, Z. Carbon emission reduction in prefabrication construction during materialization stage: A BIM-based life-cycle assessment approach. Sci. Total Environ. 2020, 723, 137870. [Google Scholar] [CrossRef]
- Collins, M.; Knutti, R.; Arblaster, J.; Dufresne, J.L.; Fichefet, T.; Friedlingstein, P.; Gao, X.; Gutowski, W.J.; Johns, T.; Krinner, G.; et al. Long-term climate change: Projections, commitments and irreversibility. In Climate Change 2013—The Physical Science Basis: Contribution of Working Group I to the Fifth Assessment Report of the Intergovernmental Panel on Climate Change; Cambridge University Press: Cambridge, UK, 2013; pp. 1029–1136. [Google Scholar]
- Union of Concerned Scientists. Each Country’s Share of CO2 Emission. Available online: https://www.ucsusa.org/resources/each-countrys-share-co2-emissions (accessed on 9 February 2022).
- United Nations Environment Programme. 2021 Global Status Report for Buildings and Construction: Towards a Zero-Emission, Efficient and Resilient Buildings and Construction Sector. Nairobi. 2021. Available online: https://www.unep.org/resources/report/2021-global-status-report-buildings-and-construction (accessed on 9 February 2022).
- Construction Physics. Every Building in America-an Analysis of the US Building Stock. Available online: https://constructionphysics.substack.com/p/every-building-in-america-an-analysis (accessed on 1 February 2022).
- Raupach, M.R.; Davis, S.J.; Peters, G.P.; Andrew, R.M.; Canadell, J.G.; Ciais, P.; Friedlingstein, P.; Jotzo, F.; Van Vuuren, D.P.; Le Quéré, C. Sharing a quota on cumulative carbon emissions. Nat. Clim. Chang. 2014, 4, 873–879. [Google Scholar] [CrossRef]
- Yu, D.; Tan, H.; Ruan, Y. A future bamboo-structure residential building prototype in China: Life cycle assessment of energy use and carbon emission. Energy Build. 2011, 43, 2638–2646. [Google Scholar] [CrossRef]
- Nadoushani, Z.S.M.; Akbarnezhad, A. Effects of structural system on the life cycle carbon footprint of buildings. Energy Build. 2015, 102, 337–346. [Google Scholar] [CrossRef]
- Wang, P.; Ryberg, M.; Yang, Y.; Feng, K.; Kara, S.; Hauschild, M.; Chen, W.Q. Efficiency stagnation in global steel production urges joint supply-and demand-side mitigation efforts. Nat. Commun. 2021, 12, 1–11. [Google Scholar] [CrossRef] [PubMed]
- Churkina, G.; Organschi, A.; Reyer, C.P.; Ruff, A.; Vinke, K.; Liu, Z.; Reck, B.K.; Graedel, T.E.; Schellnhuber, H.J. Buildings as a global carbon sink. Nat. Sustain. 2020, 3, 269–276. [Google Scholar] [CrossRef]
- Structure Magazine. Groundbreaking: Tall Mass Timber Construction Types Included in 2021 IBC. Available online: https://www.structuremag.org/?p=14545 (accessed on 31 January 2022).
- Wang, Q.; Wang, X. Moving to economic growth without water demand growth—A decomposition analysis of decoupling from economic growth and water use in 31 provinces of China. Sci. Total Environ. 2020, 726, 138362. [Google Scholar] [CrossRef]
- Dodoo, A.; Gustavsson, L.; Sathre, R. Carbon implications of end-of-life management of building materials. Resour. Conserv. Recycl. 2009, 53, 276–286. [Google Scholar] [CrossRef]
- Liu, G.; Bangs, C.E.; Müller, D.B. Stock dynamics and emission pathways of the global aluminium cycle. Nat. Clim. Chang. 2013, 3, 338–342. [Google Scholar] [CrossRef]
- Mao, C.; Shen, Q.; Shen, L.; Tang, L. Comparative study of greenhouse gas emissions between off-site prefabrication and conventional construction methods: Two case studies of residential projects. Energy Build. 2013, 66, 165–176. [Google Scholar] [CrossRef]
- Teng, Y.; Pan, W. Estimating and minimizing embodied carbon of prefabricated high-rise residential buildings considering parameter, scenario and model uncertainties. Build. Environ. 2020, 180, 106951. [Google Scholar] [CrossRef]
- Robati, M.; Oldfield, P.; Nezhad, A.A.; Carmichael, D.G.; Kuru, A. Carbon value engineering: A framework for integrating embodied carbon and cost reduction strategies in building design. Build. Environ. 2021, 192, 107620. [Google Scholar] [CrossRef]
- Andersen, J.H.; Rasmussen, N.L.; Ryberg, M.W. Comparative life cycle assessment of cross laminated timber building and concrete building with special focus on biogenic carbon. Energy Build. 2022, 254, 111604. [Google Scholar] [CrossRef]
- United States Census. Highlights of Annual 2020 Characteristics of New Housing. Available online: https://www.census.gov/construction/chars/highlights.html (accessed on 24 January 2022).
Figure 1.
Embodied carbon definition and life cycle stages (adapted from [35]).
Figure 1.
Embodied carbon definition and life cycle stages (adapted from [35]).

Figure 2.
(a) Building type breakdown, and (b) US climate region map [9].
Figure 2.
(a) Building type breakdown, and (b) US climate region map [9].

Figure 3.
US residential building stock characteristics: (a) building age, (b) construction type, (c) housing stock segmentation per climate region, and (d) exterior wall types.
Figure 3.
US residential building stock characteristics: (a) building age, (b) construction type, (c) housing stock segmentation per climate region, and (d) exterior wall types.
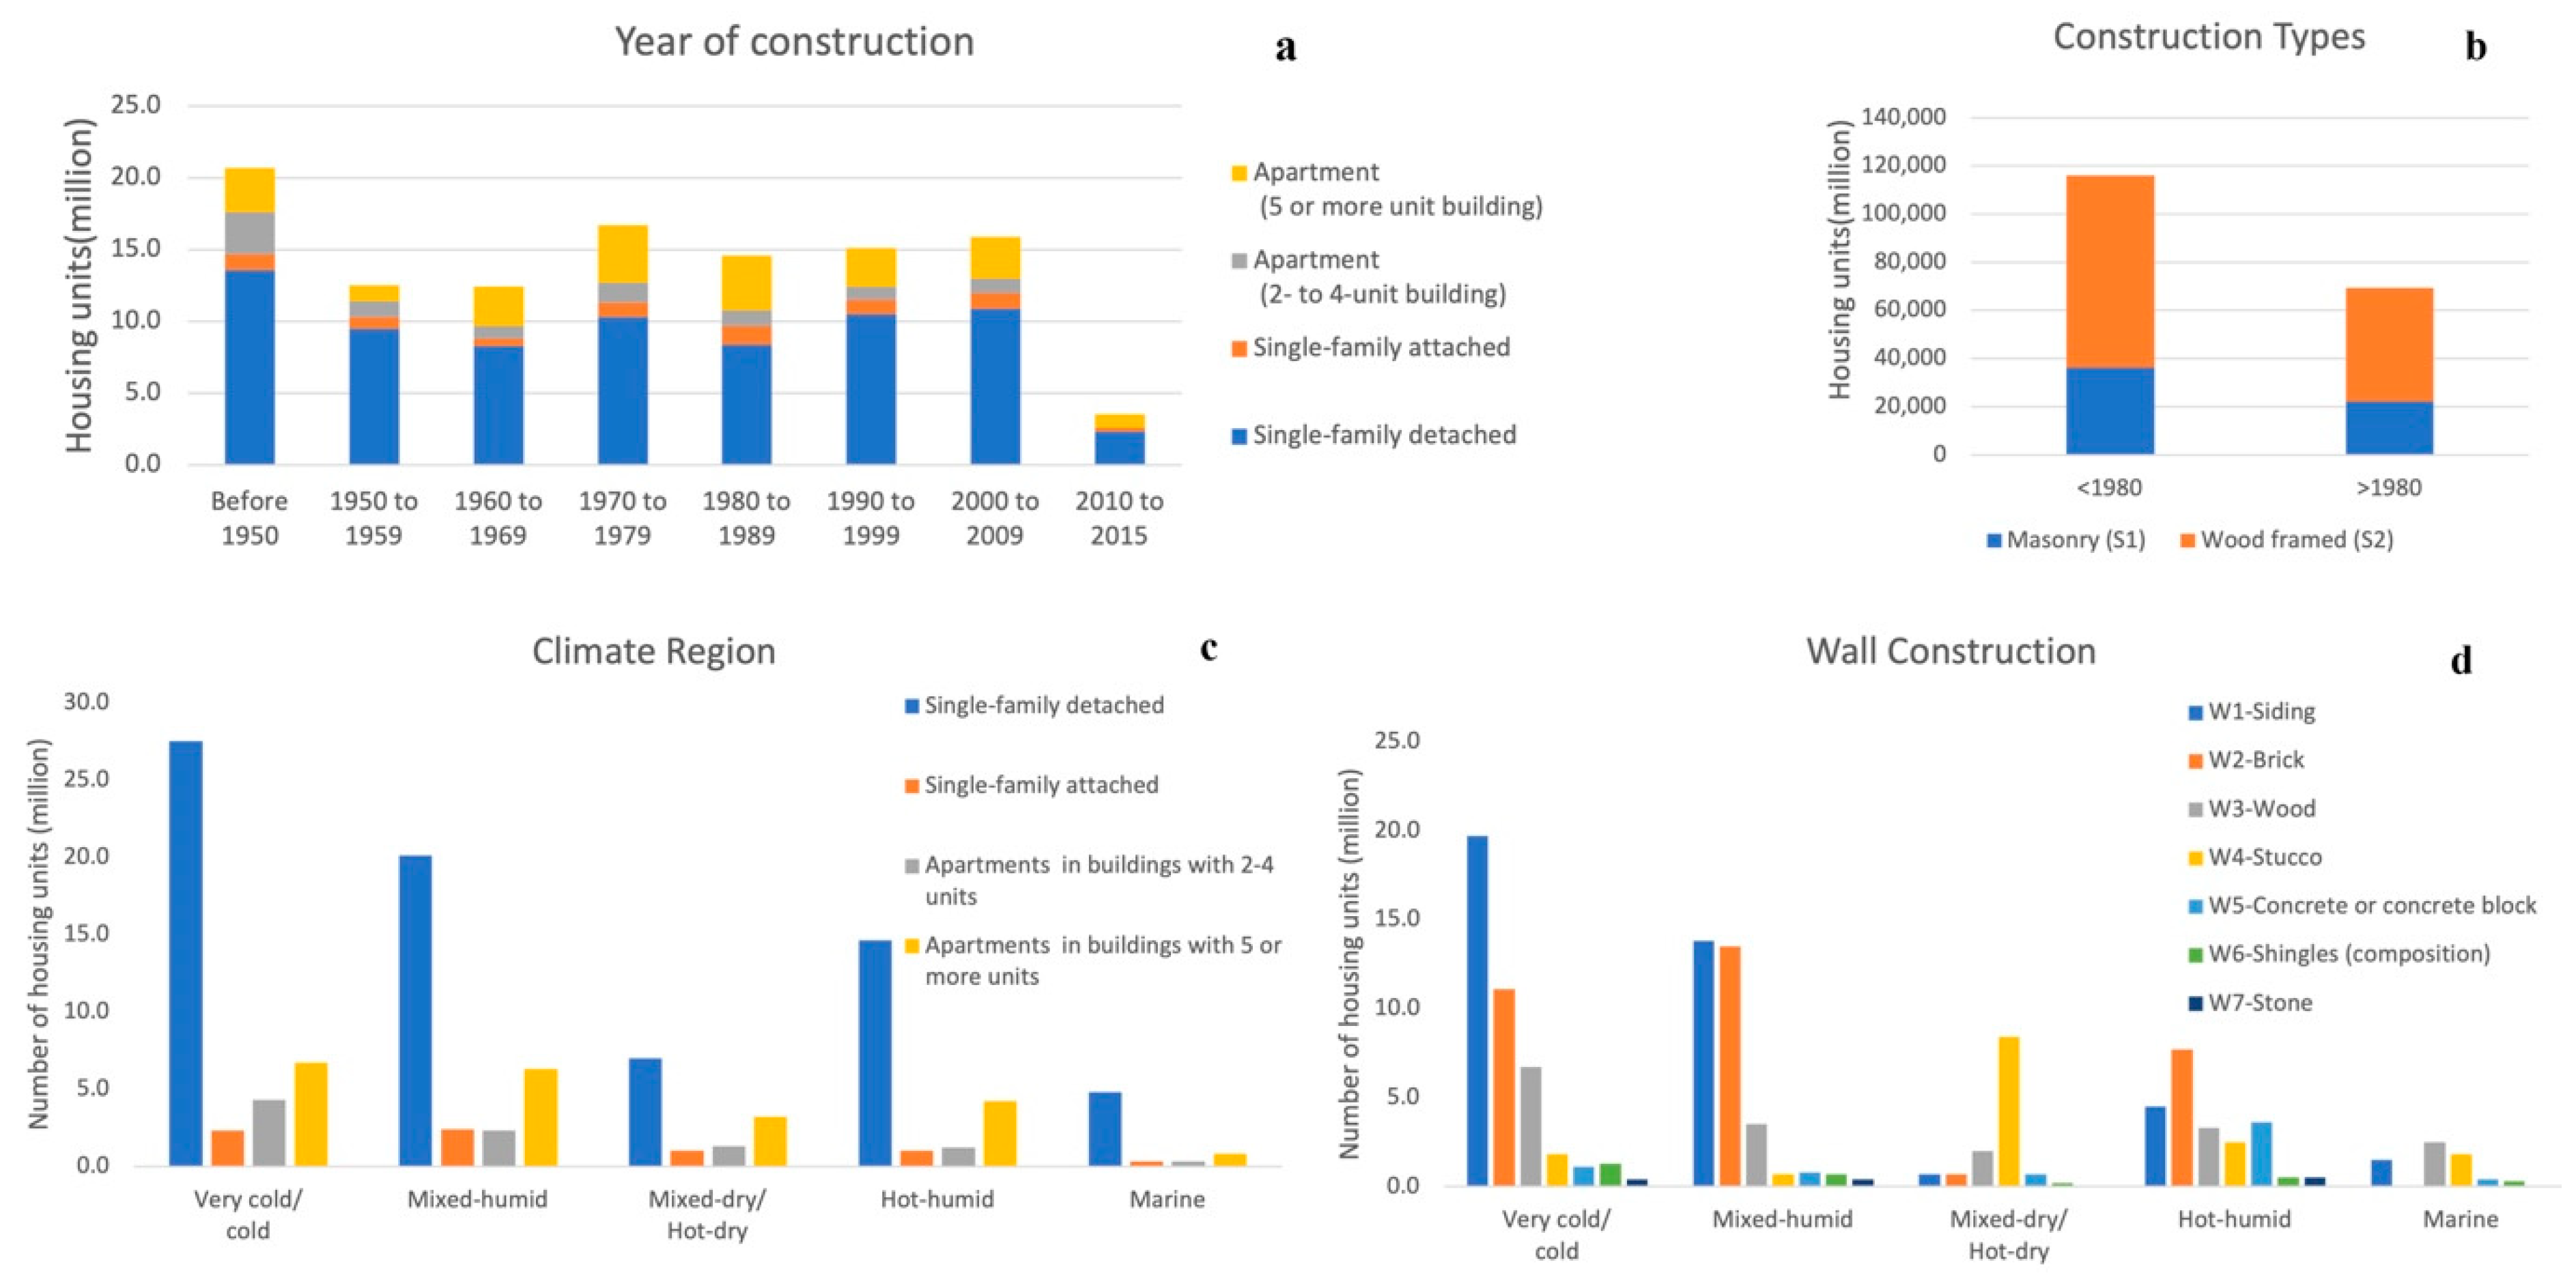
Figure 4.
LCEC in the existing US residential building stock: (a) normalized emissions per building type, and (b) emissions per archetype per housing segment.
Figure 4.
LCEC in the existing US residential building stock: (a) normalized emissions per building type, and (b) emissions per archetype per housing segment.
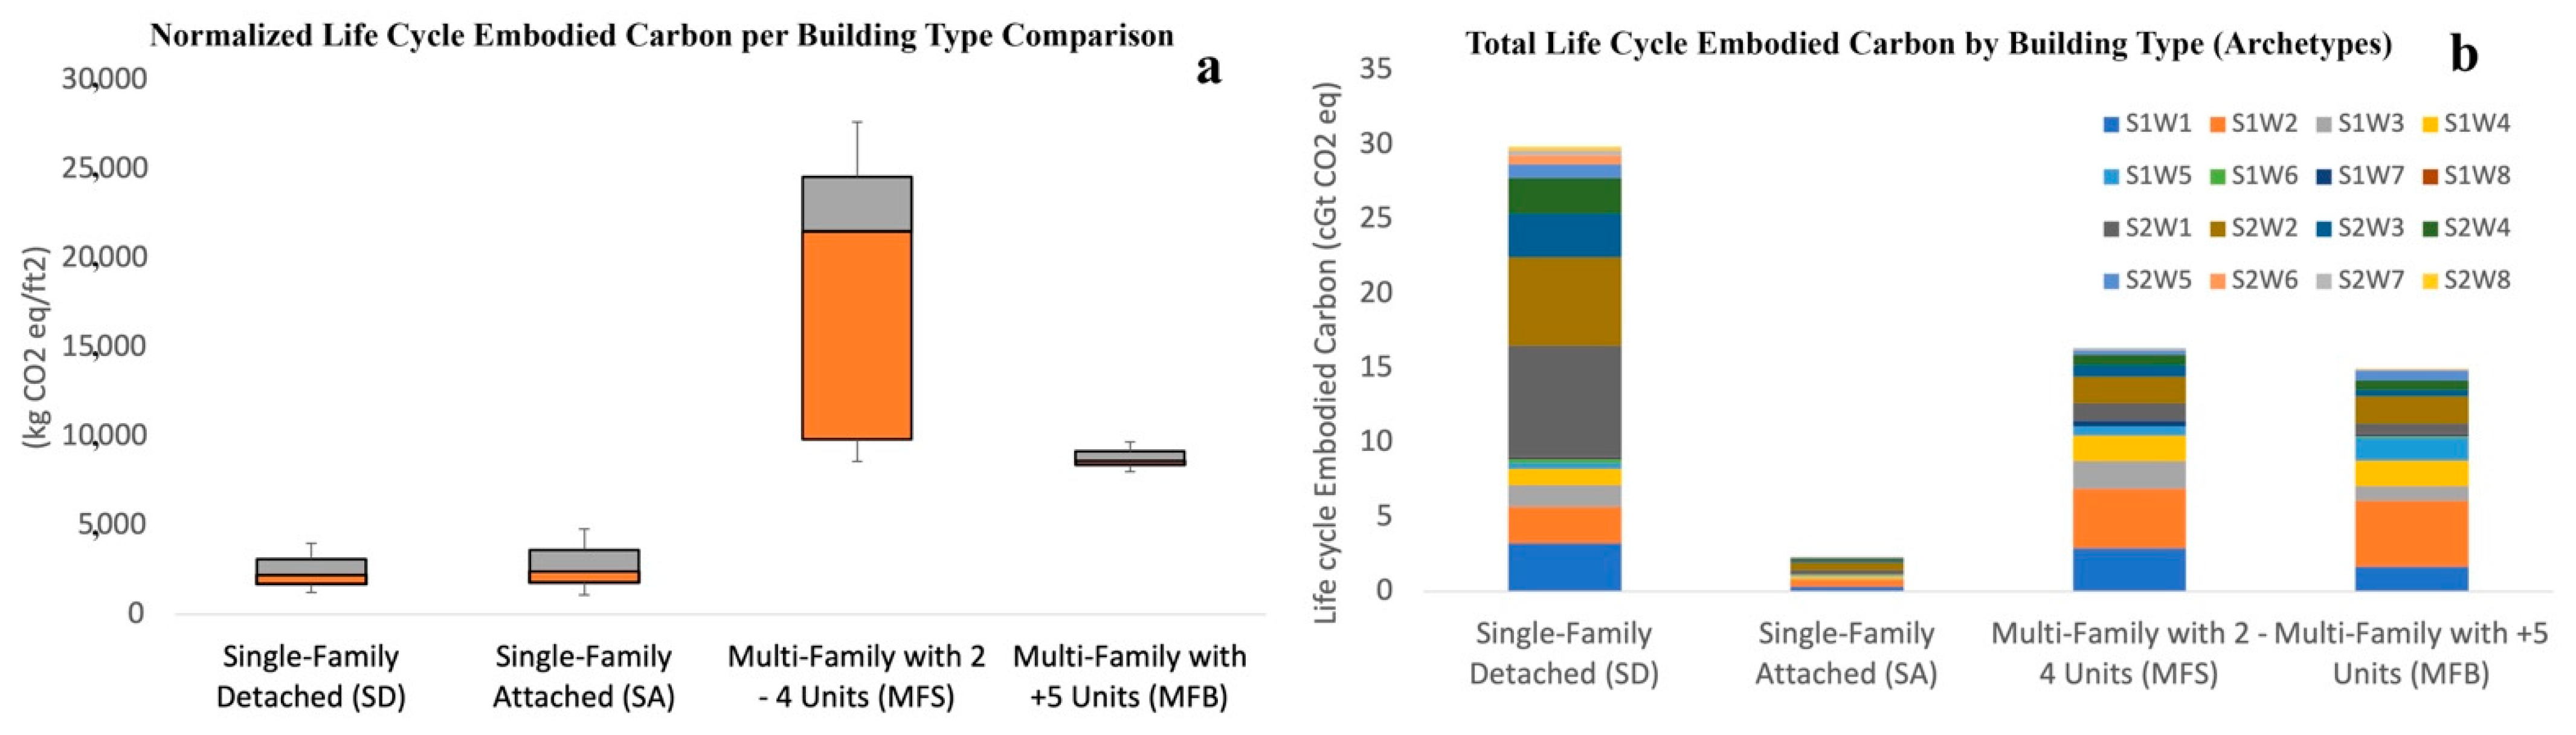
Figure 5.
LCEC of the existing building stock: (a) LCEC per life cycle stage, (b) LCEC per archetype, and (c) LCEC per building assembly.
Figure 5.
LCEC of the existing building stock: (a) LCEC per life cycle stage, (b) LCEC per archetype, and (c) LCEC per building assembly.

Figure 6.
Embodied carbon emissions from the US residential building stock in the baseline scenario: (a) per housing segment, (b) per climate region, and (c) by archetype.
Figure 6.
Embodied carbon emissions from the US residential building stock in the baseline scenario: (a) per housing segment, (b) per climate region, and (c) by archetype.

Figure 7.
Residential building stock-related emissions in the baseline and progressive scenarios.


Table 1.
Previous studies of embodied carbon emissions of US buildings.
| Ref. # | Author | Year | State | EC Scope | EC Boundary | ECEI (kgCO2eq/m2/y) | Building Type | Construction | Area (m2) | Life Span | Method/Database Tool |
|---|---|---|---|---|---|---|---|---|---|---|---|
| [21] | Blanchard and Reppe | 1998 | MI | A-C | Whole building | 92 | SD | Wood | 220.5 | 50 | DEAM database (French) |
| [22] | Keoleian et al. | 2000 | MI | A-C | Whole building | 89 | SD | Wood stud | 228 | 50 | Excel sheet/ use mass and emissions factor of materials |
| [23] | Marceau et al. | 2002 | AZ, Fl, WA, IL, DC | A-D | STR only | 23.5–110 | SD | Wood vs. concrete | 203 | 100 | Unknown |
| [24] | Scheuer et al. | 2003 | MI | A-C | Whole building | 185 | ED | Concrete | 7300 | 100 | SimaPro |
| [14] | Junnila et al. | 2006 | IL | A-C | Whole building | 530 | Off | Concrete | Unknown | 50 | Carnegie Mellon tool |
| [25] | Kahhat et al. | 2009 | AZ | A-C | Exterior wall | SD | Compare wall system | 200 | 50 | Athena | |
| [26] | Bilec et al. | 2010 | PA | A-C | Whole building | 116 | Off | Steel | 17280 | 50 | Carnegie Mellon tool/EIO-LCA |
| [27] | Thiel et al. | 2013 | PA | A-C | 390 | Off | Concrete | 22672 | 50 | Unknown | |
| [28] | Mosteiro-Romero et al. | 2014 | NJ | A-C | Whole building | 42 | SD | Wood and concrete | 255 | 65 | IMPACT 2002+ Method/Ecoinvent 2.2 |
| [29] | Meneghel-li | 2018 | IL | A1-B5, excl. A5 | Whole building | 580 | Lib | Concrete and steel | 2410 | 60 | Excel sheet/University of Bath data |
| [30] | Rodriguez et al. | 2020 | WA | A1-A3 | MEP and interior | 40–75 (MEP) 45–135 (IN) | Off | NA | 185–745322 | 50 | EPD |
SD: single-family detached house; Off: office; ED: educational building; Lib: library.
Table 2.
Physical characteristics of archetypes.
| Archetype | Single-Family Detached (SD) | Single-Family Attached (SA) | Multifamily 2–4 Units (MFS) | Multifamily ≥5 Units (MFB) | ||||
|---|---|---|---|---|---|---|---|---|
| Construction Type | S1 | S2 | S1 | S2 | S1 | S2 | S1 | S2 |
| Floor area (ft2) | 2150 | 2184 | 2555 | 2811 | 2815 | 2939 | 15,324 | 15,452 |
| Height/stories | 1 | 1 | 2 | 2 | 3 | 3 | 6 | 6 |
| Number of bedrooms | 3 | 3 | 2 | 2 | 2 | 2 | 2 | 2 |
| Number of windows | 12 | 12 | 8 | 8 | 8 | 8 | 4 | 4 |
| Total area of windows | 96 | 96 | 64 | 64 | 64 | 64 | 32 | 32 |
| Type of window | Double-pane glass w/wood frame | Double-pane glass w/metal frame | Single-pane glass w/metal frame | Single-pane glass w/metal frame | ||||
| Basement | Y | Y | Y | Y | N | N | N | N |
| Foundation | Concrete | |||||||
| Roofing | Shingles (composition or asphalt) | |||||||
| Construction type | S1 | S2 | S1 | S2 | S1 | S2 | S1 | S2 |
| Adequate insulation | Y | Y | Y | Y | Y | Y | Y | Y |
| Wall material | W1–W8 | W1–W6 | W1–W5, W7 | W1–W8 | ||||
Table 3.
Housing growth rate for baseline scenario.
| Climate Region | Housing Growth Rate (%) | Building Segment Makeup |
|---|---|---|
| Cold/Very Cold | 7.19 | SD (67%), SA (6%), MFS (11%), MFB (16%) |
| Mixed–Humid | 5.55 | SD (65%), SA (8%), MFS (7%), MFB (20%) |
| Hot–Humid | 7.64 | SD (56%), SA (8%), MFS (10%), MFB (26%) |
| Hot–Dry/Mixed–Dry | 5.97 | SD (70%), SA (5%), MFS (6%), MFB (20%) |
| Marine | 9.60 | SD (77%), SA (5%), MFS (5%), MFB (13%) |
Table 4.
Mitigation strategies for reducing embodied carbon emissions from the building stock.
| Mitigating Strategies | Description |
|---|---|
| M1—Efficient use of space | The floor area per person is reduced by 20%, thus reducing the built floor area [53] |
| M2—Extended life span | Up to a 90% lifetime extension by 2050 [12] |
| M3—Lightweight materials | Reduce heavyweight materials—steel (19%), metal (19%), and concrete (10%)—by 2050 [12,54] |
| M4—Use of wood products | 10% of building materials are replaced by wood products by 2050 [12] |
| M5—Recycle and reuse | Maximum recycling and reuse rates estimated by 2050 (90% steel, 90% metal, 15% concrete) [13,14] |
| M6— Prefabrication construction | Replaced in situ construction methods with prefabricated components (reduce whole-building carbon by 15%) [55] |
Table 5.
Emission mitigation potential for 2022–2100 by different strategies.
| Mitigation Reduction GT CO2eq | ||||||
|---|---|---|---|---|---|---|
| M1 | M2 | M3 | M4 | M5 | M6 | |
| SD | 12.95 | 1.20 | 3.83 | 9.57 | 6.38 | 1.66 |
| SA | 0.80 | 0.53 | 0.58 | 0.58 | 0.44 | 0.11 |
| MFS | 1.42 | 4.07 | 11.74 | 5.87 | 0.82 | 0.84 |
| MFB | 0 | 8.12 | 10.41 | 4.17 | 1.14 | 1.12 |
Publisher’s Note: MDPI stays neutral with regard to jurisdictional claims in published maps and institutional affiliations. |
© 2022 by the author. Licensee MDPI, Basel, Switzerland. This article is an open access article distributed under the terms and conditions of the Creative Commons Attribution (CC BY) license (https://creativecommons.org/licenses/by/4.0/).
Share and Cite
MDPI and ACS Style
Hu, M. Embodied Carbon Emissions of the Residential Building Stock in the United States and the Effectiveness of Mitigation Strategies. Climate 2022, 10, 135. https://doi.org/10.3390/cli10100135
AMA Style
Hu M. Embodied Carbon Emissions of the Residential Building Stock in the United States and the Effectiveness of Mitigation Strategies. Climate. 2022; 10(10):135. https://doi.org/10.3390/cli10100135
Chicago/Turabian StyleHu, Ming. 2022. "Embodied Carbon Emissions of the Residential Building Stock in the United States and the Effectiveness of Mitigation Strategies" Climate 10, no. 10: 135. https://doi.org/10.3390/cli10100135
Note that from the first issue of 2016, this journal uses article numbers instead of page numbers. See further details here.