
Mapping Open Data and Big Data to Address Climate Resilience of Urban Informal Settlements in Sub-Saharan Africa


1
UFZ—Helmholtz Centre for Environmental Research, Department Urban and Environmental Sociology, Permoser Str. 15, 04318 Leipzig, Germany
2
Department of Social Sciences, Human Services & Criminal Justice, Borough of Manhattan Community College, The City University of New York, New York, NY 10007, USA
3
Institute for Geosciences and Geography, Department of Sustainable Landscape Development, Martin Luther University Halle-Wittenberg, Von-Seckendorff-Platz 4, 06120 Halle (Saale), Germany
*
Author to whom correspondence should be addressed.
Climate 2022, 10(12), 186; https://doi.org/10.3390/cli10120186
Submission received: 27 September 2022
/
Revised: 27 October 2022
/
Accepted: 5 November 2022
/
Published: 22 November 2022
(This article belongs to the Special Issue Climate Change - Achieving the UN Sustainable Development Goals in Urban Contexts)
Abstract
:This perspective paper highlights the potentials, limitations, and combinations of openly available Earth observation (EO) data and big data in the context of environmental research in urban areas. The aim is to build the resilience of informal settlements to climate change impacts. In particular, it highlights the types, categories, spatial and temporal scales of publicly available big data. The benefits of publicly available big data become clear when looking at issues such as the development and quality of life in informal settlements within and around major African cities. Sub-Saharan African (SSA) cities are among the fastest growing urban areas in the world. However, they lack spatial information to guide urban planning towards climate-adapted cities and fair living conditions for disadvantaged residents who mostly reside in informal settlements. Therefore, this study collected key information on freely available data such as data on land cover, land use, and environmental hazards and pressures, demographic and socio-economic indicators for urban areas. They serve as a vital resource for success of many other related local studies, such as the transdisciplinary research project “DREAMS—Developing REsilient African cities and their urban environMent facing the provision of essential urban SDGs”. In the era of exponential growth of big data analytics, especially geospatial data, their utility in SSA is hampered by the disparate nature of these datasets due to the lack of a comprehensive overview of where and how to access them. This paper aims to provide transparency in this regard as well as a resource to access such datasets. Although the limitations of such big data are also discussed, their usefulness in assessing environmental hazards and human exposure, especially to climate change impacts, are emphasised.
1. Mapping Open and Big Data in African Cities
1.1. Urban Expansion in African Countries and Its Influence on Informal Settlements
Sub-Saharan African (SSA) cities are among the fastest growing urban areas in the world. According to United Nations (UN) estimates, more than 50% of the African population will live in cities by 2030. To put it in perspective, the population will have doubled from almost 1.2 billion in 2021 to more than 2.5 billion in 2050 [1]. This continued growth puts immense pressure on major urban areas in SSA to provide basic services such as permanent housing, water and sanitation, jobs, learning opportunities and access to health care for their residents. On the other side of this growth, the UN [2] warns that there is a proliferation of informal settlements within and around major cities and this creates environmental hazards for the poor urban residents. It is therefore imperative that efforts be made to stabilise and, if possible, improve the resilience and quality of life in urban areas, especially in informal settlement zones.
1.2. The Value of Open and Big Data for Fostering Information Processes
In a rapidly evolving data-driven economy, as in most African countries, the role of openly available multisource Earth Observation (EO) and other big data cannot be underestimated when building urban resilience and creating opportunities to find solutions to urgent environmental pressures related to urbanisation processes and population growth, as well as accessibility of resources and utilisation problems. Recent research [3,4,5] shows how resilience is enhanced through the use of big data analyses. They improve the speed and effectiveness of linking disaster information and systemic responses. Geospatial data is made available through various access points, ranging from crowdsourcing to traditionally established sources. To this end, modern infrastructures provide timely data access and easily accessible data sources, which in turn facilitate data analysis and support reliable evidence-based decision-making in SSA.
A starting point for this type of decision-making is the provision of freely available data, i.e., open data, on land cover, land use, environmental hazards, and pressures, as well as on demographic and socio-economic indicators of urban areas. Since the responsible authorities, interest groups and organisations usually do not have this information, access to open and freely available data is significant. This is because in most parts of SSA, critical landscape and environmental information is often sparse, and at worst non-existent, and certainly not suitable for sophisticated and complex analyses [6,7]. In particular, the problem of data availability is a major impediment to assessing environmental resilience in the region. This increases the need for easily accessible open EO and big data to address urban issues in SSA.
This perspective paper focuses on the provision of context-specific open and big data sources, access options, usage guidelines and dependencies for the organisation of different sources in any big data ventures in SSA. We show which data is available where, how to access it, and which dimensions of resilience could be considered when using the different data sources. Beyond that, we also explore the barriers to be anticipated in the use of these open data sources, as well as suggest which data sources could present opportunities for developing urban resilience against climate related environmental hazards like flooding. These narratives and guidelines are provided within the broader context of the Belmont Forum funded DREAMS Project.
2. The Dreams Project
African cities and urban agglomerations face significant challenges in achieving the UN Sustainable Development Goals (SDG). Even though there are official planning systems for many SSA countries, the trajectory of urban developments is often out of governmental control, especially in informal settlements of major cities where growth is largely driven by informal social networks [8,9]. These informal settlements account for 570 million slum dwellers, in which about 238 million out of whom represent 23% living in a critical habitat in or around major cities in SSA [2,10,11]. They often develop when rural migrants and original inhabitants of areas undergoing rapid urban growth resort to cheap accommodation in sub-standard and unplanned settlements, to support subsistence livelihoods [12,13]. The transdisciplinary research project ‘DREAMS—Developing Resilient African cities and their urban environMent facing the provision of essential urban SDGs’ seeks to create new sustainability pathways for African cities through participatory scenario modelling, impact assessment and integrated strategic planning. DREAMS is a Belmont Forum-sponsored project and anticipates future development of African cities with regard to key driving forces and their social-ecological influences, as reflected in six Sustainable Development Goals (SDGs) including SDG 3, 5, 6, 11, 13 and 15 (see https://www.eli-web.com/, accessed on 4 November 2022). A key component of the project was the transdisciplinary and cross-continental partnership (SDG 17) of researchers from West Africa (Ghana), East-Africa (Uganda) and Southern Africa (Republic of South Africa), Germany and the United States, with municipal planning authorities, NGOs and traditional leaders in the target cities. The DREAMS project also combines expertise from the natural and social sciences which brings in experience on urban planning processes and methods that embrace Charrettes as a key participatory planning approach for addressing local hotspots where the cooperation between communities and planners is urgently needed [14]. The DREAMS project primarily focuses on existing informal settlements or those under development in three major cities in SSA. These informal settlements are usually located in areas susceptible to climate change impacts such as increased flood intensity. Through the DREAMS project activities, we sought to develop new sustainability pathways increasing the resilience of these informal settlements against such environmental pressures that affect many growing African cities. Data and information derived from these strategies are intended to be bundled and documented as learning blocks for weaker informal systems, while significant inputs for slum upgrades will be communicated to governments for action.
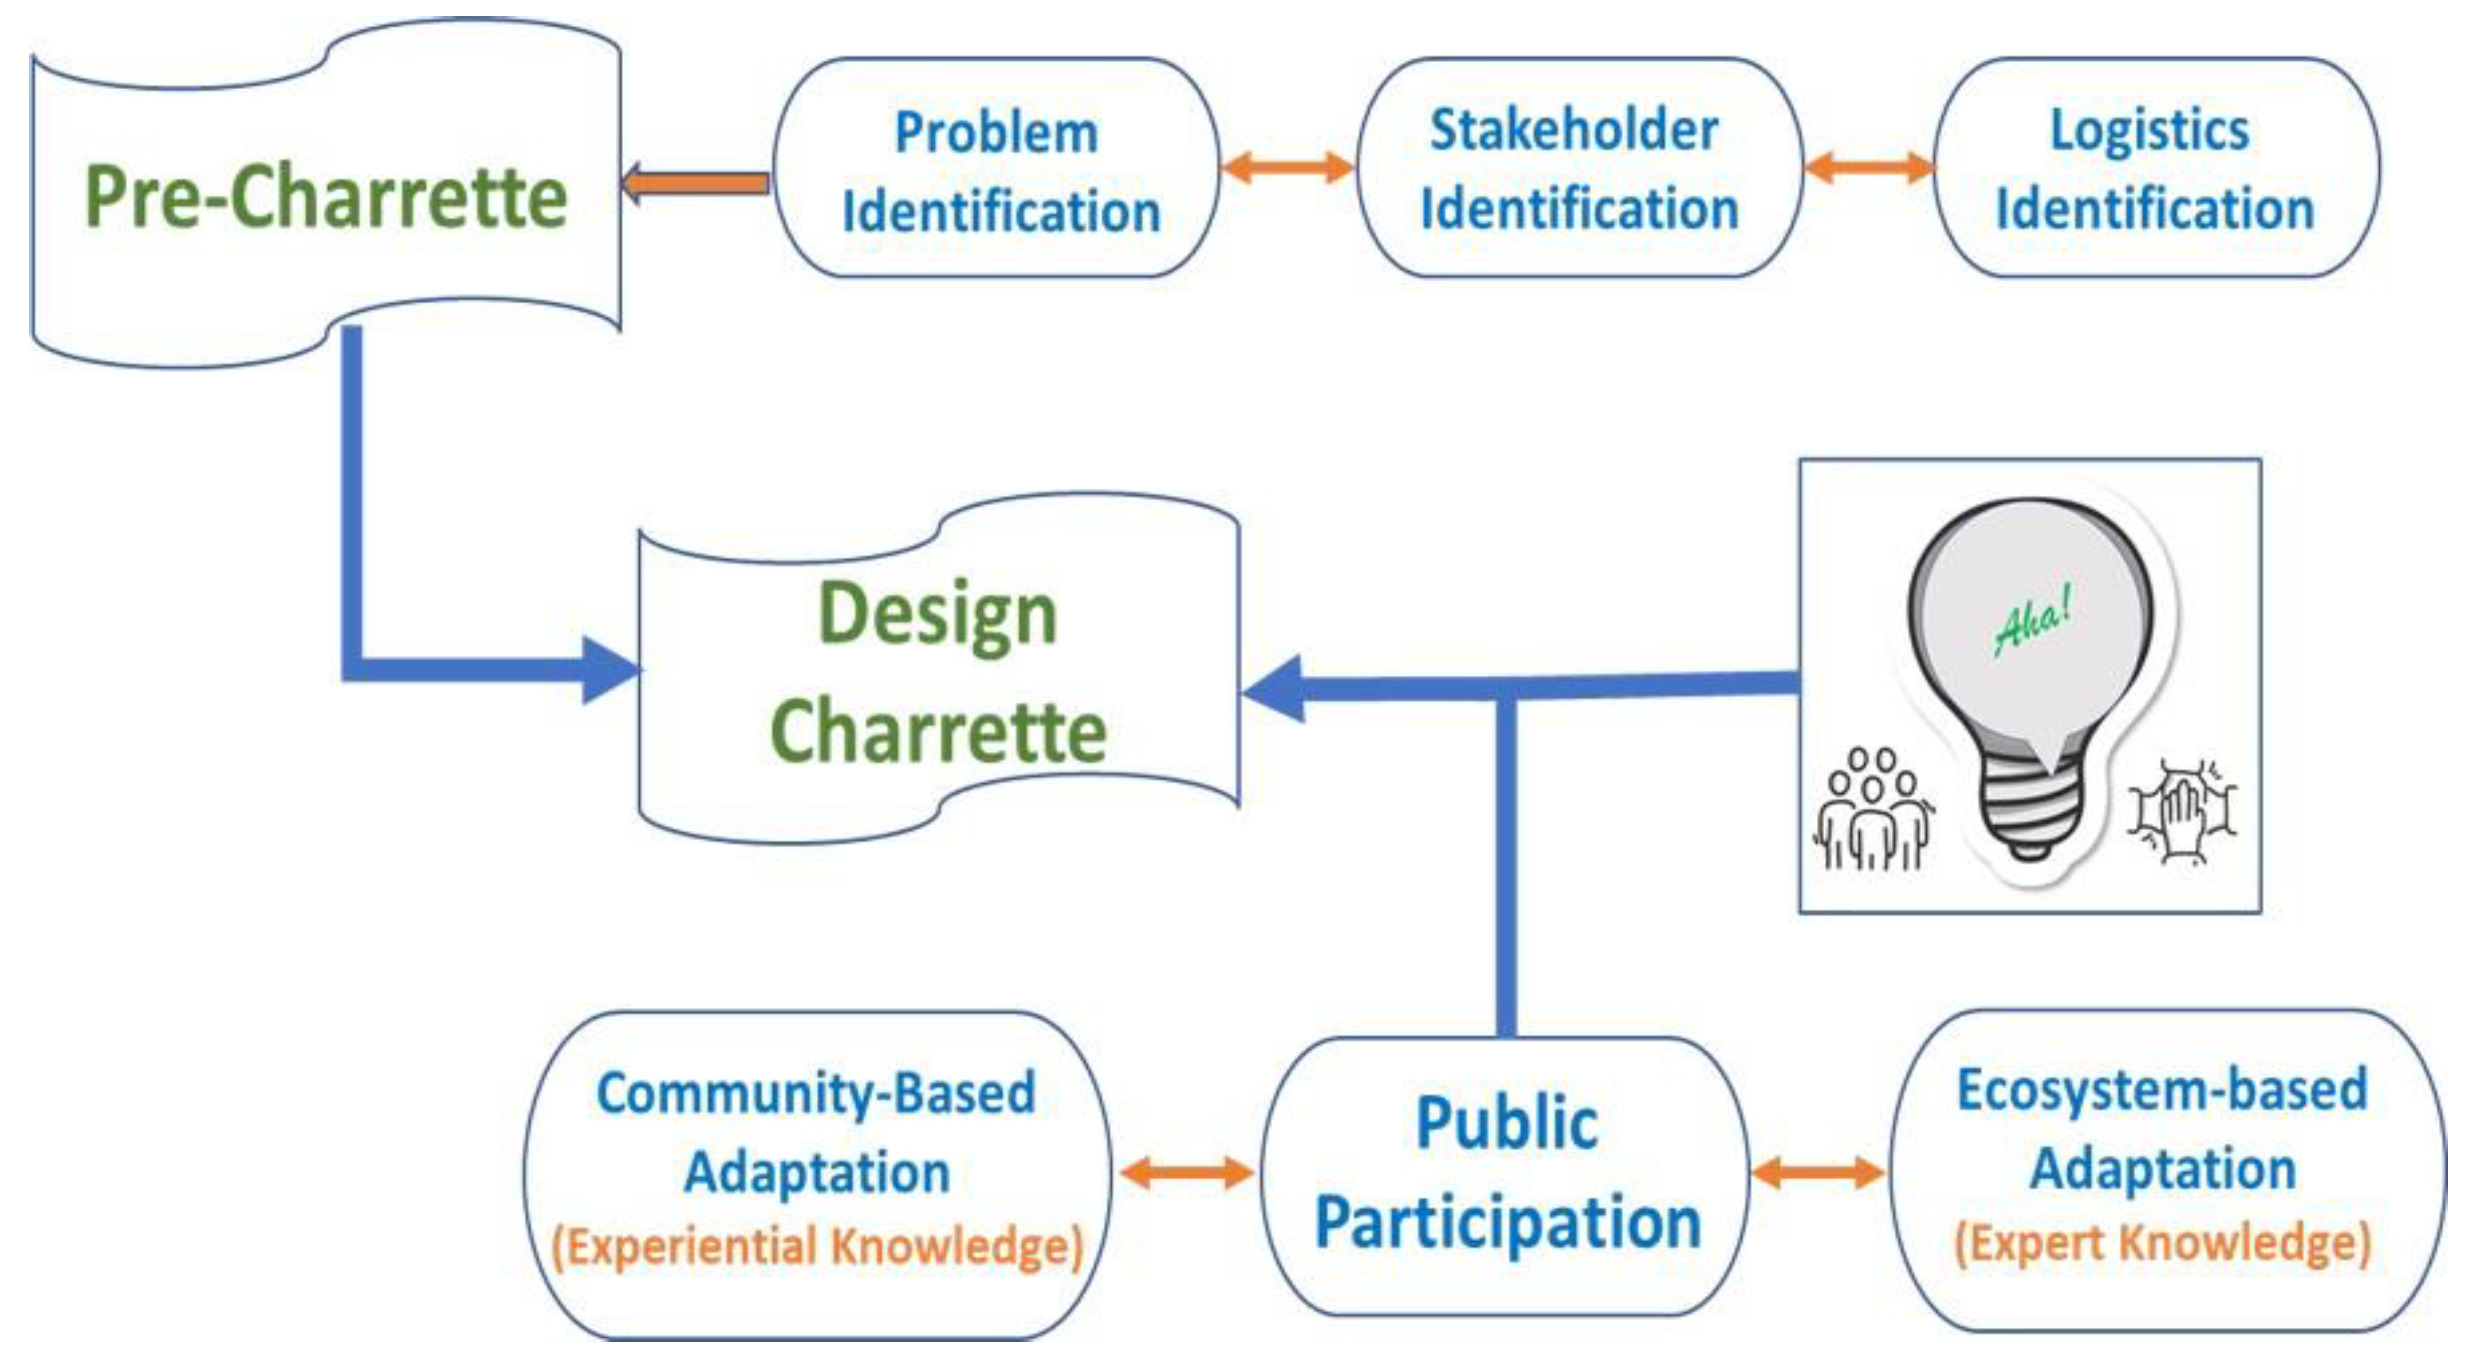
Charrette Approach
The DREAMS project integrates the Charrette process which is essential in risk sensitive planning. It consists of intensive and time-constrained public participatory activities that are usually organised as a sequence of different types of meetings, exchanges, local discussions and syntheses (Figure 1) [14]. Such a process stretches over 9–12 months. An effective Charrette process is premised on essential preliminary work, and these include problem definition, the identification of stakeholders, and the identification of information and physical logistics. It is noteworthy that poor data or obsolete data could lead to poor Charrette design and poor planning outcomes. The Charrette process in the DREAMS project was constrained by the project timeline. For example, the Charrette for target cities in Ghana occurred over a 2-month period, and this was also affected by the lack of relevant information logistics, including updated land use change and environmental data. Hence, publicly and freely available open and big data are vital to understanding urban landscape dynamics with the view of planning for urban growth and resilience, especially informal settlements.
3. Open Data and Big Data as Spatial Information Strategy
3.1. Technical Considerations
The opportunity to use open data and big data has become more popular in recent years. In preparation for the International Geophysical Year of 1957–1958, the open data concept was established, and it focuses on the free availability of data and the resulting advantages of big data due to exponential growth in the amount of EO data and increasing computational power [15]. Both aspects of exponential growth and increasing computation power have become the driving force in most operational sectors in developed and developing countries [16]. For instance, there is a myriad of open data accessible through open scientific publications, open population statistics and open geodata [17,18]. These available geodata often cover the four dimensions of big data: the large volume, recurrence (temporal resolution), variety and veracity. There is the need for new approaches for geospatial data analyses, since resolutions are increasing: finer spatial and spectral scales make more details visible, while a higher temporal resolution enables inter-annual and intra-annual evaluations. Due to this rapid development, centralised cloud computing has become more important to bundle computational power and avoid the duplication of computational-extensive tasks. Over the years, several articles and research projects e.g., [3,5,19,20,21] have focused on specific aspects of big data interventions without necessarily considering the critical aspect of access, processing methods and use for specific interventions that address urban resilience.
3.2. Benefits of Global EO Data for Urban Research
Global EO data offer various opportunities for scientists and public institutions to use the rapidly growing available data infrastructure to improve their strategies for building resilient cities. To address the problem of missing geo-information, satellite-based remote sensing (RS) is often used for EO (see Table 1). Thematic data from RS sensors are commonly exploited not only to map land cover at different spatial scales, but also to monitor landscape change at varying temporal scales. There have been substantive efforts committed into the use of EO data to monitor derived land uses and environmental stressors. A review by Hirschmugl et al. [22] revealed the availability of a wide variety of methods for the detection of forest degradation, for example, in Cameroon and Congo, by using optical EO data. Despite this advancement, similar applications of EO in urban areas face intricate problems of high complexity of underlying spatial heterogeneities and close proximities of the urban systems: mostly, urban morphology and infrastructure. At the same time, urban areas undergo rapid landscape change dynamics compared to other land-cover/land-use types. For this reason, satellite-based EO information is used in various inter- and transdisciplinary fields of urban research, such as environmental management, morphological analysis and population estimation, among others [6,23].
Publicly available geodata play a crucial role in developing resilient cities, especially in regions with smaller urban planning budgets. These datasets can be classified by different means for instance by their format, extent and coverage, a brief description, and relevant categories inherent in the available dataset. We categorise important openly available global and continental scale datasets into four groups: (i) land cover (Table 1), (ii) urban land use (Table 2), (iii) environmental pressures (Table 3) and (iv) demographic information (Table 4). Global scale land-cover data are derived from satellite images and contain information like vegetation or soil types pertaining to international scales. At this scale, it is possible for users to obtain these datasets across national and international boundaries. Urban land-use data focus on structure and functions of cities and settlements and map infrastructure information such as building types. Especially when determining the potential environmental challenges of an urban area, environmental pressure data are indispensable to quantify vulnerabilities like flood risk, heat islands or light pollution. Each dataset has a value in itself, but their usability increases when the information is linked or integrated with other datasets. To visualise data sets of the different subjects, each data set is illustrated by an exemplary map of one of the DREAMS cities (Table 2).
The dynamic and complex socio-ecological problems of urban areas demand integrated approaches. This implies that social or environmental challenges are not addressed as sectoral issues but are tailored across sectors to the complexity of the urban areas under consideration. Environmental pressures are the highest amongst poorer urban residents living in informal settlements that are exposed to environmental risks such as flooding. This requires that EO data should be analysed in a coupled and more holistic way. For example, to understand how urban drainage systems could accommodate flow volumes across different landscapes within the urban system, EO data on land cover and land use (Table 1) can be coupled with soil characteristics, a digital elevation model and river flow data to undertake flood frequency analyses to quantify the impacts of extreme flooding events on informal settlements, often inhabited by poor urban dwellers or squatters. This is very important for the development of flood vulnerability or risk indices which are needed for effective flood mitigation strategies and planning to combat impacts of climate change in SSA.
An important benefit of the use of publicly available data is that spatial information can easily be complemented by demographic information, or linked to socio-demographic indicators of urban resilience. It is important to explore connections across different information types and consider the spatio-temporal dimensions to understand urban environmental risks and threat exposures to urban dwellers in informal settlements. Another benefit of exploiting EO data is that the same piece of information can be stored for each city, for different cities or for different areas within a given city. This is useful for comparing development patterns and dynamics, and for comparing the different degrees of environmental exposure of poorer dwellers in different locations to identify and prioritise well-adapted solutions and climate change mitigation options.
EO data are important to make comparisons between cities of different countries and cities within a country. The same indicators can be compiled from open and big data and integrated with other geo-located data to deepen our understanding of either similar environmental challenges across cities or contrasting situations between them. In this way, analysts and decision-makers can gain better insights into the management of environmental hazards and the effectiveness of risk assessments by evaluating the same spatial information under different scenarios. This again fosters communication between urban planners and stakeholders across different cities and countries in SSA. For example, such environmental risk data could provide useful “information logistics” for the planning and execution of the DREAMS project’s Charrette activities in Ghana.
EO datasets can be compiled to propose new land-cover mapping, tailored to a specific research question, or newly arising environmental threats. Such challenges can include climate change impacts, biodiversity conservation and ecosystem functions and services occurring at different scales, from the local to the international/cross-border levels. The use of EO data also makes urban and spatial planning more effective; it is faster to react or proactively build resilient strategies in the mitigation of the impacts of environmental risks and protection of poor urban dwellers in places such as informal settlements.
3.3. Barriers in EO Application
The use of EO data reaches its limits where high-resolution data are needed but cannot be provided by publicly available data archives, or where data with a much higher temporal resolution would be needed to monitor current problems, such as sudden flash floods or varying intensities of urban heat islands and their impact on local people [24]. The coupling of different datasets from different sources can also be hindered by different spatial resolutions, which then require the aggregation of the higher-quality data, which in turn leads to the loss of vital details. Inconsistent categories of data can be a hindrance. In this case, different datasets must first be harmonised (i.e., the matching of categories) in order to generate a thematic understanding of specific urban dynamics and enable the creation of a detailed map of vulnerable areas, such as informal settlements. They are often located in ecologically sensitive landscapes, such as floodplains [25,26]. Metadata of the categories (e.g., land cover) are therefore particularly important information needed to carry out status analyses. The aforementioned limitations can be addressed by resampling the data or by data fusion, and also by utilising different kinds of downscaling methods [27,28,29,30,31]. This is common for soil and elevation data when undertaking and optimising spatial models to make predictions about urban resilience.
Another kind of limitation is the documentation of data accuracies. Documentation may not easily be found in the metadata, or sometimes they may not exist. This affects the accuracy of the resulting mapping and derived products. Furthermore, the lack of standardisation of the metadata nomenclature hinders cooperation among national institutions, transnational and regional institutions, and makes it difficult to use the data for specific urban interventions or research agenda. Therefore, global or continental institutions that are able to produce, thematically process and provide EO data are responsible for this data harmonisation. A lack of standardisation may limit the opportunity for cross-data adoption in the world of big data [31]. Evaluation products are important to estimate the quality of the mapping methods and related scores. In other cases, the actual temporal and spatial resolution of the available geospatial data may not be compatible with certain specific environmental risk assessments and research questions. This often results in disjoint data management processes and affects the veracity of geospatial data analysis results.
4. Conclusions
Cities in SSA are faced with immense socio-ecological problems due to the projected increases in the rural–urban population shift by 2030. Nowhere is this more pronounced than in informal settlements within urban areas, or on the periphery of cities. The DREAMS project is based on selected cities in Ghana, Uganda and South Africa, and uses a transdisciplinary approach to develop insights to help build resilient and liveable communities, especially in the informal settlements. This involves research on land use changes, planning Charrette workshops and scenario modelling. The success of the DREAMS project is intimately tied to readily available and reliable information, especially Earth observation (EO) data or geodata. In the era of exponential increases in open and big data analytics, especially geospatial information, their usefulness in SSA has been hampered by the disparate nature of these datasets, with no comprehensive overview of where and how to access these datasets. The aim of this contribution is to create transparency regarding these matters, and we have created an online resource (Open Data and Big Data Available for Urban Resilience Assessment in SSA) to serve this purpose.
In the previous sections, we described the four categories of open and big data regarding their sources, access options, and some usage guidelines for both analysts and practitioners in SSA. We highlighted the available datasets and how to access them, in addition to the important resilience dimensions to be considered when using the different data sources to assess environmental risks and conditions. This is critical given the barriers associated with disparate spatial and temporal resolutions of EO data, such as accuracy documentations, data standardisations and others. However, care must be taken to limit the propagation of minor data management errors in the initial phase of analysis tasks, as errors increase exponentially over the cycle of geospatial data analyses and can severely affect the reliability of the results and derivations of EO data. Therefore, users who undertake spatially explicit urban environmental research need to pay attention to the metadata of the multisource EO and other big data. When using open data, uncertainties arising from different formats at different spatial and temporal scales must be adequately taken into account. Nonetheless, the integration of different types of open data and big data, such as the geospatial and socio-economic data presented here, is of great benefit.
Author Contributions
Conceptualization, E.B., H.N.B. and S.E.; methodology, S.E. and J.N.I.; investigation, E.B., H.N.B., J.N.I. and S.E.; data curation, J.N.I. and S.E.; writing—original draft preparation, E.B., H.N.B., J.N.I. and S.E.; writing—review and editing, E.B., H.N.B.; visualization, J.N.I., S.E.; project administration, E.B.; funding acquisition, E.B.; formal analysis, N.A.; supervision, E.B., H.N.B.; validation, N.A. All authors have read and agreed to the published version of the manuscript.
Funding
This research was funded by the Belmont Forum under grant number FU 1000/4-1 Belmont Forum; RA-312/21.
Acknowledgments
We greatly appreciate research through the project DREAMS—Developing Resilient African cities and their urban environment facing the provision of essential urban SDGs (https://www.eli-web.com/DREAMS/index.php?menu=3&article=links&lang=english) accessed on 4 November 2022, which enabled our collaboration. This project has received funding from the Belmont Forum under grant agreement FU 1000/4-1 Belmont Forum; RA-312/21.
Conflicts of Interest
The authors declare no conflict of interest.
References
- United Nations. Revision of World Population Prospects. 2022. Available online: https://population.un.org/wup/ (accessed on 22 July 2022).
- UNSTATS. The Sustainable Development Goals Report; United Nations: New York, NY, USA, 2019; Available online: https://unstats.un.org/sdgs/report/2019/The-Sustainable-Development-Goals-Report-2019.pdf (accessed on 22 October 2022).
- Inkoom, J.N.; Frank, S.; Greve, K.; Fürst, C. A framework to assess landscape structural capacity to provide regulating ecosystem services in West Africa. J. Environ. Manag. 2018, 209, 393–408. [Google Scholar] [CrossRef] [PubMed]
- Kleemann, J.; Inkoom, J.N.; Thiel, M.; Shankar, S.; Lautenbach, S.; Fürst, C. Peri-urban land use pattern and its relation to land use planning in Ghana, West Africa. Landsc. Urban Plan. 2017, 165, 280–294. [Google Scholar] [CrossRef]
- Young, J.C.; Lynch, R.; Boakye-Achampong, S.; Jowaisas, C.; Sam, J.; Norlander, B. Volunteer geographic information in the Global South: Barriers to local implementation of mapping projects across Africa. GeoJournal 2020, 86, 2227–2243. [Google Scholar] [CrossRef] [PubMed] [Green Version]
- Georganos, S. The Use of Very-High-Resolution Earth Observation Satellite Data for Multi-Thematic Urban Mapping in Sub-Saharan Africa. Applications in Population, Household Wealth and Epidemiological Modeling. Thesis. 2021. Available online: https://www.researchgate.net/publication/348686518_The_use_of_very-high-resolution_earth_observation_satellite_data_for_multi-thematic_urban_mapping_in_sub-Saharan_Africa_Applications_in_population_household_wealth_and_epidemiological_modeling (accessed on 22 July 2022).
- World Wide Web Foundation. Open Data Barometer—Leaders Edition; World Wide Web Foundation: Washington, DC, USA, 2022a; Available online: https://opendatabarometer.org/4thedition/regional-snapshot/sub-saharan-africa/ (accessed on 25 July 2022).
- Morgner, C.; Ambole, A.; Anditi, C.; Githira, D. Exploring the Dynamics of Social Networks in Urban Informal Settlements: The Case of Mathare Valley, Kenya. Urban Forum 2020, 31, 489–512. [Google Scholar] [CrossRef]
- Finn, B.M.; Cobbinah, P.B. African urbanisation at the confluence of informality and climate change. Urban Stud. 2022. [Google Scholar] [CrossRef]
- UNDESA. Revision of World Urbanization Prospects. 2018. Available online: https://www.un.org/development/desa/publications/2018-revision-of-world-urbanization-prospects.html (accessed on 12 July 2022).
- Pesaresi, M.; Melchiorri, M.; Siragusa, A.; Kemper, T. Atlas of the Human Planet–Mapping Human Presence on Earth with the Global Human Settlement Layer; JRC103150; Publications Office of the European Union: Luxembourg, 2016; European Commission, DG JRC. [Google Scholar]
- Simiyu, S.; Cairncross, S.; Swilling, M. Understanding Living Conditions and Deprivation in Informal Settlements of Kisumu, Kenya. Urban Forum 2019, 30, 223–241. [Google Scholar] [CrossRef] [Green Version]
- Ono, H.; Kidokoro, T. Understanding the development patterns of informal settlements in Nairobi. Jpn. Arch. Rev. 2020, 3, 384–393. [Google Scholar] [CrossRef]
- Dhar, T.K.; Khirfan, L. Community-based adaptation through ecological design: Lessons from Negril, Jamaica. J. Urban Des. 2016, 21, 234–255. [Google Scholar] [CrossRef]
- Committee on Scientific Accomplishments of Earth Observations from Space, National Research Council. Earth Observations from Space: The First 50 Years of Scientific Achievements; The National Academies Press: Washington, DC, USA, 2008; p. 6. ISBN 978-0-309-11095-2. [Google Scholar] [CrossRef]
- World Wide Web Foundation. Open Data Barometer—Leaders Edition; World Wide Web Foundation: Washington, DC, USA, 2022; Available online: https://opendatabarometer.org (accessed on 25 July 2022).
- BMI. Open-Data-Strategie der Bundesregierung. 2021. Available online: https://www.bmi.bund.de/SharedDocs/downloads/DE/publikationen/themen/moderne-verwaltung/open-data-strategie-der-bundesregierung.pdf?__blob=publicationFile&v=3 (accessed on 22 July 2022).
- European Commission. A European Strategy for Data. 2020. Available online: https://www.assonime.it/Stampa/Documents/SWD_2022_45_1_EN_document_travail_service_part1_v2_tI7BgzIxTJOGvsQzZVHacn6IEVE_83562%20%281%29.pdf (accessed on 20 July 2022).
- Joubert, A.; Murawski, M.; Bick, M. Big Data Readiness Index—Africa in the Age of Analytics. In Proceedings of the 18th Conference on e-Business, e-Services and e-Society (I3E), Trondheim, Norway, 18–20 September 2019; pp. 101–112. Available online: https://hal.inria.fr/hal-02510093/document (accessed on 4 November 2022).
- Wang, X.; Rafa, M.; Moyer, J.D.; Li, J.; Scheer, J.; Sutton, P. Estimation and Mapping of Sub-National GDP in Uganda Using NPP-VIIRS Imagery. Remote Sens. 2019, 11, 163. [Google Scholar] [CrossRef]
- Pritchard, R.; Alexandridis, T.; Amponsah, M.; Ben Khatra, N.; Brockington, D.; Chiconela, T.; Castillo, J.O.; Garba, I.; Gómez-Giménez, M.; Haile, M.; et al. Developing capacity for impactful use of Earth Observation data: Lessons from the AfriCultuReS project. Environ. Dev. 2022, 42, 100695. [Google Scholar] [CrossRef]
- Hirschmugl, M.; Gallaun, H.; Dees, M.; Datta, P.; Deutscher, J.; Koutsias, N.; Schardt, M. Methods for Mapping Forest Disturbance and Degradation from Optical Earth Observation Data: A Review. Curr. For. Rep. 2017, 3, 32–45. [Google Scholar] [CrossRef] [Green Version]
- Palacios-Lopez, D.; Bachofer, F.; Esch, T.; Heldens, W.; Hirner, A.; Marconcini, M.; Sorichetta, A.; Zeidler, J.; Kuenzer, C.; Dech, S.; et al. New Perspectives for Mapping Global Population Distribution Using World Settlement Footprint Products. Sustainability 2019, 11, 6056. [Google Scholar] [CrossRef] [Green Version]
- Huang, X.; Wang, Y. Investigating the effects of 3D urban morphology on the surface urban heat island effect in urban functional zones by using high-resolution remote sensing data: A case study of Wuhan, Central China. ISPRS J. Photogramm. Remote Sens. 2019, 152, 119–131. [Google Scholar] [CrossRef]
- Abunyewah, M.; Gajendran, T.; Maund, K. Profiling Informal Settlements for Disaster Risks. Procedia Eng. 2018, 212, 238–245. [Google Scholar] [CrossRef]
- Yang, J.; Huang, X. The 30 m annual land cover dataset and its dynamics in China from 1990 to 2019. Earth Syst. Sci. Data 2021, 13, 3907–3925. [Google Scholar] [CrossRef]
- Ghamisi, P.; Rasti, B.; Yokoya, N.; Wang, Q.M.; Hofle, B.; Bruzzone, L.; Bovolo, F.; Chi, M.M.; Anders, K.; Gloaguen, R.; et al. Multisource and multitemporal data fusion in remote sensing a comprehensive review of the state of the art. IEEE Geosci. Remote Sens. Mag. 2019, 7, 6–39. [Google Scholar] [CrossRef] [Green Version]
- Schmidli, J.; Frei, C.; Vidale, P.L. Downscaling from GCM precipitation: A benchmark for dynamical and statistical downscaling methods. Int. J. Clim. 2006, 26, 679–689. [Google Scholar] [CrossRef]
- Xu, Z.; Han, Y.; Yang, Z. Dynamical downscaling of regional climate: A review of methods and limitations. Sci. China Earth Sci. 2018, 62, 365–375. [Google Scholar] [CrossRef]
- Zhu, X.; Cai, F.; Tian, J.; Williams, T.K.-A. Spatiotemporal Fusion of Multisource Remote Sensing Data: Literature Survey, Taxonomy, Principles, Applications, and Future Directions. Remote Sens. 2018, 10, 527. [Google Scholar] [CrossRef]
- Acharjya, D.P.; Kauser, A.P. A survey on big data analytics: Challenges, open research issues and tools. Int. J. Adv. Comput. Sci. Appl. 2016, 7. [Google Scholar] [CrossRef]
Figure 1.
Simplified Charrette design as a transdisciplinary model linking ecosystem-based adaptations and community-based adaptations (Modified after Dhar and Khirfan [14]).
Figure 1.
Simplified Charrette design as a transdisciplinary model linking ecosystem-based adaptations and community-based adaptations (Modified after Dhar and Khirfan [14]).

Table 1.
Publicly available dataset revealing different characteristics of land cover.
| Earth Observation Hub | Data Description | Resolution | Illustration | |||
|---|---|---|---|---|---|---|
| Temporal [yrs.] | Spatial [m] | No. of Categories | ||||
| 1 | ESA World cover | ESA https://worldcover2020.esa.int (accessed on 26 September 2022) | It is a very high-resolution 11-class land cover map. | 2020 | 10 | 11 | Cape Town |
| 2 | Copernicus Global Land Service: Land Cover | ESA https://land.copernicus.eu/global/products/lc (accessed on 26 September 2022) | The Climate Change Initiative Land Cover (CCI-LC) consists of a time series of 23-class land cover maps on an annual basis. | 2015–2019 | 100 | 23 | Accra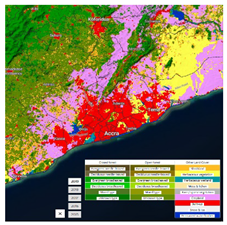 |
| 3 | GlobeLand 30 | Ministry of Natural Resources, China http://www.globallandcover.com (accessed on 26 September 2022) | It is a high-resolution 10-class land cover map. | 2000, 2010, 2020 | 30 | 10 | Kampala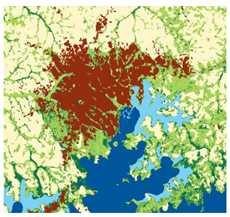 |
| 4 | Climate Change Initiative Land Cover (CCI-LC) https://www.esa-landcover-cci.org/?q=node/164 (accessed on 26 September 2022) | A new time series of consistent global LC maps at 300 m spatial resolution on an annual basis | 1992–2019 | 300 | 23 | Accra, Kampala, Cape Town |
| 5 | Africa LC http://maps.elie.ucl.ac.be/CCI/viewer/index.php (accessed on 26 September 2022) | Represents a prototype high resolution LC map at 20m over Africa based on 1 year of Sentinel-2A observations from December 2015 to December 2016 | 2015–2016 | 20 | 38 | Accra, Kampala, Cape Town |
| 6 | ESRI LC https://www.arcgis.com/apps/instant/media/index.html?appid=fc92d38533d440078f17678ebc20e8e2 (accessed on 26 September 2022) | It provides access to individual 10-meter resolution GeoTIFF scenes for all land masses on the planet, for each year from 2017-2021 | 2017–2021 | 10 | 9 | Global |
| 7 | ESA WorldCover https://viewer.esa-worldcover.org/worldcover/ (accessed on 26 September 2022) | The product provides a global land cover map for 2020 at 10 m resolution based on Sentinel-1 and Sentinel-2 data | 2000 | 10 | 11 | Accra, Kampala, Cape Town |
| 8 | AFRICOVER https://data.review.fao.org/map/catalog/srv/api/records/22eeb8b6-0158-4be3-a35f-be19e51516b8 (accessed on 26 September 2022) | The full resolution dataset of towns was developed from data from the National Imagery and Mapping Agency (NIMA | 1999 | 30 | 23 | Accra, Kampala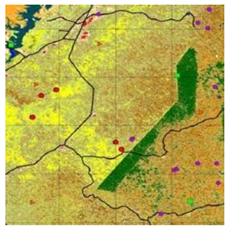 |
Table 2.
Publicly available dataset revealing urban land use in different continents.
| Earth Observation Hub | Data Description | Resolution | Illustration | |||
|---|---|---|---|---|---|---|
| Temporal [yrs.] | Spatial [m] | No. of Categories | ||||
| 1 | World Settlement Footprint Evolution | DLR https://geoservice.dlr.de/web/maps/eoc:wsfevolution (accessed on 26 September 2022) | The World Settlement Footprint (WSF) Evolution is a 30m resolution dataset outlining the global settlement extent on a yearly basis from 1985 to 2015. | 1985–2015 | 30 | 2 | Kampala |
| 2 | World Settlement Footprint | DLR https://www.esa.int/Applications/Observing_the_Earth/Mapping_our_human_footprint_from_space (accessed on 26 September 2022) | The World Settlement Footprint (WSF) 2019 is a 10m resolution binary mask outlining the extent of human settlements globally derived by means of 2019 multitemporal Sentinel-1 (S1) and Sentinel-2 (S2) imagery. | 2015 & 2019 | 10 | 2 | Accra |
| 3 | GHSL - Global Human Settlement Layer https://ghsl.jrc.ec.europa.eu/visualisation.php# (accessed on 26 September 2022) | Open and free data and tools for assessing the human presence on the planet. Data created using satellite, in situ (ground) and model data | 1975–2030 | 20 | 12 | |
| 4 | Building Footprints https://www.microsoft.com/en-us/maps/building-footprints (accessed on 26 September 2022) | Building footprints derived with the aid of ML algorithms on available satellite imagery. | 2020–2021 | - | - | Kampala |
| 5 | Open Buildings https://sites.research.google/open-buildings/#download (accessed on 26 September 2022) | This data repository contains an outline of buildings derived from high-resolution satellite imagery. Building footprints are useful for population estimation, urban planning and humanitarian response. | 2021 | - | - | Accra, Kampala, Cape Town |
| 6 | Open Street Map | Citizen Science https://www.openstreetmap.org/ (accessed on 26 September 2022) | OpenStreetMap is a map of the world, created by people and freely available | 2022 | 0.04–1000 | >300 | Cape Town |
Table 3.
EO dataset revealing optional dataset for exploring environmental pressures.
| Earth Observation Hub | Data Description | Resolution | Illustration | |||
|---|---|---|---|---|---|---|
| Temporal [yrs.] | Spatial [m] | No. of Categories | ||||
| 1 | Global Urban Heat Island (UHI) | Columbia Universityhttps://sedac.ciesin.columbia.edu/data/set/sdei-global-uhi-2013/ (accessed on 26 September 2022) | The product provides a global data set of average summer daytime maximum/nighttime minimum land surface temperatures (LSTs) for urban extents, as well as the LST difference between the urban area and the buffer. | 2013 | 1000 | 4 | Cape Town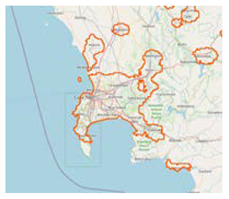 |
| 2 | Global Surface UHI Explorer | T. Chakraborty, X. Lee (University Yale) https://yceo.yale.edu/research/global-surface-uhi-explorer (accessed on 26 September 2022) | The Global Surface UHI Explorer is an interactive web app to monitor urban heat island (UHI) intensities of practically all urban clusters on Earth. The app is built on the Google Earth Engine platform and allows users to query the UHI data of urban areas using a simple interface. | 2003–2018 | 300 | 6 | Kampala |
| 3 | Digital Earth Africa https://docs.digitalearthafrica.org/en/latest/sandbox/notebooks/Datasets/Digital_Elevation_Models.html (accessed on 26 September 2022) | A collection of four DEM product available from the Open Data Cube. The Copernicus products come from the European Space Agency (ESA) and the Shuttle Radar Topography Mission (SRTM) products | >2000 | 30–90 | Accra, Kampala, Cape Town | |
| 4 | Stellenbosch University Digital Elevation Model (SUDEM) https://geosmart.space/products/sudem.html (accessed on 26 September 2022) | The 5 m SUDEM, branded as SUDEM5, is currently the highest resolution DEM covering South Africa | 5 | Cape Town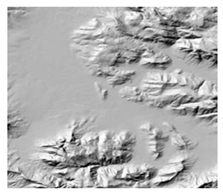 | ||
| 5 | VIIRS Night Lights | Suomi NPP |Satellite Data https://viirsland.gsfc.nasa.gov/Products/NASA/BlackMarble.html (accessed on 26 September 2022) | It is a daily, top-of-atmosphere, at-sensor nighttime radiance product. The product contains 26 Science Data Sets | since 2013 | 500 | - | Accra |
Table 4.
Publicly available dataset for spatially referenced demographic studies.
| Earth Observation Hub | Data Description | Resolution | Illustration | |||
|---|---|---|---|---|---|---|
| Temporal [yrs.] | Spatial [m] | No. of Categories | ||||
| 1 | Gridded Population of the World (GPW), v4 | Center for International Earth Science Information Network | Population Statistics https://sedac.ciesin.columbia.edu/data/collection/gpw-v4/sets/browse (accessed on 26 September 2022) | To provide estimates of population density and count for the years 2000, 2005, 2010, 2015, and 2020, based on counts consistent with national censuses and population registers | 2000 2005 2010 2015 2020 | 1000 | 2 |  |
| 2 | High Resolution Population Density Maps https://data.humdata.org/ (accessed on 26 September 2022) | Humanitarian data created to respond to humanitarian emergency crises | ||||
| 3 | AfriPolis https://africapolis.org/en/data?country=Angola&keyfigure=totalPop&type=abs&year=2015 (accessed on 26 September 2022) | Africapolis data is based on a large inventory of housing and population censuses, electoral registers and other official population sources | 1950–2015 | - | 2 | Accra, Kampala, Cape Town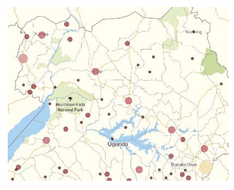 |
Publisher’s Note: MDPI stays neutral with regard to jurisdictional claims in published maps and institutional affiliations. |
© 2022 by the authors. Licensee MDPI, Basel, Switzerland. This article is an open access article distributed under the terms and conditions of the Creative Commons Attribution (CC BY) license (https://creativecommons.org/licenses/by/4.0/).
Share and Cite
MDPI and ACS Style
Banzhaf, E.; Bulley, H.N.; Inkoom, J.N.; Elze, S. Mapping Open Data and Big Data to Address Climate Resilience of Urban Informal Settlements in Sub-Saharan Africa. Climate 2022, 10, 186. https://doi.org/10.3390/cli10120186
AMA Style
Banzhaf E, Bulley HN, Inkoom JN, Elze S. Mapping Open Data and Big Data to Address Climate Resilience of Urban Informal Settlements in Sub-Saharan Africa. Climate. 2022; 10(12):186. https://doi.org/10.3390/cli10120186
Chicago/Turabian StyleBanzhaf, Ellen, Henry N. Bulley, Justice Nana Inkoom, and Sebastian Elze. 2022. "Mapping Open Data and Big Data to Address Climate Resilience of Urban Informal Settlements in Sub-Saharan Africa" Climate 10, no. 12: 186. https://doi.org/10.3390/cli10120186
Note that from the first issue of 2016, this journal uses article numbers instead of page numbers. See further details here.