
Assessing Changes in 21st Century Mean and Extreme Climate of the Sacramento–San Joaquin Delta in California

California Department of Water Resources, 1516 9th Street, Sacramento, CA 95814, USA
Climate 2022, 10(2), 16; https://doi.org/10.3390/cli10020016
Submission received: 10 January 2022
/
Revised: 27 January 2022
/
Accepted: 28 January 2022
/
Published: 29 January 2022
(This article belongs to the Special Issue Climate Extremes: Human-Environment Consequences and Adaptation Measures)
Abstract
:This work aims to assess potential changes in the mean and extreme precipitation and temperature across the Sacramento–San Joaquin Delta (Delta) in California in the 21st century. The study employs operative climate model projections from the Coupled Model Inter-comparison Project Phase 5 (CMIP5). Specifically, 64 individual downscaled daily projections (1/16 degree, approximately 6 by 6 km) on precipitation and temperature from 32 Global Circulation Models (GCMs) under two emission scenarios (RCP 4.5 and RCP 8.5) from 2020–2099 are utilized for the analysis. The results indicate increasing warming (in mean, minimum, and maximum temperature) further into the future under both emission scenarios. Warming also exhibits a strong seasonality, with winters expecting lower and summers expecting higher increases in temperature. In contrast, for mean annual total precipitation, there is no consistent wetter or drier signal. On average, the changes in annual total precipitation are minimal. However, dry season precipitation is projected to decline. The study also shows that the number of wet days is projected to decrease while the number of very wet (daily precipitation over 10 mm) and extremely wet (daily precipitation over 20 mm) days is projected to increase. Moreover, the study illustrates that only about half of the changes in total annual precipitation are projected to come from changes in the wettest 10% of wet days. In contrast, a majority of changes in variance of the annual precipitation comes from changes in variance of the wettest 10% of the wet days. This suggests that fluctuations in large storms are projected to dictate the variability of precipitation in the Delta. Additionally, a general upward trend in dry conditions measured by the Standardized Precipitation-Evapotranspiration Index is expected during the projection period. The trending signal is stronger at multi-year temporal scales (one to four years) and under the higher emission scenario. These change patterns are generally similar across three sub-regions of the Delta (i.e., North, South, and West), even though some changes in the South Delta are the most pronounced. This study further discusses challenges posed by these changes to the Delta’s water supply and ecosystems, along with the Delta’s resiliency and potential ways to address these challenges.
1. Introduction
1.1. Background
It has been well recognized now that Earth’s climate is changing faster than at any other time in modern history [1]. Observed changes include more extreme events (e.g., heat, heavy precipitation, flood, droughts, etc.) [2,3], shrinking snow cover and glaciers [4,5], warming and rising sea [6,7], increasing wildfires [8], among many others. These changes are projected to intensify at an accelerated pace in the future [9,10,11,12]. The observed and projected changes pose growing challenges to our livelihood and the natural environment, particularly in arid and semi-arid regions including California.
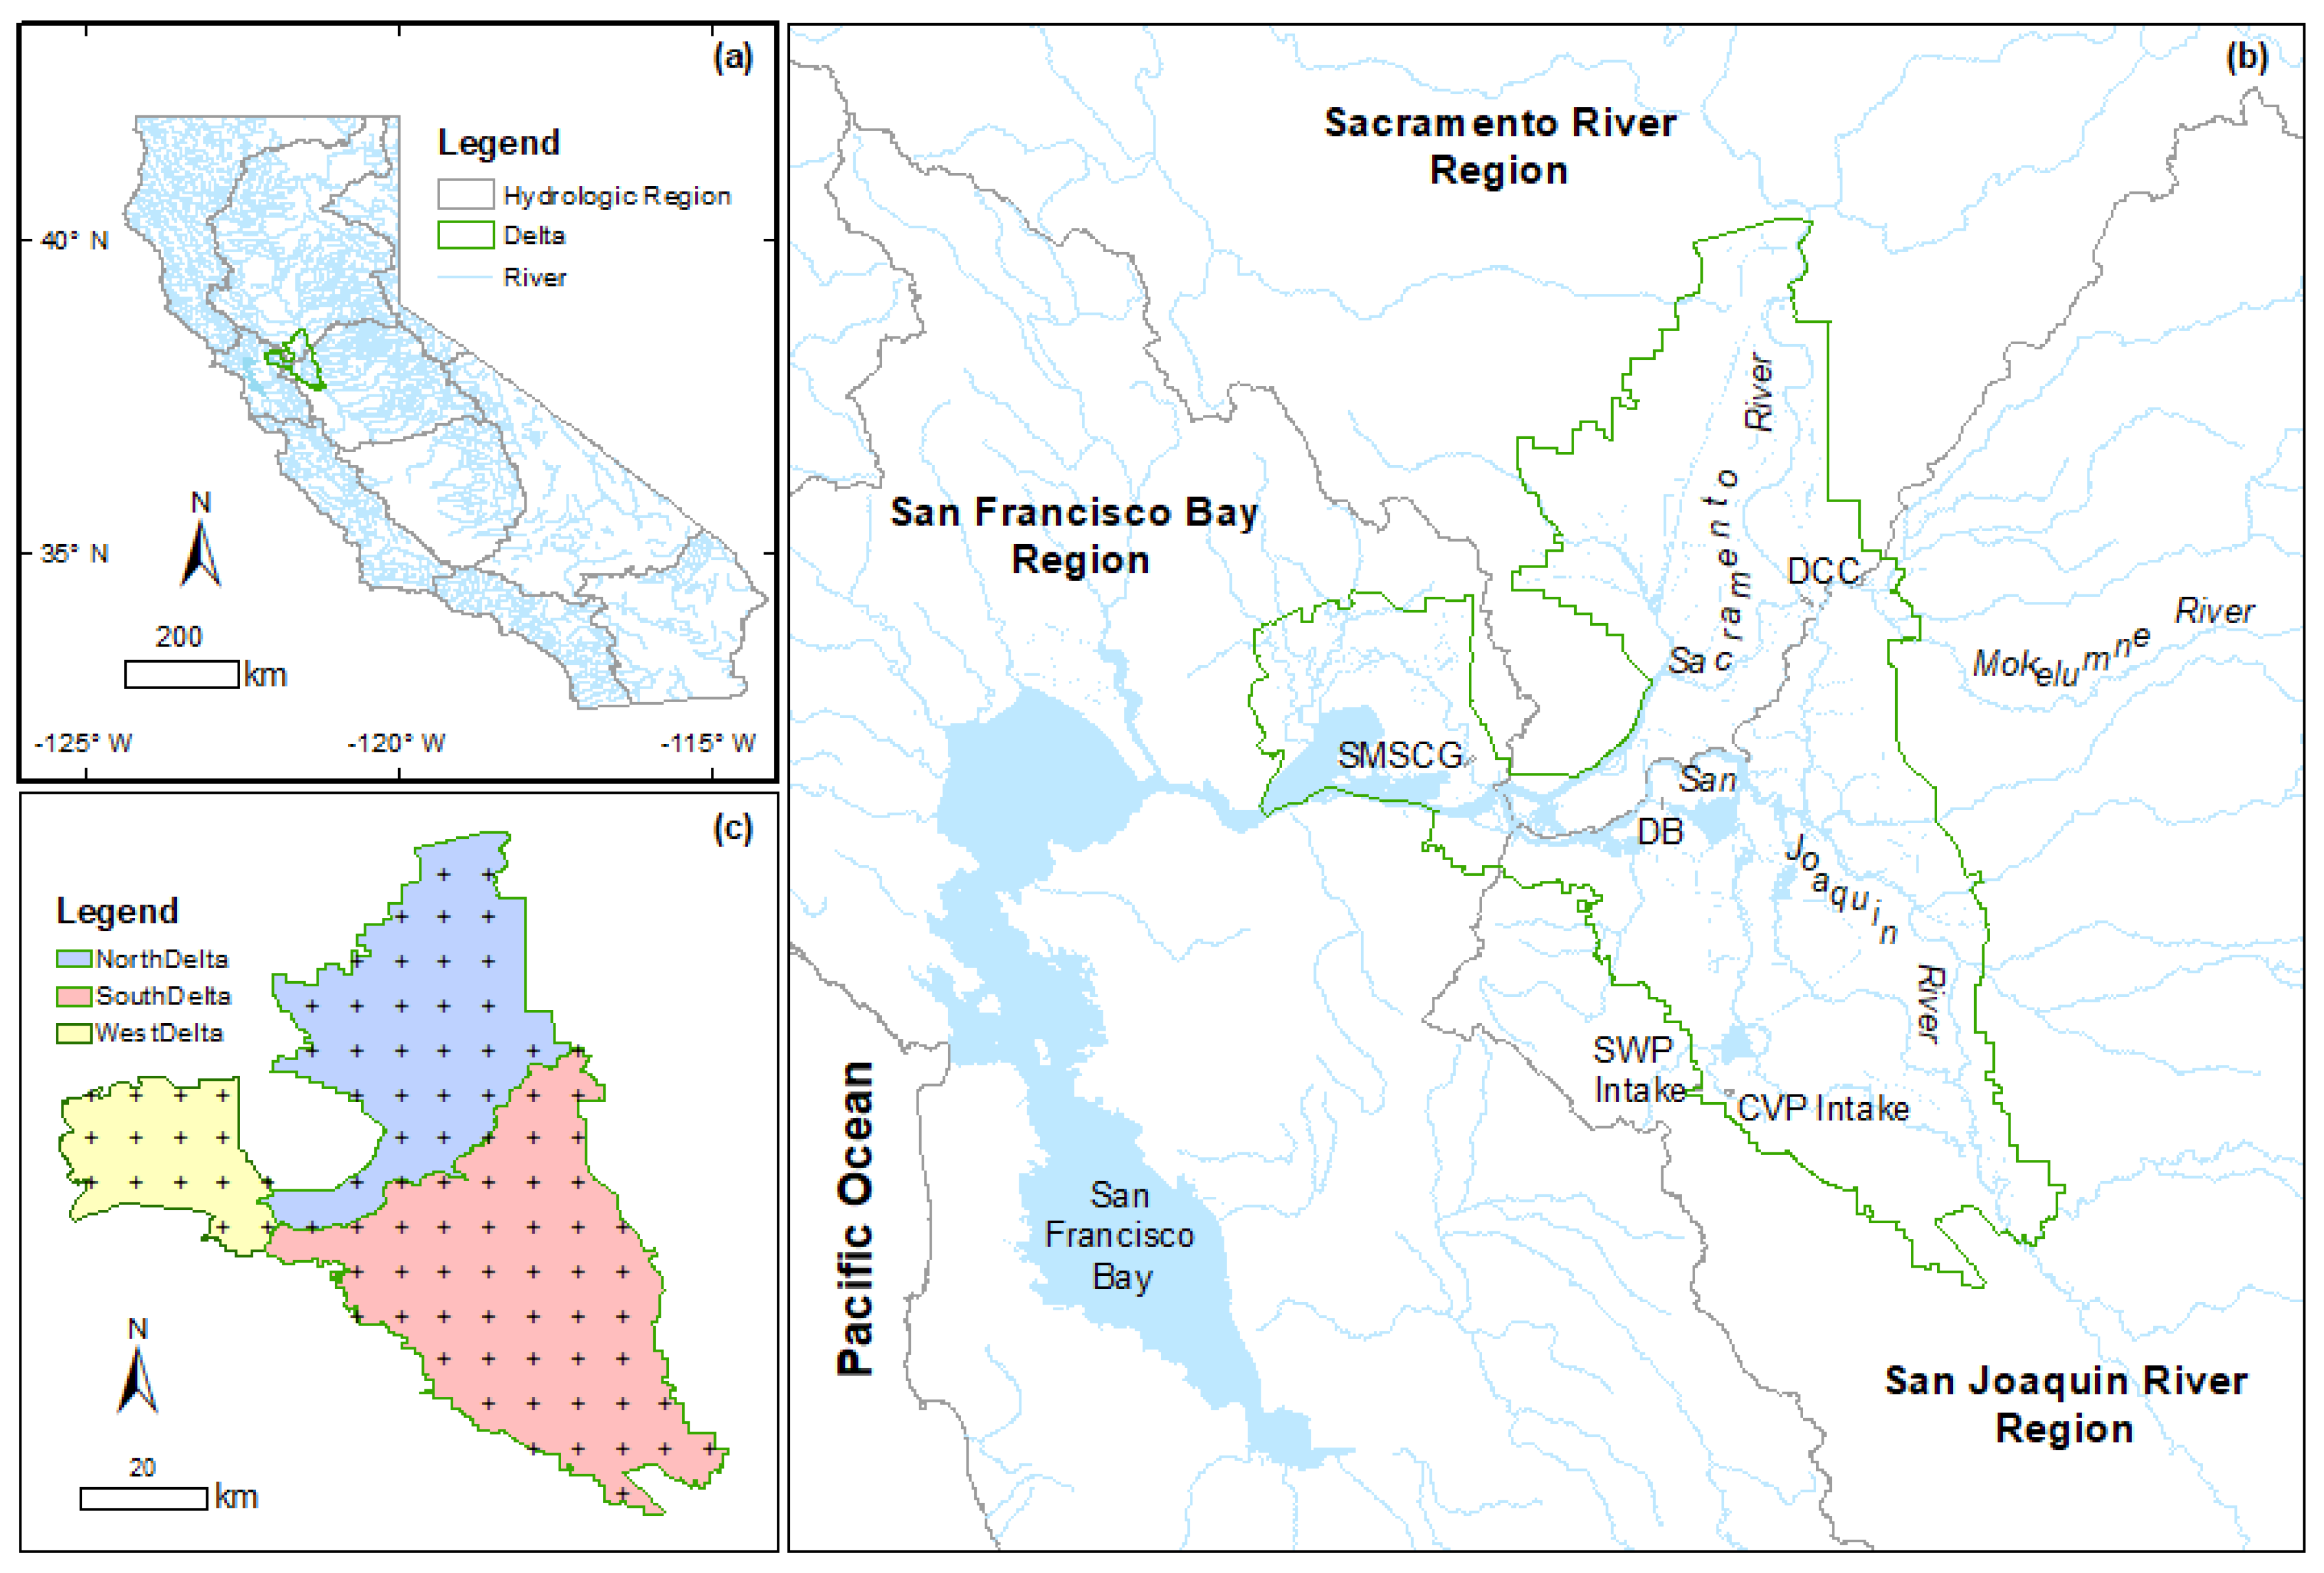
California is the most populous state in the United States [13] and the fifth largest economy in the world. Water plays a central role in supporting such a large population (39.5 million) and sustaining the State’s enormous economy. However, water supply and water demand in the State are strikingly mismatched on both spatial and temporal scales. Most precipitation occurs in the northern half of the State, while most of the population and farmland (and thus water demand) is in the southern half. A majority of the precipitation comes during the wet season (October-March), while the water demands are typically the highest during the dry season (April-September) [14]. The State has built a complex water system to redistribute water to counter the mismatch in space and time. This system contains a number of water storage and transfer projects, including the state-owned State Water Project (SWP) and the federal Central Valley Project (CVP) [15,16]. Both projects consist of tens of reservoirs which store rainfall runoff and snowmelt (during late spring and early summer) from mountainous watersheds (so called “rim watersheds”) and hundreds of kilometers of canals, tunnels, pipelines, and aqueducts to transfer water to users. Collectively, these two projects serve over 25 million Californians and more than 15,000 km2 of farmland. The hub of this complex water system is the Sacramento–San Joaquin Delta (Delta) where the largest two rivers in the State (i.e., Sacramento River and San Joaquin River) converge and flow into the San Francisco Bay, which is bounded by the Pacific Ocean on the west (Figure 1). Physically, the Delta is a patchwork of islands mostly used for agriculture. About 1800 km of levees protect these islands from about 1100 km of waterways that surround the islands. Some of these islands are below sea level and are experiencing subsidence due to the oxidation of peat soils, which increases the likelihood of levee failure and island flooding [17,18]. The Delta receives freshwater from upstream reservoirs to which both the Sacramento River and its tributaries on the north and the San-Joaquin River and its tributaries on the southeast drain. Freshwater flowing through the Delta repels salty seawater intrusion from the San Francisco Bay. Ecologically, the Delta is a (one out of 25) biodiversity hot spot with the highest priority of conservation globally [19]. It directly provides habitats or supports about 750 species of plants and animals of which some are near extinction [20]. The physical and ecological features of the Delta largely shape Delta water operations. These operations, centered on SWP and CVP operations, aim to achieve the coequal goals of a reliable water supply and an ecologically sustainable Delta ecosystem [21]. The SWP and CVP pump water out of the southern Delta and delivers it to urban and agricultural users. The pumping time and rates are regulated by state and federal court rules and decisions to ensure that flow and water quality standards at various locations in the Delta maintain compliance, and that additional regulations to protect endangered species are followed [22,23].
In light of climate change risks and their potential adverse impacts to the State, California conducts comprehensive statewide climate change assessments regularly to provide science-based information for developing actions to safeguard the State from expected impacts of climate change. The latest assessment, California’s Fourth Climate Change Assessment (CCCA4), was released in 2018 [24]. CCCA4 produced a range of datasets including statewide daily precipitation and temperature data downscaled via a statistical downscaling technique called Localized Constructed Analogs (LOCA) from a set of 32 GCMs [25]. These models come from a global effort, the Coupled Model Intercomparison Project Phase 5 (CMIP5) [26], which aims to study and intercompare simulations from different climate GCMs. Currently, CMIP is at Phase 6 [27]. However, CMPI6 climate projections have not yet been downscaled to the scale that is suitable for operational use in California. They will likely be incorporated into California’s next Climate Change Assessment.
Based on the datasets produced for CCCA4, a number of studies have been conducted to assess changes in climate at different regions across California and their potential impacts on water resources in the State. The authors of [28] assessed potential changes in future precipitation, temperature, and drought across 10 hydrologic regions in California based on projections from 10 out of 32 GCMs. They showed that the increasing air temperature is clear across all regions, while there is less consensus on the changing direction of precipitation. The research of [25,29] also reported similar observations across the State. Additionally, they projected more extreme flood risks and drought risks as well as remarkable sea level rise. In another study, [30] explored future relationships between large storms and droughts in the Central Valley region using projections from the same 10 GCMs. Results indicated that the largest storms are projected to continue dictating the regimes of wet and dry spells in the State. The results of [31] translated precipitation and temperature projections from these 10 models into snowpack and reservoir storage projections in the Sacramento and San-Joaquin basins as well as unimpaired inflows to the Delta. They found out that snowpack in the Sacramento basin would decline sharply (by 89%), and snowmelt timing would shift earlier (33% more flow arriving before 1 April). Delta inflows were projected to increase in the wet season (up to 63%) and decrease (up to 54%) in the dry season. The authors of [32] presented similar findings in runoff changes across eight rim watersheds that drain into the Delta using the same dataset. The climate projections were also applied to run operational models to simulate reservoir operations and SWP/CVP water supply exports from the Delta to municipal and agricultural users across the State in the future. The authors of [33] explored the impacts of a set of different potential climate change scenarios on the performance of the SWP and CVP systems. They projected declines in all analyzed system performance metrics by 2050. In a companion study using perturbed (rather than directly modeled) runoff projections as Delta inflows, [34] identified similar declines in SWP/CVP system performance by 2060.
1.2. Motivation and Scope of the Study
Those studies focused on changes either in rim watersheds that provide freshwater inflows to the Delta [31,32,33,34] or in large regions that contain the entire Delta [28,29,30]. None of them focused on the Delta exclusively. While Delta water operations (e.g., operations of SWP and CVP facilities in the Delta) are largely dictated by upstream freshwater inflows (which depend on upstream reservoir operations, hydro-climatic variability, and land use changes in rim watersheds) and downstream sea water intrusion (with daily tidal and seasonal variability and which his impacted by sea level rise), local climate in the Delta also plays a role in these operations.
From a water supply perspective, precipitation over the Delta serves as a secondary freshwater source for the Delta, since the primary sources of water are upstream freshwater inflows. In dry years when rim watershed runoff is largely diminished, and upstream reservoir releases are limited, precipitation can be an important supplement, particularly during the wet season when reservoirs need to store water for dry season use. For instance, during the fourth year (2015) of the historical 2012–2015 drought when record-low snowpack and snowmelt runoff along with record-high temperatures were observed [35], Sacramento River basin runoff was about half of its long-term average while San Joaquin River basin runoff was merely a quarter of its historical average. Reservoir releases during the wet winter when most precipitation occurred were minimal. During this year (2015), precipitation over the Delta amounted to about 0.6 billion m3. It is equivalent to 71% of CVP export and 45% of SWP export in that year [36], respectively, even though a majority of the precipitation did not directly contribute to exports. Delta precipitation is nontrivial even during wet years. As an example, in 2011 when Sacramento River basin runoff was 140% of its long-term average and the San Joaquin River basin runoff was nearly double its average amount, Delta precipitation was equivalent to 35% of CVP export and 23% of SWP export, respectively, during the year [36]. From an ecological perspective, changes in Delta temperature likely have profound impacts on Delta water quality and species. These changes, when compounded with changes in precipitation (e.g., deficit-induced drought), could increase the risk of levee failure (e.g., from soil strength reduction, land subsidence and erosion, fissuring and soil softening, and soil organic carbon oxidation [37]), leading to the flooding of islands protected by the levees and thus the change of habitats that supports native species.
In addition, those studies [28,29,30,31,32,33,34] used projections from carefully selected subsets of all 32 GCMs (to meet specific criteria as resources limitations often make including all GCMs unfeasible) available in CCCA4. The information contained in other GCMs remained unexplored. However, as [29] pointed out, large uncertainties in precipitation projections (versus high consensus in warming) imply that adaptations to precipitation changes and water supplies should focus on increasing the range of possible future scenarios.
The current study aims to shed light on potential changes in the mean and extreme climate of the Delta during the 21st century and discuss their implications for water resources planning and management in the Delta. This study extends those previous studies in the context of (1) capitalizing on the whole suite of 32 available GCMs to explore the widest possible range of future climate scenarios operationally available in California; and (2) focusing on the changes in the Delta area specifically while discussing the implications of these changes along with changes projected for other parts of the water system (discussed in previous studies) on the Delta’s water supply and ecosystem.
1.3. Structure of the Paper
The rest of the paper is organized as follows. Section 2 introduces the study area, the datasets utilized, and the variables and metrics explored. Section 3 presents the findings of the study. Section 4 discusses these findings, challenges associated with them, their implications on the resiliency of the Delta, as well as potential future work.
2. Materials and Methods
2.1. Study Area
California Department of Water Resources (DWR) divides the State into ten hydrologic regions as water resources management goals, and challenges vary across these regions (Figure 1a). Different regions tend to have different hydro-climatic characteristics. Generally speaking, the climate tends to be drier and warmer towards the southern regions. The Sacramento–San Joaquin Delta (including the Suisun-Marsh area) contains the trijunction of three hydrologic regions and covers portions of each. These three hydrologic regions are the Sacramento River Region, San Joaquin River Region, and San Francisco Bay Region (Figure 1a,b). The Delta receives freshwater inflows from the Sacramento River on the north and from San Joaquin River on the south. A couple of tributaries of the San Joaquin River including the Mokelumne, Cosumnes, and Calaveras Rivers also contribute freshwater into the Delta from the east. The freshwater serves the threefold purpose of (1) repelling salt water intrusion from the San Francisco Bay; (2) contributing to SWP and CVP exports as well as in-Delta diversions for urban and agricultural use (SWP and CVP intakes are depicted in Figure 1b); and (3) satisfying consumptive use and channel depletion. Freshwater inflows from upstream reservoirs along with operations of in-Delta hydraulic structures aim to maintain satisfactory water quality. Those structures include the Delta Cross Channel (DCC; Figure 1b) in the North Delta and the Suisun Marsch Salinity Control Gates (SMSCG; Figure 1b) in the West Delta. Temporary barriers are also utilized on an as-needed basis. Figure 1b shows the location of a Drought Barrier (DB) installed (and later removed) in the South Delta in 2015 and 2021 to minimize salt intrusion into the Delta as available freshwater water inflows in that year were very limited. Accordingly, this study divides the Delta into three sub-regions including North Delta (located in the Sacramento River Region), South Delta (San Joaquin River Region), and West Delta (San Francisco Bay Region).
Historically, South Delta is the warmest and driest sub-region. In contrast, West Delta is the wettest and coolest (Table 1). While the average temperature varied by no more than 0.5 °C across the regions (15.9–16.4 °C), there was more variation in annual average precipitation (329–449 mm). North Delta is closer to West Delta in terms of annual precipitation received, while it is closer to South Delta in terms of temperature. For all three sub-regions, on average a third of the days each year are rainy (daily precipitation > 0 mm). North Delta observes slightly more rainy days than the other two sub-regions. Very wet days (with daily precipitation over 10 mm) are much rarer (between 2% and 4%) than wet days. The extremely wet days (daily precipitation > 20 mm) are even rarer, accounting for less than 1% of the time (e.g., a few days per year) (Table 1). Among three sub-regions, relatively speaking, West Delta (South Delta) experiences the highest (lowest) amount of very wet events and extremely wet events. This is consistent with topographic and storm track features of the region. The wettest storms have flow from the southwest to the northeast, which would be consistent with the western Delta having the most very wet or extremely wet precipitation events that then diminish in amount as the storms move across the North Delta. The southern Delta is in the rain shadow and receives less precipitation. In water resources operations, in addition to mean values, metrics that represent more extreme events such as the 90th percentile (below which 90% of the observations fall) are commonly explored to inform decision making. As expected, West Delta has the largest 90th percentile of daily precipitation (11.2 mm), while South Delta has the smallest value (8.3 mm, 26% smaller that its counterpart in West Delta).
2.2. Study Datasets
This study employs daily climate projections on precipitation, and maximum and minimum temperature from water year 2020 through 2099. Those projections are derived from a set of 32 GCMs (Table A1 in the Appendix A) that participate in the Coupled Model Intercomparison Project Phase 5 (CMIP5) under two emission scenarios named Representative Concentration Pathways (RCP) 4.5 and RCP 8.5, which are available in CCCA4 [25]. RCP 8.5 is the high emission scenario, which assumes that greenhouse-gas emission continues to rise as usual throughout the current century. RCP 4.5 is the lower emission scenario, in which greenhouse-gas concentrations become stabilized at a concentration 4.5/8.5 as large as in the RCP 8.5 scenario by 2099. These 64 (32 GCMs, 2 emissions) scenarios define a future climate projection distribution. These projections are downscaled to a spatial resolution of 1/16th degree (about 6 km by 6 km) via the Localized Constructed Analogs (LOCA) statistical downscaling approach [39]. LOCA is designed to better represent extreme weather conditions on a daily scale and avoid non-physical changes to the original GCM projections [25]. The limitation of LOCA is that, as other statistical downscaling methods, it assumes historical relationships between the original coarse scale and the target fine scale (1/16th degree in this case) data and will persist into the future [31]. These downscaled projections serve as the backbone for the 2018 CCCA4 (http://cal-adapt.org/, accessed on 1 January 2019), which provides “the scientific foundation for understanding climate-related vulnerability at the local scale and informing resilience actions” across California [24]. GCM simulations of historical-period daily precipitation, and maximum and minimum temperature (driven by historical radiative climate forcings) for the 40-year period of water year 1960–1999 were utilized in this analysis as the historical climate baseline to benchmark aforementioned projections of those models. Specifically, the entire projection period is divided into two 40-year periods: the mid-century, from water year 2020–2059, and the late-century, from water year 2060–2099. Changes are obtained by comparing projections in these two future periods against historical simulations during the baseline period. In addition, when analyzing historical climate of the study areas, the observational dataset of daily precipitation and maximum and minimum temperature from water years (October to September) 1916–2011 of [38] are applied. They are gridded data (at the same spatial resolution as those climate projections and simulations from these 32 GCMs) derived from daily precipitation and temperature observations at approximately 20,000 U.S. National Oceanic and Atmospheric Administration Cooperative Observer (COOP) stations [38].
2.3. Study Variables and Metrics
When looking at changes in a mean sense, the study focuses on typical climatological variables including annual precipitation, wet season (October-March) precipitation, and dry season (April–September) precipitation, mean annual temperature, and mean monthly temperature
When examining changes in an extreme sense, variables including the number of wet days (with daily precipitation greater than 0 mm), very wet days (with daily precipitation exceeding 10 mm), and extreme wet days (with daily precipitation above 20 mm), contributions to total precipitation and precipitation variance from the wettest 10% days and from the remaining wet days (refer to Appendix B for detailed explanation), annual and monthly maximum and minimum temperature, and annual and monthly diurnal temperature range (DTR) are investigated. The wet season precipitation predominantly relies on a handful of big storms during a limited number of wet days. A wet season having fewer or more than the average amount of such events can be particularly dry or wet [14]. Therefore, understanding how these extreme events may change in the future and how their contributions to the mean and variance of annual precipitation change is foremost in making any adaptive plans on future water management practices. The Delta provides a habitat for over 55 fish species and more than 750 plant and wildlife species, of which many are sensitive to extreme temperature in addition to extreme precipitation (i.e., flooding and drought). The most recent example is the 2012–2015 state-wide drought (characterized by record low precipitation and record high temperature), which decimated millions of trees in the State and pushed several fish species closer to extinction [40]. Specifically, about 102 million forest trees were decimated during the drought due to reduced soil moisture. The death of these trees has profound implications for public safety, erosion, and wildfire. In addition, water quality has declined, and the habitat for native fish species (e.g., winter-run salmon) has been impaired [40]. In this regard, exploring changes in those variables also have important environmental implications.
As droughts can cause devastating consequences to the Delta, in addition to looking at precipitation and temperature separately, this study further examines a drought index, which considers the compound impact of precipitation and temperature [41,42]. The index, Standardized Precipitation-Evapotranspiration Index (SPEI), first calculates the monthly discrepancies between precipitation and potential evapotranspiration, which is derived from temperature. Monthly discrepancies can be aggregated to different time scales (e.g., 12-month, 24-month, 36-month, 48-month, among others) to calculate SPEI values at corresponding temporal scales. A Log-logistic distribution is then applied to fit the discrepancy time series. Finally, the SPEI value is determined as the standardized values of the probability distribution function of the discrepancies (details provided in Appendix B). SPEI values smaller and greater than 0 typically indicate dry and wet conditions, respectively. SPEI values less than −2 and larger than 2 designate extreme drought and extremely wet conditions, respectively. This index compares favorably to other popular drought indices [41,42], but with the advantage of implicitly considering the impact of temperature on drought. This makes it particularly suitable in assessing drought conditions in future warming scenarios. This study assesses the SPEI values on an annual scale (SPEI-12), two-year scale (SPEI-24), three-year scale (SPEI-36), and four-year scale (SPEI-48), as drought occurs in California at those time scales in many instances [35]. It is essential to explore future drought conditions at those scales for adaptive planning purposes. Rather than analyzing changes in specific SPEI values, this study examines the overall trend in SPEI during the entire project period (2020–2099). It is difficult to predict when drought events may occur at which level of severity in the short-term to medium-term range (e.g., one year ahead), not to mention well into the future. Under these circumstances, the changing tendency (i.e., trend) in drought conditions is more accurate and meaningful than specific changes in drought severity and frequency, as there are numerous uncertainties associated with the latter. Specifically, the trend information casts light on when one or more operational thresholds may be exceeded and, consequently, a different set of operational rules will be applied, or investments will need to be made in advance to prevent that from occurring. Using the entire project period rather than two equal sub-periods (mid-century and late-century) provides enough of a sample size (80) to develop more statistically reliable trend information. The study employs the widely used non-parametric Mann–Kendall test [43,44] in assessing the significance of trend in SPEI with a significance level of 0.05. The slope of a significant trend is determined via the Theil–Sen approach [45,46], referring to Appendix B for details.
3. Results
This section first examines Delta climate based on the Livneh historical data [38]. Projected changes in mean and extreme climatic variables are explored next, followed by the drought trend in the Delta.
3.1. Delta Climate
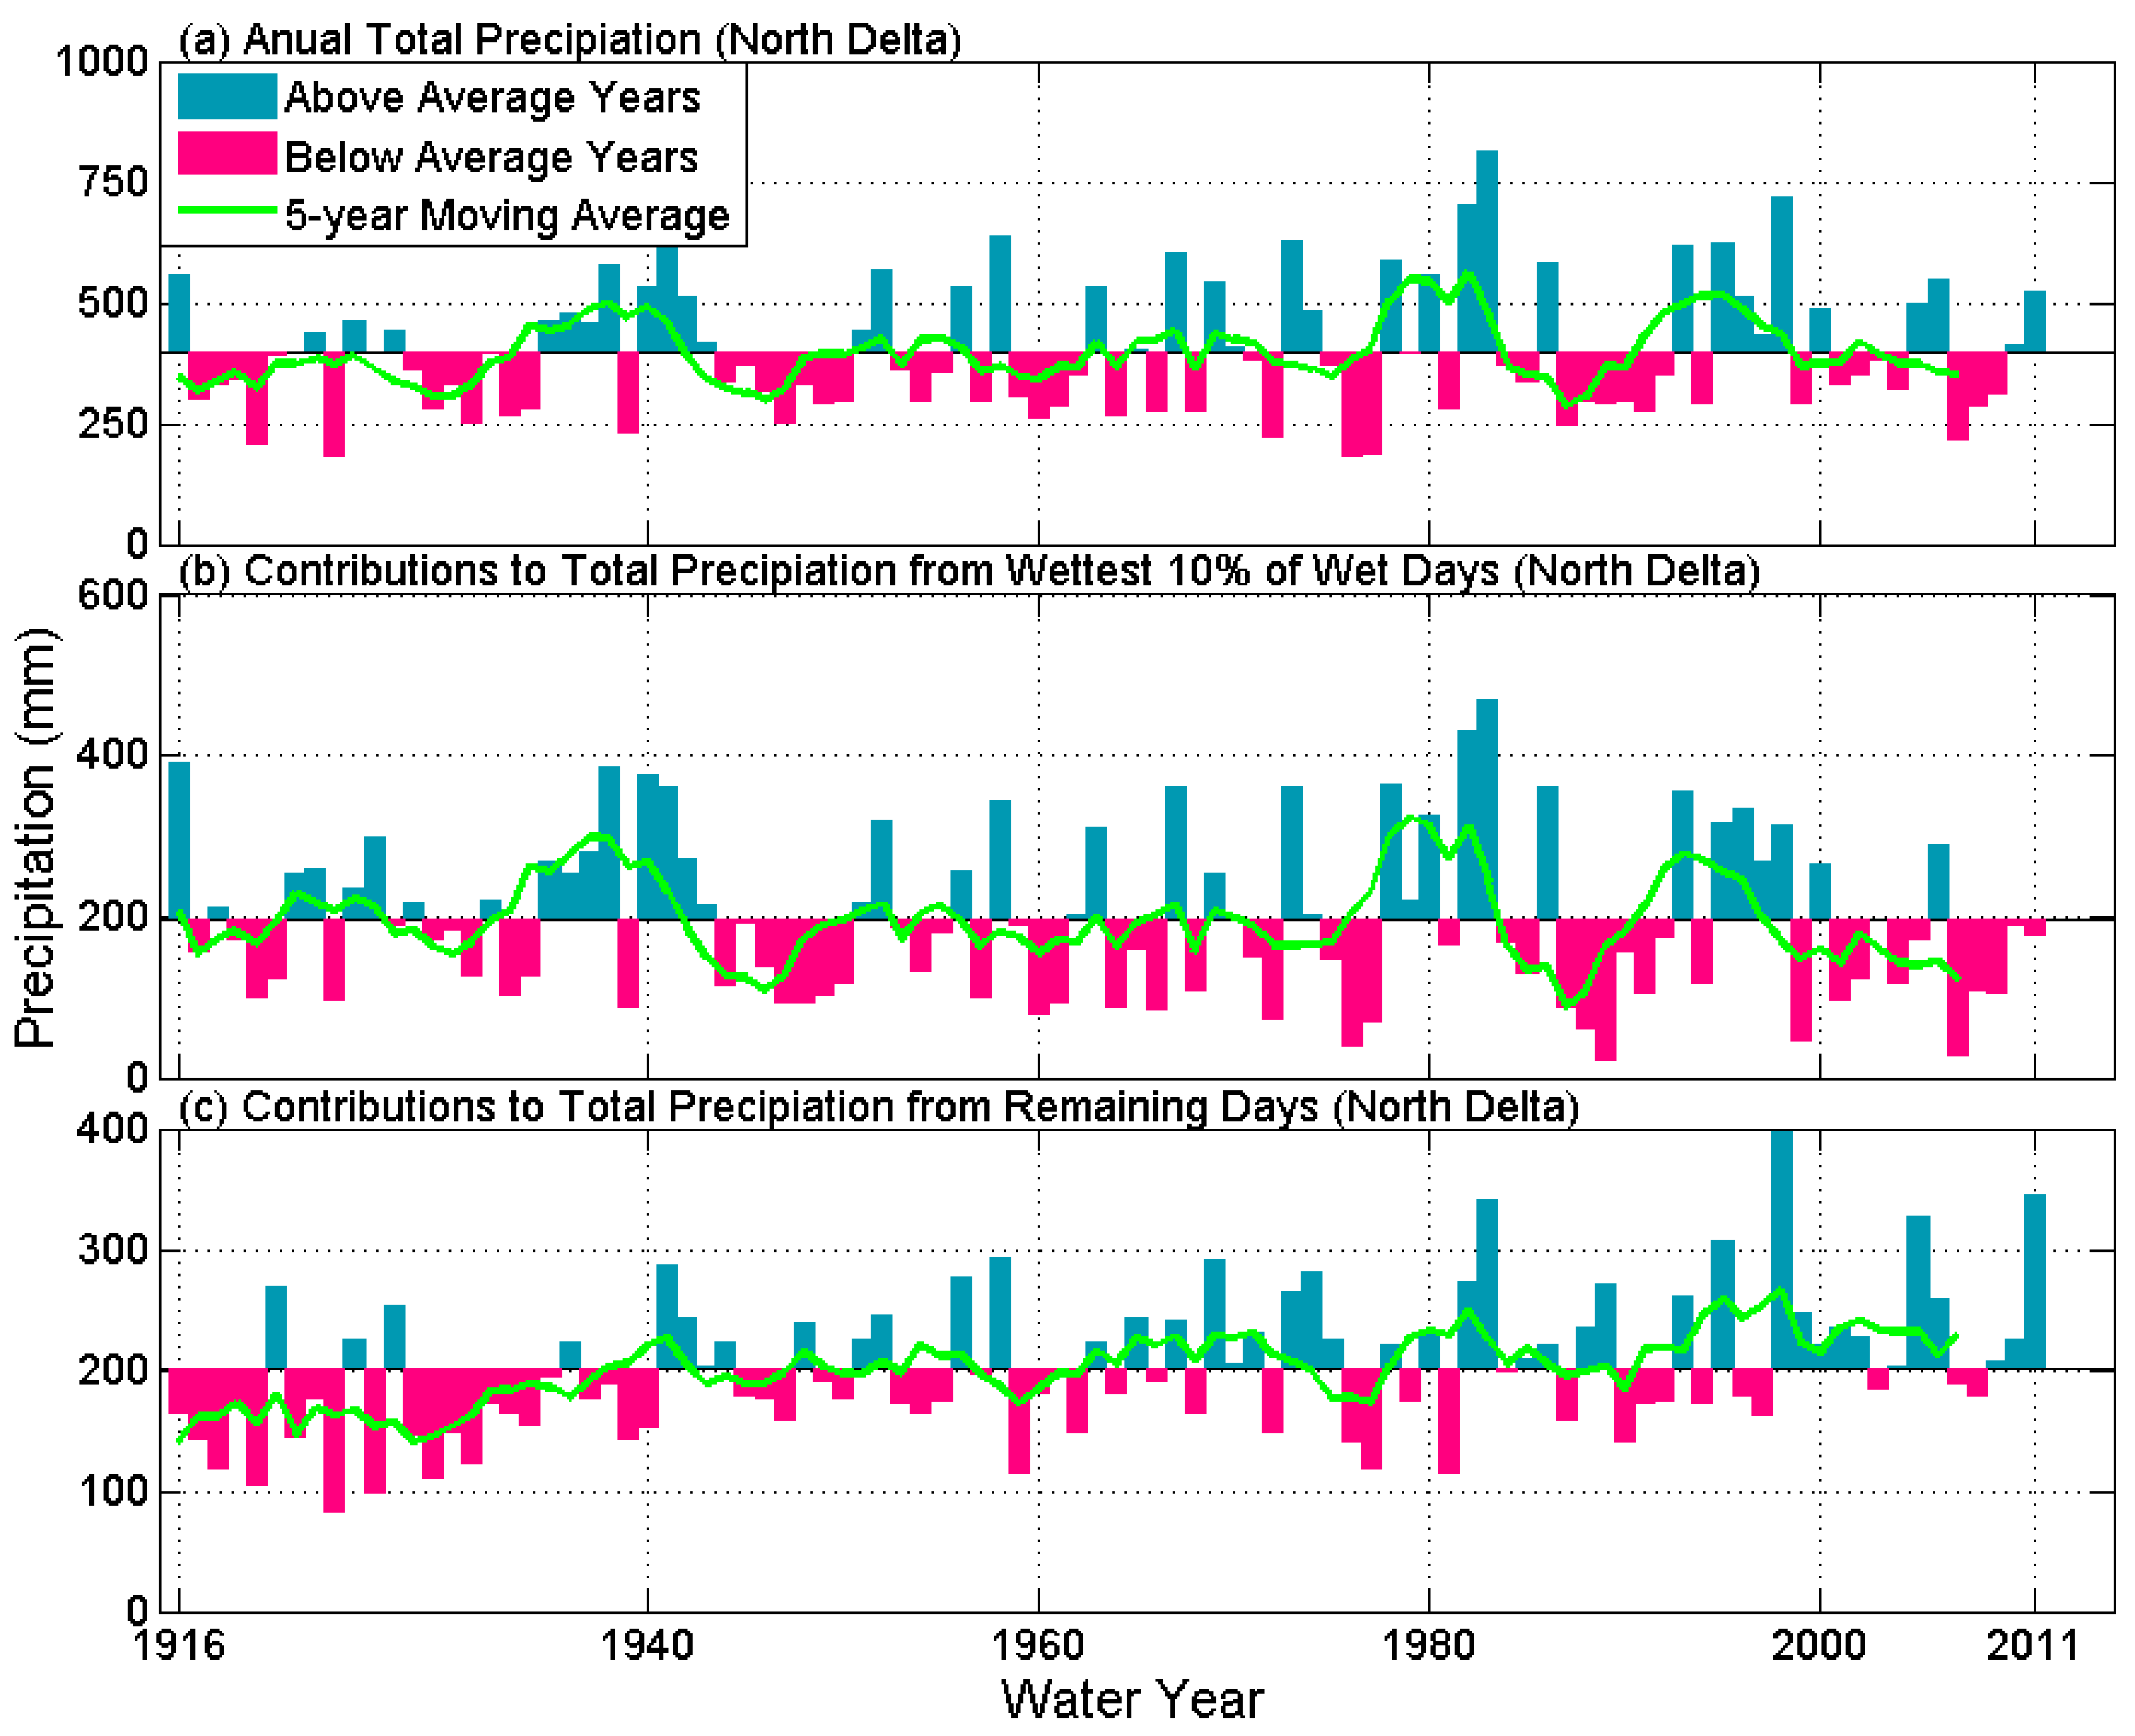
Historically, the Delta receives about 370 mm of precipitation annually on average, as calculated from the Livneh historical precipitation data from water year 1916–2011 [38]. However, precipitation across the Delta is not uniformly distributed. As indicated in Table 1, relatively speaking, West Delta is the wettest (annual precipitation 449 mm), while South Delta is the driest (annual precipitation 329 mm). This is likely due to the fact that the local storms typically track west (Pacific Ocean) to east (inland) and that the Southern half of the State is generally drier that the Northern half. A majority portion of the precipitation occurs during the wet season (October-March) due to the Mediterranean climate of these three hydrologic regions where the Delta is located. The dry season (April-September) precipitation only accounts for 12–13% of the annual total precipitation across three Delta sub-regions (Figure 2a). About half (49%, 47%, and 48% for North, South, and West Delta, respectively) of the annual total precipitation comes from the wettest 10% of wet days, and the rest comes from all remaining wet days (Figure 2b). In spite of the nearly equal contributions of top 10% wettest days and the remaining wet days to mean annual total precipitation, the contributions to variance from the 10% wettest days is about three times as much as that from the remaining wet days (Figure 2c). For instance, the variance of the largest 10% of storms (namely, precipitation events in the top 10% wettest days) is as big as 56% of the variance of annual total precipitation. In contrast, the variance of the smaller storms (namely, precipitation events in the remaining wet days) is only 18% as large as that of annual total precipitation. This suggests that variations in the largest 10% of storms dictate the variations in annual precipitation. Taking one step further, measured by the square of the Pearson correlation coefficient (a measure of the strength of the relationship between two variables) between water year total precipitation and water year contributions from two categories of storms, the largest 10% of storms explain over 80% of the total precipitation variance, while the remaining storms explain only slightly over 50% of it across all three sub-regions (Figure 2d). These contrasting features of two water-year contributions (from largest 10% of storms and remaining storms) to mean and variance of total annual precipitation are also evident by looking at annual time series of the annual precipitation and two separated contributions together (e.g., Figure A1 in the Appendix A). Simulated precipitation from the 32 GCMs also reflects the observed fractional mean and variance contributions in a general sense (Figure A2 in the Appendix A).
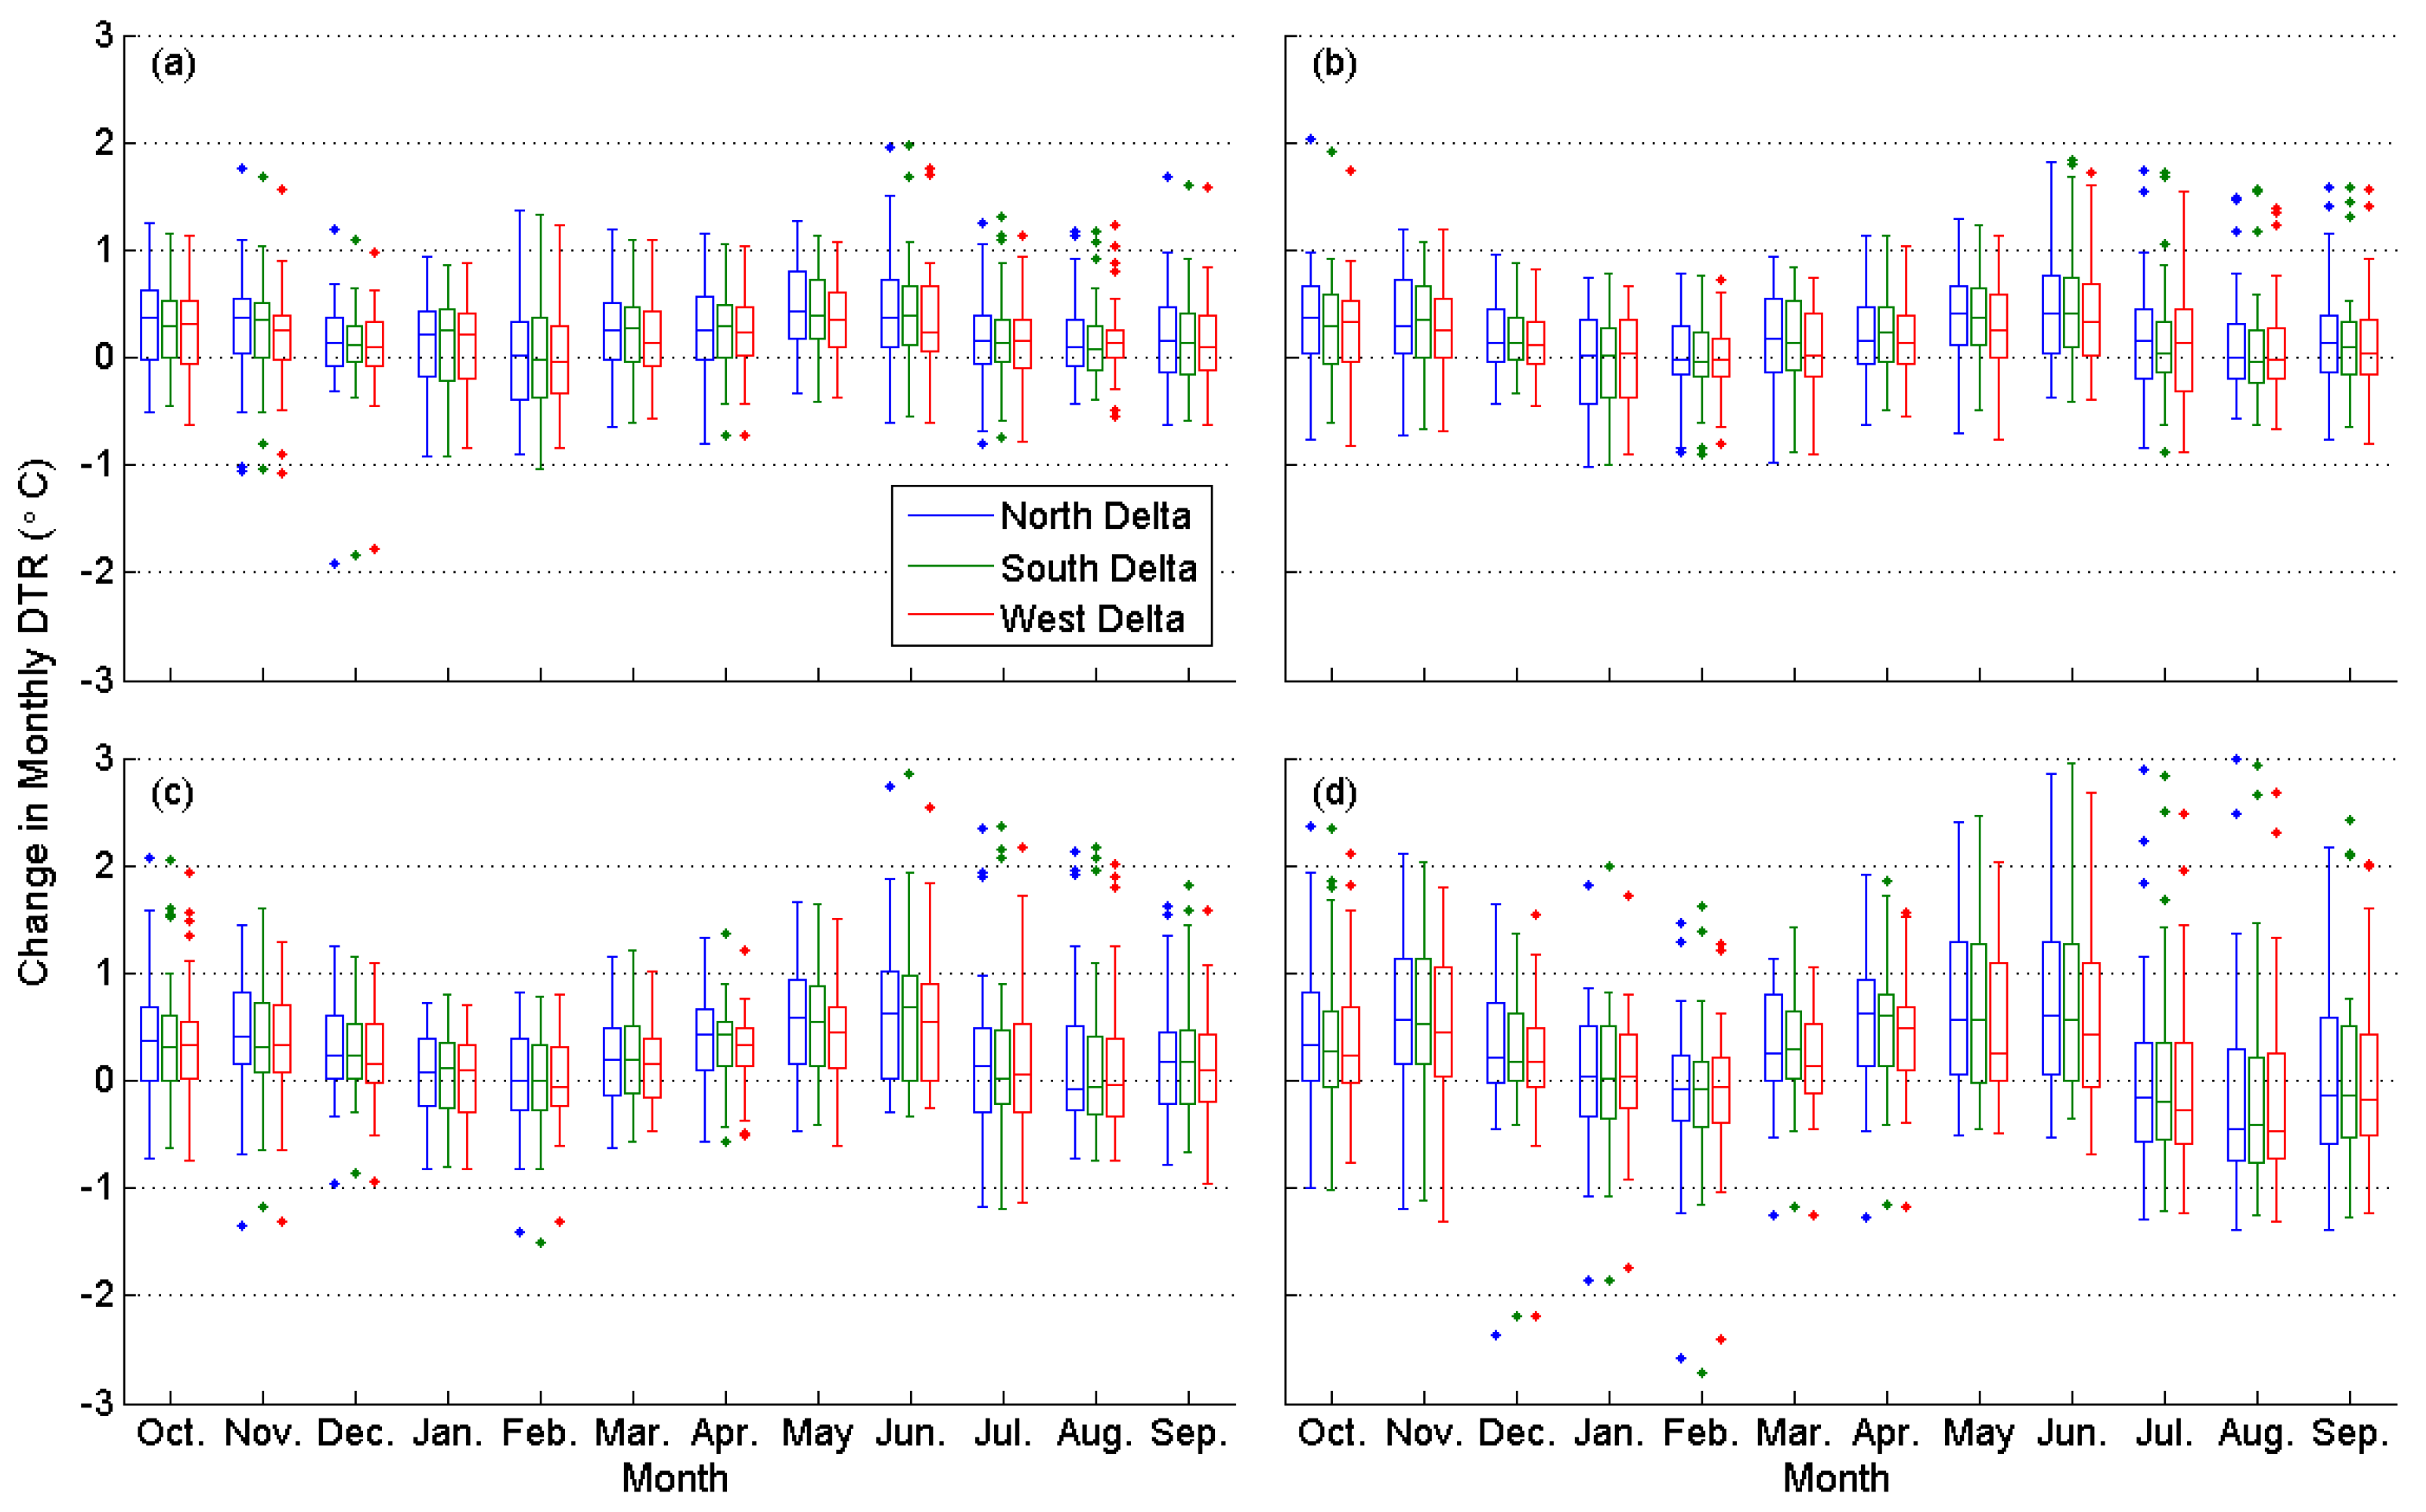
The long-term mean annual maximum, average, and minimum temperature values of the Delta are about 23.1,16.3, and 9.4 °C, respectively. Across three sub-regions in the Delta, temperature varies slightly with differences less than 1 °C (Figure 3a). Overall, South Delta is the warmest, while West Delta is the coolest, as it is closer to the coastal climate compared to South Delta and North Delta. As expected, all three temperature variables exhibit strong seasonality, with the lowest temperature values in December or January and the highest values in July. Figure 3b shows the long-term mean monthly maximum, average, and minimum temperature of North Delta (the pattern is similar for South Delta and West Delta). Monthly average temperature ranges from 8.0 °C (January) to 23.5 °C (July). The diurnal temperature range (DTR; difference between daily maximum and minimum temperature) varies from 9.0 °C in January to 18.5 °C in July.
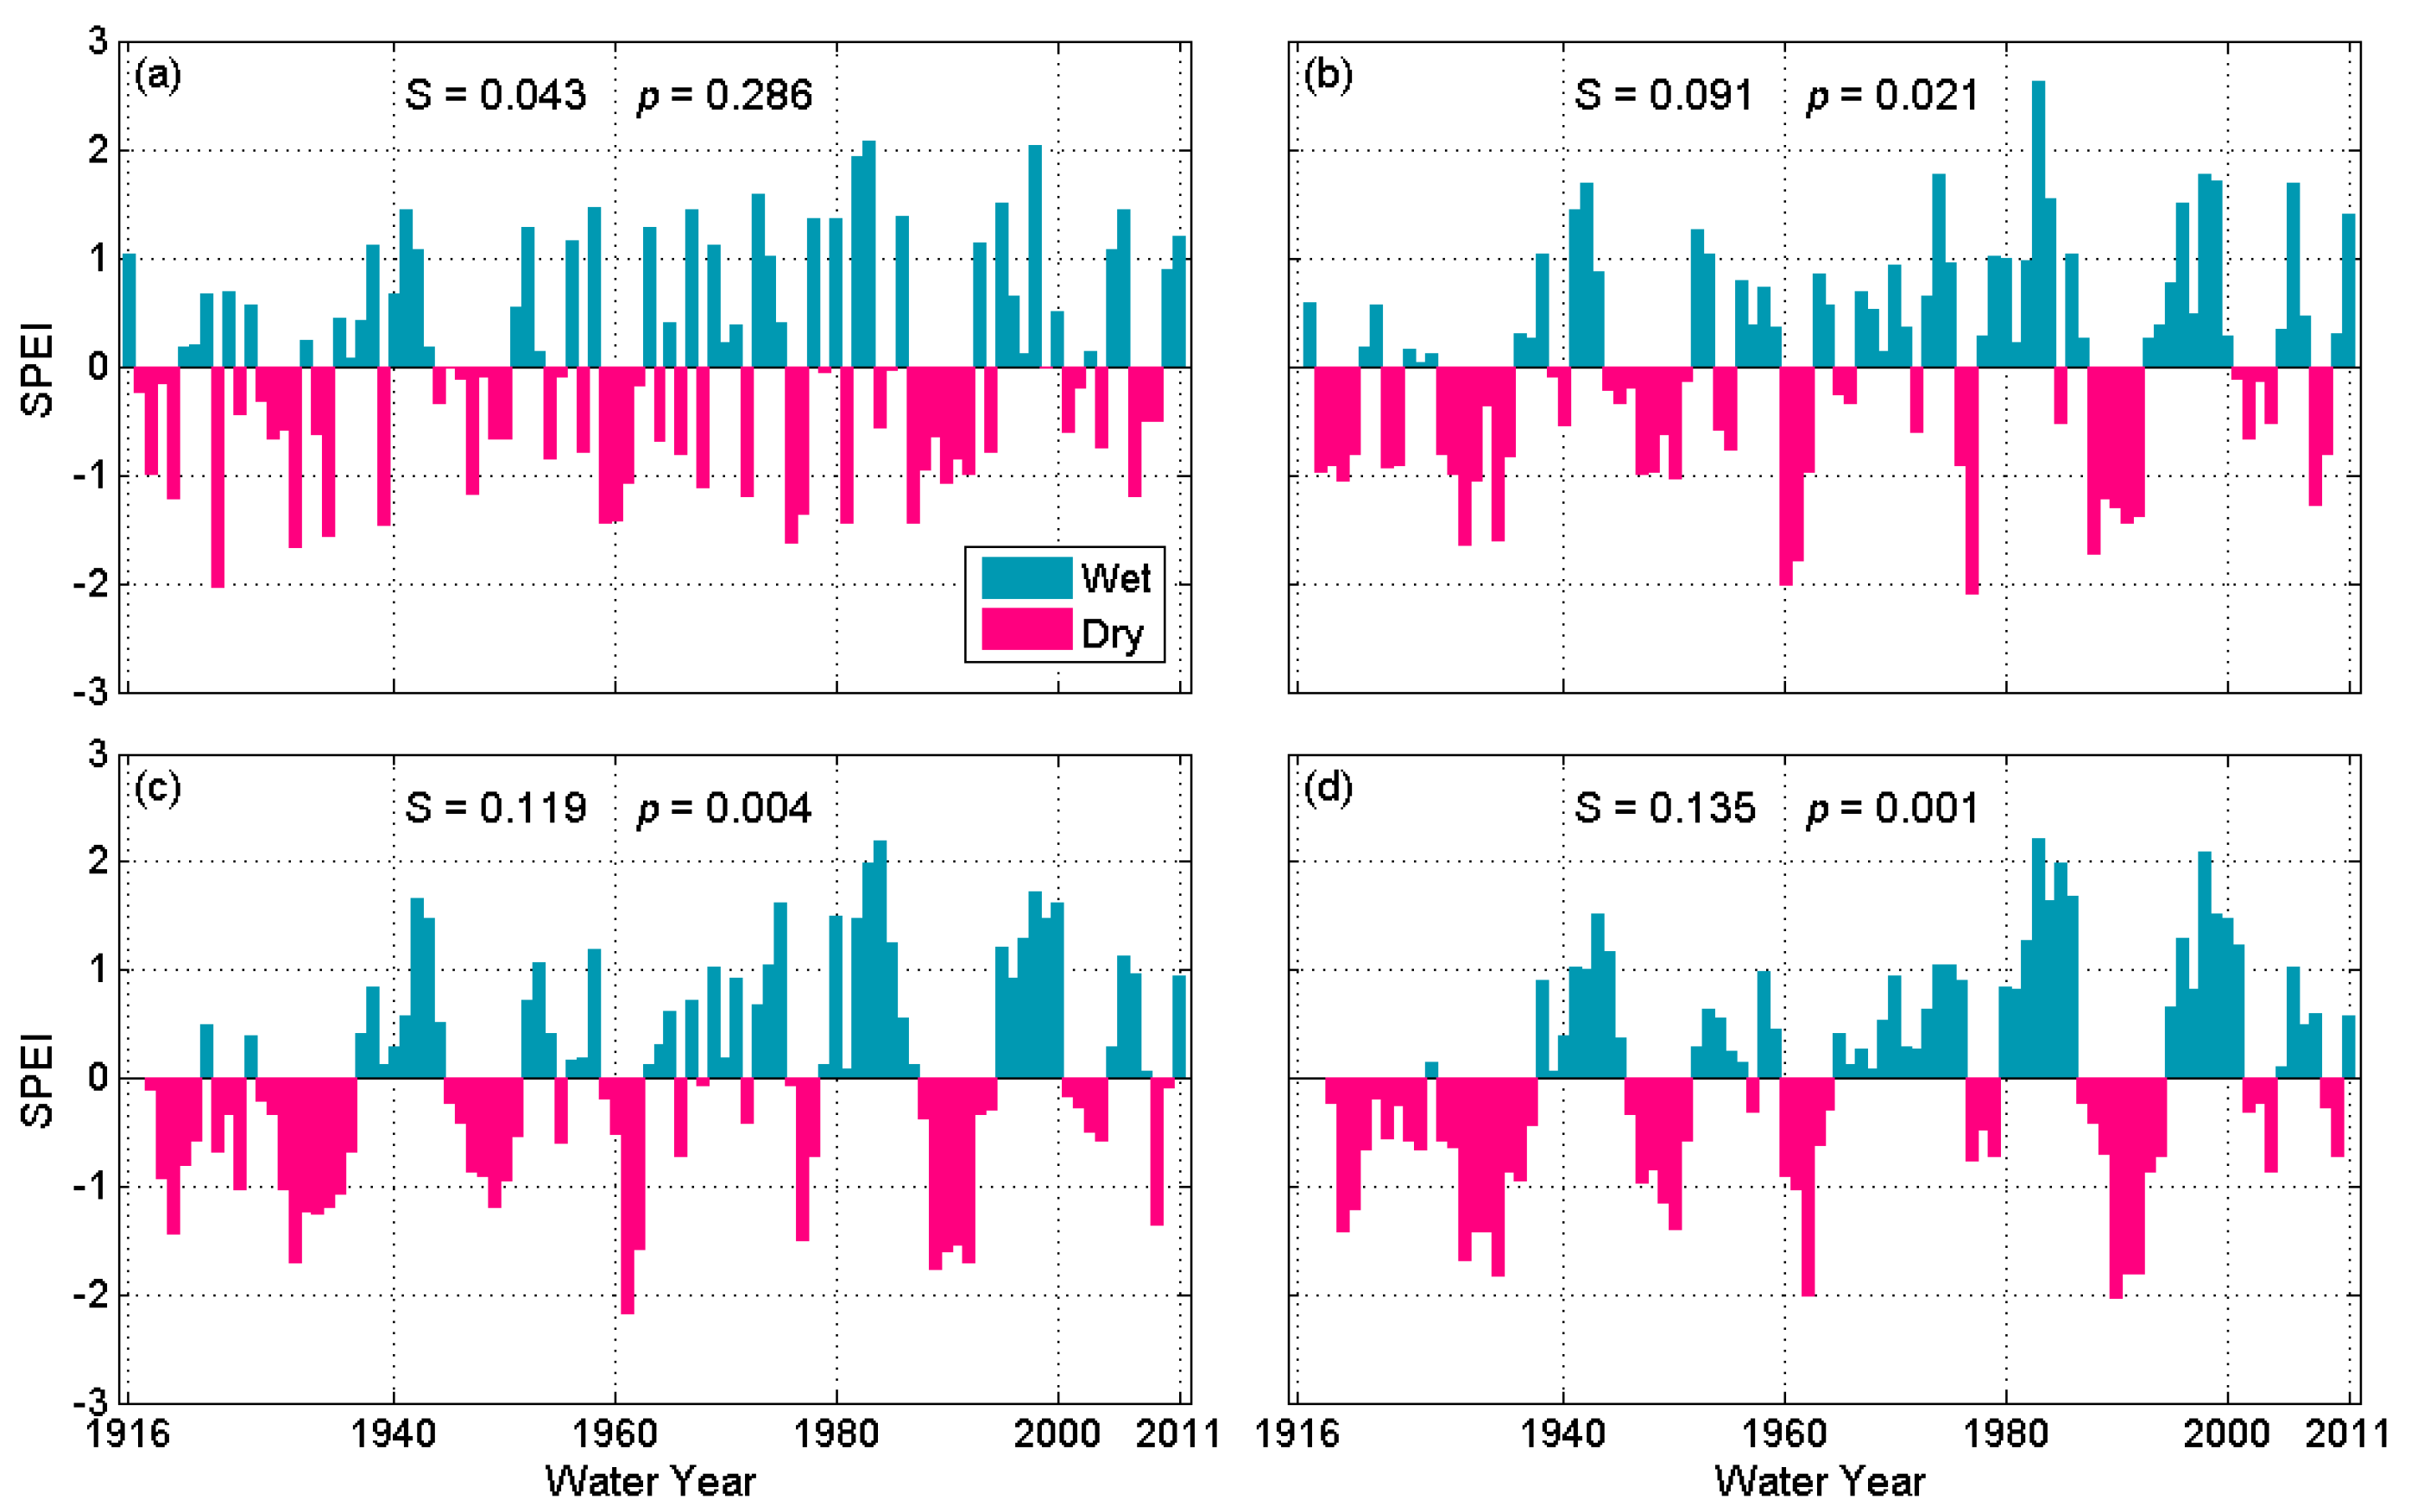
Figure 4 illustrates SPEI values calculated on an annual scale and multi-year (up to four years) scales for West Delta. On the annual scale (Figure 4a), SPEI generally parallels the annual precipitation variation pattern (e.g., Figure A1 in the Appendix A). The alternation of dry conditions and wet conditions largely mimics that of the below-normal precipitation years and above-normal precipitation years in annual precipitation time series (e.g., Figure A1). On longer time scales (Figure 4b–d), it is evident that the longest dry and wet spells become longer, accordingly. For instance, on one to four-year scales, the longest wet periods with consecutive positive SPEI values are 6 (1995–2000), 8 (1993–2000), 9 (1979–1987), and 12 (1965–1976) years, respectively. This is because, on multi-year scales, SPEI values reflect not only the conditions of the current year but also of the previous year(s). The overall trend in the SPEI index at each temporal scale is also assessed. A positive trend is detected for each of them (on one to four-year scales), indicating that the climate during the analysis period from water year 1916–2011 is trending toward wet. The trend slope is steeper at longer time scales, while the corresponding p-value becomes smaller. This suggests that the trend signal is stronger and more compatible at longer temporal scales. It is worth noting that the trend of the annual SPEI is not compatible. Trend assessment is also conducted for the North Delta and South Delta at those four temporal scales. The trends identified are all positive (Table A2 in the Appendix A), but are less compatible with wetter or drier tendencies during the historical period from 1916–2011.
Overall, the Delta has the typical Mediterranean climate, with dry and warm summers as well as wet and cool winters. Among three sub-regions, on average, South Delta has historically been the driest and warmest, with the least number of extreme storms (quantified by number of very wet and extremely wet days), while West Delta is the wettest and coolest, with the largest number of extreme storms. In the historical period (water year 1916–2011), there is no trend toward wetter or drier conditions in general.
3.2. Projected Changes in Mean Climate
Comparing projected mean annual total precipitation during mid-century and late century to the corresponding GCM-based baseline simulations under historical climate forcings (Figure 5a), the 32 climate models produce large variations in precipitation changes ranging from about −40% up to around 60%. This is in line with a widely recognized feature of climate projections in the broader Central Valley region that there is no consensus on the change direction (i.e., wetter or drier) of future precipitation across different climate models [28,29]. The variation ranges are generally larger for the higher emission scenario RCP 8.5 (versus lower emission scenario RCP 4.5) and during the late-century (versus the mid-century), indicating more uncertainty in precipitation projections under higher emissions and further into the future. In spite of large variations in these precipitation projections, on average (in a median sense), the changes are fairly small under both emission scenarios during two future periods. The absolute median changes are consistently less than 3% from the historical baseline. Comparing three sub-regions, the changes in projected precipitation in North Delta and West Delta are similar to each other. One notable difference in the driest South Delta region is that its 75th percentile (and above) precipitation changes are generally smaller than their counterparts in other two sub-regions under all four scenarios considered here. This suggests that the top 25% changes for South Delta are smaller than that of the other two sub-regions.
In contrast, the warming signal in mean annual temperature change is clear and consistent across all 32 climate models (Figure 5b). This is also consistent with previous findings on warming in the broader Central Valley region [28,29]. Warming in the late-century is clearly more significant (about 0.8 °C under RCP 4.5 and 2 °C under RCP 8.5) than that of the mid-century. Comparing two emission scenarios, during the mid-century, the warming associated with RCP 8.5 is slightly higher (about 0.3 °C) than that of RCP 4.5. In late-century, however, the gap (about 1.5 °C) becomes much larger. On average, the warming magnitude across three sub-regions is fairly similar.
In addition to changes in annual total precipitation, changes in wet season (October-March) and dry season (April-September) precipitation are also explored (Figure 6). The change pattern in wet season precipitation (Figure 6a) under each scenario is similar to that of the total annual precipitation (Figure 5a), suggesting that wet season precipitation fluctuations dictate total precipitation fluctuations. This is not surprising, as wet season precipitation historically accounts for over 80% of total annual precipitation (Figure 2). For dry season precipitation, over 60% of all 32 GCMs project decreases under both emission scenarios during both future periods. The changes range from −17% to −5% on average, with the largest decreases expected under RCP 8.5 during the late-century (Figure 6b). All three sub-regions tend to have similar change pattern in dry season precipitation under each scenario. The “dry season gets drier” feature has also been reported in other regions of California [28,32,47].
Changes in temperature are also examined in a finer temporal (i.e., monthly) scale (Figure 7). Firstly, similar to the change pattern in annual mean temperature (Figure 5b), the warming magnitude is higher during the late-century than during the mid-century. It is also higher under the high emission scenario than under the low emission scenario. The differences in warming magnitude between two emission scenarios during the mid-century are generally mild. They become more pronounced during the late-century. Secondly, it is evident that these changes exhibit strong seasonality, as the temperature itself does (Figure 3b), with less warming in winter months and more warming in summer months. Furthermore, during cool months from December to April, South Delta tends to have the most significant warming across the three sub-regions. In comparison, the warming signal in North Delta during warm months from May to October is generally the strongest among all three sub-regions.
In short, all GCMs agree on warming over the Delta throughout the end of this century. The warming exhibits strong seasonality, with higher warming expected in the summers and less warming in winters. Across three sub-regions, on average, the coolest South Delta is projected to have the largest warming in winters, while the North Delta is projected to experience the largest warming in summers. Conversely, there is much less certainty on projected changes in precipitation, which tend to be dominated by changes in wet season precipitation. Nevertheless, a majority of GCMs project declines in dry season precipitation. Particularly, the median changes in dry season precipitation are consistently negative (i.e., drier than the baseline) across all sub-regions under both emission scenarios during two future study periods. In comparison, there is no such consensus for the median changes in annual total precipitation and wet season precipitation. Those changes can either be positive or negative but are generally small in magnitude with absolute values less than 3%. On average, the relative wetness and warmness among the three sub-regions tend to stay unchanged from the historical conditions at the annual scale. Namely, West Delta is expected to be the wettest and coolest, while South Delta is expected to be the driest and warmest.
3.3. Projected Changes in Extreme Climate
As previously discussed in Section 2.3, mean and variance contributions from the 10% largest storms (to total precipitation and precipitation variance, respectively), the number of three types of wet days (wet, very wet, and extremely wet), minimum and maximum temperature, and the diurnal temperature range are used to represent extreme climatic variables in this study. This section examines changes in these variables.
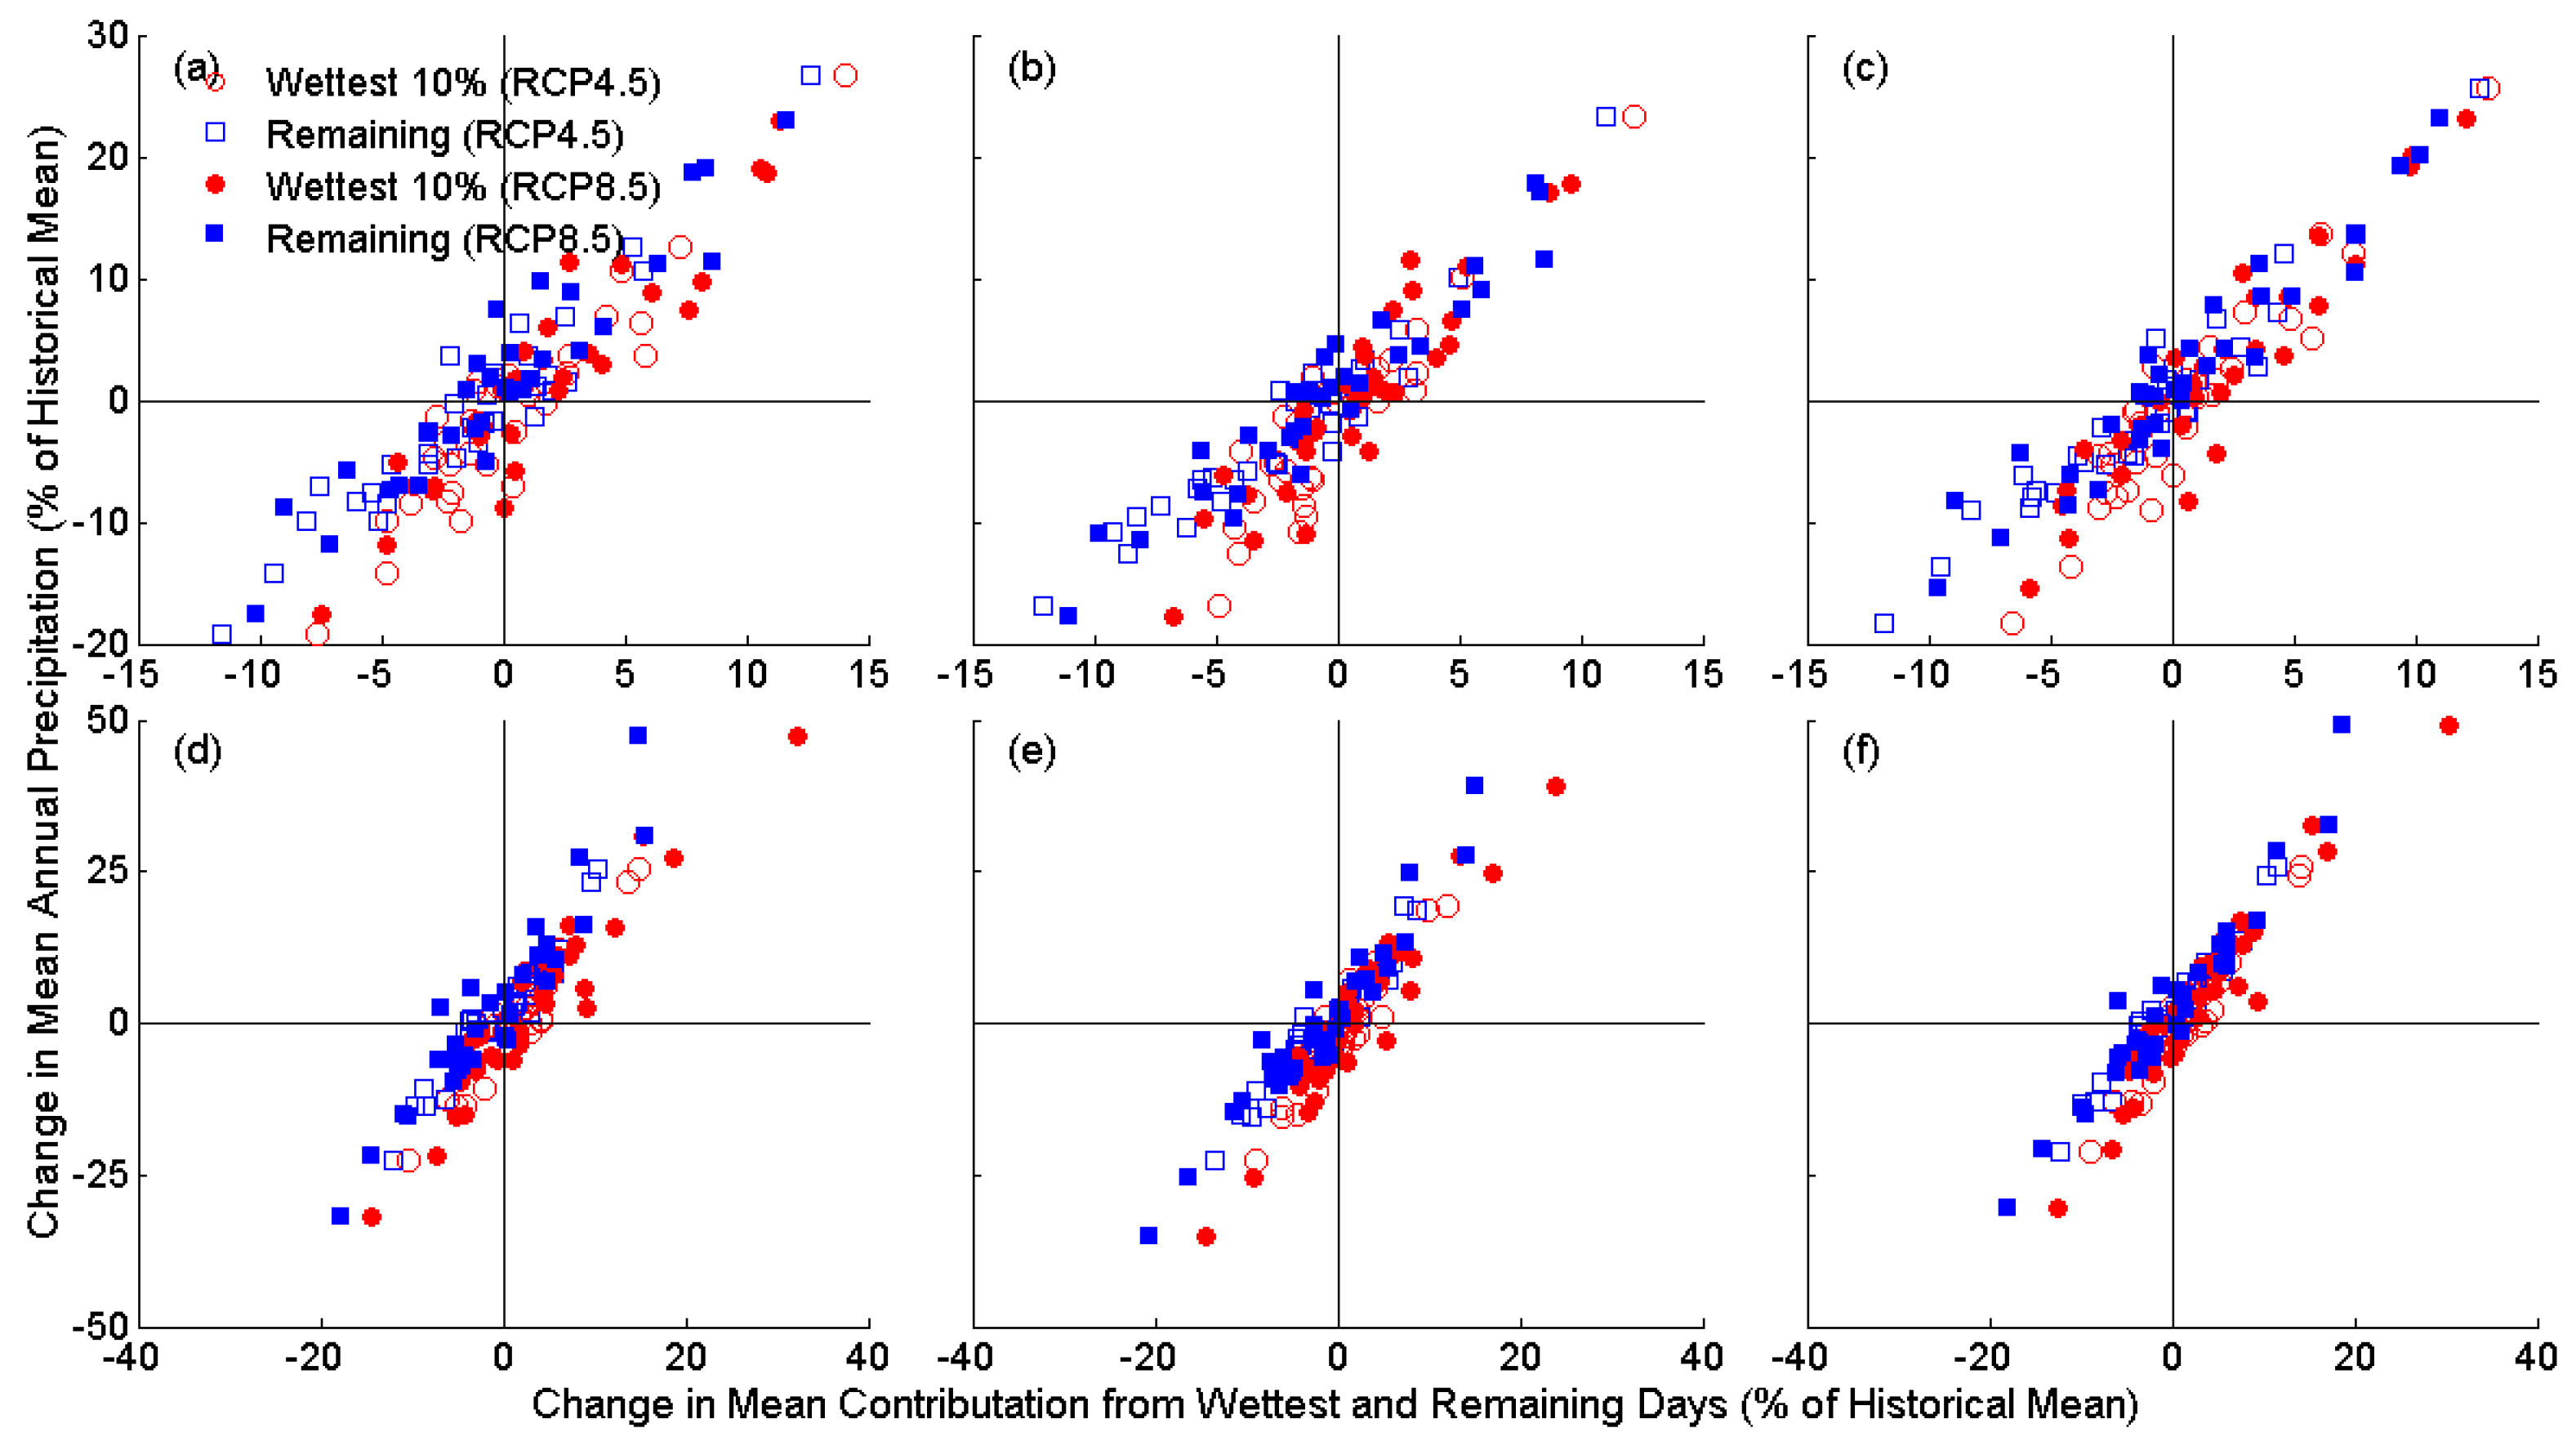
Looking across the 32 GCMs’ projection distribution used in this study (Figure 8), across three Delta sub-regions during both future periods under two emission scenarios, changes in contributions to annual total precipitation from the wettest 10% of storms (interchangeable with the wettest 10% of wet days hereinafter) and the remaining storms (interchangeable with the remaining wet days hereinafter) exhibit strong linear relationships to change in annual precipitation. It is also clear that change in mean contribution from the wettest days (red circles) and changes in mean contribution from the remaining days (blue squares) largely overlap each other. This indicates that changes in contribution from each type of storm roughly accounts for about half of the change in annual total precipitation, similar to the 50-50 split in their contributions to annual precipitation (Figure 2b). This can be also explained by the fact that the strength of the linear relationship between precipitation change and contribution change from the wettest 10% of wet days is fairly close to its counterpart between precipitation change and contribution change from the remaining wet days (Table A3). However, for large increases (>25%) in annual precipitation, the contribution from the 10% wettest days seems larger than that from the remaining wet days. This is particularly true for the wettest model during the late-century, which projects about 50% increases in annual precipitation. In this case, the contributions from the 10% wettest days are nearly twice that from the remaining wet days. Contrariwise, for large decreases (<−10%) in annual precipitation, contributions from the remaining wet days are larger than contributions from the 10% wettest days. This is more noticeable during the mid-century than in the late-century. It is also evident that the change signals are generally stronger during the late-century (versus mid-century) under RCP 8.5 (versus RCP 4.5). In particular, the largest increase and decrease in annual total precipitation (along with the changes in contributions from two types of wet days) occur during the late-century under RCP 8.5. Comparing three sub-regions, their change patterns are fairly similar to each other. The changes in North Delta and South Delta are slightly more spread out than that of West Delta. This suggests that the strength of the linear relationship between the annual precipitation change and the contribution changes associated with the latter is higher than that of the former (Table A3).
On average, however, precipitation changes are generally small. The absolute value of the average of individual changes derived from 32 GCMs is generally around or smaller than 3% for three sub-regions under two emission scenarios during both future periods (Table 2). Changes in mean contribution from the 10% wettest days are all positive except for one case (South Delta under RCP 4.5 in mid-century), indicating more such wet days in the future no matter how the annual precipitation changes. Changes in mean contribution from the remaining wet days are mixed across three sub-regions. Nevertheless, South Delta is expected to experience decreases in contributions from smaller storms in the remaining wet days in all scenarios. The highest increase in annual precipitation ranges from 17% to 27% under RCP 4.5 during both the future period and under RCP 8.5 during the mid-century (Table 2). For RCP 8.5 during the late-century, the increase is up to 49% (West Delta). Among three sub-regions, the increases in South Delta are the smallest. During the mid-century, contributions to these increases from the top 10% wettest days and the smaller storms are fairly close to each other. The contributions from the top 10% wettest days are slightly higher. During the late-century, however, the contribution from the top 10% wettest days becomes more dominant. The highest decrease in annual precipitation varies from about 15% (West Delta under RCP 8.5 during the mid-century) to 35% (South Delta under RCP 8.5 during the late-century). Contributions to the decline from the smaller storms are generally more pronounced than the contributions from the 10% wettest days.
Changes in the variance of total precipitation also vary largely from model to model (Figure 9). Comparing three sub-regions, the variation range of South Delta is the smallest on average, which is similar to changes in mean annual precipitation, as illustrated in Figure 8. During the mid-century, changes in precipitation variance range from −43% (South Delta) to 123% (North Delta) under RCP 4.5 (Figure 9; Table A4 in the Appendix A). Under RCP 8.5, the increase magnitude is generally milder, while the decrease magnitude is more significant. Specifically, the changes vary from −59% (West Delta) to 81% (North Delta). During the late-century, the changes are even wider as expected. The variation ranges are from −52% to 151% and from −59% to 399% for RCP 4.5 and RCP 8.5, respectively. The changes in the variance of the top 10% wettest days generally mimic the changes in precipitation variance, though the magnitude of the former is smaller than the latter. A strong linear relationship (represented by the red circles in Figure 9) between them is evident. Meanwhile, there seems to be a linear relationship (blue squares in Figure 9) between changes in the variance of the remaining (smaller) storms and changes in precipitation variance as well. However, the strength of the relationship is markedly weaker. These observations indicate that, similar to the historical baseline, variability in large storms is expected to continue dictating the variability of annual precipitation in the Delta in mid-century and late-century.
Different from changes in the mean contributions (roughly 50-50 split) from the 10% wettest days and the remaining wet days as depicted in Figure 8, these changes in precipitation variance mostly come from changes in the variance of the wettest 10% of storms (red circles in Figure 9). This is also evident by examining the percent of change in precipitation variance explained by changes in variance contributions from wettest 10% of storms and remaining smaller storms, respectively (Table 3). Under RCP 4.5, changes in the variance of the wettest-day contribution explain around and over 80% of the change in precipitation variance while their counterparts of the remaining wet days are consistently less than 30%. Under RCP 8.5 during the mid-century, the percentages explained by changes in the variance of the wettest-day contribution are still over twice their counterparts from the remaining wet days. Under RCP 8.5 during the late-century, though percentages explained by changes in the variance of the remaining day contribution increase largely (to 50–60%), they are still much smaller compared to those from the wettest-day contribution (above 86%). Looking across three sub-regions, changes in the wettest-day contribution of South Delta have the smallest percentages under both emission scenarios during both future periods, while it is the case for North Delta for changes in the remaining day contribution. Put differently, variations in the wettest 10% of storms in the driest sub-region explain the variations in total precipitation the least. In comparison, in the wettest sub-region, the remaining smaller storms explain the variations in total precipitation the least. This suggests higher dominance of the wettest storms in wetter sub-regions on year-to-year variation in precipitation.
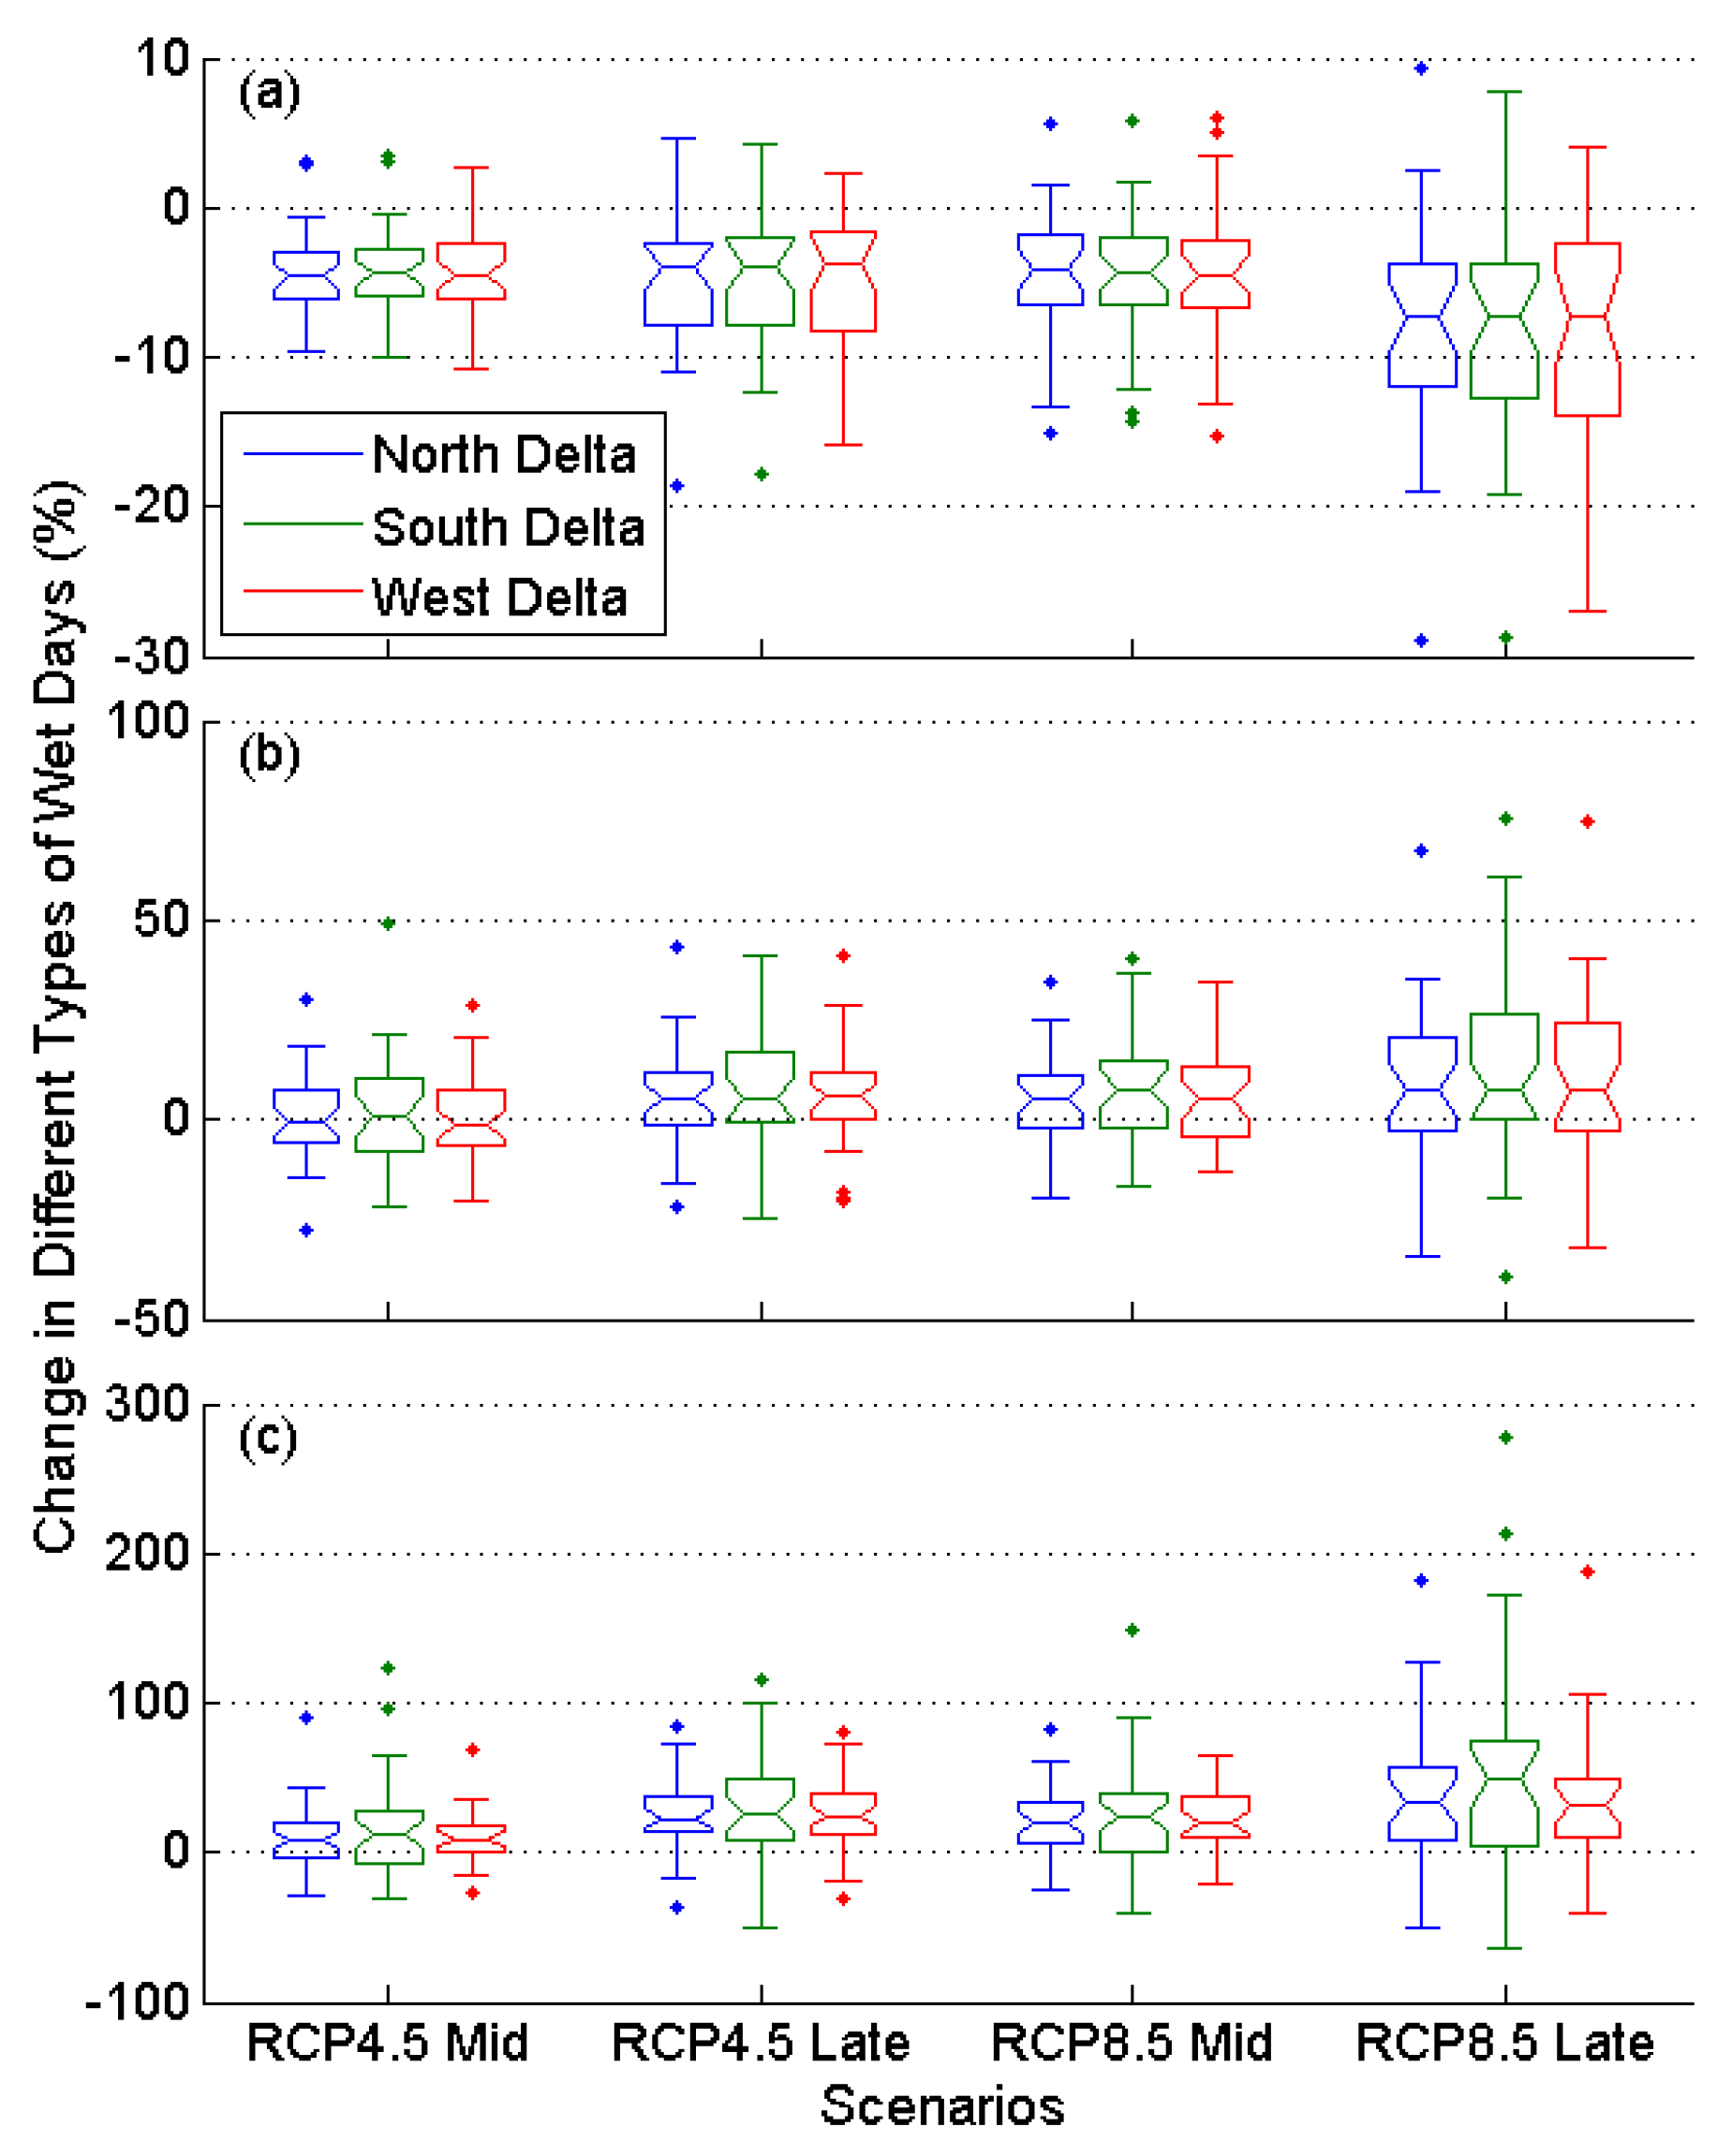
In addition to changes in the mean and variance of annual precipitation as well as their wettest-day and remaining-day contributions, changes in the number of wet days, very wet days, and extremely wet days are also investigated (Figure 10). A majority (>75%) of GCMs project decreases in the number of wet days per year (Figure 10a). The median decreases under RCP4.5 are slightly smaller compared to their counterparts under RCP 8.5. The differences among three sub-regions are fairly small (less than 0.3%).
Comparing to changes in the number of wet days, the changes in the number of very wet days are different in terms of both direction and magnitude. As depicted in Figure 10b, under RCP 4.5 during the mid-century, the median changes in the number of very wet days are minimal with absolute change values less than 1%. Under RCP 4.5 during the late-century, more than two thirds of GCMs project increases rather than decreases. The median changes are consistently above 5% for three sub-regions. This is also the case for RCP 8.5 during the mid-century. One noticeable difference is that the median change for South Delta is about 7.8% (versus around 5% for the other two sub-regions). Under RCP 8.5 during the late-century, the median changes for three sub-regions are all above 7%. Similar to changes in the number of wet days, the variation ranges of changes in the very wet days are generally wider under a higher emission scenario and further into the future. In terms of magnitude, however, the latter (change in very wet days) is evidently larger. The variation range of RCP 8.5 during the late-century is the largest, particularly for South Delta which ranges from −40% to 75% (versus from −29% to 9% for changes in the number of wet days under the same emission scenario during the same projection period).
In comparison, the variation ranges of changes in the extremely wet days are even wider (Figure 10c), indicating that there is even less consensus among GCM models on how extreme precipitation events are expected to change from the historical baseline. Nevertheless, over two-thirds of models project an increase in the number of extremely wet days, particularly during the late-century where more than 27 out of 32 GCMs project increases. The median changes under RCP 4.5 are consistently above 8% and above 22% during the mid-century and late-century, respectively. Under RCP 8.5, the median increases are over 19% and 31% during the two future periods, respectively. Among three sub-regions, the highest increases are expected over South Delta in all four scenarios particularly for RCP 8.5 during the late-century where a median increase of 49% is projected.
In short, on average, the number of wet days is projected to decrease while the number of very wet and extremely wet days are projected to increase. By and large, this is in line with previous findings that future wet seasons in other places in California will likely be compressed in length, while the magnitudes of wet extremes will increase [11,48].
For temperature, changes in annual maximum and annual minimum temperature are first examined (Figure 11). It is clear that three sub-regions share some common change patterns. First, all changes are positive, meaning that warming is expected in both temperature variables. Second, warming magnitude becomes larger under higher emission scenarios further into the future. Third, there is roughly a linear relationship between warming in the maximum temperature and warming in the minimum temperature. This implies that GCMs project similar ratios of warming in the maximum temperature over warming in the minimum temperature. In general, the relationship is the strongest for West Delta and the weakest for North Delta. It is also stronger during the late-century than during the mid-century. Despite this linear relationship, the magnitude of the warming in maximum temperature differs from that of the minimum temperature. Changes in DTR are also investigated (Figure 11d). In general, over 70% of the GCMs project increases in annual mean DTR for all scenarios except for RCP 8.5 during the late-century. The median DTR difference ranges from nearly no change (West Delta, RCP 8.5 during the late-century) to 0.3 °C (North Delta, RCP 4.5 during the late-century). Among three sub-regions, changes over West Delta is consistently the smallest. Changes in North Delta are slightly higher than that of South Delta.
Looking at the warming in maximum and minimum temperature at a finer monthly scale in a mean sense (represented by the mean of the 32-model ensemble), all three sub-regions also have similar patterns (Figure 12). Firstly, the warming has strong seasonality with the lower warming in winter–spring and higher warming in summer–fall. The highest warming typically occurs in August. Secondly, for a specific scenario, the average warming in the maximum temperature is slightly higher than that of the minimum temperature. Thirdly, for a specific variable (i.e., maximum or minimum temperature), the warming in the late-century is typically 1 °C higher than that of the mid-century under RCP 4.5; the number is slightly higher than 2 °C under RCP 8.5. These patterns persist when looking at all 32 models as a whole (Figure A3 and Figure A4 in the Appendix A).
The changes in monthly DTR exhibit less seasonality compared with changes in maximum and minimum temperature, particularly during the mid-century when the changes are somewhat uniform across different months (Figure 13). Most models project that the changes vary between −1 °C and 1 °C during the mid-century and between −1 °C and 2 °C during the late-century. As for the median changes, they are generally positive across all months under RCP 4.5 except for August during the late-century, where the median changes are near zero. Under RCP 8.5, the median changes in January, February, and August are minimal (near zero) during the mid-century; during the late-century, while January and February also tend to have minimal changes, July to September observe negative changes. This indicates that during these three months under RCP 8.5 in the late-century, warming in monthly minimum temperature is expected to be more significant than warming in monthly maximum temperature. When looking at all 12 months as a whole, however, the changes in DTR are positive, indicating that the warming in the maximum temperature is still larger than the warming in the minimum temperature. Comparing three sub-regions, the differences in DTR changes among them are generally subtle.
All in all, changes in the mean of the wettest 10% of storms and changes in the mean of the remaining storms are projected to contribute equally to changes in mean annual total precipitation on average. However, changes in the variance of the wettest 10% of storm account for a majority of changes in the variance of annual total precipitation. Meanwhile, on average, the number of wet days is projected to decrease, while the numbers of very and extremely wet days are projected to increase. As for temperature, changes in minimum temperature generally parallel changes in maximum temperature, yet the latter are slightly larger in magnitude. Consequently, changes in DTR are positive on average. Among three sub-regions, North Delta and West Delta tend to have the highest and lowest annual DTR, respectively. Additionally, warming in minimum and maximum temperature exhibits a strong seasonality, with higher warming expected in summers and less warming expected in winters. In comparison, the seasonality of changes in DTR is relatively weaker.
3.4. Projected Drought Trend
California, including the Delta area, is prone to drought [30,40]. While the occurrence, severity, and lasting period of drought events are difficult to predict decades in advance, the overall tendency of drought events can inform long-term drought response planning activities. This section examines the trend in projected future drought conditions (represented by the Standardized Precipitation-Evapotranspiration Index (SPEI)) at various temporal scales which are relevant to operational planning practices.
Figure 14 shows slopes in SPEI indices calculated on one- to four-year scales based on precipitation and temperature projections of all 32 GCMs. Under RCP 4.5, over half of the projections have a statistically significant (with p-value less than 0.05) decreasing trend. When the time-scale becomes longer, more projections show a significant decreasing trend, more compatible with drier conditions further into the future. Under RCP 8.5, all projections except for one projection at West Delta on the annual scale have a decreasing tendency. For this exception, the trend is also negative (−0.093/decade). However, its p-value is 0.068, which is slightly higher than the significance threshold level 0.05. Looking at the magnitude of the changing tendency, the trend slope varies largely among different GCMs. This is particularly true for RCP 8.5 projections where there are always a number of outliers, indicative of large disagreement among different models on the extent of future dry conditions even though there is an extremely high consensus on a drier tendency. In addition, the trend slopes associated with RCP 8.5 are generally steeper (with higher absolute values) than their counterparts of RCP 4.5. This suggests more severe dry conditions under RCP 8.5 than RCP 4.5 further into the future. This is expected, as RCP 8.5 projections on precipitation show small discrepancies from that of RCP 4.5 projections, while RCP 8.5 projections on temperature are markedly higher than their RCP 4.5 counterparts (Figure 5), given that the SPEI index is determined from precipitation and temperature collectively.
Among three sub-regions, it is evident that South Delta has the largest decreasing trend on average. This may be explained by the fact that South Delta is the driest and warmest sub-region in the Delta (Table 1) while its projected changes in precipitation and temperature are similar to those changes in North Delta and West Delta. Otherwise stated, the driest and warmest South Delta faces the most severe drought risk in a warming climate, which has also been reported on a hydrological region scale in a previous study [28].
4. Discussion and Conclusions
4.1. Findings
This study provides a close-up look at potential changes in Delta’s mean and extreme climate as well as the overall drought trend in the Delta through the 21st century based on projections from 64 plausible future projections from 32 GCMs under two emission scenarios, RCP 4.5 and RCP 8.5. RCP 8.5 is a “business as usual” emission scenario; RCP 4.5 is a relatively lower emission scenario that assumes mitigation actions will be taken to reduce greenhouse gas emissions. California’s Fourth Climate Change Assessment (CCCA4) selected these two scenarios to address uncertainty in future concentrations of greenhouse gases [25]. It is worth noting that there are other scenarios (e.g., RCP 2.6 and RCP 6.0) not included in the CCCA4 that may be worth exploring in the future.
Some findings of this study are largely in line with those previously reported in the broader Central Valley region and other regions in California [28,30,48]. Firstly, there is a unanimous agreement among all GCMs that warming conditions are expected in the Delta. Moreover, warming in the maximum temperature tends to be higher in most months than that of the minimum temperature. In addition, the warming exhibits a strong seasonality, with summers and winters expecting more and less warming, respectively. There is also a weaker seasonality in changes of the diurnal temperature range. Furthermore, the warming signal is stronger in the late-century (versus the mid-century) under the higher (versus the lower) emission scenario. Secondly, there are large uncertainties on the direction of precipitation changes. The uncertainties become even larger during the late-century under the higher emission scenario. Despite uncertainties on changing direction (decrease or increase) for annual precipitation, the dry season (April-September) in the Delta is projected to be even drier. In the meantime, the number of wet days is projected to decrease while the number of big storms (represented by number of very wet days and extremely wet days) is expected to increase. Thirdly, there is a tendency that drier conditions in the Delta are expected further into the future, particularly under the higher emission scenario.
A new key finding of this study is that historically the wettest 10% of storms in the Delta contribute nearly half of the mean annual precipitation and make up three-fourths of the variance of annual precipitation. Projected changes in the mean and variance of annual precipitation reflect similar changes in the mean and variance of the largest 10% of storm contributions. Specifically, changes in the amount of wettest 10% of storms and the amount of the remaining storms contribute equally to changes in mean total annual precipitation for most GCM projections. For the wettest projection (largest increase in precipitation), however, the contribution from the wettest 10% of storms is relatively bigger, particularly under the higher emission scenario. Conversely, for drier projections (decrease in precipitation), a greater contribution comes from the remaining storms.
Another new finding of this study is that even though three sub-regions of the Delta share similar change patterns, their change magnitudes are not uniform. A noticeable difference is that South Delta is the only sub-region where more than half of climate models project no change or decreases in annual total precipitation. Meanwhile, warming in annual mean temperature in South Delta is slightly higher than that of two other sub-regions. Consequently, South Delta is expected to face the most severe drought risks as it is expected to receive the least amount of precipitation and experience the highest increase in temperature among three sub-regions, particularly under the higher emission scenario. Another difference is that, on average, contributions to changes in mean and variance of annual precipitation from the wettest 10% of storms in South Delta are less than their counterparts in North Delta and West Delta. These differences imply that different adaptative strategies may be required for South Delta, which is the driest and warmest and thus most vulnerable sub-region of the Delta.
4.2. Challenges
These findings pose a number of challenges to the Delta’s water supply reliability and ecosystem health. Firstly, warming temperatures will most likely lead to increased consumptive use and thus increased water demand in and out the Delta. Meanwhile, decreasing dry season precipitation means that the Delta would rely more on upstream reservoir release to meet water demand during the dry season, while the dry season reservoir release is expected to be less reliable as warming shifts wet season precipitation partitioning and leads to more winter runoff and less spring-summer snowmelt that replenishes reservoir storage. Additionally, increases in minimum temperatures would likely decrease the number of chill days. Some crops in the Delta require a certain number of chill days to break dormancy and start flowering. With fewer chill days, the crops may not flower and thus be less productive.
Secondly, variations in large storms are projected to continue dominating variations in total precipitation and thus the wet and dry spells of the Delta. Particularly, extreme storms are expected to occur more frequently in general. Along with projected sea level rise, increasing extreme storms increase flood potential and the failure risk of the already aging levee system in the Delta. On the other end of the spectrum, dry conditions are projected to increase especially under the higher emission scenario. Drier conditions lead to higher risks of subsidence of the land masses in the Delta, which in turn also increase the possibility of levee breach [37]. Levee failures, either caused from flooding or drought, threaten both water supply reliability and ecosystem health in the context of compromising on the safety of the water delivery system, increasing water pollution (e.g., turbidity) and water quality decline (e.g., island inundation induced salt intrusion), among others.
Even more concerning is the compound of warming and drought (so-called warm drought) that is projected to occur more often in the Delta. Warm droughts are expected to reduce freshwater inflows to the Delta while increasing water temperature in the Delta (besides increasing levee-stability risks), forming a dual threat (not enough freshwater nor dissolved oxygen [49]) on aquatic species [50,51].
4.3. Delta Resiliency
The Delta has its own natural and structural resiliency to address these challenges (to a certain extent). One example is the response to the most recent 2012–2015 warm drought, which is characterized by record-high temperature, record-low snowpack, and large deficit in precipitation statewide [35,52,53]. The drought, a potential precursor of the “new-normal” in the future [54], highlighted the vulnerability and tested the resiliency of the current water system in the Delta. Changes in both the Delta operations (including operating the reservoirs feeding freshwater into the Delta) and the Delta’s infrastructure framework were made to manage the drought. Exports of SWP and CVP were dramatically cut due to significantly reduced freshwater inflows. A temporary emergency drought barrier (Figure 1) was installed in South Delta to block landward salt intrusion into the intakes of SWP and CVP [55].
Another example was the re-operation of the Suisun Marsh Salinity Control Gates (SMSCGs; Figure 1) during the summer of above-normal and below-normal years [56]. SMSCGs are typically operated from October to May when salinity measurements at compliance locations in West Delta exceed preset thresholds. When in operation, the gates are open on ebb tides to allow freshwater from North Delta and South Delta flow into the marsh; on flood tides, the gates are closed to retain freshwater inside and reduce saline water intrusion into the marsh. In 2018, DWR conducted a pilot project to re-operate the gates in August. The re-operation turned out to be very effective in terms reducing salinity in and improving the habitat for Delta Smelt in West Delta [56].
Other adaptive measures including farmland idling, water conservation, and relaxed regulatory requirements have been all applied during the 2012–2015 drought with considerable success [36,40]. Nevertheless, it is hard to predict whether (or when) the changes projected in the current study and previous relevant studies will exceed or exhaust the Delta’s resiliency or adaptive capacity. It has been advocated that greater integration of monitoring, modeling, and decision making across variables, time, and space are necessary to make the Delta more resilient [29,31,57]. Along the same lines, the next section discusses a few future directions for that work.
4.4. Future Directions
Delta water supply operations and planning activities largely rely on flow, water quality, biological, and other data measured inside and outside of the Delta. The current monitoring stations are generally sparse. Remote sensing techniques can be employed to supplement the current monitoring system and provide better spatial coverage of target variables. The benefits of remote sensing for the Delta are at least threefold. First, remote sensing can be applied in monitoring land subsidence and predicting potential water infrastructure (e.g., levee) failure. This information is of the utmost importance to water supply reliability and ecosystem health in the Delta. Second, remote sensing can be used in estimating farmland evapotranspiration, which is a main component of the consumptive use. Consumptive use plays an important role in Delta’s water budget. It can exceed SWP export in dry years. Third, remote sensing can provide a more comprehensive accounting of the soil moisture, surface water, and groundwater storage. Example applications on these fronts in California include space-based and airborne inter-radar (InSAR), which has been used in monitoring ground deformation and land subsidence in the Central Valley [58,59]; Landsat 8 satellite observations were utilized to estimate evapotranspiration of three mature pistachio orchards in the San Joaquin River region [60]; Gravity Recovery and Climate Experiment (GRACE) satellite data have been employed in analyzing groundwater table depth, storage variations, and groundwater drought in the Central Valley [61,62,63], yet further work needs to downscale the data to be applicable at regional scales (e.g., the Delta region). Despite these promising applications, those remote sensing products have not been directly explored (e.g., InSAR, GRACE) or are in the process of transferring to meaningful operative use in the Delta [64]. Climate change is expected to exacerbate land subsidence and make accurate water accounting (including consumptive use, surface water storage, and groundwater storage) more challenging in the Delta. It is imperative to integrate remote sensing and traditional in situ monitoring systems to advance our understanding on the current status and overall trend of the physical Delta. This understanding informs us on the capability, limitations, and risks of the water system, which collectively lay the foundation for adaptive management of the Delta in a changing climate.
An integrated (hybrid remote sensing and in-situ) monitoring system can increase the certainty on the variables measured but cannot eliminate uncertainties associated with them. Uncertainties arise from many aspects ranging from the system error of the monitoring equipment, representativeness of the measurement, and ignorance, among others. These uncertainties of measured variables that are either directly or indirectly (e.g., calibrate or drive models) applied to inform decision making need to be addressed. In the context of climate change, the largest uncertainties exist in precipitation projections. The number of climate models projecting wetter conditions is nearly identical to the number of models projecting drier conditions (Figure 5). This wide range of uncertainties on the Delta’s main source of riverine inflows would challenge the Delta’s current ecosystems and water operations.
Data is an indispensable building block of the decision-making process. Models simulating complex hydrologic, hydrodynamic, water quality, and biological processes in the Delta are also essential in terms of providing realistic guidance to the Delta’s operations and planning activities. In the Delta, modeling is a common practice in guiding SWP and CVP operations [65] and assessing the feasibility of drought barrier installation [66], Delta restoration [67], and SMSCGs re-operation [56], among many others. While useful, models are complex representations of the reality. There are inherent uncertainties in model structure and parameters.
Uncertainties associated with the data and models involved in Delta modeling practices remain largely unexplored. Instead, multiple models are typically developed for similar modeling purposes in the Delta by different agencies. As an example, there is a suite of hydrodynamic and salinity transport models (e.g., DSM2, SCHISM, RMA, UnTrim, Delft3D, etc.) that have been developed for and (or) applied in the Delta [67,68,69,70,71]. Each model has its own assumptions, configuration, structure, and parameters, and thus may require different ways of uncertainty assessments. One approach to handling model structure uncertainty is the multi-model ensemble method. The method capitalizes on the strengths of each model, while yielding better performance than using individual models. This can be achieved by assigning different weights to different model results, yielding a single set of weighted average model outputs. This approach will be explored in the future work.
4.5. Concluding Remarks
This study is the first to explore climate change exclusively over the Delta using a wide range of climate projections tailored for operational planning activities in California. The study offers new insights on potential changes in the mean and extreme climate of the Delta. The study also discusses future work to better prepare for these changes. In a nutshell, this study provides meaningful information that can be used to guide water resources planning and management practices in the Delta.
Funding
This research received no external funding.
Data Availability Statement
Data used in this study are available at https://cal-adapt.org/data/ (accessed on 1 January 2019).
Acknowledgments
The author would like to thank their colleagues Michael Anderson, Elissa Lynn, and Jamie Anderson for their insightful, detailed, and constructive comments on an earlier version of the manuscript. The author also wants to thank five anonymous reviewers and the editor for their thorough and valuable comments that largely improved the quality of the study. The views expressed in this paper are those of the author, and not of the State of California.
Conflicts of Interest
The author declares no conflict of interest.
Appendix A
Figure A1.
(a) Annual total precipitation from water year 1916–2011; (b) contributions to the annual precipitation from the wettest 10% of wet days; and (c) contributions from all remaining wet days for North Delta. Green curves designate 5-year moving average values.
Figure A1.
(a) Annual total precipitation from water year 1916–2011; (b) contributions to the annual precipitation from the wettest 10% of wet days; and (c) contributions from all remaining wet days for North Delta. Green curves designate 5-year moving average values.

Figure A2.
Box-and-whisker plots of (a) contributions (in percentage) from the wettest 10% of wet days and the remaining wet days to mean annual total precipitation; (b) contributions (in percentage) from the wettest 10% of wet days and the remaining wet days to annual total precipitation variance; and (c) annual precipitation variance explained by the wettest 10% of wet days and the remaining wet days based on simulations from 32 GCMs driven by historical forcings from water year 1960–1999. “N”, “S”, and “W” indicate North Delta, South Delta, and West Delta, respectively. “Wet” and “Rem” designate the wettest 10% of wet days and the remaining wet days, respectively. Filled blue circles indicate the corresponding historical baseline values derived from the Livneh historical data [38] during the same period.

Figure A3.
Box-and-whisker plots of changes in monthly maximum temperature (Tm) under (a) RCP 4.5 during the mid-century; (b) RCP 8.5 during the mid-century; (c) RCP 4.5 during the late-century; and (d) RCP 8.5 during the late-century across three sub-regions of the Delta.
Figure A3.
Box-and-whisker plots of changes in monthly maximum temperature (Tm) under (a) RCP 4.5 during the mid-century; (b) RCP 8.5 during the mid-century; (c) RCP 4.5 during the late-century; and (d) RCP 8.5 during the late-century across three sub-regions of the Delta.

Figure A4.
Box-and-whisker plots of changes in monthly minimum temperature (Tn) under (a) RCP 4.5 during the mid-century; (b) RCP 8.5 during the mid-century; (c) RCP 4.5 during the late-century; and (d) RCP 8.5 during the late-century across three sub-regions of the Delta.
Figure A4.
Box-and-whisker plots of changes in monthly minimum temperature (Tn) under (a) RCP 4.5 during the mid-century; (b) RCP 8.5 during the mid-century; (c) RCP 4.5 during the late-century; and (d) RCP 8.5 during the late-century across three sub-regions of the Delta.


Table A1.
32 General Circulation Models (GCMs) used in California’s Fourth Climate Change Assessment [24].
Table A1.
32 General Circulation Models (GCMs) used in California’s Fourth Climate Change Assessment [24].
| Model ID | Model Name | Model Institution |
|---|---|---|
| 1 | ACCESS1.0 | Commonwealth Scientific and Industrial Research Organisation (CSIRO) and Bureau of Meteorology, Australia |
| 2 | ACCESS1.3 | |
| 3 | bcc-csm1.1 | Beijing Climate Center, China |
| 4 | bcc-csm1.1.m | |
| 5 | CanESM2 | Canadian Centre for Climate Modeling and Analysis, Canada |
| 6 | CCSM4 | National Center for Atmospheric Research, USA |
| 7 | CESM1-BGC | National Science Foundation, Department of Energy, National Center for Atmospheric Research, USA |
| 8 | CESM1-CAM5 | |
| 9 | CMCC-CM | Centro Euro-Mediterraneo sui Cambiamenti Climatici, Italy |
| 10 | CMCC-CMS | |
| 11 | CNRM-CM5 | Centre National de Recherches Météorologiques/Centre Européen de Recherche et de Formation Avancée en Calcul Scientifique, France |
| 12 | CSIRO-Mk3.6.0 | CSIRO and Queensland Climate Change Centre of Excellence, Australia |
| 13 | EC-EARTH | EC-EARTH consortium published at Irish Centre for High-End Computing, Netherlands/Ireland |
| 14 | FGOALS-g2 | Institute of Atmospheric Physics, Chinese Academy of Sciences, China |
| 15 | GFDL-CM3 | National Oceanic and Atmospheric Administration Geophysical Fluid Dynamics Laboratory, USA |
| 16 | GFDL-ESM2G | |
| 17 | GFDL-ESM2M | |
| 18 | GISS-E2-H | National Aeronautics and Space Administration Goddard Institute for Space Studies, USA |
| 19 | GISS-E2-R | |
| 20 | HadGEM2-AO | National Institute of Meteorological Research, Korea Meteorological Administration, South Korea |
| 21 | HadGEM2-CC | Met Office Hadley Centre, UK |
| 22 | HadGEM2-ES | |
| 23 | inmcm4 | Russian Academy of Sciences, Institute of Numerical Mathematics, Russia |
| 24 | IPSL-CM5A-LR | Institut Pierre Simon Laplace, France |
| 25 | IPSL-CM5A-MR | |
| 26 | MIROC5 | Atmosphere and Ocean Research Institute (The University of Tokyo), National Institute for Environmental Studies, and Japan Agency for Marine-Earth Science and Technology, Japan |
| 27 | MIROC-ESM-CHEM | |
| 28 | MIROC-ESM | |
| 29 | MPI-ESM-LR | Max Planck Institute for Meteorology, Germany |
| 30 | MPI-ESM-MR | |
| 31 | MRI-CGCM3 | Meteorological Research Institute, Japan |
| 32 | NorESM1-M | Bjerknes Centre for Climate Research, Norwegian Meteorological Institute, Norway |
Table A2.
Trend slope and significance level of SPEI indices at different temporal scales during the period from water year 1916–2011.
Table A2.
Trend slope and significance level of SPEI indices at different temporal scales during the period from water year 1916–2011.
| SPEI | North Delta | South Delta | West Delta | |||
|---|---|---|---|---|---|---|
| Slope (/Decade) | p-Value | Slope (/Decade) | p-Value | Slope (/Decade) | p-Value | |
| Annual | 0.024 | 0.537 | 0.029 | 0.449 | 0.042 | 0.286 |
| Two-Year | 0.068 | 0.102 | 0.063 | 0.096 | 0.091 * | 0.021 |
| Three-Year | 0.077 | 0.059 | 0.082 | 0.064 | 0.119 * | 0.004 |
| Four-Year | 0.074 | 0.083 | 0.083 | 0.055 | 0.135 * | 0.001 |
* The corresponding trend is statistically significant (p < 0.05).
Table A3.
Pearson correlation coefficient between changes in annual total precipitation and mean contributions to annual precipitation from the wettest 10% days as well as the remaining wet days.
Table A3.
Pearson correlation coefficient between changes in annual total precipitation and mean contributions to annual precipitation from the wettest 10% days as well as the remaining wet days.
| Scenario | Wettest 10% Days [-] | Remaining Wet Days [-] | ||||
|---|---|---|---|---|---|---|
| North Delta | South Delta | West Delta | North Delta | South Delta | West Delta | |
| RCP 4.5 Mid-Century | 0.933 | 0.913 | 0.941 | 0.949 | 0.955 | 0.964 |
| RCP 4.5 Late-Century | 0.950 | 0.935 | 0.958 | 0.961 | 0.959 | 0.971 |
| RCP 8.5 Mid-Century | 0.933 | 0.922 | 0.940 | 0.945 | 0.957 | 0.957 |
| RCP 8.5 Late-Century | 0.956 | 0.955 | 0.963 | 0.940 | 0.959 | 0.963 |
Table A4.
Ensemble mean, maximum, and minimum changes in annual precipitation variance as well as variance contributions from the wettest 10 days and remaining wet days.
Table A4.
Ensemble mean, maximum, and minimum changes in annual precipitation variance as well as variance contributions from the wettest 10 days and remaining wet days.
| Scenario | Metric | Change in Annual Total Precipitation (%) | Change in Mean Contribution from the Wettest 10% Days (%) | Change in Mean Contribution from the Remaining Wet Days (%) | ||||||
|---|---|---|---|---|---|---|---|---|---|---|
| North Delta | South Delta | West Delta | North Delta | South Delta | West Delta | North Delta | South Delta | West Delta | ||
| RCP 4.5 Mid-Century | Maximum | 122.9 | 102.9 | 116.0 | 78.7 | 72.0 | 86.2 | 13.8 | 14.1 | 17.8 |
| Mean | 19.7 | 14.4 | 19.6 | 12.7 | 9.8 | 11.5 | 1.3 | 0.2 | 1.4 | |
| Minimum | −36.2 | −43.2 | −38.1 | −36.3 | −34.1 | −32.6 | −10.7 | −7.9 | −8.9 | |
| RCP 4.5 Late-Century | Maximum | 151.4 | 135.0 | 142.0 | 96.8 | 82.5 | 81.3 | 15.0 | 18.2 | 14.6 |
| Mean | 28.0 | 21.3 | 29.4 | 17.0 | 12.6 | 17.0 | 1.3 | 1.6 | 2.5 | |
| Minimum | −49.3 | −52.3 | −44.4 | −31.6 | −27.5 | −31.3 | −7.8 | −10.5 | −9.4 | |
| RCP 8.5 Mid-Century | Maximum | 80.6 | 60.0 | 75.6 | 66.3 | 49.0 | 55.9 | 14.1 | 21.6 | 13.5 |
| Mean | 10.3 | 6.3 | 11.2 | 7.0 | 6.5 | 7.7 | 1.4 | 0.9 | 1.5 | |
| Minimum | −52.7 | −56.9 | −59.1 | −40.4 | −51.2 | −41.2 | −9.0 | −8.9 | −10.2 | |
| RCP 8.5 Late-Century | Maximum | 359.6 | 263.3 | 399.4 | 238.8 | 139.9 | 229.1 | 22.8 | 26.2 | 32.3 |
| Mean | 43.7 | 34.9 | 47.4 | 28.6 | 22.0 | 27.5 | 2.5 | 2.4 | 4.7 | |
| Minimum | −52.1 | −59.0 | −48.2 | −30.3 | −31.6 | −39.9 | −9.2 | −11.3 | −10.5 | |
Appendix B
This Appendix briefly introduces the definition of the wettest days, identification of the variance explained and variance contribution, calculation of the Standardized Precipitation-Evapotranspiration Index (SPEI), and determination of the trend slope of a time series.
In determining the wettest days, all wet days (with daily precipitation over 0 mm) are ranked according to the precipitation amount. The day with the highest precipitation ranks first while the day with the least amount of precipitation ranks last. The top 10% of these days is then categorized as the “wettest 10% days”. The rest of those (remaining 90%) wet days is categorized as the “remaining wet days”.
Variance explained is the proportion of the variance in the dependent variable predicted by the independent variable in the sense of linear regression. It is typically measured by the coefficient of determinations () and is calculated as follows:
In which and are the dependent and independent variables, respectively; is the mean value of the dependent variable; is the sample size.
The variance of the total precipitation () is the sum of the variance contributions from the wettest days () and remaining wet days (), respectively, plus the covariance between them ():
According to [30], the covariance term indicates the interference of the fluctuations of the wettest day and remaining days’ contributions to the total precipitation. If these two contributions vary in phase with each other, they increase the overall variance of total precipitation. Otherwise, if they are out of phase, they tend to cancel each other and reduce the overall variance of total precipitation.
For SPEI calculation, the first step is to calculate the discrepancies between precipitation (P) and potential evapotranspiration (PET) on a monthly time scale (D = P − PET). The PET is determined via the empirical Thornthwaite equation, which only requires temperature data as input. Monthly discrepancies can be aggregated to other time scales (e.g., 12-month, 24-month, 36-month, and 48-month, among others) to calculate corresponding SPEI values. Next, a three-parameter Log-logistic distribution is selected to model the discrepancy time series. The probability distribution function of D is calculated according to the Log-logistic distribution (), of which the distribution parameters are fitted using all data provided via unbiased Probability Weighted Moments. Lastly, the SPEI value is determined as the standardized values of following
where ; is the probability of exceeding a determined D value; when , is replaced by 1 − and SPEI reverses its sign. , and are preset constant coefficients. For detailed information on the concept and calculation of the SPEI index, the readers are referred to [41].
The Theil–Sen approach (TSA) [45,46] is employed to calculate the trend slope of a time series in this study. The TSA is a non-parametric procedure that computes the slope () as follows:
where is the sample size of the time series; and are the th and th number in the time series, respectively.
References
- Allan, P.R.; Hawkins, E.; Bellouin, N.; Collins, B. IPCC, 2021: Summary for Policymakers. In Climate Change 2021: The Physical Science Basis. Contribution of Working Group I to the Sixth Assessment Report of the Intergovernmental Panel on Climate Change; Masson-Delmotte, V., Zhai, P., Pirani, A., Connors, S.L., Péan, C., Berger, S., Caud, N., Chen, Y., Goldfarb, L., Gomis, M.I., et al., Eds.; Cambridge University Press: Cambridge, UK, 2021. [Google Scholar]
- Easterling, D.R.; Evans, J.L.; Groisman, P.Y.; Karl, T.R.; Kunkel, K.E.; Ambenje, P. Observed variability and trends in extreme climate events: A brief review. Bull. Am. Meteorol. Soc. 2000, 81, 417–426. [Google Scholar] [CrossRef] [Green Version]
- Dai, A. Drought under global warming: A review. WIREs Clim. Chang. 2011, 2, 45–65. [Google Scholar] [CrossRef] [Green Version]
- Barnett, T.P.; Adam, J.C.; Lettenmaier, D.P. Potential impacts of a warming climate on water availability in snow-dominated regions. Nature 2005, 438, 303–309. [Google Scholar] [CrossRef]
- Bolch, T.; Kulkarni, A.; Kääb, A.; Huggel, C.; Paul, F.; Cogley, J.G.; Frey, H.; Kargel, J.S.; Fujita, K.; Scheel, M. The state and fate of Himalayan glaciers. Science 2012, 336, 310–314. [Google Scholar] [CrossRef] [Green Version]
- Cabanes, C.; Cazenave, A.; Le Provost, C. Sea level rise during past 40 years determined from satellite and in situ observations. Science 2001, 294, 840–842. [Google Scholar] [CrossRef] [Green Version]
- Levitus, S.; Antonov, J.I.; Boyer, T.P.; Baranova, O.K.; Garcia, H.E.; Locarnini, R.A.; Mishonov, A.V.; Reagan, J.; Seidov, D.; Yarosh, E.S. World ocean heat content and thermosteric sea level change (0–2000 m), 1955–2010. Geophys. Res. Lett. 2012, 39. [Google Scholar] [CrossRef] [Green Version]
- Jolly, W.M.; Cochrane, M.A.; Freeborn, P.H.; Holden, Z.A.; Brown, T.J.; Williamson, G.J.; Bowman, D.M. Climate-induced variations in global wildfire danger from 1979 to 2013. Nat. Commun. 2015, 6, 7537. [Google Scholar] [CrossRef]
- Meehl, G.A.; Zwiers, F.; Evans, J.; Knutson, T.; Mearns, L.; Whetton, P. Trends in extreme weather and climate events: Issues related to modeling extremes in projections of future climate change. Bull. Am. Meteorol. Soc. 2000, 81, 427–436. [Google Scholar] [CrossRef] [Green Version]
- O’Gorman, P.A.; Schneider, T. The physical basis for increases in precipitation extremes in simulations of 21st-century climate change. Proc. Natl. Acad. Sci. USA 2009, 106, 14773–14777. [Google Scholar] [CrossRef] [Green Version]
- Yoon, J.-H.; Wang, S.S.; Gillies, R.R.; Kravitz, B.; Hipps, L.; Rasch, P.J. Increasing water cycle extremes in California and in relation to ENSO cycle under global warming. Nat. Commun. 2015, 6, 8657. [Google Scholar] [CrossRef] [Green Version]
- Chikamoto, Y.; Timmermann, A.; Widlansky, M.J.; Balmaseda, M.A.; Stott, L. Multi-year predictability of climate, drought, and wildfire in southwestern North America. Sci. Rep. 2017, 7, 6568. [Google Scholar] [CrossRef] [PubMed] [Green Version]
- USCB. United States Census Bureau QuickFacts: United States; U.S. Department of Commerce: Washington, DC, USA, 2019. [Google Scholar]
- Dettinger, M.D.; Ralph, F.M.; Das, T.; Neiman, P.J.; Cayan, D.R. Atmospheric rivers, floods and the water resources of California. Water 2011, 3, 445–478. [Google Scholar] [CrossRef]
- Sabet, M.H.; Coe, J.Q. Models for water and power scheduling for the California State Water Project. J. Am. Water Resour. Assoc. 1986, 22, 587–596. [Google Scholar] [CrossRef]
- Becker, L.; Yeh, W.; Fults, D.; Sparks, D. Operations models for central valley project. J. Water Resour. Plann. Manag. Div. Am. Soc. Civ. Eng. 1976, 101, 101–115. [Google Scholar] [CrossRef]
- Mount, J.; Twiss, R. Subsidence, sea level rise, and seismicity in the Sacramento–San Joaquin Delta. San Franc. Estuary Watershed Sci. 2005, 3, 5. [Google Scholar]
- Deverel, S.J.; Leighton, D.A. Historic, recent, and future subsidence, Sacramento-San Joaquin Delta, California, USA. San Franc. Estuary Watershed Sci. 2010, 8. [Google Scholar] [CrossRef] [Green Version]
- Myers, N.; Mittermeier, R.A.; Mittermeier, C.G.; Da Fonseca, G.A.; Kent, J. Biodiversity hotspots for conservation priorities. Nature 2000, 403, 853. [Google Scholar] [CrossRef]
- Moyle, P.B.; Brown, L.R.; Durand, J.R.; Hobbs, J.A. Delta smelt: Life history and decline of a once-abundant species in the San Francisco Estuary. San Franc. Estuary Watershed Sci. 2016, 14. [Google Scholar] [CrossRef] [Green Version]
- Healey, M.; Dettinger, M.; Norgaard, R. Perspectives on Bay–Delta Science and Policy. San Franc. Estuary Watershed Sci. 2016, 14. [Google Scholar] [CrossRef] [Green Version]
- CSWRCB. Water Right Decision 1641; CSWRCB: Sacramento, CA, USA, 1999; p. 225. [Google Scholar]
- USFWS. Formal Endangered Species Act Consultation on The proposed Coordinated Operations of the Central Valley Project (CVP) and State Water Project (SWP); USFWS: Sacramento, CA, USA, 2008; p. 410. [Google Scholar]
- Bedsworth, L.; Cayan, D.; Franco, G.; Fisher, L.; Ziaja, S. California’s Fourth Climate Change Assessment Statewide Summary Report; California’s Fourth Climate Change Assessment; California Energy Commission: Sacramento, CA, USA, 2018; p. 133. [Google Scholar]
- Pierce, D.W.; Kalansky, J.F.; Cayan, D.R. Climate, Drought, and Sea Level Rise Scenarios for the Fourth California Climate Assessment; California’s Fourth Climate Change Assessment; Publication Number: CNRA-CEC-2018-006; California Energy Commission: Sacramento, CA, USA, 2018. [Google Scholar]
- Taylor, K.E.; Stouffer, R.J.; Meehl, G.A. An overview of CMIP5 and the experiment design. Bull. Am. Meteorol. Soc. 2012, 93, 485–498. [Google Scholar] [CrossRef] [Green Version]
- Eyring, V.; Bony, S.; Meehl, G.A.; Senior, C.A.; Stevens, B.; Stouffer, R.J.; Taylor, K.E. Overview of the Coupled Model Intercomparison Project Phase 6 (CMIP6) experimental design and organization. Geosci. Model Dev. 2016, 9, 485–498. [Google Scholar] [CrossRef] [Green Version]
- He, M.; Schwarz, A.; Lynn, E.; Anderson, M. Projected changes in precipitation, temperature, and drought across California’s hydrologic regions in the 21st century. Climate 2018, 6, 31. [Google Scholar] [CrossRef] [Green Version]
- Dettinger, M.; Anderson, J.; Anderson, M.; Brown, L.R.; Cayan, D.; Maurer, E. Climate change and the Delta. San Franc. Estuary Watershed Sci. 2016, 14. [Google Scholar] [CrossRef] [Green Version]
- Dettinger, M. Historical and future relations between large storms and droughts in California. San Franc. Estuary Watershed Sci. 2016, 14. [Google Scholar] [CrossRef] [Green Version]
- Knowles, N.; Cronkite-Ratcliff, C.; Pierce, D.; Cayan, D. Responses of Unimpaired Flows, Storage, and Managed Flows to Scenarios of Climate Change in the San Francisco Bay-Delta Watershed. Water Resour. Res. 2018, 54, 7631–7650. [Google Scholar] [CrossRef] [Green Version]
- He, M.; Anderson, M.; Schwarz, A.; Das, T.; Lynn, E.; Anderson, J.; Munévar, A.; Vasquez, J.; Arnold, W. Potential Changes in Runoff of California’s Major Water Supply Watersheds in the 21st Century. Water 2019, 11, 1651. [Google Scholar] [CrossRef] [Green Version]
- Ray, P.; Wi, S.; Schwarz, A.; Correa, M.; He, M.; Brown, C. Vulnerability and risk: Climate change and water supply from California’s Central Valley water system. Clim. Chang. 2020, 161, 177–199. [Google Scholar] [CrossRef]
- Wang, J.; Yin, H.; Reyes, E.; Smith, T.; Chung, F. Mean and Extreme Climate Change Impacts on the State Water Project; California’s Fourth Climate Change Assessment; California Energy Commission: Sacramento, CA, USA, 2018. [Google Scholar]
- He, M.; Russo, M.; Anderson, M. Hydroclimatic characteristics of the 2012–2015 California drought from an operational perspective. Climate 2017, 5, 5. [Google Scholar] [CrossRef] [Green Version]
- Lund, J.R. California’s agricultural and urban water supply reliability and the Sacramento–San Joaquin Delta. San Franc. Estuary Watershed Sci. 2016, 14. [Google Scholar] [CrossRef] [Green Version]
- Vahedifard, F.; Robinson, J.D.; AghaKouchak, A. Can Protracted Drought Undermine the Structural Integrity of California’s Earthen Levees? J. Geotech. Geoenviron. 2016, 142, 02516001. [Google Scholar] [CrossRef] [Green Version]
- Livneh, B.; Rosenberg, E.A.; Lin, C.; Nijssen, B.; Mishra, V.; Andreadis, K.M.; Maurer, E.P.; Lettenmaier, D.P. A long-term hydrologically based dataset of land surface fluxes and states for the conterminous United States: Update and extensions. J. Clim. 2013, 26, 9384–9392. [Google Scholar] [CrossRef]
- Pierce, D.W.; Cayan, D.R.; Thrasher, B.L. Statistical downscaling using localized constructed analogs (LOCA). J. Hydrometeorol. 2014, 15, 2558–2585. [Google Scholar] [CrossRef]
- Lund, J.; Medellin-Azuara, J.; Durand, J.; Stone, K. Lessons from California’s 2012–2016 drought. J. Water Resour. Plan. Manag. 2018, 144, 04018067. [Google Scholar] [CrossRef] [Green Version]
- Vicente-Serrano, S.M.; Beguería, S.; López-Moreno, J.I. A multiscalar drought index sensitive to global warming: The standardized precipitation evapotranspiration index. J. Clim. 2010, 23, 1696–1718. [Google Scholar] [CrossRef] [Green Version]
- Vicente-Serrano, S.M.; Beguería, S.; López-Moreno, J.I.; Angulo, M.; El Kenawy, A. A new global 0.5° gridded dataset (1901–2006) of a multiscalar drought index: Comparison with current drought index datasets based on the Palmer Drought Severity Index. J. Hydrometeorol. 2010, 11, 1033–1043. [Google Scholar] [CrossRef] [Green Version]
- Mann, H.B. Nonparametric tests against trend. Econometrica 1945, 13, 245–259. [Google Scholar] [CrossRef]
- Kendall, M. Rank Correlation Methods; Charles Griffin: London, UK, 1975. [Google Scholar]
- Thiel, H. A rank-invariant method of linear and polynomial regression analysis, Part 3. In Proceedings of the Koninalijke Nederlandse Akademie van Weinenschatpen A, Amsterdam, The Netherlands, September 1950; Royal Netherlands Academy of Arts and Sciences: Amsterdam, The Netherlands, 1950; pp. 1397–1412. [Google Scholar]
- Sen, P.K. Estimates of the regression coefficient based on Kendall’s tau. J. Am. Stat. Assoc. 1968, 63, 1379–1389. [Google Scholar] [CrossRef]
- Mallakpour, I.; Sadegh, M.; AghaKouchak, A. A new normal for streamflow in California in a warming climate: Wetter wet seasons and drier dry seasons. J. Hydrol. 2018, 567, 203–211. [Google Scholar] [CrossRef]
- Swain, D.L.; Langenbrunner, B.; Neelin, J.D.; Hall, A. Increasing precipitation volatility in twenty-first-century California. Nat. Clim. Chang. 2018, 8, 427–433. [Google Scholar] [CrossRef]
- Ficklin, D.L.; Stewart, I.T.; Maurer, E.P. Effects of climate change on stream temperature, dissolved oxygen, and sediment concentration in the Sierra Nevada in California. Water Resour. Res. 2013, 49, 2765–2782. [Google Scholar] [CrossRef]
- Jeffries, K.M.; Connon, R.E.; Davis, B.E.; Komoroske, L.M.; Britton, M.T.; Sommer, T.; Todgham, A.E.; Fangue, N.A. Effects of high temperatures on threatened estuarine fishes during periods of extreme drought. J. Exp. Biol. 2016, 219, 1705–1716. [Google Scholar] [CrossRef] [PubMed] [Green Version]
- Davis, B.E.; Hansen, M.J.; Cocherell, D.E.; Nguyen, T.X.; Sommer, T.; Baxter, R.D.; Fangue, N.A.; Todgham, A.E. Consequences of temperature and temperature variability on swimming activity, group structure, and predation of endangered delta smelt. Freshwater Biol. 2019, 64, 2156–2175. [Google Scholar] [CrossRef]
- Dettinger, M.; Cayan, D.R. Drought and the California Delta—A matter of extremes. San Franc. Estuary Watershed Sci. 2014, 12. [Google Scholar] [CrossRef] [Green Version]
- Griffin, D.; Anchukaitis, K.J. How unusual is the 2012–2014 California drought? Geophys. Res. Lett. 2014, 41, 9017–9023. [Google Scholar] [CrossRef] [Green Version]
- Williams, A.P.; Seager, R.; Abatzoglou, J.T.; Cook, B.I.; Smerdon, J.E.; Cook, E.R. Contribution of anthropogenic warming to California drought during 2012–2014. Geophys. Res. Lett. 2015, 42, 6819–6828. [Google Scholar] [CrossRef] [Green Version]
- Kimmerer, W.; Wilkerson, F.; Downing, B.; Dugdale, R.; Gross, E.S.; Kayfetz, K.; Khanna, S.; Parker, A.E.; Thompson, J. Effects of Drought and the Emergency Drought Barrier on the Ecosystem of the California Delta. San Franc. Estuary Watershed Sci. 2019, 17. [Google Scholar] [CrossRef] [Green Version]
- Zhou, Y.; He, M.; Sandhu, N. 2018 Suisun Marsh Salinity Control Gates Pilot Study: Water Cost Analysis. In 40th Annual Progress Report “Methodology for Flow and Salinity Estimates in the Sacramento-San Joaquin Delta and Suisun Marsh”; California Department of Water Resources: Sacramento, CA, USA, 2019. [Google Scholar]
- Cloern, J.E.; Knowles, N.; Brown, L.R.; Cayan, D.; Dettinger, M.D.; Morgan, T.L.; Schoellhamer, D.H.; Stacey, M.T.; Van der Wegen, M.; Wagner, R.W. Projected evolution of California’s San Francisco Bay-Delta-River system in a century of climate change. PLoS ONE 2011, 6, e24465. [Google Scholar] [CrossRef]
- Farr, T.; Jones, C.; Liu, Z. Progress Report: Subsidence in California, March 2015–September 2016; California Department of Water Resources: Sacramento, CA, USA, 2016. [Google Scholar]
- Murray, K.D.; Lohman, R.B. Short-lived pause in Central California subsidence after heavy winter precipitation of 2017. Sci. Adv. 2018, 4, eaar8144. [Google Scholar] [CrossRef] [Green Version]
- Jin, Y.; He, R.; Marino, G.; Whiting, M.; Kent, E.; Sanden, B.L.; Culumber, M.; Ferguson, L.; Little, C.; Grattan, S. Spatially variable evapotranspiration over salt affected pistachio orchards analyzed with satellite remote sensing estimates. Agr. For. Meteorol. 2018, 262, 178–191. [Google Scholar] [CrossRef]
- Thomas, B.F.; Famiglietti, J.S.; Landerer, F.W.; Wiese, D.N.; Molotch, N.P.; Argus, D.F. GRACE groundwater drought index: Evaluation of California Central Valley groundwater drought. Remote Sens. Environ. 2017, 198, 384–392. [Google Scholar] [CrossRef]
- Scanlon, B.R.; Longuevergne, L.; Long, D. Ground referencing GRACE satellite estimates of groundwater storage changes in the California Central Valley, USA. Water Resour. Res. 2012, 48. [Google Scholar] [CrossRef] [Green Version]
- Stampoulis, D.; Reager, J.T.; David, C.H.; Andreadis, K.M.; Famiglietti, J.S.; Farr, T.G.; Trangsrud, A.R.; Basilio, R.R.; Sabo, J.L.; Osterman, G.B. Model-data fusion of hydrologic simulations and GRACE terrestrial water storage observations to estimate changes in water table depth. Adv. Water Resour. 2019, 128, 13–27. [Google Scholar] [CrossRef]
- Liang, L.; Suits, B.; Kadir, T. Refining the spatial-temporal distribution of Delta consumptive use based on remote sensing studies. In 41st Annual Progress Report “Methodology for Flow and Salinity Estimates in the Sacramento-San Joaquin Delta and Suisun Marsh”; California Department of Water Resources: Sacramento, CA, USA, 2020. [Google Scholar]
- Jayasundara, N.C.; Seneviratne, S.A.; Reyes, E.; Chung, F.I. Artificial Neural Network for Sacramento–San Joaquin Delta Flow–Salinity Relationship for CalSim 3.0. J. Water Resour. Plan. Manag. 2020, 146, 04020015. [Google Scholar] [CrossRef]
- Smith, T. Delta Modeling for Emergency Drought Barriers. In 35th Annual Progress Report “Methodology for Flow and Salinity Estimates in the Sacramento-San Joaquin Delta and Suisun Marsh”; California Department of Water Resources: Sacramento, CA, USA, 2014. [Google Scholar]
- Ateljevich, E.; Nam, K. SCHISM Modeling in Support of Franks Tract Restoration Feasibility Study. In 39th Annual Progress Report “Methodology for Flow and Salinity Estimates in the Sacramento-San Joaquin Delta and Suisun Marsh”; California Department of Water Resources: Sacramento, CA, USA, 2018. [Google Scholar]
- CDWR, Calibration and verification of DWRDSM. In 12th Annual Progress Report “Methodology for Flow and Salinity Estimates in the Sacramento-San Joaquin Delta and Suisun Marsh”; California Department of Water Resources: Sacramento, CA, USA, 1991.
- DeGeorge, J.F. A Multi-Dimensional Finite Element Transport Model Utilizing a Characteristic-Galerkin Algorithm; University of California: Davis, CA, USA, 1996. [Google Scholar]
- MacWilliams, M.; Bever, A.J.; Foresman, E. 3-D simulations of the San Francisco Estuary with subgrid bathymetry to explore long-term trends in salinity distribution and fish abundance. San Franc. Estuary Watershed Sci. 2016, 14. [Google Scholar] [CrossRef] [Green Version]
- Kernkamp, H.W.; Van Dam, A.; Stelling, G.S.; de Goede, E.D. Efficient scheme for the shallow water equations on unstructured grids with application to the Continental Shelf. Ocean Dyn. 2011, 61, 1175–1188. [Google Scholar] [CrossRef]
Figure 1.
(a). A location map showing California’s ten hydrologic regions, river system, and the Sacramento–San Joaquin Delta (Delta); (b) a close-up of the Delta and its surrounding hydrologic regions; and (c) three sub-regions (North Delta, South Delta, and West Delta) of the Delta, which belong to three hydrologic regions, respectively. Crosses represent the centroid points of individual climate projection grids (1/16th degree) located in each sub-region. DCC: Delta Cross Channel; DB: Drought Barrier; SWP: State Water Project; CVP: Central Valley Project; SMSCG: Suisun Marsh Salinity Control Gate.

Figure 2.
(a) Long-term (water year 1916–2011) mean wet season (October-March) and dry season (April-September) precipitation; (b) contributions to mean annual precipitation from the wettest 10% of wet days and the remaining wet days; (c) contributions to annual precipitation variance from the wettest 10% of wet days and the remaining wet days; and (d) variance of annual precipitation explained by the wettest 10% of wet days and the remaining wet days in terms of the square of the Pearson correlation coefficient of simple linear regressions.

Figure 3.
(a) Long-term (water year 1916–2011) mean annual maximum (Tm), average (Ta), and minimum temperature (Tn) for three sub-regions of the Delta; and (b) long-term mean monthly maximum (Tm), average (Ta), and minimum (Tn) temperature of North Delta.
Figure 3.
(a) Long-term (water year 1916–2011) mean annual maximum (Tm), average (Ta), and minimum temperature (Tn) for three sub-regions of the Delta; and (b) long-term mean monthly maximum (Tm), average (Ta), and minimum (Tn) temperature of North Delta.

Figure 4.
SPEI indices of West Delta calculated on different temporal scales including (a) annual; (b) two-year; (c) three-year; and (d) four-year during the historical period (water year 1916–2011). Trend slope (S, per decade) and the significance level (p) of the trend are also shown.
Figure 4.
SPEI indices of West Delta calculated on different temporal scales including (a) annual; (b) two-year; (c) three-year; and (d) four-year during the historical period (water year 1916–2011). Trend slope (S, per decade) and the significance level (p) of the trend are also shown.

Figure 5.
Box-and-whisker plots of (a) changes in annual precipitation as percent of historical mean annual precipitation; (b) warming (°C) in mean annual temperature under two emission scenarios (RCP 4.5 and RCP 8.5) during two future periods (mid-century and late-century) across three sub-regions of the Delta. The central mark on each box represents the median value; the edges of the boxes denote the 25th and 75th percentiles; the upper (lower) whisker is 1.5-times the interquartile range away from the top (bottom) of the box; the dots designate outliers.

Figure 6.
Box-and-whisker plots of (a) changes in wet season (October-March) precipitation and (b) changes in dry season (April-September) precipitation as percent of historical wet and season precipitation, respectively, under two emission scenarios (RCP 4.5 and RCP 8.5) during two future periods (mid-century and late-century) across three sub-regions of the Delta.

Figure 7.
Box-and-whisker plots of warming in mean monthly temperature under (a) RCP 4.5 during the mid-century; (b) RCP 4.5 during the late-century; (c) RCP 8.5 during the mid-century; and (d) RCP 8.5 during the late-century across three sub-regions of the Delta.
Figure 7.
Box-and-whisker plots of warming in mean monthly temperature under (a) RCP 4.5 during the mid-century; (b) RCP 4.5 during the late-century; (c) RCP 8.5 during the mid-century; and (d) RCP 8.5 during the late-century across three sub-regions of the Delta.

Figure 8.
Scatter plots of projected (via 32 GCM models) changes in contributions to annual total precipitation from the 10% wettest days and the remaining wet days against changes in mean annual total precipitation (both as percentage of mean historical annual total precipitation simulations from water year 1960–1999) in two future periods: mid-century (first row; panels (a–c)) and late-century (second row; panels (d–f)) across three Delta sub-regions: North Delta (first column; panels (a,d)), South Delta (second column; panels (b,e)), and West Delta (third column; panels (c,f)).

Figure 9.
Scatter plots of projected (via 32 GCM models) changes in variance contributions to annual precipitation variance from the top 10% wettest days and the remaining wet days against changes in mean annual total precipitation (both as percentage of historical annual precipitation variance calculated from water year 1960–1999) in two future periods: mid-century (first row; panels (a–c)) and late-century (second row; panels (d–f)) across three Delta sub-regions: North Delta (first column; panels (a,d)), South Delta (second column; panels (b,e)), and West Delta (third column; panels (c,f)).

Figure 10.
Box-and-whisker plots of percent changes (from the historical baseline) in number of (a) wet days; (b) very wet days; and (c) extreme wet days under two emission scenarios (RCP 4.5 and RCP 8.5) during two future periods (mid-century and late-century) across three sub-regions of the Delta.

Figure 11.
Scatter plots of warming in annual minimum temperature (Tn) against warming in annual maximum temperature (Tm) of (a) North Delta; (b) South Delta; and (c) West Delta under two emission scenarios (RCP 4.5 and RCP 8.5) during two future periods (mid-century and late-century). (d) shows changes in annual Diurnal Temperature Range (DTR) from the corresponding historical baseline values.

Figure 12.
Mean warming in annual maximum temperature (Tm) and minimum temperature (Tn) under RCP 4.5 (first column (a,c,e)) and RCP 8.5 (second column (b,d,f)) for North Delta (first row (a,b)), South Delta (second row (c,d)), and West Delta (third row (e,f)).
Figure 12.
Mean warming in annual maximum temperature (Tm) and minimum temperature (Tn) under RCP 4.5 (first column (a,c,e)) and RCP 8.5 (second column (b,d,f)) for North Delta (first row (a,b)), South Delta (second row (c,d)), and West Delta (third row (e,f)).

Figure 13.
Box-and-whisker plots of changes in monthly Diurnal Temperature Range (DTR) under (a) RCP 4.5 during the mid-century; (b) RCP 8.5 during the mid-century; (c) RCP 4.5 during the late-century; and (d) RCP 8.5 during the late-century across three sub-regions of the Delta.
Figure 13.
Box-and-whisker plots of changes in monthly Diurnal Temperature Range (DTR) under (a) RCP 4.5 during the mid-century; (b) RCP 8.5 during the mid-century; (c) RCP 4.5 during the late-century; and (d) RCP 8.5 during the late-century across three sub-regions of the Delta.

Figure 14.
Box-and-whisker plots of trend slope in SPEI indices at different temporal scales including (a) annual; (b) two-year; (c) three-year; and (d) four-year under RCP 4.5 and RCP 8.5 during water year 2020–2099. “ND”,”SD”, and “WD” stand for “North Delta”, “South Delta”, and “West Delta”, respectively. The number associated with each box plot indicates the size of the sample (i.e., number of SPEI projections with statistically significant trend) applied to produce that box. Red crosses designate outliers.

Table 1.
Geographic and climatic characteristics of study areas *.
| Study Area | Area (km2) | Total Annual Precipitation (mm) | Average Annual Temperature (°C) | Percentage of | 90th Percentile Daily Precipitation (mm/day) | ||
|---|---|---|---|---|---|---|---|
| Wet Days (>0 mm) | Very Wet Days (>10 mm) | Extremely Wet Days (>20 mm) | |||||
| North Delta | 1174 | 397 | 16.2 | 31.6% | 3.2% | 0.7% | 10.0 |
| South Delta | 1748 | 329 | 16.4 | 31.0% | 2.3% | 0.3% | 8.3 |
| West Delta | 485 | 449 | 15.9 | 31.1% | 3.8% | 0.9% | 11.2 |
* Based on observation-based Livneh historical climate data from water year 1916–2011 of [38].
Table 2.
Ensemble mean, maximum, and minimum changes in annual total precipitation as well as changes in mean contributions from the wettest 10% of wet days and the remaining wet days.
Table 2.
Ensemble mean, maximum, and minimum changes in annual total precipitation as well as changes in mean contributions from the wettest 10% of wet days and the remaining wet days.
| Scenario | Metric | Change in Annual Total Precipitation (%) | Change in Mean Contribution from the Wettest 10% Days (%) | Change in Mean Contribution from the Remaining Wet Days (%) | ||||||
|---|---|---|---|---|---|---|---|---|---|---|
| North Delta | South Delta | West Delta | North Delta | South Delta | West Delta | North Delta | South Delta | West Delta | ||
| RCP 4.5 Mid-Century | Maximum | 26.7 | 23.2 | 25.7 | 14.1 | 12.2 | 13.0 | 12.7 | 11.0 | 12.7 |
| Mean | −1.2 | −2.5 | −0.9 | 0.2 | −0.3 | 0.3 | −1.4 | −2.1 | −1.2 | |
| Minimum | −19.2 | −16.9 | −18.3 | −7.6 | −4.9 | −6.5 | −11.6 | −12.1 | −11.8 | |
| RCP 4.5 Late-Century | Maximum | 25.4 | 19.3 | 25.7 | 15.0 | 12.0 | 14.1 | 10.4 | 8.6 | 11.6 |
| Mean | 1.7 | −0.4 | 2.2 | 2.1 | 0.8 | 2.2 | −0.4 | −1.2 | 0.0 | |
| Minimum | −22.4 | −22.4 | −21.1 | −10.3 | −9.0 | −8.9 | −12.1 | −13.4 | −12.2 | |
| RCP 8.5 Mid-Century | Maximum | 23.0 | 17.8 | 23.1 | 11.4 | 9.6 | 12.1 | 11.6 | 8.5 | 11.0 |
| Mean | 1.8 | 0.3 | 2.2 | 1.6 | 0.8 | 1.7 | 0.1 | −0.5 | 0.5 | |
| Minimum | −17.6 | −17.8 | −15.4 | −7.4 | −6.7 | −5.9 | −10.2 | −11.0 | −9.6 | |
| RCP 8.5 Late-Century | Maximum | 47.2 | 38.9 | 49.1 | 32.3 | 23.9 | 30.4 | 15.6 | 15.0 | 18.7 |
| Mean | 2.2 | −0.3 | 3.1 | 3.0 | 1.5 | 2.9 | −0.8 | −1.8 | 0.2 | |
| Minimum | −32.0 | −35.1 | −30.4 | −14.4 | −14.5 | −12.4 | −17.7 | −20.6 | −17.9 | |
Table 3.
Percent of change in precipitation variance explained by changes in variance contributions from wettest 10% of wet days and remaining wet days.
Table 3.
Percent of change in precipitation variance explained by changes in variance contributions from wettest 10% of wet days and remaining wet days.
| Scenario | Wettest 10% Days (%) | Remaining Wet Days (%) | ||||
|---|---|---|---|---|---|---|
| North Delta | South Delta | West Delta | North Delta | South Delta | West Delta | |
| RCP 4.5 Mid-Century | 80 | 78 | 78 | 27 | 29 | 27 |
| RCP 4.5 Late-Century | 87 | 83 | 86 | 12 | 19 | 16 |
| RCP 8.5 Mid-Century | 83 | 69 | 86 | 25 | 27 | 28 |
| RCP 8.5 Late-Century | 96 | 86 | 94 | 54 | 62 | 61 |
Publisher’s Note: MDPI stays neutral with regard to jurisdictional claims in published maps and institutional affiliations. |
© 2022 by the author. Licensee MDPI, Basel, Switzerland. This article is an open access article distributed under the terms and conditions of the Creative Commons Attribution (CC BY) license (https://creativecommons.org/licenses/by/4.0/).
Share and Cite
MDPI and ACS Style
He, M. Assessing Changes in 21st Century Mean and Extreme Climate of the Sacramento–San Joaquin Delta in California. Climate 2022, 10, 16. https://doi.org/10.3390/cli10020016
AMA Style
He M. Assessing Changes in 21st Century Mean and Extreme Climate of the Sacramento–San Joaquin Delta in California. Climate. 2022; 10(2):16. https://doi.org/10.3390/cli10020016
Chicago/Turabian StyleHe, Minxue. 2022. "Assessing Changes in 21st Century Mean and Extreme Climate of the Sacramento–San Joaquin Delta in California" Climate 10, no. 2: 16. https://doi.org/10.3390/cli10020016
Note that from the first issue of 2016, this journal uses article numbers instead of page numbers. See further details here.