
Climate Risk and Vulnerability Assessment of Georgian Hydrology under Future Climate Change Scenarios

1
Department of Civil and Environmental Engineering, University of Virginia, Charlottesville, VA 22904, USA
2
EcoCoast Consultancy, 9407 GT Assen, The Netherlands
*
Author to whom correspondence should be addressed.
Climate 2023, 11(11), 222; https://doi.org/10.3390/cli11110222
Submission received: 11 October 2023
/
Revised: 27 October 2023
/
Accepted: 31 October 2023
/
Published: 2 November 2023
(This article belongs to the Special Issue Natural Disasters and Extreme Hazards under Changing Climate)
Abstract
:The Climate Risk and Vulnerability Assessment (CRVA) is a systematic process used to identify gaps in regional climate adaptation strategies. The CRVA method assesses regional vulnerability, adaptation capacity, exposure, and sensitivity to climate change to support improved adaptation policies. This CRVA study assesses Georgia’s climate exposure, geographic sensitivity, and socio-economic sensitivity by focusing on the impacts of climate change on regional hydrology. The projected change in climate extreme indices, defined by the Expert Team on Climate Change Detection and Indices (ETCCDI), is assessed against the 1961–1990 baseline under future Representative Concentration Pathway (RCP) scenarios. These indices encompass various climate factors such as the maximum daily temperature, warmth duration, total precipitation, heavy and extreme precipitation, maximum 5-day precipitation, and consecutive drought duration. This evaluation helps us understand the potential climate exposure impacts on Georgia. The climate-induced geographic sensitivity is examined based on water stress, drought risk, and changes in soil productivity using the Normalized Difference Vegetation Index (NDVI). The climate-induced socio-economic sensitivity is determined using the Gross Domestic Product per capita (GDP), Human Development Index, Education Index, and population density. The highest vulnerability to climate change was found in the Kakheti and Kvemo Kartli regions, with the vulnerability index values ranging from 6 to 15, followed by Mtskheta-Mtianeti, Samtskhe–Javakheti, and Shida Kartli with vulnerability index values ranging from 2 to 8. The location of these regions upstream of the Alazani-Iori, Khrami-Debeda, and Mktvari river basins indicates that the country’s water resources are vulnerable to climate change impacts in the future under the RCP 4.5 and 8.5 scenarios.
1. Introduction
Climate change has upended the lives of millions of people, flora, and fauna around the world [1,2]. It is becoming increasingly challenging to manage the impacts of climate change in both low- and middle-income countries [3]. The world’s rising population, food and water scarcity, soaring energy demand, and dwindling natural resources have turned climate change into a “threat multiplier” [4]. Climate change intensifies resource scarcity and stresses socio-ecological systems [3]. The impacts of climate change are visible across several sectors. These impacts span global food security [5,6], agriculture [6,7,8,9], forestry [10], economics [11,12], hydrology [13,14,15,16], land cover [17], renewable energy supply [18], and biodiversity [19]. Researchers have investigated the influence of climate change on water resources, including the global water availability [20], terrestrial water storage [21], the evaluation of global hydrological models [22], flood events and extreme precipitation [23], and water demand [24]. The consequences of climate change vary according to the region, sector, and structural elements in place. Development initiatives are thus particularly vulnerable to the influence of climate change.
It is crucial to factor in the realities of climate change in policy making and development activities. Information about climate change helps to reduce climate-related harms, supports the sustainable use of valuable resources, and minimizes risks for future generations [25]. Consequently, it becomes imperative to proactively assess climate change and natural disaster risks as early as possible to avert substantial losses and protect these invaluable resources. Even in the event of significant reductions in greenhouse gas emissions, the global climate will continue to undergo substantial changes [26]. This underscores the necessity for communities and governments across all levels and continents to proactively prepare themselves and adapt to the inevitable consequences of climate change [26].
Access to information about potential climate-related risks is essential to effectively plan adaptation measures and justify their implementation. The interaction between these risks with regional demographics and various types of current and future properties should be considered carefully [27]. Adaptation interventions should be coordinated across different sectors and levels of government to address the direct and indirect impacts of climate change. Conducting vulnerability and risk assessments that highlight the climate change-related risks in specific regions has become a rising trend, which helps to bridge the knowledge gap [28,29,30].
One commonly used risk and vulnerability assessment method is impact chains [3,31,32,33]. The “general representation of how a given climate stimulus propagates through a system of interest via the direct and indirect impacts it entails” is known as the climate impact chain [34] and it is an analytic tool that aids in systematizing, prioritizing, and improving the understanding of the influential factors for risk and vulnerability assessments of a particular system [35,36,37,38,39,40,41]. Typically, the use of an impact chain in climate change research is developed by following these steps: (1) possible climate risk identification, (2) impact and hazard determination, (3) system vulnerability assessments, and (4) system exposed element determination [33,34,42].
Many studies have used the Intergovernmental Panel on Climate Change’s (IPCC) Third and Fourth Assessment Report definition of vulnerability as a starting point for risk assessments [43]. Factors such as exposure, sensitivity, and adaptive capacity are considered when evaluating a system’s vulnerability to environmental stimuli. In the Fifth Assessment Report and Special Report Managing the Risks of Extreme Events and Disasters to Advance Climate Change Adaptation [27,44], the IPCC proposed the conceptualization of climate risk, which includes hazard, exposure, and vulnerability [29]. Examples of exposed components include people and ecosystems, which are collectively referred to as elements of exposure. Vulnerability is the capability of a region to withstand damage, to cope, and to adapt to the sensitivity associated with the damage [26,32,34,45].
A systematic process for bridging the gap between a region’s climate exposure, vulnerabilities, and the adaptation strategies that are the most likely to mitigate those risks is known as a Climate Risk and Vulnerability Assessment (CRVA). Over the past decades, vulnerability assessment methods have been developed in various development-related areas [44]. Several well-known toolkits and collections of techniques for assessing the impacts, vulnerability, and adaptability to climate change exist [46,47,48]. The CRVA method incorporates vulnerability, adaptation capacity, exposure, and sensitivity into the adaptation planning process against climate change [3,31,32,33]. The extent of the necessary adaptation measures is determined by defining the impacts and identifying the vulnerabilities, which offers a focused solution to complex issues. This process also facilitates the identification of critical underlying factors or exacerbating variables contributing to sector-specific vulnerabilities.
Once the assessment is completed, potential adaptation options can be framed, prioritized, and chosen. Then, a plan for implementation and the requirements for technical assistance and capacity building may be determined [32]. Climate change adaptation measures need a systematic base of specific indicators [43]. This may result in measures and investments failing to respond to future climate change impacts. The aim of carrying out a CRVA is to present a step-by-step method to come together with the stakeholders to make a more optimal selection of climate change adaptation measures. In this regard, a CRVA is a fundamental tool that provides invaluable information to this end. It enables professionals and decision makers to find the most vulnerable social groups, industries, and geographic regions [43].
Considering the adverse impacts of climate change, it is crucial to comprehend and evaluate the risks and vulnerabilities that are present in various sectors. Collaborative efforts across multiple disciplines, such as climate, geography, and socio-economic disciplines, are necessary to conduct a CRVA. Conducting a CRVA at any level or region is paramount to advance ongoing research into the effects of extreme climate and global change. Several relevant studies have been conducted on this topic, including [46,48,49,50,51]. The research conducted and the subsequent findings have proven to be crucial in comprehending the intricacies of a CRVA and its significance for stakeholders who bear the direct consequences of climate change.
Due to the importance of the research topic, this paper aims to conduct a CRVA to assess Georgian hydrology (water sector) under the impacts of climate change. Our assessment of the climate change risk and vulnerability in Georgia’s water sector involves a comprehensive analysis across multiple sectors such as agriculture, nature protection, health, energy, water management, and transport. We considered key factors such as climate, geography, and socio-economic aspects, acknowledging the water sector’s intricate interdependencies with other sectors. Our findings offer a systematic method and guidance for evaluating climate vulnerability to governmental and non-governmental adaptation executioners, such as government officials, development specialists, and civil society representatives. This method might also be used by technical experts and planners working at the local, sub-national, or national levels for decision making.
2. Materials and Methods
2.1. Study Area
Georgia is a transcontinental nation situated at the intersection of Eastern Europe and Western Asia. Figure 1a illustrates Georgia’s borders, including the Black Sea to the west, Russia to the north and northeast, Turkey to the southwest, Armenia to the south, and Azerbaijan to the southeast. Georgia is home to approximately 3.7 million people residing in an area spanning 69,700 square kilometers [52]. Despite its relatively small size, Georgia boasts a diverse topography (as seen in Figure 1b). It stands out as one of Europe’s most mountainous nations, situated within the Caucasus Mountains and the Greater Caucasus Mountains, forming a significant portion of its northern border.
2.1.1. Climate
The Black Sea influences much of the climate in the country’s western half, which is categorized as subtropical. The central part has a drier, moderate continental climate characterized by milder winters and warmer summers. The climate is the warmest along the Black Sea and substantially cooler on the slopes of the Great and Lesser Caucasus Mountain ranges. The annual mean temperature is about 7 °C. In the areas characterized by a continental climate, precipitation has an annual cycle, with most rain falling in the spring and early summer. In the subtropical region, rainfall occurs relatively uniformly throughout the year. The annual mean precipitation decreases from west to east, ranging from more than 4500 mm in the west to less than 400 mm in some central regions.
2.1.2. Hydrology
Georgia has over 26,000 rivers, over 800 lakes, over 40 water reservoirs (35 in the east of the country), and about 700 glaciers. Kura, Alazani, Aragvi, Enguri, and Rioni are the most important rivers. Many of them are used for hydropower, which supplies Georgia with more than 80% of its electricity. From west to east, the glacial contribution in discharge decreases, whereas the contributions from snow and rainfall increase. The area covered by Caucasus glaciers is decreasing by about 0.5% annually, with an increase in the eastern part of the Caucasus of 0.98% per year [53]. Snow cover and thickness are decreasing in the Caucasus areas, especially at higher altitudes [54]. This reduction can be explained by increased summer temperatures and incoming solar radiation due to changes in circulation, while the precipitation remains the same. As per the Climate Risk Country Profile of Georgia [55], glacier melt increases the discharge at present, but it is expected that, especially for the eastern rivers, the discharge may decrease by 30–50%.
Of the renewable surface water resources, 75% flows into the Black Sea basin with a volume of 42.5 km3/year [56]. The hydrographic network of Georgia is shown in Figure 1c, with six major river basins and river networks. Forestry is the principal land cover with 40.6%. General agricultural land covers 34% of the land, of which arable land covers 4.5%, and permanent crops cover around 1.8%. Of the cultivated land, about 29% is equipped for irrigation, while about 17.5% is potentially equipped for irrigation. Depending on the sources, these figures may differ. The global land cover map of Georgia, as shown in Figure 1d, provides geographical data on many land cover types on the earth’s surface, such as forests, grasslands, croplands, lakes, and wetlands.

2.2. Climate Change Outlook
2.2.1. Annual mean Temperature
Forecasts indicate that the annual mean temperature will shift significantly over the next few years [61]. The predicted shift range by 2030 will likely be +1.2 °C to +2.0 °C. This range is predicted to grow even wider by 2050, going from +1.6 °C to +3.0 °C. The predicted shift range is likely to be even more substantial by 2085, ranging from +1.9 °C to +4.9 °C [61]. Moreover, there is a very likely range of change in the annual mean temperature. This range is predicted to be between +1.1 °C and +2.3 °C by 2030. The spread will probably rise from +1.3 °C to +3.5 °C by 2050. Finally, by 2085, it is predicted that the change will most likely range from +1.3 °C to +6.1 °C [61].
2.2.2. Heat Waves
The duration of long-lasting heat waves is projected to change significantly in the coming years [61]. A substantial increase in the duration of heat waves is projected. The projected shift in the duration of long-lasting heat waves by 2030 is between +4 and +13 days. By 2050, this range is predicted to expand even more, going from +7 to +19 days. The range of anticipated changes in the duration of prolonged heat waves by 2085 is expected to be between +7 and +42 days [61]. Additionally, as highlighted in [61], there is a strong likelihood that the length of prolonged heat waves will alter. By 2030, this range will be between +2 to +16 days. It is expected to rise to +2 to +29 days by 2050. Ultimately, by 2085, the shift will likely occur within a range of +3 to +70 days.
2.2.3. Annual Total Precipitation/Precipitation Seasonality
Forecasts predict that the total annual precipitation will likely change from −3% to +5% by 2030, from −5% to +6% by 2050, and from −5% to +6% by 2085. However, the change range will likely be wider, with changes between −4% and +7% anticipated by 2030, −7% and +8% expected by 2050, and −11% and +9% expected by 2085 [61]. Although there is a significant amount of uncertainty in these predictions regarding future precipitation patterns, it is evident that changes are anticipated and should be considered when making climate change adaptation plans. Further, projections indicate that the winter season will see a slight rise in precipitation and that there is a propensity for drying during the summer season. In the winter, the predicted difference in total precipitation is likely between −5 and +25%, while in the summer, it is between −45 and +10%. The very probable range, however, is more severe, with a significant drop of −60 to +23% in the summer and a decrease of −17 to +40% in the winter [61]. These shifts may have significant ramifications in areas where water scarcity is already a problem.
2.3. Methodology
This study employed the CRVA methodology described in [3,26,31,32,33]. The CRVA methodology follows a top-down approach that primarily emphasized the biophysical impacts of climate change and ecosystem-based assessments. It presents the steps to systematically consider ecosystem-based solutions in the context of climate risk assessments applicable for several sectors like agriculture, nature protection, health, energy, water management, and transport. Additionally, geographic and socio-economic assessments are considered. The development of a standardized methodology for assessing the vulnerability to climate change poses a significant challenge, given the variances in the types and scope of impacts and the range of susceptibilities among critical economic sectors, administrative levels, and social groups [62]. The CRVA methodology for this study offers a flexible framework that can be adapted to diverse conditions in Georgia, allowing for customization to the specific contexts in which it will be utilized.
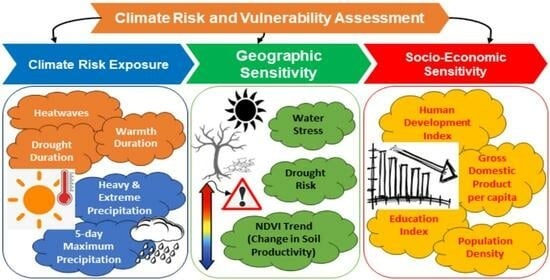
Heat indicating the maximum daily temperature, warmth duration, total precipitation, heavy and extreme precipitation, 5-day maximum precipitation, and drought duration were investigated as climate exposure indicators (Figure 2). Similarly, the climate-induced geographic sensitivity was assessed using indicators like water stress to measure the proportion of natural water resources used and drought risk, which incorporates population, poverty, and changes in soil productivity using the Normalized Difference Vegetation Index (NDVI) trend (Figure 2). Furthermore, the climate-induced socio-economic sensitivity was measured using indicators such as Gross Domestic Product (GDP) per capita, Human Development Index (HDI), Education Index (EI), and Population Density (Figure 2).
The indicators chosen for this study are of good quality and are easily accessible and publicly available for research purposes. All of the indicators were obtained from trusted data sources and widely used by the research community [63,64,65,66,67,68,69]. Further, the pre-processing steps of data cleaning, aggregation, and resampling were performed on the dataset to ensure the highest quality and reliability.
All of the indicators considered in this study have different characteristics, making it challenging to bring them together to carry out the CRVA. To address this challenge, the indicators were standardized before assessing their impacts on climate risk and vulnerability. The quantile classification method for all indicators was first applied to achieve standardization. Next, we reclassified the discrete quantile classes into a predefined set of values based on each indicator’s characteristics.
Quantile classification is a data classification method that distributes a set of values into groups that contain an equal number of values. The attribute values are summed and then divided into the predetermined number of classes. This classification ensures that the data classes that are created are equally represented on a map. This classification technique is beneficial for ordinal data as it provides the same number of values for classes at the extremes and middle, resulting in the easy computation of classes.
The compiled data were converted into raster data, and then quantile-classified into six classes. The quantile-classified rasters were subsequently reclassified to values ranging from +1 to +6 in the case of negative change, with +1 being the least exposed to risk and +6 being the most exposed to risk. Similarly, the parameters showing positive responses in future scenarios were reclassified into a range from −6 to −1, with −1 showing the least positive response and −6 showing the most positive response.
In a few instances where changes were present in positive and negative directions, these indicators were reclassified into seven different classes, taking the 0 value as the base instead of classifying them into six classes. As shown in Figure 2, the classes employed and their color palettes reflect the score range from −1 to −6 for a positive impact and from +1 to +6 for a negative impact.
2.3.1. Global Climate Models (GCMs)
Climate risk assessment relies on creating climate exposure maps, which involves a detailed process of preparing these maps based on extreme climate indices. The foremost requirement for generating such climate exposure maps is the availability of datasets derived from global climate models. In this particular study, Global Climate Models (GCMs) from the Coupled Model Intercomparison Project Phase 5 (CMIP5) were employed.
Prior to selecting the GCMs, an extensive literature review was conducted, drawing upon the research of [70,71,72]. Two primary criteria were established: first, GCMs with a spatial resolution of less than 2 degrees (approximately 200 km), and second, GCMs with a comprehensive projected dataset of climate extreme indices, specifically from the Expert Team on Climate Change Detection and Indices (ETCCDI), for the future climate change scenarios outlined in the Representative Concentration Pathway (RCP). These criteria were selected for subsequent exposure, sensitivity, and vulnerability assessments.
By adhering to these criteria and building upon the insights of the aforementioned studies, seven climate models were chosen for the study area. The table below (Table 1) presents these seven selected GCMs along with their respective spatial resolutions.
An RCP scenario, distinct from emissions, is a greenhouse gas concentration pathway established by the IPCC. In the Fifth Assessment Report (AR5) published in 2014, the IPCC utilized four such pathways. For this study, our focus was on the RCP 4.5 and RCP 8.5 future (2040–2060) climate change scenarios. This selection was deliberate, as it encompasses both optimistic and pessimistic outlooks for future climate scenarios. Specifically, RCP 4.5 represents a more optimistic scenario, while RCP 8.5 paints a more pessimistic picture. Once the models were chosen, the subsequent step involved obtaining the data from the extreme climate indices for these selected models.
2.3.2. ETCCDI Extreme Climate Indices (Climate Exposure Indicators)
The ETCCDI extreme climate indices data were accessed through the Climdex portal (https://climate-modelling.canada.ca/climatemodeldata/climdex/) (accessed on 15 June 2022) [73]. Several global climate models contributing to CMIP5 were used to compute the climate extreme indices defined by the ETCCDI. The authors of [74,75] report the validation of climatic extremes indices and analyze their projected future changes simulated using the CMIP5 models. This study utilized the data from the extreme climate indices computed from the selected CMIP5 models in Table 1. For the assessment, the ensemble mean of the selected CMIP5 GCMs (Table 1) was computed for each extreme climate index for the future period (2040–2060) under the RCP 4.5 and RCP 8.5 scenarios, as well as the baseline period (1961–1990). Finally, the projected change for each climate index was calculated by subtracting the long-term average values of the baseline period from those of the future period under RCP 4.5 and 8.5 scenarios. The extreme climate indices chosen for the study and their brief definitions are provided in Table 2.
2.3.3. Geographic Indicators
The geographic indicators used for the sensitivity assessment in this study are tabulated in Table 3. Water stress, expressed in percentage, quantifies the ratio of sectoral water demand to water supply. Higher values mean greater user rivalry for water. Drought risk combines drought hazard, exposure, and vulnerability [69,76]. It measures where droughts are likely to occur, the population and assets exposed, and the vulnerability of the population and assets to adverse effects. Higher values indicate a higher risk of drought. The water stress and drought risk data were obtained from the Aqueduct Project 3.0, World Resources Institute (WRI) [77].
NDVI is an indicator of the greenness of the biomes. The MODIS Terra Vegetation Indices 16-Day Global 250 m version 6.0 [78] data were used to calculate the NDVI trend for the 2000–2020 period in the Google Earth Engine (GEE) environment. The MODIS NDVI was computed from atmospherically corrected bi-directional surface reflectances masked for water, clouds, heavy aerosols, and cloud shadows [78]. The linear regression approach was considered for determining the trend values of the NDVI. The positive NDVI trend values indicate an increment in the greenness of the biomes, whereas the negative NDVI trend values indicate a decrement in the greenness of the biomes due to over-exploitation of the land or a change in the land use pattern in the region.
2.3.4. Socio-Economic Indicators
The socio-economic indicators used for the sensitivity assessment in this study are tabulated in Table 4. The GDP per capita is gross national income (GNI) converted to international dollars using purchasing power parity (PPP) rates. The EI measures a country’s overall achievement in the educational dimension. The GNI (PPP) per capita and life expectancy are also considered while calculating the country’s education index. Population density is midyear population divided by land area in square kilometers. The provincial/sub-national level GDP per capita, EI, and population density data were obtained from the National Statistics Office of Georgia [52]. HDI measures a country’s overall achievement in its social and economic dimensions, like people’s health, education attainment, and standard of living. The provincial/sub-national level HDI data were retrieved from the Subnational HDI Database of the Global Data Lab [79,80].
2.3.5. Climate Exposure, Geographic and Socio-Economic Sensitivity, Climate Risk and Vulnerability Index
Table 5 provides the equations used to calculate the Climate Exposure Index, Geographic Sensitivity Index, Socio-economic Sensitivity Index, and Climate Risk and Vulnerability Index. These equations were applied easily due to the standardized procedure implemented to streamline the analysis of indicators, as discussed earlier. The weighting factors for each indicator were determined based on their importance in assessing the risk and vulnerability of Georgia to the impacts of climate change. Moreover, multiple iterations utilizing varying weights were conducted to obtain the most suitable weights that yielded expected outcomes within the study area. The weights employed, as presented in Table 5, produced results and findings that were accurate, thereby enhancing the dependability of said weights. Indicators that have more direct adverse impacts on the water resources of Georgia were assigned higher weights. The weights were finalized after consultation with stakeholders and climate experts.
3. Results and Discussion
3.1. Climate Exposure Assessment
East Georgia can expect the highest increase in maximum temperature, up to 3.6 °C under the RCP 4.5 scenario (Figure 3a) and up to 4.5 °C under the RCP 8.5 scenario (Figure 4a). However, in both scenarios, west Georgia can expect an increase of 4 °C in the maximum temperatures. The warmth duration increases the impact of the maximum temperature. This increment in warmth duration is expected to occur nationwide, with a minimal 13–18% increase in the mountain areas and over a 25% increase in the southern regions and Adjara, as observed in Figure 3b andFigure 4b, respectively. The southern region of Georgia is more affected by the increased warmth duration than the rest of the country.
The precipitation is expected to decrease by up to 33 mm under RCP 4.5 (Figure 3c) and by 44 mm under the RCP 8.5 scenario (Figure 4c) in Eastern Georgia. While Eastern Georgia faces reduced precipitation, Northwest Georgia can expect an increase in the total precipitation. The precipitation effectiveness depends on the yearly average and interannual differences, seasonal shifts, extreme precipitation, and land degradation. The need for irrigation will also appear in the summer as the rainfall decreases, significantly impacting crops such as maize or walnuts. This reduction is also expected in the mountain areas of Mscheta and Kakheti, which will decrease the summer discharge of rivers like Aragvi, Iori, and Alazani.
The spring and summer precipitation values clearly show the shift in precipitation from the summer period (up to −140 mm) to the spring period (up to +30 mm), as shown in Figure 5a–d. A clear shift is visible with increased spring precipitation and strongly reduced summer precipitation for Western Georgia by up to 140 mm under the RCP 8.5 scenario, as seen in Figure 5b,d. This shift is the strongest in the coastal areas (Samegrelo, Guria, and Adjara), where water retention will be required besides drainage. The eastern part will need increased natural water retention and water efficiency. However, in the mountains of Mtskheta-Mtianeti and Kakheti, summer precipitation will be strongly reduced, reducing river discharge. Under RCP 4.5, almost the whole country is assumed to have increased precipitation in the spring (Figure 5a). Under RCP8.5, Kvemo Kartli is expected to have reduced spring precipitation, as observed in Figure 5a–d.
Heavy and extreme precipitation are indicators of adequate precipitation. The higher the amount of heavy precipitation, the higher the runoff, and the less effective the infiltration in soil. Also, it is an indicator of hazards like mudflow and flash flood risk. Especially in the western provinces, heavy precipitation is expected to increase to 44.8 mm under RCP 4.5 (Figure 3d) and to 54.9 mm under RCP 8.5 (Figure 4d). Similarly, extreme precipitation is expected to increase to 17.8 mm under RCP 4.5 (Figure 3e) and to 27.5 mm under RCP 8.5 (Figure 4e) in the western provinces near the coast. Therefore, these regions require increased drainage capacities to deal with flooding in the future.
The 5-day maximum precipitation indicates the soil erosion risk and hazards, like flooding and slope failures. The coastal area and southern Kakheti seem to have the highest exposure to these problems. The maximum positive changes of up to 7.6 mm under RCP 4.5 (Figure 3f) and 6 mm under RCP 8.5 (Figure 4f) can be expected in these regions.
The projected change in the 100-year return-period riverine flood risk in 2050 compared to 1980 under the RCP 4.5 and 8.5 scenarios are also investigated in this study. The riverine flood risk map was created by subtracting the historical flood risk map from the RCP flood risk map, as shown in Figure 6. Almost all rivers show an increased flood risk, mostly in the western part of the country, but also in the Kura and Alazani basins.
A drought duration increase is directly linked to the request for water. For southern Kakheti and Abkhazia, the drought duration is expected to increase by up to 9 days under RCP 4.5 (Figure 3g) and by up to 11 days under RCP 8.5 (Figure 4g). Further, under RCP 8.5, in the upstream area of rivers like Aragvi, Iori, and Alezani in the northeast region, the drought duration will increase by up to 9.5 days, leading to decreased summer discharge (Figure 4g).
Combined Climate Exposure Map
The combined climate exposure map (Figure 7) is created using the equation provided in Table 5. The value of 1 is the lowest exposure, and the value of 6 is the highest exposure to climate risks, as seen in Figure 7.
The climate exposure in the water sector can be expected from heat; reduced precipitation, especially in the summer; increased heavy precipitation; and increased drought. This means there is less water availability in the growing season and increased water requests. The country’s eastern and southern regions have a high exposure score ranging from 4 to 6 (Figure 7). These are the vulnerable regions that will be directly exposed to an extreme climate in the future under the RCP 4.5 and RCP 8.5 scenarios. The upstream reaches of the major rivers (northeastern area) are also under the highest risk of exposure to extreme climate, which will ultimately impact the country’s water resources, as observed in Figure 7.
The Kakheti, Mtskheta-Mtianeti, Kvemo Kartli, and Samtskhe–Javakheti provinces are the most exposed to climate change under both RCP scenarios, as seen in Figure 7. An increased extreme maximum temperature (up to 3.6 °C) and an increased warmth duration (up to 25%), a decrease in precipitation (especially in the eastern provinces), and an increased drought duration are the most critical factors. The decreased precipitation in the eastern part of the country will be accompanied by increased heavy precipitation, resulting in less available water resources. The heavy precipitation of up to 55 mm for the coastal region overrules the precipitation increase (up to 6.4 mm). A substantial increase in the drought spell duration ranging from 4 to 12 days, is expected for the eastern and northern parts of the country. As a result of the increase in the 5-day maximum precipitation in Abkhazia, Guria, and Adjara, an increased risk of flooding may be expected.
3.2. Geographic Sensitivity Assessment
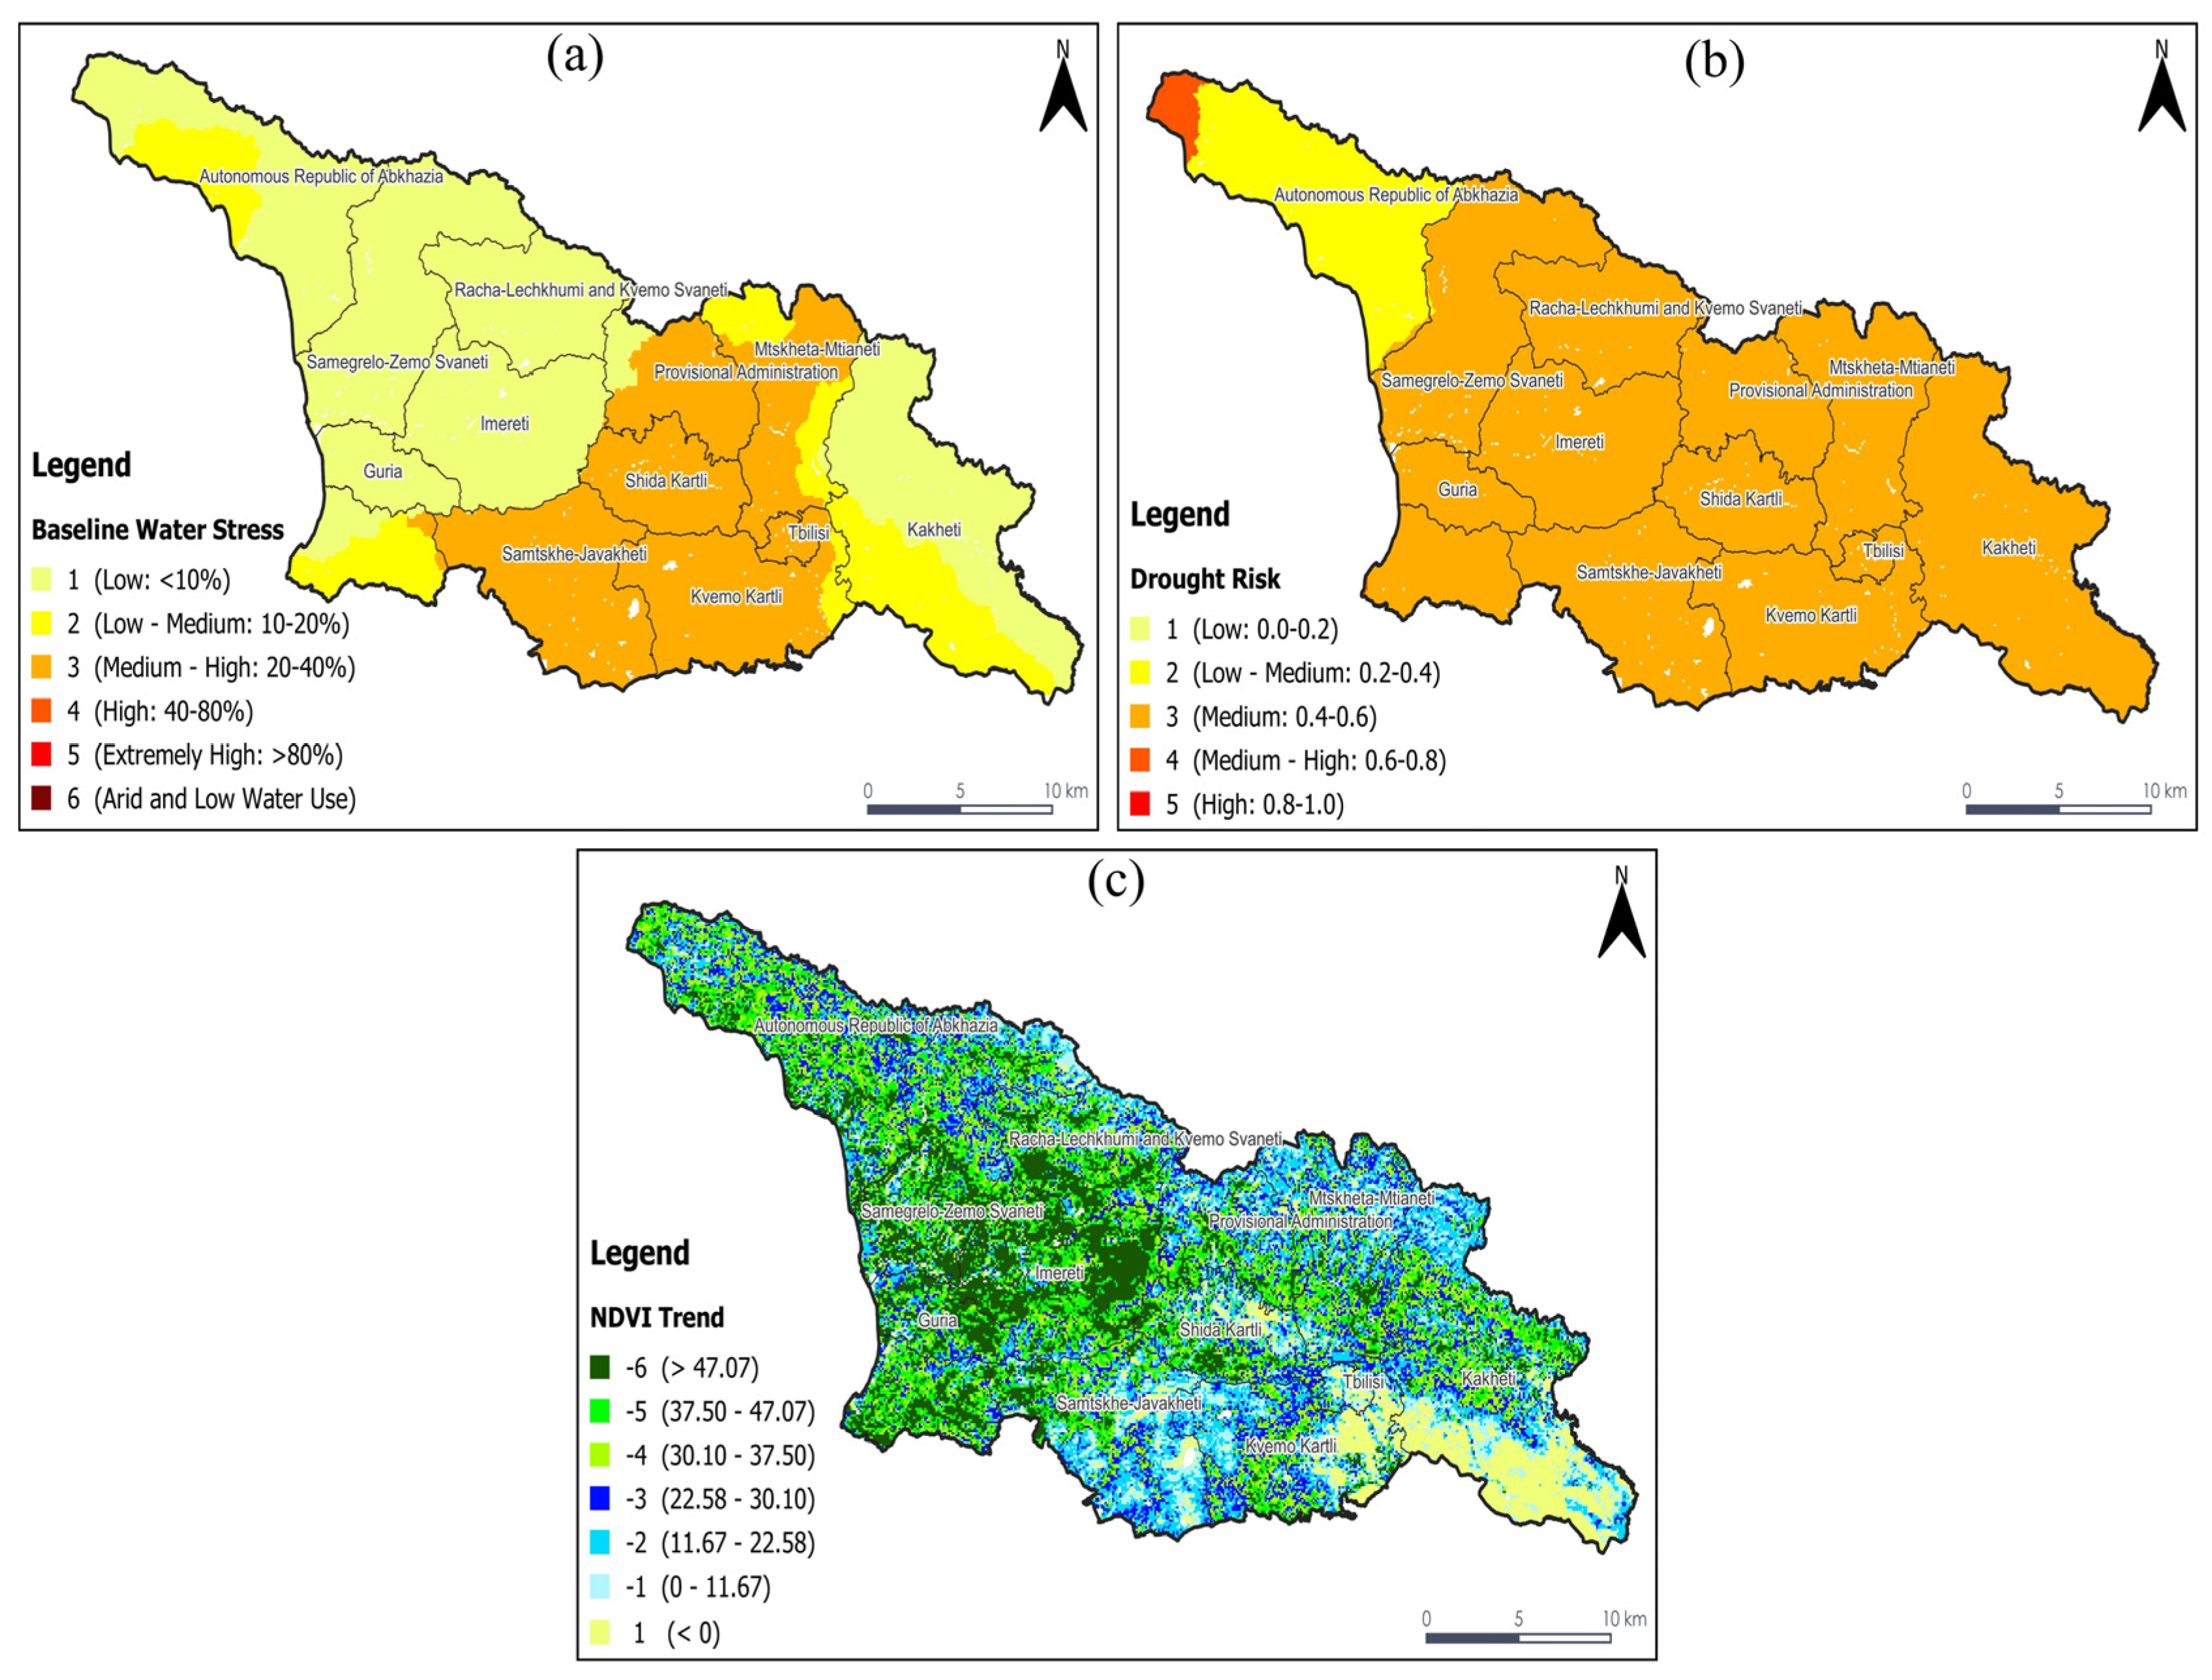
There is medium-high (20–40%) water stress in the central region of Georgia, mainly in Kvemo Kartli, Tbilisi, Shida Kartli, Samtshke-Javakhet, the provincial administration region, and Mtsheta-Mtaneti, as seen in Figure 8a. Low (10%) to low-medium (10–20%) water stress is present in the rest of the country, mainly in the eastern and western regions (Figure 8a). There is a medium drought risk with a rating of 0.4 to 0.6 in most of the country except for the Abkhazia region, as seen in Figure 8b.
A change in the NDVI indicates a change in the soil productivity. Land productivity is a result of climate and land management. A change in the productivity can result from a sensitivity to climate change and human-induced land management. Southern Kakheti, Kvemo Kartli, and the upper regions of Mscheta show losses in land productivity over the past 20 years (Figure 8c). Moreover, the country’s eastern region shows a gain in land productivity as there has been a positive increase in the trend over the past two decades, as observed in Figure 8c.
Combined Geographic Sensitivity Map
The combined geographic sensitivity map (Figure 9) was created using the equation in Table 5. The value of −4 is the lowest, and 3 is the highest, as seen in Figure 9.
Southern Kakheti, Kvemo Kartli, Tbilisi, Mtskheta-Mtianeti, Samskhe-Javakheti, and Shida Kartli are the most sensitive to climate change, with higher Geographic Sensitivity Index scores ranging from 1 to 3 (Figure 9), as a result of medium water stress and a decrease in land productivity. The mountain areas of Mscheta-Mtianeti and Svaneti are the most sensitive due to the reduced land productivity, which can be partly related to human-induced land degradation and will impact water resources and natural hazards.
Water stress and drought risk are major geographic indicators for sensitivity. The provinces of Shida Kartli, Samtskhe-Javakheti, Mtskheta-Mtianeti, and Kvemo Kartli have medium sensitivity to water stress. The drought risk is medium for almost all parts of the country. The decrease in land productivity is most visible in Southern Kakheti, Kvemo Kartli, Samtskhe–Javakheti, and Mtskheta-Mtianeti. The increase in soil productivity can mainly be found at higher elevations. There are prominent human-induced land degradation impacts in the southern Kakheti, northern and southern Mtskheta-Mtianeti, eastern Samtskhe–Javakheti, Rachi-Lechkhumi, and Svaneti regions. This makes most of Eastern and Southern Georgia geographically sensitive to climate exposure, as indicated in Figure 9.
3.3. Socio-Economic Sensitivity Assessment
The GPD per capita of Georgia ranges from less than USD 2600 to more than USD 3600, as seen in Figure 10a. Kakheti and Guria have lower GDP per capita values, whereas Tbilisi, Mtsheta-Mtaneti, and Adjara have higher GDP per capita values (Figure 10a). Tbilisi, Imereti, Racha-Lechkhumi, Kvemo Svaneti, and Adjara have higher HDIs that are greater than 0.81, whereas the Mtsheta-Mtaneti, Kakheti, and Guria provinces have lower HDI values than the rest of the provinces with less than 0.77 (Figure 10b).
Tbilisi, Imereti, Racha-Lechkhumi, Kvembo Svaneti, and Adjara have higher EI values that are greater than 0.851, whereas Kvemo Kartli, Samtskhe–Javakheti, and Guria have lower EI values than the rest of the provinces with less than 0.802 (Figure 10c). Tbilisi, some parts of Imereti, and Kvemo Kartli, along with other coastal cities in the western region, show higher population densities, as seen in Figure 10d.
The socio-economic data used in this study were sourced from the National Statistics Office of Georgia, an official government agency that ensures the data’s accuracy and reliability. The authors of [83] employed the GDP as a key economic indicator to assess the risks and vulnerabilities stemming from multiple hazards in Georgia. This underscores the indicator’s value in the CRVA. It is advisable to exercise caution when dealing with socio-economic data and to critically evaluate their reliability before drawing any conclusive inferences.
Combined Socio-Economic Sensitivity Map
The combined socio-economic sensitivity map (Figure 11) was created using the equation in Table 5. The value of 1 is the lowest sensitivity, and 6 is the highest sensitivity, as seen in Figure 11.
Socio-economic sensitivity is directly linked to issues like education and health services, life expectancy, income per capita, and, to a lesser extent, the population density. From a socio-economic view, Guria and Kakheti, followed by Kvemo Kartli and Shida Kartli, have the highest Socio-economic Sensitivity Index scores ranging from 4 to 6 (Figure 11) and the lowest adaptive capacities. The lower GDP per capita and the lack of quality education services play significant roles in this increased sensitivity in these regions.
The higher income per capita can be found in Adjara and Mtskheta-Mtianeti, followed by Samegrelo, Zemo Svaneti, and Samtskhe-Javakheti. Guria and Kakheti have the lowest scores of income per capita. The Human Development Index (life expectancy, education, and health) is the lowest in the Mtskheta-Mtianeti region, followed by Kakheti, Guria, Samegrelo, and Zemo Svaneti. The Education Index is the lowest in Guria and Kvemo Kartli, followed by Samegrelo, Zemo Svaneti, and Guria. After Tbilisi and Adjara, Imereti, Kvemo Kartli, and Shida Kartli have the highest population densities. As a result, Guria and Kakheti have the highest socio-economic sensitivities and the lowest adaptive capacities, followed by Kvemo Kartli and Shida Kartli, as observed in Figure 11.
3.4. Climate Risk and Vulnerability Map
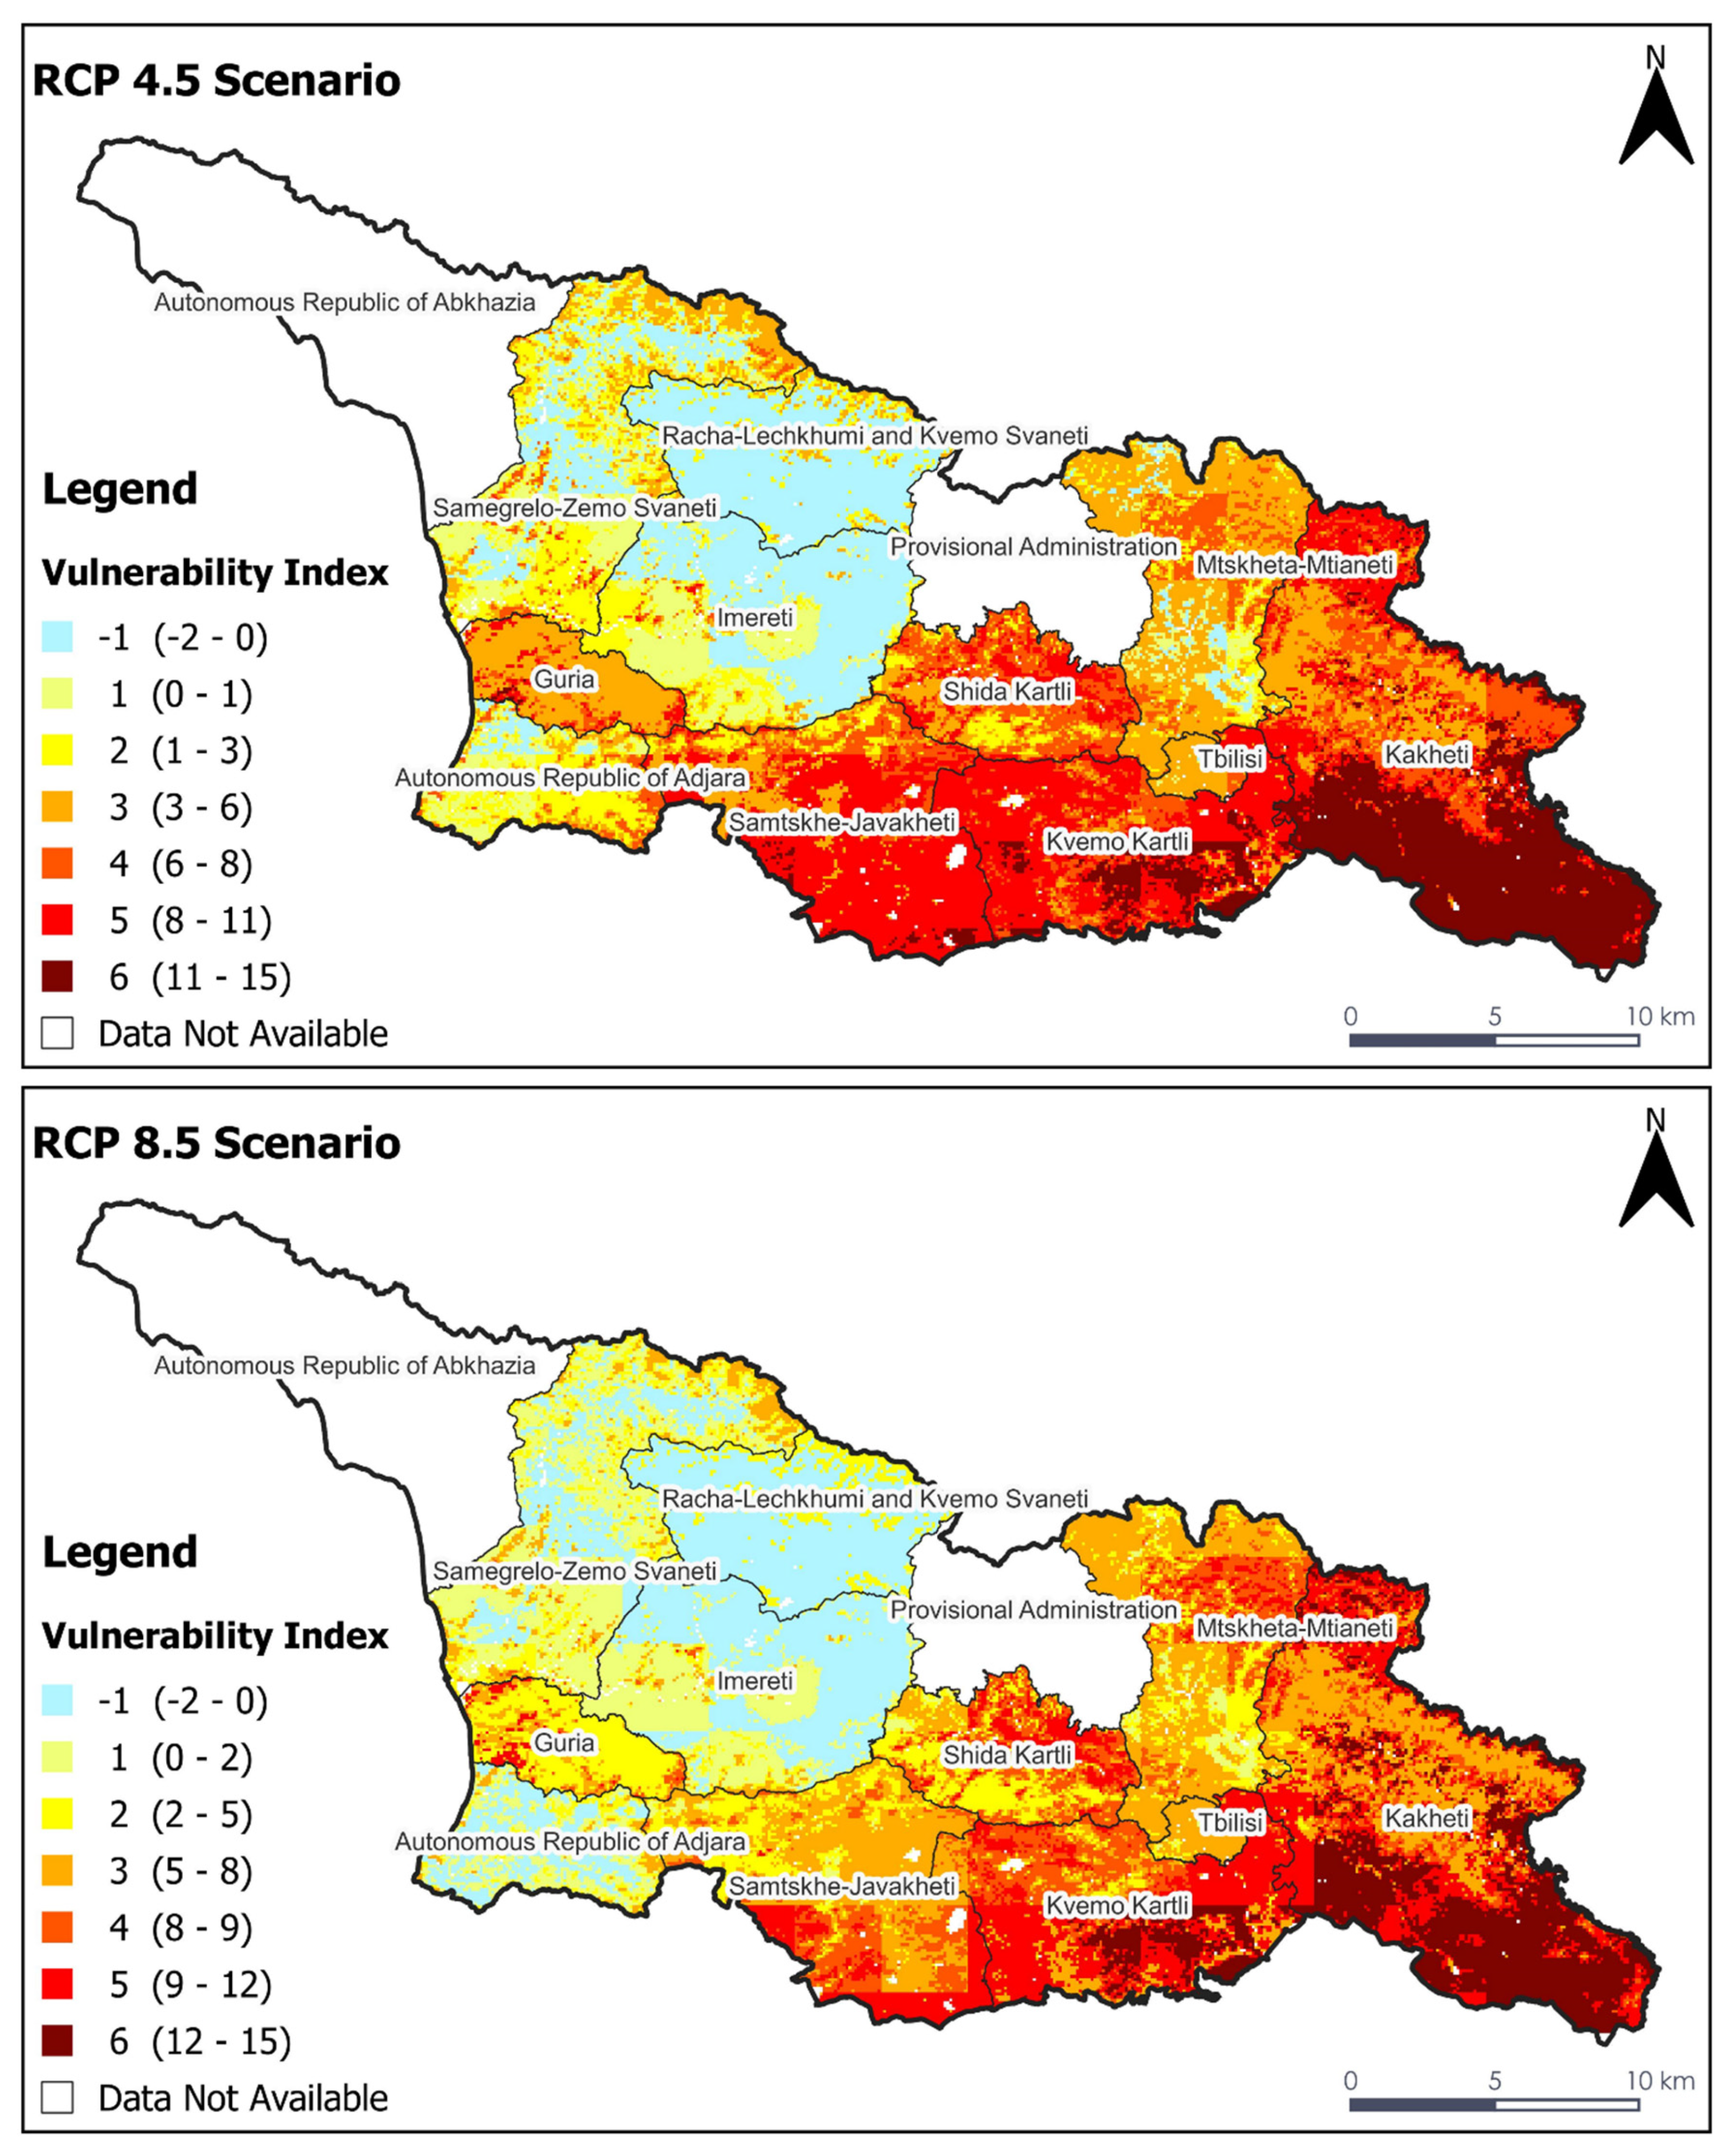
The map of climate risk and vulnerability (Figure 12) was created using the equation in Table 5. The value of −1 is the least vulnerable, and 6 is the most vulnerable, as seen in Figure 12. By applying the same classification system for all indicators, the summaries from different indicators are statistically allowed to obtain climate change risk and vulnerability maps.
Climate vulnerability, which is composed of climate exposure, geographic sensitivity, and socio-economic sensitivity, is expected to be the highest in the Kakheti and Kvemo Kartli regions under both RCP scenarios, as indicated in Figure 12. These regions show higher vulnerability indices ranging from 4 to 6. Under the RCP 4.5 scenario, the Samtskhe–Javakheti and Shida Kartli regions show higher vulnerability indices, indicating that these regions are also vulnerable to climate change impacts along with the other regions mentioned above, as seen in Figure 12. This shows that regions with higher vulnerabilities to climate change and more pronounced impacts on water resources meet extreme climate exposure, increased water stress, lower productivity linked to land degradation, low income per capita, lower education and HDI, and higher population density. It is worth noting that the mountain ranges influence the vulnerability to climate change in Georgia. The higher vulnerability index values in the upstream areas of the Alazani-Iori, Khrami-Debeda, and Mktvari river basins also provide evidence that the water resources in Georgia will deplete and affect the country’s overall water availability, as indicated in Figure 12.
During periods of drought, the water sector can come under increased pressure. This heightened stress is compounded by more intense precipitation, which hinders infiltration. Such stress affects the water sector by impacting the availability of drinking water, especially from open water sources and non-segregated drainage and sewage systems. In the western part of the country, particularly the coastal region, the amount of heavy precipitation increases, and the timing shifts from summer to spring. This necessitates greater water retention, drainage, and reservoir buffer capacity.
Furthermore, rising temperatures and the prevalence of drought lead to increased evaporation from water reservoirs, resulting in significant water loss. Glacier melt, combined with summer droughts, further reduces the summer flow of eastern rivers, limiting water availability for abstraction. The reluctance of farmers to engage in irrigation water contracts adds to the inefficiencies in water delivery as long-term water management planning becomes unfeasible.
The most pressing issue, however, lies in the shortage of young professionals and the low level of professional education. The outflow of experienced professionals due to retirement exceeds the inflow of well-trained young experts. This poses a significant threat to water management despite the imperative for climate adaptation. It is particularly vulnerable in provinces with low education indices, such as Kvemo Kartli, Guria, and Samtskhe-Javakheti. The critical hazards anticipated to worsen are heat, extremely high precipitation, drought, and land degradation. Heat, drought, and land degradation are expected to have the highest economic costs. These are mostly not recognized as hazards as the responsibility is not in emergencies but in other sectoral institutions like agriculture, water resources, and environmental agencies. Eastern Georgia will be impacted the most by drought, and the western provinces will be impacted the most by extreme precipitation, which will cause an increased risk of hazards like mudflow, landslides, flash floods, and flooding. The relatively low adaptive capacities in the Kakheti, Kvemo Kartli, and Guria areas need particular attention.
The analysis highlighted the likely climate changes in Georgia and which territories are the most vulnerable. The eastern part of the country presents the greatest vulnerability to climate change, and these are also territories for which agricultural activity is essential both in socio-economic and cultural terms. In these regions, investments in irrigation and support for agricultural development will also be the most important in the coming years. The analysis also shows that the traditional dichotomy between the west and east of Georgia, with the west requiring drainage and the east requiring irrigation, needs to be rethought in light of the perceived and expected effects of climate change.
Assessing the impacts on the hydrology and water availability of Georgia through CRVA under future climate scenarios is a pertinent issue that requires attention in the present context for the country. Despite the importance of this topic, only a few studies have been conducted to investigate the risk assessment of Georgia, and recent studies focusing on assessing the risk in water resources due to climate change impact are limited. For instance, the authors of [84] conducted a risk assessment of surface and subsurface water due to natural disasters in small regions of Georgia. This paper highlighted the adverse implications of natural disasters on Georgia’s largest rivers, namely the Kura and the Rioni rivers, which is consistent with the findings of this study. This demonstrates the vulnerability of these river basins to the impacts of extreme climate.
The authors of [85] researched the landslide risk assessment of Georgia and created a landslide susceptibility map for the country using a similar approach to that used in this study. Their multi-hazard risk assessment employed a hazard, exposure, and risk analysis to develop a vulnerability map for landslide risks. This helps to validate the method applied in this study to carry out a CRVA.
The authors of [83] developed a comprehensive national framework for assessing Georgia’s natural hazards, risk, and vulnerability. The authors used multiple linear regression methods to establish correlations between economic losses, physical exposure, and hazards by linking physical and socio-economic variables. This enabled them to conduct an effective risk assessment and devise appropriate risk management strategies. The results and findings of this study appear to lend support, at least in part, to the future outlook envisioned by the authors of [83,85].
Overall, the need for a risk assessment of Georgia’s water resources while considering climate change cannot be overstated, and this study contributes to the growing body of literature focused on this crucial issue.
3.5. Limitations
Some of the limitations of this study are as follows:
- Climate change simulated using climate models must undergo significance testing to determine the reliability of the simulation results compared to the model’s internal variability. Although this study utilized an ensemble mean of selected GCMs to decrease uncertainty and model internal variability to some extent, carrying out significance testing on the GCMs would provide further accuracy and confidence to the results.
- This study used various indicators from different sources, each with distinct characteristics. The indicators were measured or determined using different baseline periods. This study carefully selected the indicators and data sources. The indicators used for this study are widely used and accepted by the research community. This approach was adopted to ensure that the methods of calculating the CRVA remain simple to replicate in other regions.
- As per [78], the algorithm used to determine the NDVI selects the optimal pixel value by analyzing all of the data gathered over 16 days, with additional criteria such as less cloud cover, a lower viewing angle, and the highest NDVI value. Therefore, this study trusted the data and used it for the analysis, assuming it underwent some post-processing and validation. However, it is always recommended to conduct additional atmospheric and radiometric corrections to improve the accuracy of the NDVI data.
- The weights used in the equations to determine the exposure risk, sensitivity, and vulnerability index were not chosen solely based on scientific methods. This might raise questions about the reliability of the analysis. These weights are critical for assessing climate risk and vulnerability, so it was necessary to have extensive discussions among different stakeholders in Georgia. Ensuring that all parties involved took and accepted the study’s findings seriously was essential.
- This study utilized the ETCCDI climate indices data from the CMIP5 GCMs. However, it is worth noting that the CMIP6 GCM data have recently become available and have been made publicly accessible. For further research, it may be worthwhile for researchers to calculate extreme climate indices using the CMIP6 data and conduct a CRVA study to examine any potential variations in the outcomes.
4. Conclusions
In conclusion, this study has made significant contributions to the field of CRVA by utilizing a straightforward approach that can be easily replicated in any region or scale of the world. This study’s findings have shed new light on utilizing publicly available data and the methods used to conduct a CRVA under future climate change RCP scenarios across various sectors and disciplines. The recommended CRVA approach in this study is expected to assist government agencies and other institutions in assessing climate risk and vulnerability due to climate change or extreme weather events. The findings of the CRVA study will enable stakeholders to make informed decisions and allocate resources to areas that are highly susceptible to climate risks and their consequences.
This CRVA provides a bridge between climate change and the measures that Georgia can implement to manage and adapt to the regional risks posed by the changing climate. The Kakheti, Kvemo Kartli, Samtskhe–Javakheti, Mtskheta-Mtianeti, and Shida Kartli regions are the most vulnerable to climate change risks under both RCP scenarios. These regions are evaluated based on their climate exposures, geographic sensitivities, and socio-economic sensitivities. It is also concluded that the mountain ranges influence the vulnerability to climate change. It should be noted that the average precipitation is increasing, and precipitation is shifting from summer to early spring. This increases the duration of potential drought events during the summer months. Georgia’s water stock in glaciers is also reducing due to the shift in precipitation to a lower altitude and increased sublimation. This increases river discharge in the short term but will rapidly decrease in the longer term. The yearly reduction in river discharge differs from the west to east.
These results show that regions with higher vulnerabilities to climate change and more pronounced impacts on water resources meet extreme climate exposure, increased water stress, lower productivity linked to land degradation, a low income per capita, lower education and HDI, and a higher population density. The higher vulnerability index to climate change in the upstream areas of the Alazani-Iori, Khrami-Debeda, and Mktvari river basins also provides strong evidence that the water resources in Georgia will become depleted and affect the country’s climate, geography, and socio-economic sectors.
This study had several limitations that should be considered when interpreting its findings. These limitations can be addressed in future studies to improve the findings further. These limitations include the need for significance testing on the GCMs used for the simulation, the absence of accuracy and consistency tests in the study area, the use of various other indicators, the use of non-scientific weights in equations, and the use of more recent CMIP6 GCM data. While these limitations may affect the study’s accuracy, the indicators used are widely accepted by the research community, and the study’s findings can still provide valuable insights into the climate risk and vulnerability of the study area. Despite these limitations, it is safe to assume that this study represents an important step forward in the field and can potentially make a significant scientific impact.
Author Contributions
Conceptualization, A.A. and R.B.; methodology, A.A. and R.B.; software, A.A.; validation, A.A. and R.B.; formal analysis, A.A.; investigation, A.A. and R.B.; resources, A.A. and R.B.; data curation, A.A.; writing—original draft preparation, A.A.; writing—review and editing, A.A., R.B. and V.L.; visualization, A.A.; supervision, R.B. and V.L.; funding acquisition, V.L. All authors have read and agreed to the published version of the manuscript.
Funding
This study was part of the project named “Feasibility Study of the Policy Based Loan on Water Resources Management Project in Georgia (Project Contract No.—CGE 1054)”, which was funded by the French Development Agency (AFD) and supported by the BRL Ingénierie (BRLI). BRLI is a consulting firm based in France that offers specialized services in water, environment, and regional land-use management sectors. Further, AFD is a public financial institution that executes the policies established by the French Government to combat poverty and encourage sustainable development around the world.
Data Availability Statement
The datasets generated and analyzed during the current study are available from the corresponding authors upon reasonable request.
Acknowledgments
We thank the French Development Agency (AFD) and the BRL Ingénierie (BRLI) for their support and motivation. We would also like to thank Sophia Bakar for helping with the editing process. We would also like to acknowledge the reviewers for providing constructive feedback on our research paper and for their valuable time.
Conflicts of Interest
The authors declare no conflict of interest.
References
- Liang, Y.; Song, W. Integrating Potential Ecosystem Services Losses into Ecological Risk Assessment of Land Use Changes: A Case Study on the Qinghai-Tibet Plateau. J. Environ. Manag. 2022, 318, 115607. [Google Scholar] [CrossRef] [PubMed]
- Sekhri, S.; Kumar, P.; Fürst, C.; Pandey, R. Mountain Specific Multi-Hazard Risk Management Framework (MSMRMF): Assessment and Mitigation of Multi-Hazard and Climate Change Risk in the Indian Himalayan Region. Ecol. Indic. 2020, 118, 106700. [Google Scholar] [CrossRef]
- Fritzsche, K.; Schneiderbauer, S.; Bubeck, P.; Kienberger, S.; Buth, M.; Zebisch, M.; Kahlenborn, W. The Vulnerability Sourcebook: Concept and Guidelines for Standardised Vulnerability Assessments; Deutsche Gesellschaft für Internationale Zusammenarbeit (GIZ) GmbH: Bonn, Germany; Eschborn, Germany, 2014. [Google Scholar]
- CNA Corporation. National Security and the Threat of Climate Change; CNA Corporation: Alexandria, VA, USA, 2007. [Google Scholar]
- Wheeler, T.; Von Braun, J. Climate Change Impacts on Global Food Security. Science 2013, 341, 508–513. [Google Scholar] [CrossRef] [PubMed]
- Li, L.; Wang, B.; Feng, P.; Jägermeyr, J.; Asseng, S.; Müller, C.; Macadam, I.; Liu, D.L.; Waters, C.; Zhang, Y.; et al. The Optimization of Model Ensemble Composition and Size Can Enhance the Robustness of Crop Yield Projections. Commun. Earth Environ. 2023, 4, 362. [Google Scholar] [CrossRef]
- Calzadilla, A.; Rehdanz, K.; Betts, R.; Falloon, P.; Wiltshire, A.; Tol, R.S.J. Climate Change Impacts on Global Agriculture. Clim. Chang. 2013, 120, 357–374. [Google Scholar] [CrossRef]
- Liu, K.; Harrison, M.T.; Yan, H.; Liu, D.L.; Meinke, H.; Hoogenboom, G.; Wang, B.; Peng, B.; Guan, K.; Jaegermeyr, J.; et al. Silver Lining to a Climate Crisis in Multiple Prospects for Alleviating Crop Waterlogging under Future Climates. Nat. Commun. 2023, 14, 765. [Google Scholar] [CrossRef] [PubMed]
- Parker, L.; Bourgoin, C.; Martinez-Valle, A.; Läderach, P. Vulnerability of the Agricultural Sector to Climate Change: The Development of a Pan-Tropical Climate Risk Vulnerability Assessment to Inform Sub-National Decision Making. PLoS ONE 2019, 14, e0213641. [Google Scholar] [CrossRef]
- Kirilenko, A.P.; Sedjo, R.A. Climate Change Impacts on Forestry. Proc. Natl. Acad. Sci. USA 2007, 104, 19697–19702. [Google Scholar] [CrossRef]
- Tol, R.S.J. The Economic Impacts of Climate Change. Rev. Environ. Econ. Policy 2018, 12, 4–25. [Google Scholar] [CrossRef]
- Cutter, S.L.; Boruff, B.J.; Shirley, W.L. Social Vulnerability to Environmental Hazards. Soc. Sci. Q. 2003, 84, 242–261. [Google Scholar] [CrossRef]
- Aryal, A.; Bosch, R.; Lakshmi, V. Climate Risk and Vulnerability Assessment of the Georgian Hydrology (Water Sector) to the Effects of Climate Change. In Proceedings of the AGU Fall Meeting 2022, Chicago, IL, USA, 12–16 December 2022; p. NH45C-0472. [Google Scholar]
- Aryal, A.; Tran, T.N.D.; Kumar, B.; Lakshmi, V. Evaluation of Satellite-Derived Precipitation Products for Streamflow Simulation of a Mountainous Himalayan Watershed: A Study of Myagdi Khola in Kali Gandaki Basin, Nepal. Remote Sens. 2023, 15, 4762. [Google Scholar] [CrossRef]
- Aryal, A.; Tran, T.N.D.; Kim, K.Y.; Rajaram, H.; Lakshmi, V. Climate and Land Use/Land Cover Change Impacts on Hydrological Processes in the Mountain Watershed of Gandaki River Basin, Nepal. In Proceedings of the AGU Fall Meeting 2022, Chicago, IL, USA, 12–16 December 2022; p. H52L-0615. [Google Scholar]
- Tran, T.N.D.; Nguyen, B.Q.; Zhang, R.; Aryal, A.; Grodzka-Łukaszewska, M.; Sinicyn, G.; Lakshmi, V. Quantification of Gridded Precipitation Products for the Streamflow Simulation on the Mekong River Basin Using Rainfall Assessment Framework: A Case Study for the Srepok River Subbasin, Central Highland Vietnam. Remote Sens. 2023, 15, 1030. [Google Scholar] [CrossRef]
- Nguyen, B.Q.; Tran, T.N.D.; Grodzka-Łukaszewska, M.; Sinicyn, G.; Lakshmi, V. Assessment of Urbanization-Induced Land-Use Change and Its Impact on Temperature, Evaporation, and Humidity in Central Vietnam. Water 2022, 14, 3367. [Google Scholar] [CrossRef]
- Gernaat, D.E.H.J.; de Boer, H.S.; Daioglou, V.; Yalew, S.G.; Müller, C.; van Vuuren, D.P. Climate Change Impacts on Renewable Energy Supply. Nat. Clim. Chang. 2021, 11, 119–125. [Google Scholar] [CrossRef]
- Nunez, S.; Arets, E.; Alkemade, R.; Verwer, C.; Leemans, R. Assessing the Impacts of Climate Change on Biodiversity: Is below 2 °C Enough? Clim. Chang. 2019, 154, 351–365. [Google Scholar] [CrossRef]
- Konapala, G.; Mishra, A.K.; Wada, Y.; Mann, M.E. Climate Change Will Affect Global Water Availability through Compounding Changes in Seasonal Precipitation and Evaporation. Nat. Commun. 2020, 11, 3044. [Google Scholar] [CrossRef]
- Pokhrel, Y.; Felfelani, F.; Satoh, Y.; Boulange, J.; Burek, P.; Gädeke, A.; Gerten, D.; Gosling, S.N.; Grillakis, M.; Gudmundsson, L.; et al. Global Terrestrial Water Storage and Drought Severity under Climate Change. Nat. Clim. Chang. 2021, 11, 226–233. [Google Scholar] [CrossRef]
- Gädeke, A.; Krysanova, V.; Aryal, A.; Chang, J.; Grillakis, M.; Hanasaki, N.; Koutroulis, A.; Pokhrel, Y.; Satoh, Y.; Schaphoff, S.; et al. Performance Evaluation of Global Hydrological Models in Six Large Pan-Arctic Watersheds. Clim. Chang. 2020, 163, 1329–1351. [Google Scholar] [CrossRef]
- Tabari, H. Climate Change Impact on Flood and Extreme Precipitation Increases with Water Availability. Sci. Rep. 2020, 10, 13768. [Google Scholar] [CrossRef] [PubMed]
- Wang, X.-j.; Zhang, J.-y.; Shahid, S.; Guan, E.-h.; Wu, Y.-x.; Gao, J.; He, R.-m. Adaptation to Climate Change Impacts on Water Demand. Mitig. Adapt. Strat. Glob. Chang. 2016, 21, 81–99. [Google Scholar] [CrossRef]
- Gigli, S.; Agrawala, S. Stocktaking of Progress on Integrating Adaptation to Climate Change into Development Co-Operation Activities Oecd; OECD: Paris, France, 2007. [Google Scholar]
- IPCC. Summary for Policymakers. In Climate Change 2014: Impacts, Adaptation, and Vulnerability. Part A: Global and Sectoral Aspects. Contribution of Working Group II to the Fifth Assessment Report of the Intergovernmental Panel on Climate Change; Field, C.B., Barros, V.R., Dokken, D.J., Mach, K.J., Mastrandrea, M.D., Bilir, T.E., Chatterjee, M., Ebi, K.L., Estrada, Y.O., Genova, R.C., et al., Eds.; Cambridge University Press: Cambridge, UK; New York, NY, USA, 2014. [Google Scholar]
- Oppenheimer, M.; Campos, M.; Warren, R.; Birkmann, J.; Luber, G.; Takahashi, K.; Berkhout, F.; Brklacich, M.; Semenov, S.; Licker, R.; et al. Emergent risks and key vulnerabilities. In Climate Change 2014: Impacts, Adaptation, and Vulnerability. Part A: Global and Sectoral Aspects. Contribution of Working Group II to the Fifth Assessment Report of the Intergovernmental Panel on Climate Change; Field, C.B., Barros, V.R., Dokken, D.J., Mach, K.J., Mastrandrea, M.D., Bilir, T.E., Chatterjee, M., Ebi, K.L., Estrada, Y.O., Genova, R.C., et al., Eds.; Cambridge University Press: Cambridge, UK; New York, NY, USA, 2014; pp. 1039–1099. [Google Scholar]
- Fünfgeld, H.; Mcevoy, D. Framing Climate Change Adaptation in Policy and Practice; Victorian Centre for Climate Change Adaptation Research: Melbourne, Australia, 2011. [Google Scholar]
- Jurgilevich, A.; Räsänen, A.; Groundstroem, F.; Juhola, S. A Systematic Review of Dynamics in Climate Risk and Vulnerability Assessments. Environ. Res. Lett. 2017, 12, 013002. [Google Scholar] [CrossRef]
- Preston, B.L.; Yuen, E.J.; Westaway, R.M. Putting Vulnerability to Climate Change on the Map: A Review of Approaches, Benefits, and Risks. Sustain. Sci. 2011, 6, 177–202. [Google Scholar] [CrossRef]
- GIZ. A Framework for Climate Change Vulnerability Assessments; Deutsche Gesellschaft für Internationale Zusammenarbeit (GIZ) GmbH: New Delhi, India, 2014. [Google Scholar]
- GIZ; EURAC. Risk Supplement to the Vulnerability Sourcebook. Guidance on How to Apply the Vulnerability Sourcebook’s Approach with the New IPCC AR5 Concept of Climate Risk; Deutsche Gesellschaft für Internationale Zusammenarbeit (GIZ) GmbH: Bonn, Germany, 2017. [Google Scholar]
- GIZ; EURAC; UNU-EHS. Climate Risk Assessment for Ecosystem-Based Adaptation—A Guidebook for Planners and Practitioners; Deutsche Gesellschaft für Internationale Zusammenarbeit (GIZ) GmbH: Bonn, Germany, 2018. [Google Scholar]
- Estoque, R.C.; Ooba, M.; Togawa, T.; Yoshioka, A.; Gomi, K.; Nakamura, S.; Tsuji, T.; Hijioka, Y.; Watanabe, M.; Kitahashi, M. Climate Impact Chains for Envisaging Climate Risks, Vulnerabilities, and Adaptation Issues. Reg. Environ. Chang. 2022, 22, 133. [Google Scholar] [CrossRef]
- Menk, L.; Terzi, S.; Zebisch, M.; Rome, E.; Lückerath, D.; Milde, K.; Kienberger, S. Climate Change Impact Chains: A Review of Applications, Challenges, and Opportunities for Climate Risk and Vulnerability Assessments. Weather. Clim. Soc. 2022, 14, 619–636. [Google Scholar] [CrossRef]
- Schneiderbauer, S.; Zebisch, M.; Kass, S.; Pedoth, L. Assessment of Vulnerability to Natural Hazards and Climate Change in Mountain Environments–Examples from the Alps. In Measuring Vulnerability; Birkmann, J., Ed.; United University Press: Tokyo, Japan, 2013; pp. 349–380. [Google Scholar]
- Schneiderbauer, S.; Baunach, D.; Pedoth, L.; Renner, K.; Fritzsche, K.; Bollin, C.; Pregnolato, M.; Zebisch, M.; Liersch, S.; López, M.d.R.R.; et al. Spatial-Explicit Climate Change Vulnerability Assessments Based on Impact Chains. Findings from a Case Study in Burundi. Sustainability 2020, 12, 6354. [Google Scholar] [CrossRef]
- Zebisch, M.; Terzi, S.; Pittore, M.; Renner, K.; Schneiderbauer, S. Climate Impact Chains—A Conceptual Modelling Approach for Climate Risk Assessment in the Context of Adaptation Planning. In Climate Adaptation Modelling; Springer International Publishing: Cham, Switzerland, 2022; pp. 217–224. [Google Scholar] [CrossRef]
- Zebisch, M.; Schneiderbauer, S.; Fritzsche, K.; Bubeck, P.; Kienberger, S.; Kahlenborn, W.; Schwan, S.; Below, T. The Vulnerability Sourcebook and Climate Impact Chains—A Standardised Framework for a Climate Vulnerability and Risk Assessment. Int. J. Clim. Chang. Strat. Manag. 2021, 13, 35–59. [Google Scholar] [CrossRef]
- Heltberg, R.; Bonch-Osmolovskiy, M. Mapping Vulnerability to Climate Change; World Bank Policy Research Working Paper No. 5554. 2011. Available online: https://ssrn.com/abstract=1754347 (accessed on 10 October 2023).
- Schneiderbauer, S.; Zebisch, M.; Renner, K.; Brossmann, M.; Ederer, W.; Schwan, S.; Below, T.; Bertram, M. The Vulnerability Sourcebook. Standardised Vulnerability and Risk Assessments to Support Adaptation Planning and Evaluation; Climate Risk Community of Practice (CoP) Launch Event. 2018. Available online: https://bia.unibz.it/esploro/outputs/conferencePoster/The-Vulnerability-Sourcebook-Standardised-vulnerability-and/991005773346801241#file-0 (accessed on 10 October 2023).
- Füssel, H.M.; Klein, R.J.T. Climate Change Vulnerability Assessments: An Evolution of Conceptual Thinking. Clim. Chang. 2006, 75, 301–329. [Google Scholar] [CrossRef]
- IPCC. Climate Change 2007: Impacts, Adaptation and Vulnerability. Contribution of Working Group II to the Fourth Assessment Report of the Intergovernmental Panel on Climate Change; Parry, M.L., Canziani, O.F., Palutikof, J.P., van Der Linden, P.J., Hanson, C.E., Eds.; Cambridge University Press: Cambridge, UK, 2007. [Google Scholar]
- Cardona, O.-D.; van Aalst, M.K.; Birkmann, J.; Fordham, M.; McGregor, G.; Perez, R.; Pulwarty, R.S.; Lisa Schipper, E.F.; Tan Sinh, B.; Décamps, H.; et al. Determinants of Risk: Exposure and Vulnerability. In Managing the Risks of Extreme Events and Disasters to Advance Climate Change Adaptation, A Special Report of Working Groups I and II of the Intergovernmental Panel on Climate Change (IPCC); Field, C.B., Barros, V., Stocker, T.F., Qin, D., Dokken, D.J., Ebi, K.L., Mastrandrea, M.D., Mach, K.J., Plattner, G.-K., Allen, S.K., et al., Eds.; Cambridge University Press: Cambridge, UK; New York, NY, USA, 2012; pp. 65–108. [Google Scholar]
- Estoque, R.C.; Ooba, M.; Seposo, X.T.; Togawa, T.; Hijioka, Y.; Takahashi, K.; Nakamura, S. Heat Health Risk Assessment in Philippine Cities Using Remotely Sensed Data and Social-Ecological Indicators. Nat. Commun. 2020, 11, 1581. [Google Scholar] [CrossRef]
- Schilling, J.; Hertig, E.; Tramblay, Y.; Scheffran, J. Climate Change Vulnerability, Water Resources and Social Implications in North Africa. Reg. Environ. Chang. 2020, 20, 15. [Google Scholar] [CrossRef]
- Zhang, M.; Liu, Z.; Van Dijk, M.P. Measuring Urban Vulnerability to Climate Change Using an Integrated Approach, Assessing Climate Risks in Beijing. PeerJ 2019, 2019, e7018. [Google Scholar] [CrossRef] [PubMed]
- Leis, J.L.; Kienberger, S. Climate Risk and Vulnerability Assessment of Floods in Austria: Mapping Homogenous Regions, Hotspots and Typologies. Sustainability 2020, 12, 6458. [Google Scholar] [CrossRef]
- Leal Filho, W.; Modesto, F.; Nagy, G.J.; Saroar, M.; YannickToamukum, N.; Ha’apio, M. Fostering Coastal Resilience to Climate Change Vulnerability in Bangladesh, Brazil, Cameroon and Uruguay: A Cross-Country Comparison. Mitig. Adapt. Strat. Glob. Chang. 2018, 23, 579–602. [Google Scholar] [CrossRef]
- Aryal, J.P.; Sapkota, T.B.; Rahut, D.B.; Krupnik, T.J.; Shahrin, S.; Jat, M.L.; Stirling, C.M. Major Climate Risks and Adaptation Strategies of Smallholder Farmers in Coastal Bangladesh. Environ. Manag. 2020, 66, 105–120. [Google Scholar] [CrossRef]
- Gemeda, D.O.; Korecha, D.; Garedew, W. Climate Change Perception and Vulnerability Assessment of the Farming Communities in the Southwest Parts of Ethiopia. Climate 2023, 11, 183. [Google Scholar] [CrossRef]
- National Statistics Office of Georgia. Available online: https://www.geostat.ge/en (accessed on 15 June 2022).
- Tielidze, L.G.; Wheate, R.D. The Greater Caucasus Glacier Inventory (Russia, Georgia and Azerbaijan). Cryosphere 2018, 12, 81–94. [Google Scholar] [CrossRef]
- Notarnicola, C. Hotspots of Snow Cover Changes in Global Mountain Regions over 2000–2018. Remote Sens. Environ. 2020, 243, 111781. [Google Scholar] [CrossRef]
- Group, W.B.; Bank, A.D. Climate Risk Country Profile: Georgia; World Bank Publications, The World Bank Group: Washington, DC, USA, 2021. [Google Scholar]
- AQUASTAT|Land; Water|Food and Agriculture Organization of the United Nations|Land; Water|Food and Agriculture Organization of the United Nations. Available online: https://www.fao.org/land-water/databases-and-software/aquastat/en/ (accessed on 10 June 2022).
- OpenTopography-NASADEM Global Digital Elevation Model. Available online: https://portal.opentopography.org/datasetMetadata?otCollectionID=OT.032021.4326.2 (accessed on 11 June 2022).
- Lehner, B.; Verdin, K.; Jarvis, A. New Global Hydrography Derived from Spaceborne Elevation Data. Eos Trans. Am. Geophys. Union 2008, 89, 93–94. [Google Scholar] [CrossRef]
- Buchhorn, M.; Lesiv, M.; Tsendbazar, N.E.; Herold, M.; Bertels, L.; Smets, B. Copernicus Global Land Cover Layers—Collection 2. Remote Sens. 2020, 12, 108. [Google Scholar] [CrossRef]
- Land Cover|Copernicus Global Land Service. Available online: https://land.copernicus.eu/global/products/lc (accessed on 12 June 2022).
- GERICS. Climate-Fact-Sheets, Updated Version 2015; Georgia; Helmholtz-Zentrum Geesthacht Zentrum für Material-und Küstenforschung GmbH, GERICS: Hamburg, Germany, 2015. [Google Scholar]
- Hinkel, J. “Indicators of Vulnerability and Adaptive Capacity”: Towards a Clarification of the Science-Policy Interface. Glob. Environ. Chang. 2011, 21, 198–208. [Google Scholar] [CrossRef]
- Thibeault, J.M.; Seth, A. Changing Climate Extremes in the Northeast United States: Observations and Projections from CMIP5. Clim. Chang. 2014, 127, 273–287. [Google Scholar] [CrossRef]
- Cannon, A.J. Selecting GCM Scenarios That Span the Range of Changes in a Multimodel Ensemble: Application to CMIP5 Climate Extremes Indices. J. Clim. 2015, 28, 1260–1267. [Google Scholar] [CrossRef]
- Lee, J.-H. Analysis of Water Resources and Water Conflicts in Korea Using Aqueduct 3.0 and Water Conflict Chronology. In Proceedings of the Korea Water Resources Association Conference, Daegu, Republic of Korea, 6 October 2023; p. 395. [Google Scholar]
- Chen, P.Y.; Fedosejevs, G.; Tiscareño-López, M.; Arnold, J.G. Assessment of MODIS-EVI, MODIS-NDVI and VEGETATION-NDVI Composite Data Using Agricultural Measurements: An Example at Corn Fields in Western Mexico. Environ. Monit. Assess. 2006, 119, 69–82. [Google Scholar] [CrossRef] [PubMed]
- Eckert, S.; Hüsler, F.; Liniger, H.; Hodel, E. Trend Analysis of MODIS NDVI Time Series for Detecting Land Degradation and Regeneration in Mongolia. J. Arid Environ. 2015, 113, 16–28. [Google Scholar] [CrossRef]
- Mendez, C.; Santos-Marquez, F. Economic and Social Disparities across Subnational Regions of South America: A Spatial Convergence Approach. Comp. Econ. Stud. 2022, 64, 582–605. [Google Scholar] [CrossRef]
- Hofste, R.W.; Kuzma, S.; Walker, S.; Sutanudjaja, E.H.; Bierkens, M.F.P.; Kuijper, M.J.M.; Sanchez, M.F.; Van Beek, R.; Wada, Y.; Rodríguez, S.G.; et al. Aqueduct 3.0: Updated Decision-Relevant Global Water Risk Indicators. 2018. Available online: https://www.wri.org/research/aqueduct-30-updated-decision-relevant-global-water-risk-indicators (accessed on 25 June 2022).
- Asokan, S.M.; Rogberg, P.; Bring, A.; Jarsjö, J.; Destouni, G. Climate Model Performance and Change Projection for Freshwater Fluxes: Comparison for Irrigated Areas in Central and South Asia. J. Hydrol. Reg. Stud. 2016, 5, 48–65. [Google Scholar] [CrossRef]
- Ta, Z.; Yu, Y.; Sun, L.; Chen, X.; Mu, G.; Yu, R. Assessment of Precipitation Simulations in Central Asia by CMIP5 Climate Models. Water 2018, 10, 1516. [Google Scholar] [CrossRef]
- Yu, X.; Zhao, Y.; Ma, X.; Yao, J.; Li, H. Projected Changes in the Annual Cycle of Precipitation over Central Asia by CMIP5 Models. Int. J. Climatol. 2018, 38, 5589–5604. [Google Scholar] [CrossRef]
- Environment Canada-Climate Change-CCCma: Climate Model Data-ETCCDI Extremes Indicies Archive. Available online: https://climate-modelling.canada.ca/climatemodeldata/climdex/ (accessed on 15 June 2022).
- Sillmann, J.; Kharin, V.V.; Zwiers, F.W.; Zhang, X.; Bronaugh, D. Climate Extremes Indices in the CMIP5 Multimodel Ensemble: Part 2. Future Climate Projections. J. Geophys. Res. Atmos. 2013, 118, 2473–2493. [Google Scholar] [CrossRef]
- Sillmann, J.; Kharin, V.V.; Zhang, X.; Zwiers, F.W.; Bronaugh, D. Climate Extremes Indices in the CMIP5 Multimodel Ensemble: Part 1. Model Evaluation in the Present Climate. J. Geophys. Res. Atmos. 2013, 118, 1716–1733. [Google Scholar] [CrossRef]
- Abu Arra, A.; Şişman, E. Characteristics of Hydrological and Meteorological Drought Based on Intensity-Duration-Frequency (IDF) Curves. Water 2023, 15, 3142. [Google Scholar] [CrossRef]
- Aqueduct Global Maps 3.0 Data|World Resources Institute. Available online: https://www.wri.org/data/aqueduct-global-maps-30-data (accessed on 25 June 2022).
- Didan, K. MOD13A1 MODIS/Terra Vegetation Indices 16-Day L3 Global 500m SIN Grid V006 [Data Set]. NASA EOSDIS Land Processes Distributed Active Archive Center. NASA Eosdis Land Process. 2015, 10, 415. [Google Scholar] [CrossRef]
- Subnational Human Development-Global Data Lab. Available online: https://globaldatalab.org/shdi/ (accessed on 10 July 2022).
- Smits, J.; Permanyer, I. The Subnational Human Development Database. Sci. Data 2019, 6, 190038. [Google Scholar] [CrossRef]
- Karger, D.N.; Conrad, O.; Böhner, J.; Kawohl, T.; Kreft, H.; Soria-Auza, R.W.; Zimmermann, N.E.; Linder, H.P.; Kessler, M. Climatologies at High Resolution for the Earth’s Land Surface Areas. Sci. Data 2017, 4, 170122. [Google Scholar] [CrossRef]
- Dryad|Data-Climatologies at High Resolution for the Earth’s Land Surface Areas. Available online: https://datadryad.org/stash/dataset/doi:10.5061/dryad.kd1d4 (accessed on 20 July 2022).
- Varazanashvili, O.; Tsereteli, N.; Amiranashvili, A.; Tsereteli, E.; Elizbarashvili, E.; Dolidze, J.; Qaldani, L.; Saluqvadze, M.; Adamia, S.; Arevadze, N.; et al. Vulnerability, Hazards and Multiple Risk Assessment for Georgia. Nat. Hazards 2012, 64, 2021–2056. [Google Scholar] [CrossRef]
- Davitashvili, T. Natural Disasters and Surface and Subsurface Water Pollution Risk Assessment for Some Regions of Georgia; Springer: Dordrecht, The Netherlands, 2009; pp. 83–89. [Google Scholar] [CrossRef]
- Gaprindashvili, G.; Van Westen, C.J. Generation of a National Landslide Hazard and Risk Map for the Country of Georgia. Nat. Hazards 2016, 80, 69–101. [Google Scholar] [CrossRef]
Figure 2.
The methodology applied for the CRVA study. Twelve classes from −6 to 6 measure risk exposure, sensitivity, and vulnerability.
Figure 2.
The methodology applied for the CRVA study. Twelve classes from −6 to 6 measure risk exposure, sensitivity, and vulnerability.
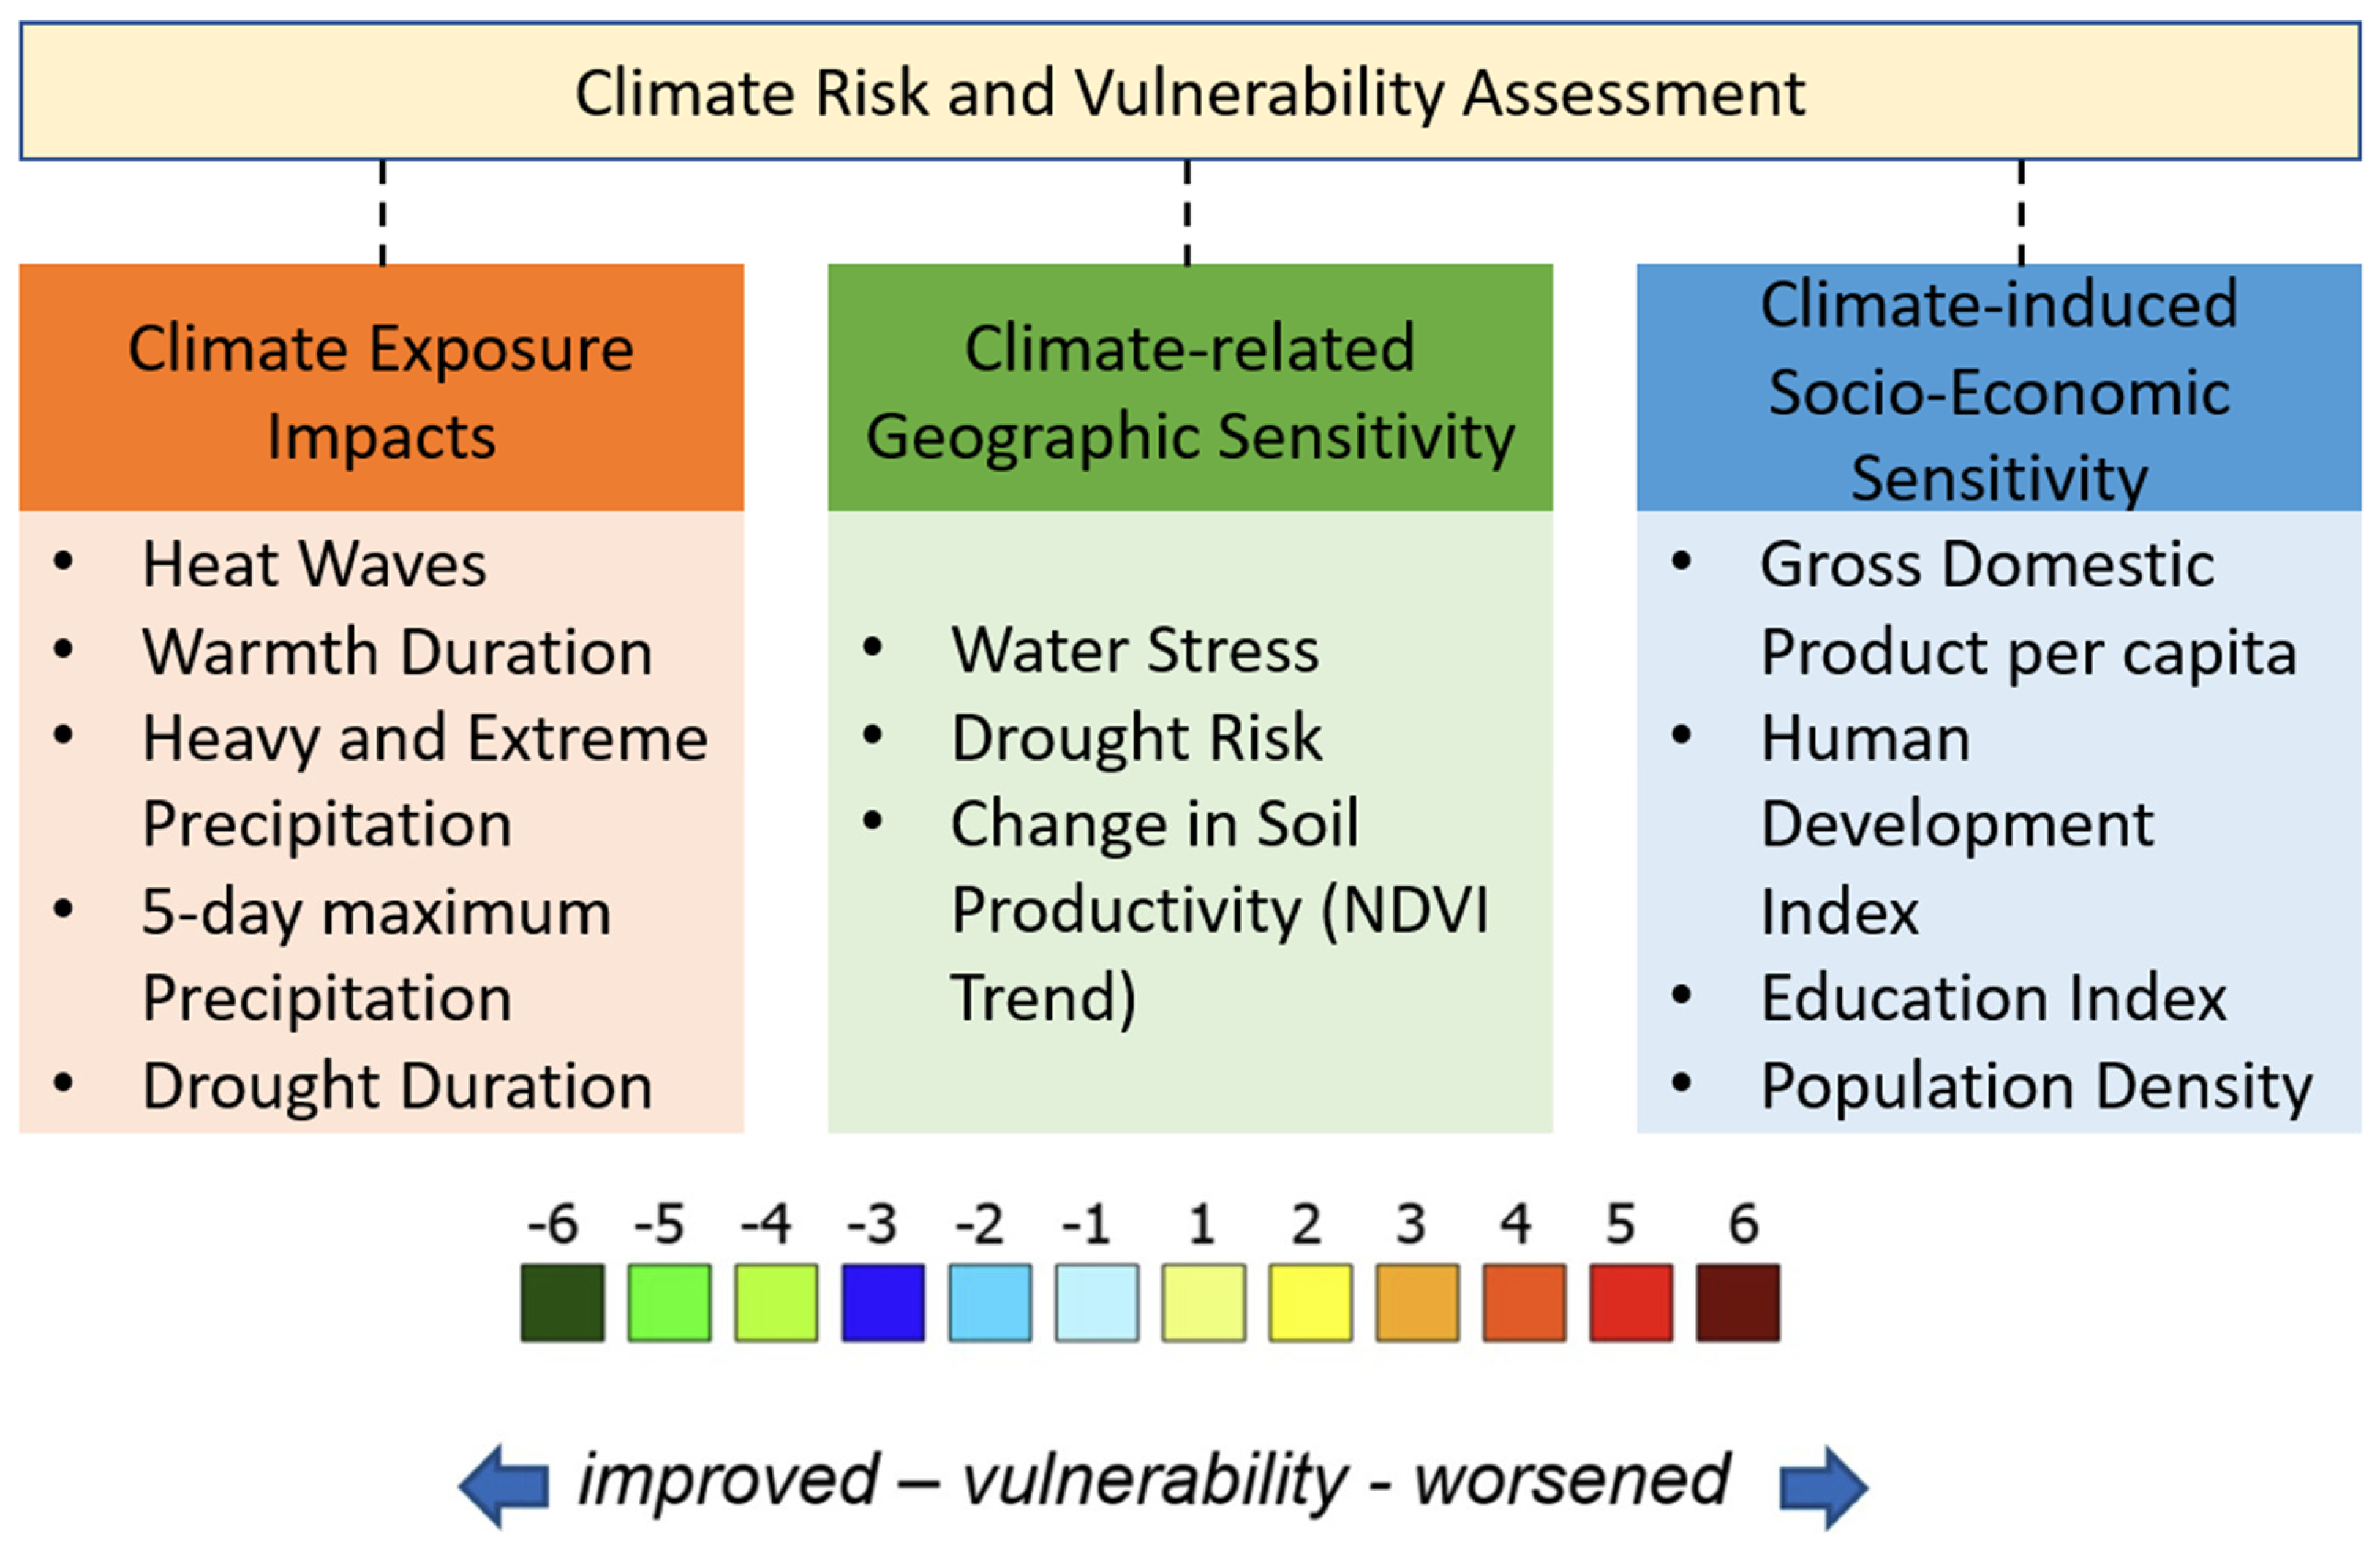
Figure 3.
Projected changes in (a) TXx, (b) TX90p, (c) PRCPTOT, (d) R95pTOT, (e) R99pTOT, (f) Rx5day, and (g) CDD by 2050 against the baseline of the 1961–1990 period. Projections are based on CMIP5 Global Circulation Models (ETCCDI extreme indices) for the RCP 4.5 scenario.
Figure 3.
Projected changes in (a) TXx, (b) TX90p, (c) PRCPTOT, (d) R95pTOT, (e) R99pTOT, (f) Rx5day, and (g) CDD by 2050 against the baseline of the 1961–1990 period. Projections are based on CMIP5 Global Circulation Models (ETCCDI extreme indices) for the RCP 4.5 scenario.

Figure 4.
Projected changes in (a) TXx, (b) TX90p, (c) PRCPTOT, (d) R95pTOT, (e) R99pTOT, (f) Rx5day, and (g) CDD by 2050 against the baseline of the 1961–1990 period. Projections are based on CMIP5 Global Circulation Models (ETCCDI extreme indices) for the RCP 8.5 scenario.
Figure 4.
Projected changes in (a) TXx, (b) TX90p, (c) PRCPTOT, (d) R95pTOT, (e) R99pTOT, (f) Rx5day, and (g) CDD by 2050 against the baseline of the 1961–1990 period. Projections are based on CMIP5 Global Circulation Models (ETCCDI extreme indices) for the RCP 8.5 scenario.
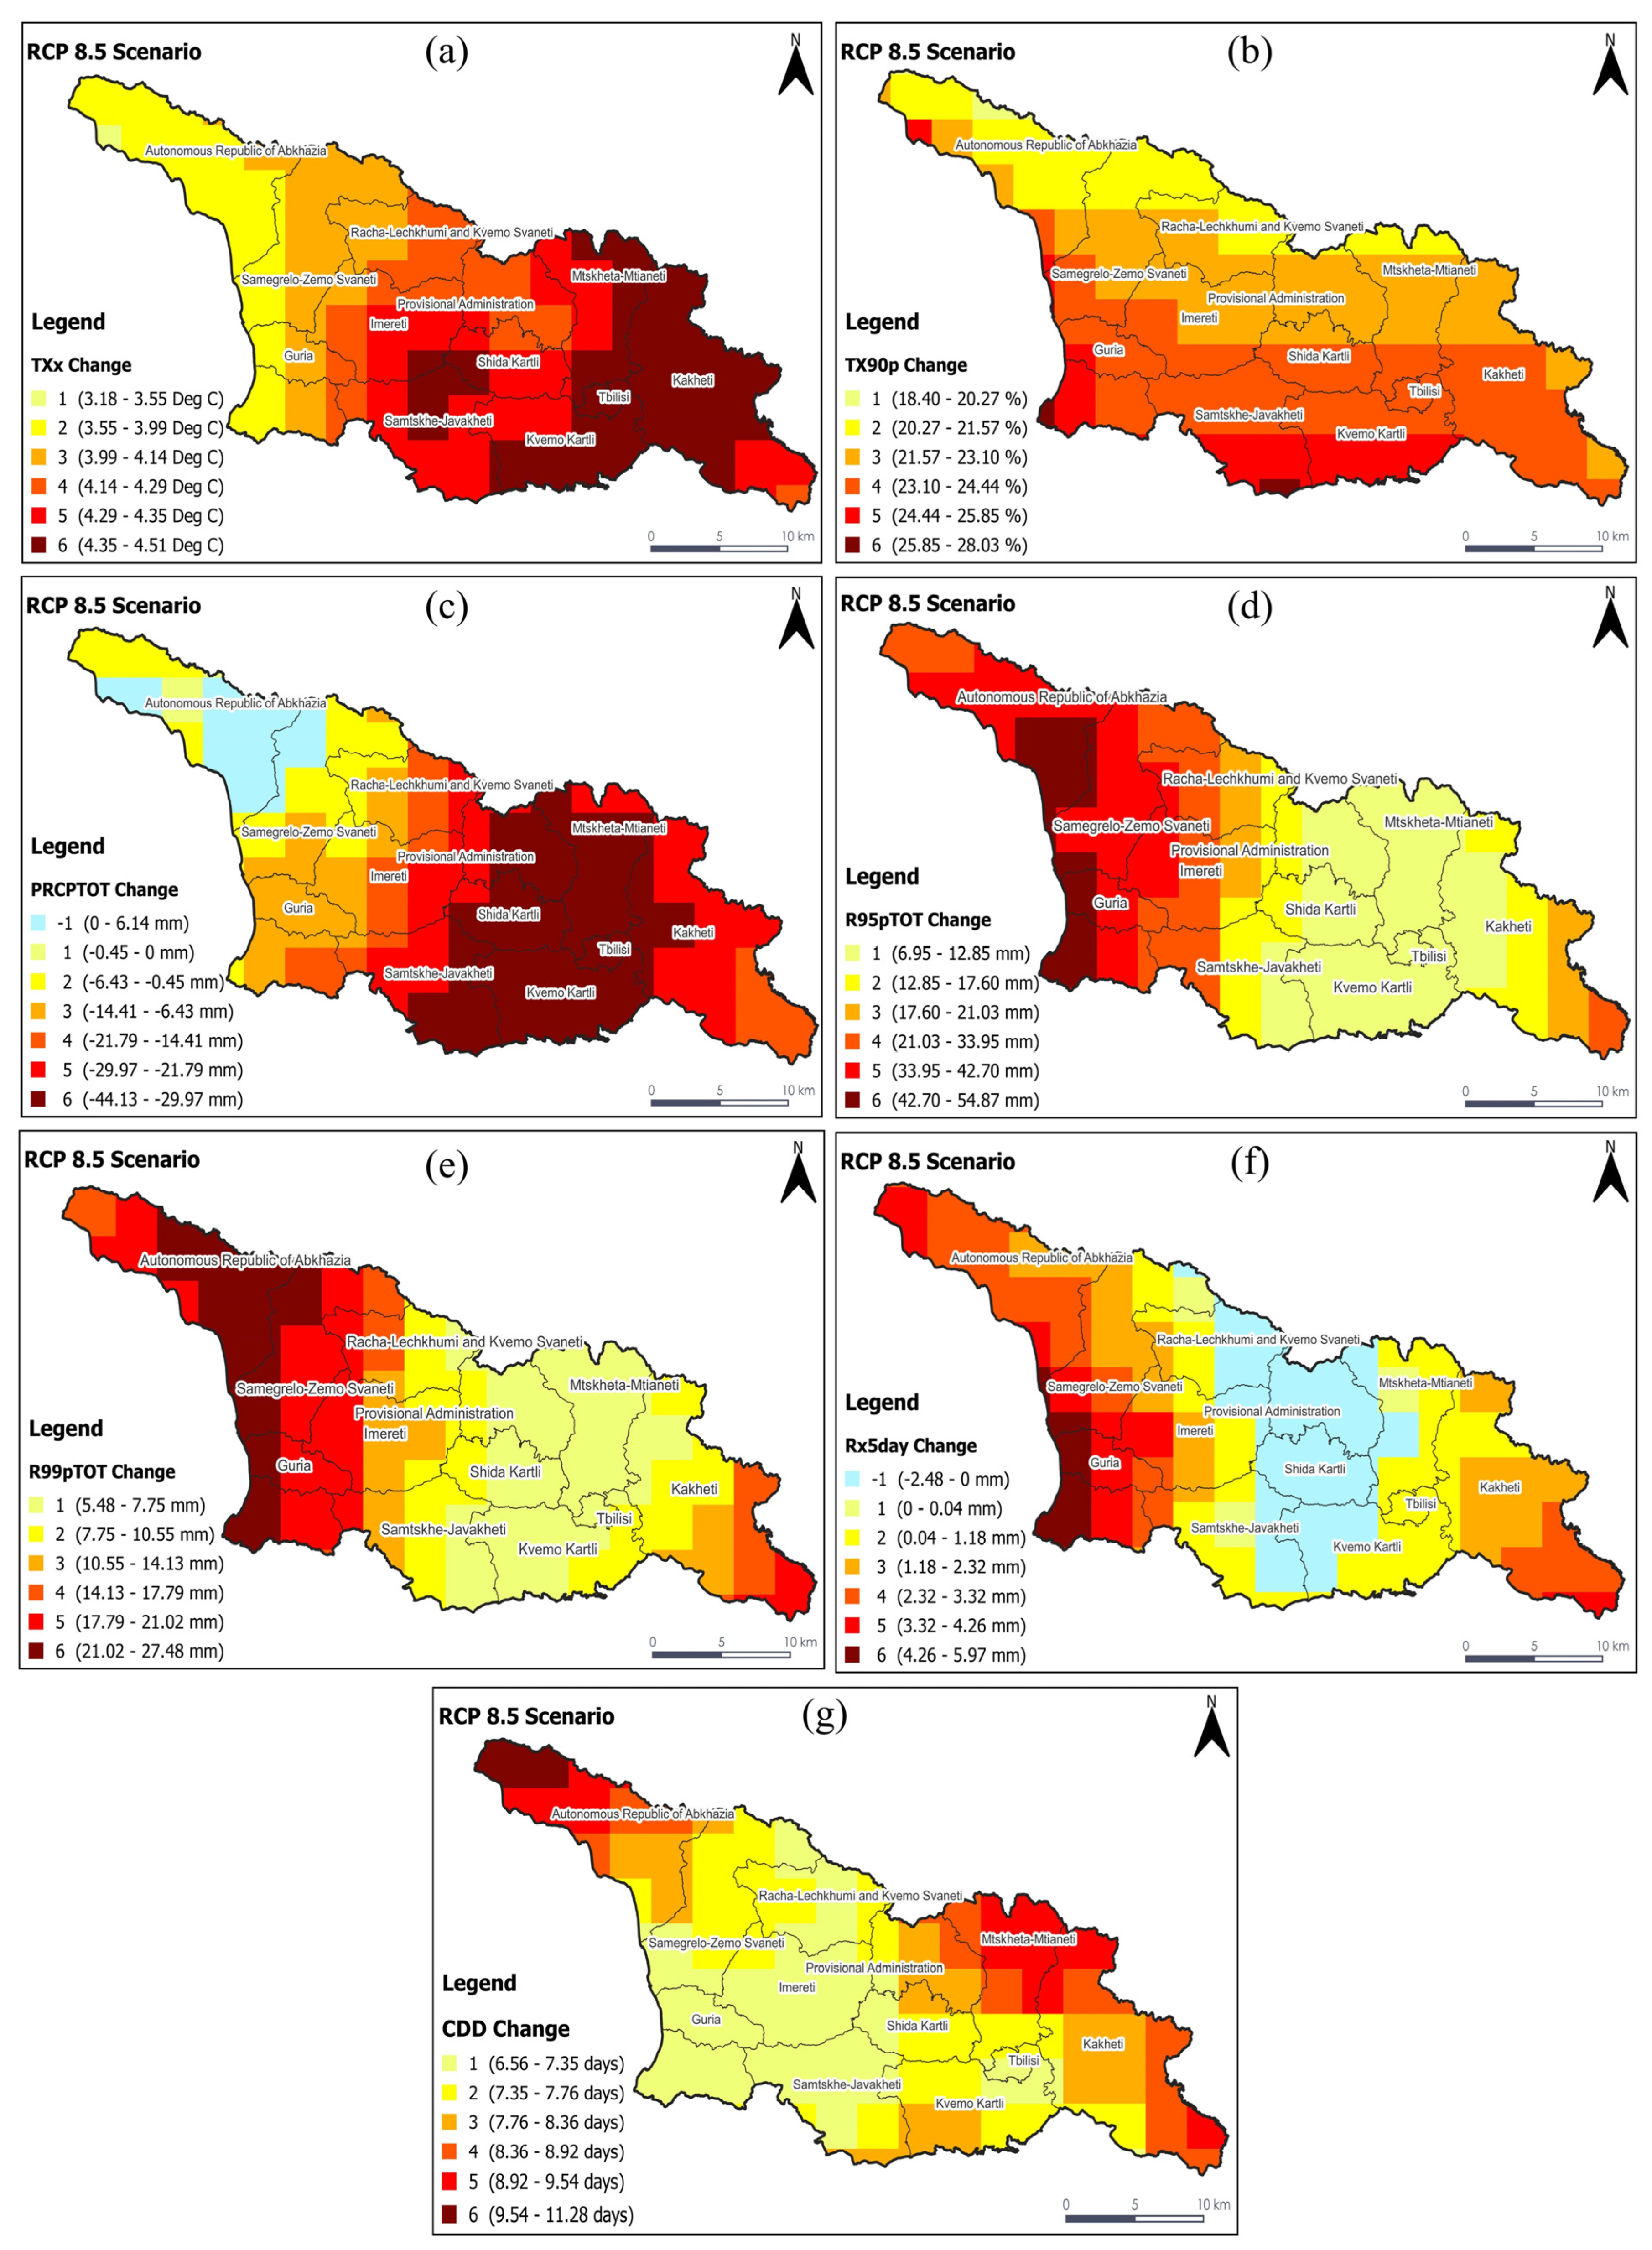
Figure 5.
(a,b) Projected change in total spring (March–May) precipitation by 2050 against the baseline (1979–2013) under RCP 4.5 and RCP 8.5 scenarios. (c,d) Projected change in total summer (June–August) precipitation by 2050 against the baseline (1979–2013) under RCP 4.5 and RCP 8.5 scenarios. The data were taken from the CHELSA Version 1.2 [81,82].
Figure 6.
Projected change in riverine flood risk by 2050 with a return period of 100 years in comparison with 1980 under RCP 4.5 and RCP 8.5 scenarios. Data are from Aqueduct 3.0, World Resources Institute [77].
Figure 6.
Projected change in riverine flood risk by 2050 with a return period of 100 years in comparison with 1980 under RCP 4.5 and RCP 8.5 scenarios. Data are from Aqueduct 3.0, World Resources Institute [77].

Figure 7.
Total climatic exposure combines the heat, total precipitation, share of heavy precipitation, and drought length by 2050. The value of 1 is the lowest exposure, and 6 is the highest exposure to climate risks.
Figure 7.
Total climatic exposure combines the heat, total precipitation, share of heavy precipitation, and drought length by 2050. The value of 1 is the lowest exposure, and 6 is the highest exposure to climate risks.
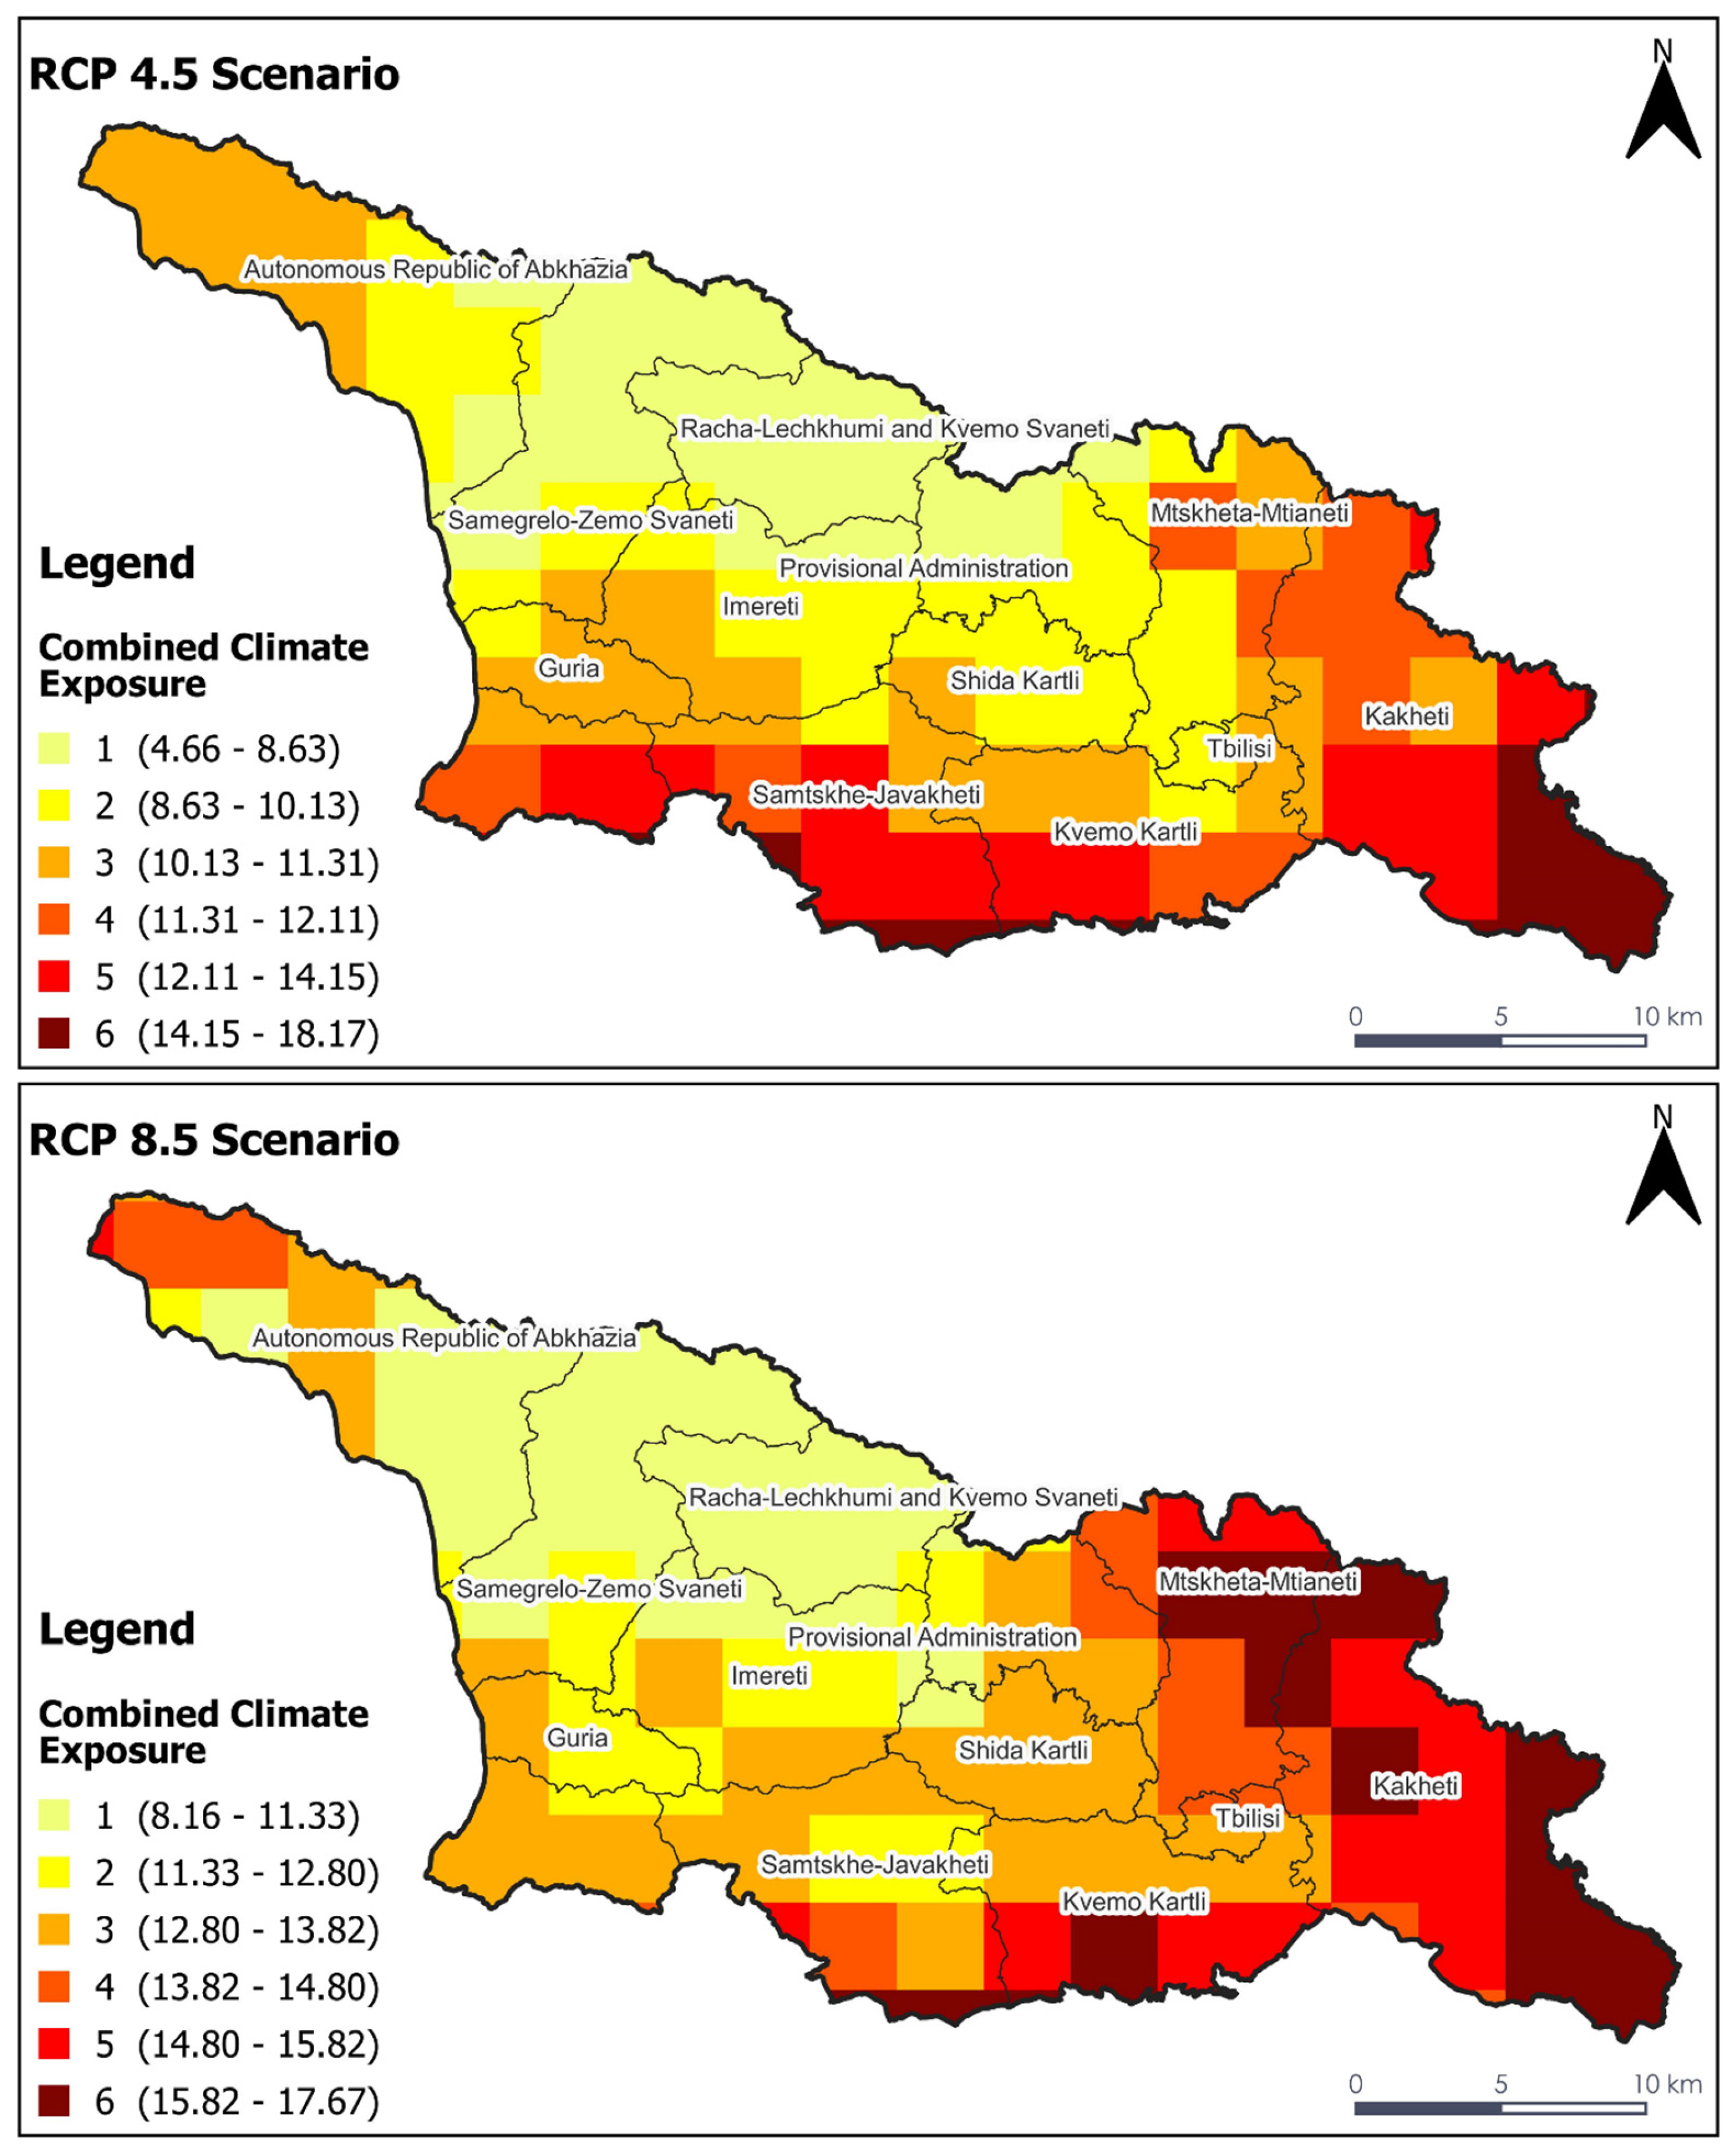
Figure 8.
(a) Water stress. (b) Drought risk. (c) NDVI trend as an indicator for change in soil productivity from 2000 to 2020 in Georgia.
Figure 8.
(a) Water stress. (b) Drought risk. (c) NDVI trend as an indicator for change in soil productivity from 2000 to 2020 in Georgia.

Figure 9.
Map of combined geographic sensitivity to climate change in Georgia. The value of −4 is the lowest sensitivity, and 3 is the highest sensitivity.
Figure 9.
Map of combined geographic sensitivity to climate change in Georgia. The value of −4 is the lowest sensitivity, and 3 is the highest sensitivity.
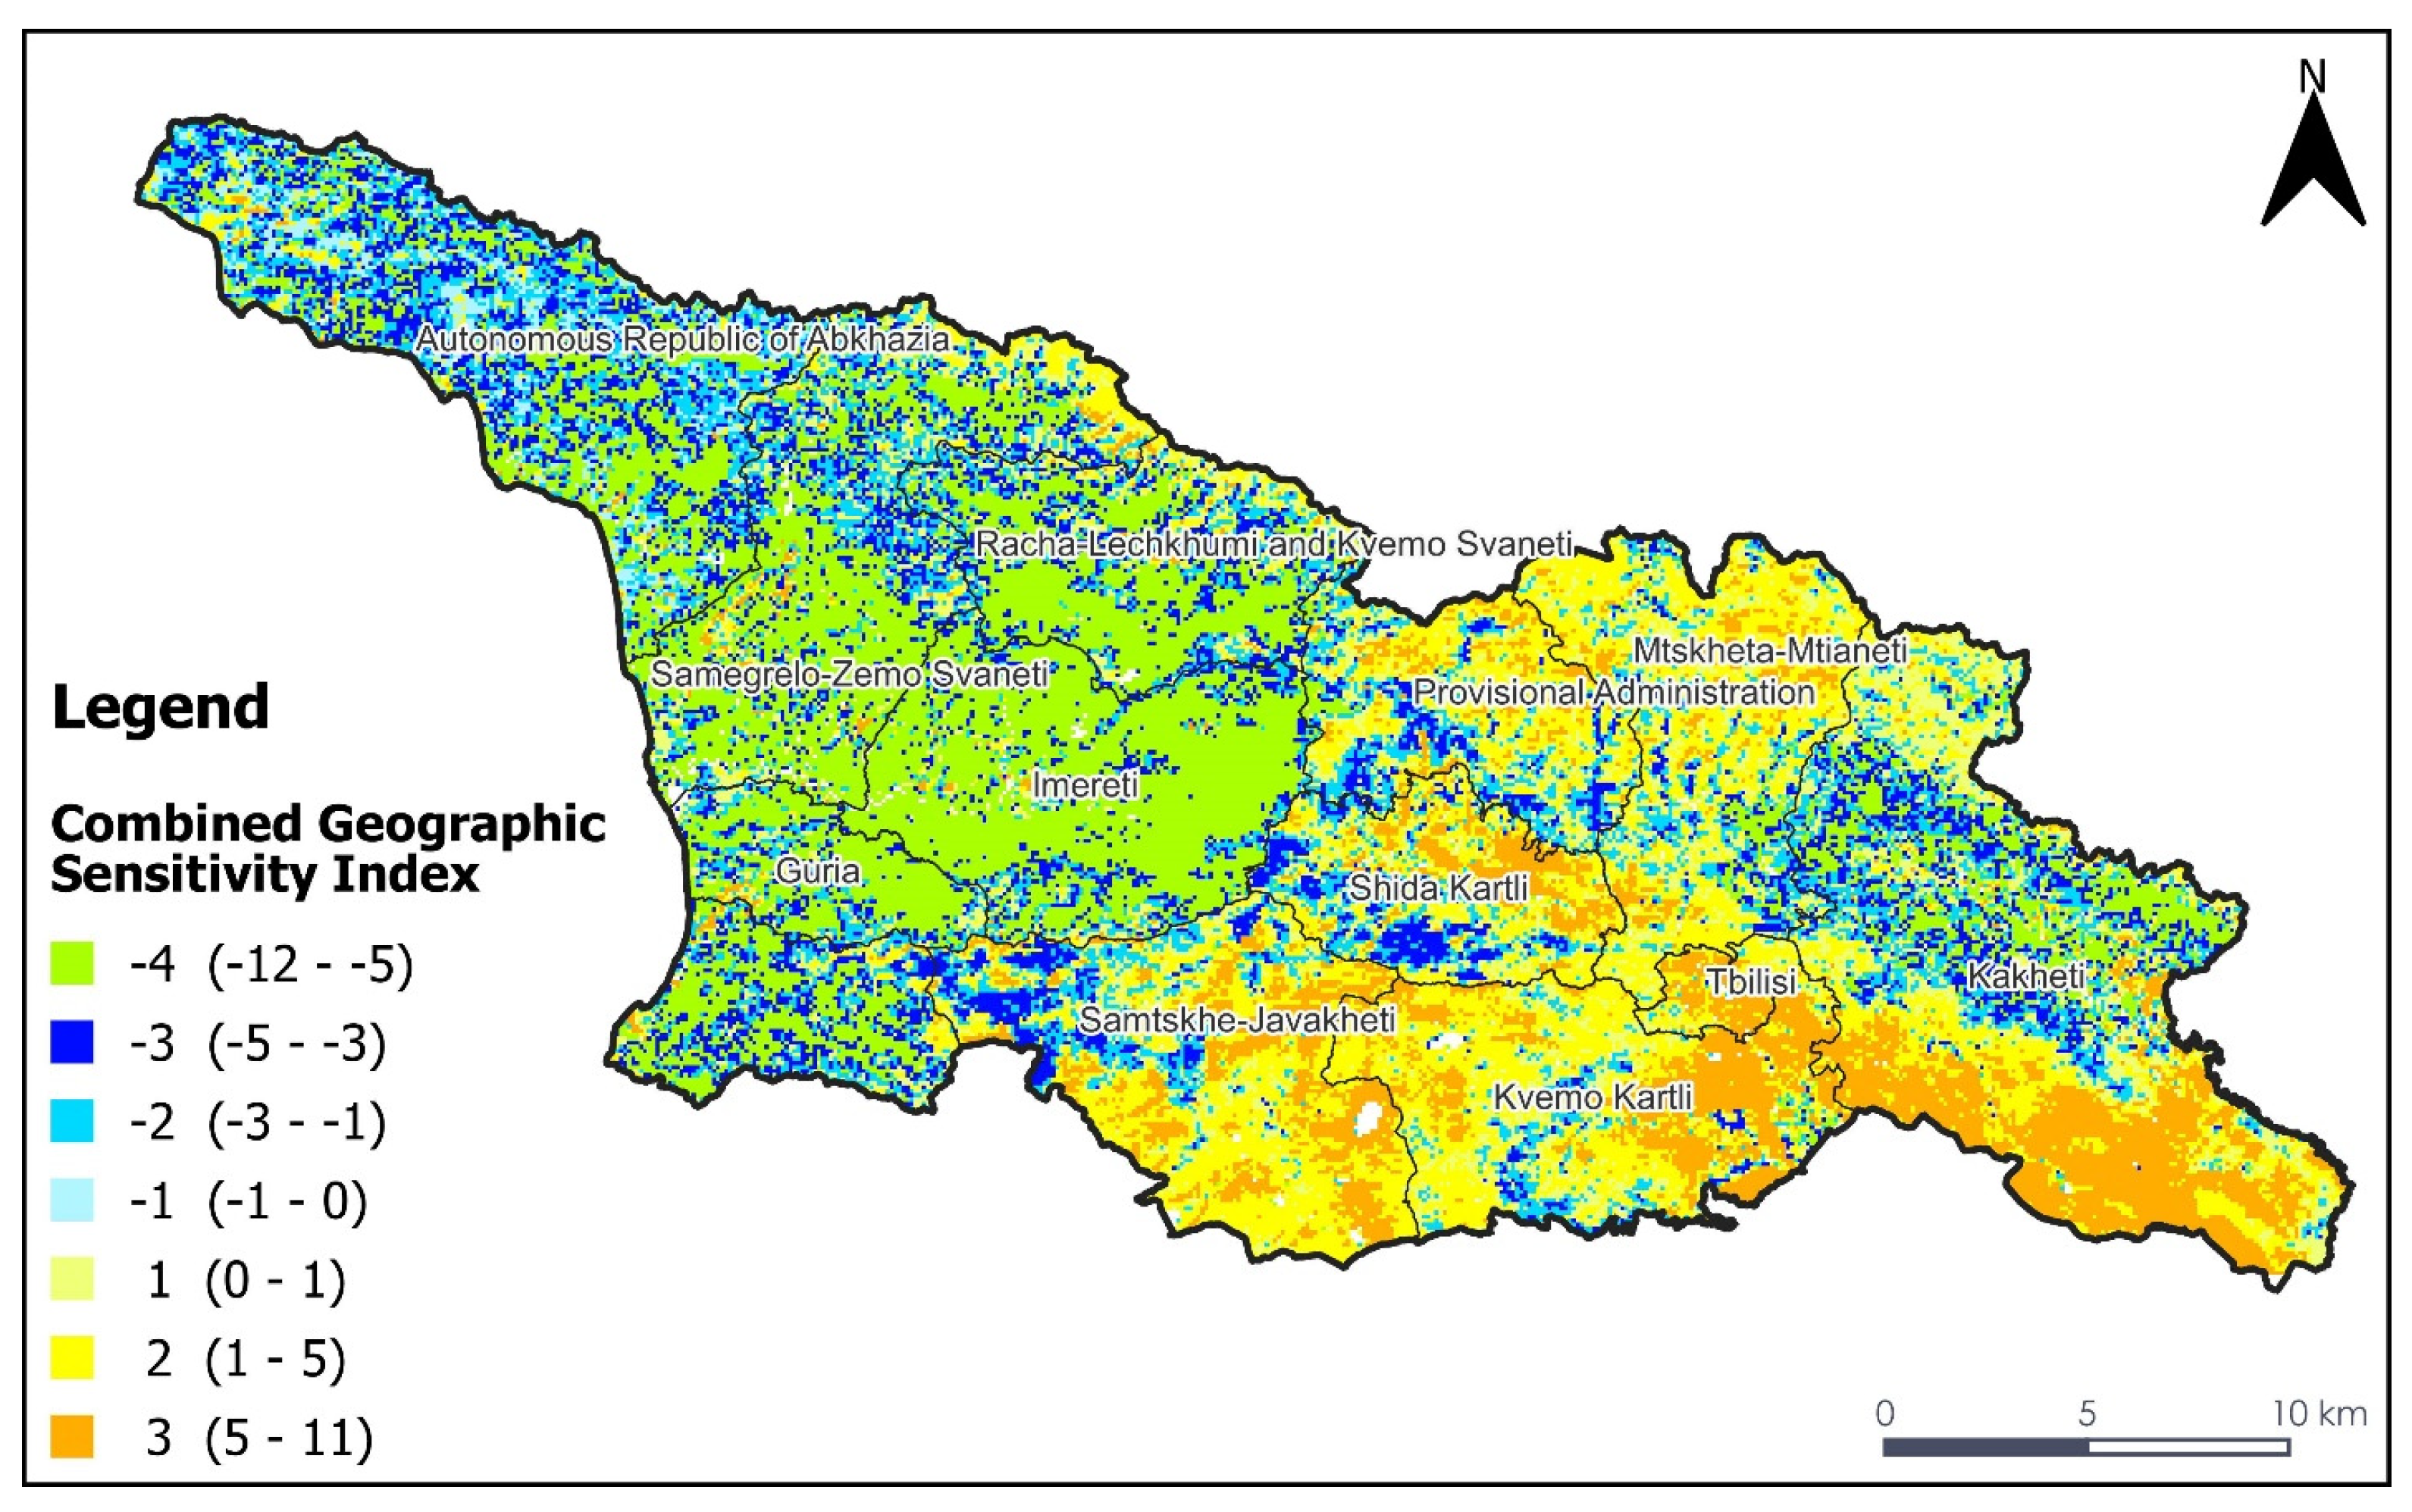
Figure 10.
(a) GDP per capita in USD; (b) HDI; (c) EI; (d) population density of Georgia.
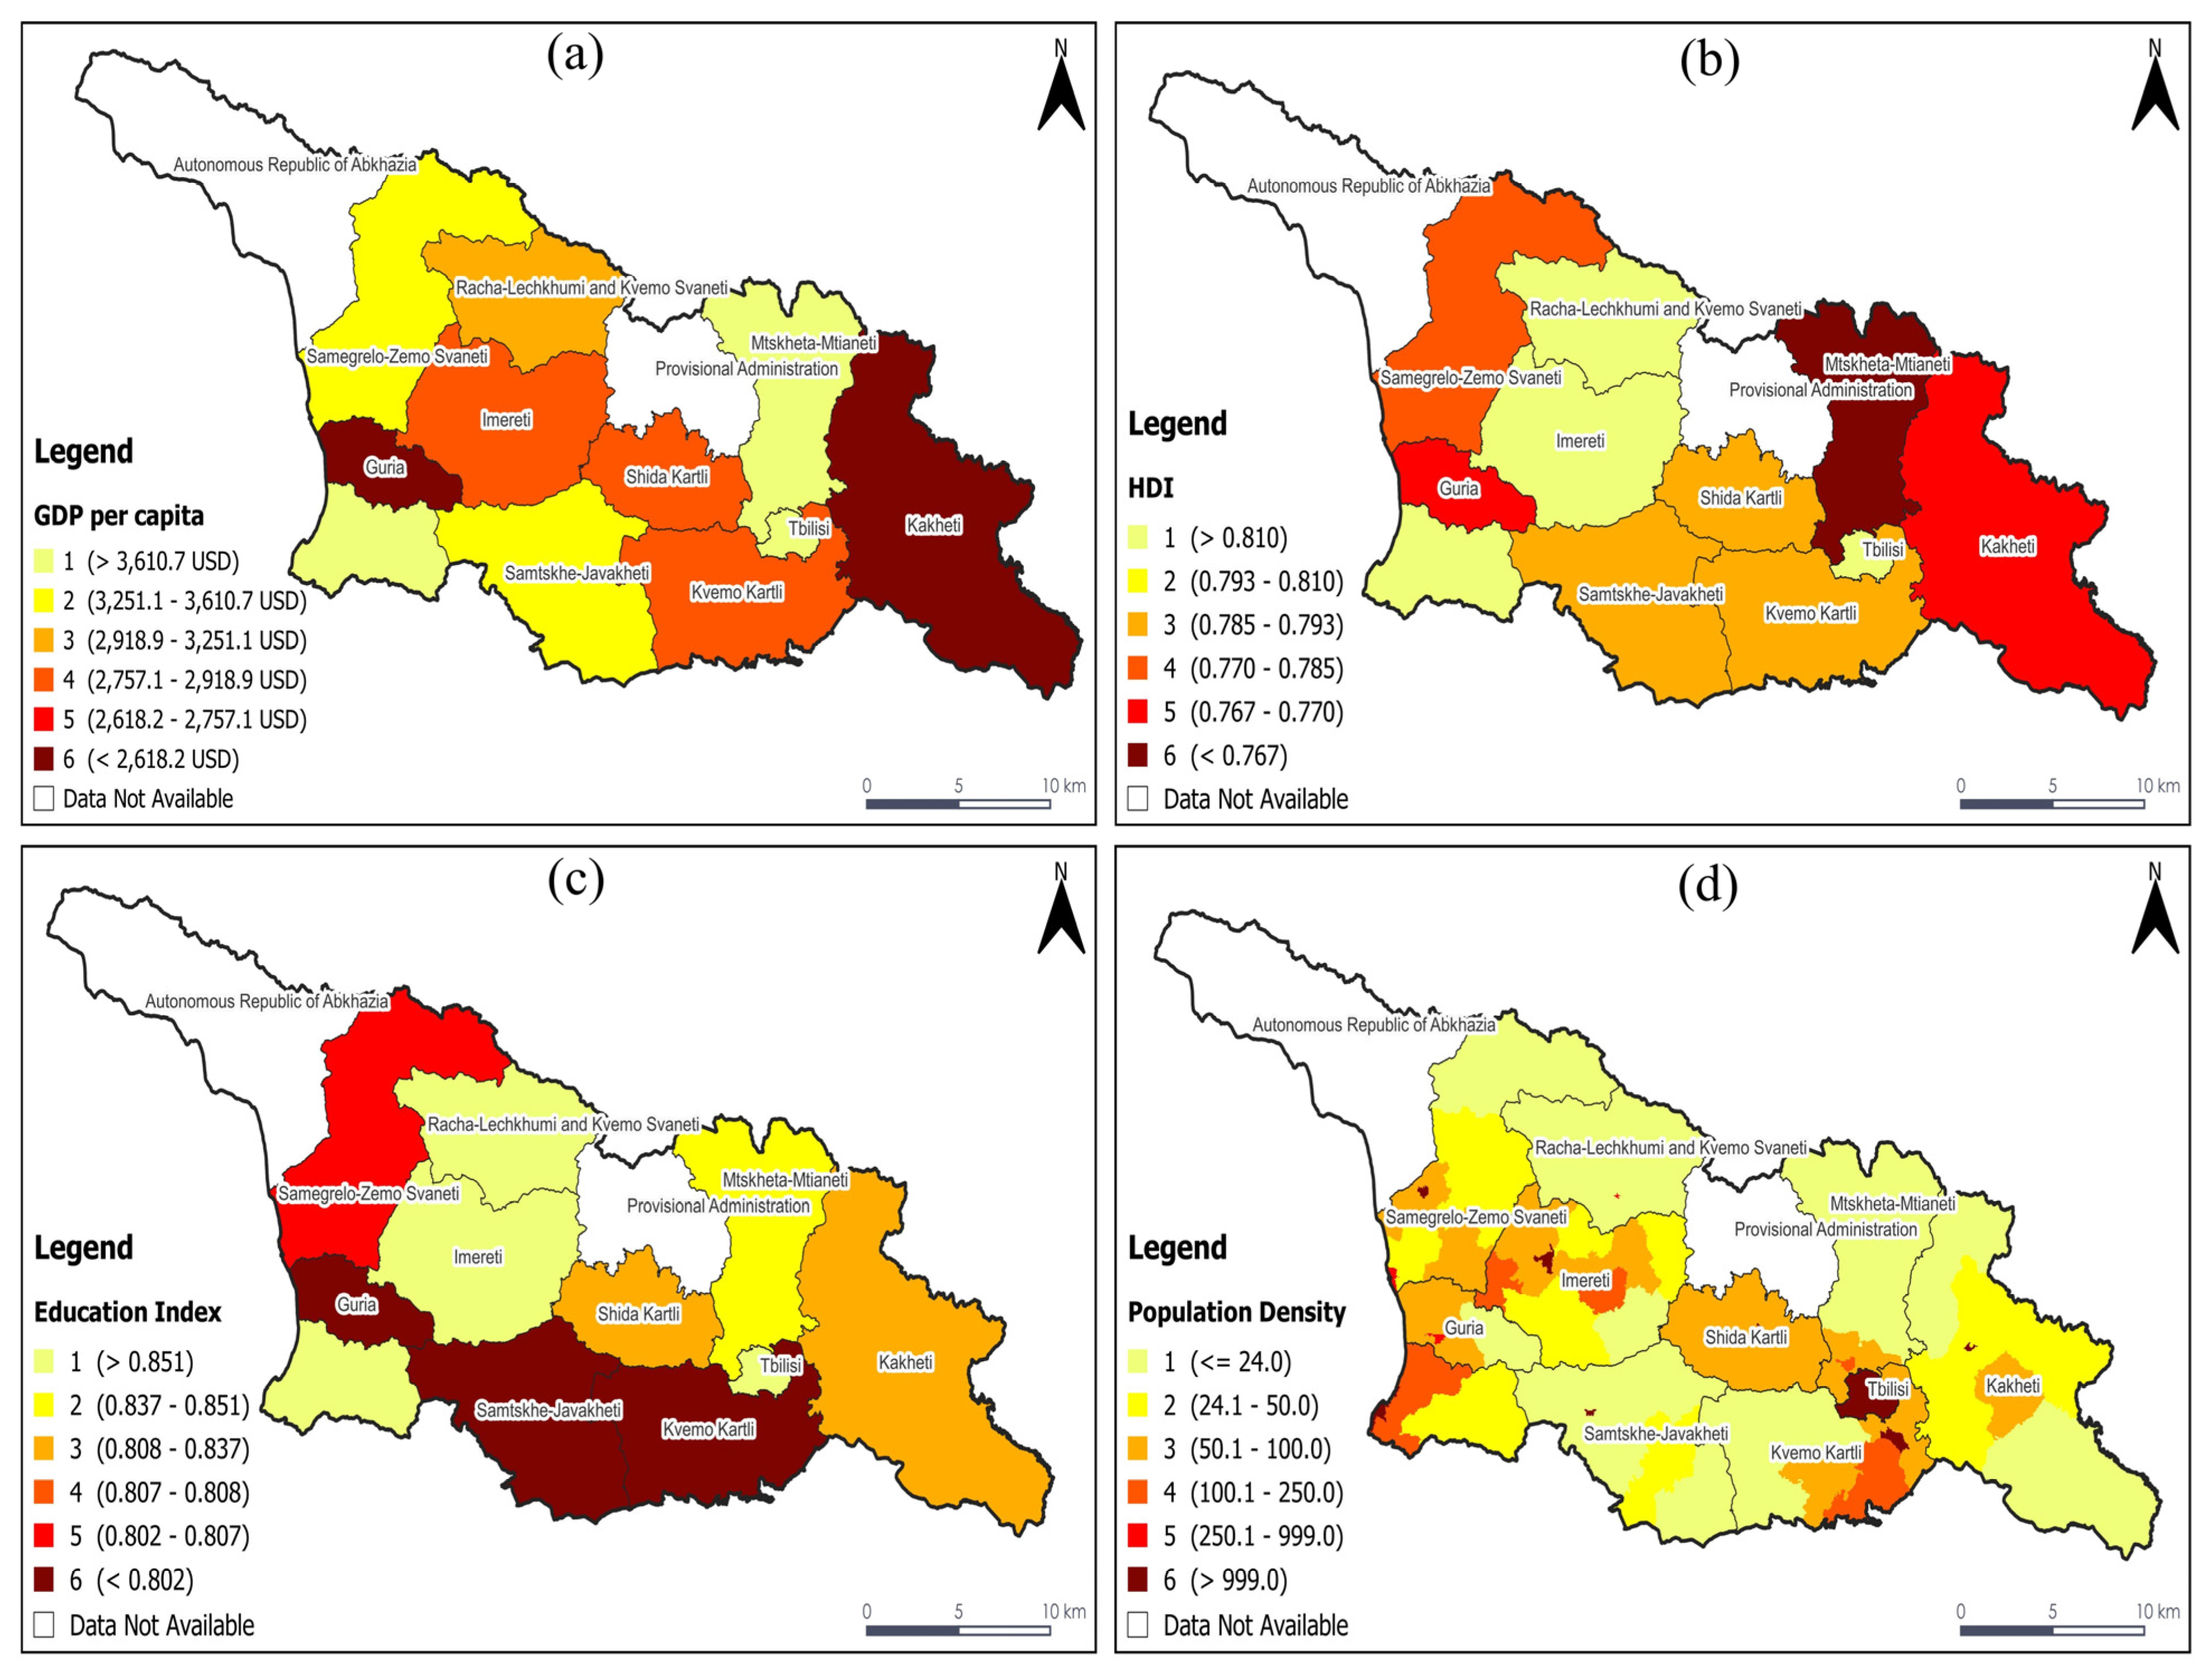
Figure 11.
Map of combined socio-economic sensitivity to climate change in Georgia. The value of 1 is the lowest sensitivity, and 6 is the highest sensitivity.
Figure 11.
Map of combined socio-economic sensitivity to climate change in Georgia. The value of 1 is the lowest sensitivity, and 6 is the highest sensitivity.

Figure 12.
Climate exposure, geographic, and socio-economic sensitivity-based risk and vulnerability maps for the RCP 4.5 and RCP 8.5 scenarios. The value of −1 is the least vulnerable, and 6 is the most vulnerable to climate change impacts.
Figure 12.
Climate exposure, geographic, and socio-economic sensitivity-based risk and vulnerability maps for the RCP 4.5 and RCP 8.5 scenarios. The value of −1 is the least vulnerable, and 6 is the most vulnerable to climate change impacts.


Table 1.
CMIP5 GCMs selected for the study.
| Scheme | Global Circulation Models | Institution | Spatial Resolution |
|---|---|---|---|
| 1 | CMCC-CM | CMCC, Italy | 0.75° |
| 2 | CSIRO-Mk3.6.0 | CSIRO-QCCCE, Australia | 1.875° |
| 3 | GFDL-ESM2G | NOAA-GFDL, USA | 2.0° |
| 4 | MIROC5 | MIROC, Japan | 1.40625° |
| 5 | MPI-ESM-LR | MPI-M, Germany | 1.875° |
| 6 | MPI-ESM-MR | MPI-M, Germany | 1.875° |
| 7 | MRI-CGCM3 | MRI, Japan | 1.125° |
Table 2.
ETCCDI extreme climate indices used for the climate exposure risk assessment.
| S. No. | Extreme Climate Index | Name (Units) | Definition |
|---|---|---|---|
| 1 | PRCPTOT | Total precipitation (mm) | Total annual accumulated precipitation on days with precipitation > 1 mm. |
| 2 | R95pTOT | Heavy precipitation (mm) | Total yearly precipitation on very wet days when daily precipitation is higher than the 95th percentile. |
| 3 | R99pTOT | Extreme precipitation (mm) | Total yearly precipitation on extremely wet days when daily precipitation is higher than the 99th percentile. |
| 4 | Rx5day | 5-day maximum precipitation (mm) | Maximum precipitation in five consecutive days in a year. |
| 5 | TXx | Annual maximum of daily maximum temperature (°C) | Maximum value of daily maximum temperature in a year. |
| 6 | TX90p | Warmth duration (%) | Percentage of warm days when the daily maximum temperature exceeds the 90th percentile. |
| 7 | CDD | Consecutive drought duration (day) | Maximum duration of drought period or maximum number of consecutive days with precipitation below 1 mm in a given year. |
Table 3.
Description of geographic indicators used for sensitivity assessment.
| S. No. | Geographic Indicators | Temporal Coverage | Data Source | References |
|---|---|---|---|---|
| 1 | Water Stress | 1960–2014 | Aqueduct 3.0, WRI | [69,77] |
| 2 | Drought Risk | 2000–2019 | Aqueduct 3.0, WRI | [69,77] |
| 3 | NDVI Trend | 2000–2020 | NASA LP DAAC | [78] |
Table 4.
Description of socio-economic indicators used for sensitivity assessment.
| S. No. | Geographic Indicators | Temporal Coverage | Data Source | References |
|---|---|---|---|---|
| 1 | GDP per capita | 2020 | National Statistics Office of Georgia | [52] |
| 2 | HDI | 2019 | Global Data Lab | [79,80] |
| 3 | EI | 2020 | National Statistics Office of Georgia | [52] |
| 4 | Population Density | 2020 | National Statistics Office of Georgia | [52] |
Table 5.
Equations used to determine the Climate Exposure Index, Geographic Sensitivity Index, Socio-economic Sensitivity Index, and Climate Risk and Vulnerability Index.
Table 5.
Equations used to determine the Climate Exposure Index, Geographic Sensitivity Index, Socio-economic Sensitivity Index, and Climate Risk and Vulnerability Index.
| S. No. | Exposure, Sensitivity, and Vulnerability Index | Equation |
|---|---|---|
| 1 | Combined Climate Exposure Index | 0.5 * TXx + 0.5 * TX90p + 1 * PRCPTOT + 0.333 * R95pTOT + 0.333 * R99pTOT + 0.333 * Rx5day + 1 * CDD |
| 2 | Combined Geographic Sensitivity Index | 2 * Water Stress + Drought Risk + 2 * NDVI Trend |
| 3 | Combined Socio-Economic Sensitivity Index | GDP per capita + 0.5 * HDI + 0.5 * EI + 0.5 * Population Density |
| 4 | Climate Risk and Vulnerability Index | Climate Exposure + Geographic Sensitivity + Socio-Economic Sensitivity |
Disclaimer/Publisher’s Note: The statements, opinions and data contained in all publications are solely those of the individual author(s) and contributor(s) and not of MDPI and/or the editor(s). MDPI and/or the editor(s) disclaim responsibility for any injury to people or property resulting from any ideas, methods, instructions or products referred to in the content. |
© 2023 by the authors. Licensee MDPI, Basel, Switzerland. This article is an open access article distributed under the terms and conditions of the Creative Commons Attribution (CC BY) license (https://creativecommons.org/licenses/by/4.0/).
Share and Cite
MDPI and ACS Style
Aryal, A.; Bosch, R.; Lakshmi, V. Climate Risk and Vulnerability Assessment of Georgian Hydrology under Future Climate Change Scenarios. Climate 2023, 11, 222. https://doi.org/10.3390/cli11110222
AMA Style
Aryal A, Bosch R, Lakshmi V. Climate Risk and Vulnerability Assessment of Georgian Hydrology under Future Climate Change Scenarios. Climate. 2023; 11(11):222. https://doi.org/10.3390/cli11110222
Chicago/Turabian StyleAryal, Aashutosh, Rieks Bosch, and Venkataraman Lakshmi. 2023. "Climate Risk and Vulnerability Assessment of Georgian Hydrology under Future Climate Change Scenarios" Climate 11, no. 11: 222. https://doi.org/10.3390/cli11110222
Note that from the first issue of 2016, this journal uses article numbers instead of page numbers. See further details here.