
Extremely Cold Climate and Social Vulnerability in Alaska: Problems and Prospects


1
Department of Geography, Humboldt Universität zu Berlin (HU), 10099 Berlin, Germany
2
International Arctic Research Centre, University of Alaska Fairbanks, Fairbanks, AK 99775, USA
*
Author to whom correspondence should be addressed.
Climate 2024, 12(2), 20; https://doi.org/10.3390/cli12020020
Submission received: 13 December 2023
/
Revised: 23 January 2024
/
Accepted: 30 January 2024
/
Published: 2 February 2024
(This article belongs to the Special Issue Climate, Climate Change and the Arctic: Environment, Infrastructure, Health and Well-Being)
Abstract
:Cold exposure remains a significant public health concern, particularly in the Arctic regions prone to extremely cold weather. While the physical health impacts of cold exposure are well documented, understanding the social vulnerability aspects is crucial for effective mitigation and policy development. This study investigates the multifaceted dimensions of social vulnerability in the face of cold temperatures across various communities in Alaska. Alaska, renowned for its extreme cold temperatures and harsh environmental conditions, poses unique challenges to its residents, particularly in the context of social vulnerability. Drawing on a combination of quantitative data analysis and qualitative insights, we examine the factors contributing to social vulnerability, including demographic, economic, geographic, and infrastructural elements, in terms of the Extremely Cold Social Vulnerability Index, for seven Public Health Regions in Alaska. The Universal Thermal Climate Index in two very cold categories (<−27 °C) was used to identify cold exposure. Factors such as income, housing quality, health status, and resilience of the population play crucial roles in determining an individual or community’s sensitivity to, and ability to cope with, cold temperatures. Our analysis reveals that social vulnerability in Alaska is not uniform but varies significantly among regions. The research findings highlight the importance of considering factors of both sensitivity and adaptivity in understanding and addressing social vulnerability, thereby informing the development of targeted strategies and policies to enhance the resilience of Alaskan communities. As cold temperatures are projected to continue to challenge the region, addressing social vulnerability is essential for ensuring the well-being and safety of Alaska’s diverse populations.

1. Introduction
Ongoing climate change in the Arctic has a profound impact on the environmental, social, cultural, political, economic, and security aspects of people’s lives in the region. These consequences have drawn closer attention to the Arctic, highlighting both its intrinsic value and relationship with the global landscape [1]. The perils associated with climatic and geological hazards entail significant social and economic consequences, exacerbating the vulnerability of the Arctic population. The need to eliminate these Arctic-specific risks has intensified due to the accelerated pace of environmental transformation. Recent studies show that the rate of atmospheric warming in the Arctic can be three to four times higher than the global average [2,3,4,5]. The accumulation of knowledge through proactive research can be used to assess and reduce vulnerability, thereby helping to prevent or mitigate adverse effects. As we continue to explore the underlying mechanisms of climate change, it is extremely important to redirect our efforts to respond to its consequences. This redirection entails a focus on risk reduction, resilience, mitigation, and scenario development. In this context, sustainable development is becoming a growing field of research that explores the interaction between natural and social systems. Central to sustainable development is the task of meeting the needs of current and future generations while significantly reducing poverty and preserving the Earth’s life support systems. Remaining challenges include persistent differences in health status between residents of Arctic and non-Arctic regions, climate-related health and social risks, as well as food/energy/water/economic insecurity [6,7,8].
Vulnerability is a concept associated with the susceptibility to harm, lack of power, defenselessness, diminished capabilities, and dependence. It provides a framework for exploring the interplay between hazards, cultural practices, people’s life contexts, disasters, and development [9]. In the field of hazard studies, a widely accepted definition of social vulnerability, as proposed by Wisner et al. [10], p. 11, is “the characteristics of a person or group in terms of their capacity to anticipate, cope with, resist and recover from the impact of natural hazard”. Vulnerability represents the theoretical junction that connects the way individuals interact with their environment to the social forces, institutions, and cultural values that either support or challenge them. Wisner and coauthors [10] delved into four overarching methods for defining vulnerability: (i) demographic, (ii) taxonomic, (iii) situational, and (iv) contextual and proactive approaches, while J. Birkmann with colleagues [11] discussed the multi-dimensional character of vulnerability, emphasizing its social, economic, physical, cultural, environmental, and institutional aspects. As a concept, social vulnerability describes combinations of social, cultural, economic, political, and institutional processes that shape socioeconomic differentials in the experience of and recovery from hazards [11].
The broad definition of vulnerability encompasses the potential for property or life loss due to environmental hazards [12]. At the same time, Cutter et al. [13] aptly emphasize that social vulnerability encompasses multiple dimensions, aiding in the recognition of the attributes and life experiences of both communities and individuals that enable their capacity to react to and recuperate from natural disasters. The Intergovernmental Panel on Climate Change defines vulnerability as “the extent to which a system can be affected by adverse impacts of climate change, including climate variability and extremes” [14].
Typically, vulnerability is seen as a combination of components, including exposure and sensitivity to external stresses or disturbances, along with the capacity to adapt [15]. Exposure and sensitivity are often merged into potential impact, which can further interact with adaptive capacity to determine vulnerability. Another common perspective is the hazards-of-place model of vulnerability, employed by Cutter et al. in the Social Vulnerability Index (SVI) [13]. In this model, hazard potential results from the interplay of risk (an objective measure of the likelihood of a hazard event occurring) and mitigation (measures to reduce or mitigate risks), which can be influenced by geographic factors and the social context of a place. Additionally, some researchers emphasize the involvement of stakeholders within the vulnerability framework [16,17]. Wilhelmi and Hayden [16] introduced a novel research framework for analyzing local-level vulnerability to extreme heat, combining quantitative and qualitative data on social vulnerability and adaptive capacity beyond basic demographic information. The engagement of stakeholders, as one element in the collection of quantitative and qualitative data, helps establish connections between people and places, enhancing the understanding of local-level vulnerability and existing adaptation strategies.
Quantitative measures of social vulnerability are widely used in research and practice. The literature on vulnerability demonstrates that two primary approaches have been employed to assess social vulnerability: (1) an inductive method based on statistical relationships, and (2) a deductive method grounded in the theoretical understanding of relationships [18].
The inductive approach to evaluating social vulnerability involves the creation of a systematic Social Vulnerability Index (SVI) by incorporating extensive sets of variables that impact social vulnerability [13]. While this approach also draws upon the existing vulnerability literature, it distinguishes itself from the deductive method by encompassing all potential variables mentioned in the literature as relevant to assessing social vulnerability. The SVI was originally constructed as a general environmental hazard vulnerability measure for the USA [1]. Cutter et al. [13] conducted a comprehensive analysis of the body of vulnerability literature, compiling a collection of 85 social vulnerability variables. From this pool, they utilized a normalized set of 42 variables in a statistical analysis to measure social vulnerability across over 3000 U.S. counties. Numerous other researchers have adopted Cutter’s SVI to investigate social vulnerability in many countries and for different purposes [18,19,20,21]. For example, the SVI was used for preparedness to specific hazards, including climate-related disasters, such as flooding [22,23,24,25,26,27,28], coastal inundation and storm surge [29], coastal erosion [30,31,32], tsunamis [33], hurricanes [34] or extreme heat [35], and for disaster recovery [36,37]. The results of the SVI estimations can be used for different management purposes, such as for local jurisdictions [38], metropolitan comparisons [39], and mitigation planning [40,41], in different countries worldwide, such as Norway [42], Germany [43], Portugal [44], Italy [28], China [45], Brazil [46], Philippines [47], and others.
On the other hand, the deductive approach involves the deliberate selection of a limited number of variables based on prior theoretical knowledge and existing literature to construct the SVI. The degree to which a researcher utilizes this deductive approach can vary. In some cases, it simply entails the adoption of variables identified in previous research without providing additional justification for their selection. For instance, Cutter et al. [12] employed the deductive approach by choosing eight variables to quantify social vulnerability when examining populations residing within hazard zones in Georgetown County, South Carolina. Similarly, Wu et al. [30] selected nine variables to assess social vulnerability in Cape May County, New Jersey, while Chakraborty et al. [48] opted for ten variables to determine social vulnerability for evacuation in Hillsborough County, Florida. In contrast, Zahran et al. [23] chose only three variables as proxies to assess social vulnerability. These selectively chosen social vulnerability variables were tailored to address the specific research questions and concepts of the respective researchers.
With a deep understanding of vulnerability, numerous indices have been developed and utilized in assessing vulnerability to extreme temperatures, specifically to heat, and each index was developed with distinct frameworks and objectives [16,49,50,51,52,53,54,55]. They identify vulnerable areas and populations at risk: e.g., Wilhelmi and Hayden [16] underscore the importance of adopting an interdisciplinary strategy to address societal susceptibility to extreme heat events. The approach should encompass various factors, including information on weather and climate, the natural and constructed environment, social processes and characteristics, interactions with stakeholders, and an evaluation of community vulnerability at the local level. They delve into the connections between individuals and locations within the context of urban heat stress, introducing a novel research framework for a comprehensive, both top-down and bottom-up, analysis of local-level vulnerability to extreme heat, with this framework striving to enhance the representation of societal vulnerability by integrating quantitative and qualitative data that extend beyond mere aggregated demographic information [16]. Wolf and McGregor [52] created a Heat Vulnerability Index (HVI) for London, UK, revealing higher vulnerability in central London, particularly in the central boroughs and areas north of the Thames [52]. These studies assess the spatial and temporal distribution of vulnerability and explain the patterns: Chow et al. [53] produced HVI maps for Metropolitan Phoenix, USA, demonstrating how climate, urban ecology, social status, and demographic changes interact to shape spatial and temporal patterns of heat vulnerability [53]. An important aspect is offering decision support for resource allocation in preparation for and response to heat-related events. Using the HVI map in Pittsburgh, USA, Bradford et al. [54] determined optimal cooling center placements to address vulnerability among at-risk populations, presenting a cost-effective solution for city decision makers [54]. Last but not least among the issues is projecting future vulnerability. For example, Oh et al. [55] utilized an HVI to assess health vulnerability to heat waves under the Representative Concentration Pathways (RCP) 8.5 scenario in the 2040s at the provincial level in South Korea, pinpointing Daegu Metropolitan City as the most vulnerable region [55].
Whilst it was emphasized by some studies that sometimes cold exposure can pose a higher danger to human health that heat [56,57,58] even despite future warming scenarios [59], the vulnerability of society to low temperatures [60,61] has received little attention. One of the major gaps in our current understanding of vulnerability is the limited research on extreme cold conditions. K.C. Lauta and colleagues [60] argued that the existing body of literature on disasters primarily concentrates on regions that are warm, easily accessible, and densely populated. Nonetheless, with the increasing human presence in the Arctic and Antarctica, the study of cold environments and their unique attributes has become more pertinent [60]. The authors explored “cold disasters” in the context of disaster theory with the aim of clarifying how these events challenge established understandings of disasters and presenting emergency scenarios to illustrate the intricate dynamics of cold environments.
Vulnerability to the cold is particularly relevant in the Arctic because of its cold background climate [60,62,63,64,65]. Although the Arctic is undergoing rapid climate change and is expected to experience the most warming of any world region during this century, there has been limited research on the subject of social vulnerability to extreme cold in the Arctic. In order to enhance our comprehension of the health risks associated with extreme cold and promote the development of models that highlight these risks, this paper introduces the Extremely Cold Social Vulnerability Index (ECSVI). The ECSVI employs an approach that incorporates well-established variables encompassing both physical and social factors that are known contributors to vulnerability in extreme environments. This research sets itself apart from previous studies, which have either focused on analyzing variables (environmental or social) to identify the most relevant ones for cold-related health risks or attempted to create a comprehensive index linking it to mortality or other health consequences related to cold impacts. Despite numerous attempts to link exposure to cold with health effects, only a few research studies have been able to quantify their interaction and significance for the human environment, expressed in demographic and social–economic factors. Our study aims to bridge this gap and should be recognized as a significant contribution to modeling vulnerability to cold-related challenges, building upon prior findings. The primary objective of our ongoing research is to assess regional aspects of social vulnerability in the context of an extremely cold climatic environment, with a specific emphasis on the expansive region of Alaska, USA. This investigation will delve into the unique natural, medical, economical, and social characteristics and concerns of the population in Alaska.
2. Materials and Methods
2.1. Study Area
Alaska is the largest and the northwestern-most state of the USA. In Alaska, the Pacific coastline is separated from the interior by the Alaskan Range, with Denali Mountain (6190 m) standing as the highest point in North America. The interior region consists of a plateau that reaches an elevation of 1200 m in the east but generally drops to below 600 m in the west, eventually transitioning into lowland terrain near the coast. To the north, the Brooks Ridge runs in an east–west orientation, serving as a protective barrier for the interior against the harsh cold of the Arctic. Beyond the Brooks Ridge lies the Arctic lowland of the North Slope, which is exposed to the influences of the frigid Arctic Ocean, resulting in consistently low temperatures and strong winds throughout the year. Consequently, Alaska’s diverse topography and varying proximity to cold bodies of water in the Beringia region give rise to a range of climates [62,63,64,65]. According to the Köppen–Geiger climate classification, Alaska’s climate transitions from Arctic polar tundra in the north, to subarctic oceanic and continental in the northwest and interior, to temperate oceanic in the south and southeast [65,66,67].
Despite being the largest state in the USA, Alaska has a population of less than 750,000, with almost 40% of the population residing in Anchorage and nearly 15% residing in the Juneau and Fairbanks boroughs; in other parts of the state, the population density is exceptionally low [68,69]. Alaska is a very diverse state in terms of health status, poverty, and education level [70].
The study area includes 29 locations in Alaska, selected based on population size, including the most densely populated locations as well as locations representative of both the Köppen–Geiger subclasses as well as the Public Health Regions (PHRs). Alaska’s seven PHRs are: Anchorage, Gulf Coast, Interior, Matanushka-Susitna (Mat-Su), Northern, Southeast, and Southwest. Figure 1 shows the selected locations in the PHRs of Alaska.
2.2. Methods
The assessment of social vulnerability to cold climatic environments, with a primary focus on Alaska, USA, has been conducted using the Social Vulnerability Index, which combines bioclimatic and socio-economic data. The Extremely Cold Social Vulnerability Index (ECSVI) is proposed as an integrative metric with three primary components: (1) cold exposure or climatic discomfort (CD), denoting the discomfort caused by cold climatic conditions; (2) social sensitivity (SS), encompassing groups within the population most susceptible to temperature extremes; and (3) the adaptive capacity or social adaptivity (SA) of a society to thrive in an extremely cold natural environment. Both (2) and (3) are grounded in demographic, health, and economic statistics [13,16,19,20,21,23,24,26,28,29,33,35,36,39,42,44,45,46,49,50,51,52,53,54,55]. The most challenging part of this research is to choose indicators which could be used to better describe the social block in the ECSVI—both SS and SA. They should be relevant, according to the literature search, and represented in open and available databases [13,16,19,20,23,24,26,28,29,33,35,36,39,42,44,46,49,50,51,52,53,55]. A widely acknowledged and simple method for defining social vulnerability to extreme weather events involves aggregating these components [16,49], as illustrated in Equation (1):
V(ulnerability) = E(xposure) + S(ensitivity) − A(daptive capacity)
Following the idea that sensitivity and adaptivity have opposite—positive for SS and negative for SA—impacts on social vulnerability, as in [16,49], which means the higher the SS, the higher the vulnerability, and the higher the SA, the lower the vulnerability, and having in mind that the social block is a very important indicator for social vulnerability to extreme weather exposure and combining SS and SA together, we suggest changes to Equation (1), as shown in Equation (2):
where CD is the cold climate discomfort, SS is the social sensitivity, and SA is the social adaptivity. SS and SA were calculated as the arithmetic mean of all indicators for both SS and SA.
ECSVI = CD + (SS − SA)/2
First, estimation of social vulnerability to cold environments should involve an assessment of the cold exposure. The Universal Thermal Climate Index (UTCI) was used to identify the exposure. The UTCI stands out as a widely utilized metric for characterizing how individuals perceive atmospheric conditions, amalgamating air temperature, humidity, wind velocity, and radiation [71,72]. The UTCI represents the state-of-the-art measure of thermal stress experienced by the human body, calculated through an advanced model that combines human thermoregulation with a clothing insulation model [71,73]. These models estimate the impact of air temperature, wind speed, water vapor pressure, and both short- and long-wave radiant energy on human physiology [74]. The UTCI provides values on a stress category scale, ranging from extreme cold to extreme hot stress [65], where the thresholds for the categories of thermal stress have been defined by previous research [71,72,73] depending on the corresponding physiological responses. In this study, CD is quantified in terms of hours spent in the UTCI’s two very cold thermal perception categories below −27 °C; namely, Category 1—extremely cold (UTCI ≤ −40 °C) and Category 2—very cold (UTCI = −40°…−27 °C) [65].
Secondly, SS should define how various social factors contribute to an individual or community’s susceptibility to the adverse effects of cold weather: social vulnerability to the cold climatic environment must be determined through a combination of indicators that highlight groups within the population that are particularly susceptible to extreme cold temperatures. These indicators encompass the following categories: the percentages of (i) elderly and (ii) disabled individuals; those with (iii) cardiovascular and (iv) respiratory illnesses; (v) individuals with low income (falling below the poverty threshold); and (vi) the proportion of people residing in housing units lacking complete plumbing facilities. U.S. Census Data for Social, Economic, and Health Research defines “complete plumbing facilities” or water and sanitation services, as piped hot and cold water, a flush toilet, and a bathtub or shower, all within the household [https://usa.ipums.org/usa/index.shtml (accessed on 12 January 2024)]. Since a large part of Alaska is located in the cold areas with permafrost, plumbing facilities are not widespread, and water use for people is a very challenging issue, which can be very complicated and expensive, especially in winter [75,76]. Consequently, the availability of complete plumbing facilities in households serves as an important additional indicator of SS to cold environments. As a result, SS was represented as a combination of the six indicators listed above.
The third problem arises with SA. We posit that the society’s ability to adapt to the harsh cold environment can be reflected in its social infrastructure and socio-economic indicators, which offer both direct and indirect insights into the income levels of the population. Our assumption is that factors affecting the ability of society to adapt to natural extremes include (i) income levels, as higher levels enhance individuals’ capacity to adapt to challenging natural surroundings by affording them greater personal resources; (ii) the level of education; (iii) the proportion of people with a bachelor’s degree or higher; and (iv) the proportion of people of working age. A literature review shows that the Market Basket indicator, which measures the consumer price index and purchasing power, plays a pivotal role in gauging actual income levels since it shows the real income [77,78]. This indicator likely exhibits significant regional variations within Alaska. But given that the consumer price index is only available in open bases for the Anchorage metropolitan area, we rely on alternative indicators that, in our assessment, can be applied for the estimation of differences in the cost of living. In our case, we choose indicators including (v) the proportion of housing units with five or more bedrooms and (vi) those with three or more vehicles available.
In summary, we have selected two indicators for cold exposure and twelve indicators for the social component, with social sensitivity and adaptive capacity each being allocated six indicators. All indicators were normalized to the same value range of 0–1 using the min-max technique [79]. After normalization, each indicator was given equal weight (1) using the Equal Weight approach, as in-situ expertise on the value of one indicator over another is inaccessible [24,80]. And finally, all indicators are aggregated using Equation (2).
2.3. Data
The data used for exposure include the number of hours with the UTCI below −27 °C for 29 weather stations in Alaska (1980–2019), based on the historical reconstruction of the ERA5-HEAT (human thermal comfort) gridded dataset for the surface level with 0.25° × 0.25° spatial resolution; this dataset is available from the Copernicus Climate Change Service (C3S) [81], Di Napoli et al. [82], and Hersbach et al. [83]. For all 29 locations, the ERA5-HEAT pixel with its geographical center closest to the weather station location was selected for the analysis. Social and economic data for the population in Alaska for the years 2014 and 2019 were taken from the US Census data at https://data.census.gov/cedsci/ (accessed on 12 May 2022). The data are for SS—old-age dependency ratio, %; total civilian non-institutionalized or disabled population; occupied housing units lacking complete plumbing facilities (%); population for whom poverty status is determined (%);SA—population of working age, or age 15–64 (%); per capita personal income (USD); housing units with five or more bedrooms (%); housing units with three or more vehicles available (%); population 25 years and over that are high school graduates (includes equivalency) (%); and percent of the population with a bachelor’s degree or higher (%). The old-age dependency ratio shows the ratio between the number of persons aged 65 and over, which is when they are generally economically inactive, and the working-age population, or those ages 15–64. Statistics on cardiovascular and respiratory disease, both for emergency department visits with upper respiratory infections per 10,000 of the population and for diseases of the circulatory system per 10,000 of the population, for the period of 2014–2019 are available at the State Department of Health website data and statistics page: https://dhss.alaska.gov/dph/VitalStats/Pages/data/default.aspx (accessed on 12 May 2022). All data are distributed spatially by the seven PHRs (Figure 1).
A flow chart of research methods is provided to make the results clearer, as shown in Figure 2.
3. Results
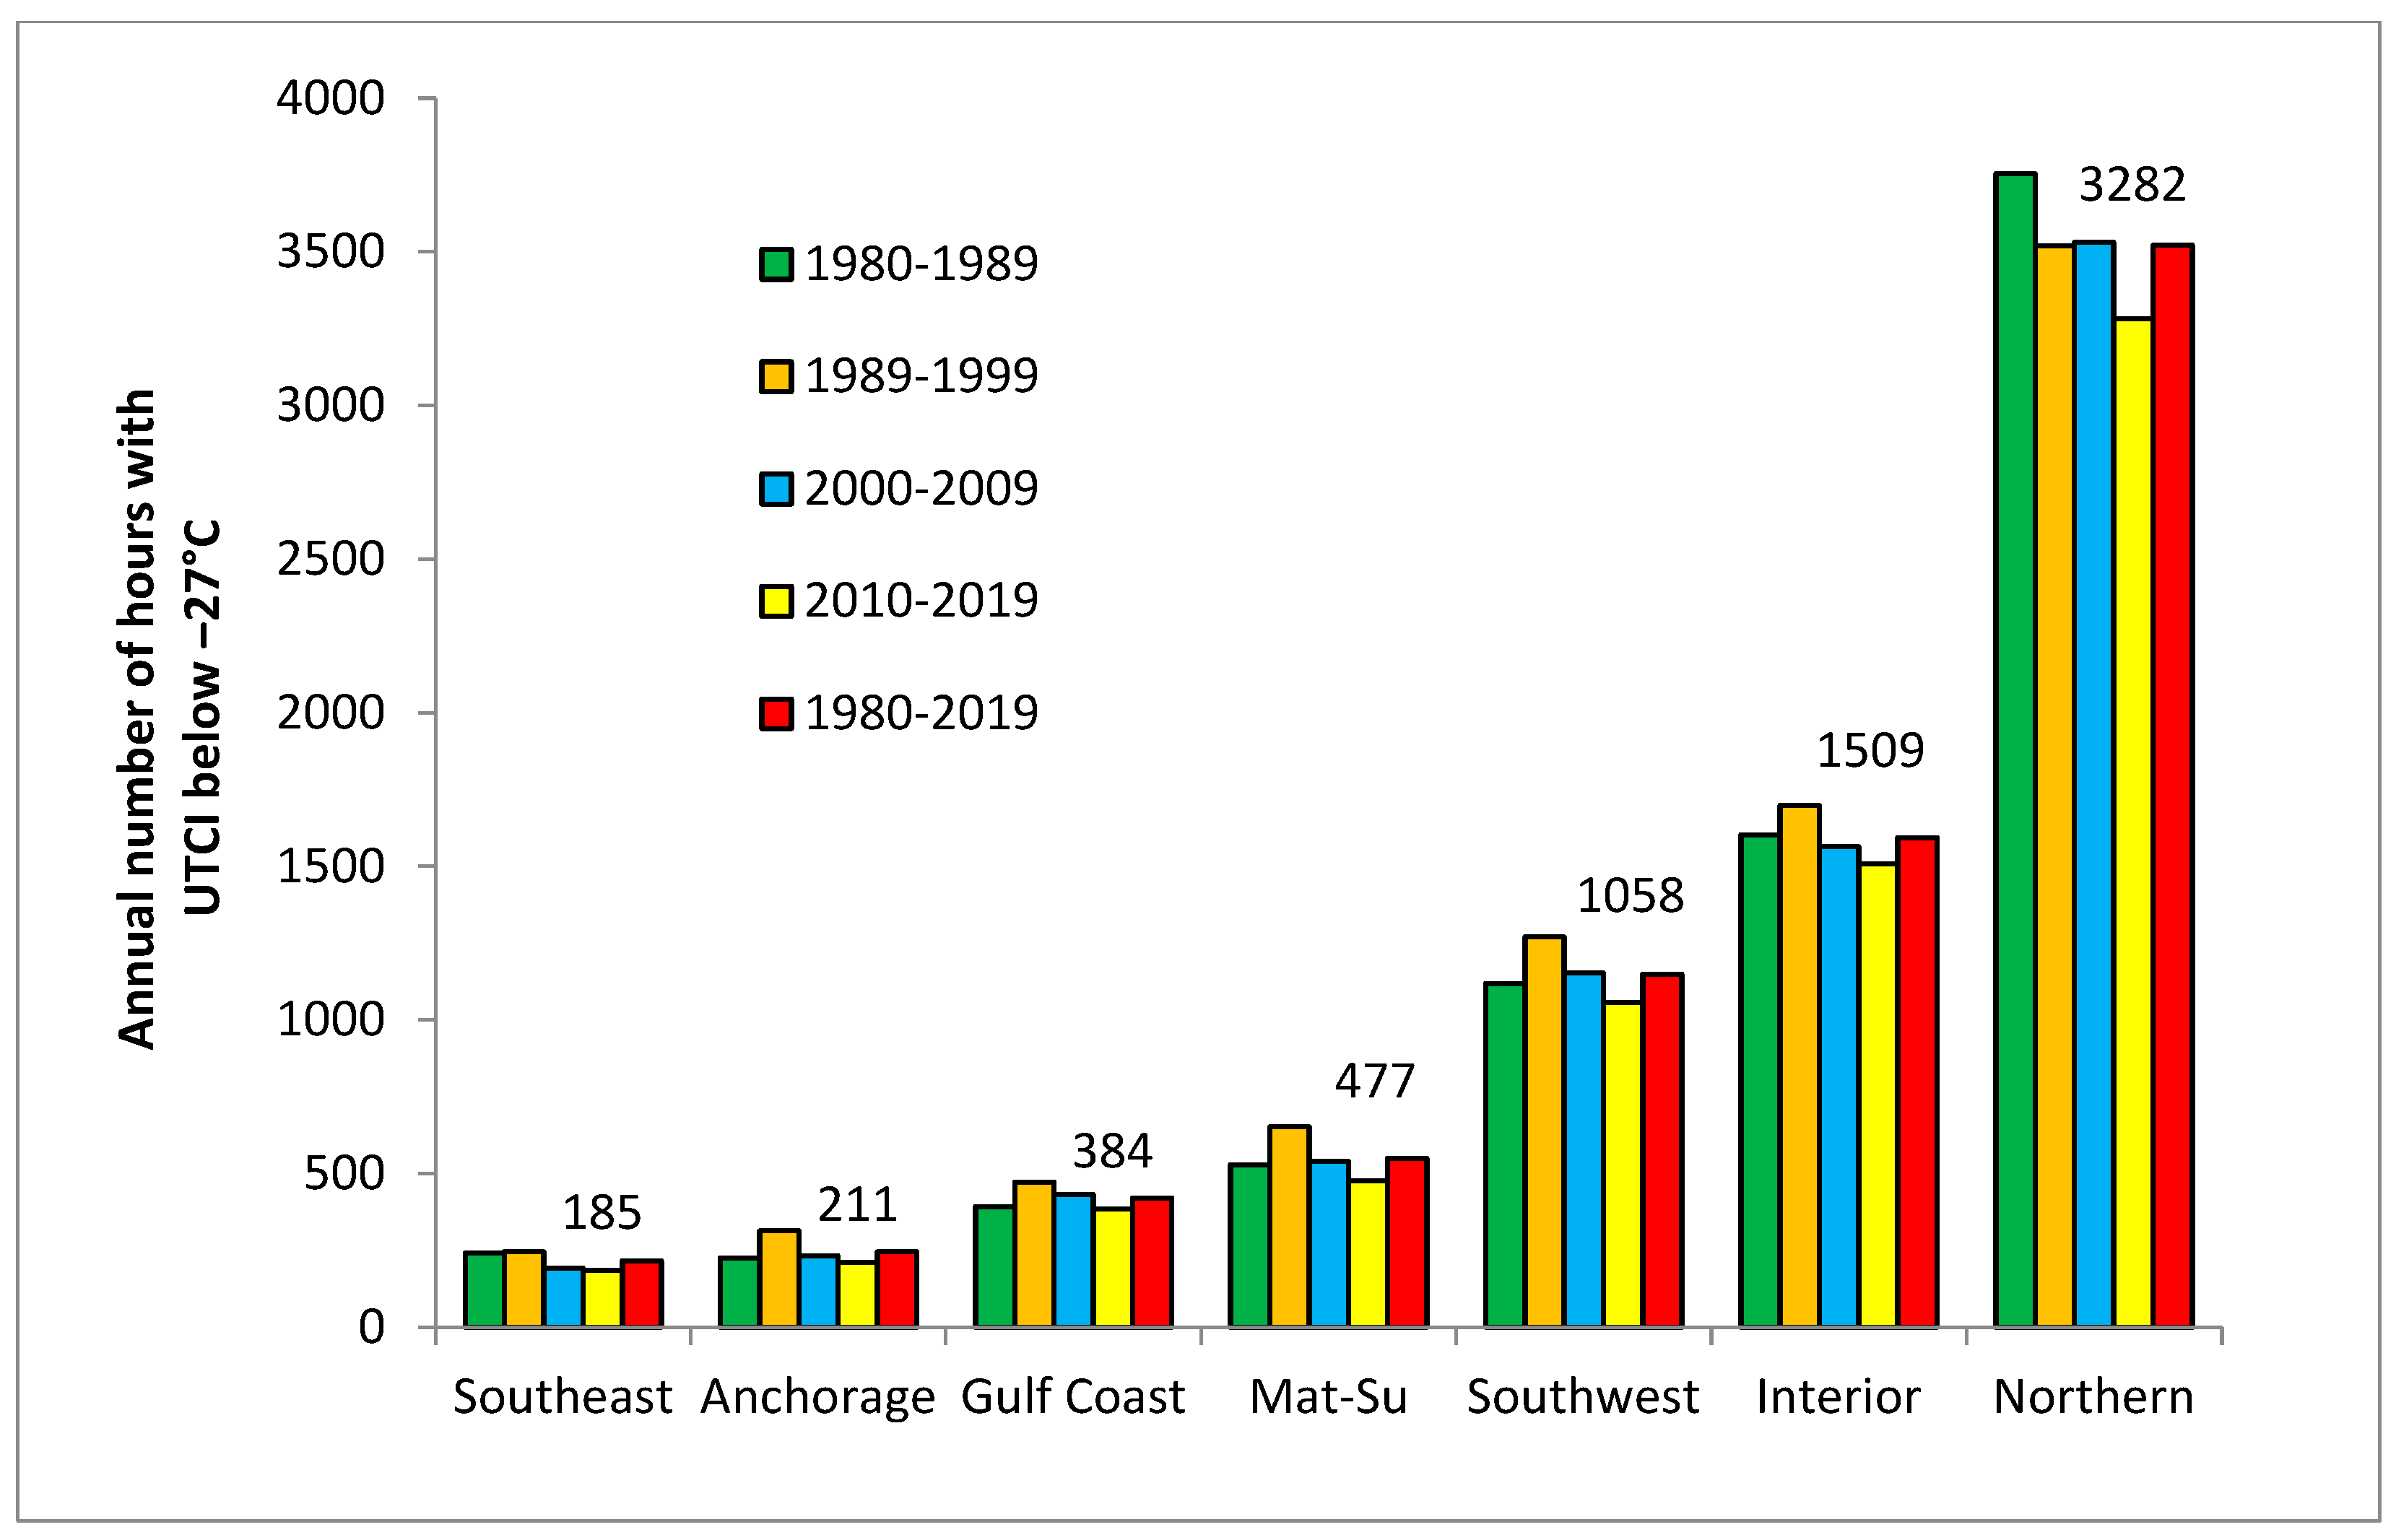
The results for the UTCI were extracted from research describing spatial and temporal changes of the UTCI in Beringia, including Alaska and Chukotka [65]. Figure 3 demonstrates the annual number of UTCI hours in categories of thermal stress below −27 °C for the seven PHRs in Alaska for the whole period of calculations from 1980 to 2019 and for each of the four decades within the period. The largest temporary decrease, up to 13% in the period from 1980–1989 to 2010–2019, was shown for the Northern Region. But even with such a high rate of the cold exposure reduction, it still remains extremely cold, with the annual number of UTCI hours in the coldest categories of thermal stress being just below 3300 h, which is more than two and three times as high as in the two next coldest regions: the Interior (about 1500 h) and the Southwest (1060 h) (Figure 3). Matanushka-Susitna has fewer than 500 cold stress hours, Anchorage has about 210 h, and the Southeast has about 185 h (Figure 3). With these results showing that the 2010–2019 values are generally only slightly smaller than the 40-year means, we assume that for ECSVI estimates we can make use of the period of 2010–2019 that coincides with the period of available social data.
The next step was to incorporate the indicators taken for evaluation of the social sensitivity block of the ECSVI in Alaska. Figure 4 demonstrates the results of applying the min-max technique with the rankings of each of the six indicators for all seven PHRs. The old-age dependency ratio shows the ratio of people older than 64 to the working-age population, or those ages 15–64. It is lowest for the Northern Region (11.7%) and highest in the Southeast, with the Southwest (12.2%) and Anchorage (16.2%) having the second and the third highest values. Application of the min-max technique gives the ranks from the lowest to highest, as shown in Figure 4, with the old-age dependency ratio increasing from the Northern Region, to the Southwest and Anchorage Regions, to Matanushka-Susitna, to the Interior, and to the Gulf Coast and Southeast Regions.
All other indicators were calculated in the same way as the old-age dependency ratio. The indicator for total civilian non-institutionalized population, as a percent of the whole population, shows the disabled proportion of the population, with the highest rates in the Interior and Southwest. The number of occupied housing units that are lacking complete plumbing facilities (as a percentage of all housing units) is the highest in the Northern and Interior Regions, meaning these regions have the worst conditions. The Northern Region ranks highest in poverty level, defined as the proportion (%) of the population for whom poverty status is determined. The two indicators of health status—emergency department visits with upper respiratory infections/10,000 and the population with diseases of the circulatory system/10,000—are highest in the Northern Region.
The same technique was used for the components of social adaptivity (SA), or the adaptive capacity—the ability of a society to adapt to extremely cold environments. Figure 5 demonstrates the results with the ranking of each of the six components of SA for all seven PHRs. The population of working age (as a % of total population) has the lowest rank in the Northern Region and the highest value in Anchorage. The highest income (USD) is in Anchorage and the lowest is in Mat-Su. Total housing units with five or more bedrooms (%) and with three or more vehicles available (%)—both components used to express the real income in terms of the availability of spendable money—rank the highest in Anchorage and in Matanushka-Susitna and the lowest in the Northern Region. The two indicators showing the education level—percent of the population of 25 years and over with a high school degree (includes equivalency), and percent of the population with a bachelor’s degree or higher—are the highest in Matanushka-Susitna and Anchorage, respectively. The Northern Region has the lowest level of population with a high school degree.
Finally, Figure 6a summarizes all components of SS (shown in red bars) and SA (in green bars). The Northern Region ranks highest in social sensitivity, which means it has the worst social, demographic, and medical conditions among the PHRs in Alaska and is most sensitive to cold exposure. At the same time, this region ranks lowest in adaptive capacity as expressed by SA (Figure 6a). Conversely, Anchorage has the lowest sensitivity to cold environments and is best positioned in terms of social adaptivity. Figure 6b synthesizes the information from the social block of ECSVI in Alaska, ranking the regions from best (lowest value) to the worst (highest value), from Anchorage to the Northern Region. The negative values, as in Anchorage, Matanushka-Susitna, Gulf Coast, Southwest, and Southeast, imply that in these PHRs the ability of society to adapt to cold exposure is higher than the sensitivity. For other PHRs such as the Interior and Northern Regions, the positive value of the social block indicates that society’s vulnerability to cold environments exceeds its ability to resist (Figure 6b).
The last step is combining the results for CD, SS, and SA into a one value of the ECSVI by using Equation (2). The predictable outcome is shown in Figure 7 and Figure 8. While Figure 7 shows the value of the ECSVI and the ranking of all PHRs, Figure 8 summarizes the details of the ECSVI for each component and each PHR. Anchorage shows the optimal conditions compared to other PHRs, as it is a less cold region (Figure 3), having the lowest social sensitivity and the best conditions to adapt (Figure 7 and Figure 8). Positive values of the ECSVI indicate that cold exposure is higher than the ability of the society to resist. The Northern Region with negative results of the ECSVI is the coldest one, having the highest sensitivity and the worst adaptive capacity (Figure 7 and Figure 8). The Interior is less vulnerable than the Northern Region but still has a high value of the ECSVI, indicating a high enough cold exposure and an insufficient social response capability.
4. Discussion
The SVI approach has been applied in many places throughout the world and has inspired other quantitative indicators of social vulnerability. Integration of climatic data related to the thermal conditions of the environment with socio-economic information derived from demographic, health, and economic metrics has been carried out in this study for a cold-climate region: Alaska. The framework utilized here enables quantitative assessment of adaptive capacity to environmental changes, or resilience to challenges within the social–ecological system in the face of shifting climate conditions. The foundational basis for the assessment is the Extremely Cold Social Vulnerability Index (ECSVI). By highlighting the social vulnerability of the population to climate extremes, societal, the results of our research show the societal range of regions in Alaska, supporting our hypothesis that the ECSVI can serve as a comprehensive quantitative indicator that purports to measure a place’s social vulnerability to climatic extremes, with implications for societal security.
The use of indicators that assign scores or rankings to locations simplifies the task of integrating social and economic dimensions into the processes of planning the adaptive measures. However, the ECSVI exhibits notable deficiencies in terms of its theoretical underpinnings and internal consistency. We demonstrate that the ECSVI often deviates from established theories; increases in factors contributing to vulnerability, such as poverty level, frequently result in decreased vulnerability according to SVI measurements. We urge caution when considering the use of this index in policymaking or other risk reduction initiatives and recommend the development of more robust methods for assessing social vulnerability in practical applications. We believe that even without extensive validation, social vulnerability indicators have merit because it is essential to incorporate a social element into hazard planning, readiness, and response.
The enhanced ability of individuals in the northern countries to adapt to harsh cold climates is reflected in their decreased vulnerability to extreme cold conditions, which is inversely related to winter temperatures [58]. This pattern aligns with expectations of local adaptation to cold environments and has been observed in previous research [84,85,86]. Essentially, in regions where frigid temperatures prevail, the architectural designs and ways of life tend to be adjusted to these conditions, thus reducing the impact of extremely cold days and cold spells on public health [56,87]. Nonetheless, it is worth noting that socioeconomic factors play a significant role in adaptation to cold environments [88].
Some researchers contend that in future climates under warmer scenarios, population growth may even result in a rise in cold-related fatalities, despite the decline in cold temperatures [59]. Conversely, in warmer conditions, it is anticipated that there will be an upsurge in disease risks associated with food-borne pathogens, water-borne illnesses, and vector-borne zoonotic diseases within both human and animal populations residing in Arctic regions. The detrimental health consequences of warming in the Arctic will be particularly significant for wildlife communities and Indigenous populations reliant on the subsistence of food sources derived from wild flora and fauna [89,90,91].
4.1. Indigenous Knowledge and Social Support Network
Robust social support networks and a tightly knit sense of community can help alleviate the adverse effects of exposure to cold temperatures. In cases where support networks are less robust, vulnerable groups may encounter difficulties in obtaining help during emergency situations. Improvements in support networks during emergencies can be intertwined with changes in available technology, e.g., cell phones, social media, and the internet. In the remote regions of Alaska, Indigenous communities are evolving and adapting, but it would be beneficial to establish stronger connections and contacts for improved resilience [92]. Studying and sharing information, which encompasses Indigenous knowledge, are of the utmost significance in comprehending and preparing for the future conditions of the Arctic by establishing the groundwork for well-informed decision-making processes [93].
4.2. Limitations and Advantages
This study has several limitations. Firstly, it is not possible to draw individual conclusions from population-level findings. Additionally, the exposure variables were not directly measured in the locations where people experienced them. On a more technical level, the distribution of the meteorological observatories was uneven among the groups, potentially leading to disparities in the exposure measurements’ precision. The measurement of meteorological indicators covered broad areas, introducing the possibility of Berkson’s error [94]. However, since the study population was divided into climate groups with similar characteristics, the bias associated with this should be considered. It is important to emphasize that the current research was hindered by the absence of higher-quality data, particularly information regarding Indigenous knowledge and social support networks. Moreover, to simplify the calculations, the equal weighting of each indicator was used despite this being a non-conventional approach in vulnerability studies.
The next studies will aim at exploring the role of government policies, emergency response mechanisms, and community engagement in mitigating social vulnerability to cold temperatures, identifying opportunities for improved preparedness, response, and recovery efforts to reduce the disproportionate impacts of cold weather on vulnerable populations.
4.3. Recommendations: Reducing Vulnerability through Adaptation
The current research delves into the social aspects of vulnerability in the context of cold climate challenges in Alaska. The state’s unique climatic conditions and geographical features necessitate targeted and effective policies to mitigate the impacts of extreme cold. Recommendations to increase social adaptivity and reduce social sensitivity, or improve adaptive policy and to help vulnerable people, can include the development of targeted educational programs to enhance cold weather awareness and preparedness, while integrating Indigenous knowledge and cultural practices into adaptive measures; establishment of collaborative platforms for knowledge exchange; the enhancement of infrastructure resilience; the development of community-based early warning systems; and the implementation of community-based support networks to foster resilience. Additionally, promoting affordable and accessible personal protective measures such as specialized clothing and shelters is crucial. To mitigate the elevated risk of frostbite and a substantial drop in skin temperature, particularly in the face and hands, essential protective measures include avoiding prolonged exposure, donning specialized warm clothing, or opting to stay indoors. Indigenous communities and long-term residents in the region have long adhered to these protective practices, demonstrating physiological and behavioral adaptations to cold environments. New arrivals are encouraged to leverage the experiences of these seasoned individuals to effectively navigate and adapt to the challenges posed by the cold climate [56,65,95].
Implementation of these recommendations by policymakers has the potential to amplify the adaptive capacity of individuals in Alaska, ensuring a more robust response to cold-related challenges and bolstering the overall resilience of communities. The findings hold relevance not only for Alaska but also offer insights into improving adaptive policies in other regions facing similar cold climatic adversities.
5. Conclusions
The Extremely Cold Social Vulnerability Index (ECSVI) provides a framework to identify the vulnerability of the population to cold environments. The ECSVI test for the Alaskan Public Health Regions illustrates areas characterized by the maximum severity of weather conditions (Northern and Interior) and those with the best conditions for adaptation to them (Anchorage).
The results will be useful for prioritizing appropriate intervention procedures in the field of health monitoring and adaptation planning in order to minimize population losses and guarantee demographic and social security. Adapting to the reality of climate change and mitigating its effects will require new levels of collaboration between the physical and social sciences. By applying the ECSVI to a particularly vulnerable region such as Alaska, this study may be regarded as a step in that direction.
Alaska, renowned for its extreme cold temperatures and harsh environmental conditions, poses unique challenges to its residents, particularly in the context of social vulnerability. This study investigates the multifaceted dimensions of social vulnerability in the face of cold temperatures across various regions in Alaska. Drawing on a combination of quantitative data analyses, we examine the factors contributing to social vulnerability, including demographic, medical, economic, and geographic elements.
Our analysis reveals that social vulnerability in Alaska is not uniform but varies significantly among regions. These research findings highlight the importance of considering both structural and non-structural factors in understanding and addressing vulnerability. Factors such as income, housing quality, and individual resilience play crucial roles in determining a community’s ability to cope with cold temperatures and extreme weather events.
Ultimately, this research contributes to our understanding of social vulnerability in cold climates and informs the development of targeted strategies and policies to enhance the resilience of Alaskan communities. As cold temperatures are projected to continue to challenge the region, addressing social vulnerability is essential for ensuring the well-being and safety of Alaska’s diverse populations. Social vulnerability is a critical determinant of the impact of cold exposure on individuals and communities. To address this issue comprehensively, policymakers, public health officials, and community organizations must consider a broad range of factors, starting with cold climate, but including income disparities, housing conditions, age, health status, and geographic location. Implementing proactive measures and policies to reduce social vulnerability is essential for safeguarding the well-being of vulnerable populations during cold weather events. Future research should continue to explore the interplay between these factors and develop innovative strategies to enhance cold weather resilience in vulnerable communities.
Author Contributions
Conceptualization, E.A.G. and J.E.W.; methodology, E.A.G.; writing—original draft preparation, E.A.G., J.E.W. and V.A.A.; writing—review and editing, E.A.G., J.E.W. and V.A.A.; visualization, E.A.G. and V.A.A. All authors have read and agreed to the published version of the manuscript.
Funding
The research by E. Grigorieva was funded by the Fulbright Arctic Initiative 2021–2023 and by the German Research Foundation’s (DFG) research grant ‘Menschliches Bioklima in der Arktis im Zeitalter des Klimawandels’ (GR # D.02779.00.331217). J. Walsh was supported by NOAA project NA21OAR4310314. V. Alexeev was supported by the Interdisciplinary Research for Arctic Coastal Environments project through the Department of Energy, Office of Science, Biological and Environmental Research Program’s Regional and Global Model Analysis program, by NOAA project NA18OAR4590417, and NSF grants 2318380, 2040240.
Data Availability Statement
Data are contained within the article.
Acknowledgments
We are grateful to Di Napoli et al. [84] for providing the ERA5-HEAT dataset.
Conflicts of Interest
The authors declare no conflicts of interest.
References
- Report on the Goals and Objectives for Arctic Research 2023–2024 for the US Arctic Research Program Plan United States Arctic Research Commission. United States Arctic Research Commission. (2023). Report on the Goals and Objectives for Arctic Research 2023–2024 for the US Arctic Research Program Plan. Arlington, VA: United States Arctic Research Commission. Available online: https://www.arctic.gov/uploads/assets/arctic-research-2023-2024.pdf (accessed on 4 October 2023).
- Arctic Climate Change Update 2021: Key Trends and Impacts. In Summary for Policy-Makers; Arctic Monitoring and Assessment Programme (AMAP): Tromsø, Norway, 2021; 16p, Available online: https://www.amap.no/documents/doc/arctic-climate-change-update-2021-key-trends-and-impacts.-summary-for-policy-makers/3508 (accessed on 4 October 2023).
- Rantanen, M.; Karpechko, A.Y.; Lipponen, A.; Nordling, K.; Hyvärinen, O.; Ruosteenoja, K.; Vihma, T.; Laaksonen, A. The Arctic has warmed nearly four times faster than the globe since 1979. Commun. Earth Environ. 2022, 3, 168. [Google Scholar] [CrossRef]
- Esau, I.; Pettersson, L.H.; Cancet, M.; Chapron, B.; Chernokulsky, A.; Donlon, C.; Sizov, O.; Soromotin, A.; Johannesen, J.A. The Arctic Amplification and Its Impact: A Synthesis through Satellite Observations. Remote Sens. 2023, 15, 1354. [Google Scholar] [CrossRef]
- Nielsen-Englyst, P.; Høyer, J.L.; Kolbe, W.M.; Dybkjær, G.; Lavergne, T.; Tonboe, R.T.; Skarpalezos, S.; Karagali, I. A combined sea and sea-ice surface temperature climate dataset of the Arctic, 1982–2021. Remote Sens. Environ. 2023, 284, 113331. [Google Scholar] [CrossRef]
- Attanasio, O.; Kitao, S.; Violante, G.L. Global demographic trends and social security reform. J. Monetary Econ. 2007, 54, 144–198. [Google Scholar] [CrossRef]
- Nakashima, D.; Galloway, M.; Thulstrup, H.; Ramos, C.; Rubis, J. Weathering Uncertainty: Traditional Knowledge for Climate Change Assessment and Adaptation; UNESCO: Paris, France; United Nations University: Darwin, Australia, 2012; 120p. [Google Scholar]
- Devlin, M.K.; Grey, M.A. Climate Change Refugees and Public Health Implications. In Good Health and Well-Being. Encyclopedia of the UN Sustainable Development Goals; Leal Filho, W., Wall, T., Azul, A.M., Brandli, L., Özuyar, P.G., Eds.; Springer: Cham, Switzerland, 2020; pp. 91–99. [Google Scholar] [CrossRef]
- Andharia, J. Vulnerability: Its discursive and material nature. In Routledge Handbook of Environmental Hazards and Society; Routledge: London, UK; New York, NY, USA, 2022; pp. 185–200. [Google Scholar] [CrossRef]
- Wisner, B.; Blaikie, P.; Cannon, T.; Davis, I. At Risk: Natural Hazards, Peoples’ Vulnerabilities and Disasters; Routledge: London, UK; New York, NY, USA, 2004. [Google Scholar]
- Birkmann, J.; Cardona, O.D.; Carreño, M.L.; Barbat, A.H.; Pelling, M.; Schneiderbauer, S.; Kienberger, S.; Keiler, M.; Alexander, D.; Zeil, P.; et al. Framing vulnerability, risk and societal responses: The MOVE framework. Nat. Hazards 2013, 67, 193–211. [Google Scholar] [CrossRef]
- Cutter, S.L.; Mitchell, J.T.; Scott, M.S. Revealing the vulnerability of people and places: A case study of Georgetown County, South Carolina. Ann. Assoc. Am. Geogr. 2000, 90, 713–737. [Google Scholar] [CrossRef]
- Cutter, S.L.; Boruff, B.J.; Shirley, W.L. Social Vulnerability to Environmental Hazards. Soc. Sci. Q. 2003, 84, 242–261. [Google Scholar] [CrossRef]
- McCarthy, J.; Canziani, O.; Leary, N.; Dokken, D.; White, K. Climate change 2001: Impacts, adaptation, and vulnerability. In Contribution of Working Group II to the Fourth Assessment Report of the Intergovernmental Panel on Climate Change; Cambridge University Press: Cambridge, UK, 2001; 19p. [Google Scholar]
- Adger, W.N. Vulnerability. Glob. Environ. Change 2006, 16, 268–281. [Google Scholar] [CrossRef]
- Wilhelmi, O.V.; Hayden, M.H. Connecting people and place: A new framework for reducing urban vulnerability to extreme heat. Environ. Res. Lett. 2010, 5, 014021. [Google Scholar] [CrossRef]
- Lorencová, E.K.; Whitham, C.E.L.; Bašta, P.; Harmáčková, Z.V.; Štěpánek, P.; Zahradníček, P.; Farda, A.; Vačkář, D. Participatory climate change impact assessment in three Czech cities: The case of heatwaves. Sustainability 2018, 10, 1906. [Google Scholar] [CrossRef]
- Yoon, D.K. Assessment of social vulnerability to natural disasters: A comparative study. Nat. Hazards 2012, 63, 823–843. [Google Scholar] [CrossRef]
- Fatemi, F.; Ardalan, A.; Aguirre, B.; Mansouri, N.; Mohammadfam, I. Social vulnerability indicators in disasters: Findings from a systematic review. Int. J. Disaster Risk Reduct. 2017, 22, 219–227. [Google Scholar] [CrossRef]
- Ran, J.; MacGillivray, B.H.; Gong, Y.; Hales, T.C. The application of frameworks for measuring social vulnerability and resilience to geophysical hazards within developing countries: A systematic review and narrative synthesis. Sci. Total Environ. 2020, 711, 134486. [Google Scholar] [CrossRef]
- De Pascale, F. The Social Vulnerability Index: A Literature Review. In Geohazards and Disaster Risk Reduction. Advances in Natural and Technological Hazards Research; D’Amico, S., De Pascale, F., Eds.; Springer: Cham, Switzerland, 2023; p. 51. [Google Scholar] [CrossRef]
- Azar, D.; Rain, D. Identifying population vulnerability to hydrological hazards in San Juan, Puerto Rico. GeoJournal 2007, 69, 23–43. [Google Scholar] [CrossRef]
- Zahran, S.; Brody, S.D.; Peacock, W.G.; Vedlitz, A.; Grover, H. Social vulnerability and the natural and built environment: A model of flood casualties in Texas, 1997–2001. Disasters 2008, 32, 537–560. [Google Scholar] [CrossRef]
- Fekete, A. Spatial disaster vulnerability and risk assessments: Challenges in their quality and acceptance. Nat. Hazards 2012, 61, 1161–1178. [Google Scholar] [CrossRef]
- Rufat, S.; Tate, E.; Burton, C.G.; Maroof, A.S. Social vulnerability to floods: Review of case studies and implications for measurement. Int. J. Disaster Risk Reduct. 2015, 14, 470–486. [Google Scholar] [CrossRef]
- Aroca-Jiménez, E.; Bodoque, J.M.; García, J.A. How to construct and validate an Integrated Socio-Economic Vulnerability Index: Implementation at regional scale in urban areas prone to flash flooding. Sci. Total Environ. 2020, 746, 140905. [Google Scholar] [CrossRef]
- Hinojos, S.; McPhillips, L.; Stempel, P.; Grady, C. Social and environmental vulnerability to flooding: Investigating cross-scale hypotheses. Appl. Geogr. 2023, 157, 103017. [Google Scholar] [CrossRef]
- Lapietra, I.; Rizzo, A.; Colacicco, R.; Dellino, P.; Capolongo, D. Evaluation of Social Vulnerability to Flood Hazard in Basilicata Region (Southern Italy). Water 2023, 15, 1175. [Google Scholar] [CrossRef]
- Rygel, L.; O’Sullivan, D.; Yarnal, B. A method for constructing a social vulnerability index: An application to hurricane storm surges in a developed country. Mitig. Adapt. Strat. Glob. Chang. 2006, 11, 741–764. [Google Scholar] [CrossRef]
- Wu, S.Y.; Yarnal, B.; Fisher, A. Vulnerability of coastal communities to sea-level rise: A case study of Cape May County, New Jersey, USA. Clim. Res. 2002, 22, 255–270. [Google Scholar] [CrossRef]
- Boruff, B.J.; Cutter, S.L. The environmental vulnerability of Caribbean island nations. Geogr. Rev. 2007, 97, 24–45. [Google Scholar] [CrossRef]
- Mafi-Gholami, D.; Jaafari, A.; Zenner, E.K.; Kamari, A.N.; Bui, D.T. Vulnerability of coastal communities to climate change: Thirty-year trend analysis and prospective prediction for the coastal regions of the Persian Gulf and Gulf of Oman. Sci. Total Environ. 2020, 741, 140305. [Google Scholar] [CrossRef]
- Wood, N.; Burton, C.; Cutter, S. Community variations in social vulnerability to Cascadia-related tsunamis in the U.S. Pacific Northwest. Nat. Hazards 2010, 52, 369–389. [Google Scholar] [CrossRef]
- Myers, C.A.; Slack, T.; Singlemann, J. Social vulnerability and migration in the wake of disaster: The case of Hurricanes Katrina and Rita. Popul. Environ. 2008, 29, 271–291. [Google Scholar] [CrossRef]
- Johnson, D.; Stanforth, A.; Lulla, V.; Luber, G. Developing an applied extreme heat vulnerability index utilizing socioeconomic and environmental data. Appl. Geogr. 2012, 35, 23–31. [Google Scholar] [CrossRef]
- De Oliveira Mendes, J. Social Vulnerability Indexes as planning tools: Beyond the preparedness paradigm. J. Risk Res. 2009, 12, 43–58. [Google Scholar] [CrossRef]
- Finch, C.; Emrich, C.; Cutter, S. Disaster Disparities and Differential Recovery in New Orleans. In Global Labour in Distress, Volume I. Palgrave Readers in Economics; Goulart, P., Ramos, R., Ferrittu, G., Eds.; Palgrave Macmillan: Cham, Switzerland, 2022. [Google Scholar] [CrossRef]
- Wheeler, A.F.; Conservation, C.V. National Infrastructure and Buildings Climate Change Adaptation State of Play Report. Prepared for the Infrastructure and Buildings Working Group, Part of Canada’s Climate Change Adaptation Platform. 2017. Available online: http://www.ibwgsop.org/assets/IBWG_SOP_Final_-_August_10_2017.pdf (accessed on 4 October 2023).
- Borden, K.A.; Schmidtlein, M.C.; Emrich, C.T.; Piegorsch, W.W.; Cutter, S.L. Vulnerability of US cities to environmental hazards. J. Homel. Secur. Emerg. Manag. 2007, 4, 5. [Google Scholar] [CrossRef]
- Cutter, S.L.; Finch, C. Temporal and spatial changes in social vulnerability to natural hazards. Proc. Natl. Acad. Sci. USA 2008, 105, 2301–2306. [Google Scholar] [CrossRef]
- Modgil, S.; Singh, R.K.; Foropon, C. Quality management in humanitarian operations and disaster relief management: A review and future research directions. Ann. Oper. Res. 2022, 319, 1045–1098. [Google Scholar] [CrossRef] [PubMed]
- Holand, I.; Lujala, P. Replicating and adapting an index of social vulnerability to a new context: A comparison study for Norway. Prof. Geogr. 2013, 65, 312–328. [Google Scholar] [CrossRef]
- Fekete, A. Validation of a social vulnerability index in context to river-floods in Germany. Nat. Hazard Earth Syst. 2009, 9, 393–403. [Google Scholar] [CrossRef]
- Guillard-Goncalves, C.; Cutter, S.; Emrich, C.; Zezere, J. Application of Social Vulnerability Index (SoVI) and delineation of natural risk zones in Greater Lisbon, Portugal. J. Risk Res. 2015, 18, 651–674. [Google Scholar] [CrossRef]
- Chen, W.; Cutter, S.; Emrich, C.; Shi, P. Measuring social vulnerability to natural hazards in the Yangtze River Delta region, China. Int. J. Disaster Risk Sci. 2013, 4, 169–181. [Google Scholar] [CrossRef]
- de Loyola Hummel, B.; Cutter, S.; Emrich, C. Social vulnerability to natural hazards in Brazil. Int. J. Disaster Risk Sci. 2016, 7, 111–122. [Google Scholar] [CrossRef]
- Lloyd, S.; Gray, J.; Healey, S.; Opdyke, A. Social vulnerability to natural hazards in the Philippines. Int. J. Disaster Risk Reduct. 2022, 79, 103103. [Google Scholar] [CrossRef]
- Chakraborty, J.; Montz, B.E.; Tobin, G.A. Population evacuation: Assessing spatial variability in geophysical risk and social vulnerability to natural hazards. Nat. Hazards Rev. 2005, 6, 23–33. [Google Scholar] [CrossRef]
- Szagri, D.; Nagy, B.; Szalay, Z. How can we predict where heatwaves will have an impact?—A literature review on heat vulnerability indexes. Urban Clim. 2023, 52, 101711. [Google Scholar] [CrossRef]
- Nayak, S.; Shrestha, S.; Kinney, P.; Ross, Z.; Sheridan, S.; Pantea, C.; Hsu, W.; Muscatiello, N.; Hwang, S. Development of a heat vulnerability index for New York State. Public Health 2018, 61, 127–137. [Google Scholar] [CrossRef]
- Zuhra, S.S.; Tabinda, A.B.; Yasar, A. Appraisal of the heat vulnerability index in Punjab: A case study of spatial pattern for exposure, sensitivity, and adaptive capacity in megacity Lahore, Pakistan. Int. J. Biometeorol. 2019, 63, 1669–1682. [Google Scholar] [CrossRef]
- Wolf, T.; McGregor, G. The development of a heat wave vulnerability index for London, United Kingdom. Weather Clim. Extremes 2013, 1, 59–68. [Google Scholar] [CrossRef]
- Chow, W.; Chuang, W.-C.; Gober, P. Vulnerability to extreme heat in Metropolitan Phoenix: Spatial, temporal, and demographic dimensions. Prof. Geogr. 2012, 64, 286–302. [Google Scholar] [CrossRef]
- Bradford, K.; Abrahams, L.; Hegglin, M.; Klima, K. A heat vulnerability index and adaptation solutions for Pittsburgh, Pennsylvania. Environ. Sci. Technol. 2015, 49, 11303–11311. [Google Scholar] [CrossRef]
- Oh, K.-Y.; Lee, M.-J.; Jeon, S.-W. Development of the Korean Climate Change Vulnerability Assessment Tool (VESTAP)-centered on health vulnerability to heat waves. Sustainability 2017, 9, 1103. [Google Scholar] [CrossRef]
- Grigorieva, E.A.; Revich, B.A. Health Risks to the Russian Population from Temperature Extremes at the Beginning of the XXI Century. Atmosphere 2021, 12, 1331. [Google Scholar] [CrossRef]
- Demoury, C.; Aerts, R.; Vandeninden, B.; Van Schaeybroeck, B.; De Clercq, E.M. Impact of Short-Term Exposure to Extreme Temperatures on Mortality: A Multi-City Study in Belgium. Int. J. Environ. Res. Public Health 2022, 19, 3763. [Google Scholar] [CrossRef]
- Masselot, P.; Mistry, M.; Vanoli, J.; Schneider, R.; Iungman, T.; Garcia-Leon, D.; Ciscar, J.-C.; Feyen, L.; Orru, H.; Urban, A.; et al. Excess mortality attributed to heat and cold: A health impact assessment study in 854 cities in Europe. Lancet Planet. Health 2023, 7, e271–e281. [Google Scholar] [CrossRef]
- de Schrijver, E.; Royé, D.; Gasparrini, A.; Franco, O.H.; Vicedo-Cabrera, A.M. Exploring vulnerability to heat and cold across urban and rural populations in Switzerland. Environ. Res. Health 2023, 1, 025003. [Google Scholar] [CrossRef] [PubMed]
- Lauta, K.C.; Vendelø, M.T.; Sørensen, B.R.; Dahlberg, R. Conceptualizing cold disasters: Disaster risk governance at the Arctic edge. Int. J. Disaster Risk Reduct. 2018, 31, 1276–1282. [Google Scholar] [CrossRef]
- López-Bueno, J.; Díaz, J.; Navas, M.; Mirón, I.; Follos, F.; Vellón, J.; Ascaso, M.; Luna, M.; Martínez, G.; Linares, C. Temporal evolution of threshold temperatures for extremely cold days in Spain. Sci. Total Environ. 2022, 844, 157183. [Google Scholar] [CrossRef] [PubMed]
- Bieniek, P.A.; Bhatt, U.S.; Thoman, R.L.; Angeloff, H.; Partain, J.; Papineau, J.; Fritsch, F.; Holloway, E.; Walsh, J.E.; Daly, C.; et al. Climate divisions for Alaska based on objective methods. J. Appl. Meteorol. Climatol. 2012, 51, 1276–1289. [Google Scholar] [CrossRef]
- Mölders, N. Outdoor Universal Thermal Comfort Index Climatology for Alaska. Atmos. Clim. Sci. 2019, 9, 558–582. [Google Scholar] [CrossRef]
- Walsh, J.E. Arctic climate change, variability, and extremes. In Arctic Hydrology, Permafrost and Ecosystems; Yang, D., Kane, D.L., Eds.; Springer: Cham, Switzerland, 2021. [Google Scholar] [CrossRef]
- Grigorieva, E.; Alexeev, V.; Walsh, J. Universal Thermal Climate Index in the Arctic in an era of climate change: Alaska and Chukotka as a case study. Int. J. Biometeorol. 2023, 67, 1703–1721. [Google Scholar] [CrossRef]
- Peel, M.C.; Finlayson, B.L.; Mcmahon, T.A. Updated world map of the Köppen–Geiger climate classification. Hydrol. Earth Syst. Sci. 2007, 11, 1633–1644. [Google Scholar] [CrossRef]
- Beck, H.E.; Zimmermann, N.E.; McVicar, T.R.; Vergopolan, N.; Berg, A.; Wood, E.F. Present and future Köppen-Geiger climate classification maps at 1-km resolution. Sci. Data 2018, 5, 180214. [Google Scholar] [CrossRef]
- Allhoff, F.; Golemon, L. Rural Bioethics: The Alaska Context. HEC Forum 2020, 32, 313–331. [Google Scholar] [CrossRef]
- Alaska: 2020 Census. United States Census Buro. 2022. Available online: https://www.census.gov/library/stories/state-by-state/alaska-population-change-between-census-decade.html (accessed on 18 January 2024).
- Social Context Team; Shaw, A.; Kelsey, L.; Doherty, J.; Grigsby, C. Census Bureau 2010–2014; US Census Bureau: Anchorage, CA, USA, 2015. [Google Scholar]
- Bröde, P.; Fiala, D.; Błażejczyk, K.; Holmér, I.; Jendritzky, G.; Kampmann, B.; Tinz, B.; Havenith, G. Deriving the operational procedure for the Universal Thermal Climate Index (UTCI). Int. J. Biometeorol. 2012, 56, 481–494. [Google Scholar] [CrossRef]
- Jendritzky, G.; de Dear, R.; Havenith, G. UTCI—Why another thermal index? Int. J. Biometeorol. 2012, 56, 421–428. [Google Scholar] [CrossRef]
- Blazejczyk, K.; Epstein, Y.; Jendritzky, G.; Staiger, H.; Tinz, B. Comparison of UTCI to selected thermal indices. Int. J. Biometeorol. 2012, 56, 515–535. [Google Scholar] [CrossRef]
- de Freitas, C.R.; Grigorieva, E.A. A comparison and appraisal of a comprehensive range of human thermal climate indices. Int. J. Biometeorol. 2017, 61, 487–512. [Google Scholar] [CrossRef] [PubMed]
- Available online: https://djcoregon.com/news/2001/08/08/alaska-leads-nation-in-homes-that-lack-plumbing/ (accessed on 1 December 2023).
- Available online: https://highlatitudestyle.com/permafrost-can-cause-problems-for-providing-drink-water/ (accessed on 1 December 2023).
- Aten, B.H. Regional Price Parities and Real Regional Income for the United States. Soc. Indic. Res 2017, 131, 123–143. [Google Scholar] [CrossRef]
- Dufour, M.; Labrie, V.; Tremblay-Pepin, S. Using the Market Basket Measure to Discuss Income Inequality from the Perspective of Basic Needs. Soc. Indic. Res. 2021, 155, 455–478. [Google Scholar] [CrossRef]
- Schmidtlein, M.C.; Deutsch, R.C.; Piegorsch, W.W.; Cutter, S.L. A Sensitivity Analysis of the Social Vulnerability Index. Risk Anal. 2008, 28, 1099–1114. [Google Scholar] [CrossRef] [PubMed]
- Hagenlocher, M.; Renaud, F.G.; Haas, S.; Sebesvari, Z. Vulnerability and risk of deltaic social-ecological systems exposed to multiple hazards. Sci. Total Environ. 2018, 631, 71–80. [Google Scholar] [CrossRef] [PubMed]
- C3S (Copernicus Climate Change Service). Near Surface Meteorological Variables from 1979 to 2018 Derived from Bias-Corrected Reanalysis; CDS: 2020 European Centre for Medium-Range Weather Forecasts: Reading, UK. [CrossRef]
- Di Napoli, C.; Barnard, C.; Prudhomme, C.; Cloke, H.L.; Pappenberger, F. Thermal Comfort Indices Derived from ERA5 Reanalysis (Version N.N); Copernicus Climate Change Service (C3S) Climate Data Store (CDS); European Centre for Medium-Range Weather Forecasts: Reading, UK, 2020. [Google Scholar] [CrossRef]
- Hersbach, H.; Bell, B.; Berrisford, P.; Hirahara, S.; Horányi, A.; Muñoz-Sabater, J.; Nicolas, J.; Peubey, C.; Radu, R.; Schepers, D.; et al. The ERA5 global reanalysis. Q. J. R. Meteorol. Soc. 2020, 146, 1999–2049. [Google Scholar] [CrossRef]
- Carmona, R.; Díaz, J.; Mirón, I.J.; Ortíz, C.; León, I.; Linares, C. Geographical variation in relative risks associated with cold waves in Spain: The need for a cold wave prevention plan. Environ. Int. 2016, 88, 103–111. [Google Scholar] [CrossRef]
- Díaz, J.; García, R.; López, C.; Linares, C.; Tobías, A.; Prieto, L. Mortality impact of extreme winter temperatures. Int. J. Biometeorol. 2005, 49, 179–183. [Google Scholar] [CrossRef]
- Pyrgou, A.; Santamouris, M. Probability risk of heat- and cold-related mortality to temperature, gender, and age using GAM regression analysis. Climate 2020, 8, 40. [Google Scholar] [CrossRef]
- Bobb, J.F.; Peng, R.D.; Bel, M.L.; Dominici, F. Heat-related mortality and adaptation to heat in the United States. Environ. Health Perspect. 2014, 122, 811–816. [Google Scholar] [CrossRef]
- López-Bueno, J.A.; Navas-Martin, M.A.; Díaz, J.; Mirón, I.J.; Luna, M.Y.; Sánchez-Martínez, G.; Culqui, D.; Linares, C. Population vulnerability to extreme cold days in rural and urban municipalities in ten provinces in Spain. Sci. Total Environ. 2022, 852, 158165. [Google Scholar] [CrossRef]
- Dudley, J.P.; Hoberg, E.P.; Jenkins, E.J.; Parkinson, A.J. Climate Change in the North American Arctic: A One Health Perspective. EcoHealth 2015, 12, 713–725. [Google Scholar] [CrossRef]
- Harper, S.L.; Wright, C.; Masina, S.; Coggins, S. Climate change, water, and human health research in the Arctic. Water Secur. 2020, 10, 100062. [Google Scholar] [CrossRef]
- Ford, J.D.; Pearce, T.; Canosa, I.V.; Harper, S. The rapidly changing Arctic and its societal implications. Wiley Interdiscip. Rev. Clim. Chang. 2021, 12, e735. [Google Scholar] [CrossRef]
- Kruse, J.; Lowe, M.; Haley, S.; Fay, G.; Hamilton, L.; Berman, M. Arctic observing network social indicators project: Overview. Polar Geogr. 2011, 34, 1–8. [Google Scholar] [CrossRef]
- Vincent, W.F. Arctic Climate Change: Local Impacts, Global Consequences, and Policy Implications. In The Palgrave Handbook of Arctic Policy and Politics; Coates, K.S., Holroyd, C., Eds.; Palgrave Macmillan: Cham, Switzerland, 2020. [Google Scholar] [CrossRef]
- Berkson, J. Are there Two Regressions? J. Am. Stat. Assoc. 1950, 45, 164–180. [Google Scholar] [CrossRef]
- Beatty, B.; Graybill, J.; Grigorieva, E.; Hansen, K.L.; Lohmann, R.; Soikkeli, A. Increasing health and wellbeing for all arctic communities: A community-oriented, non-clinical approach. In Fulbright Arctic Initiative III (2021–2023). Policy Brief; Poelzer, G., Rink, E.L., Eds.; Bureau of Educational and Cultural Affairs, U.S. Department of State: Washington, DC, USA, 2023; pp. 11–12. Available online: https://fulbrightscholars.org/sites/default/files/2023-04/Fulbright_Arctic_Policy_Brief_2023.pdf (accessed on 18 January 2024).
Figure 1.
Selected locations at the Public Health Regions in Alaska.

Figure 2.
A flow chart of research methods.

Figure 3.
Climatic discomfort (CD) for seven Alaskan Public Health Regions: UTCI in categories of very strong and extremely strong thermal stress (below −27 °C). Numbers above bars denote hours for the decade 2010–2019.
Figure 3.
Climatic discomfort (CD) for seven Alaskan Public Health Regions: UTCI in categories of very strong and extremely strong thermal stress (below −27 °C). Numbers above bars denote hours for the decade 2010–2019.

Figure 4.
Components of the social sensitivity block in ECSVI for Alaska, represented in normalized values, where 1—old-age dependency; 2—total civilian non-institutionalized population; 3—occupied housing units: lacking complete plumbing facilities; 4—population for whom poverty status is determined; 5—emergency department visits with upper respiratory infections; 6—population with diseases of the circulatory system.

Figure 5.
Components of the social adaptivity block in ECSVI for Alaska, represented in normalized values, where 1—population of working age; 2—per capita personal income; 3—total housing units with five or more bedrooms; 4—housing units with three or more vehicles available (%); 5—population 25 years and over that are high school graduates (includes equivalency); 6—percent of population with bachelor’s degree or higher.

Figure 6.
Alaskan Public Health Regions: results for evaluation of (a) social sensitivity (SS) and social adaptivity (SA); (b) social block [(SS − SA)/2] (all values normalized). The number (1–7) indicates the rank of each region.
Figure 6.
Alaskan Public Health Regions: results for evaluation of (a) social sensitivity (SS) and social adaptivity (SA); (b) social block [(SS − SA)/2] (all values normalized). The number (1–7) indicates the rank of each region.

Figure 7.
Extremely Cold Social Vulnerability Index (normalized) and its ranking for Alaskan Public Health Regions. The number (1–7) indicates the rank of each region.
Figure 7.
Extremely Cold Social Vulnerability Index (normalized) and its ranking for Alaskan Public Health Regions. The number (1–7) indicates the rank of each region.

Figure 8.
Extremely Cold Social Vulnerability Index (ECSVI) and its components for Alaskan Public Health Regions, where CD—climatic discomfort, with UTCI in categories of very strong and extremely strong physiological strain (below −27 °C); SS—social sensitivity; SA—social adaptivity. The number (1–7) indicates the rank of each region.

Disclaimer/Publisher’s Note: The statements, opinions and data contained in all publications are solely those of the individual author(s) and contributor(s) and not of MDPI and/or the editor(s). MDPI and/or the editor(s) disclaim responsibility for any injury to people or property resulting from any ideas, methods, instructions or products referred to in the content. |
© 2024 by the authors. Licensee MDPI, Basel, Switzerland. This article is an open access article distributed under the terms and conditions of the Creative Commons Attribution (CC BY) license (https://creativecommons.org/licenses/by/4.0/).
Share and Cite
MDPI and ACS Style
Grigorieva, E.A.; Walsh, J.E.; Alexeev, V.A. Extremely Cold Climate and Social Vulnerability in Alaska: Problems and Prospects. Climate 2024, 12, 20. https://doi.org/10.3390/cli12020020
AMA Style
Grigorieva EA, Walsh JE, Alexeev VA. Extremely Cold Climate and Social Vulnerability in Alaska: Problems and Prospects. Climate. 2024; 12(2):20. https://doi.org/10.3390/cli12020020
Chicago/Turabian StyleGrigorieva, Elena A., John E. Walsh, and Vladimir A. Alexeev. 2024. "Extremely Cold Climate and Social Vulnerability in Alaska: Problems and Prospects" Climate 12, no. 2: 20. https://doi.org/10.3390/cli12020020
Note that from the first issue of 2016, this journal uses article numbers instead of page numbers. See further details here.