1. Introduction
1.1. Foehn Wind (FW)
Foehn wind (FW) is a type of dry and hot wind formed by an increase in temperature and a decrease in humidity due to the adiabatic motion of sinking air. FW usually occurs on the lee slope of mountain ranges, which experiences a localized form of air movement caused by a mountainous region [
1]. FW occurs in many mountainous areas around the world, such as the Alps in Europe, the Rockies in America, and the Taihang Mountains in China [
2,
3,
4,
5,
6,
7,
8,
9,
10,
11,
12,
13,
14]. It often poses a threat to local people’s safety, the infrastructure, transportation, agricultural production, etc. In winter, FW is the one of the main factors that contribute to heavy urban pollution [
15,
16,
17].
Urumqi is located on the northern slope of the Central Tianshan Mountains and is the capital of Xinjiang province in China. It is the political, economic, cultural, and transportation center of Xinjiang and has significant regional influence. Urumqi is in a canyon area, surrounded by mountains on three sides, with large differences in terrain. When Urumqi is located at the bottom of a high-pressure system, southeast winds blow, and the airflow is forced by the terrain to sink rapidly after crossing the mountains, causing adiabatic heating of the air and a decrease in humidity. This is the unique FW weather in the Urumqi region [
13,
14,
18,
19,
20]. FW in Urumqi has had a significant impact on local socio-economic development, and thus a thorough investigation and exploration of the activity patterns of FW is urgent.
There has been extensive research on the weather and climate characteristics of FW both domestically and internationally, and the results vary in different regions. Research on the northern slope of the Central Tianshan Mountains shows that the frequency of FW in the urban area of Urumqi is the highest in spring and the lowest in winter. The northern suburb of Urumqi Airport is prone to frequent and high-speed FWs during the morning to noon period, but they occur less frequently with relatively low wind speeds from the afternoon to night, lasting less than 5 h [
19,
20,
21]. Scholars have found that European fine-grid numerical forecasting products can improve the spatiotemporal resolution and forecasting performance in predicting FW in Urumqi [
13,
21]. In addition, some scholars have pointed out that winter FW in Urumqi has a significant impact on the formation and enhancement of boundary layer inversion and plays an important role in the initiation of heavily polluted weather [
15,
16,
17]. However, the above-mentioned studies mostly used short-term data, and the understanding of the spatiotemporal distribution and variation characteristics of the temperature and humidity of Urumqi FW is not detailed or in-depth enough.
1.2. EI Niño
EI Niño Southern Oscillation (ENSO) events refer to the periodic weather phenomena caused by the interaction between the tropical sea surface temperature (SST) and atmospheric circulation in the Pacific region, which have a wide influence on the global climate system. The ENSO event consists of two main stages: EI Niño and La Niña [
22,
23]. El Niño events are closely related to global cooling and warming, as well as droughts and floods, and therefore are of great concern. In recent years, the National Oceanic and Atmospheric Administration (NOAA) of the United States and the National Climate Center of the China Meteorological Administration have used the Oceanic Niño Index (ONI) to define the intensity of El Niño events: 0 ≤ ONI ≤ 0.5 (normal), 0.6 ≤ ONI ≤ 0.9 (weak), 1 ≤ ONI ≤ 1.4 (moderate), 1.5 ≤ ONI ≤ 1.9 (strong), and ONI ≥ 2 (very strong) [
24].
El Niño indirectly affects the weather and climate of Xinjiang. Previous researchers found that the impact of El Niño events on weather and climate is almost global. This impact is significant in Northern Xinjiang and insignificant in Southern Xinjiang. Warm winters and dry springs often occur during El Niño, and precipitation increases as the phenomenon moves away [
25,
26,
27,
28]. However, previous research has mainly focused on the impact of El Niño events on temperature and precipitation in Xinjiang, but there have been few related studies on the impact of El Niño events on FW in the northern slope of the Central Tianshan Mountains.
1.3. Extreme High Temperatures
In Chinese meteorology, a daily maximum temperature reaching or exceeding 35 °C is generally referred to as a high temperature. In 2015, the average temperature in Urumqi was higher than usual. In July, historically rare large-scale, long-term, and high-intensity high-temperature weather swept through the Urumqi region, generating widespread attention [
29,
30]. Some meteorologists have pointed out that an extreme heat event is mainly caused by the strong intensity and eastward position of Iranian subtropical high pressure [
30,
31]. However, no previous research has identified whether southeast winds cause the Foehn wind effect due to the influence of terrain, which also intensifies this high-temperature weather. The understanding of the extreme heat caused by the Urumqi FW is still relatively weak.
Based on observation data from the Urumqi Meteorological Station, this paper analyzes in detail the characteristics of the occurrence frequency, intensity, and temperature and humidity changes during FW weather in Urumqi. In addition, combined with the Oceanic Niño Index and the ERA5 global reanalysis data from the ECMWF, the impact of the El Niño event on FW weather and the effect of FWs on extreme heat weather in Urumqi are analyzed.
2. Study Region, Data, and Methods
2.1. Study Region
The Tianshan Mountains are in the central part of Xinjiang, China, with an average elevation of above 4000 m and stretching for ~2000 km from east to west. Xinjiang is divided into two different climatic zones: Northern Xinjiang and Southern Xinjiang. The Middle Tianshan Valley from Dabancheng to Urumqi runs through the Tianshan Mountains in the southeast–northwest direction. The narrowest part of the Valley has a width of ~15 km, and both ends are very prone to mountain pass winds or downhill storms. Urumqi is located at the opening of the northern end of the Middle Tianshan Valley. The urban area is surrounded by mountains with a height of 1300~5000 m on three sides, and the northern opening faces the Junggar Basin, with a “bell mouth” shape (see
Figure 1). The terrain of the urban area slopes from southeast to northwest, with an average elevation of 800 m and a drop of 300–400 m. When the cold air mass around the Mongolian high-pressure system flows back to the southern slope of the Tianshan Mountains, a pressure gradient across the Tianshan Mountains is easily formed at both ends of the Middle Tianshan Valley, which in turn leads to airflow passing through the Middle Tianshan Valley, invading Urumqi and its downstream areas and easily generating FWs (see
Figure 2).
2.2. Data and Methods
- (1)
Meteorological station observation data. This study selected meteorological variables such as hourly 2 min average, 10 min average, instantaneous, and maximum wind speeds and directions; atmospheric and sea level pressure; temperature; and relative humidity from Urumqi Station from 2008 to 2022.The beginning and end periods of Foehn wind, the duration of FW weather, and the distribution of various meteorological elements over time in Urumqi over the past 15 years were analyzed based on the southeast winds in Urumqi, the conditions in the upper level during the Foehn period, the surface pressure situation of ”high in the south and low in the north”, and the sudden rise/drop in temperature/humidity [
14]. The selection criteria for strong FW are as follows: an instantaneous wind speed ≥ 17 m/s or a 2 min average wind speed ≥ 10.8 m/s. The selection criterion for a Foehn day is as follows: a day with one hour of FW from 20:00 of the current day to 20:00 of the following day. When analyzing the temperature and humidity changes during FW, the hourly temperature/relative humidity change (ΔT/ΔRH) is calculated as the difference between the temperature/relative humidity at the previous and present moment. Using the statistical method, the characteristics of FW in Urumqi were analyzed.
- (2)
The Oceanic EI Niño Index (ONI). The ONI was obtained from the USA National Center for Environmental Prediction (
https://origin.cpc.ncep.noaa.gov/products/analysis_monitoring/ensostuff/ONI_v5.php, accessed on 6 December 2023) and the literature [
24]. There have been three El Niño events in the past 15 years (
Table 1): from June 2009 to April 2010, from October 2014 to April 2016, and from September 2018 to June 2019. The period of October 2014 to April 2016 was regarded as a very strong El Niño event. To match the ONI, a three-month sliding anomaly (DJF, JFM, FMA, MAM, AMJ, MJJ, JJA, JAS, ASO, SON, OND, and NDJ) was calculated for the past 15 years of Urumqi FW days. The relationship between the two parameters was analyzed through the regression analysis and correlation analysis methods.
- (3)
ERA5 reanalysis data. This paper uses ECMWF ERA5 hourly reanalysis meteorological variables with a spatial resolution of 0.25° × 0.25° (including temperature, pressure, and wind speed) to analyze the regional geopotential height field and anomaly field during the extreme heat weather induced by FW. The climate average field refers to the 30-year average from 1991 to 2020.
3. Results
3.1. The Characteristic of FW in Urumqi
3.1.1. The Time Distribution of FW
Annual Distribution Characteristic
In the past 15 years, Urumqi has experienced a total of 3110 h of FW. The annual average duration is 207.3 h; of this, the duration was higher than the average in 5 years, and lower than the average in the remaining 10 years. In 2015, the peak duration of FW reached 346 h, and the lowest was 125 h in 2012 (not shown in tables and figures).
Figure 3 presents the statistics of the number of days of FW in Urumqi from 2008 to 2022; the total number of FW days in the past 15 years is 526, with an annual average of 35.1 days. The maximum and minimum number of FW days is 49 in 2010 and 2015 and 23 in 2021, respectively. In particular, there was strong FW in Urumqi for total of 149 h and 53 days over the past 15 years, and the annual average was 9.9 h and 3.5 days. It is noted that the number of hours (162 h) and days (23 d) of FW in 2012 was lower than for other years, but the duration of strong FW was the highest in nearly 15 years, reaching 24 h. Consequently, the time distribution of FW in Urumqi over the past 15 years has shown a fluctuating pattern. In 2015 (top occurrence frequency of FW in the past 15 years), we have preliminarily found better consistency between the anomaly of diurnal FW days and the variation in the ONI, which was mainly associated with atmospheric circulation anomalies caused by super strong El Niño events. The detailed analysis can be found in
Section 4.
Monthly and Daily Distribution Characteristics
Figure 4 shows the monthly distribution of FW (days and hours) in Urumqi in the past 15 years. In general, the occurrence of FW peaks in spring (March, April, and May) and autumn (September, October, and November), and there are 715 h and 65 days of FW in April (more than other months). FW occurs infrequently, and for about 70 h (30 days) and 73 h (25 days) in summer and winter, especially in February and July, respectively. The duration (hours) of FW in winter is lower than in other seasons, but there is an insignificant difference in the number of days between seasons. It can be inferred that the duration of FW is generally shorter in winter. For example, the duration of FW is 82 h (43 days), indicating that the duration of FW is relatively short in January.
FW dominates in spring and autumn, which is mainly due to the frequent activity of cold air, the high background temperature, and the pressure difference between the south (high) and the north (low) causing the temperature to alternate easily between cold and warm. Therefore, the favorable thermal conditions and special terrain contribute to the high occurrence of FW. In winter, the frequency of FW is relatively low, which is likely due to the existence of a deep inversion layer in the Urumqi area. Meanwhile, FW is blocked by the inversion layer and cannot enter the urban area, and instead blows through the low-altitude area in Urumqi. As a result, FW rarely touches the ground in winter.
In addition, we calculated the daily variation in FW for each month in the past 15 years (
Figure 5). Overall, FW has the highest frequency from 9:00 to 14:00 and the lowest from 21:00 to 02:00 every day, and mainly dominates at 10:00 and 11:00 in April and May (and does not dominate at night in July). At night, there is often a mixed airflow of mountain wind and FW, and distinguishing between the dominant effect of FW and mountain wind is worthy of further discussion.
3.1.2. The Characteristics of FW Speed in Urumqi
FWs in Urumqi are often very strong, causing many disasters. The maximum average 2 min wind speed was 18 m/s at 13:00 on 30 March 2012.
Figure 6 shows the distribution of the annual average FW speed (yellow color) and the annual average wind speed (green color) in Urumqi from 2008 to 2022. Generally, the annual average FW speed (5 m/s) is more than twice the annual average wind speed (2 m/s) in Urumqi. In 2011, 2012, and 2014, the annual average FW speed exceeded 6 m/s, and the lowest wind speed was 3.8 m/s in 2021.
Figure 7 shows the monthly distribution of average wind speed in Urumqi from 2008 to 2022. The maximum monthly average wind speed in Urumqi (green) reached 2.60 m/s, 2.60 m/s, and 2.40 m/s in March, April, and May, and the minimum reached less than 2 m/s in December, January, and February, respectively. Conversely, the yellow line fluctuates more than the green line, which is related to the high frequency of FW in Urumqi. The average wind speeds caused by FW are relatively high in March, April, May, and June (5.92 m/s, 5.95 m/s, 6.05 m/s, and 5.80 m/s), and relatively low in December, January, and July (3.61 m/s, 3.95 m/s, and 4.18 m/s, respectively). The wind speed is often low in winter, and the unique canyon terrain in Urumqi is not conducive to the diffusion of pollutants, which contributes to the severe air pollution in the region.
3.1.3. The Characteristics of Temperature and Relative Humidity of FW in Urumqi
Monthly Distribution of Average Temperature
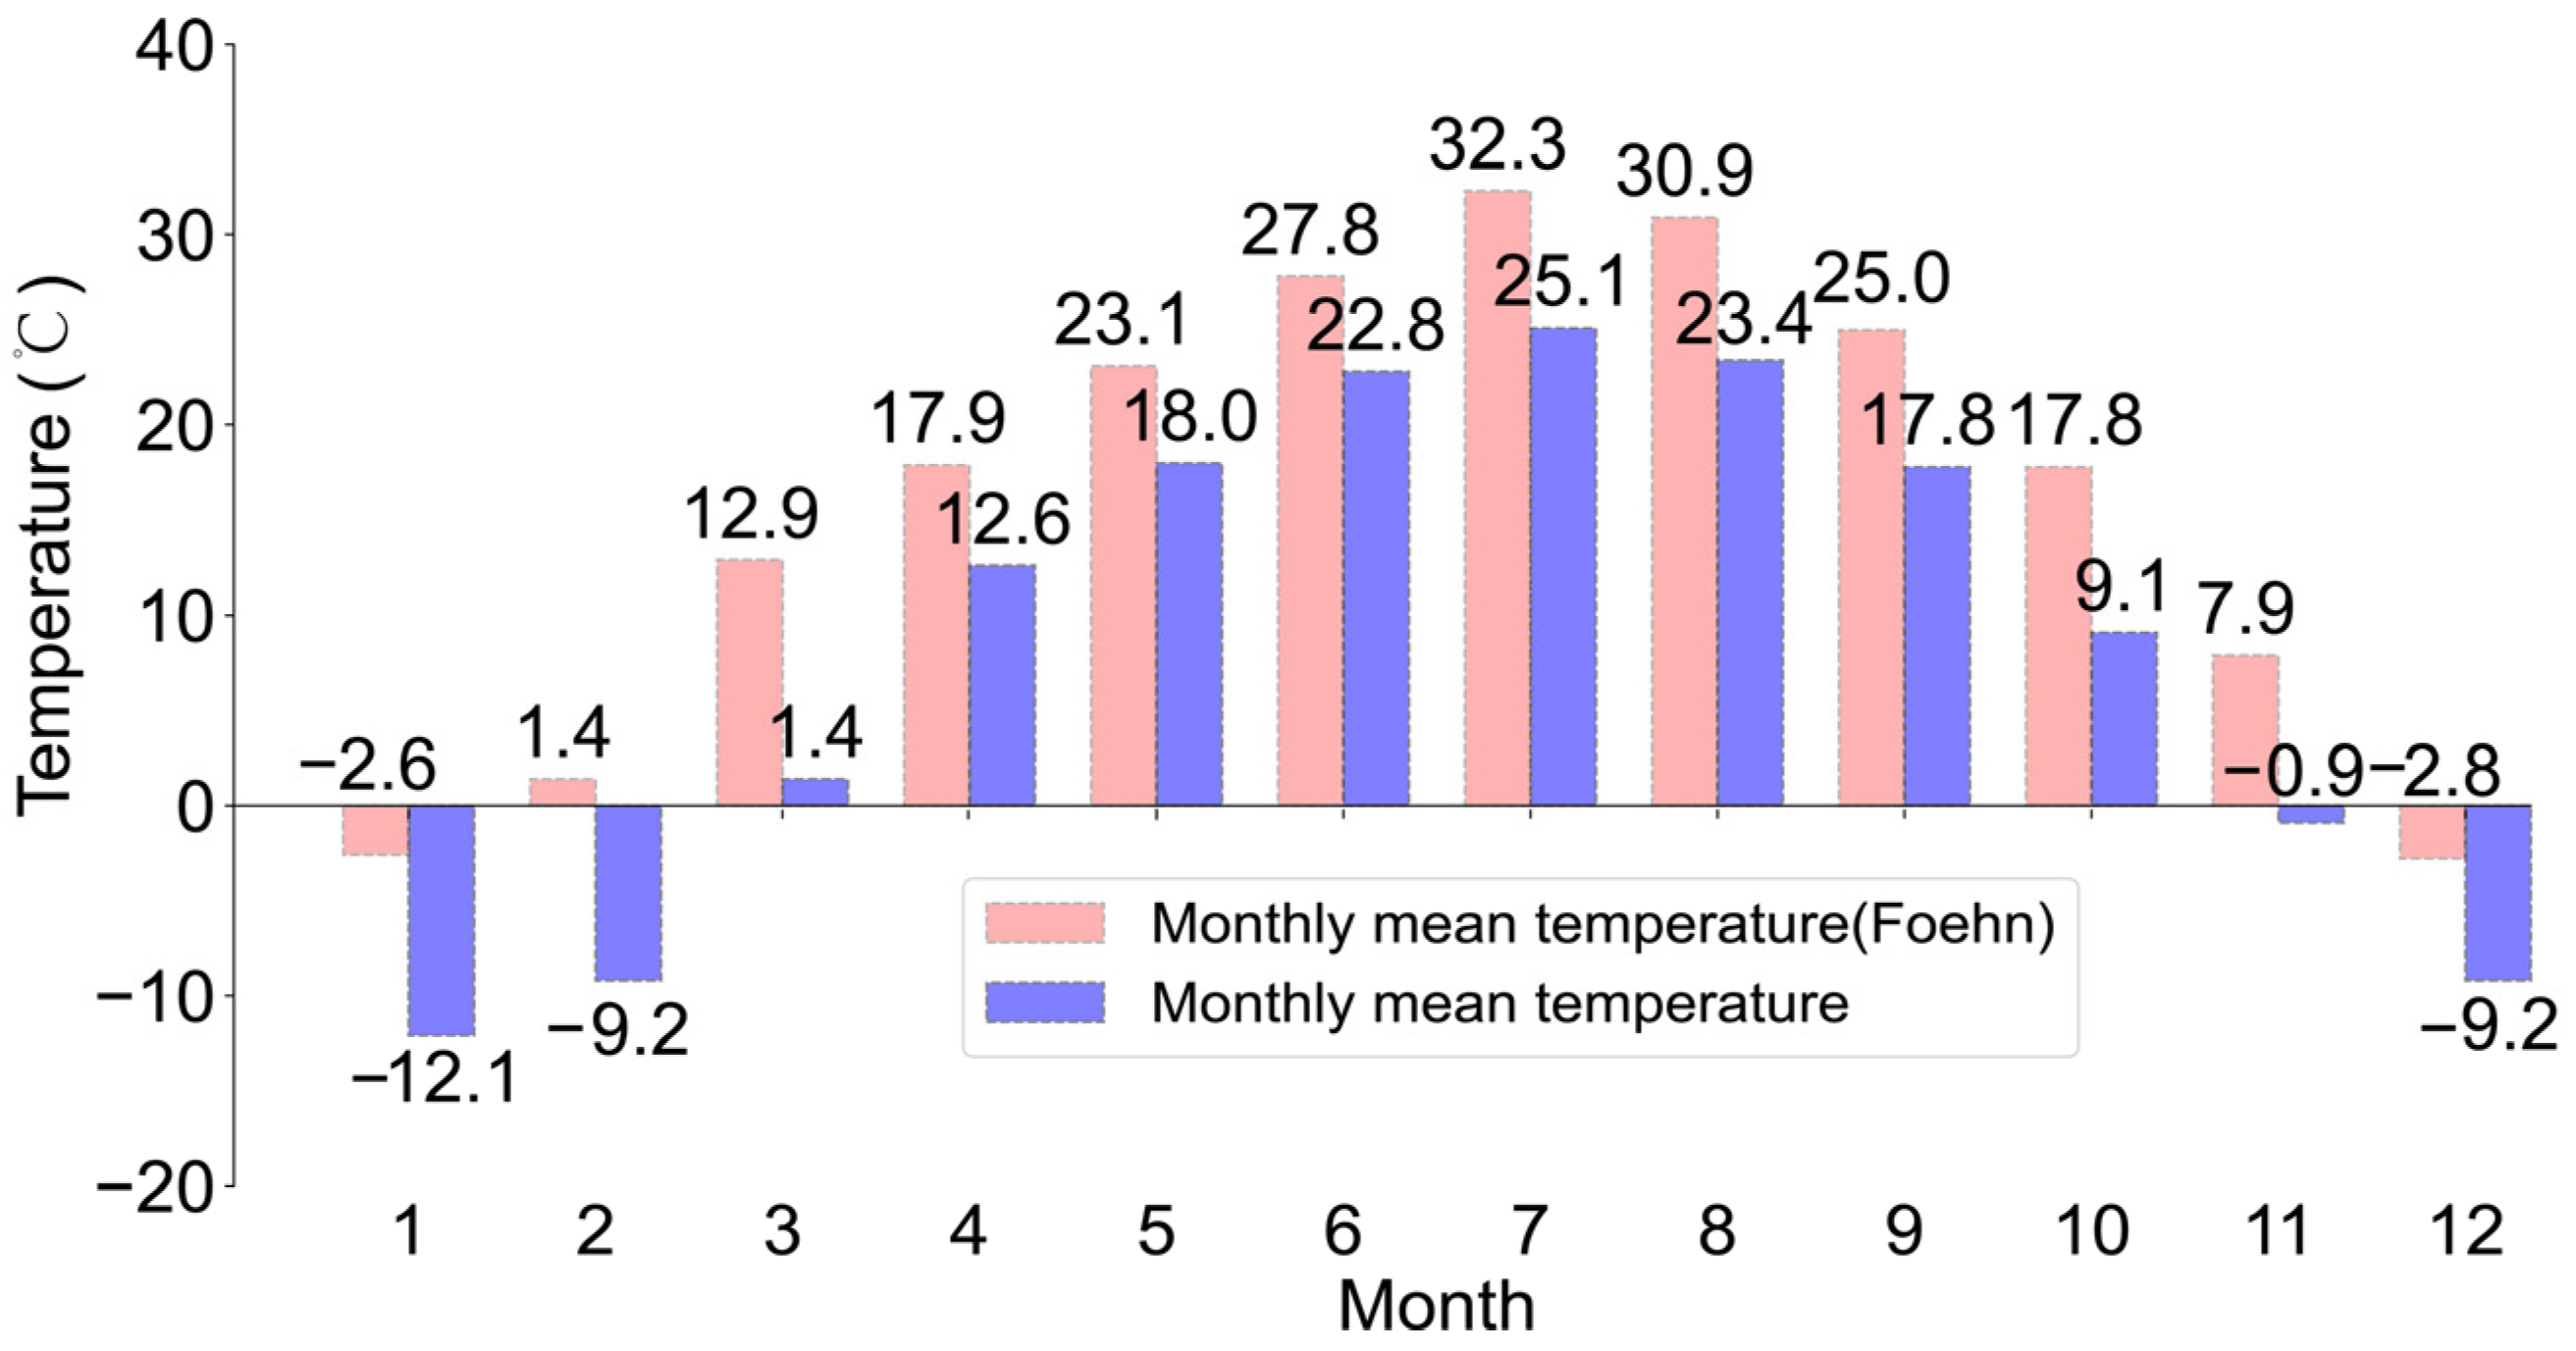
During the FW period, the temperature significantly increases due to adiabatic heating during the movement of air downhill on the leeward slope.
Figure 8 shows that the monthly average temperature over 15 years in Urumqi is generally lower than the temperature of the FW. The average temperature is around 25 °C in the summer in Urumqi, which is lower than the average temperatures of FW of 32.3 °C and 30.9 °C in July and August, respectively. That indicates that FW weather can easily cause high temperatures in Urumqi.
Table 2 also presents the difference in average temperature. The average temperature is −9.2 °C in February, and the average temperature induced by FW reaches 1.4 °C. The most significant average temperature differences, in descending order, are 11.5 °C, 10.6 °C, and 9.5 °C in March, February, and January, and the most insignificant are around 5 °C in April, May, and June, respectively. In addition, there is a relatively large temperature difference of above 8 °C in October and November.
Urumqi has experienced a total of 289 h of high temperature (temperature ≥ 35 °C) in the past 15 years, and 25.3% (73 h) of these are affected by FW weather.
Table 3 summarizes the hours of high temperature during the FW period. The peak is 32 h in 2015, followed by 14 h and 8 h in 2008 and 2022, respectively. The highest temperature of 40.5 °C in Urumqi in the past 15 years occurred at 17:00 on 21 July 2015 (more than 35°C from July 21 to 23). The high-temperature weather corresponded to an FW period, which also intensifies extreme heat. Therefore, the duration of extreme heat exceeded historical extremes in the summer of 2015 in Xinjiang; this also represented one of the top ten weather and climate events in China in 2015. A detailed analysis of the causality of the heat waves in Urumqi on 21 July 2015 is presented in
Section 5.
In summary, the effect of FW on temperature changes is significant in Urumqi and has been shown to cause significant warming and high-temperature weather. Active efforts should be made to prevent the impact of abrupt temperature increases caused by FW.
The Distribution of Temperature and Relative Humidity Changes in FW
Figure 9 shows the variations in the hourly temperature and relative humidity of FW during different seasons in Urumqi in the past 15 years. Overall, the temperature variation presents a positive phase during the FW period, while humidity presents a negative phase. A maximum hourly temperature variation of 15.5 °C occurred in winter on 19 February 2021, when the FW had a southeast direction and a wind speed of 5 m/s at 04:00 a.m., and was interrupted by a northwest wind at 05:00 a.m. The hourly temperature change was very sharp during this process (temperature increased from −7.1 °C at 03:00 a.m. to 8.4 °C at 04:00 a.m., and then dropped to −10.2 °C at 05:00 a.m.). In Urumqi, 15 h of hourly temperatures reaching ≥10 °C total and 177 h of hourly temperatures reaching ≥5 °C were related to FW in the past 15 years. The greatest variation in humidity was a decrease of 63% in spring on March 3, 2013; the relative humidity dropped from 89% at 21:00 p.m. to 26% at 22:00 p.m. The changes in the temperature and relative humidity of FW during the winter period are more significant than in other seasons. The variation in hourly temperature ranged from 0.9 °C to 5.9 °C, and that of relative humidity ranged from −1% to −19%. The variations in hourly temperature and humidity in the other three seasons were similar, with a higher positive temperature change of 13.1 °C in spring and autumn.
In addition,
Figure 10 presents the changes in hourly temperature and humidity of FW at the beginning, duration, and end periods in Urumqi in the past 15 years. At the beginning of FW, the changes in temperature and humidity are relatively severe, with the temperature increasing by 0.4 °C to 6.9 °C and the relative humidity decreasing by −2% to −32%. At the end of FW, the temperature decreases significantly from 5.4 °C to −0.7 °C, and the relative humidity increases from −1% to 23%. The duration of FW shows insignificant changes in temperature and relative humidity, with a slight increase in temperature and a slight decrease in relative humidity.
3.2. The Effect of EI Niño Events on FW in Urumqi
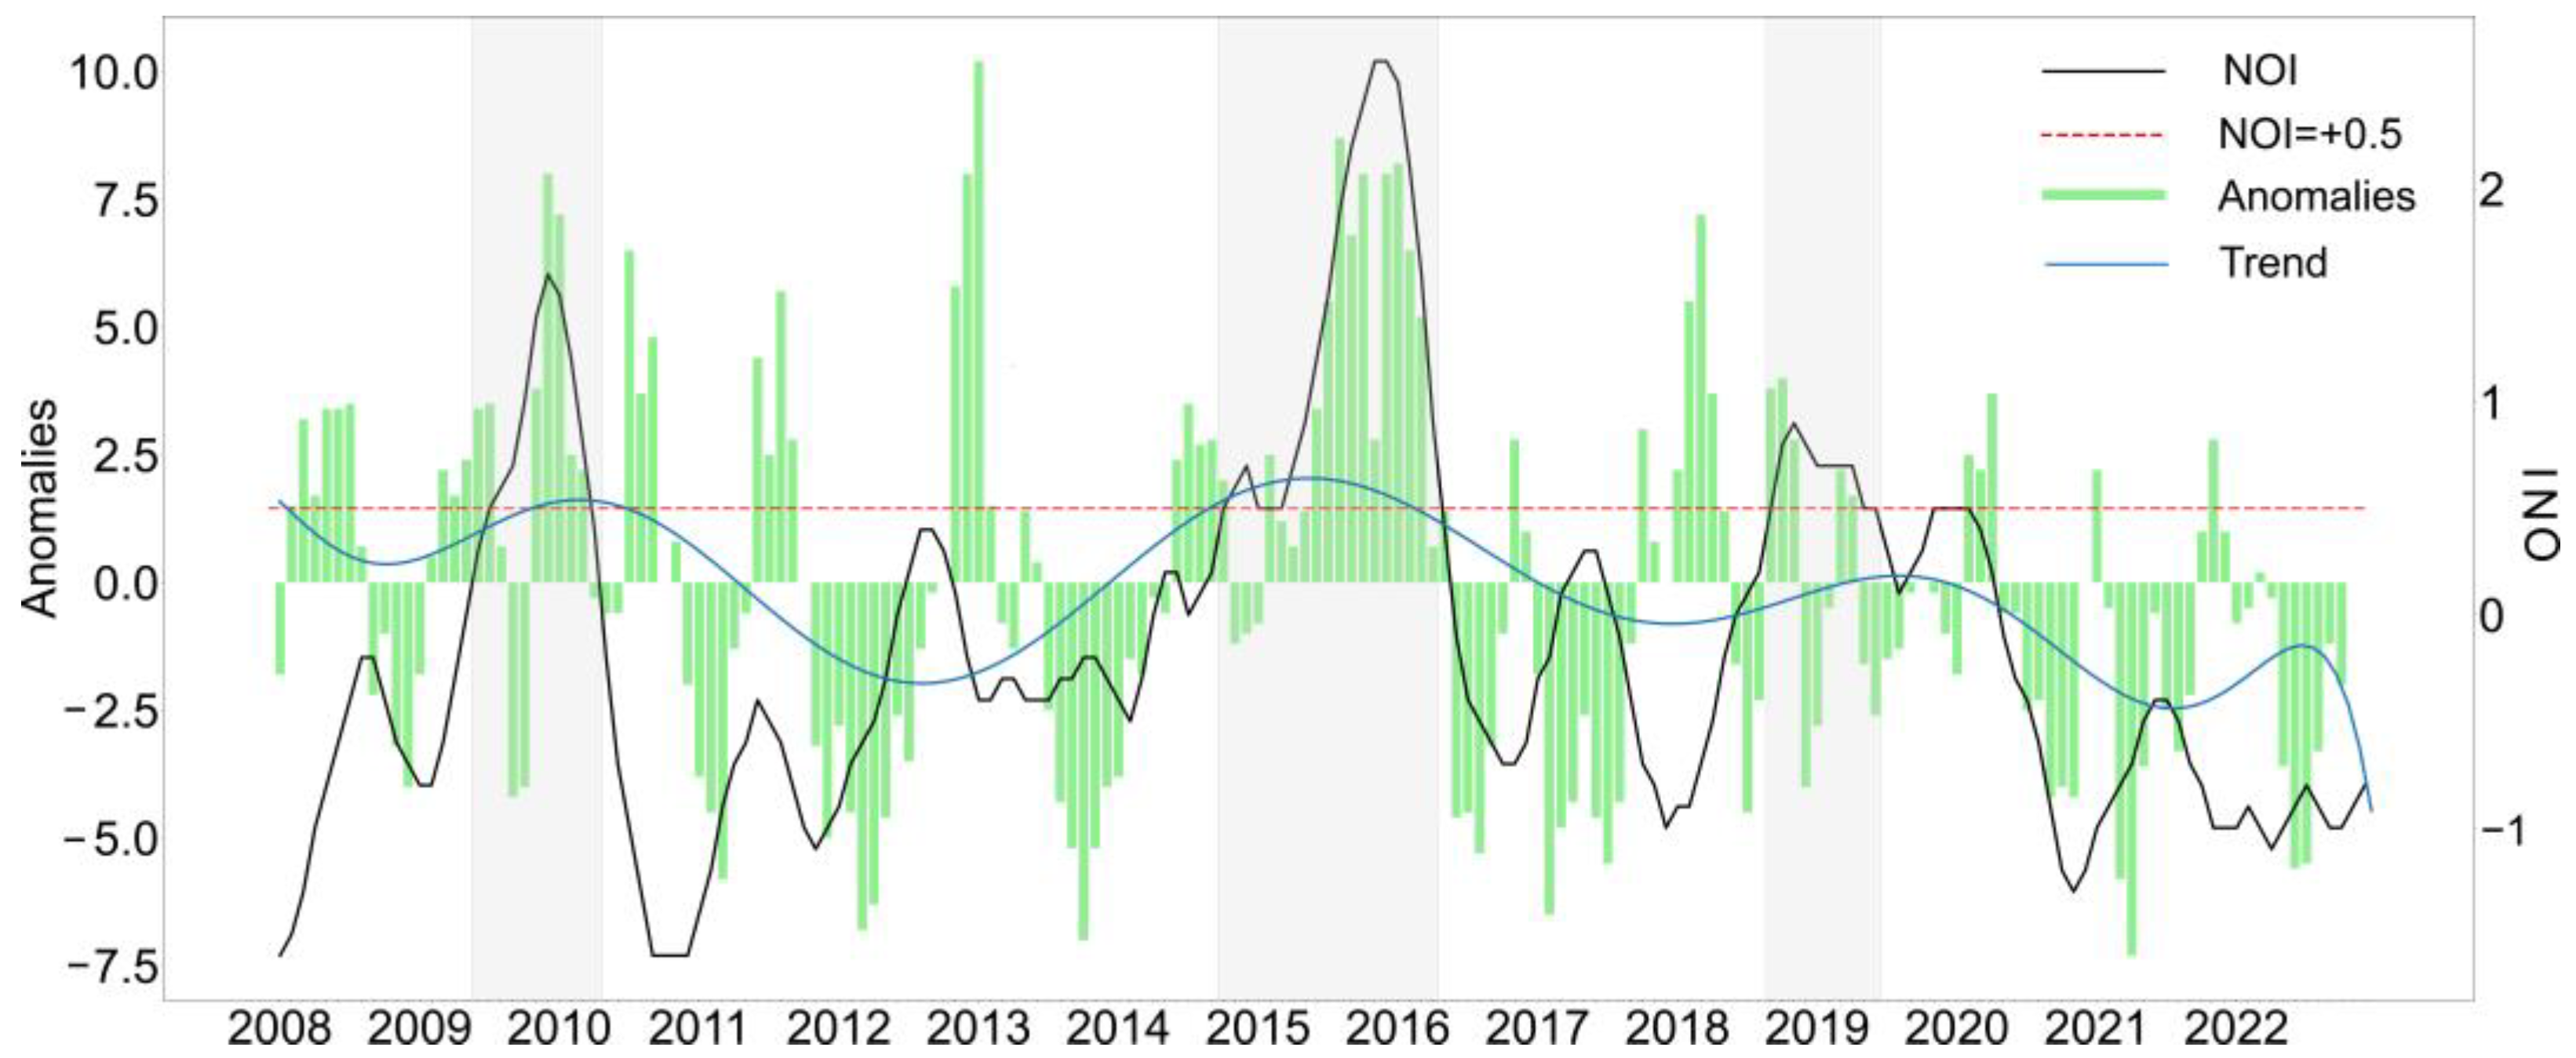
Figure 11 shows the distribution of the ONI and the sliding anomaly of FW days in Urumqi over the past 15 years. Overall, the ONI (black solid line) is consistent with the sliding anomaly trend line (blue solid line) and with the corresponding peak and valley value. The days of FW significantly increased during the three El Niño events from June 2009 to April 2010, October 2014 to April 2016, and September 2018 to June 2019 (
Table 1). In particular, the highest frequency of FW occurred in Urumqi during the super strong El Niño event from October 2014 to April 2016. The above analysis in
Section 3 also found that FW occurred for 346 h and 49 days in 2015, which was more frequent than other years. The periods of moderate El Niño events from June 2009 to April 2010 also present a high frequency of FW, at 230 h and 49 days. The correlation coefficient between the ONI and the anomaly of FW days is 0.71 (at a significance level of 95%; α = 0.05) in Urumqi. This indicates a good correlation between the abnormal occurrence of FW in Urumqi and the corresponding El Niño events.
3.3. Effect of FW Intensifies Heat Waves
A rare heat wave occurred in Urumqi from 21 to 23 July 2015. In
Figure 12, the 500 hPa circulation pattern and anomaly illustrate that an unusually strong Iranian subtropical high pressure is the main factor that caused the rare sustained high temperatures. The high-pressure center and the ridge line on the north side of the high-pressure system are both located over the Xinjiang region, with a strong central intensity. The anomaly center is in the northern region of the high-pressure system, and the variation magnitude exceeds 10 hPa in Northern Xinjiang. Both Northern Xinjiang and the Tianshan Mountains are influenced by the positive anomaly center.
Figure 13 demonstrates the surface circulation pattern. It shows that the low-pressure system in the north and the strong Mongolian high-pressure system in the south of Urumqi form a “high in the south and low in the north” pressure field pattern. Urumqi is located in the southwest of the Mongolian high-pressure system, and FW occurred in the valley area.
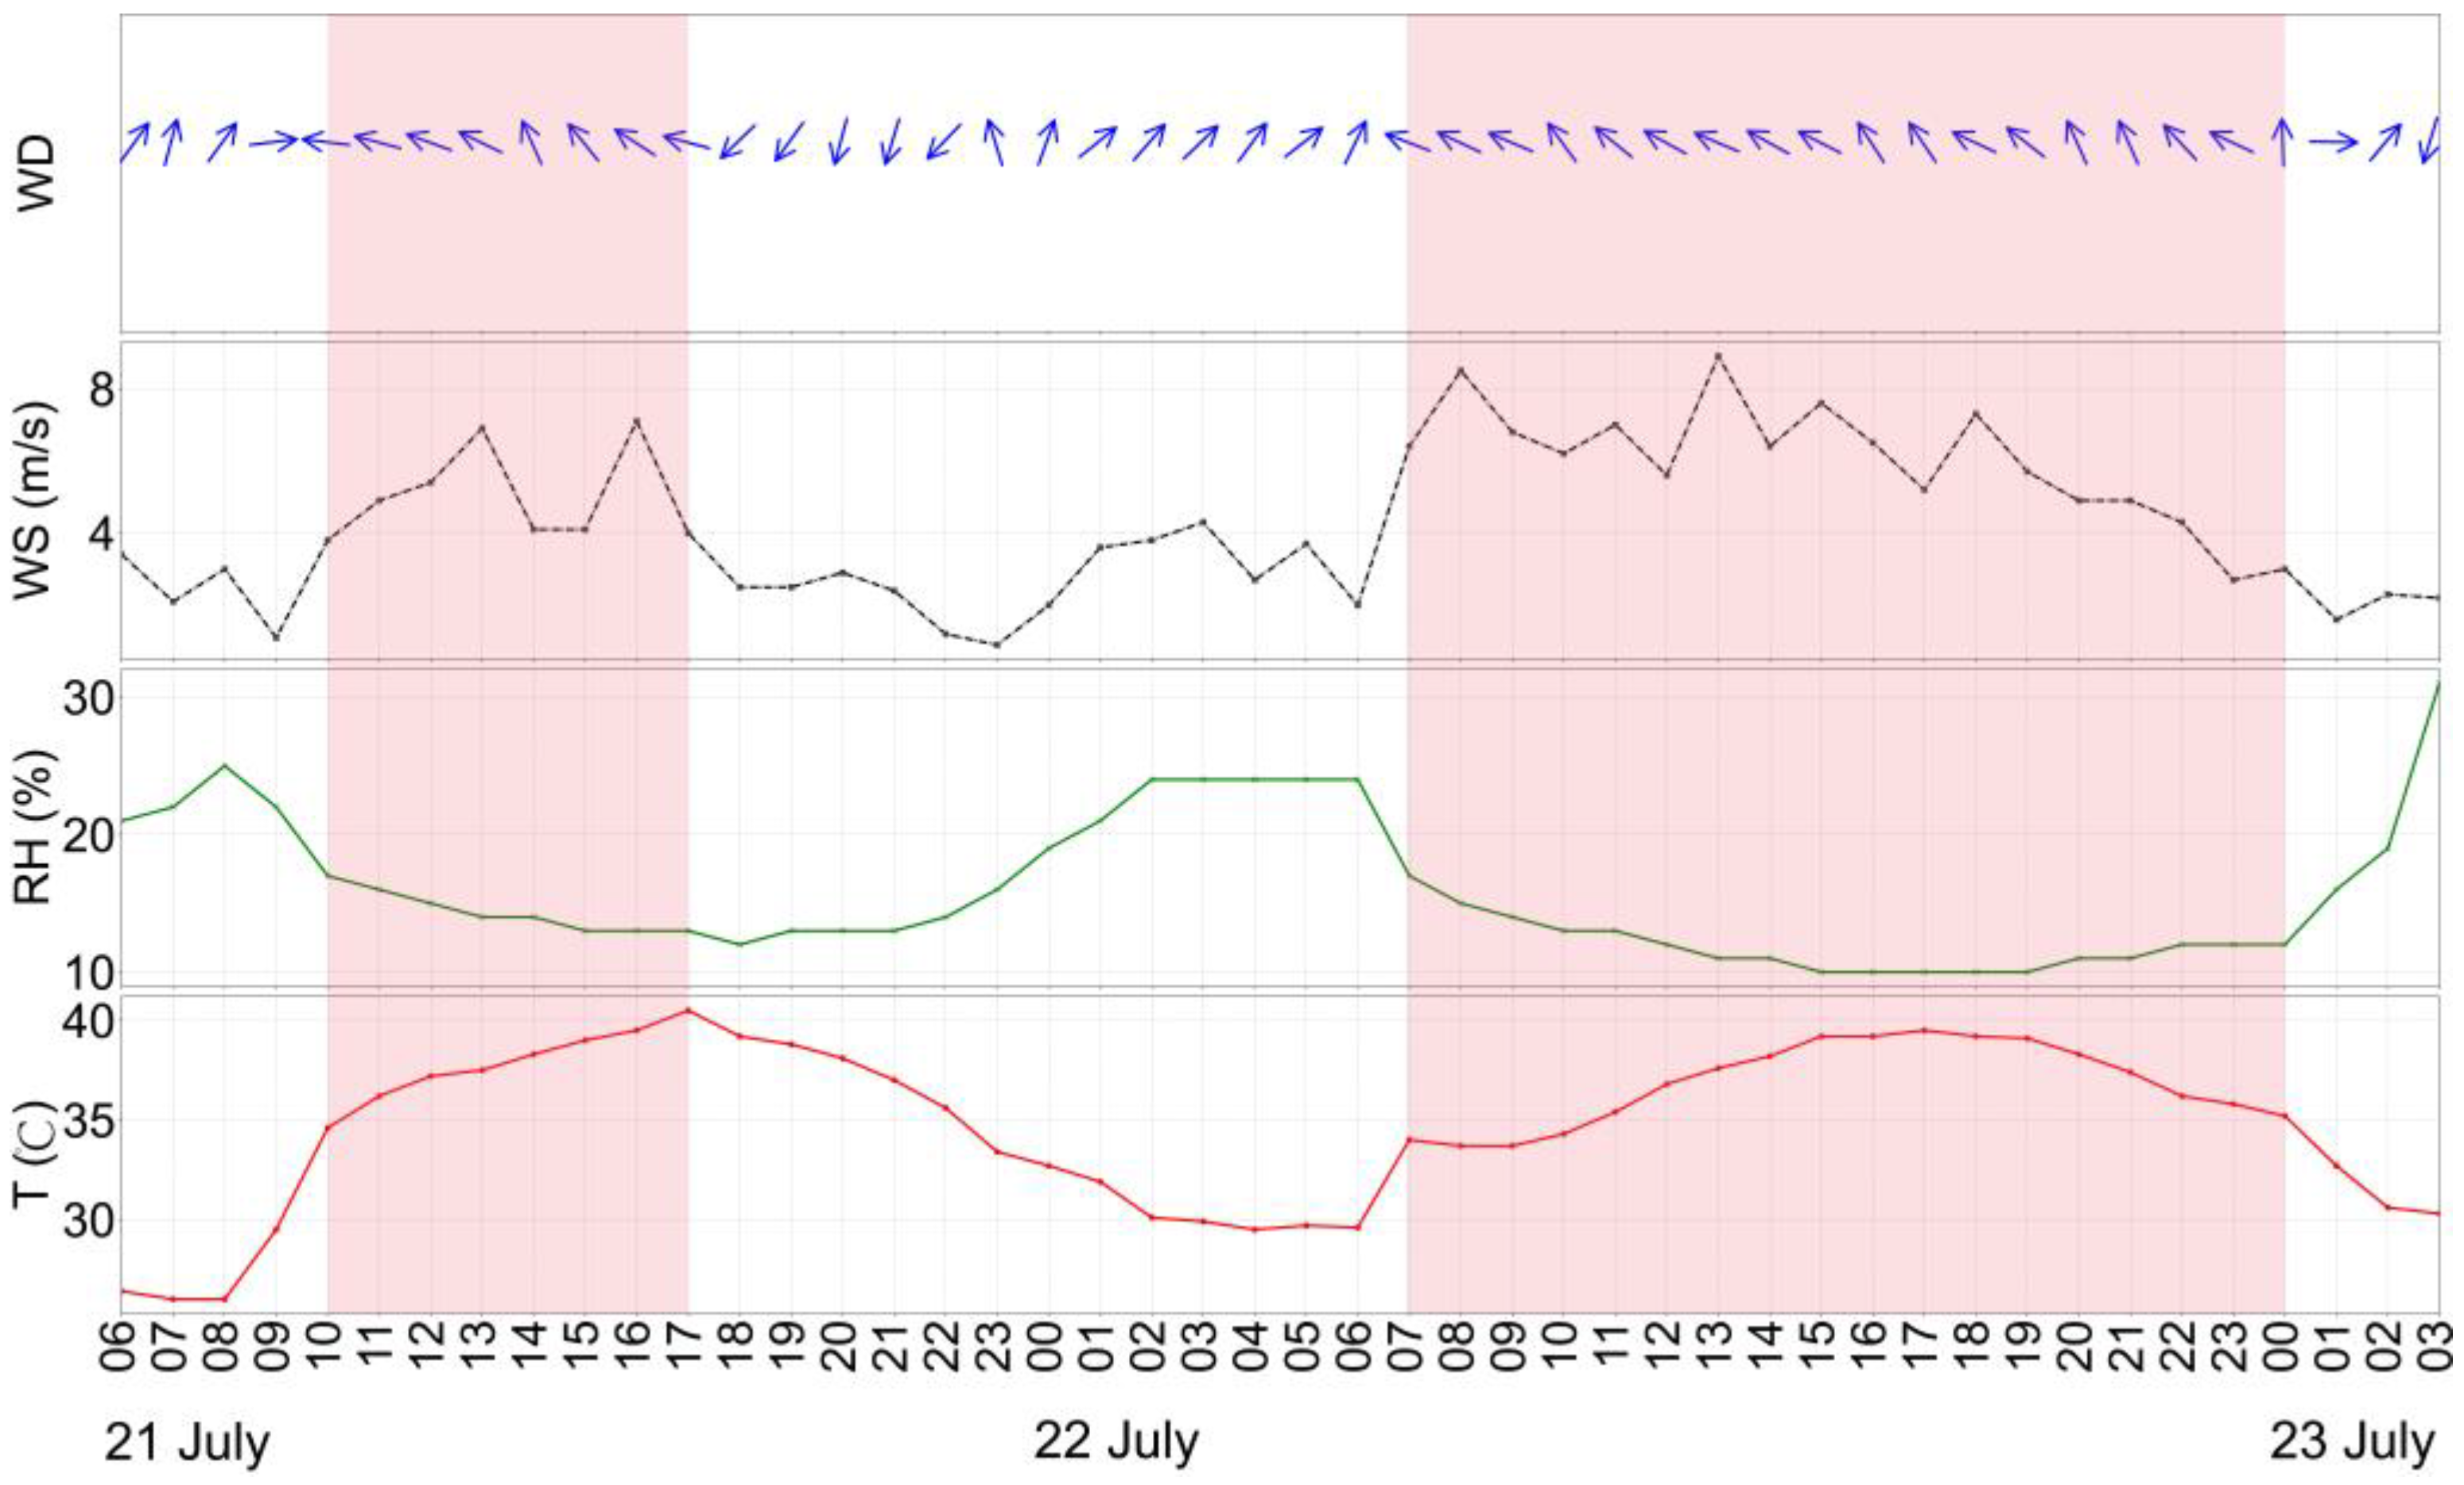
Figure 14 shows the changes in surface meteorological elements in Urumqi from 21 to 23 July 2015. On 21 July 2015, FW began to occur in Urumqi at 10:00 a.m. and ended at 6:00 p.m. At 07:00 a.m. on the 22nd, FW began again and ended at 01:00 a.m. on the 23rd. The temperature reached 40.5 °C on 21 July at 17:00, and the temperature was relatively high from 21 to 23 July. Thus, the high-temperature weather occurred during the period of FW. Generally, the temperature in Urumqi suddenly rises once a FW occurs. Except for the first few hours of the FW, the temperature was usually ≥35 °C (even on the night of the 22nd). The temperature gradually dropped when the FW ended. In addition, the relative humidity was very low (below 20%), and the sky was clear or slightly cloudy, resulting in strong solar radiation during the FW period. Based on this, it can be concluded that the characteristics of a rise in temperature and a decrease in humidity during the FW period aggravate the intensity of heat waves.
Through the analysis of changes in ground meteorological elements and circulation patterns, it has been found that the eastward movement of high pressure in Xinjiang is the direct cause of this high temperature process, which is consistent with previous research [
29,
30,
31]. In addition, Urumqi is located in the southwestern part of the Mongolian high-pressure system. When FW blows along the ground, the airflow is forced to sink rapidly by the terrain after crossing the mountain, causing adiabatic warming of the air. During FW periods, the relative humidity decreases, the air becomes dry, and the weather is clear, which are all conducive to local radiation warming. Therefore, the high-temperature weather process is also significantly affected by the FW effect. In summary, three factors contribute to these heat waves: an abnormally strong Iranian subtropical high pressure, the FW effect, and radiation heating.
4. Discussion
FW has brought many disasters to the local area in Urumqi due to its high wind speed and dry and hot characteristics. In the spring and autumn seasons, FW occurs frequently and with high wind speeds, which often cause strong wind disasters in the area. The low FW speeds and high emissions of pollutants from winter heating are meteorological conditions that are not conducive to the diffusion of local pollutants in winter. Therefore, severe pollution easily occurs during winter FW periods. In summer, the airflow loses moisture on the windward slope and becomes dry. After crossing the mountain, airflow is forced to sink rapidly due to the terrain, causing adiabatic warming of the air. In the meantime, the weather is generally fair or slightly cloudy, which is favorable to local radiation warming during the FW period. Therefore, Urumqi is prone to high-temperature weather, which is related to the FW in summer. It has been noted that FW has different impacts on the local area in different seasons, so it is necessary to comprehensively monitor and forecast FWs.
Previous studies have shown that Xinjiang mostly experienced warm winters and dry springs during the El Niño period. This study found that the frequency of FW in Urumqi was relatively high during the El Niño period. The highest number of FW days and the highest temperatures in the past 15 years occurred during the strong El Niño event in 2015. During an El Niño period, the air–sea interaction causes abnormal atmospheric circulation, resulting in frequent and strong FW in Urumqi. In summer, FW also further intensifies high-temperature weather. Therefore, it is necessary to pay more attention to FW weather and prevent the occurrence of strong winds and extreme high temperatures in Urumqi during the El Niño period.
FW processes differ in different regions of the northern slopes of the Middle TianShan Mountains. In this paper, we used the data from Urumqi meteorological stations to determine the characteristics of FW speed, temperature, and humidity changes during FW in the last 15 years. Currently, more than 60 ground-based automatic meteorological stations have been deployed in and around Urumqi, providing valuable basic data for monitoring and early warning of FW in complex terrain. Our next step will be to classify the intensity of the FW process based on these 60 stations’ long-term data to carry out a more detailed statistical analysis of FW at different stations by year, season and month, so as to more comprehensively reveal the distribution characteristics and change rules of different-intensity FWs on the north slope of the Middle Tianshan Mountains in China.
5. Conclusions
This article uses hourly ground meteorological data to analyze the annual, monthly, and daily variations in FW in Urumqi over the past 15 years, as well as the annual and monthly variations in the speed of FWs. A comparative analysis is also conducted on the difference between the monthly average temperature and the monthly average temperature during FW periods in Urumqi. In addition, the characteristics of changes in hourly temperature and relative humidity are investigated during the FW period. Using reanalysis data and the Oceanic Niño Index, the impact of the El Niño event on FW and the heat waves caused by the FW process is primarily discussed and verified. The specific conclusions are as follows:
- (1)
The annual distribution of FW days in Urumqi in the past 15 years presents a fluctuating pattern. The highest numbers of FW days occurred in 2010 and 2015, and the lowest number occurred in 2012; this year also had the most hours of strong FWs. The monthly distribution of FW dominates in spring (March, April, and May) and autumn (September, October, and November), with the lowest occurrence in February and July. The daily distribution of FW shows the highest frequency from 09:00 a.m. to 14:00 p.m.; in particular, the highest occurrence was at 10:00 a.m. and 11:00 a.m. in April and May.
- (2)
The annual average wind speed of ~2 m/s in Urumqi is much lower than the values of ~5 m/s during the FW period. In 2011, 2012, and 2014, the average FW speed exceeded 6 m/s, and the wind speed was the lowest at 3.8 m/s in 2021. The monthly average FW speed is higher in March, April, May, and June, while it is lower in December, January, and July.
- (3)
A significant impact of FW on temperature changes in Urumqi is found. The monthly average temperature is lower than that during the FW period, and the most significant temperature differences are 11.5 °C, 10.6 °C, and 9.5 °C in March, February, and January, respectively. This indicates that FW can easily cause high-temperature weather in summer. There was a total of 289 h of high temperature in Urumqi in the past 15 years, and 25.3% (73 h) were affected by FW weather. The highest number of hours of high temperature of 32 occurred in 2015.
- (4)
Through observational analysis, we confirmed that FW causes significant warming and reductions in humidity. The most significant temperature and relative humidity changes related to FW occurred in winter compared to other seasons. At the beginning of FWs, the changes in temperature and humidity are relatively severe, with the temperature increasing by 0.4 °C to 6.9 °C, and the relative humidity decreasing by −2% to −32%. At the end of FWs, the temperature decreases significantly from 5.4 °C to −0.7 °C, and the relative humidity increases significantly from −1% to 23%. During FW, there are insignificant changes in temperature and relative humidity, with a slight increase in temperature and a slight decrease in relative humidity.
- (5)
The abnormal occurrence of FW in Urumqi is consistent with EI Niño periods, with a correlation coefficient of 0.71.
- (6)
Urumqi experienced a heat wave from 21 to 23 July 2015, and the highest temperature reached 40.5 °C. Three factors contribute to the extreme high-temperature weather: the abnormally strong subtropical high pressure in Iran, the FW effect, and radiation heating. The effect of FW on intensifying extreme high temperatures cannot be ignored.
Author Contributions
Conceptualization, M.A., Q.H. and X.L.; data curation, M.A., Y.M. and S.L.; formal analysis, M.A., X.L. and Q.H.; funding acquisition, S.L. and Y.Z.; investigation, M.A., K.C., S.L. and Y.Z.; methodology, M.A. and X.L.; project administration, M.A.; resources, M.A., X.L. and K.C.; software, M.A. and Y.M.; supervision, X.L. and Q.H.; validation, M.A. and X.L.; visualization, M.A., X.L., Q.H. and Y.M.; writing—original draft, M.A. and X.L.; writing—review and editing, M.A. and X.L. All authors have read and agreed to the published version of the manuscript.
Funding
This research was funded by the National Natural Science Foundation of China (Grant No. 42205010) and the Xinjiang Meteorological Bureau Science and Technology Innovation Development Fund Project (MS202303).
Institutional Review Board Statement
Not applicable.
Informed Consent Statement
Not applicable.
Data Availability Statement
The data used in this paper can be provided by M.A. (
[email protected]) upon request.
Conflicts of Interest
The authors declare no conflicts of interest.
References
- Brinkmann, W. What is a foehn? Weather 1971, 26, 230–239. [Google Scholar] [CrossRef]
- Seibert, R. South foehn studies since the ALPEX experiment. Meteorol. Atmos. Phys. 1990, 43, 91–103. [Google Scholar] [CrossRef]
- Lentink, H.S. Extreme foehn in Switzerland: A Climatology and the Relation to Large Scale Flow. Master’s Thesis, University Utrecht, Utrecht, Switzerland, 2012; pp. 1–65. Available online: https://studenttheses.uu.nl/handle/20.500.12932/15889 (accessed on 20 December 2023).
- Richner, H.; Gutermann, T. Statistical analysis of foehn in Altdorf, Switzerland. In Proceedings of the International Conference on Alpine Meteorology, Chamb’ery, France, 1 January 2007; pp. 457–460. [Google Scholar]
- Richner, H.; Hächler, P. Understanding and Forecasting Alpine Foehn. In Mountain Weather Research and Forecasting; Springer Atmospheric Sciences: Berlin/Heidelberg, Germany, 2013; pp. 219–260. [Google Scholar]
- Vergeiner, J. South Foehn Studies and a New Foehn Classification Scheme in the Wipp and Inn Valley. Ph.D. Thesis, University of Innsbruck, Innsbruck, Austria, 2004; pp. 1–111. [Google Scholar]
- Mayr, G.J.; Armi, L.; Arnold, S.; Banta, R.M.; Darby, L.S.; Durran, D.D.; Flamant, C.; Gaberšek, S.; Gohm, A.; Mayr, R.; et al. Gap flow measurements during the Mesoscale Alpine Programme. Meteorol. Atmos. Phys. 2004, 86, 99–119. [Google Scholar] [CrossRef]
- Nishi, A.; Kusaka, H. Future changes of the extreme high-temperature events influenced by foehn winds in Niigata, Japan. Atmos. Sci. Lett. 2023, 24, e1137. [Google Scholar] [CrossRef]
- Zhao, S.L.; Wang, R.K.; Guo, Y.B.; Tan, J.L.; Shi, Z.Z. The Foehn in the Middle Rang of Taihang Mountain. Meteor Mon. 1993, 19, 3–6. [Google Scholar]
- Wang, Z.; Ding, Y.; Zhang, Y.; Fan, J.; Zhang, S.; Tian, L. Statistical Characteristics and Mechanism Analysis of Foehn Weather in the Eastern Foothills of Taihang Mountain II: Case analysis of the influence of leeward wave on the generation and propagation of Foehn wind. Plateau Meteorol. 2012, 31, 555–561. [Google Scholar]
- Li, D.; Zhang, Q.; He, K.; Sun, J.; Zhao, Z. Analysis of Temporal and Spatial Characteristics of Foehn in Xingtai City. J. Agric. Catastrophol. 2022, 12, 122–124. [Google Scholar] [CrossRef]
- Zhao, Z.; Ma, H.; Ding, Z.; Xu, Y. The Influence of the Foehn Wind on the Temperature of Baoding Area. Shanxi Sci. Technol. 2016, 31, 88–91. [Google Scholar] [CrossRef]
- Maulen, A.; Li, X.; Wang, S.; Mu, S.; Li, S.; Zhong, Y. Temporal and Spatial Characteristics of Foehn on the North Slope of the Tianshan Mountains of China and Prediction Ability of European Fine Grid Numerical Products. Mt. Res. 2022, 40, 823–834. [Google Scholar] [CrossRef]
- Ayitikan, M.; Li, X.; He, Q.; Musha, Y.; Tang, H.; Li, S.; Zhong, Y.; Ren, G. Characteristics and Establishment of Objective Identifification Criteria and Predictors for Foehn Winds in Urumqi, China. Atmosphere 2023, 14, 1206. [Google Scholar] [CrossRef]
- Li, X.; Zhao, K.; Zhong, S.; Yu, X.; Feng, Z.; Zhong, Y.; Maulen, A.; Li, S. Evolution of Meteorological Conditions during a Heavy Air Pollution Event under the Influence of Shallow Foehn in Urumqi, China. Adv. Atmos. Sci. 2023, 40, 29–43. [Google Scholar] [CrossRef]
- Li, X.; Xia, X.; Zhong, S.; Luo, L.; Yu, X.; Jia, J.; Zhao, K.; Li, N.; Liu, Y.; Ren, Q. Shallow foehn on the northern leeside of Tianshan Mountains and its influence on atmospheric boundary layer over Urumqi, China—A climatological study. Atmos. Res. 2020, 240, 104940. [Google Scholar] [CrossRef]
- Li, X.; Xia, X.A.; Wang, L.; Cai, R.; Zhao, L.; Feng, Z.; Ren, Q.; Zhao, K. The role of foehn in the formation of heavy air pollution events in Urumqi, China. J. Geophys. Res. Atmos. 2015, 120, 5371–5384. [Google Scholar] [CrossRef]
- Zhang, J.; Su, Q.; Sun, S. Xinjiang Short-Term Weather Forecast Guidebook; Urumqi, Xinjiang People’s Publishing House: Urumqi, China, 1986; pp. 341–347. [Google Scholar]
- Diao, P. The statistical characteristics and forecast of southeast gale in Urumqi in spring. Xinjiang Meteorol. 1991, 14, 16–18. [Google Scholar]
- Meng, Q.; Lyu, B.; Diao, P. Research on the Distribution Law of Southeast Gale in Urumqi Area. Xinjiang Meteorol. 1995, 18, 6–10. [Google Scholar]
- Wan, Y.; Cao, X.; Dou, X.; Lu, H. The Application of ECMWF Refined Net Numerical Forecast Data in the Southeast Gale in Urumqi. Desert Oasis Meteorol. 2014, 8, 32–38. [Google Scholar] [CrossRef]
- Berknes, J. Atmospheric teleconnections from the equatorial Pacific. Mon. Weather Rev. 1969, 97, 163–172. [Google Scholar] [CrossRef]
- Cane, M.A.; Zebiak, S.E. A theory for El Niño and the Southern Oscillation. Science 1985, 228, 1085–1087. [Google Scholar] [CrossRef]
- Zhao, Z.C.; Luo, Y.; Huang, B. Global warming and El Niño events. Clim. Chang. Res. 2023, 19, 663–666. [Google Scholar] [CrossRef]
- Lian, T.; Chen, D.; Tang, Y.; Wu, Q. Effects of westerly wind bursts on El Niño: A new perspective. Geophys. Res. Lett. 2014, 41, 3522–3527. [Google Scholar] [CrossRef]
- Lian, T.; Wang, J.; Chen, D.; Liu, T.; Wang, D. A strong 2023/24 El Niño is staged by tropical Pacific Ocean heat content buildup. Ocean-Land-Atmos. Res. 2023, 2, 0011. [Google Scholar] [CrossRef]
- Huang, B.; Thorne, P.W.; Banzon, V.F.; Boyer, T.; Chepurin, G.; Lawrimore, J.H.; Menne, M.J.; Smith, T.M.; Vose, R.S.; Zhang, H.M. Extended Reconstructed Sea Surface Temperature version 5 (ERSSTv5), upgrades, validations, and intercomparisons. J. Clim. 2017, 30, 8179–8205. [Google Scholar] [CrossRef]
- Ren, H.-L.; Lu, B.; Wan, J.; Tian, B.; Zhang, P. Identification standard for ENSO events and its application to monitoring and prediction in China. China J. Meteorol. Res. 2018, 32, 923–937. [Google Scholar] [CrossRef]
- Lei, Y.-N.; Gong, D.-Y.; Zhang, Z.-Y.; Guo, D.; He, X.-Z. Spatial-temporal characteristics of high-temperature events in summer in eastern China and the associated atmospheric circulation. Geogr. Res. 2009, 28, 653–662. [Google Scholar] [CrossRef]
- Mao, W.; Chen, P.; Shen, Y. Characteristics and effects of the extreme maximum air temperature in the summer of 2015 in Xinjiang under global warming. J. Glaciol. Geocryol. 2016, 38, 291–304. [Google Scholar] [CrossRef]
- Zhang, L.; Zhang, T.; Mao, W.; Si, J.; Zhang, T.; Wang, S. Analysis of the upper-air temperature change in Xinjiang region. Arid Zone Res. 2021, 38, 133–143. [Google Scholar]
Figure 1.
A sketch of the topography of Urumqi.
Figure 1.
A sketch of the topography of Urumqi.
Figure 2.
Typical Foehn Wind events in Urumqi. Changes in surface meteorological elements in Urumqi from 27 to 28 October 2020. The pink shaded area represents the Foehn wind period.Green line represents relative humidity; black line is pressure; red line is temperature.
Figure 2.
Typical Foehn Wind events in Urumqi. Changes in surface meteorological elements in Urumqi from 27 to 28 October 2020. The pink shaded area represents the Foehn wind period.Green line represents relative humidity; black line is pressure; red line is temperature.
Figure 3.
Annual distribution of Foehn wind (FW) in Urumqi in the past 15 years: (a) FW, (b) strong FW. The red dashed line represents the mean value.
Figure 3.
Annual distribution of Foehn wind (FW) in Urumqi in the past 15 years: (a) FW, (b) strong FW. The red dashed line represents the mean value.
Figure 4.
Seasonal variation in Foehn wind (FW) in Urumqi in the past 15 years: (a) hourly FW per month and (b) daily FW per month.
Figure 4.
Seasonal variation in Foehn wind (FW) in Urumqi in the past 15 years: (a) hourly FW per month and (b) daily FW per month.
Figure 5.
Daily variation in Foehn wind (FW) per month in Urumqi in the past 15 years.
Figure 5.
Daily variation in Foehn wind (FW) per month in Urumqi in the past 15 years.
Figure 6.
Annual distribution of average wind speed in Urumqi from 2008 to 2022. Yellow refers to the average wind speed of Foehn wind (FW); green is the average wind speed.
Figure 6.
Annual distribution of average wind speed in Urumqi from 2008 to 2022. Yellow refers to the average wind speed of Foehn wind (FW); green is the average wind speed.
Figure 7.
Monthly distribution of average wind speed in Urumqi from 2008 to 2022. Yellow refers to the average wind speed of Foehn wind (FW); green is the average wind speed.
Figure 7.
Monthly distribution of average wind speed in Urumqi from 2008 to 2022. Yellow refers to the average wind speed of Foehn wind (FW); green is the average wind speed.
Figure 8.
Monthly distribution of average temperature in Urumqi in the past 15 years. Purple represents the monthly average temperature; pink is the average temperature of Foehn wind (FW).
Figure 8.
Monthly distribution of average temperature in Urumqi in the past 15 years. Purple represents the monthly average temperature; pink is the average temperature of Foehn wind (FW).
Figure 9.
Variations in the hourly temperature (a) and relative humidity (b) of Foehn wind (FW) during the different seasons in Urumqi in the past 15 years.
Figure 9.
Variations in the hourly temperature (a) and relative humidity (b) of Foehn wind (FW) during the different seasons in Urumqi in the past 15 years.
Figure 10.
Variations in hourly temperature (a) and relative humidity (b) in the three periods (start, end, and during) of Foehn wind (FW).
Figure 10.
Variations in hourly temperature (a) and relative humidity (b) in the three periods (start, end, and during) of Foehn wind (FW).
Figure 11.
Distribution of the ONI and sliding anomaly of FW days in Urumqi in the past 15 years (the black solid line represents the ONI, and the red dashed line represents ONI = +0.5; the green histogram represents the sliding anomaly of FW days for three months; and the blue solid line represents the trend of the anomaly).
Figure 12.
(a) The 500 hPa circulation pattern on 21 July 2015, and (b) an anomaly. Black dot represents Urmqi Meteorological stations.
Figure 12.
(a) The 500 hPa circulation pattern on 21 July 2015, and (b) an anomaly. Black dot represents Urmqi Meteorological stations.
Figure 13.
(a) Surface circulation pattern on 21 July 2015, and (b) an anomaly. Black dot represents Urmqi Meteorological stations.
Figure 13.
(a) Surface circulation pattern on 21 July 2015, and (b) an anomaly. Black dot represents Urmqi Meteorological stations.
Figure 14.
Changes in surface meteorological elements in Urumqi from 21 to 23 July 2015. The pink shaded area represents the Foehn wind (FW) period. Blue arrow represents 2 min average wind direction; black line is 2 min average wind speed; green line is relative humidity; red line is temperature.
Figure 14.
Changes in surface meteorological elements in Urumqi from 21 to 23 July 2015. The pink shaded area represents the Foehn wind (FW) period. Blue arrow represents 2 min average wind direction; black line is 2 min average wind speed; green line is relative humidity; red line is temperature.
Table 1.
Three EI Niño events in the past 15 years.
Table 1.
Three EI Niño events in the past 15 years.
| Time | Intensity |
|---|
| June 2009–April 2010 | moderate |
| October 2014–April 2016 | very strong |
| September 2018–June 2019 | weak |
Table 2.
The difference in average temperature between full months and Foehn wind (FW) periods in Urumqi in the past 15 years.
Table 2.
The difference in average temperature between full months and Foehn wind (FW) periods in Urumqi in the past 15 years.
| T (°C) | January | February | March | April | May | June | July | August | September | October | November | December |
|---|
| FW | −2.6 | 1.4 | 12.9 | 17.9 | 23.1 | 27.8 | 32.3 | 30.9 | 25.0 | 17.8 | 7.9 | −2.8 |
| Full month | −12.1 | −9.2 | 1.4 | 12.6 | 18.0 | 22.8 | 25.1 | 23.4 | 17.8 | 9.1 | −0.9 | −9.2 |
| Difference | 9.5 | 10.6 | 11.5 | 5.3 | 5.1 | 5.0 | 7.2 | 7.5 | 7.2 | 8.7 | 8.8 | 6.4 |
Table 3.
The hours of high temperature during the FW period.
Table 3.
The hours of high temperature during the FW period.
| Year | 2008 | 2009 | 2010 | 2011–2013 | 2014 | 2015 | 2016 | 2017 | 2018–2020 | 2021 | 2022 |
|---|
| Hour | 14 | 0 | 7 | 0 | 2 | 32 | 2 | 3 | 0 | 5 | 8 |
| Disclaimer/Publisher’s Note: The statements, opinions and data contained in all publications are solely those of the individual author(s) and contributor(s) and not of MDPI and/or the editor(s). MDPI and/or the editor(s) disclaim responsibility for any injury to people or property resulting from any ideas, methods, instructions or products referred to in the content. |
© 2024 by the authors. Licensee MDPI, Basel, Switzerland. This article is an open access article distributed under the terms and conditions of the Creative Commons Attribution (CC BY) license (https://creativecommons.org/licenses/by/4.0/).


