

The Effectiveness of Climate Adaptation Finance and Readiness on Vulnerability in African Economies

1
Doctoral School of Economic and Regional Sciences, The Hungarian University of Agriculture and Life Sciences, Páter Károly u. 1, 2100 Gödöllő, Hungary
2
Business School, Strathmore University, Nairobi 0200, Kenya
3
Department of Investment, Finance, and Accounting, Institute of Rural Development and Sustainable Economy, Kaposvár Campus, The Hungarian University of Agriculture and Life Sciences, 7400 Kaposvár, Hungary
*
Author to whom correspondence should be addressed.
Climate 2024, 12(5), 59; https://doi.org/10.3390/cli12050059
Submission received: 27 March 2024
/
Revised: 18 April 2024
/
Accepted: 20 April 2024
/
Published: 24 April 2024
(This article belongs to the Topic Climate Change Impacts and Adaptation: Interdisciplinary Perspectives)
Abstract
:Addressing climate vulnerability remains a priority for economies globally. This study used the panel-corrected standard error (PCSE) methodology to investigate the impact of adaptation financing on climate vulnerability. This analysis examined 52 African countries from 2012 to 2021 while considering their climate adaptation readiness. The impact was also assessed based on the Human Development Index (HDI) categories to reflect different levels of development. The findings showed that adaptation finance considerably influenced climate vulnerability reduction in Africa, particularly in nations with a moderate HDI. However, most countries still need higher levels of adaptation financing, resulting in a small impact on vulnerability reduction. Furthermore, the impact of readiness measures differed by HDI category. Economic and social climate readiness strongly impacted climate vulnerability in high-HDI nations, but governance preparedness was more critical in low-HDI countries. Based on the empirical facts, two policy proposals emerge. First, it is critical to reconsider the distribution of adaptation financing to reduce disparities and effectively alleviate climate vulnerability. Moreover, African economies should consider implementing innovative localized financing mechanisms to mobilize extra adaptation finance. Second, African governments should customize climate readiness interventions based on their HDI levels to improve the achievement of a positive impact on climate vulnerability.
1. Introduction
In light of the pressing issue of climate change, it is imperative to swiftly and consistently execute measures that address climate change adaptation on a continental scale [1]. The implemented adaptation measures’ long-term effectiveness partly depends on the climate vulnerability of the respective regions [2]. Climate vulnerability, referred to as the susceptibility to adverse impacts caused by climate-driven hazards [3], remains a subject of considerable interest as policymakers work toward enhancing climate risk management [4]. The far-reaching consequences of climate change risks, which threaten economic and social advancement [5,6], have garnered significant attention across the globe, including in Africa.
The African continent, categorized as the most vulnerable to climate change [7], continues to experience disruptions, particularly in sectors susceptible to the adverse effects of climate change [8,9,10]. The need to address climate vulnerability remains an area of focus, given the crucial role these sectors play in the countries’ socioeconomic landscapes. The agriculture sector, for example, significantly influences the macro- and micro-economies [11]. A considerable proportion of Africa’s mixed economies notably rely on the rainfed agricultural sector for employment and livelihood, directly or indirectly. In 2021, the agriculture sector employed 52% of the workforce, according to World Bank employment statistics [12].
Moreover, the sector’s significant contribution to the gross domestic production, averaging nearly 20% across African countries, cannot be undermined [13]. The services sector, which is the highest contributor to the economic output of most African countries, is also sensitive to extreme climate-related events like drought and floods [14,15,16]. The impact of climate change across the key sectors has stimulated more discussion regarding proactive adaptation, notwithstanding the obstacles faced, particularly on confined financial, infrastructural, and technological resources [17].
Improving adaptation readiness toward tackling the complexities of climate change and strengthening resilience is crucial for Africa. Lagging in implementing proper coping measures will undeniably increase the number of Africans living in poverty by 2030 [18]. The Notre Dame Global Adaptation Index (ND-GAIN), an open-source index [19] adopted by scholars [20,21,22], defines readiness as the capacity to attract adaptation investment from various avenues. Its measurement is based on proxies that could encourage or discourage public and private sector investment.
A country’s readiness is evaluated based on economic, governance, and social metrics. Economic readiness is assessed through the business environment since this is expected to attract or discourage investment in adaptation, particularly from the private sector. Governance readiness focuses more on the political risks and their possible impact on foreign capital flows. Social readiness proxies revolve around social attributes, including inequalities, education, access to knowledge, and innovation that could derail the community’s ability to identify adaptation opportunities, invest, and yield returns. Adaptation readiness is pivotal in effectively habituating climate change’s impacts [17,23]
In addition to readiness, actual progress in adaptation requires massive finance disbursement for related investments in Africa. The developed economies’ commitment toward Africa’s climate finance basket has seen more distributions toward mitigation than the adaptation course. This fact has been attributed to mitigation being considered a public good that directly benefits all nations, whereas adaptation indirectly benefits the fund contributors [24]. Disbursements on adaptation finance are also lagging compared to the commitments made [25]. The estimated deficit in financing based on the annual average is above 70% for 2020–2030 [26]. This sluggish adaptation financing trend attracts interest, given that climate adaptation financing initiatives have been laid out globally to support climate adaptation projects since the 1990s. The initiatives include the establishment of the Global Environment Facility in 1991, the Kyoto Protocol adaptation fund in 2001, and the Green Climate Fund in 2010. Generally, the formation of adaptation finance initiatives has mainly focused on vulnerable developing countries since adaptation finance has been acknowledged as having the potential to address climate vulnerability in these regions [27,28].
The influence of human development on climate adaptation and mitigation measures in different countries is significant [29]. Analyzing and understanding the disparities in countries’ levels of development is crucial for effective policy design [30]. The Human Development Index (HDI) is a comprehensive metric systematically evaluating a country’s development [31]. African countries exhibit a diverse range of HDI rankings and trends. Several African countries have achieved notable advancements in human development and exhibit relatively high HDI scores.
Nevertheless, a significant proportion of the HDI values in this region are relatively low compared to other areas. Specifically, more than 50% of the nations in this region have an average HDI below 0.55 (Figure 1), which falls within the low category according to the United Nations Development Programme (UNDP) classification ([32], p. 1). This results from countries with poverty, inequality, and limited access to quality education and healthcare. Countries with higher levels of human development are anticipated to possess the resources and capability to allocate and execute more ambitious adaptation readiness policies in contrast to countries with lower levels, owing to divergent priorities [33].
Given the interaction between adaptation financing, readiness, and vulnerability, we aimed to establish if the adaptation finance to Africa by bilateral, multilateral, and private philanthropic organizations has achieved the intended objective of reducing climate vulnerability while considering the various countries’ readiness and HDI categories. The novelty of our research model is derived from the fact that we (i) evaluate the impact of traceable adaptation finance on Africa’s climate vulnerability while taking into account the individual countries’ readiness levels, (ii) employ the Prais–Winsten regression and panel-corrected standard error analysis (PCSE) to predict this impact, and (iii) analyze the impact across three African countries categories based on the level of development as measured by the Human Development Index (HDI). The rest of this paper is organized as follows: Section 2 discusses the relevant literature, Section 3 presents materials and methods, Section 4 presents the results and discussion of our findings, and we conclude the paper in Section 5.
2. Climate Vulnerability, Adaptation Readiness, and Adaptation Finance Literature
The climate vulnerability aspect has been examined through empirical research, resulting in interconnected themes defining the policy and scholarly investigations. The three main subjects of interest related to the topic are vulnerability assessment methodologies, factors influencing vulnerability, and their association with adaptation.
Climate vulnerability assessment entails modeling based on specific factors and risks to evaluate the levels at which climate impacts affect societies. The vulnerability assessment process of communities comprises the measurement of four components: climate change exposure, sensitivity to exposure, implications on points of sensitivity, and adaptive capabilities based on steps taken to address the impacts [34]. Moreover, it is imperative to acknowledge the importance of complex adaptive systems theory to assess vulnerability effectively. Considerations of community modulation, feedback mechanisms, redundancy, and susceptibility to change, extending from the theory, are essential incorporations in vulnerability models [35].
The approach adopted to assess vulnerability differs depending on the scale of analysis, emphasizing single risks impacting a specific industry or society or those affecting multiple sectors [36,37]. Integrating more indicators can strengthen the vulnerability indexes and provide unique insights to guide the strategies adopted to reduce the vulnerability [38]. The efficacy of climate vulnerability assessment is crucial in informing and implementing suitable local strategies ([39], p. 12). Our study builds upon vulnerability measurement papers by going beyond assessment and determining the role of adaptability on the vulnerability trend using a preexisting ND-GAIN vulnerability measure.
The second broad category of researchers explores the factors influencing climate vulnerability, including socioeconomic and governance factors, considered components of adaptation readiness in ND-GAIN metrics [19,40]. A notable interaction between these factors and vulnerability is evident, though with mixed findings, as reported by [22,41,42,43,44]. One specific focus is the association between socioeconomic factors, including wealth and education levels, and climate vulnerability. Examining the correlation between wealth and vulnerability has established a clear negative relationship between low-income populations and those facing greater vulnerability risk. While assessing the dynamics of vulnerability to climate-related hazards, [45] reported a decreasing trend in global socioeconomic vulnerability, suggesting that societies worldwide have become less vulnerable to climate-related hazards over time. Moreover, the study revealed a strong negative relationship between population income levels and climate vulnerability.
Relatedly, wealth increases the sense of control, leading individuals to be climate change conscious and take climate action [46]. From the perspective of educational levels, there are two possible scenarios, especially for future generations [47]. Educational factors could improve the Human Development Index (HDI), a primary indicator of climate resilience, thus reducing vulnerability. However, population education attainments could increase energy consumption resulting from labor productivity and slow progress in reducing environmental pressures. Empirical evidence provided for the association between a country’s economic level and climate vulnerability has indicated mixed findings. The contributors to a country’s economic growth determine whether climate vulnerability reduces or accelerates [48]. Furthermore, there is a correlation between economic development and climate vulnerability [49]. The findings above underscore the significance of giving due consideration to socioeconomic factors in a bid to mitigate the impacts of climate change effectively.
The discussions on governance factors encompass political factors and institutional and societal frameworks that determine climate finance resource allocation and regulation. The efficacy of national and local governments, non-government institutions, and relevant international institutions in climate governance has been assessed [6,50,51,52,53]. While examining adaptation readiness from a climate governance perspective, [23] examined the effectiveness of governance across various countries and found that it impacts climate vulnerability. Participation, collaboration, and knowledge sharing among the various regulating bodies are essential to enhancing climate governance [54,55]. Regarding the influence of political factors, [56] acknowledges the possible self-interest of powerful political–economic institutions, politicians, and other interested actors in the vulnerability measurement and policymaking role. This creates challenges, including conflicting ideologies on the definition and indicators of climate vulnerability and implementing transformative and practical approaches that benefit the most affected.
Empirical studies on the adaptation readiness index comprising a combination of economic, social, and governance factors have indicated that countries with a high adaptation readiness, majorly the developed economies, are less vulnerable compared to their counterparts [17,57]. In essence, most studies on all the above factors focus on regions considered most vulnerable. This stems from the generally accepted ideology that climate vulnerability distribution is unequal [58,59], with developed economies being less vulnerable than developing economies [60]. The importance of reviewing the climate vulnerability influencing factors for our paper was the appreciation that they could contribute to aggravating or reducing climate vulnerability in addition to the distribution of adaptation finance [61,62]. This was a critical aspect to consider in our discussion of findings.
The climate adaptation topic has also been emphasized, with empirical evaluations focusing mainly on countries’ adaptive capacities, adaptive interventions, and adaptation finance distributions. While developed countries have greater climate adaptation capacities due to their adaptation readiness, developing countries struggle to counter climate-related risks due to adaptation constraints [23,63]. The adaptive capacities of various communities have been assessed using different frameworks, with the strength varying across sectors and contexts [64,65,66]. For example, from the perspective of households, evidence suggests disparities in adaptive capacity scores across different age groups, genders, education levels, and locations. The technological, financial, social, infrastructural, governance, and human capital capabilities further determine the adaptive capacities [67,68,69,70].
Adaptation interventions to facilitate effective responses to climate change effects have been implemented from different levels, including national and local governments, international communities, and community-based initiatives. The intervention cruciality is highest in the most vulnerable regions [71,72]. Deep engagement with the communities in vulnerable regions to understand the different local contexts could lead to more adaptation success [71]. However, a lack of proper adaptation interventions may reinforce, redistribute, or create new vulnerabilities, thus hindering making substantial progress. From a related angle, [73] note that interventions may create losers and winners, just like the climate-related crisis. The main losers could be vulnerable communities if they are misrepresented, stereotyped, or excluded from adaptation discussions.
One essential adaptation intervention effort is the distribution of adaptation financing to fund essential adaptation projects. International funds are crucial in supporting adaptation for low-income states, given that adaptation finance is a significant constraint [74,75]. So far, examinations of adaptation finance have focused on the allocation levels across various sectors and countries, as well as the associated opportunities and challenges. The discrepancy between countries that need adaptation funding and those that are allocated exists [76,77]. The extent to which adaptation finance has reached vulnerable countries through the Green Climate Fund is low, particularly for the least developed countries that are stricken by conflict and have sluggish government institutions [78,79]. To this end, climate justice in adaptation financing has been explored, with inequities attributed to donors’ use of aid to foster their political and economic interest in recipient countries [6,80].
Although scholars have explored the link between vulnerability and adaptation finance, focusing on whether vulnerability determines the adaptation finance received, [21,81] the findings are still controversial. Moreover, while it is recognized that investing in adaptation measures is crucial for reducing vulnerability and building resilience to the adverse effects of climate change, scholarly emphasis on trends in achieving this goal is minimal. Accordingly, we expect climate vulnerability to decrease in countries with higher adaptation finance over time and a higher adaptation readiness index. We therefore formulate the following hypothesis:
Alternative hypotheses:
H1:
In the case of African economies, climate adaptation finance positively impacts the reduction of climate vulnerability when readiness factors are considered.
Further, given the different levels of development across African countries, as measured by the HDI, we expect the impact of adaptation finance on vulnerability to be different across the low, moderate, and high HDI classifications. We hence formulate the second alternative hypothesis:
H2:
There is a significant difference in the impact of adaptation finance and climate readiness on climate vulnerability across Africa based on the Human Development Index (HDI) categories.
In essence, testing the hypothesis and answering the questions could contribute to a deeper understanding of climate adaptation finance, readiness, and vulnerability dynamics and enhance evidence-based decision-making in policy formulation. This can, in turn, promote the development of more effective policies and empower policymakers to fine-tune policy interventions relating to climate adaptation.
3. Materials and Methods
3.1. Scope
The first hypothesis, regarding whether adaptation finance reduces climate vulnerability in Africa, was evaluated using panel data analysis. We used panel data since it has several advantages, including controlling for cross-section heterogeneity and providing a greater capacity to find and quantify effects that are not discernible just through cross-sectional or time-series data [82]. We analyzed balanced panel data comprising 52 of 54 African countries over ten years (2012–2021) using a combination of R version 4.3.2, Stata/SE 17, and Microsoft Excel version 16.78.3. South Sudan and Eswatini were excluded from the analysis due to missing data cases.
To test the second hypothesis, we stratified African economies into three classifications based on their average HDI as reported by the UNDP data repository over ten years. According to the data, no African country has an HDI level that is significantly higher than 0.8. Further, less than five countries have an average high HDI above 0.7. Since most countries fall within the medium and low UNDP HDI classifications, we categorized the countries into three classifications [83]. The first category included countries with an average HDI of 0.6 or higher, indicating a relatively high level of human development. The second category encompassed countries with an average HDI ranging between 0.5 and 0.6, representing moderate human development. Lastly, the third category consisted of countries with an average HDI below 0.5, suggesting a lower level of human development.
The stratification allowed for a comprehensive analysis of the impact across varying levels of countries’ development. We selected the ten years following the establishment of the Green Climate Fund, including 2015, the year that saw the ratification of the Paris Agreement. Focusing on this period, we aimed to capture the recent developments and advancements in climate finance adaptation and vulnerability.
3.2. Data
The data on climate adaptation finance originated from the Organization for Economic Cooperation and Development (OECD). OECD monitors climate finance using OECD DAC Rio Markers for Climate. This encompasses bilateral public climate finance from institutions in developed countries, multilateral public climate finance, climate-related officially supported export credits, and bilateral and multilateral private finance attributed to developed countries [84].
The climate vulnerability and adaptation readiness data were sourced from the University of Notre Dame Global Adaptation Index (ND-GAIN). This index serves as a comprehensive measure of countries’ readiness and vulnerability to the impacts of climate change. It assesses various factors such as exposure to climate hazards, sensitivity to climate change, and adaptive capacity. The ND-GAIN index is widely recognized and used by researchers, policymakers, and organizations worldwide to understand climate vulnerabilities better and support effective adaptation strategies. Moreover, the HDI and greenhouse gas emissions (GHG) data, included as a control variable, were obtained from the World Bank Data Bank and UNDP databases [85]
Data Limitation
The challenges associated with establishing adaptation financing components and acquiring accurate data to differentiate commitments from disbursements hindered our ability to estimate adaptation finance requirements precisely. Nevertheless, the OECD has actively monitored climate development finance since 2000 and offers comprehensive data explorer tools and methodological documents. The distinction between adaptation financing and mitigation financing was of particular interest since our study focuses specifically on climate adaptation.
4. Findings and Interpretation
This section presents the empirical findings derived from the study’s data analysis. The results are then systematically discussed, providing insightful interpretations and implications.
4.1. Descriptive Statistic Analysis
The descriptive statistics below provide a comprehensive overview of the relevant data. The statistics play a crucial role in understanding the current state and trends in vulnerability to climate-related risks, adaptation finance, the adaptation readiness of different countries, and the classification based on levels of development as measured by HDI in Africa.
4.1.1. Climate Change Vulnerability
Climate vulnerability, as assessed by ND-GAIN, monitors a country’s exposure, sensitivity, and mechanisms to adapt to the negative impact of climate change. In the visualization presented in Figure 2, Somalia, Chad, Guinea Bissau, and Niger stand out as the most climate-vulnerable countries. At the same time, Algeria, Tunisia, Morocco, and South Africa are identified as among the least climate vulnerable. On average, the vulnerability across the entire continent is 0.513. Further analysis revealed that highly developed countries based on HDI exhibit an average vulnerability of 0.427, moderately developed nations average 0.524, and the least developed countries demonstrate an average of 0.574. This indicated that vulnerability averages are not significantly different across the development classifications, especially for the moderate and less developed nations.
4.1.2. Climate Adaptation Development Finance
Climate Adaptation Development Finance reported by OECD comprises bilateral public climate funding from institutions in developed nations, multilateral public climate finance, climate-related publicly supported export credits, and bilateral and multilateral private financing attributed to developed countries.
To understand the level of climate adaptation finance across African countries, the study presents a map in Figure 3. The data are based on a scale of 28,018 to 10,035,018 USD thousand, with the blue color intensifying for countries with higher amounts of adaptation finance. Kenya emerged as the top African country in terms of total commitments in adaptation-related development financing recorded by the OECD within the period. Additionally, the Eastern Africa region has received more commitments than other regions, with Ethiopia, Somalia, Uganda, and Tanzania among the top ten countries in this category. The West African countries have also received significant climate adaptation commitments. A comparison of the top ten most vulnerable countries and those that have received the highest commitments indicates that only two countries, Somalia and Niger, fall into both categories. This suggests there may be a disconnect between the level of vulnerability and the amount of adaptation support provided, highlighting a potential area for further analysis and targeted intervention.
On the other hand, the countries that have received minimum commitments include Libya, Seychelles, Equatorial Guinea, Sao Tome and Principe, and Guinea-Bissau. Of this, Guinea-Bissau is among the top ten most vulnerable countries. The other four countries are among the top 30% of countries in terms of HDI-measured development. There is a significant discrepancy in the distribution of commitment allocation, as the bottom 52% of countries’ allocation is only 12% of the total share.
The global adaptation finance gap is increasing despite the increase in total climate finance [86,87]. Globally, the regions that are considered the most climate-vulnerable and thus might compete for climate adaptation finance include Africa, South Asia, the Pacific region, and Latin America [88,89]. A comparison of the adaptation finance across the regions during the period of 2021–2022 indicates that Asia and the Pacific region received 45% of global adaptation financing as compared to 20% in Africa and 10% in Latin America [90]. This means that there is an opportunity for enhancement to optimize the allocation of limited adaptation finance across vulnerable regions.
4.1.3. Climate Adaptation Overall Readiness
ND-GAIN measure of the overall climate adaptation readiness focuses on a nation’s capacity to leverage investments and convert them to adaptation actions. The overall readiness comprises economic, governance, and social readiness.
The readiness of Mauritius for climate adaptation surpasses that of other African economies, as illustrated in Figure 4. The islands of Seychelles and Cabo Verde are also highly climate adaptation-ready from an overall perspective, along with Tunisia, Botswana, Morocco, and Rwanda. The least adaptation-ready economies include the Central African Republic, Chad, DR Congo, Zimbabwe, and Eritrea. Central African Republic and Chad’s economic readiness was very low compared to the continent’s average, leading to a low overall readiness. Zimbabwe and Eritrea lagged on social readiness, contributing to their low overall readiness. This indicated a low community’s ability to tap into climate adaptation opportunities.
4.1.4. Time Trend of Variables Analysis
The visuals presented in this section illustrate African countries’ average governance, social, and economic readiness from 2012 to 2021. The ND-GAIN governance readiness, as illustrated in Figure 5, focuses on the institutional capabilities that enhance adaptation investment applications.
The governance climate adaptation readiness metric has exhibited relative consistency over time. Throughout the years, certain countries constantly demonstrated high governance readiness, with index values exceeding 0.6, while others remained below 0.1, leading to an average index of 0.37
The social readiness index featured in Figure 6 incorporates indicators of the social and technological capabilities of the society that influence adaptation investment mobility and actions.
The social climate adaptation readiness, presents a skewed distribution, including notable positive outliers, particularly in 2012–2015. However, during the period from 2016 to 2021, the majority of indices are concentrated between 0.1 and 0.35 across countries. In the same period, some countries previously considered more socially prepared experienced a decline in readiness, resulting in a decreased overall mean index of 0.237, lower than the governance and economic readiness. Moreover, the countries with a lower index below 0.2 are still notable, but the trend has reduced over the years.
The economic readiness index presented in Figure 7 assesses a country’s business environment that could influence its adaptation investments. The economic readiness trend shows some similarity with the social readiness in the period from 2012 to 2015. However, in 2016–2021, the countries’ indices are more centered around the mean of 0.313, with some countries experiencing a decline from the previous years.
The climate adaptation finance for most countries, depicted in Figure 8, has been very low averaging less than 500,000 USD thousand every year. However, the weight on the lower side has reduced over the years, with more countries receiving more adaptation funding recently.
Finally, Figure 9 shows the trend of overall climate readiness and vulnerability. The vulnerability has reduced as readiness has improved over the years. The increasing trend in adaptation readiness is notable as compared to the reduction in climate vulnerability.
4.2. Diagnostic Test
In this section, we discuss the results of five diagnostic tests. These tests played a crucial role in detecting potential issues in our panel data and, hence, selecting a robust analysis model in line with the problems identified.
4.2.1. Normality Test
Normal distribution of residuals is required for the test to be reliable while running a regression analysis [91]. The normality test on residuals was conducted at a 5% significance level. We utilized the sktest skewness and kurtosis normality test to test the null hypothesis that variable residuals were normally distributed against the alternative hypothesis that variable residuals were not normally distributed.
Table 1 indicates that the probability of skewness of the residuals is less than 0.05, meaning that the residuals are not normally distributed. Nonetheless, the probability of kurtosis implies that the residuals approach an asymptotic normal distribution with a 95% confidence level. Additionally, the joint test probability of Chi-square is less than 0.05, which provides sufficient evidence to conclude that the residuals are not normally distributed within a 5% level of significance. To address the non-normality issue, we use natural logs of the variables climate adaptation finance and GHG emissions that exhibited non-normality.
4.2.2. Pesaran CD Cross-Sectional Dependence Test
Cross-sectional dependence of error terms could lead to biased test results and is problematic. Ignoring sufficient cross-sectional dependency in panel analysis could greatly diminish estimate efficiency because the panel estimator may not differ significantly from the single equation ordinary least squares estimator [92].
Using the Pesaran CD test, we ran the pcdtest R command to examine the possibility of cross-sectional dependence in the residuals across countries. This test was appropriate for our data set, given that the number of cross-sectional units was sizeable compared to the small number of periods. The CD test is advantageous when many cross-sectional units are recorded over periods, unlike the conventional Breusch–Pagan LM test of independence [93,94]. The null hypothesis assumes no correlation between cross-section residuals at a 5% significance level, while the alternative hypothesis assumes a correlation between cross-section residuals at a 5% significance level.
As shown in Table 2, Pesaran’s test probability of 0.0161 is less than 0.05; hence, we fail to accept the null hypothesis and conclude that the cross-section residuals exhibit contemporaneous correlation.
4.2.3. Heteroscedasticity Test
Heteroscedasticity occurs when the errors do not exhibit a constant variance, meaning that var(ut) = σ2 < ∞ [91]. Testing and tackling the heteroscedasticity of the residuals is vital since its presence may result in inadequate least squares estimates and inconsistent covariance matrix estimates. We used the Aod R package module by [95] to compute the Wald statistic for groupwise heteroskedasticity in the residuals of a fixed effect regression model. The test null hypothesis (H0) was that the residuals are derived from homoscedastic distributions, against an alternative hypothesis that the residuals are not derived from homoscedastic distributions, meaning they are expected to have unequal variance.
The results in Table 3 indicate the chi2 p-value of the test was 0.000, less than α = 0.05; hence, we rejected the null hypothesis and concluded that heteroscedasticity was present in the panel regression model residuals.
4.2.4. Serial Correlation
Serial correlation is the correlation between matched data sets that are not obtained at a single point in time but rather observed progressively through time. Autocorrelation is a type of serial correlation where the second data set matches the first set, albeit with a temporal lag [96]. Testing and solving for serial correlation, also referred to as autocorrelation in panel data, are essential to avoid a false high R squared and erroneous more minor standard errors of the coefficients [97,98,99]. We utilized the pbgtest command of the Lm R package to run the Breusch–Godfrey–Wooldridge test on the null hypothesis of no serial correlation in idiosyncratic errors as proposed by [100]. The test is appropriate since it permits heteroscedasticity, which was present in our data.
4.2.5. Unit Root and Cointegration Tests
The unit root test is conducted to determine whether the panels are stationary. Stationarity is crucial to ensure no spurious relationships from the analysis [101,102]. We employed the Phillips–Peron test of the Tseries R package to examine the following hypothesis:
Null hypothesis (H0):
All panels contain a unit root.
Alternative hypothesis (HA):
None of the panels have a unit root.
The test yields more reliable results when dealing with disturbance processes that may exhibit heteroscedasticity and autocorrelation in our dataset [103,104]. Most panel unit root tests, including the Breitung and Das test and Levin–Lin–Chu unit root test, assume homoskedasticity [105] and hence were not applicable.
Table 5 shows that the p-values are not significant at 5%. We, therefore, fail to reject the null hypothesis and conclude that the panels contain a unit root, implying they are not stationary.
Consequently, we conducted the Kao cointegration test to ascertain the existence of a long-run association between the non-stationary variables. Cointegration is crucial for avoiding spurious outcomes in variables that lack stationarity [106]. The test results, presented in Table 6, support the alternative hypothesis that panels are cointegrated. Therefore, we conclude that there is a long-term relationship between the variables and hence proceeded with regression analysis.
From the diagnostic tests conducted, the standard error estimates exhibit the problems of non-normal distribution, cross-sectional dependence, heteroscedasticity, and autocorrelation. To solve the non-normality issue, we transformed the data into logs. Additionally, we ran and interpreted the panel-corrected standard error (PCSE) estimation models. This error-corrected model introduced by [107] solves for standard error estimates that are not robust due to the disturbances above in panel models. The advantages of using the model include its accountability for serial correlation, heteroskedasticity, and contemporaneous correlation. The model was also appropriate given that the data comprised many cross-sections (n) compared to the periods (t), a pre-requisite of using the model. The model employment has limitations in cases where the cross-sections are fewer than the periods [107,108].
4.3. PCSE Empirical Outputs
This study estimated four panel-corrected standard error (PCSE) econometric models to answer the research hypothesis. The results of Model 1 relating to hypothesis 1 are presented in Section 4.3.1 below, while those of Model 2–4 testing hypothesis 2 are presented in Section 4.3.2.
4.3.1. Hypothesis 1 Estimation Results
We applied the first PCSE regression model (Equation (1) below) to test the null hypothesis that climate adaptation finance does not positively impact the reduction of climate vulnerability in Africa when readiness factors are taken into account. We examined the effect of adaptation finance; economic, governance, and social readiness; GHG emissions; and vulnerability, the value of which was lagging in terms of climate vulnerability. The output is presented in Table 7 below.
Equation (1): PCSE estimation output
At a 95% level of confidence, all the variables were statistically significant. Climate adaptation finance, economic readiness, and governance readiness had a statistically negative relationship with the vulnerability index, while social readiness, GHG emissions, and the lagged value of the vulnerability index had a positive relationship. These results imply that climate adaptation finance has a positive impact on reducing vulnerability, given the negative relationship. However, based on the beta coefficient, the decrease is minimal since a 1% increase in climate adaptation finance led to an average reduction of 0.02% in climate vulnerability. The slight decline may be attributed to most nations’ insufficient aggregate adaptation funds. According to the data depicted in the adaptation finance map, 52% of the nations have received total commitments of less than 1,000,000 USD thousands. The disparity in financing between the highest- and lowest-ranking countries is also substantial.
Concerning adaptation readiness, countries’ economic and governance readiness reduces climate vulnerability, with governance readiness exhibiting a higher impact. This inferred that a good adaptation investment environment that defines the economic readiness and governance factors contributing to political stability and stability is important in minimizing climate vulnerability. Unexpectedly, contrary to prior research [17], the social readiness variable exhibited a positive relationship with vulnerability, implying that as the overall African social structures of communities become more solid, the climate vulnerability is likely to increase. The Notre Dame social readiness indicators include social inequality, innovation, information communication technology (ICT), and education.
Prior research suggests that the impact of ICT on the environment could be two-way, depending on the ICT quality and interventions [109,110]. This could suggest a possible explanation for this relationship, considering that African nations have had a higher rate of ICT technology adoption over the past decade compared to previous years. Furthermore, as argued by [111] innovation can potentially increase climate challenges, depending on the nature of the innovation, its accessibility, and its environmental implications. A significant impact of green technological innovations on carbon productivity in developing economies is difficult to find [112]. Moreover, education enhancement is expected to result in improved HDI but could also increase emissions resulting from economic growth that negatively impact the environment in the short run [47]. The results further imply that prioritizing the reduction of GHG gas emissions and addressing climate vulnerability from previous years are essential steps toward achieving overall climate vulnerability reduction.
In summary, we reject the null hypothesis 1 and conclude that at a 95% confidence level, climate adaptation finance positively influences the reduction of climate vulnerability in Africa. Nevertheless, it is important to take note of the minimal nature of the decrease and the unique characteristics of individual countries in the African continent.
4.3.2. Hypothesis 2 Empirical Output
Given that African countries vary in development, we tested the null hypothesis 2 that there is no significant difference in the impact of adaptation finance and climate readiness on climate vulnerability across African economies based on HDI 3 classifications. The results of the three empirical models are presented in Table 8, Table 9 and Table 10 below based on low HDI, average HDI, and high HDI ranking.
Results in Table 8 were based on African countries whose average HDI index was below 0.5, which signifies a lower level of human development. These countries include Somalia, Niger, Chad, Central African Republic, and Mali. All the variables except social readiness were statistically significant at a 5% level of significance. A 1% increase in climate adaptation finance is expected to reduce vulnerability by 0.01% in low-HDI African countries. From the readiness perspective, a unit increase in economic preparedness might lower climate vulnerability by 0.07, whereas a unit increase in governance readiness could reduce climate vulnerability by 0.22. Similar to the overall continent results, the findings also suggest that it is crucial to tackle climate vulnerability from past years and prioritize the decrease of greenhouse gas emissions in low-HDI economies to effectively reduce overall climate vulnerability.
Table 9 presents the output of category 2, comprising countries with an average HDI between 0.5 and 0.6. Some countries in this category included Senegal, Uganda, Nigeria, Rwanda, Zambia, Kenya, and Angola. Similar to the low HDI category, all the variables except social readiness were statistically significant at a 95% level of confidence. Climate adaptation finance was negatively related to climate vulnerability, with a 1% increase in the finance expected to lower the vulnerability by 0.03%. The reason for the greater influence, in comparison to other categories, may be attributed to the fact that countries with an average HDI, including Kenya and Nigeria, ranked among the top nations in terms of climate adaptation finance.
In contrast to the lower HDI group, the economic readiness variable exhibited a positive relationship with climate vulnerability. This finding revealed that as the ease of doing business index improves in the middle-developed countries, the climate vulnerability is likely to increase. The ease of doing business in middle-HDI countries, the economic readiness indicator, is associated with the prospect of infrastructure development, industrial growth, and increased energy intensity [113,114] as the countries expand. These activities may heighten climate vulnerability if not well planned out. Vulnerability was still positively related to the GHG and lagging vulnerability variables. However, the beta coefficients indicated a lesser potential impact on vulnerability.
The third classification was comprised of countries categorized as high-HDI countries with a value higher than 0.6. These countries included Mauritius, Seychelles, South Africa, Egypt, Namibia, and Ghana. The findings, as depicted in Table 10 above, indicated that all variables were statistically significant at 5%, similar to the overall continent’s output presented in Table 7. The relationship of climate adaptation finance, economic readiness, and governance readiness with climate vulnerability was negative, signifying a positive impact similar to that of the low HDI category. The social readiness variable exhibited a statistically significant negative relationship in this category, indicating that social readiness is essential in reducing the climate vulnerability of highly human-developed African countries. The GHG emissions and lagged value of vulnerability maintained the same results as previous models.
In summary, the impact of variables across the various HDI categories is different. The relationship between the readiness variables and climate vulnerability and the magnitude of change in the climate vulnerability index caused by change in the independent variables varied across the classifications, indicating that the influence of the variables varies with HDI levels. According to the findings, the impact of adaptation finance is higher among average HDI countries than the lower and higher HDI countries. Economic and social readiness has more influence in high-HDI countries, while governance readiness is more important in low-HDI countries.
As a result, we rejected the null hypothesis 2. We concluded that the impact of adaptation funding and climate preparation on climate vulnerability varies significantly among African economic classifications based on the Human Development Index.
5. Conclusions and Policy Recommendations
The cruciality of promptly and consistently implementing actions to minimize climate vulnerability cannot be undermined in aiding the prevention and alleviation of the detrimental impacts of climate change [115]. African countries’ socioeconomic, political, geographical, and environmental processes contribute to their heightened vulnerability to climate impacts [116]. In recent years, the continent has experienced a growing number of climate-related calamities, prompting increased discourse on the significance of adaptation.
Using Prais–Winsten regression and panel-corrected standard error analysis, this study empirically tested the effect of adaptation finance on climate change vulnerability while factoring in adaptation readiness in 52 African countries over the 2012 to 2021 period. Further, the paper explicitly assessed the effect across three different HDI categories, given the various levels of development across African countries. The empirical findings from all models validate the contribution of adaptation finance in reducing climate vulnerability to climate change in Africa. The influence is more significant in countries with average HDI than those with lower and higher HDI. However, the levels of adaptation finance are still low, with significant disparities across African countries leading to a small vulnerability reduction impact between 0.01% and 0.03% across the various HDI categories. On the other hand, the effect of adaptation readiness indicators varies across the categories. Economic and social preparedness significantly impacts vulnerability in countries with high HDI, while governance preparedness plays a more critical role in countries with low HDI.
Utilizing the empirical data, we make the following two policy recommendations. First, adaptation funding needs to be reassessed. While recognizing the critical role of adaptation finance in reducing climate vulnerability, it is essential to tackle the notable disparities in the allocation across African countries. Given that just 12% of the overall adaptation funding share to Africa is allocated to the 52% of bottom-HDI-ranked nations, it is crucial to prioritize improving the equitable distribution of funds to maximize its effectiveness in reducing vulnerability. The effective allocation process requires collaboration from stakeholders to conduct a comprehensive adaptation investment needs assessment of all countries while factoring in their risk susceptibility. Subsequently, the allocation can be carried out equitably while factoring in the assessment findings and the available resources.
Bridging the climate finance gap requires African countries’ innovation of localized adaptation financing mechanisms, continuous international cooperation, and related partnerships. The establishment of adaptation project financing mechanisms at both the national and local government levels could ensure a comprehensive reach. To foster a sense of inclusivity and community engagement, these mechanisms should aim to provide favorable terms to attract contributory financing, even from local residents and corporations in vulnerable areas. By structuring financing mechanisms in this way, a wider range of adaptation projects can be supported, contributing to greater resilience across diverse geographic and demographic contexts.
To enhance international cooperation and partnerships, especially with private investors, African countries should focus on adaptation projects that have clearly defined and measurable outcomes. Further, maintaining consistent and high-level transparency and accountability in the usage of the adaptation finances is crucial. The assurance will not only reinforce existing partners’ trust but could also encourage new international partnerships, attracting a wider pool of adaptation finance.
Second, African countries’ governments should continue enhancing their adaptation readiness. Given the varying impact of readiness indicators on vulnerability across different HDI categories, adaptation readiness interventions should be tailored to the specific needs of countries based on their HDI levels. For countries with high HDI, the focus should be on strengthening economic and social preparedness, which has been shown to have a more significant impact. This entails enhancing the business environment to attract additional investment in adaptation and leveraging societal preparedness capabilities, such as education and technology adoption. For countries with low HDI, improving governance preparedness first is crucial. This may involve capacity building, institutional reforms, and policy frameworks to enhance governance readiness, specifically in these countries.
We acknowledge that obstacles to implementing policies may arise as a result of factors such as political will, institutional capacity, and resource constraints, which may impact the effectiveness of proposed interventions. Political will plays a pivotal role in facilitating coordination among key players involved in the implementation process and in establishing important legal frameworks. Conversely, the absence of the will could pose implementation challenges. Moreover, strong and effective institutions are critical in implementation coordination and management. The absence of such institutions in African countries could challenge the implementation. Additionally, the policy recommendations also necessitate resources, particularly financial resources, and therefore, limited resources could derail the process.
This study’s conclusions are limited to a certain extent. First, this study focused on the effect of adaptation financing, readiness, and the country’s classification of HDI on climate vulnerability. Other variables outside this scope were not included in this study, which determined the overall explanatory level of the model. Other researchers could further investigate other factors to enhance knowledge of their impact on the climate vulnerability aspect, especially in regions considered to be the most vulnerable.
Second, this study excluded South Sudan and Eswatini due to the lack of sufficient data, which impacts the generalizability of our findings to these countries. The exclusion, however, was not very significant since it represented 3.85% of the sample. The limitation highlights the need for improved data collection and reporting standards in Africa to ensure more inclusive and accurate research outcomes.
Third, the research was based on Africa, a continent mostly composed of developing and low-income nations with unique socioeconomic and developmental features. The findings may, therefore, only apply to other regions with relatable similar characteristics. It is hence important to exercise caution when extrapolating the results to developed nations or regions with different socioeconomic systems and development levels.
The assumptions underlying the analysis and which might have influenced the results included a presumption that data reported for the various variables from the sources was accurate. Given that biases in data collection could influence the robustness of results, validation of data sources and collection methods is important. Further, this study assumed a causal relationship where the independent variables impact climate vulnerability. The possible reverse causation of climate vulnerability influencing the independent variables was not tested and can be considered in future research.
Author Contributions
Conceptualization, P.M.; methodology, P.M.; software, P.M.; validation, A.P.-D.; formal analysis, P.M.; investigation, P.M.; resources, P.M. and A.P.-D.; data curation, P.M.; writing—original draft preparation, P.M.; writing—review and editing, P.M. and A.P.-D.; visualization, P.M.; supervision, A.P.-D. All authors have read and agreed to the published version of the manuscript.
Funding
This research received no external funding.
Data Availability Statement
The data presented in this study are available upon request from the corresponding author.
Acknowledgments
We acknowledge the support offered by the Hungarian University of Agriculture and Life Sciences (MATE) and the Stipendium Hungaricum Scholarship.
Conflicts of Interest
The authors declare no conflicts of interest.
References
- Tilleard, S.; Ford, J. Adaptation readiness and adaptive capacity of transboundary river basins. Clim. Chang. 2016, 137, 575–591. [Google Scholar] [CrossRef]
- Dhar, T.; Moncada, S.; Briguglio, L.; Bambrick, H.; Kelman, I.; Iorns, C.; Nurse, L. Identifying Climate Change Vulnerability and Adaptation Challenges in the Caribbean SIDS: An Urban Morphological Approach. In Small Island Developing States: Vulnerability and Resilience under Climate Change; The World of Small States; Springer International Publishing: Cham, Switzerland, 2021; pp. 329–350. ISBN 978-3-030-82774-8. [Google Scholar]
- UNFCCC. Glossary of Key Terms. Available online: https://www4.unfccc.int/sites/NAPC/Pages/glossary.aspx (accessed on 14 September 2023).
- Klein, R.; Mukhala, E.; Stephen, L.; Winograd, M.; Ziervogel, G. Assessing Vulnerability for Climate Adaptation; Technical Paper 3; UNFCCC: New York, NY, USA, 2005. [Google Scholar]
- Thangjam, U.; Thong, P.; Sahoo, U.K. Climate change threat on socio-economic condition of agroforestry managers: A vulnerability study in eastern Himalayan state of Mizoram, Northeast India. Clim. Risk Manag. 2023, 40, 100519. [Google Scholar] [CrossRef]
- Weiler, F.; Klöck, C.; Dornan, M. Vulnerability, good governance, or donor interests? The allocation of aid for climate change adaptation. World Dev. 2018, 104, 65–77. [Google Scholar] [CrossRef]
- UNFCCC. Report of the Conference of the Parties on Its Thirteenth Session, Held in Bali from 3 to 15 December 2007; United Nations Framework Convention on Climate Change: New York, NY, USA, 2008. [Google Scholar]
- African Development Bank Climate Change in Africa. Available online: https://www.afdb.org/en/cop25/climate-change-africa (accessed on 31 July 2021).
- Adhikari, U.; Nejadhashemi, A.P.; Woznicki, S.A. Climate change and eastern Africa: A review of impact on major crops. Food Energy Secur. 2015, 4, 110–132. [Google Scholar] [CrossRef]
- Nhemachena, C.; Nhamo, L.; Matchaya, G.; Nhemachena, C.R.; Muchara, B.; Karuaihe, S.T.; Mpandeli, S. Climate Change Impacts on Water and Agriculture Sectors in Southern Africa: Threats and Opportunities for Sustainable Development. Water 2020, 12, 2673. [Google Scholar] [CrossRef]
- Eugenio, D.-B. Macroeconomics, Agriculture, and Food Security: A Guide to Policy Analysis in Developing Countries; International Food Policy Research Institute: Washington, DC, USA, 2015; ISBN 978-0-89629-859-0. [Google Scholar]
- World Bank Open Data. Available online: https://data.worldbank.org (accessed on 13 September 2023).
- Statista Africa: Agriculture as GDP Share by Country. 2021. Available online: https://www.statista.com/statistics/1265139/agriculture-as-a-share-of-gdp-in-africa-by-country/ (accessed on 18 September 2023).
- Attoh, E.M.N.A.N.; de Bruin, K.; Goosen, H.; van Veldhoven, F.; Ludwig, F. Making physical climate risk assessments relevant to the financial sector—Lessons learned from real estate cases in the Netherlands. Clim. Risk Manag. 2022, 37, 100447. [Google Scholar] [CrossRef]
- Burton, A.J.; Bambrick, H.J.; Friel, S. Is enough attention given to climate change in health service planning? An Australian perspective. Glob. Health Action 2014, 7, 23903. [Google Scholar] [CrossRef] [PubMed]
- Dlugolecki, A.; Loster, T. Climate Change and the Financial Services Sector: An Appreciation of the UNEPFI Study. Geneva Pap. Risk Insur. Issues Pract. 2003, 28, 382–393. [Google Scholar] [CrossRef]
- Amegavi, G.B.; Langnel, Z.; Ofori, J.J.Y.; Ofori, D.R. The impact of adaptation on climate vulnerability: Is readiness relevant? Sustain. Cities Soc. 2021, 75, 103325. [Google Scholar] [CrossRef]
- Jafino, B.; Walsh, B.; Rozenberg, J.; Hallegatte, S. Revised Estimates of the Impact of Climate Change on Extreme Poverty by 2030; World Bank Group: Washington, DC, USA, 2020. [Google Scholar]
- Chen, C.; Noble, I.; Hellmann, J.; Coffee, J.; Murillo, M.; Chawla, N. The Notre Dame-Global Adaptation Index (ND-GAIN) Country Index; ND-GAIN: South Bend, IN, USA, 2015. [Google Scholar]
- Nagy, G.J.; Gutiérrez, O.; Brugnoli, E.; Verocai, J.E.; Gómez-Erache, M.; Villamizar, A.; Olivares, I.; Azeiteiro, U.M.; Leal Filho, W.; Amaro, N. Climate vulnerability, impacts and adaptation in Central and South America coastal areas. Reg. Stud. Mar. Sci. 2019, 29, 100683. [Google Scholar] [CrossRef]
- Chen, C.; Hellmann, J.; Berrang-Ford, L.; Noble, I.; Regan, P. A global assessment of adaptation investment from the perspectives of equity and efficiency. Mitig. Adapt. Strateg. Glob. Chang. 2018, 23, 101–122. [Google Scholar] [CrossRef]
- Halkos, G.; Skouloudis, A.; Malesios, C.; Jones, N. A Hierarchical Multilevel Approach in Assessing Factors Explaining Country-Level Climate Change Vulnerability. Sustainability 2020, 12, 4438. [Google Scholar] [CrossRef]
- Sarkodie, S.A.; Strezov, V. Economic, social and governance adaptation readiness for mitigation of climate change vulnerability: Evidence from 192 countries. Sci. Total Environ. 2019, 656, 150–164. [Google Scholar] [CrossRef] [PubMed]
- Skovgaard, J. The Economisation of Climate Change: How the G20, the OECD and the IMF Address Fossil Fuel Subsidies and Climate Finance, 1st ed.; Cambridge University Press: Cambridge, UK, 2021; ISBN 978-1-108-68804-8. [Google Scholar]
- Savvidou, G.; Atteridge, A.; Omari-Motsumi, K.; Trisos, C.H. Quantifying international public finance for climate change adaptation in Africa. Clim. Policy 2021, 21, 1020–1036. [Google Scholar] [CrossRef]
- Global Center on Adaptation. Adaptation Finance Flows in Africa; Global Center on Adaptation: Rotterdam, The Netherlands, 2022. [Google Scholar]
- Scandurra, G.; Thomas, A.; Passaro, R.; Bencini, J.; Carfora, A. Does climate finance reduce vulnerability in Small Island Developing States? An empirical investigation. J. Clean. Prod. 2020, 256, 120330. [Google Scholar] [CrossRef]
- Mungai, E.M.; Ndiritu, S.W.; da Silva, I. Unlocking Climate Finance Potential for Climate Adaptation: Case of Climate Smart Agricultural Financing in Sub Saharan Africa. In African Handbook of Climate Change Adaptation; Oguge, N., Ayal, D., Adeleke, L., da Silva, I., Eds.; Springer International Publishing: Cham, Switzerland, 2021; pp. 2063–2083. ISBN 978-3-030-45106-6. [Google Scholar]
- Lombardi, D. Climate crisis mitigation and adaptation: Educational and developmental psychology’s responsibility in helping face this threat. Educ. Dev. Psychol. 2022, 39, 1–4. [Google Scholar] [CrossRef]
- Ahmad, Z.; Saleem, A. Predicting Level of Development for Different Countries. J. Sustain. Dev. 2012, 5, 15. [Google Scholar] [CrossRef]
- Morse, S. Quality of Life, Well-Being and the Human Development Index: A Media Narrative for the Developed World? Soc. Indic. Res. 2023, 170, 1035–1058. [Google Scholar] [CrossRef]
- United Nations Development Programme. Technical Note 1. Human Development Index; UNDP: New York, NY, USA, 2018; pp. 1–6. [Google Scholar]
- Osakede, U.A.; Aramide, V.O.; Adesipo, A.E.; Akunna, L.C. Correlates of human development in Africa: Evidence across gender and income group. Res. Glob. 2023, 6, 100135. [Google Scholar] [CrossRef]
- Boswell, M.R.; Greve, A.I.; Seale, T.L. Climate Change Vulnerability Assessment. In Climate Action Planning: A Guide to Creating Low-Carbon, Resilient Communities; Boswell, M.R., Greve, A.I., Seale, T.L., Eds.; Island Press/Center for Resource Economics: Washington, DC, USA, 2019; pp. 172–191. ISBN 978-1-61091-964-7. [Google Scholar]
- Naylor, A.; Ford, J.; Pearce, T.; Van Alstine, J. Conceptualizing Climate Vulnerability in Complex Adaptive Systems. One Earth 2020, 2, 444–454. [Google Scholar] [CrossRef]
- Michalak, J.L.; Withey, J.C.; Lawler, J.J.; Case, M.J. Future climate vulnerability—Evaluating multiple lines of evidence. Front. Ecol. Environ. 2017, 15, 367–376. [Google Scholar] [CrossRef]
- Warren, R.F.; Wilby, R.L.; Brown, K.; Watkiss, P.; Betts, R.A.; Murphy, J.M.; Lowe, J.A. Advancing national climate change risk assessment to deliver national adaptation plans. Philos. Trans. R. Soc. Math. Phys. Eng. Sci. 2018, 376, 20170295. [Google Scholar] [CrossRef]
- Papathoma-Köhle, M.; Cristofari, G.; Wenk, M.; Fuchs, S. The importance of indicator weights for vulnerability indices and implications for decision making in disaster management. Int. J. Disaster Risk Reduct. 2019, 36, 101103. [Google Scholar] [CrossRef]
- Fakhruddin, B.; Boylan, K.; Wild, A.; Robertson, R. Chapter 12—Assessing vulnerability and risk of climate change. In Climate Extremes and Their Implications for Impact and Risk Assessment; Sillmann, J., Sippel, S., Russo, S., Eds.; Elsevier: Amsterdam, The Netherlands, 2020; pp. 217–241. ISBN 978-0-12-814895-2. [Google Scholar]
- Wang, P.; Qiao, W.; Wang, Y.; Cao, S.; Zhang, Y. Urban drought vulnerability assessment—A framework to integrate socio-economic, physical, and policy index in a vulnerability contribution analysis. Sustain. Cities Soc. 2020, 54, 102004. [Google Scholar] [CrossRef]
- Mboya, A. Vulnerability and the Climate Change Regime. UCLA J. Environ. Law Policy 2018, 36, 79–103. [Google Scholar] [CrossRef]
- Santos-Lacueva, R.; Ariza, E.; Romagosa, F.; Saladié, Ò. The vulnerability of destinations to climate change: A comparative analysis of contextual socio-political factors. J. Sustain. Tour. 2019, 27, 1217–1238. [Google Scholar] [CrossRef]
- Sarun, S.; Ghermandi, A.; Sheela, A.M.; Justus, J.; Vineetha, P. Climate change vulnerability in a tropical region based on environmental and socio-economic factors. Environ. Monit. Assess. 2018, 190, 727. [Google Scholar] [CrossRef]
- Surjan, A.; Kudo, S.; Uitto, J.I. Risk and Vulnerability. In Sustainable Development and Disaster Risk Reduction; Uitto, J.I., Shaw, R., Eds.; Disaster Risk Reduction; Springer: Tokyo, Japan, 2016; pp. 37–55. ISBN 978-4-431-55078-5. [Google Scholar]
- Formetta, G.; Feyen, L. Empirical evidence of declining global vulnerability to climate-related hazards. Glob. Environ. Chang. 2019, 57, 101920. [Google Scholar] [CrossRef]
- Nauges, C.; Wheeler, S.A.; Fielding, K.S. The relationship between country and individual household wealth and climate change concern: The mediating role of control. Environ. Dev. Sustain. 2021, 23, 16481–16503. [Google Scholar] [CrossRef]
- O’Neill, B.C.; Jiang, L.; Kc, S.; Fuchs, R.; Pachauri, S.; Laidlaw, E.K.; Zhang, T.; Zhou, W.; Ren, X. The effect of education on determinants of climate change risks. Nat. Sustain. 2020, 3, 520–528. [Google Scholar] [CrossRef]
- Bowen, A.; Cochrane, S.; Fankhauser, S. Climate change, adaptation and economic growth. Clim. Chang. 2012, 113, 95–106. [Google Scholar] [CrossRef]
- Wu, J.; Han, G.; Zhou, H.; Li, N. Economic development and declining vulnerability to climate-related disasters in China. Environ. Res. Lett. 2018, 13, 034013. [Google Scholar] [CrossRef]
- Kim, H.; Marcouiller, D.; Woosnam, K. Multilevel Climate Governance, Anticipatory Adaptation, and the Vulnerability-Readiness Nexus. Rev. Policy Res. 2021, 38, 222–242. [Google Scholar] [CrossRef]
- Jubeh, G.; Mimi, Z. Governance and Climate Vulnerability Index. Water Resour. Manag. 2012, 26, 4147–4162. [Google Scholar] [CrossRef]
- Thomas, K.; Hardy, R.D.; Lazrus, H.; Mendez, M.; Orlove, B.; Rivera-Collazo, I.; Roberts, J.T.; Rockman, M.; Warner, B.P.; Winthrop, R. Explaining differential vulnerability to climate change: A social science review. WIREs Clim. Chang. 2019, 10, e565. [Google Scholar] [CrossRef]
- Muiderman, K.; Gupta, A.; Vervoort, J.; Biermann, F. Four approaches to anticipatory climate governance: Different conceptions of the future and implications for the present. WIREs Clim. Chang. 2020, 11, e673. [Google Scholar] [CrossRef]
- Hamilton, M.; Lubell, M. Collaborative Governance of Climate Change Adaptation Across Spatial and Institutional Scales. Policy Stud. J. 2018, 46, 222–247. [Google Scholar] [CrossRef]
- Trell, E.-M.; Van Geet, M.T. The Governance of Local Urban Climate Adaptation: Towards Participation, Collaboration and Shared Responsibilities. Plan. Theory Pract. 2019, 20, 376–394. [Google Scholar] [CrossRef]
- Barnett, J. Global environmental change II: Political economies of vulnerability to climate change. Prog. Hum. Geogr. 2020, 44, 1172–1184. [Google Scholar] [CrossRef]
- Salamanca, A.; Nguyen, H. Climate Change Adaptation Readiness in the ASEAN Countries; Stockholm Environment Institute: Stockholm, Sweden, 2016. [Google Scholar]
- Cappelli, F. Investigating the Origins of Differentiated Vulnerabilities to Climate Change and their Effects on Wellbeing 2020. Econ. Politica 2023, 40, 1051–1074. [Google Scholar] [CrossRef]
- Turner, M.D. Climate vulnerability as a relational concept. Geoforum 2016, 68, 29–38. [Google Scholar] [CrossRef]
- Scott, D.; Hall, C.M.; Gössling, S. Global tourism vulnerability to climate change. Ann. Tour. Res. 2019, 77, 49–61. [Google Scholar] [CrossRef]
- Doshi, D.; Garschagen, M. Understanding Adaptation Finance Allocation: Which Factors Enable or Constrain Vulnerable Countries to Access Funding? Sustainability 2020, 12, 4308. [Google Scholar] [CrossRef]
- Williamson, T.; Hesseln, H.; Johnston, M. Adaptive capacity deficits and adaptive capacity of economic systems in climate change vulnerability assessment. For. Policy Econ. 2012, 15, 160–166. [Google Scholar] [CrossRef]
- Adom, P.K.; Amoani, S. The role of climate adaptation readiness in economic growth and climate change relationship: An analysis of the output/income and productivity/institution channels. J. Environ. Manag. 2021, 293, 112923. [Google Scholar] [CrossRef]
- Banerjee, S.; Hussain, A.; Tuladhar, S.; Mishra, A. Building capacities of women for climate change adaptation: Insights from migrant-sending households in Nepal. Clim. Chang. 2019, 157, 587–609. [Google Scholar] [CrossRef]
- Glaas, E.; Hjerpe, M.; Wihlborg, E.; Storbjörk, S. Disentangling municipal capacities for citizen participation in transformative climate adaptation. Environ. Policy Gov. 2022, 32, 179–191. [Google Scholar] [CrossRef]
- Mesfin, D.; Simane, B.; Belay, A.; Recha, J.W.; Schmiedel, U. Assessing the Adaptive Capacity of Households to Climate Change in the Central Rift Valley of Ethiopia. Climate 2020, 8, 106. [Google Scholar] [CrossRef]
- Abdul-Razak, M.; Kruse, S. The adaptive capacity of smallholder farmers to climate change in the Northern Region of Ghana. Clim. Risk Manag. 2017, 17, 104–122. [Google Scholar] [CrossRef]
- Chepkoech, W.; Mungai, N.W.; Stöber, S.; Lotze-Campen, H. Understanding adaptive capacity of smallholder African indigenous vegetable farmers to climate change in Kenya. Clim. Risk Manag. 2020, 27, 100204. [Google Scholar] [CrossRef]
- Nguyen, Q.A.; Miller, F.; Bowen, K.; Tan Sinh, B. Evaluating capacity for climate change adaptation in the health and water sectors in Vietnam: Constraints and opportunities. Clim. Dev. 2017, 9, 258–273. [Google Scholar] [CrossRef]
- Ranasinghe, R.D.A.K.; Korale-Gedara, P.M.; Weerasooriya, S.A. Climate change adaptation and adaptive capacities of dairy farmers: Evidence from village tank cascade systems in Sri Lanka. Agric. Syst. 2023, 206, 103609. [Google Scholar] [CrossRef]
- Eriksen, S.; Schipper, E.L.F.; Scoville-Simonds, M.; Vincent, K.; Adam, H.N.; Brooks, N.; Harding, B.; Khatri, D.; Lenaerts, L.; Liverman, D.; et al. Adaptation interventions and their effect on vulnerability in developing countries: Help, hindrance or irrelevance? World Dev. 2021, 141, 105383. [Google Scholar] [CrossRef]
- Leal Filho, W.; Azeiteiro, U.M.; Balogun, A.-L.; Setti, A.F.F.; Mucova, S.A.R.; Ayal, D.; Totin, E.; Lydia, A.M.; Kalaba, F.K.; Oguge, N.O. The influence of ecosystems services depletion to climate change adaptation efforts in Africa. Sci. Total Environ. 2021, 779, 146414. [Google Scholar] [CrossRef] [PubMed]
- Marino, E.; Ribot, J. Special Issue Introduction: Adding insult to injury: Climate change and the inequities of climate intervention. Glob. Environ. Chang. 2012, 22, 323–328. [Google Scholar] [CrossRef]
- Conevska, A.; Ford, J.; Lesnikowski, A.; Harper, S. Adaptation financing for projects focused on food systems through the UNFCCC. Clim. Policy 2019, 19, 43–58. [Google Scholar] [CrossRef]
- Theokritoff, E.; Thomas, A.; Lissner, T.; Schleussner, C.-F. Interacting adaptation constraints in the Caribbean highlight the importance of sustained adaptation finance. Clim. Risk Manag. 2023, 39, 100483. [Google Scholar] [CrossRef]
- Rahman, S.M.; Ahmad, M.M. Climate finance towards vulnerable countries: Evidence from the Global Environment Facility (GEF). Int. J. Green Econ. 2015, 9, 199. [Google Scholar] [CrossRef]
- Das, M. Allocation of Climate Funds and the Adaptation Infrastructure Gap. Sustain. Dev. Res. 2022, 4, p42. [Google Scholar] [CrossRef]
- Omukuti, J.; Barrett, S.; White, P.C.L.; Marchant, R.; Averchenkova, A. The green climate fund and its shortcomings in local delivery of adaptation finance. Clim. Policy 2022, 22, 1225–1240. [Google Scholar] [CrossRef]
- Saeed, S.; Makhdum, M.S.A.; Anwar, S.; Yaseen, M.R. Climate Change Vulnerability, Adaptation, and Feedback Hypothesis: A Comparison of Lower-Middle, Upper-Middle, and High-Income Countries. Sustainability 2023, 15, 4145. [Google Scholar] [CrossRef]
- Barrett, S. Subnational Adaptation Finance Allocation: Comparing Decentralized and Devolved Political Institutions in Kenya. Glob. Environ. Polit. 2015, 15, 118–139. [Google Scholar] [CrossRef]
- Basty, N.; Azouz Ghachem, D. A Sectoral Approach of Adaptation Finance in Developing Countries: Does Climate Justice Apply? Sustainability 2022, 14, 10835. [Google Scholar] [CrossRef]
- Baltagi, B.H. Introduction. In Econometric Analysis of Panel Data; Baltagi, B.H., Ed.; Springer Texts in Business and Economics; Springer International Publishing: Cham, Switzerland, 2021; pp. 1–14. ISBN 978-3-030-53953-5. [Google Scholar]
- Mabaso, M.; Zama, T.; Mlangeni, L.; Mbiza, S.; Mkhize-Kwitshana, Z. Association between the Human Development Index and Millennium Development Goals 6 Indicators in Sub-Saharan Africa from 2000 to 2014: Implications for the New Sustainable Development Goals. J. Epidemiol. Glob. Health 2018, 8, 77–81. [Google Scholar] [CrossRef]
- Climate Finance and the USD 100 Billion Goal—OECD. Available online: https://www.oecd.org/climate-change/finance-usd-100-billion-goal/ (accessed on 8 November 2023).
- World Development Indicators|DataBank. Available online: https://databank.worldbank.org/source/world-development-indicators/Series/EN.ATM.GHGT.KT.CE (accessed on 14 November 2023).
- Malik, I.H.; Ford, J.D. Addressing the Climate Change Adaptation Gap: Key Themes and Future Directions. Climate 2024, 12, 24. [Google Scholar] [CrossRef]
- United Nations Environment Programme. Adaptation Gap Report 2022: Too Little, Too Slow—Climate Adaptation Failure Puts World at Risk; United Nations Environment Programme: Nairobi, Kenya, 2022. [Google Scholar]
- Asian Development Bank. Climate Finance Landscape of Asia and the Pacific; Asian Development Bank: Manila, Philippines, 2023. [Google Scholar]
- UNFCCC. Climate Change: Impacts, Vulnerabilities and Adaptation in Developing Countries; UNFCCC: New York, NY, USA, 2007. [Google Scholar]
- Global Center on Adaptation. State and Trends in Climate Adaptation Finance 2023; Global Center on Adaptation: Rotterdam, The Netherlands, 2023. [Google Scholar]
- Phillips, P.C.B.; Sul, D. Dynamic panel estimation and homogeneity testing under cross section dependence. Econom. J. 2003, 6, 217–259. [Google Scholar] [CrossRef]
- Breusch, T.S.; Pagan, A.R. The Lagrange Multiplier Test and its Applications to Model Specification in Econometrics. Rev. Econ. Stud. 1980, 47, 239–253. [Google Scholar] [CrossRef]
- Baltagi, B.H.; Feng, Q.; Kao, C. A Lagrange Multiplier test for cross-sectional dependence in a fixed effects panel data model. J. Econom. 2012, 170, 164–177. [Google Scholar] [CrossRef]
- Brooks, C. Introductory Econometrics for Finance; Cambridge University Press: Cambridge, UK, 2019; ISBN 978-1-108-42253-6. [Google Scholar]
- Lancelot, M.L. Raod: Analysis of Overdispersed Data. R Package Version 0.4-1.2 2022. Available online: https://cran.r-project.org/web/packages/aod/aod.pdf (accessed on 10 April 2024).
- Riffenburgh, R.H. Chapter 25—Epidemiology. In Statistics in Medicine, 3rd ed.; Riffenburgh, R.H., Ed.; Academic Press: San Diego, CA, USA, 2012; pp. 535–549. ISBN 978-0-12-384864-2. [Google Scholar]
- Born, B.; Breitung, J. Testing for Serial Correlation in Fixed-Effects Panel Data Models. Econom. Rev. 2016, 35, 1290–1316. [Google Scholar] [CrossRef]
- Drukker, D.M. Testing for Serial Correlation in Linear Panel-data Models. Stata J. 2003, 3, 168–177. [Google Scholar] [CrossRef]
- Bai, J.; Choi, S.H.; Liao, Y. Feasible generalized least squares for panel data with cross-sectional and serial correlations. Empir. Econ. 2021, 60, 309–326. [Google Scholar] [CrossRef]
- Hothorn, T.; Zeileis, A.; Farebrother, R.W.; Cummins, C.; Millo, G.; Mitchell, D. lmtest: Testing Linear Regression Models. R Package Version 0.9-40 2022. Available online: https://cran.r-project.org/web/packages/lmtest/lmtest.pdf (accessed on 10 April 2024).
- Shrestha, M.B.; Bhatta, G.R. Selecting appropriate methodological framework for time series data analysis. J. Finance Data Sci. 2018, 4, 71–89. [Google Scholar] [CrossRef]
- Lin, Z.; Brannigan, A. Advances in the Analysis of Non-stationary Time Series: An Illustration of Cointegration and Error Correction Methods in Research on Crime and Immigration. Qual. Quant. 2003, 37, 151–168. [Google Scholar] [CrossRef]
- Jalil, A.; Rao, N.H. Chapter 8—Time Series Analysis (Stationarity, Cointegration, and Causality). In Environmental Kuznets Curve (EKC); Özcan, B., Öztürk, I., Eds.; Academic Press: Cambridge, MA, USA, 2019; pp. 85–99. ISBN 978-0-12-816797-7. [Google Scholar]
- Phillips, P.; Peron, R. Testing for a Unit Root in Time Series Regression. Oxf. Univ. Press Biom. Trust. 1988, 75, 335–346. Available online: https://www.jstor.org/stable/2336182 (accessed on 10 April 2024). [CrossRef]
- Herwartz, H.; Maxand, S.; Raters, F.H.C.; Walle, Y.M. Panel Unit-root Tests for Heteroskedastic Panels. Stata J. 2018, 18, 184–196. [Google Scholar] [CrossRef]
- Banerjee, A. Panel Data Unit Roots and Cointegration: An Overview. Oxf. Bull. Econ. Stat. 1999, 61, 607–629. [Google Scholar] [CrossRef]
- Beck, N.; Katz, J.N. What to do (and not to do) with Time-Series Cross-Section Data. Am. Polit. Sci. Rev. 1995, 89, 634–647. [Google Scholar] [CrossRef]
- Maureen Tobechukwu, N.; Maxwell Azubuike, I. Panel Data Estimators in the Presence of Serial and Spatial Correlation with Panel Heteroscedasticity: A Simulation Study. Q. J. Econom. Res. 2020, 6, 1–11. [Google Scholar] [CrossRef]
- Appiah-Otoo, I.; Acheampong, A.O.; Song, N.; Chen, X. The impact of information and communication technology (ICT) on carbon dioxide emissions: Evidence from heterogeneous ICT countries. Energy Environ. 2023, 34, 3080–3102. [Google Scholar] [CrossRef]
- Freitag, C.; Berners-Lee, M.; Widdicks, K.; Knowles, B.; Blair, G.S.; Friday, A. The real climate and transformative impact of ICT: A critique of estimates, trends, and regulations. Patterns 2021, 2, 100340. [Google Scholar] [CrossRef]
- Dauda, L.; Long, X.; Mensah, C.N.; Salman, M. The effects of economic growth and innovation on CO2 emissions in different regions. Environ. Sci. Pollut. Res. 2019, 26, 15028–15038. [Google Scholar] [CrossRef] [PubMed]
- Du, K.; Li, J. Towards a green world: How do green technology innovations affect total-factor carbon productivity. Energy Policy 2019, 131, 240–250. [Google Scholar] [CrossRef]
- Bétila, R.R. The impact of Ease of Doing Business on economic growth: A dynamic panel analysis for African countries. SN Bus. Econ. 2021, 1, 144. [Google Scholar] [CrossRef]
- Alaeddine, H. The Mediating Effect of Ease of Doing Business on the Relationship Between Public Debt and infrastructure In Arab Countries. BAU J. Creat. Sustain. Dev. 2023, 4, 10. [Google Scholar] [CrossRef]
- Fernández Lopera, C.C.; Mendes, J.M.; Barata, E.J. The Differential Risk Transfer: A new approach for reducing vulnerability to climate-related hazards. Disaster Prev. Manag. Int. J. 2022, 31, 550–564. [Google Scholar] [CrossRef]
- Ayanlade, A.; Smucker, T.A.; Nyasimi, M.; Sterly, H.; Weldemariam, L.F.; Simpson, N.P. Complex climate change risk and emerging directions for vulnerability research in Africa. Clim. Risk Manag. 2023, 40, 100497. [Google Scholar] [CrossRef]
Figure 1.
Average Human Development Index (HDI) of African countries for the period of 2012–2021. The Human Development Index is a United Nations country-ranking composite index comprising social and economic development indicators.
Figure 1.
Average Human Development Index (HDI) of African countries for the period of 2012–2021. The Human Development Index is a United Nations country-ranking composite index comprising social and economic development indicators.

Figure 2.
African countries’ climate vulnerability. The climate vulnerability averages for the 2012–2021 period are sourced from the University of Notre Dame Global Adaptation Index (ND-GAIN).
Figure 2.
African countries’ climate vulnerability. The climate vulnerability averages for the 2012–2021 period are sourced from the University of Notre Dame Global Adaptation Index (ND-GAIN).

Figure 3.
Africa Climate Adaptation Development Finance. The data are the totals in USD thousands from the period of 2012–2021 and are based on the OECD Climate-related Development Finance datasets.
Figure 3.
Africa Climate Adaptation Development Finance. The data are the totals in USD thousands from the period of 2012–2021 and are based on the OECD Climate-related Development Finance datasets.

Figure 4.
Africa’s overall climate adaptation readiness by country. The overall climate readiness index is an average of the period of 2012−2022 and is a factor of economic, social, and governance readiness as reported by ND-GAIN.
Figure 4.
Africa’s overall climate adaptation readiness by country. The overall climate readiness index is an average of the period of 2012−2022 and is a factor of economic, social, and governance readiness as reported by ND-GAIN.

Figure 5.
Average governance adaptation readiness of African countries for the period of 2012−2021.

Figure 6.
Average social adaptation readiness of African countries for the period of 2012−2021.

Figure 7.
Average economic adaptation readiness of African countries for the period of 2012−2021.

Figure 8.
Climate adaptation finance of African countries for the period of 2012−2021.

Figure 9.
Overall African adaptation readiness vs. climate vulnerability trend.

Figure 10.
Heterogeneity of climate vulnerability across time.


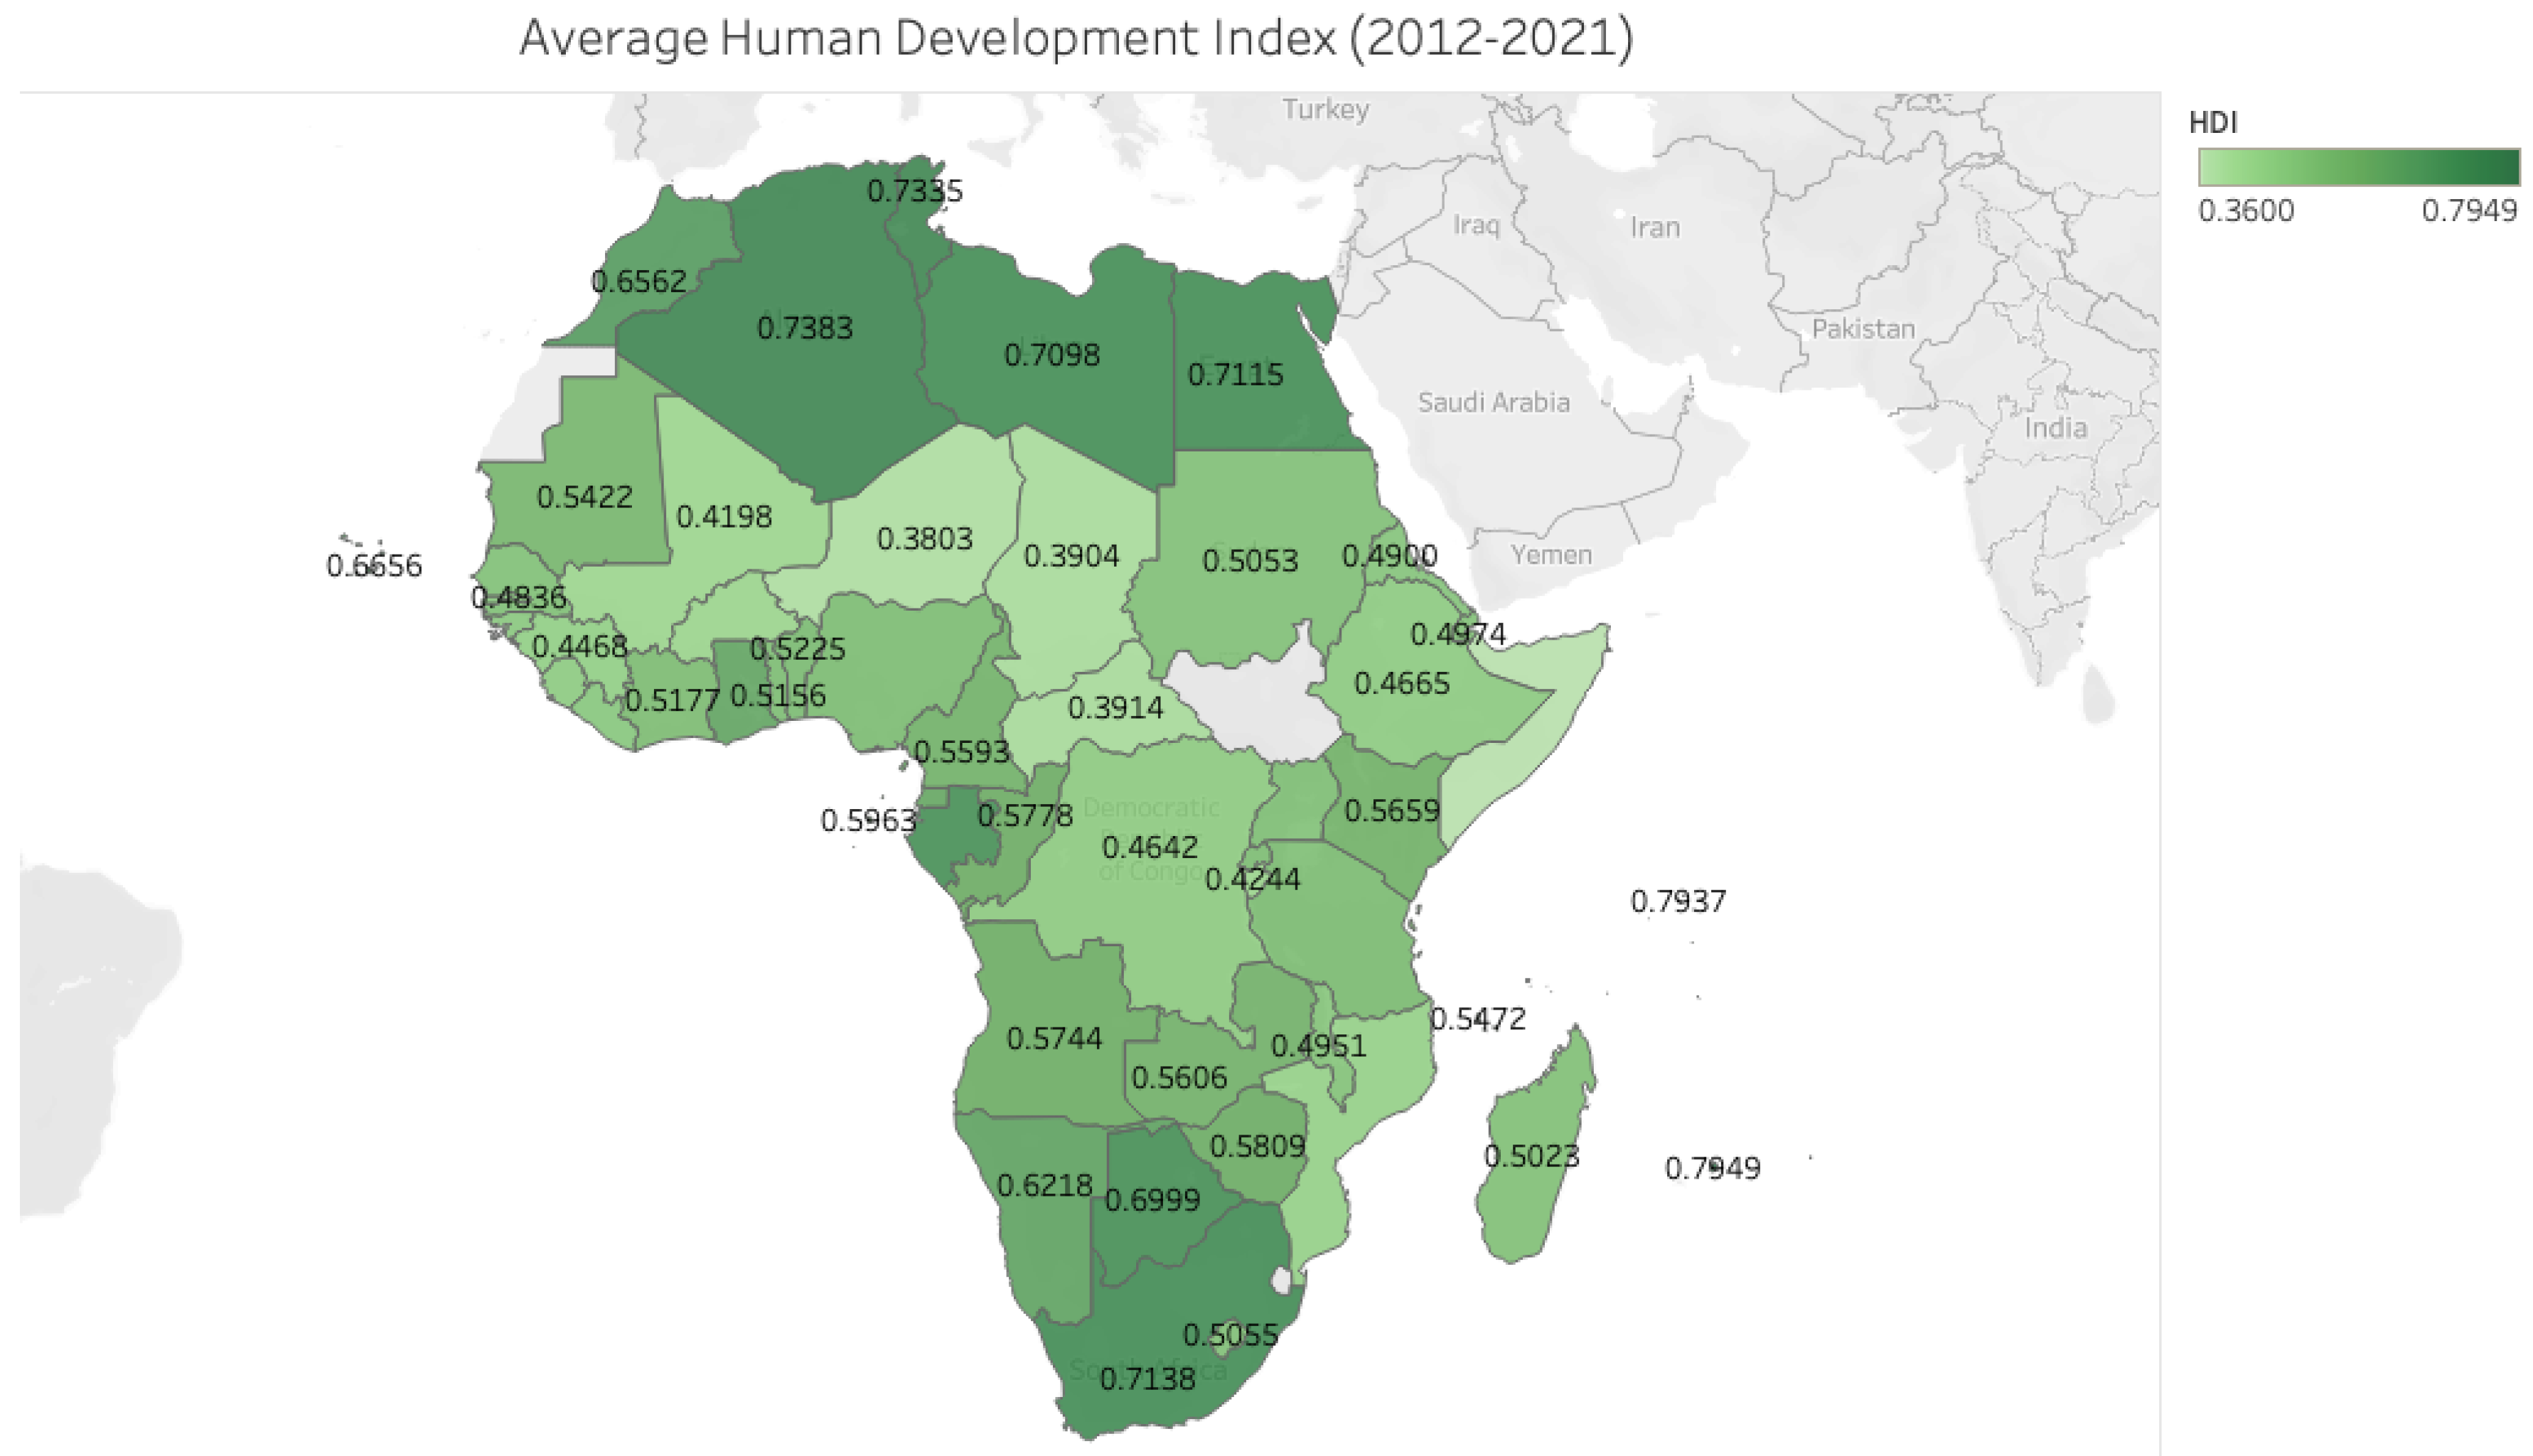
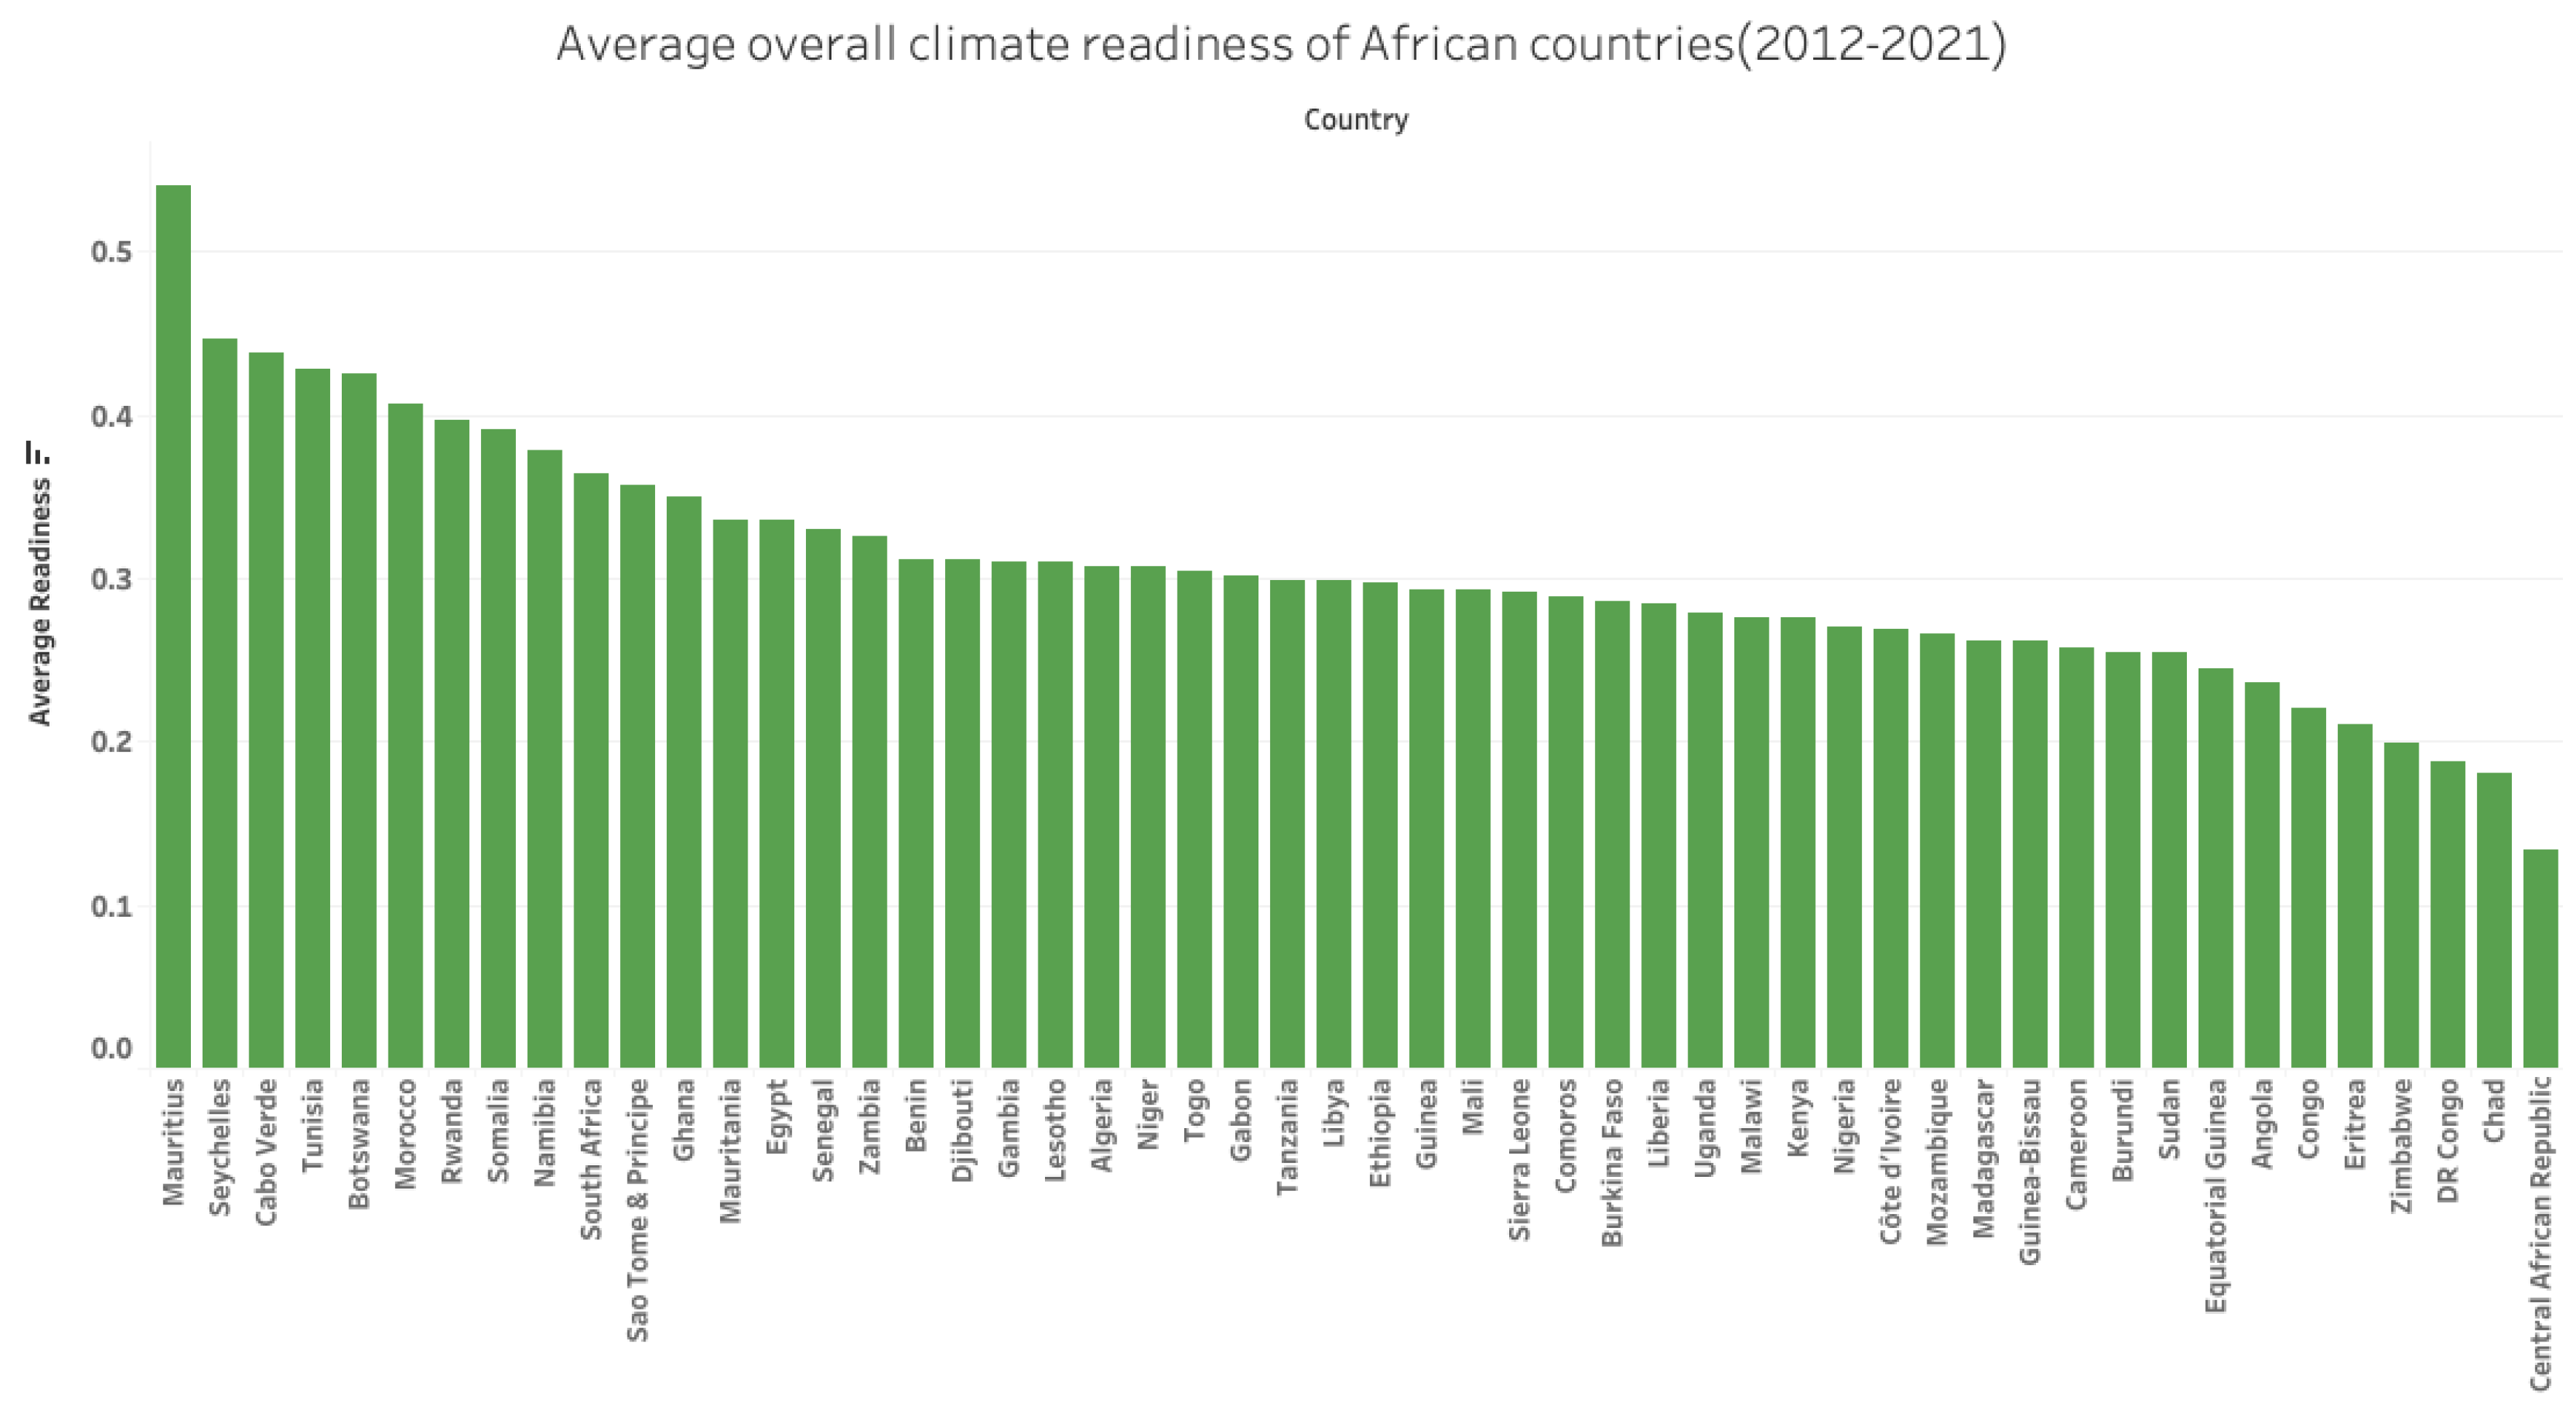
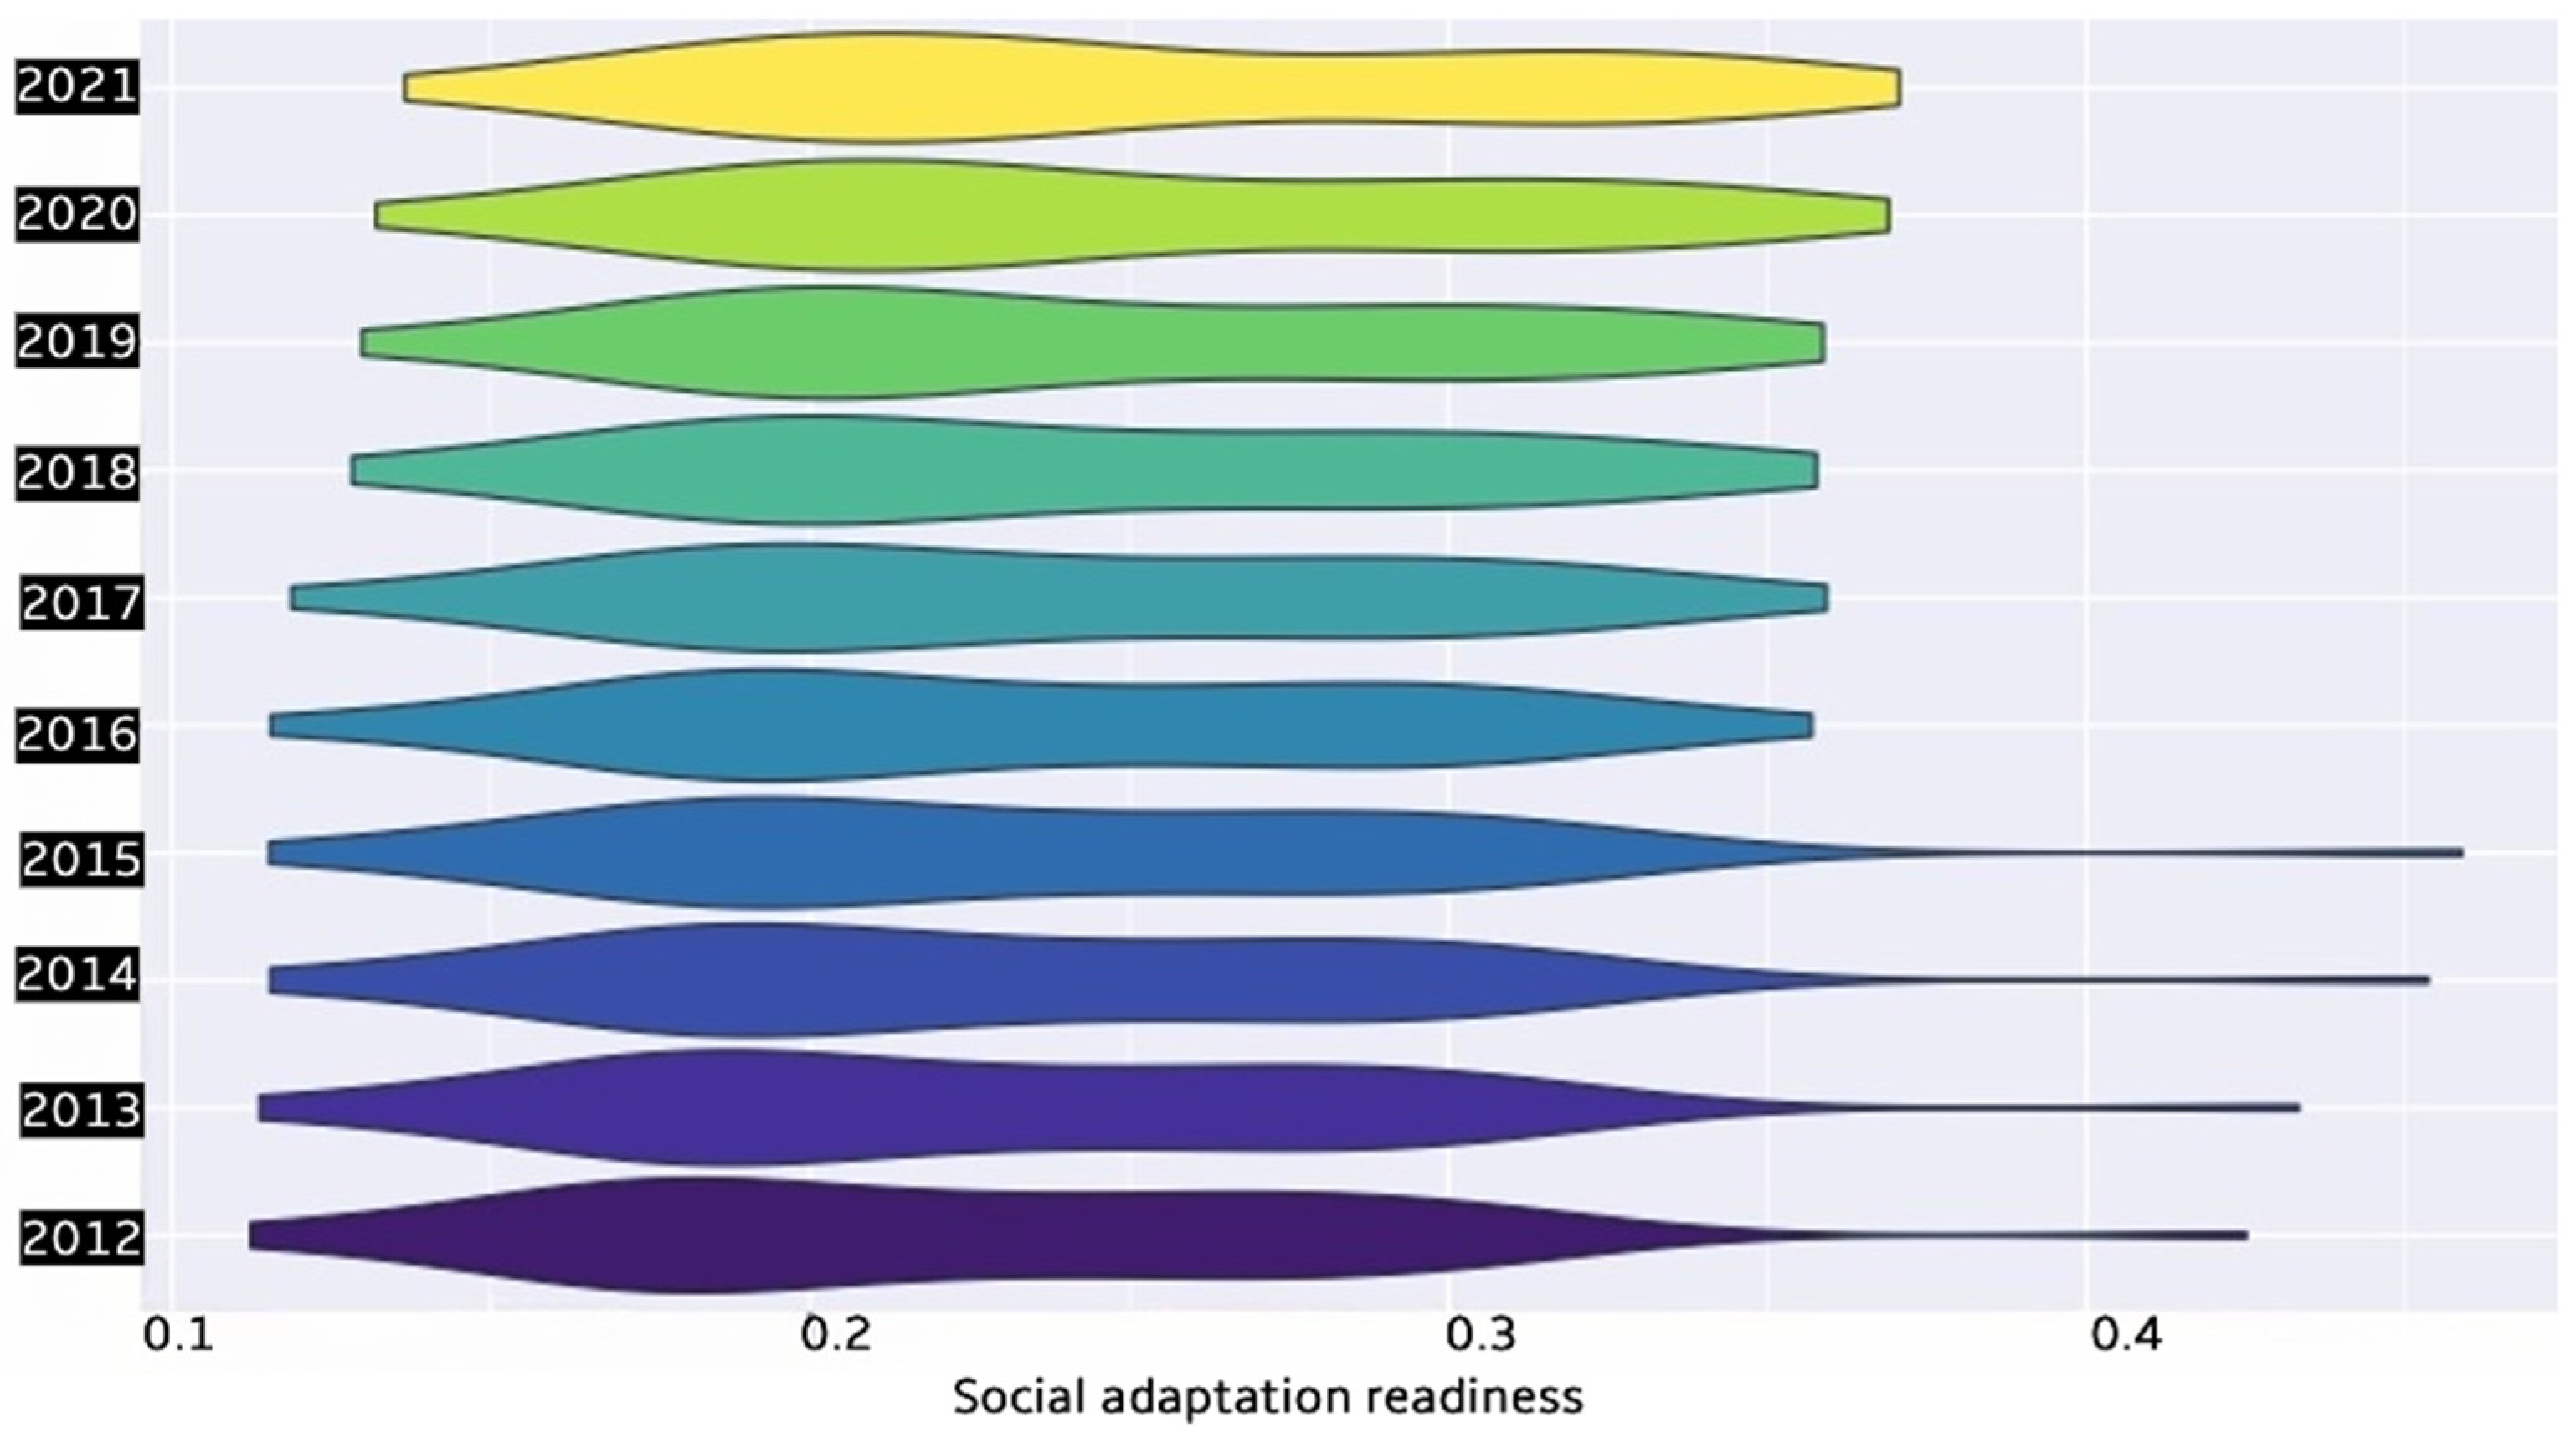
Table 1.
Normality test output.
| Skewness and Kurtosis Test for Normality Joint Test | |||||
|---|---|---|---|---|---|
| Variable | 0 bs | Pr (Skewness) | Pr (Kurtosis) | Adj chi2 (2) | Prob > chi2 |
| resid | 520 | 0.0000 | 0.6644 | 25.42 | 0.0000 |
Table 2.
Cross-sectional dependence test output.
| Z Statistic | p-Value |
|---|---|
| 2.4075 | 0.0161 |
Table 3.
Heteroscedasticity test output.
| Chi2 | DF | p-Value |
|---|---|---|
| 68.6 | 5 | 0.0000 |
Table 4.
Serial correlation output.
| Chi2 | DF | p-Value |
|---|---|---|
| 118.93 | 1 | 0.0000 |
Table 5.
Phillips–Perron unit root test output per variable.
| Variable | Dickey–Fuller | p-Value |
|---|---|---|
| Climate vulnerability | −6.016 | 0.01 |
| Climate Adaptation Finance | −7.2769 | 0.01 |
| Economic readiness | −6.3659 | 0.01 |
| Governance readiness | −5.4711 | 0.01 |
| Social readiness | −5.3766 | 0.01 |
| GHG emissions | −5.8296 | 0.01 |
Table 6.
Kao-cointegration test results.
| Static | p-Value | |
|---|---|---|
| Modified Dickey–Fuller t | −5.0399 | 0.0000 |
| Dickey–Fuller t | −11.9640 | 0.0000 |
| Augmented Dickey–Fuller t | −6.2431 | 0.0000 |
| Unadjusted modified Dickey–Fuller t | −11.8750 | 0.0000 |
| Unadjusted Dickey–Fuller t | −14.7455 | 0.0000 |
Table 7.
Overall Prais–Winsten regression output with panel-corrected standard error (PCSE): Depedent variable:climate vulnerability.
Table 7.
Overall Prais–Winsten regression output with panel-corrected standard error (PCSE): Depedent variable:climate vulnerability.
| Variable | Coefficient | Std. Err. | Z | p > Z | [95% Conf. Interval] | |
|---|---|---|---|---|---|---|
| CAFlog | −0.0207 | 0.0004 | −2.07 | 0.039 | −0.0014 | 0.0003 |
| Economic readiness | −0.1282 | 0.0170 | −7.52 | 0.000 | −0.1616 | −0.0948 |
| Governance readiness | −0.1878 | 0.0285 | −6.59 | 0.000 | −0.2437 | −0.1319 |
| Social readiness | 0.1198 | 0.0181 | 6.62 | 0.000 | 0.0843 | 0.1552 |
| GHGlog | 0.0044 | 0.0008 | 5.25 | 0.000 | 0.0028 | 0.0060 |
| LagV | 0.3883 | 0.0697 | 4.86 | 0.000 | 0.2022 | 0.4755 |
| Constant | 0.3560 | 0.0363 | 9.82 | 0.000 | 0.2849 | 0.4271 |
| rhos= | 1 | −0.2923 | 0.4447 | −0.3651 | 1 | −0.0269 |
| Wald chi2(6)= | 2810.32 | |||||
| Prob > chi2= | 0.0000 | |||||
CAF log is the natural log of the climate adaptation finance. GHG log is the natural log of greenhouse gas emissions. Lag V is the lagged value of the vulnerability index.
Table 8.
Low-HDI countries’ PCSE empirical output. Dependent variable: climate vulnerability.
| Variable | Coefficient | Std. Err. | Z | p > Z | [95% Conf. | Interval] |
|---|---|---|---|---|---|---|
| CAFlog | −0.0106 | 0.0005 | −1.24 | 0.214 | −0.0015 | 0.0003 |
| Economic readiness | −0.0735 | 0.0125 | −5.87 | 0.000 | −0.0980 | −0.0489 |
| Governance readiness | −0.2219 | 0.0161 | −13.74 | 0.000 | −0.2536 | −0.1903 |
| Social readiness | 0.0561 | 0.0435 | 1.29 | 0.198 | −0.0293 | 0.1415 |
| GHGlog | 0.0174 | 0.0016 | 11.23 | 0.000 | 0.01438 | 0.0205 |
| Lag V | 0.3033 | 0.0545 | 5.57 | 0.000 | 0.1966 | 0.4101 |
| cons | 0.1805 | 0.0153 | 11.82 | 0.000 | 0.1506 | 0.2105 |
| rhos= | 1 | 1 | 1 | −0.3687 | 1 | −1 |
| Wald chi2(6)= | 9692.34 | |||||
| Prob > chi2= | 0.0000 |
Table 9.
Average-HDI countries’ PCSE empirical output. Dependent variable: climate vulnerability.
| V | Coefficient | Std. Err. | Z | p > Z | [95% Conf. | Interval] |
|---|---|---|---|---|---|---|
| CAFlog | −0.0322 | 0.0005 | −4.48 | 0.000 | −0.0031 | −0.0012 |
| Economic readiness | 0.0328 | 0.0119 | 2.75 | 0.006 | 0.0094 | 0.0561 |
| Governance readiness | −0.0856 | 0.0222 | −3.86 | 0.000 | −0.1291 | −0.0421 |
| Social readiness | 0.0544 | 0.0297 | 1.83 | 0.067 | −0.0039 | 0.1127 |
| GHGlog | 0.0038 | 0.0007 | −5.57 | 0.000 | −0.0052 | −0.0025 |
| lagV | 0.1556 | 0.0570 | 2.73 | 0.006 | 0.0438 | 0.2674 |
| cons | 0.5394 | 0.0371 | 14.53 | 0.000 | 0.4667 | 0.6122 |
| rhos= | 0.4035 | 0.0303 | 1 | 0.0454 | 0.5301 | 1 |
| Wald chi2(6)= | 73.82 | |||||
| Prob > chi2= | 0.0000 |
Table 10.
High-HDI countries PCSE empirical output. Dependent variable: climate vulnerability.
| Variable | Coefficient | Std. Err. | Z | p > Z | [95% Conf. | Interval] |
|---|---|---|---|---|---|---|
| CAFlog | −0.0107 | 0.0003 | −2.43 | 0.015 | −0.0013 | −0.0001 |
| Economic readiness | −0.0960 | 0.0188 | −5.09 | 0.000 | −0.1329 | −0.0590 |
| Governance readiness | −0.0704 | 0.01732 | 4.07 | 0.000 | 0.0365 | 0.1044 |
| Social readiness | −0.0180 | 0.01769 | −1.02 | 0.039 | −0.0527 | 0.0167 |
| GHGlog | 0.0044 | 0.0020 | 2.18 | 0.029 | 0.0004 | 0.0084 |
| lagV | 0.4693 | 0.0800 | 5.87 | 0.000 | 0.3126 | 0.6261 |
| cons | 0.1678 | 0.0494 | 3.40 | 0.001 | 0.0711 | 0.2646 |
| rhos | 0.4749 | 1 | 1 | 0.3313 | 0.7167 | 0.6119 |
| Wald chi2(6)= | 705.5 | |||||
| Prob > chi2= | 0.0000 |
Disclaimer/Publisher’s Note: The statements, opinions and data contained in all publications are solely those of the individual author(s) and contributor(s) and not of MDPI and/or the editor(s). MDPI and/or the editor(s) disclaim responsibility for any injury to people or property resulting from any ideas, methods, instructions or products referred to in the content. |
© 2024 by the authors. Licensee MDPI, Basel, Switzerland. This article is an open access article distributed under the terms and conditions of the Creative Commons Attribution (CC BY) license (https://creativecommons.org/licenses/by/4.0/).
Share and Cite
MDPI and ACS Style
Maina, P.; Parádi-Dolgos, A. The Effectiveness of Climate Adaptation Finance and Readiness on Vulnerability in African Economies. Climate 2024, 12, 59. https://doi.org/10.3390/cli12050059
AMA Style
Maina P, Parádi-Dolgos A. The Effectiveness of Climate Adaptation Finance and Readiness on Vulnerability in African Economies. Climate. 2024; 12(5):59. https://doi.org/10.3390/cli12050059
Chicago/Turabian StyleMaina, Purity, and Anett Parádi-Dolgos. 2024. "The Effectiveness of Climate Adaptation Finance and Readiness on Vulnerability in African Economies" Climate 12, no. 5: 59. https://doi.org/10.3390/cli12050059
Note that from the first issue of 2016, this journal uses article numbers instead of page numbers. See further details here.