Climate Change in Afghanistan Deduced from Reanalysis and Coordinated Regional Climate Downscaling Experiment (CORDEX)—South Asia Simulations
Abstract
:1. Introduction
2. Regional Setting, Data and Methods
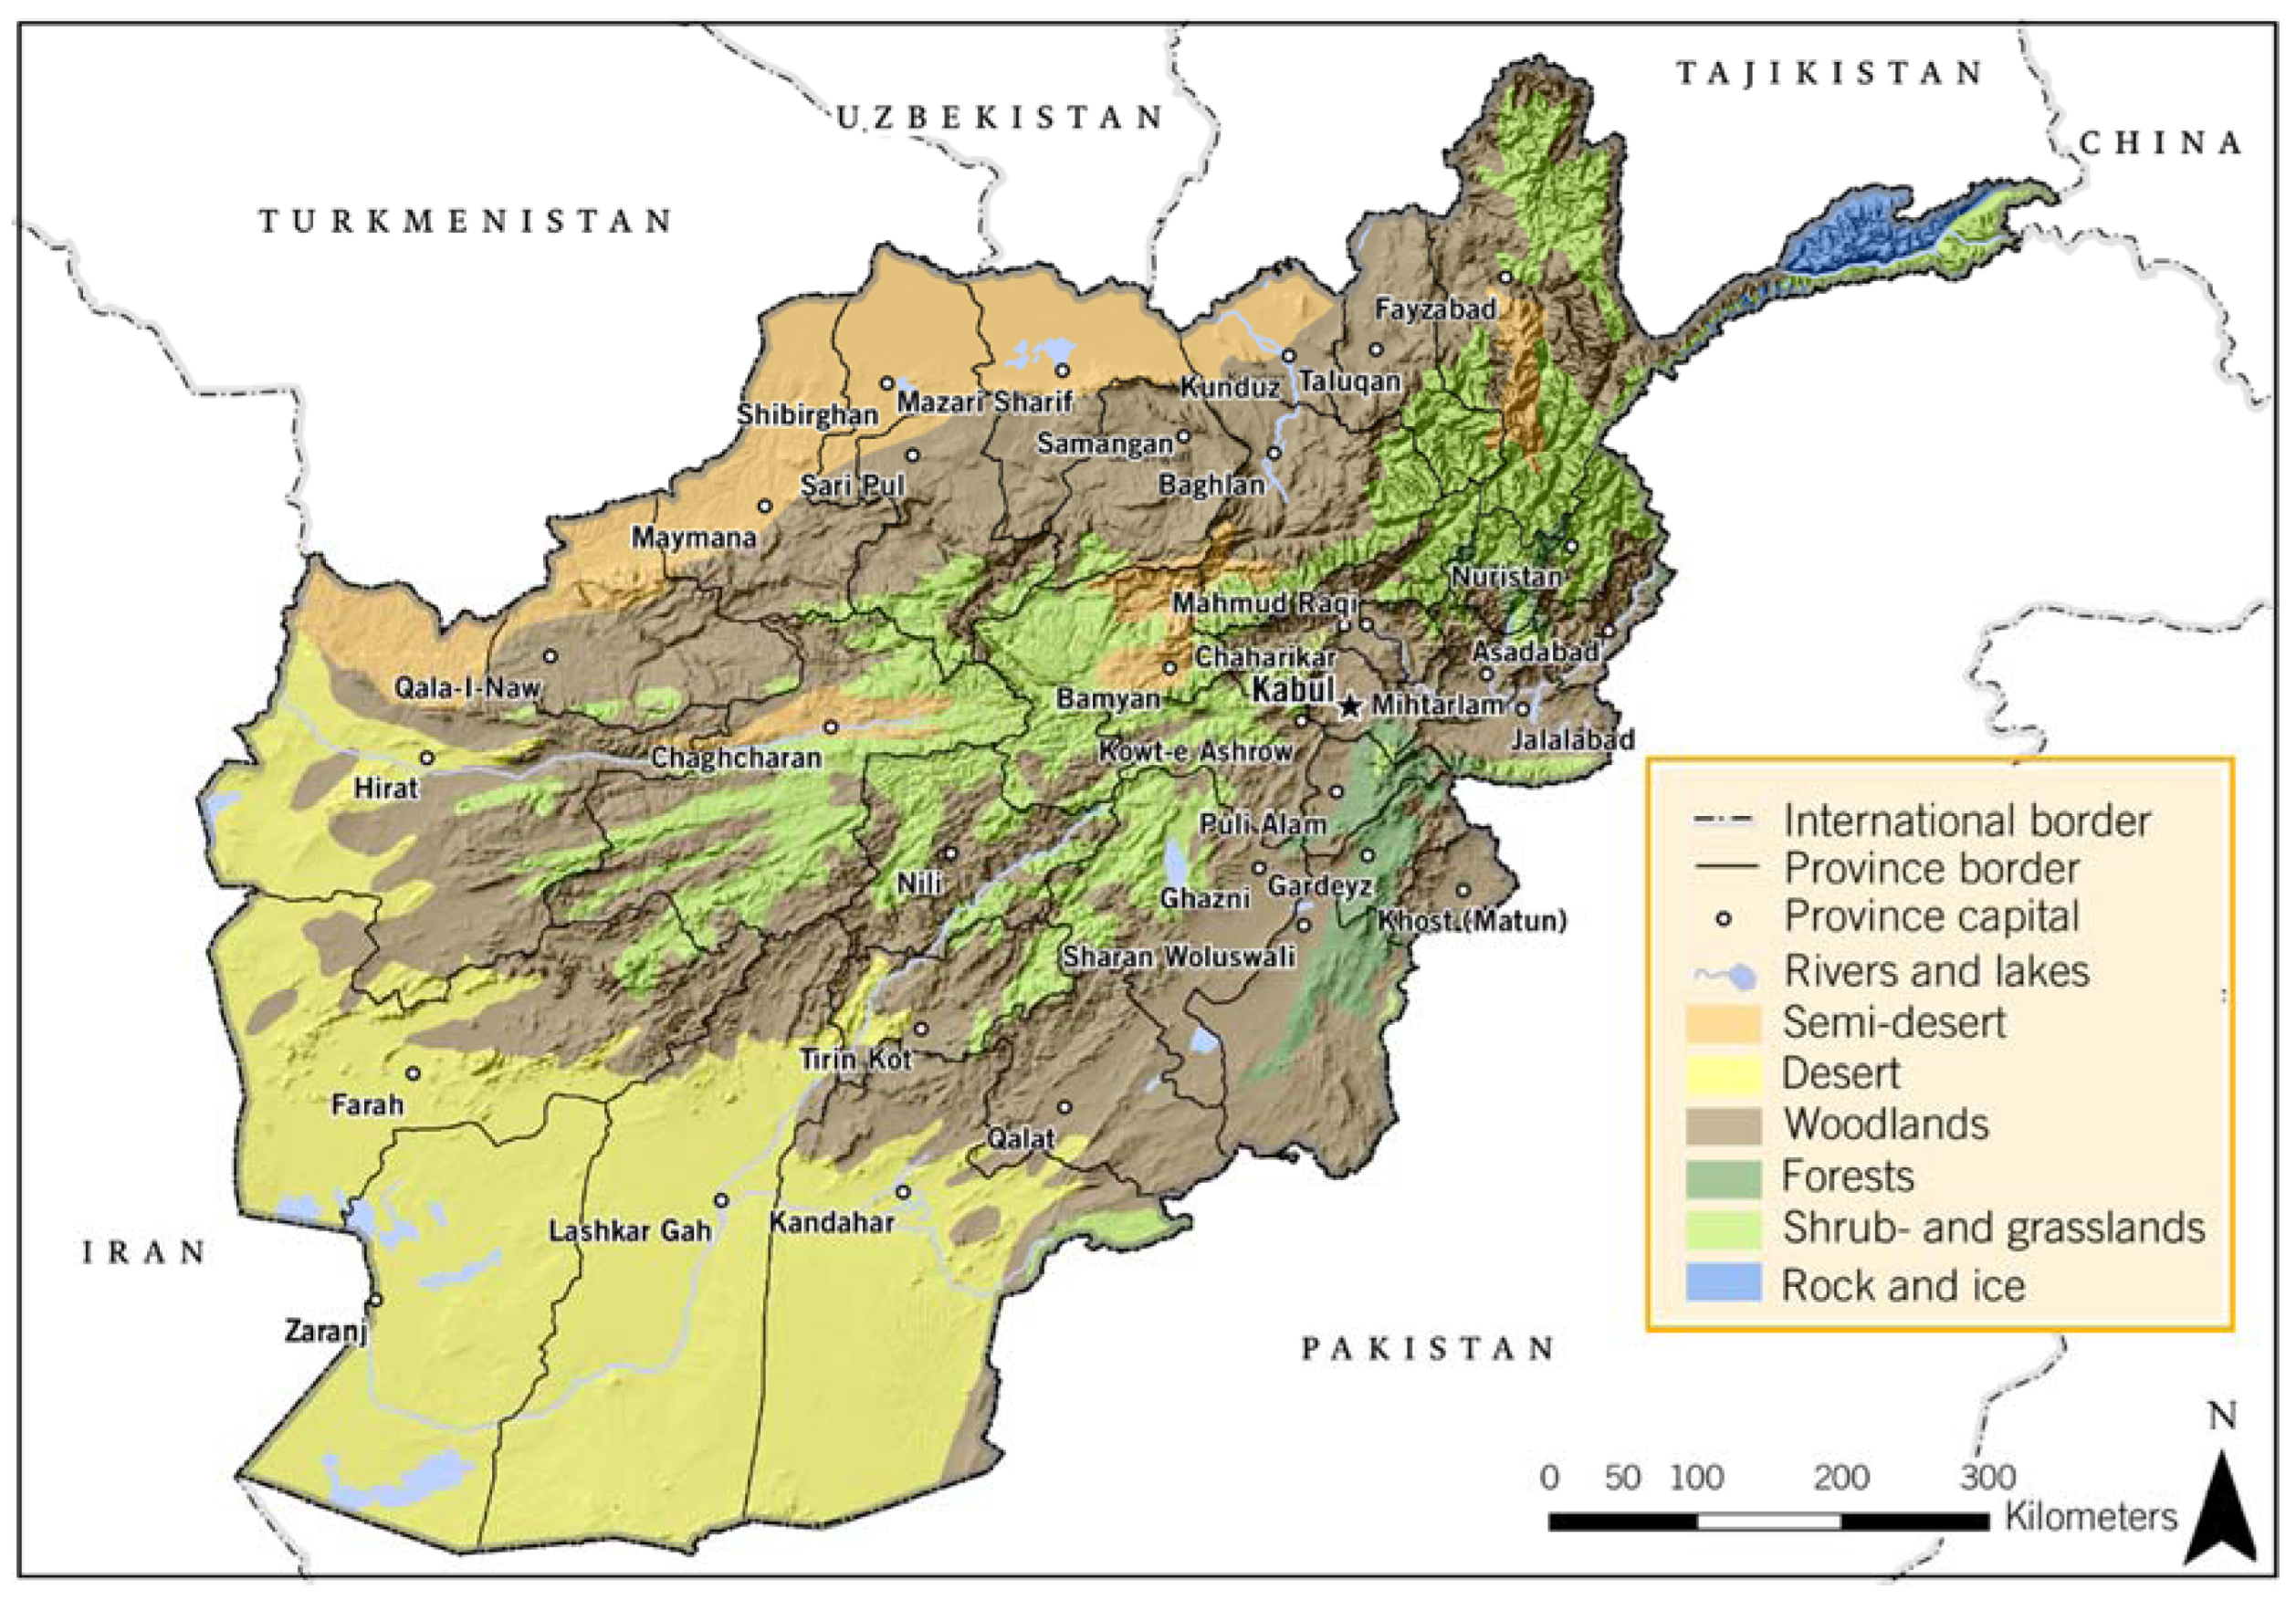
2.1. Natural Regions of Afghanistan
2.1.1. Hindu Kush
2.1.2. Northern Plains (North)
2.1.3. Central Highlands (Centre)
2.1.4. Eastern Highlands (East)
2.1.5. Southern Plateau (South)
2.2. Climate Data
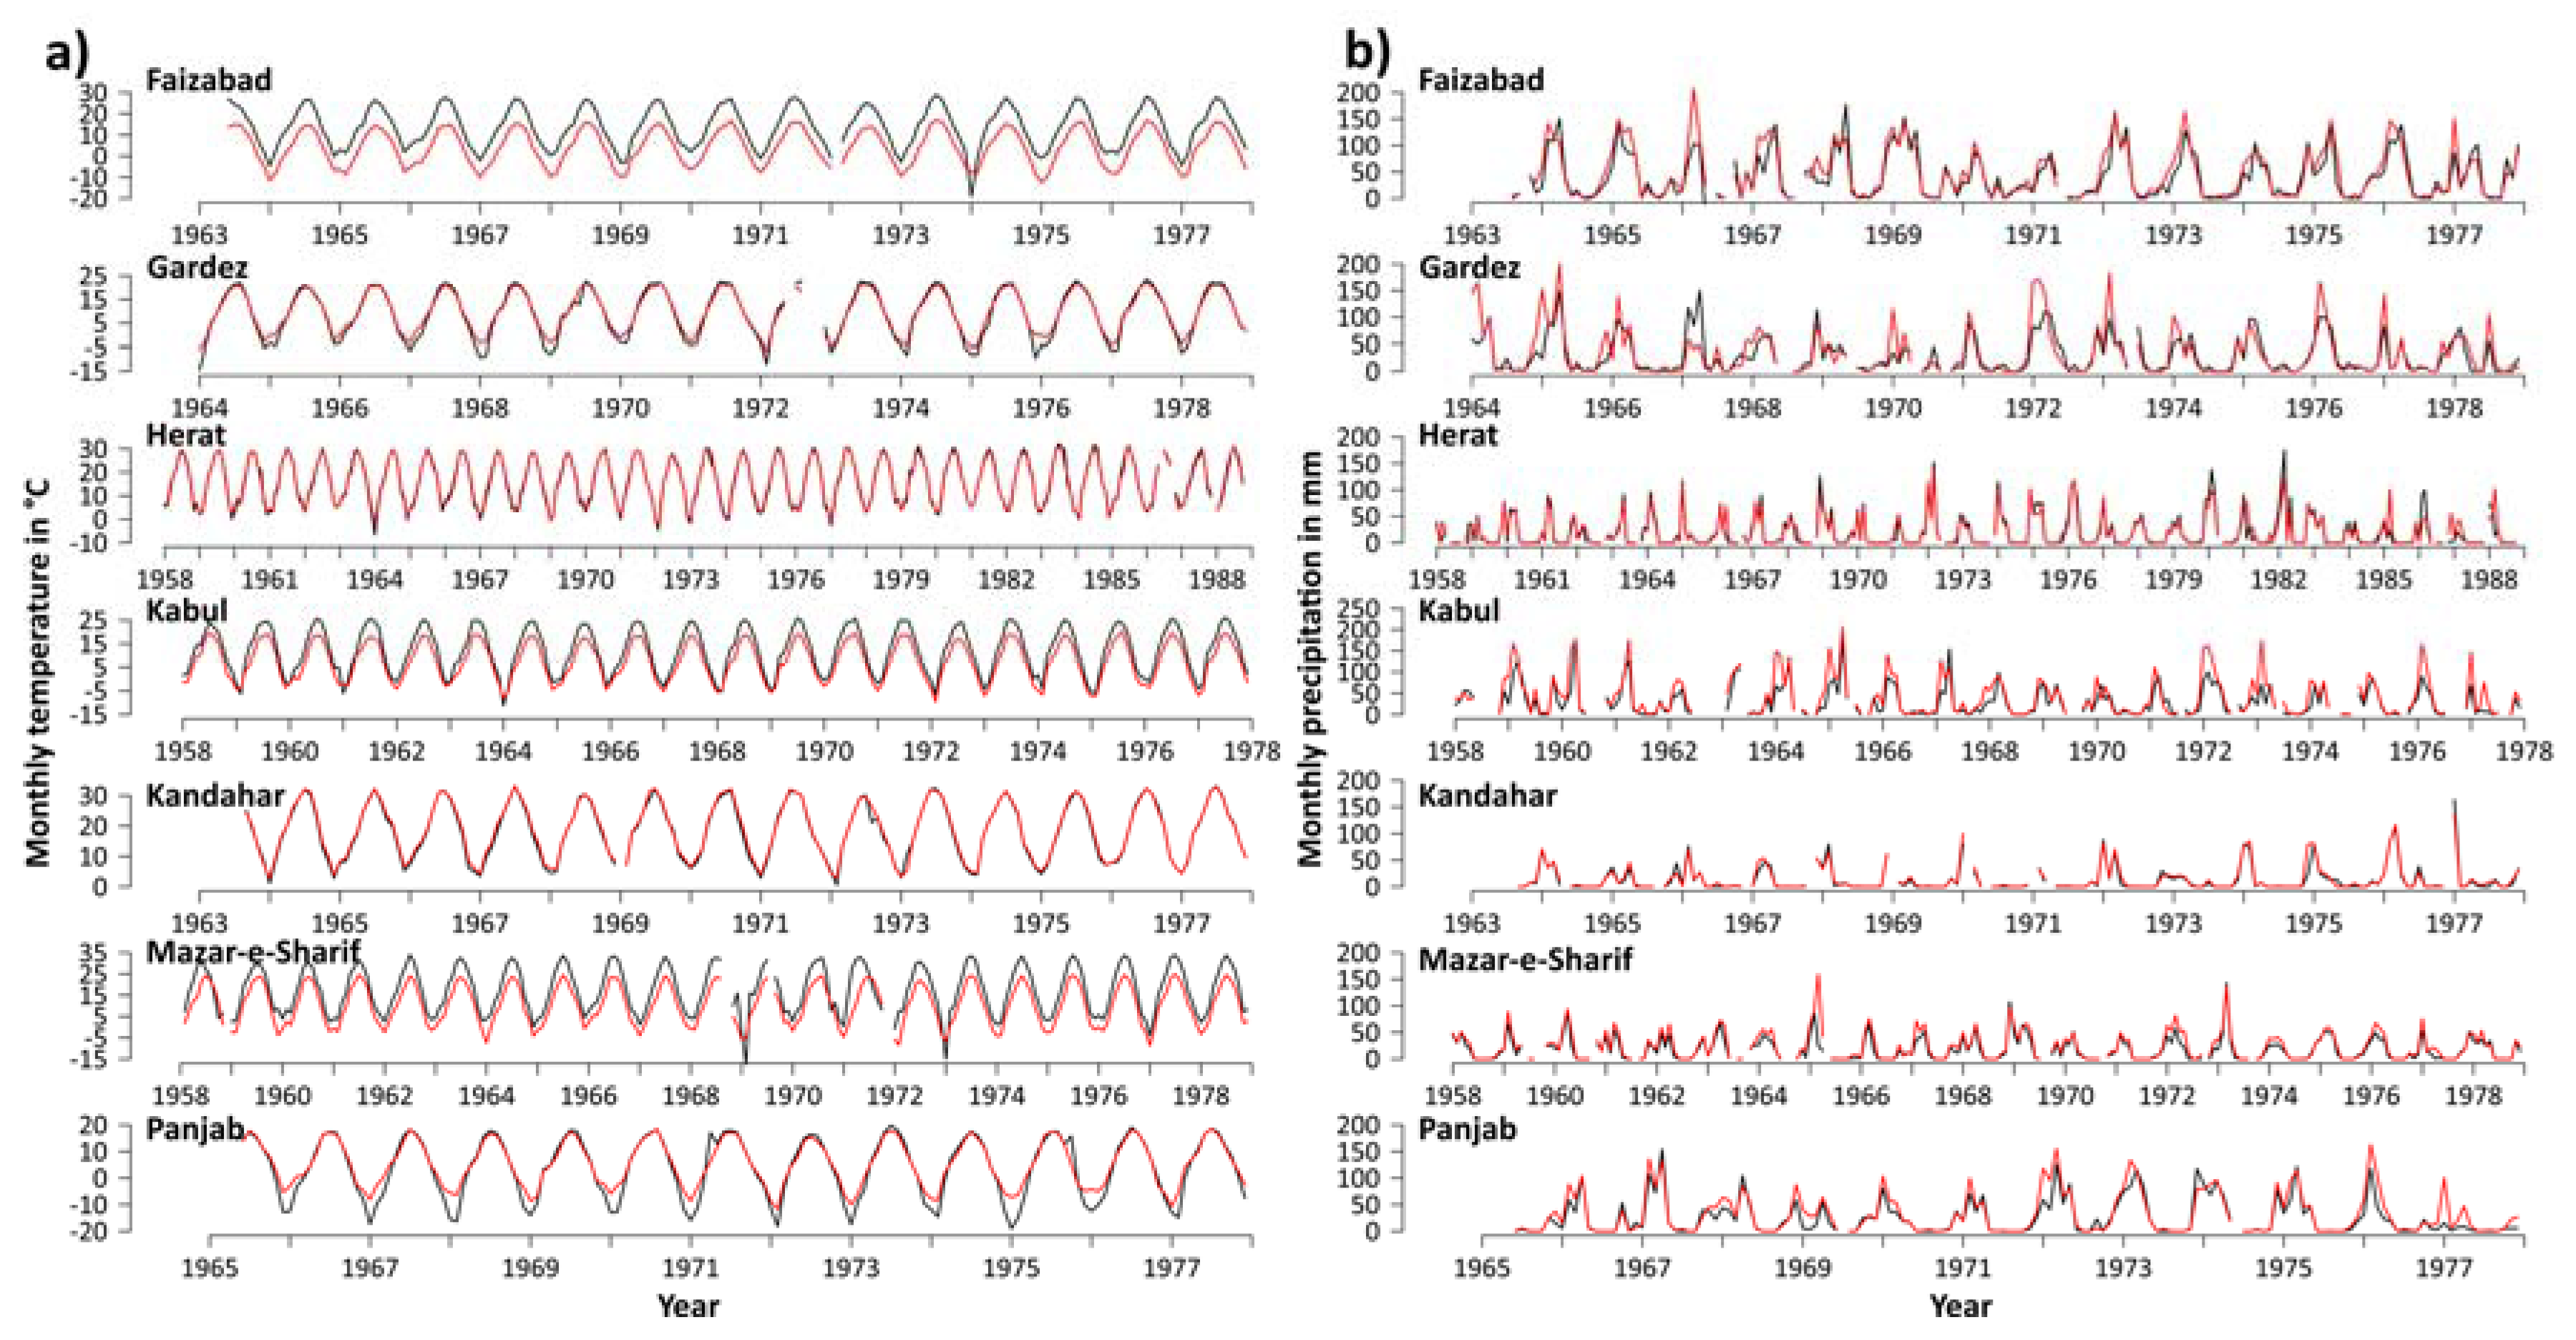
2.2.1. Availability of Direct Meteorological Observations
2.2.2. Reanalysis Data
2.2.3. Climate Projections
2.3. Indices and Statistical Methods
2.3.1. Indices
2.3.2. Analysis of Trends and Changes
3. Results
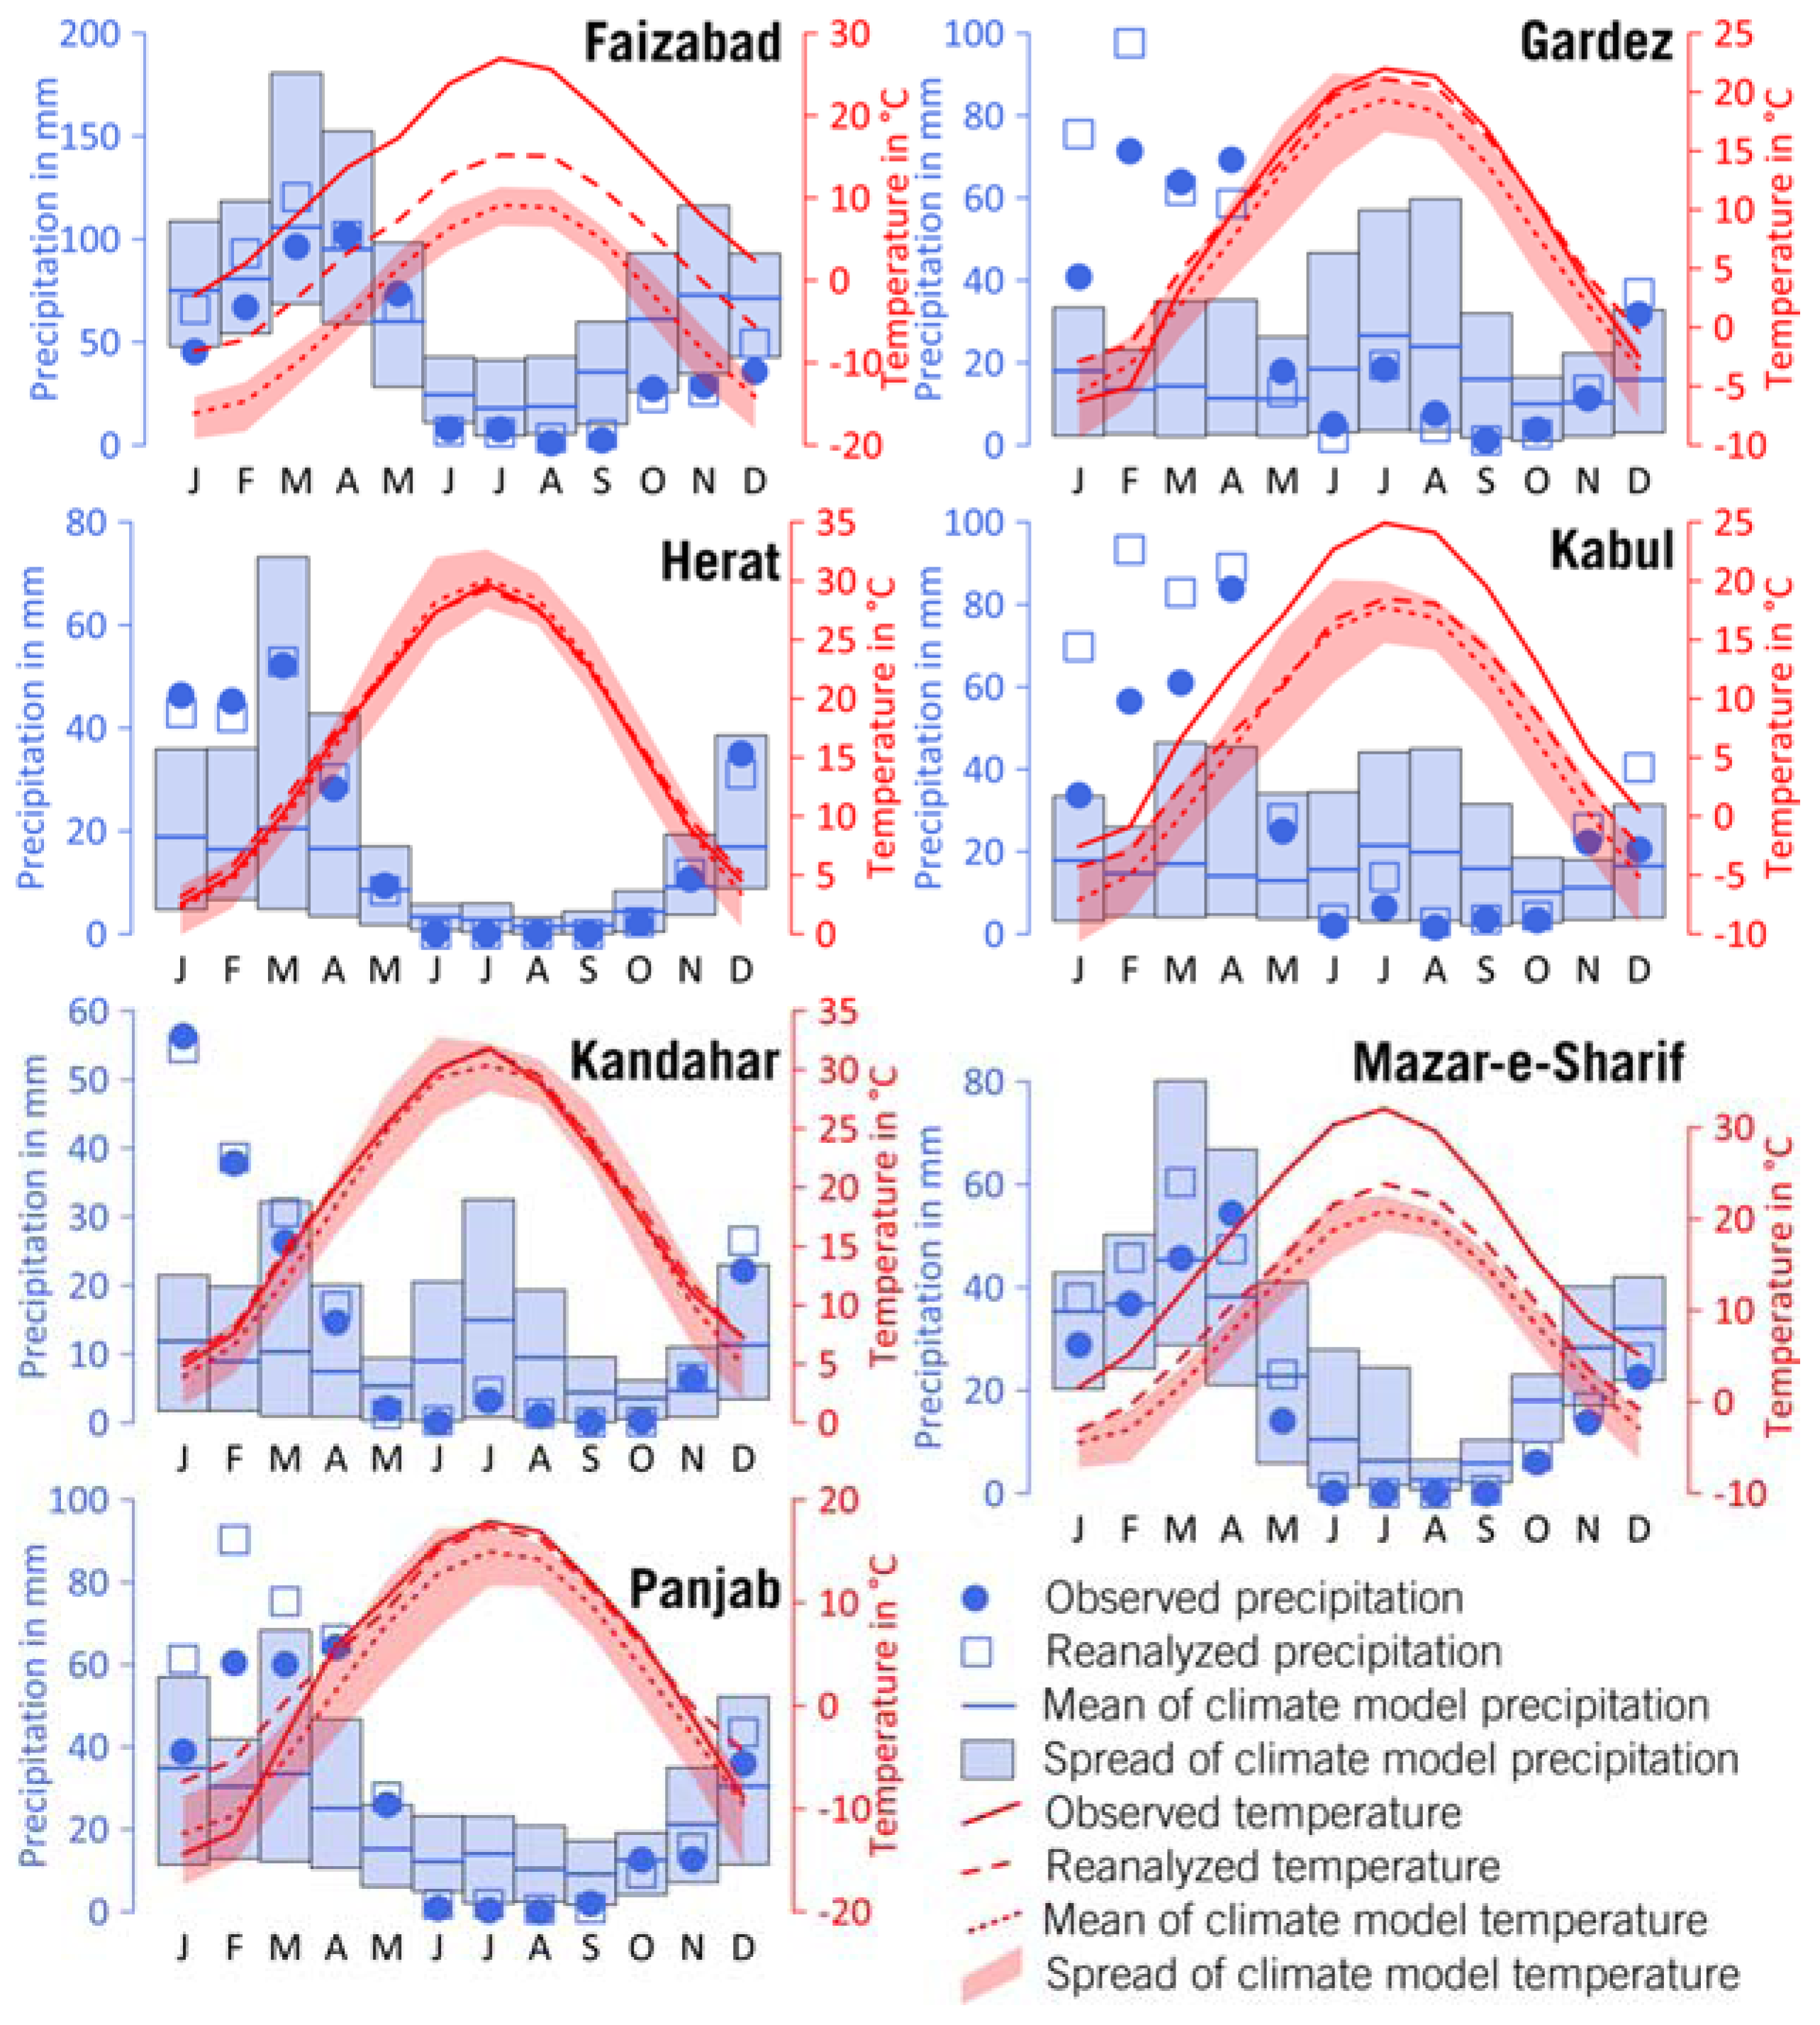
3.1. Validation of Reanalysis
3.2. Performance of Climate Models
3.3. Analysis of Past Climate Trends for the Period 1951–2010
3.4. Analysis of Future Climate Trends for the Time Period 2006–2050/2099
4. Discussion and Conclusions
4.1. Robustness and Uncertainties of the Results
4.2. Climate Impacts
Supplementary Materials
Acknowledgments
Author Contributions
Conflicts of Interest
References
- Kreft, S.; Eckstein, D.; Dorsch, L.; Fischer, L. Global Climate Risk Index 2016: Who Suffers Most from Extreme Weather Events? Weather-Related Loss Events in 2014 and 1995 to 2014; Germanwatch: Bonn, Germany, 2015. [Google Scholar]
- University of Notre Dame Afghanistan Notre Dame Global Adaptation Index. Available online: http://index.gain.org/country/afghanistan (accessed on 1 February 2017).
- Maplecroft. Climate Change Risk Atlas 2011. Available online: https://maplecroft.com/about/news/ccvi.html (accessed on 1 February 2017).
- UNEP. Afghanistan Post-Conflict Environmental Assessment; UNEP: Kabul, Afghanistan, 2003. [Google Scholar]
- Central Statistical Office. Afghanistan Statistical Yearbook 2015–2016. Available online: www.emdat.be (accessed on 1 July 2017).
- EM-DAT The OFDA/CRED International Disaster Database. Available online: www.emdat.be (accessed on 1 July 2015).
- World Bank. Turn Down the Heat: Confronting the New Climate Normal; World Bank: Washington, DC, USA, 2014. [Google Scholar]
- McSweeney, C.; New, M.; Lizcano, G.; Lu, X. The UNDP climate change country profiles, Improving the accessibility of observed and projected climate information for studies of climate change in developing countries 2010. Am. Meteorol. Soc. 2010, 157–166. [Google Scholar] [CrossRef]
- Savage, M.; Dougherty, B.; Hamza, M.; Butterfiled, R.; Bharwani, S. Socio-Economic Impacts of Climate Change in Afghanistan; Stockholm Environment Institute: Oxford, UK, 2009. [Google Scholar]
- Ridley, J.; Wiltshire, A.; Mathison, C. More frequent occurrence of westerly disturbances in Karakoram up to 2100. Sci. Total Environ. 2013, 468–469, S31–S35. [Google Scholar] [CrossRef] [PubMed]
- Mukhopadhyay, B.; Khan, A. A quantitative assessment of the genetic sources of the hydrologic flow regimes in Upper Indus Basin and its significance in a changing climate. J. Hydrol. 2014, 509, 549–572. [Google Scholar] [CrossRef]
- Ososkova, T.; Gorelkin, N.; Chub, V. Water Resources of Central Asia and Adaptation Measures for Climate Change. Environ. Monit. Assess. 2000, 61, 161–166. [Google Scholar] [CrossRef]
- Unger-Shayesteh, K.; Vorogushyn, S.; Farinotti, D. What do we know about past changes in the water cycle of Central Asian headwaters? A review. Glob. Planet. Chang. 2013, 110, 4–25. [Google Scholar] [CrossRef]
- Hagg, W.; Hoelzle, M.; Wagner, S.; Mayr, E. Glacier and runoff changes in the Rukhk catchment, upper Amu-Darya basin until 2050. Glob. Planet. Chang. 2013, 110, 62–73. [Google Scholar] [CrossRef]
- Dukhovny, V.; de Schutter, J. Water in Central Asia: Past, Present and Future; CRC Press: New York, NY, USA, 2011. [Google Scholar]
- Radić, V.; Bliss, A.; Beedlow, A.C.; Hock, R.; Miles, E.; Cogley, J.G. Regional and global projections of twenty-first century glacier mass changes in response to climate scenarios from global climate models. Clim. Dyn. 2014, 42, 37–58. [Google Scholar] [CrossRef]
- Bliss, A.; Hock, R.; Radić, V. Global response of glacier runoff to twenty-first century climate change. J. Geophys. Res. Earth Surf. 2014, 119, 717–730. [Google Scholar] [CrossRef]
- Marzeion, B.; Jarosch, A.H.; Hofer, M. Past and future sea-level change from the surface mass balance of glaciers. Cryosph. Discuss. 2012, 6, 3177–3241. [Google Scholar] [CrossRef]
- Siegfried, T.; Bernauer, T.; Guiennet, R.; Sellars, S.; Robertson, A.W.; Mankin, J.; Bauer-Gottwein, P.; Yakovlev, A. Will climate change exacerbate water stress in Central Asia? Clim. Chang. 2012, 112, 881–899. [Google Scholar] [CrossRef]
- Lutz, A.; Immerzeel, W.; Gobiet, A. Comparison of climate change signals in CMIP3 and CMIP5 multi-model ensembles and implications for Central Asian glaciers. Hydrol. Earth Syst. Sci. 2013, 17, 3661–3677. [Google Scholar] [CrossRef]
- Wiltshire, A.J. Climate change implications for the glaciers of the Hindu Kush, Karakoram and Himalayan region. Cryosphere 2014, 8, 941–958. [Google Scholar] [CrossRef]
- Jarsjö, J.; Asokan, S.M.; Prieto, C.; Bring, A.; Destouni, G. Hydrological responses to climate change conditioned by historic alterations of land-use and water-use. Hydrol. Earth Syst. Sci 2012, 16, 1335–1347. [Google Scholar] [CrossRef]
- Shibuo, Y.; Jarsjö, J.; Destouni, G. Hydrological responses to climate change and irrigation in the Aral Sea drainage basin. Geophys. Res. Lett. 2007, 34, L21406. [Google Scholar] [CrossRef]
- Jaramillo, F.; Destouni, G. Local flow regulation and irrigation raise global human water consumption and footprint. Science 2015, 350, 1248–1251. [Google Scholar] [CrossRef] [PubMed]
- Hagen, E.; Teufert, J.F. Flooding in Afghanistan: A Crisis; Springer: Dordrecht, The Netherlands, 2009; pp. 179–185. [Google Scholar]
- Hagen, E.; Shroder, J.F.; Lu, X.X.; Teufert, J.F. Reverse engineered flood hazard mapping in Afghanistan: A parsimonious flood map model for developing countries. Quat. Int. 2010, 226, 82–91. [Google Scholar] [CrossRef]
- Shroder, J.F.; Weihs, B.J.; Schettler, M.J. Mass movement in northeast Afghanistan. Phys. Chem. Earth Parts A/B/C 2011, 36, 1267–1286. [Google Scholar] [CrossRef]
- Azimi, A. Environment Assessment for ADB’s Program in Afghanistan; Country Partnership Strategy: Kabul, Afghanistan, 2007. [Google Scholar]
- UNEP; National Environmental Protection Agency of Afghanistan (NEPA). Afghnaistan’s Environment 2008; UNEP: Kabul, Afghanistan, 2008. [Google Scholar]
- Bromand, M.T. Impact Assessment of Climate Change on Water Resources in the Kabul River Basin; Afghanistan, Ritsumeikan University: Shiga, Japan, 2015. [Google Scholar]
- Amin, H.; Schilz, G.B. A Geography of Afghanistan; University of Nebraska at Omaha: Omaha, NE, USA, 1976. [Google Scholar]
- Library of Congress-Federal Research Division. Country Profile: Afghanistan. Available online: https://www.loc.gov/rr/frd/cs/profiles/Afghanistan.pdf (accessed on 4 July 2017).
- Grötzbach, E. Afghanistan: Eine Geographische Landeskunde; Wissenschaftliche Buchgesellschaft: Darmstadt, Germany, 1990. [Google Scholar]
- Olson, D.M.; Dinerstein, E.; Wikramanayake, E.D.; Burgess, N.D.; Powell, G.V.N.; Underwood, E.C.; D’amico, J.A.; Itoua, I.; Strand, H.E.; Morrison, J.C.; et al. Terrestrial Ecoregions of the World: A New Map of Life on Earth. Bioscience 2001, 51, 933. [Google Scholar] [CrossRef]
- Ministry of Rural Rehabilitation & Development. National Area-Based Development Programme (NABDP)—Provincial Profile Badakshan; Ministry of Rural Rehabilitation & Development: Kabul, Afghanistan, 2014.
- FAO. Land Cover Atlas of the Islamic Republich of Afghanistan; FAO: Kabul, Afghanistan, 2016. [Google Scholar]
- Favre, R.; Kamal, G.M. Watershed Atlas of Afghanistan; FAO: Kabul, Afghanistan, 2004. [Google Scholar]
- Hijmans, R.J.; Cameron, S.E.; Parra, J.L.; Jones, P.G.; Jarvis, A. Very high resolution interpolated climate surfaces for global land areas. Int. J. Climatol. 2005, 25, 1965–1978. [Google Scholar] [CrossRef]
- Weedon, G.P.; Gomes, S.; Viterbo, P.; Shuttleworth, W.J.; Blyth, E.; Österle, H.; Adam, J.C.; Bellouin, N.; Boucher, O.; Best, M. Creation of the WATCH Forcing Data and Its Use to Assess Global and Regional Reference Crop Evaporation over Land during the Twentieth Century. J. Hydrometeorol. 2011, 12, 823–848. [Google Scholar] [CrossRef]
- Kim, H. GSWP3. Available online: http://hydro.iis.u-tokyo.ac.jp/GSWP3/exp1.html (accessed on 24 April 2015).
- Kim, H.; Yoshimura, K.; Chang, E.; Famiglietti, J.S.; Oki, T. Century long observation constrained global dynamic downscaling and hydrologic implication. Proceeding of the American Geophysical Union Fall Meeting 2012, San Francisco, CA, USA, 3–7 December 2012. [Google Scholar]
- Sheffield, J.; Goteti, G.; Wood, E.F. Development of a 50-year high-resolution global dataset of meteorological forcings for land surface modeling. J. Clim. 2006, 19, 3088–3111. [Google Scholar] [CrossRef]
- Weedon, G.P.; Balsamo, G.; Bellouin, N.; Gomes, S.; Best, M.J.; Viterbo, P. The WFDEI meteorological forcing data set: WATCH Forcing data methodology applied to ERA-Interim reanalysis data. Water Resour. Res. 2014, 50, 7505–7514. [Google Scholar] [CrossRef]
- Grasso, L.D. The differentiation between grid spacing and resolution and their application to numerical modeling. Bull. Am. Meteorol. Soc. 2000, 81, 579–580. [Google Scholar]
- Jacob, D.; Göttel, H.; Kotlarski, S.; Lorenz, P.; Sieck, K. Klimaauswirkungen und Anpassung in Deutschland–Phase 1: Erstellung regionaler Klimaszenarien für Deutschland. Clim. Chang. 2008, 11, 154. [Google Scholar]
- Jones, C.; Giorgi, F.; Asrar, G. The Coordinated Regional Downscaling Experiment: CORDEX—An international downscaling link to CMIP5. Clivar Exch. 2011, 16, 34–40. [Google Scholar]
- IPCC. Climate Change 2013: The Physical Basis. Contribution of Working Group 1 to the Fifth Assessment Report of the IPCC; Cambridge University Press: Cambridge, UK, 2013. [Google Scholar]
- Raju, P.V.S.; Bhatla, R.; Almazroui, M.; Assiri, M. Performance of convection schemes on the simulation of summer monsoon features over the South Asia CORDEX domain using RegCM-4.3. Int. J. Climatol. 2015, 35, 4695–4706. [Google Scholar] [CrossRef]
- Ghimire, S.; Choudhary, A.; Dimri, A.P. Assessment of the performance of CORDEX-South Asia experiments for monsoonal precipitation over the Himalayan region during present climate: Part I. Clim. Dyn. 2015. [Google Scholar] [CrossRef]
- R Core Team. R: A Language and Environment for Statistical Computing; R Core Team: Vienna, Austria, 2013. [Google Scholar]
- National Environmental Protection Agency of Afghanistan (NEPA). National Self-Capacity Assessment and National Adaptation Programme of Action (NCSA & NAPA); NEPA: Kabul, Afghanistan, 2009.
- EEA (European Environment Agency) Precipitation Extremes. Available online: http://www.eea.europa.eu/data-and-maps/indicators/precipitation-extremes-in-europe-2/assessment (accessed on 27 June 2015).
- Russo, S.; Dosio, A.; Graversen, R.G.; Sillmann, J.; Carrao, H.; Dunbar, M.B.; Singleton, A.; Montagna, P.; Barbola, P.; Vogt, J.V. Magnitude of extreme heat waves in present climate and their projection in a warming world. J. Geophys. Res. Atmos. 2014, 119, 12500–12512. [Google Scholar] [CrossRef]
- Gilleland, E. Package “extRemes” Extreme Value Analysis. Extremes 2016, 18, 1. [Google Scholar]
- Beguería, S.; Vicente-Serrano, S.M. Package “SPEI” Calculation of the Standardised Precipitation-Evapotranspiration Index. Available online: https://cran.r-project.org/web/packages/SPEI/SPEI.pdf (accessed on 1 February 2017).
- Vicente-Serrano, S.; Beguería, S. A multiscalar drought index sensitive to global warming: The standardized precipitation evapotranspiration index. J. Clim. 2010, 23, 1696–1718. [Google Scholar] [CrossRef]
- Beguería, S.; Vicente-Serrano, S.M.; Reig, F.; Latorre, B. Standardized precipitation evapotranspiration index (SPEI) revisited: Parameter fitting, evapotranspiration models, tools, datasets and drought monitoring. Int. J. Climatol. 2014, 34, 3001–3023. [Google Scholar] [CrossRef]
- Thornthwaite, C.W. An Approach towards a rational Classification of Climate. Geogr. Rev. 2015, 38, 55–94. [Google Scholar] [CrossRef]
- Shean, M. AFGHANISTAN: Severe Drought Causes Major Decline in 2008/09 Wheat Production; USDA: Washington, DC, USA, 2008.
- FEWSNET. Livelihoods Zoning “Plus” Activity in Afghanistan; USAID: Washington, DC, USA, 2011.
- Karl, T.; Nicholls, N.; Ghazi, A. Clivar/GCOS/WMO workshop on indices and indicators for climate extremes workshop summary. In Weather and Climate Extremes; Springer: Dordrecht, The Netherlands, 1999. [Google Scholar]
- Klein Tank, A.M.G.; Zwiers, F.W.; Zhang, X. Guidelines on Analysis of Extremes in a Changing Climate in Support of Informed Decisions for Adaptation; World Meteorological Organisation (WMO): Geneva, Switzerland, 2009. [Google Scholar]
- McLeod, A.I. Kendall: Kendall Rank Correlation and Mann-Kendall Trend Test. R Package Version 22. Available online: https://cran.r-project.org/web/packages/Kendall/index.html (accessed on 1 February 2017).
- McLeod, A.I. Package “Kendall”. Available online: http://w.download.idg.pl/CRAN/web/packages/Kendall/Kendall.pdf (accessed on 1 February 2017).
- Theil, H. A rank-invariant method of linear and polynomial regression analysis. In Econometric Theory and Methodology; Springer: Amsterdam, The Netherlands, 1950; pp. 386–392. [Google Scholar]
- Sen, P. Estimates of the regression coefficient based on Kendall’s tau. J. Am. Stat. Assoc. 1968, 63, 1379–1389. [Google Scholar] [CrossRef]
- Yue, S.; Pilon, P.; Phinney, B.; Cavadias, G. The influence of autocorrelation on the ability to detect trend in hydrological series. Hydrol. Process. 2002, 16, 1807–1829. [Google Scholar] [CrossRef]
- Bronaugh, D. Arelia Werner Package “zyp”. Available online: http://ftp.cs.pu.edu.tw/network/CRAN/web/packages/zyp/zyp.pdf (accessed on 1 February 2017).
- Koenker, R.; Hallock, K. Quantile regression: An introduction. J. Econ. Perspect. 2001, 15, 43–56. [Google Scholar] [CrossRef]
- Friederichs, P.; Hense, A. Statistical Downscaling of Extreme Precipitation Events Using Censored Quantile Regression. Mon. Weather Rev. 2007, 135, 2365–2378. [Google Scholar] [CrossRef]
- Koenker, R.; Portnoy, S.; Ng, P.T.; Zeileis, A.; Grosjean, P.; Brian, D. Ripley Package “Quantreg”. Available online: ftp://ftp.ussg.iu.edu/pub/CRAN/web/packages/quantreg/quantreg.pdf (accessed on 1 February 2017).
- National Environmental Protection Agency of Afghanistan (NEPA). Afghanistan Initial National Communication to the United Nations Framework Convention on Climate Change; NEPA: Kabul, Afghanistan, 2012.
- IPCC. Managing the Risks of Extreme Events and Disasters to Advance Climate Change Adaptation. A Special Report of Working Groups I and II of the Intergovernmental Panel on Climate Change; Field, C.B., Barros, V., Stocker, T.F., Dahe, Q., Dokken, D.J., Ebi, K.L., Mastrandrea, M.D., Mach, K.J., Plattner, G.-K., Allen, S.K., Tignor, M., et al., Eds.; Cambridge University Press: Cambridge, UK; New York, NY, USA, 2012. [Google Scholar]
- Aich, V.; Koné, B.; Hattermann, F.F.; Müller, E.N. Floods in the Niger basin—Analysis and attribution. Nat. Hazards Earth Syst. Sci. Discuss. 2014, 2, 5171–5212. [Google Scholar] [CrossRef]
- Giertz, S.; Junge, B.; Diekkrüger, B. Assessing the effects of land use change on soil physical properties and hydrological processes in the sub-humid tropical environment of West Africa. Phys. Chem. Earth Parts A/B/C 2005, 30, 485–496. [Google Scholar] [CrossRef]
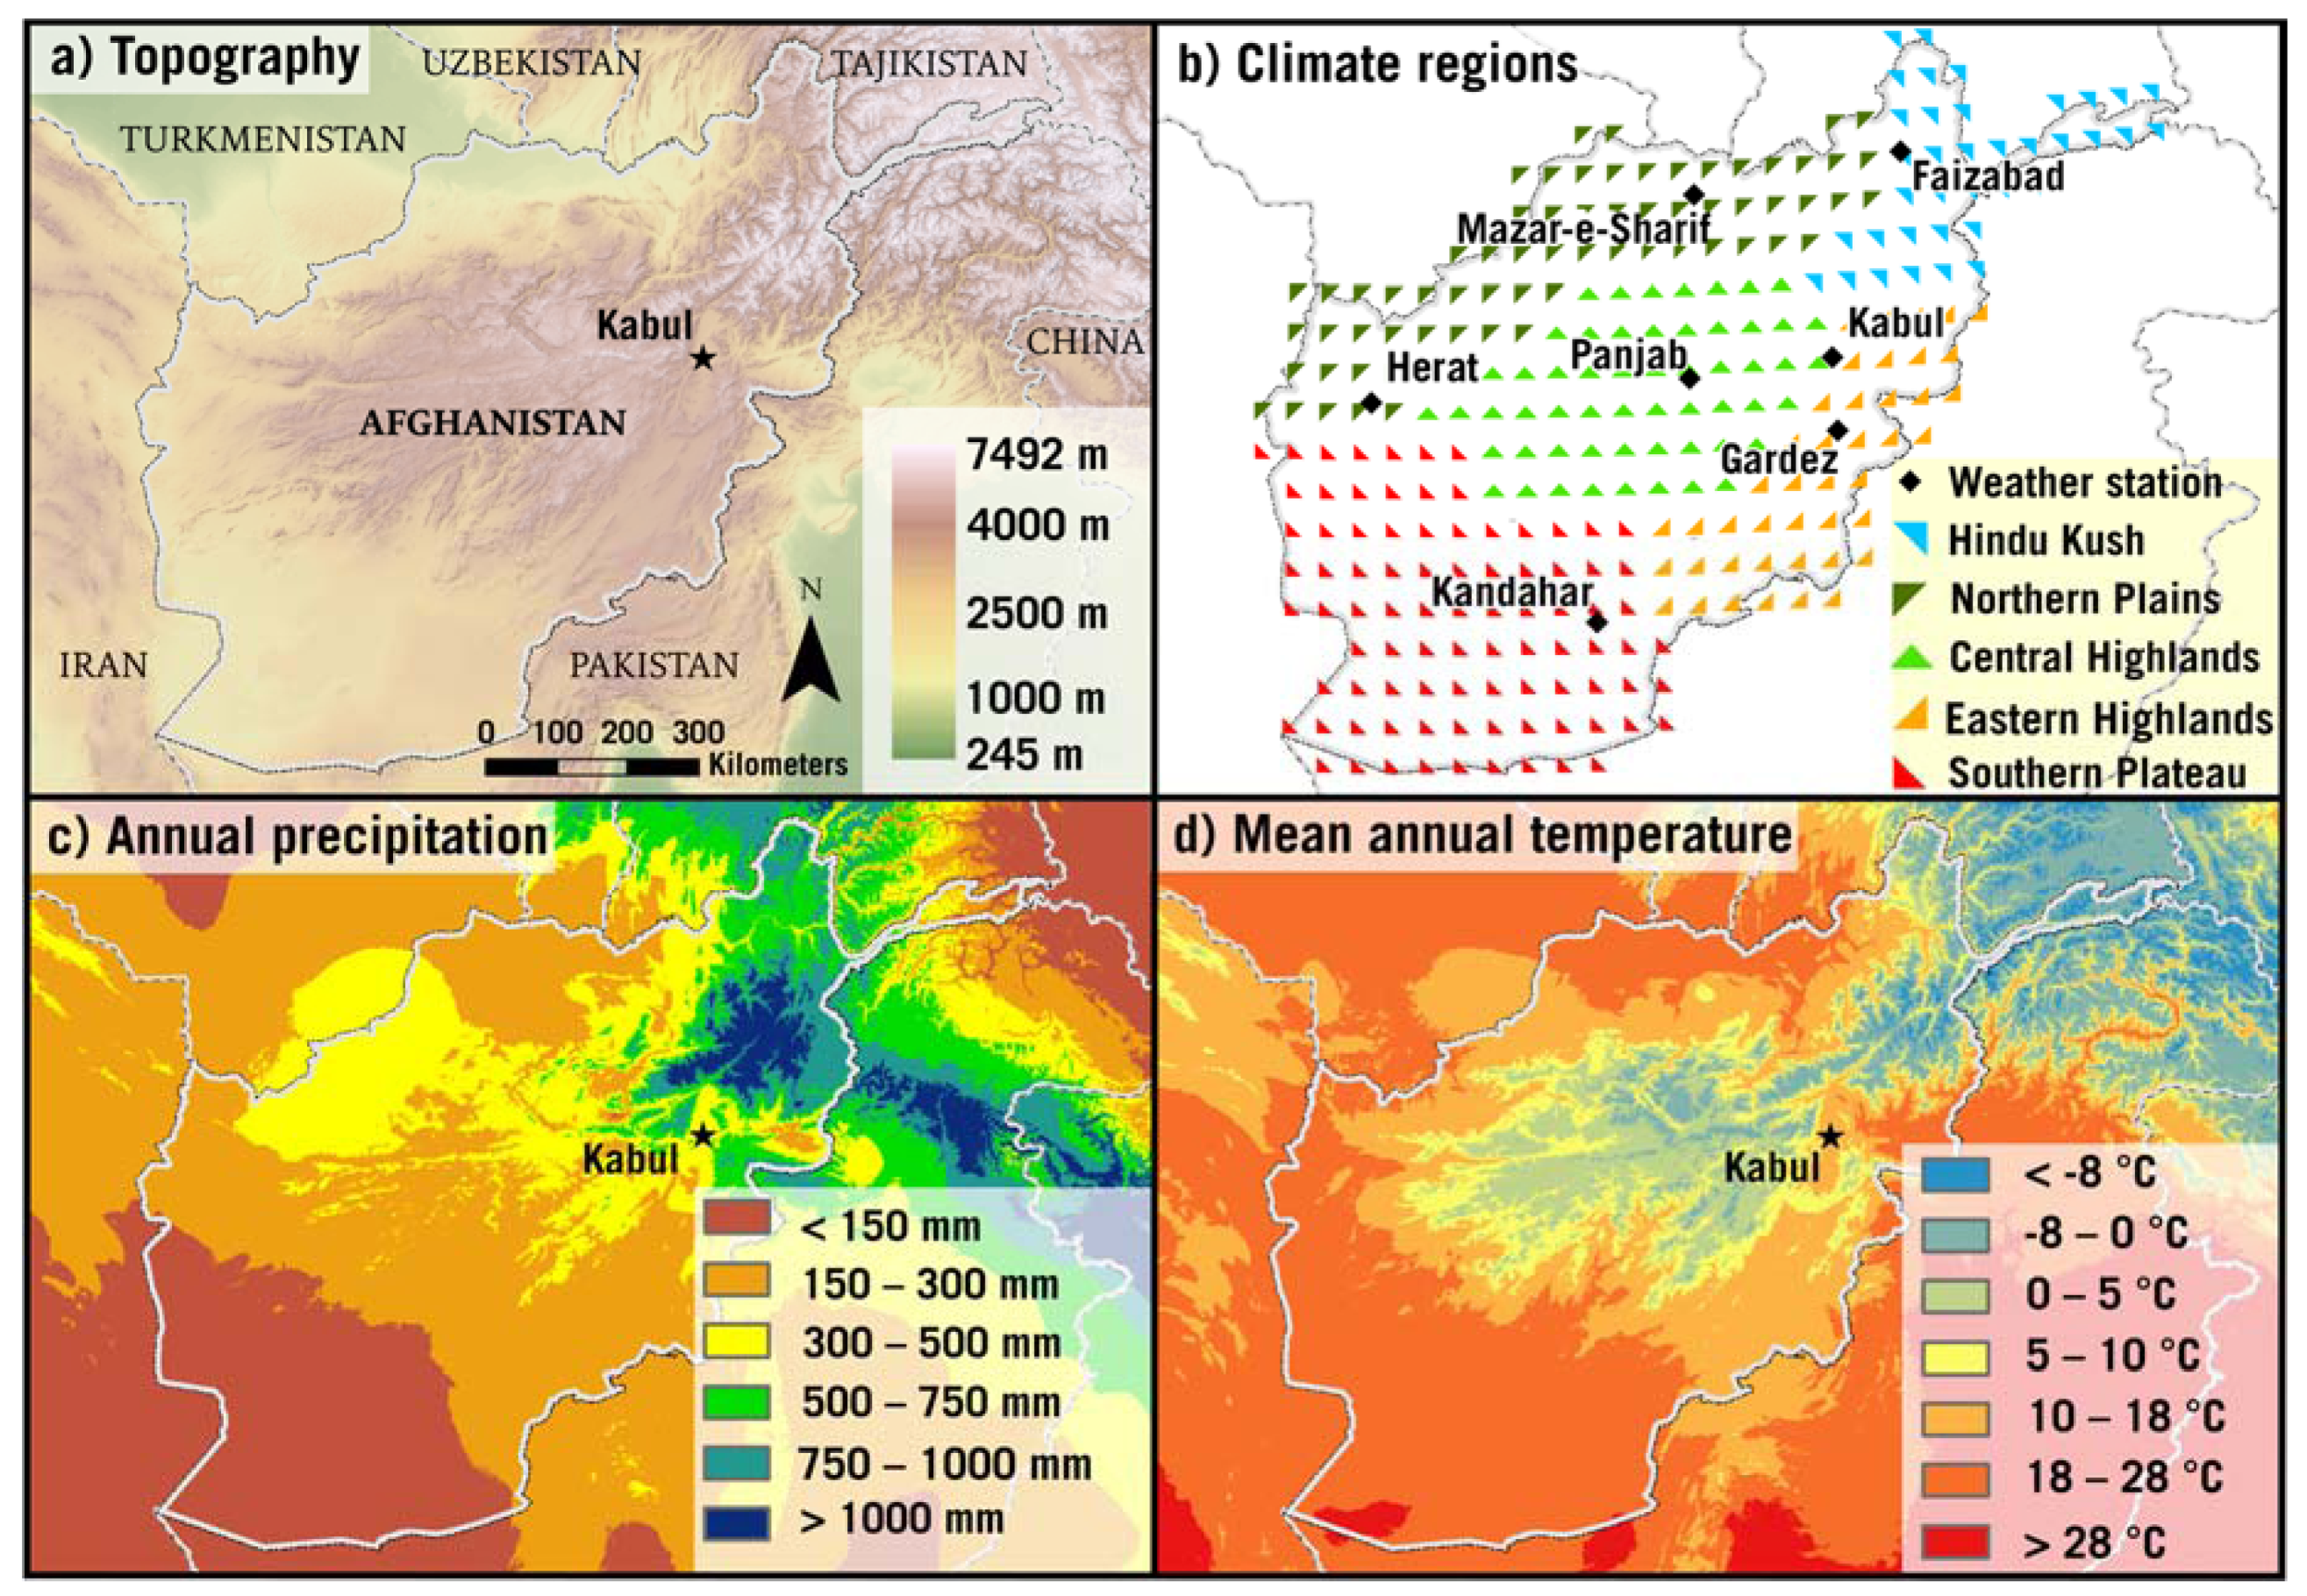

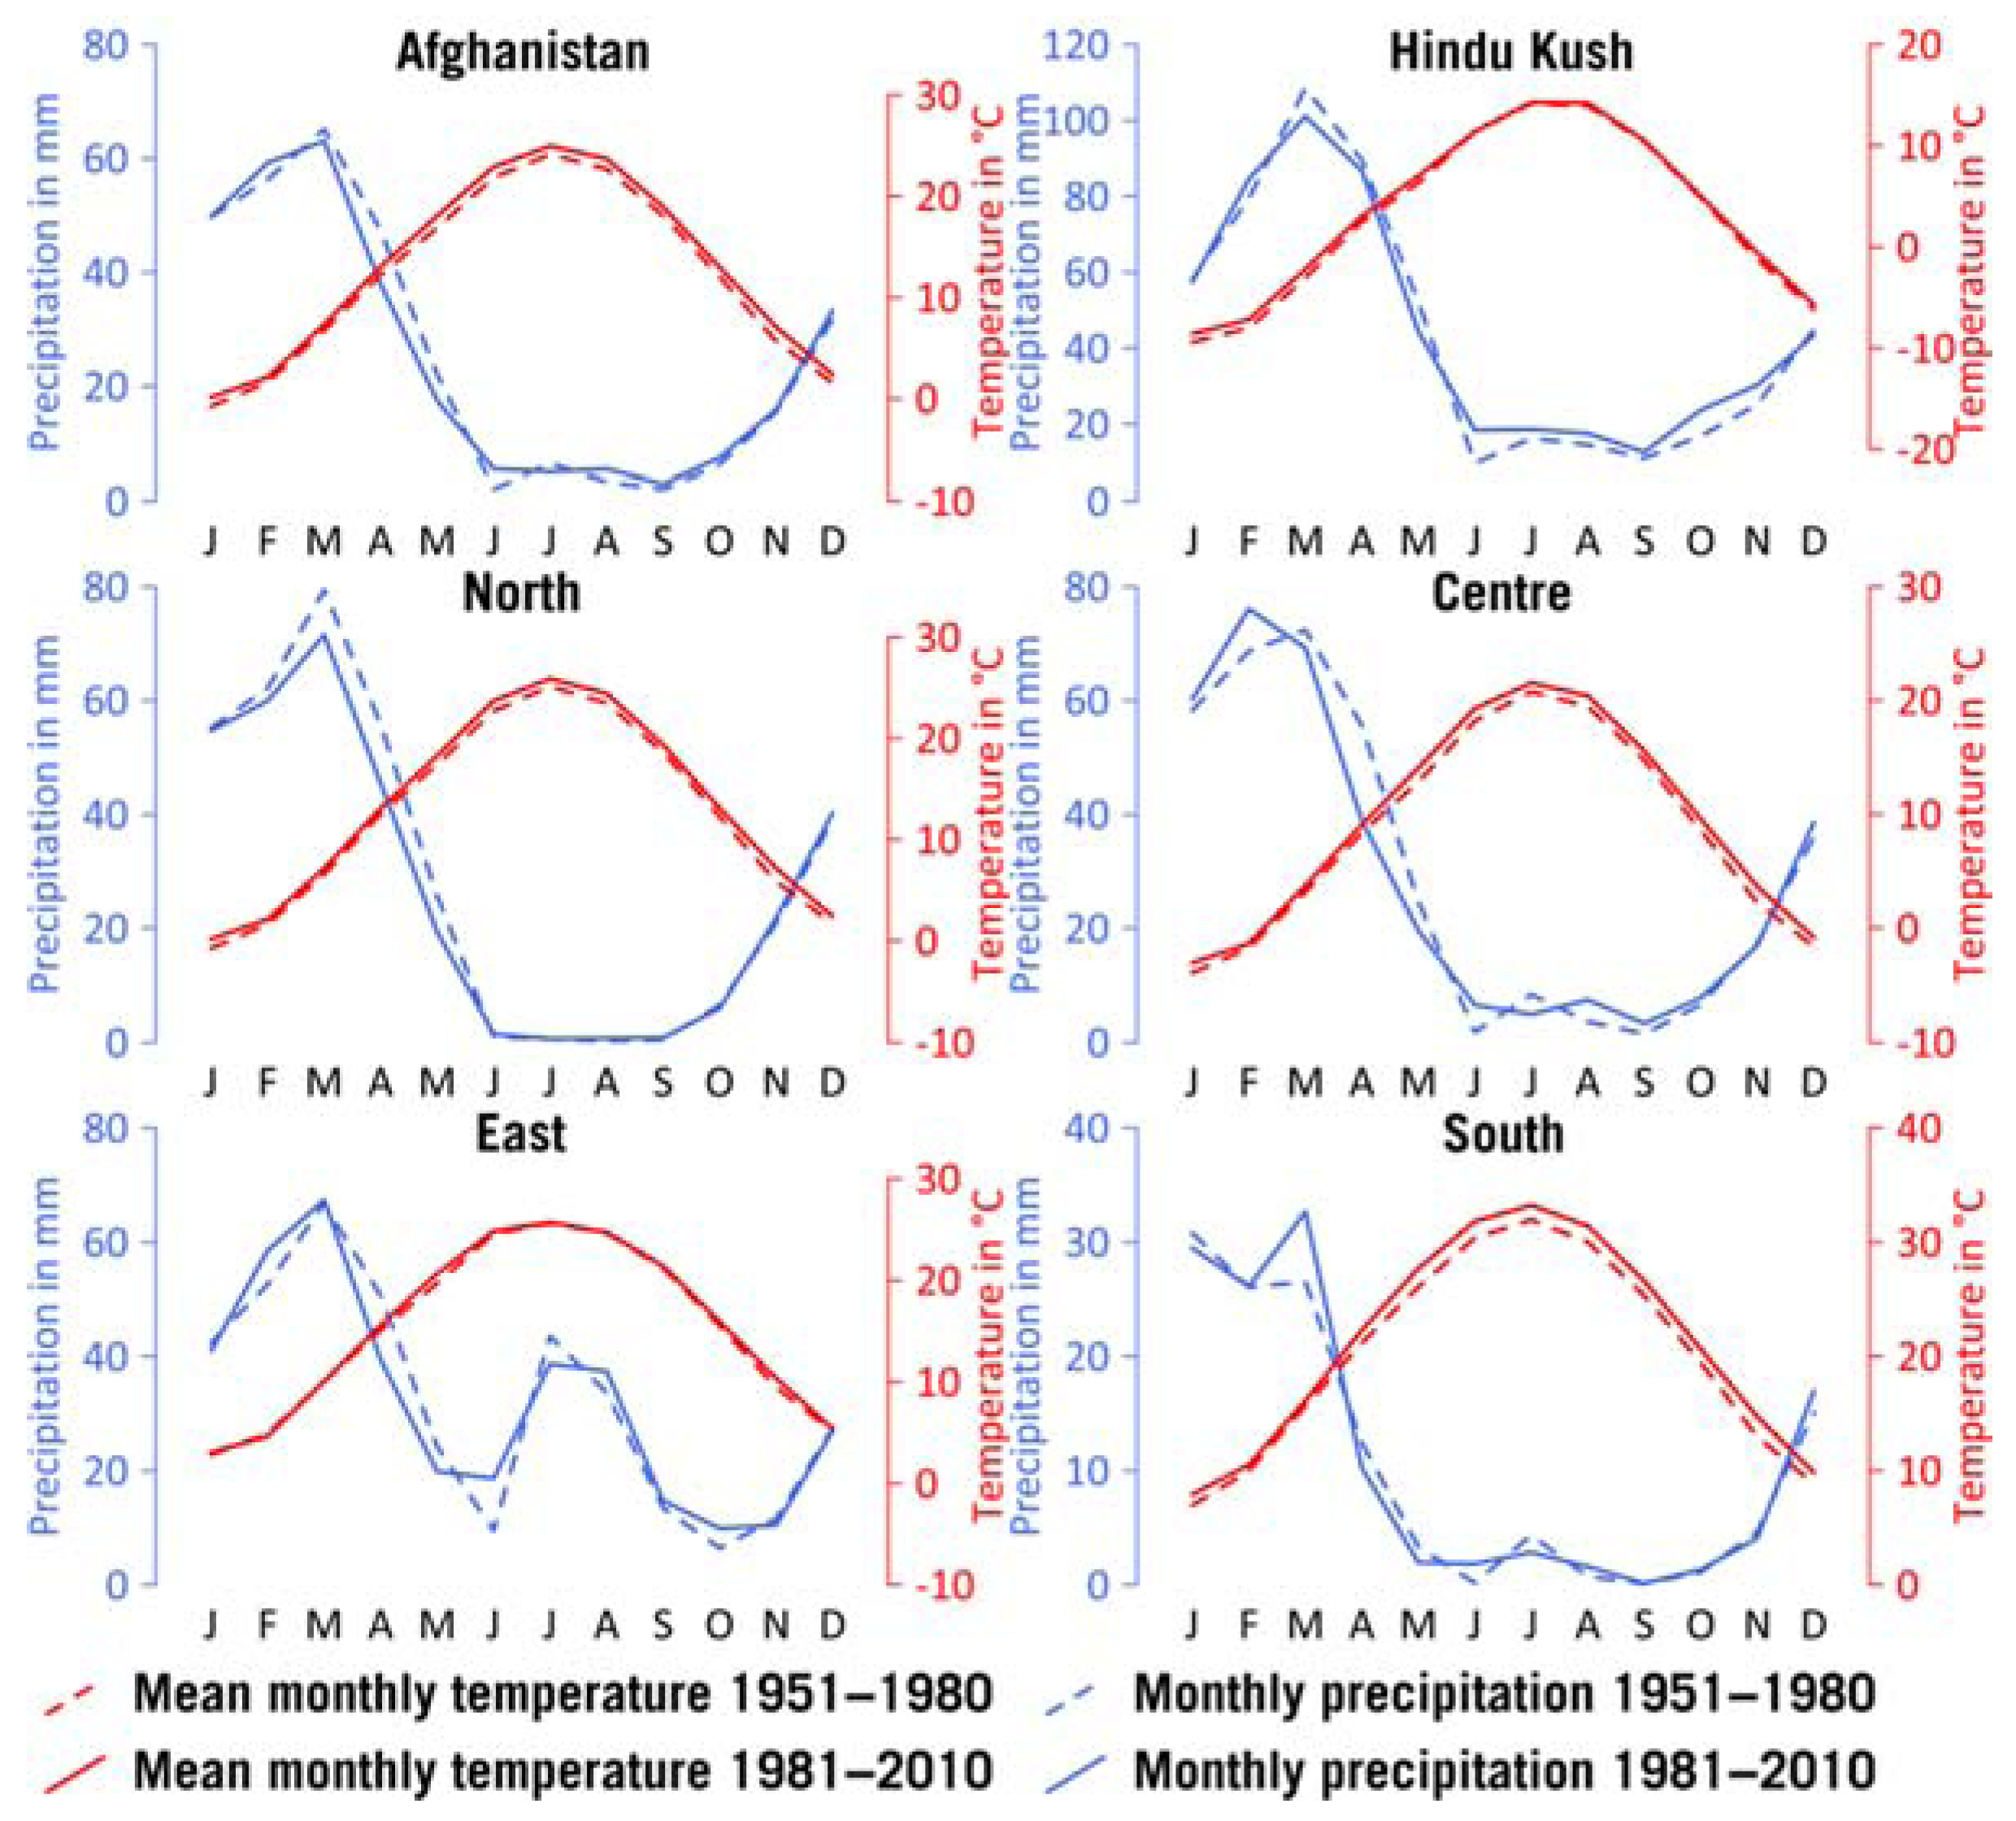
| Mean Annual Temperature in °C | Annual Precipitation in mm | |
|---|---|---|
| Afghanistan | 14.0 | 312 |
| Hindu Kush | 0.7 | 745 |
| Northern Plains | 16.2 | 311 |
| Central Highlands | 5.2 | 332 |
| Eastern Highlands | 14.7 | 366 |
| Southern Plateau | 23.3 | 116 |
| Station | Faizabad | Mazar-e Sharif | Kabul | Panjab | Herat | Gardez | Kandahar |
|---|---|---|---|---|---|---|---|
| Period | 1963–1977 | 1958–1978 | 1959–1977 | 1965–1977 | 1958–1988 | 1958–1978 | 1963–1977 |
| General Circulation Models (GCM)/Institute | Regional Climate Models (RCM)/Institute | |
|---|---|---|
| 1. | Australian Community Climate and Earth-System Simulator (ACCESS)/Bureau of Meteorology, Australia | Conformal Cubic Atmospheric Model (CCAM) /Commonwealth Scientific and Industrial Research Organisation, Australia |
| 2. | Community Climate System Model (CCSM) /National Center for Atmospheric Research in Boulder, USA | CCAM |
| 3. | Centre National de Recherches Météorologiques Climate Model 5.1 (CNRM–CM5)/Centre National de Recherches Météorologiques, France | Rossby Centre regional atmospheric model (RCA4) /Swedish Meteorological and Hydrological Institute, Sweden |
| 4. | CNRM–CM5 | CCAM |
| 5. | EC-Earth/Irish Centre for High-End Computing, Ireland | RCA4 |
| 6. | Max-Planck-Institute Earth System Model (MPI-ESM)/Max Planck Institute für Meteorologie, Germany | CCAM |
| 7. | MPI-ESM | RCA4 |
| 8. | MPI-ESM | Regional Modell (REMO)/Max Planck Institut für Meteorologie, Germany |
| 9. | Geophysical Fluid Dynamics Laboratory Climate Model (GFDL−CM)/Geophysical Fluid Dynamics Laboratory, USA | CCAM |
| 10 | GFDL-CM | RCA4 |
| 11. | Institut Pierre Simon Laplace Climate Model 5 (IPSL–CM5)/Institut Pierre Simon Laplace, France | RCA4 |
| 12. | Model for Interdisciplinary Research on Climate Earth System Model (MIROC−ESM)/Japan Agency for Marine-Earth Science and Technology | RCA4 |
| 13. | Norwegian Earth System Model (NorESM) /Bjerknes Centre for Climate Research, Norway | CCAM |
| Trends for Mean Annual Temperature in °C | Trend for Annual Precipitation in % | Trend for HWMI | Trend for Heavy Precipitation (3–9) in % | Trend for SPEI | Trend for Spring Precipitation (1–4) in % | Trend for GSL in Days | |
|---|---|---|---|---|---|---|---|
| Afghanistan | 1.8 | −1.0 | 1.0 | −26.9 | −0.1 | −6.9 | 12.3 |
| Hindu Kush | 1.0 | 5.1 | −0.1 | 3.6 | 0.2 | −3.8 | 11.5 |
| North | 1.6 | −9.2 | 1.1 | −34 | −0.4 | −13.3 | 12.5 |
| Centre | 1.7 | 0.5 | 0.8 | −32.5 | −0.3 | −5.5 | 18.8 |
| East | 0.6 | 6.4 | 0.1 | 8.5 | 0 | −10 | 2.8 |
| South | 2.4 | −9.8 | 2 | −17.2 | −0.1 | −14 | 6.7 |
| Region | Period | Scenario | Trend for Mean Annual Temperature in °C | Trend for Annual Precipitation in % | Trend for HWMI | Trend for Heavy Precipitation in % | ||||
|---|---|---|---|---|---|---|---|---|---|---|
| Mean | Range | Mean | Range | Mean | Range | Mean | Range | |||
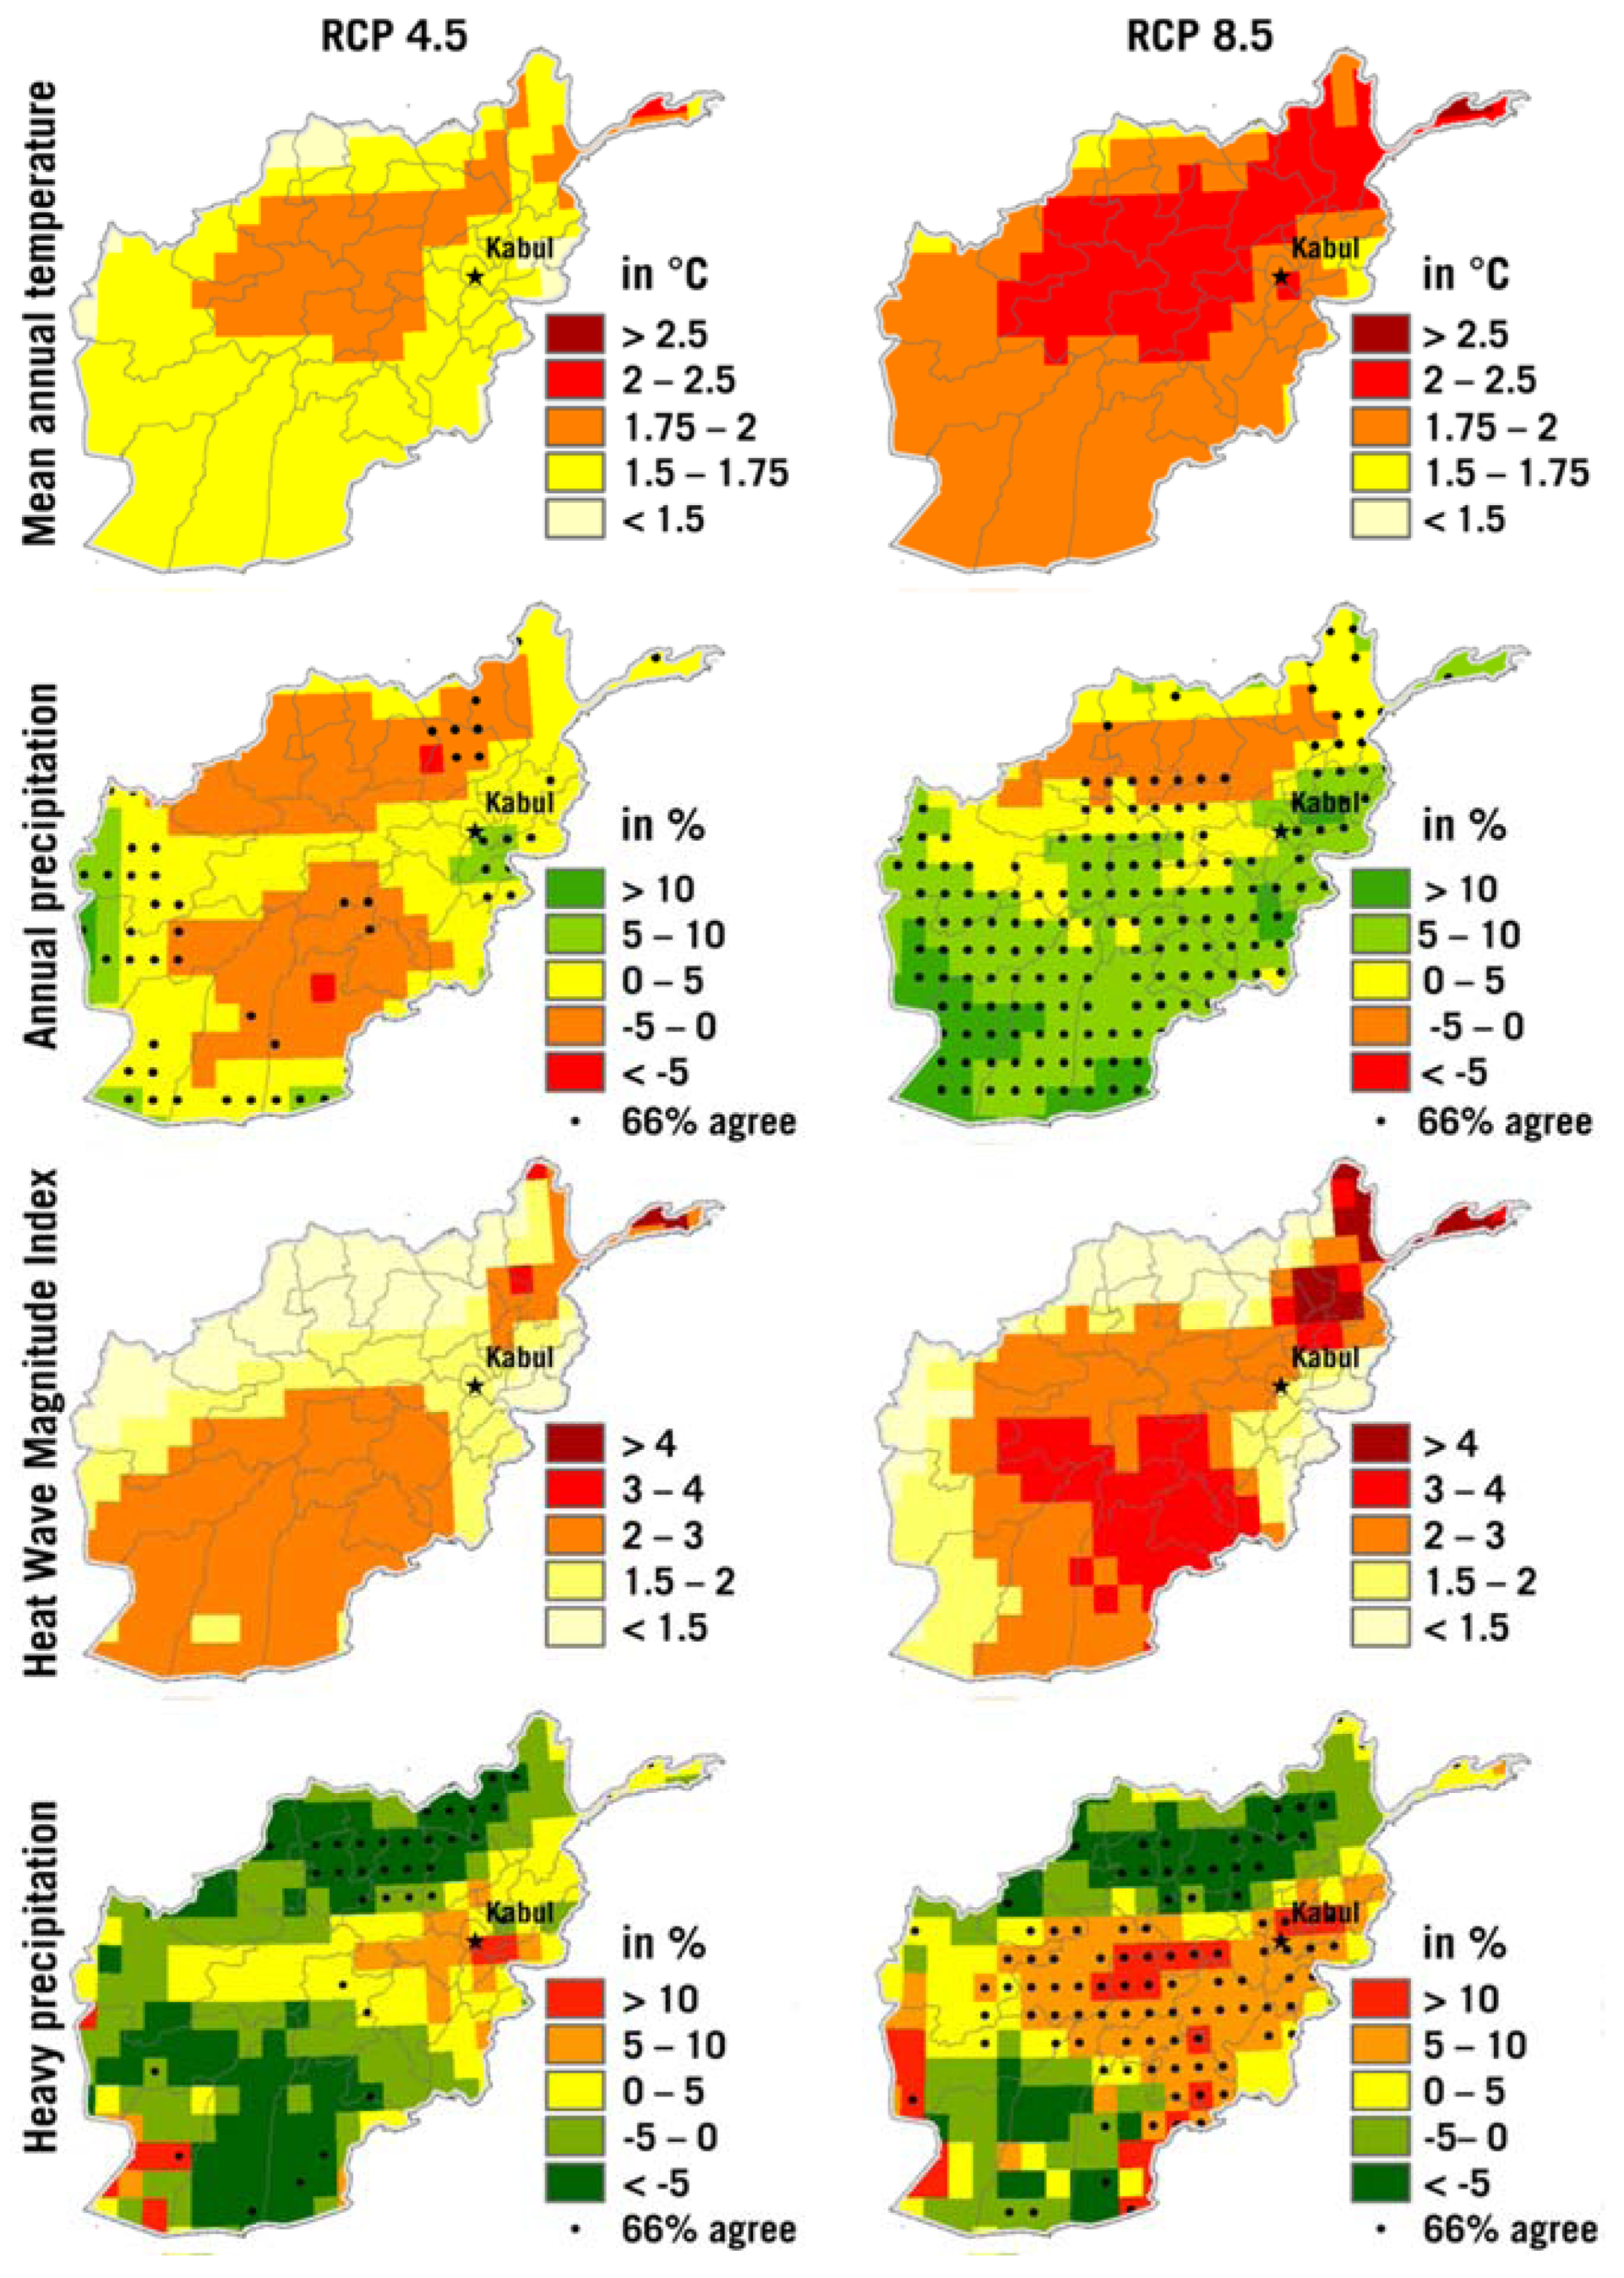
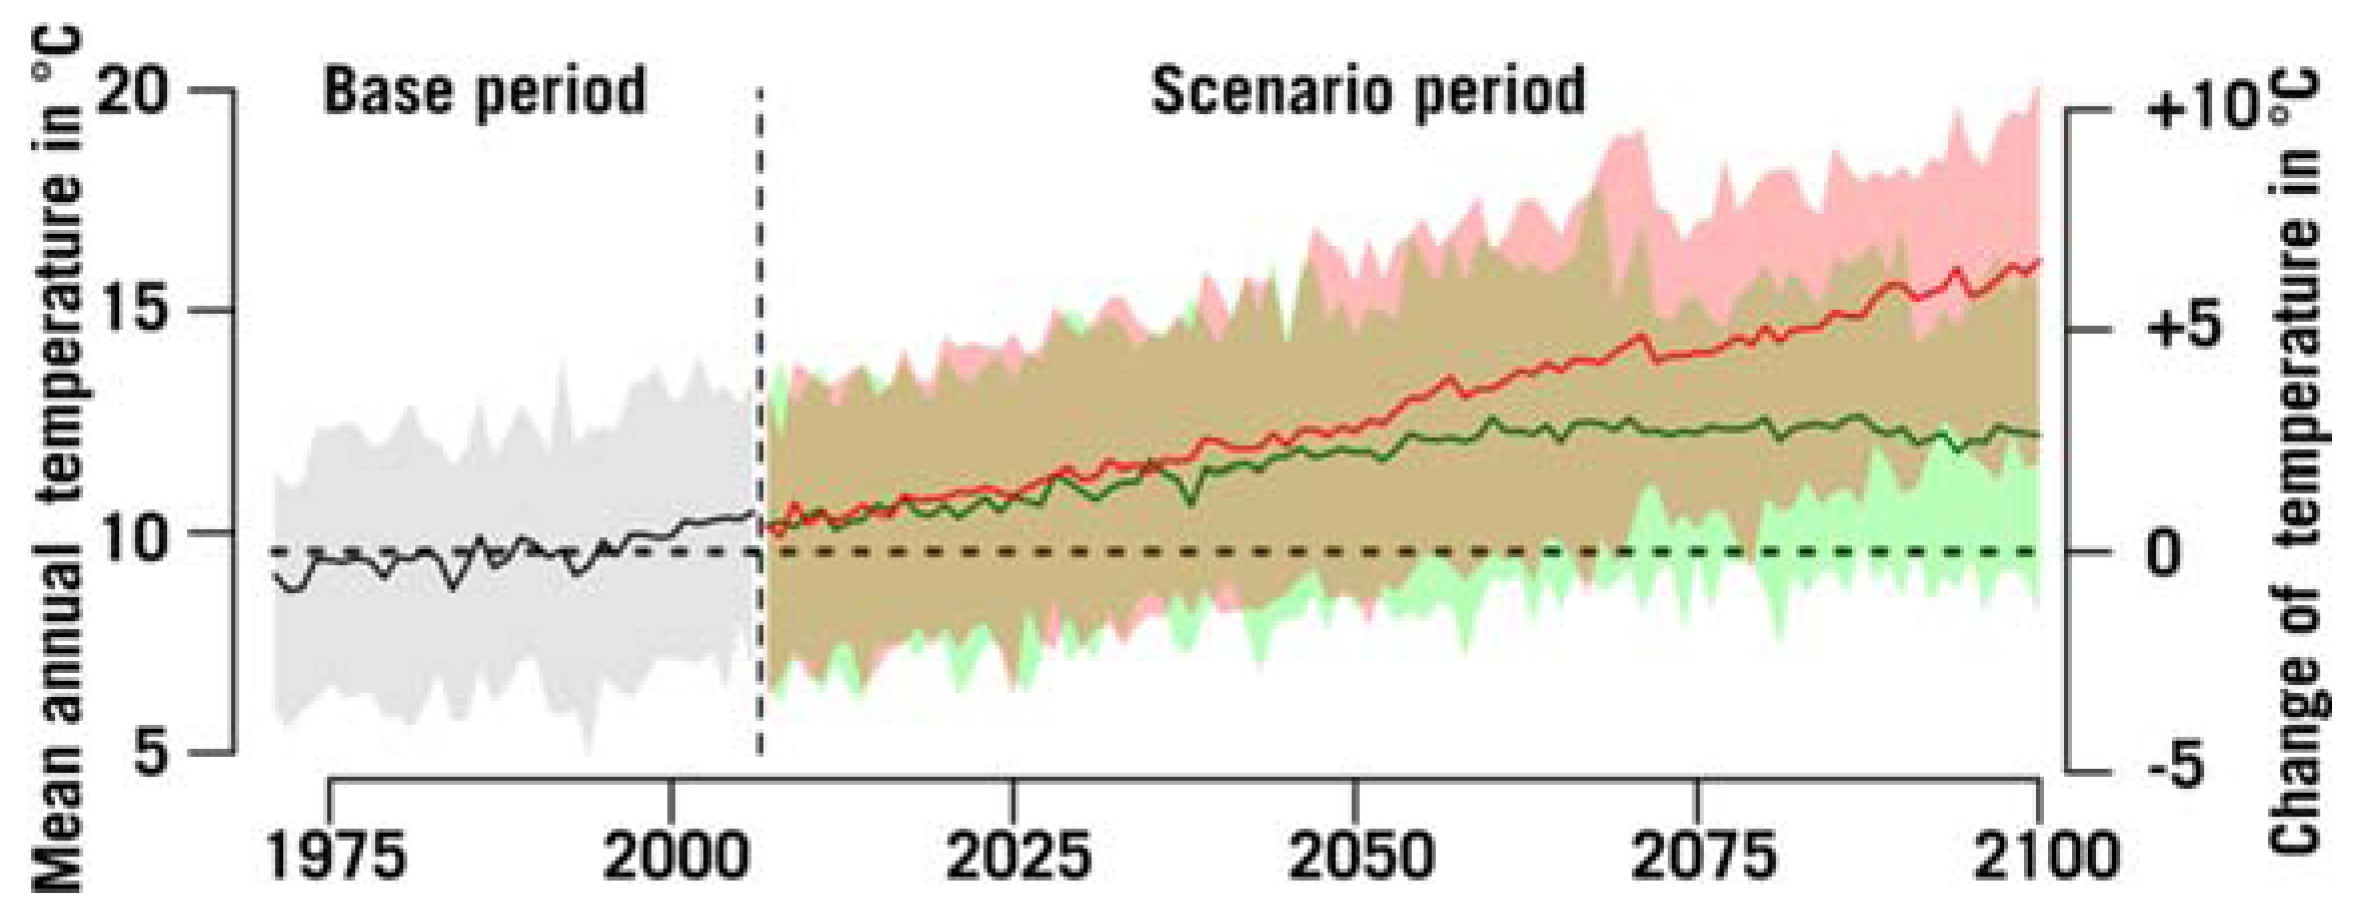
| Afghanistan | 2006–2050 | RCP 4.5 | 1.7 | 1.1–2.9 | −1.6 + | −19.1–24.7 | 1.1 | 0.4–1.6 | 0.4 + | −28.4–9.4 |
| RCP 8.5 | 2.3 | 1.6–3.5 | −3.8 | −27.3–18.6 | 1.7 | 0.7–2.4 | −2.6 + | −29.5–50.9 | ||
| 2006–2099 | RCP 4.5 | 2.7 | 2.1–3.6 | −13.1 * | −18.2–33 | 2.7 | 1–3.9 | −7.1 | −32.2–22.1 | |
| RCP 8.5 | 6.4 | 5–8.4 | −18 * | −31.8–22.40 | 8.5 | 4–14.9 | −10.5 | −38.6–34 | ||
| Hindu Kush | 2006–2050 | RCP 4.5 | 1.8 | 1–3.2 | −0.1 + | −7.6–22 | 1.2 | 0.1–1.8 | 1.9 + | −27.5–21.9 |
| RCP 8.5 | 2.6 | 1.7–3.8 | −1.3 | −20.9–9.6 | 2.0 | 0.7–2.3 | −4.1 | −24.1–20.3 | ||
| 2006–2099 | RCP 4.5 | 2.9 | 2–4.1 | −11.3 * | −9.7–14.1 | 3.4 | 1.1–5 | −2.7 + | −20.5–7.5 | |
| RCP 8.5 | 7.1 | 5.3–10.3 | −14.7 * | −25.5–21.4 | 12 | 4.4–20.2 | −12.8 * | −35.6–10.3 | ||
| North | 2006–2050 | RCP 4.5 | 1.6 | 1–2.6 | −3.1 + | −22–47.9 | 0.8 | 0.1–1.4 | −2.6 | −46.6–71 |
| RCP 8.5 | 2.3 | 1.6–3.5 | −9.8 | −26.6–7.2 | 1.1 | 0.4–1.8 | −8.5 + | −40.4–24.7 | ||
| 2006–2099 | RCP 4.5 | 2.6 | 2.1–3.6 | −16.2 * | −20.9–33.5 | 1.8 | 0.4–2.9 | −14.6 | −54.3–16.3 | |
| RCP 8.5 | 6.2 | 4.7–8.2 | −25 | −46.8–16.8 | 5.8 | 2–10.7 | −20.1 + | −72.9–32 | ||
| Centre | 2006–2050 | RCP 4.5 | 1.9 | 1.1–3 | −2 | −25.5–42.8 | 1.1 | 0.3–1.6 | −4.4 | −34.9–19.6 |
| RCP 8.5 | 2.4 | 1.4–3.6 | −2.9 | −30.8–27 | 1.8 | 0.6–2.5 | 8.3 + | −26.2–68 | ||
| 2006–2099 | RCP 4.5 | 2.9 | 2.2–3.6 | −14.2 * | −26.9–29 | 2.9 | 1–4 | −3.5 | −31.8–29.8 | |
| RCP 8.5 | 6.7 | 5.4–8.7 | −19.2 | −37.6–26.8 | 8.7 | 4–14.4 | −2.1 | −51.6–40 | ||
| East | 2006–2050 | RCP 4.5 | 1.6 | 0.9–2.8 | 0.2 | −28.3–59.3 | 1.2 | 0.5–1.5 | 0.2 | −12.4–42.5 |
| RCP 8.5 | 2.0 | 1.1–3.2 | 7.1 + | −24.2–55.5 | 1.5 | 0.3–2.3 | 3.6+ | −23.1–56.2 | ||
| 2006–2099 | RCP 4.5 | 2.4 | 1–2.8 | −9.7 | −14.4–24.8 | 2.5 | 1.3–3.5 | 0.9 | −25.6–24 | |
| RCP 8.5 | 5.9 | 4.4–7.9 | −7.3 | −35.2–42.7 | 6.5 | 3–12.2 | 0.7+ | −39.8–56.2 | ||
| South | 2006–2050 | RCP 4.5 | 1.5 | 1.9–3.2 | −0.1 | −32.9–37.2 | 1.2 | 0.5–1.8 | −0.6 | −48.4–70.2 |
| RCP 8.5 | 2.1 | 1.5–3.4 | −4 | −51.5–89.6 | 1.7 | 0.7–2.6 | 5.8 | −75.1–256.8 | ||
| 2006–2099 | RCP 4.5 | 2.4 | 1.1–2.9 | −5.8 + | −25.7–41.4 | 2.6 | 1–4 | 2.5 + | −50.3–186.1 | |
| RCP 8.5 | 6.0 | 4.5–8.2 | −13.1 * | −44.4–38.4 | 8.6 | 4.8–15.1 | −0.4 + | −85.5–152.3 | ||
| Region | Period | Scenario | Trend for SPEI | Trend for Spring Precipitation in % | Trend for GSL in Days | |||
|---|---|---|---|---|---|---|---|---|
| Mean | Range | Mean | Range | Mean | Range | |||
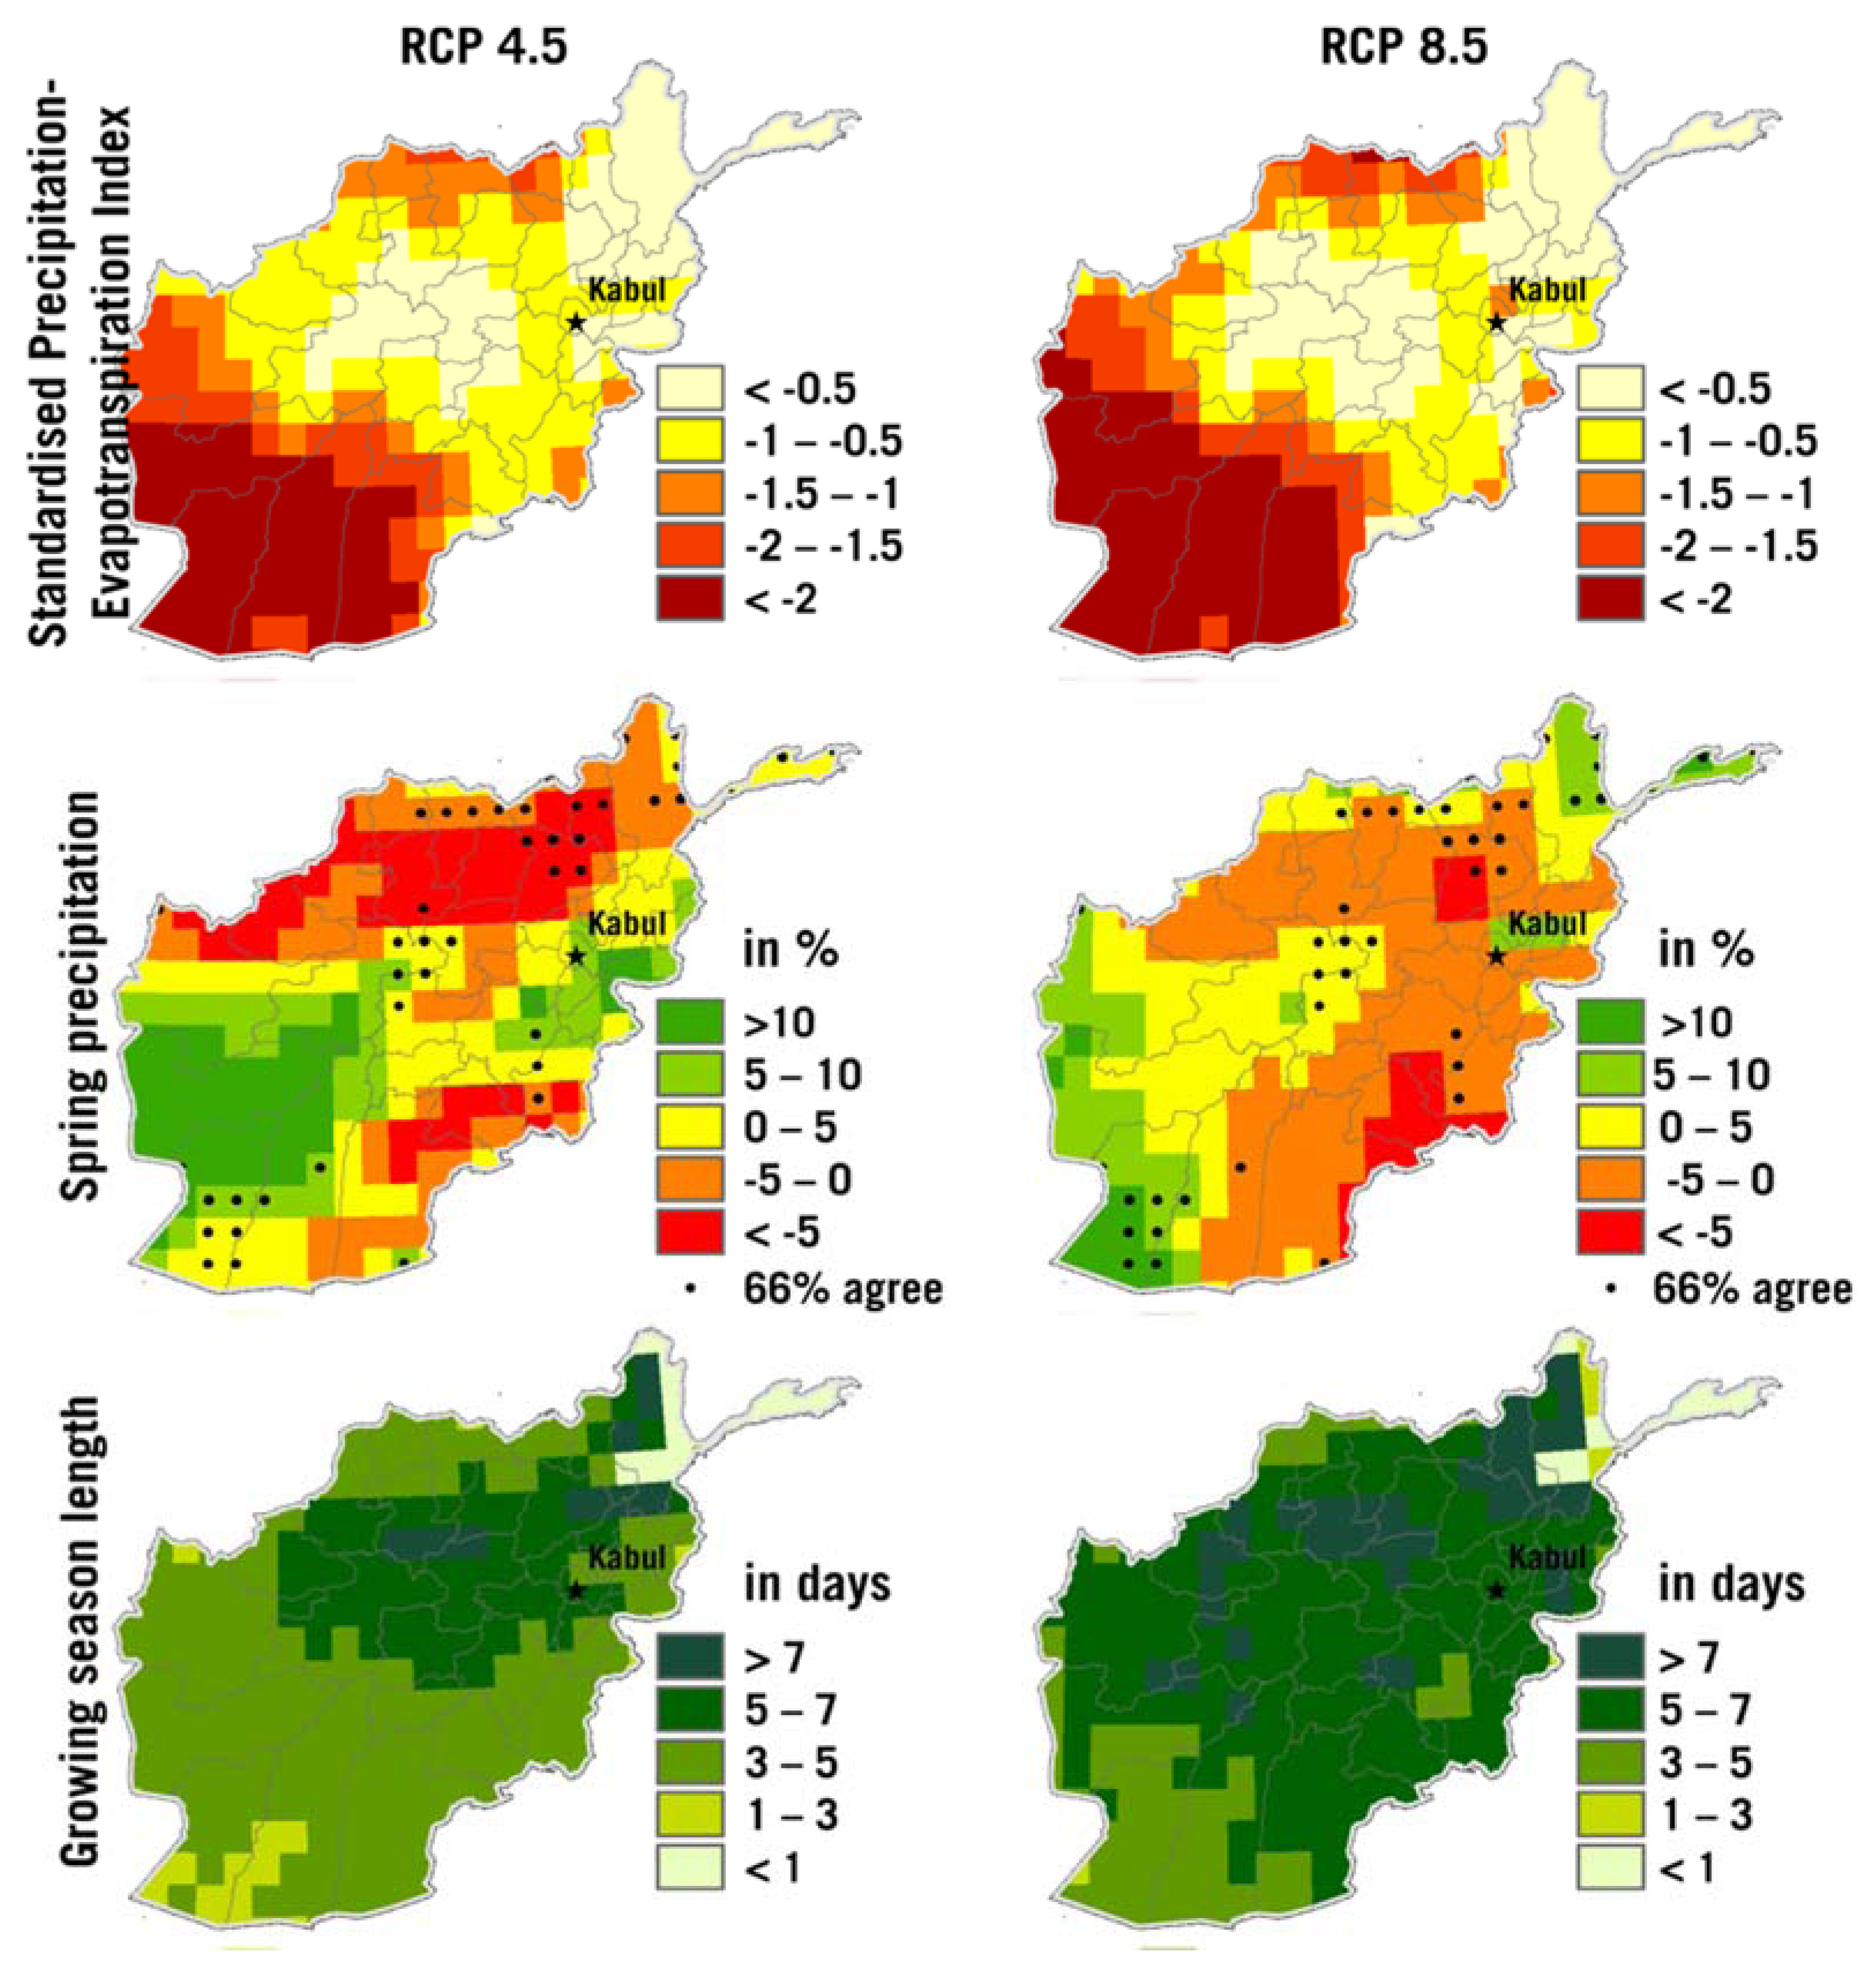
| Afghanistan | 2006–2050 | RCP 4.5 | −0.79 | −1.4–−0.1 | −3.7 | −25.5–49 | 16.6 | 8.2–27.8 |
| RCP 8.5 | −0.66 | −1.2–−0.2 | −12.9 + | −31.6–23.3 | 21.5 | 9.9–31.8 | ||
| 2006–2099 | RCP 4.5 | −1.2 | −2.1–0.8 | −15.1 * | −25–33.7 | 22.4 | 18.5–32.2 | |
| RCP 8.5 | −2.32 | −2.9–−1.5 | −28.9 | −58.7–24.3 | 59 | 44.6–81.4 | ||
| Hindu Kush | 2006–2050 | RCP 4.5 | −0.21 + | −0.7–0.8 | −1.9 | −12.2–37 | 17.2 | 1.7–40.8 |
| RCP 8.5 | −0.08 | −0.9–0.3 | −6.3 + | −22.4–17.7 | 25 | 9.2–54.7 | ||
| 2006–2099 | RCP 4.5 | −0.01 + | −0.6–1.7 | −9.3 | −10.2–32.5 | 20 | 15.9–49.4 | |
| RCP 8.5 | −0.44 | −1.7–0.6 | −18.9 | −48.1–32.8 | 78.3 | 34.5–122.4 | ||
| North | 2006–2050 | RCP 4.5 | −0.79 | −1.4–0 | −3.9 | −25–30.8 | 18.5 | 11.1–32.8 |
| RCP 8.5 | −0.84 | −1.3–−0.4 | −16.8 | −36.1–9.5 | 23.4 | 6.7–38.9 | ||
| 2006–2099 | RCP 4.5 | −1.42 | −2.3–0 | −17.4 * | −22.4–20.8 | 22.9 | 20.5–39.2 | |
| RCP 8.5 | −2.64 | −3.1–−1.8 | −33.5 | −66.8–6.4 | 64.9 | 48.7–91.7 | ||
| Centre | 2006–2050 | RCP 4.5 | −0.64 | −1.4–0.3 | −5.9 | −38.5–79.7 | 19.6 | 5.8–35.1 |
| RCP 8.5 | −0.55 | −1.2–0.1 | −13.6 | −41.7–37.1 | 24 | 10.7–37.5 | ||
| 2006–2099 | RCP 4.5 | −0.86 | −1.9–1.3 | −18.9 * | −41.3–44.6 | 21.1 | 20.8–41.3 | |
| RCP 8.5 | −2.08 | −3–−0.8 | −33.4 | −70.9–25.5 | 73.4 | 52.7–104.1 | ||
| East | 2006–2050 | RCP 4.5 | −0.77 | −1.4–0.1 | −14.2 | −42.7–105.9 | 19.2 | 10.8–26.8 |
| RCP 8.5 | −0.49 | −1.4–−0.4 | −23.8 | −49.9–56.8 | 24.1 | 15.7–33 | ||
| 2006–2099 | RCP 4.5 | −1.01 | −2.1–0.4 | −24.5 * | −54.3–45.2 | 20.9 | 19.4–35.5 | |
| RCP 8.5 | −2.18 | −2.9–−1.2 | −39.3 | −66.1–47.1 | 59.8 | 44.3–77.9 | ||
| South | 2006–2050 | RCP 4.5 | −1.28 | −2–−0.6 | −7.5 | −48–172.5 | 11.2 | 0.9–28.1 |
| RCP 8.5 | −0.93 | −1.4–−0.4 | 30.2 | −66.8–60.7 | 14.9 | 1.1–29.9 | ||
| 2006–2099 | RCP 4.5 | −1.99 | −2.9–0.5 | −18.5 | −52.5–46.4 | 11.1 | 3.4–36.1 | |
| RCP 8.5 | −3.17 | −3.3–−2.8 | −44.1 | −61.4–26.1 | 27.9 | 59.9–2.6 | ||
© 2017 by the authors. Licensee MDPI, Basel, Switzerland. This article is an open access article distributed under the terms and conditions of the Creative Commons Attribution (CC BY) license (http://creativecommons.org/licenses/by/4.0/).
Share and Cite
Aich, V.; Akhundzadah, N.A.; Knuerr, A.; Khoshbeen, A.J.; Hattermann, F.; Paeth, H.; Scanlon, A.; Paton, E.N. Climate Change in Afghanistan Deduced from Reanalysis and Coordinated Regional Climate Downscaling Experiment (CORDEX)—South Asia Simulations. Climate 2017, 5, 38. https://doi.org/10.3390/cli5020038
Aich V, Akhundzadah NA, Knuerr A, Khoshbeen AJ, Hattermann F, Paeth H, Scanlon A, Paton EN. Climate Change in Afghanistan Deduced from Reanalysis and Coordinated Regional Climate Downscaling Experiment (CORDEX)—South Asia Simulations. Climate. 2017; 5(2):38. https://doi.org/10.3390/cli5020038
Chicago/Turabian StyleAich, Valentin, Noor Ahmad Akhundzadah, Alec Knuerr, Ahmad Jamshed Khoshbeen, Fred Hattermann, Heiko Paeth, Andrew Scanlon, and Eva Nora Paton. 2017. "Climate Change in Afghanistan Deduced from Reanalysis and Coordinated Regional Climate Downscaling Experiment (CORDEX)—South Asia Simulations" Climate 5, no. 2: 38. https://doi.org/10.3390/cli5020038
APA StyleAich, V., Akhundzadah, N. A., Knuerr, A., Khoshbeen, A. J., Hattermann, F., Paeth, H., Scanlon, A., & Paton, E. N. (2017). Climate Change in Afghanistan Deduced from Reanalysis and Coordinated Regional Climate Downscaling Experiment (CORDEX)—South Asia Simulations. Climate, 5(2), 38. https://doi.org/10.3390/cli5020038


