Relation between Short-Term and Long-Term Variations of Precipitation


Institute of Applied Physics and Oeschger Centre for Climate Change Research, University of Bern, 3012 Bern, Switzerland
Climate 2017, 5(4), 96; https://doi.org/10.3390/cli5040096
Submission received: 13 October 2017
/
Revised: 29 November 2017
/
Accepted: 8 December 2017
/
Published: 14 December 2017
(This article belongs to the Special Issue Decadal Variability and Predictability of Climate)
Abstract
:It is often stated that short-term precipitation of synoptical weather is related to trends or interannual variations of precipitation. We analyzed nine long-term series of daily precipitation values of the Global Historical Climatology Network (GHCN-D V2.0). Generally, the mean amplitude of short-term variations increases (decreases) if there is a positive (negative) interannual anomaly of precipitation, respectively. In all cases, the amplitude of the short-term variations (periods < 10 days) clearly correlates with the long-term variations (periods > 1.5 years) of precipitation. The correlation coefficient is between 0.7 and 0.95 at periods <8 days. For Kukuihaele (Hawaii), the correlation maximizes at a period of about 14 days. In the other cases, the maximum of the correlation is reached at periods <5 days.
1. Introduction
Latif [1] explained that the simulation and prediction of mesoscale systems, synoptical scale disturbances, intraseasonal, seasonal and interannual variations are intimately linked. Particularly, we expect that the short-term variations of precipitation are linked to long-term variations of precipitation. One reason is that precipitation values are always positive. Thus, one can argue that a long-term positive anomaly of precipitation is likely accompanied by an increase of the frequency and intensity of short-term rainfall events. The accumulation of short-term rainfall events may induce the anomaly of the long-term variation of precipitation. On the other hand, the increase of short-term rainfall events can have its origin in long-term climate change. One example for such a connection is the increase of tropical sea surface temperature due to global warming and the associated increase in the frequency and intensity of tropical hurricanes. It would be valuable for climate change research if one can surely state that a long-term increase of precipitation is accompanied by an increase of short-term variations of precipitation. This would establish a close connection between climate change and weather. Up to now, qualitative judgments are given, for example that an increase of flooding is due to increased water vapor concentrations in the air related to global warming. The long-term series of daily precipitation values of the Global Historical Climatology Network (GHCN-D V2.0) seem to be adequate for a quantitative study of the relationship between long-term and short-term variations of precipitation.
Fujinami [2] found that sub-monthly scale (7–25 days) intraseasonal oscillations (ISO) are a dominant mode of summer rainfall fluctuations over Bangladesh. The interannual variability (IAV) of the ISOs is significantly correlated with the IAV of total summer monsoon rainfall suggesting that the ISO activity could modulate the series of total summer monsoon rainfall. Specifically, the sub-monthly-scale ISOs are closely associated with the north-south shift of the monsoon trough. Further, they found that the activity of high-frequency variations (3–6 days) has little relationship with the IAV of the intraseasonal variance and total summer monsoon rainfall. Suhas [3] explained that the potential predictability of the seasonal mean would depend on the relative contribution of the external and internal components to the IAV. The external component arises from ENSO, decadal oscillations and other slowly varying boundary forces, while the internal component may arise from the interaction between seasonal mean and ISOs, the interaction between organized convection and large-scale circulation and other interactions among different scales of motion.
There are not very many studies that have investigated the power spectrum of precipitation. Hartmann and Michelsen [4] analyzed the intraseasonal periodicities in Indian rainfall and found 40–50-day and 5–7-day spectral peaks in the power spectra. It is likely that the spectral peaks at periods <10 days are suppressed by the choice of the time window length of about one year. Possibly, a wavelet-like analysis method is more appropriate where the variable length of the time window is about three-times the period. Such a method was selected by Studer [5] for investigation of intraseasonal oscillations in the stratospheric ozone. de Jongh [6] performed a Morlet wavelet analysis of a 105-year time series of precipitation observed at Uccle, Belgium. They found multi-annual components of three and seven years, which occurred before 1935 and after 1945.
Fatichi [7] found a significant correlation between the annual precipitation and intra-annual seasonality using gauge precipitation records of the Global Historical Climatology Network. This means that sub-yearly precipitation anomalies impose a higher variability in the annual precipitation fluctuations. Generally, Fatichi [7] found a well-defined geographical distribution of regions with large and low interannual variability. Dai [8] reported that the first leading EOFin global precipitation fields is an ENSO-related pattern and that ENSO is the single largest cause of extreme precipitation events. Thus, there is a link between the interannual variation in precipitation as caused by ENSO and the strength of short-term precipitation events. Further, Peel [9] found a connection between the variability of annual precipitation and ENSO for stations in ENSO-influenced regions. The coefficient of variation of annual precipitation increased by about 5–25%. is defined as the quotient of the standard deviation of the annual precipitation series and its mean value.
Lau and Sheu [10] derived the spatial and temporal variations in global precipitation associated with the annual oscillation (AO), the tropospheric quasi-biennial oscillation (QBO) and the ENSO. They found that the QBO is well correlated with the square of the ENSO signal. Further, the QBO was strongly phase locked to the AO, while the phase lock between AO and ENSO was not obvious. Lau and Sheu [10] suggested that the timing of the AO and intraseasonal oscillations at a critical phase of the QBO may be important in influencing the subsequent evolution of the coupled ocean-atmosphere system. Wang [11] reported that the major modes of the Asian-Australian Monsoon (A-AM) system changed since the late 1970s. This inter-decadal change is ascribed to increased ENSO forcing and A-AM feedback to ENSO.
Our study investigates the relationship between short-term precipitation of synoptical weather, the annual oscillation and interannual variations of precipitation. Section 2 describes the time series of daily precipitation values at nine selected locations. The data analysis is explained in Section 3. The results are shown and discussed in Section 4.
2. Precipitation Measurements
The study utilizes nine long-term series of daily precipitation values of the Global Historical Climatology Network (GHCN-D V2.0), which are provided via the Climate Explorer of Koninklijk Nederlands Meteorologisch Instituut (https://climexp.knmi.nl). If data gaps were present, then they were closed by linear interpolation. The fraction of data gaps were on average about 3%. Table 1 shows the characteristics and certain parameters of the selected nine time series of precipitation. The stations are ordered by the strength of the mean precipitation. The selected time series cover a broad range of precipitation and have lengths of about 80 years or more. Further, the quality of the time series is good, e.g., they have only a few data gaps. The selected time series are representative of tropical, subtropical and extratropical climates.
3. Data Analysis
The time series of the interannual variations are derived by means of low pass filtering with a cutoff period of 1.5 years. The time series are filtered with a digital non-recursive, finite impulse response (FIR) low pass filter performing zero-phase filtering by processing the time series in forward and reverse directions. The number of filter coefficients corresponds to a time window of three-times the cutoff period, and a Hamming window has been selected for the filter.
Similarly, the time series of the short-term variations of precipitation were obtained by a band pass filter with central periods ranging from 2.3–200 days. Then, the amplitude series of the filtered time series is determined [5]. Please note that the amplitude is the envelope of the modulated oscillation, and the amplitude is always positive. The band pass cutoff frequencies are at , where is the central frequency. The number of filter coefficients corresponds to a time window of three-times the central period, and a Hamming window has been selected for the filter. Thus, the band pass filter has a relatively fast response time to temporal changes in the data series. The variable choice of the filter order permits the analysis of wave trains with a resolution that matches their scale. More details about the band pass filtering are given by Studer [5]. Generally, the digital filtering method has the advantage that the central wave periods of the band pass-filtered time series can be exactly selected. However, a wavelet analysis method [12] is surely an alternative to the digital filtering method of the present study.
As an example, Figure 1a shows the precipitation raw data for Ft. Lauderdale (FL, USA) as a blue line and the interannual variation (periods >1.5 years) as a red line. Figure 1b shows the amplitude series of the four-day oscillation in cyan. Further, the amplitude series is smoothed by a low pass filter (periods >1.5 years) yielding the black line. Thus, one can compare the mean amplitude of the four-day oscillation (black line) to the long-term variation of precipitation (red line) in Figure 1b. Both curves are quite similar, and the correlation coefficient r is 0.904 ± 0.002 (where the uncertainty marks the 95% confidence level). The significance of the correlation is 100%. The significance () was determined by the function corrcoef of the MATLAB software. Here, the p-value was computed by transforming the correlation to create a t-statistic having degrees of freedom, where N is the number of elements of the time series. This example is quite typical, and it shows the close relation between the mean amplitude of synoptical scale variations and the interannual variation of precipitation. Such a relation was also suggested by Fujinami [2], but they focused on the period ranging from 7–25 days.
4. Results and Discussion
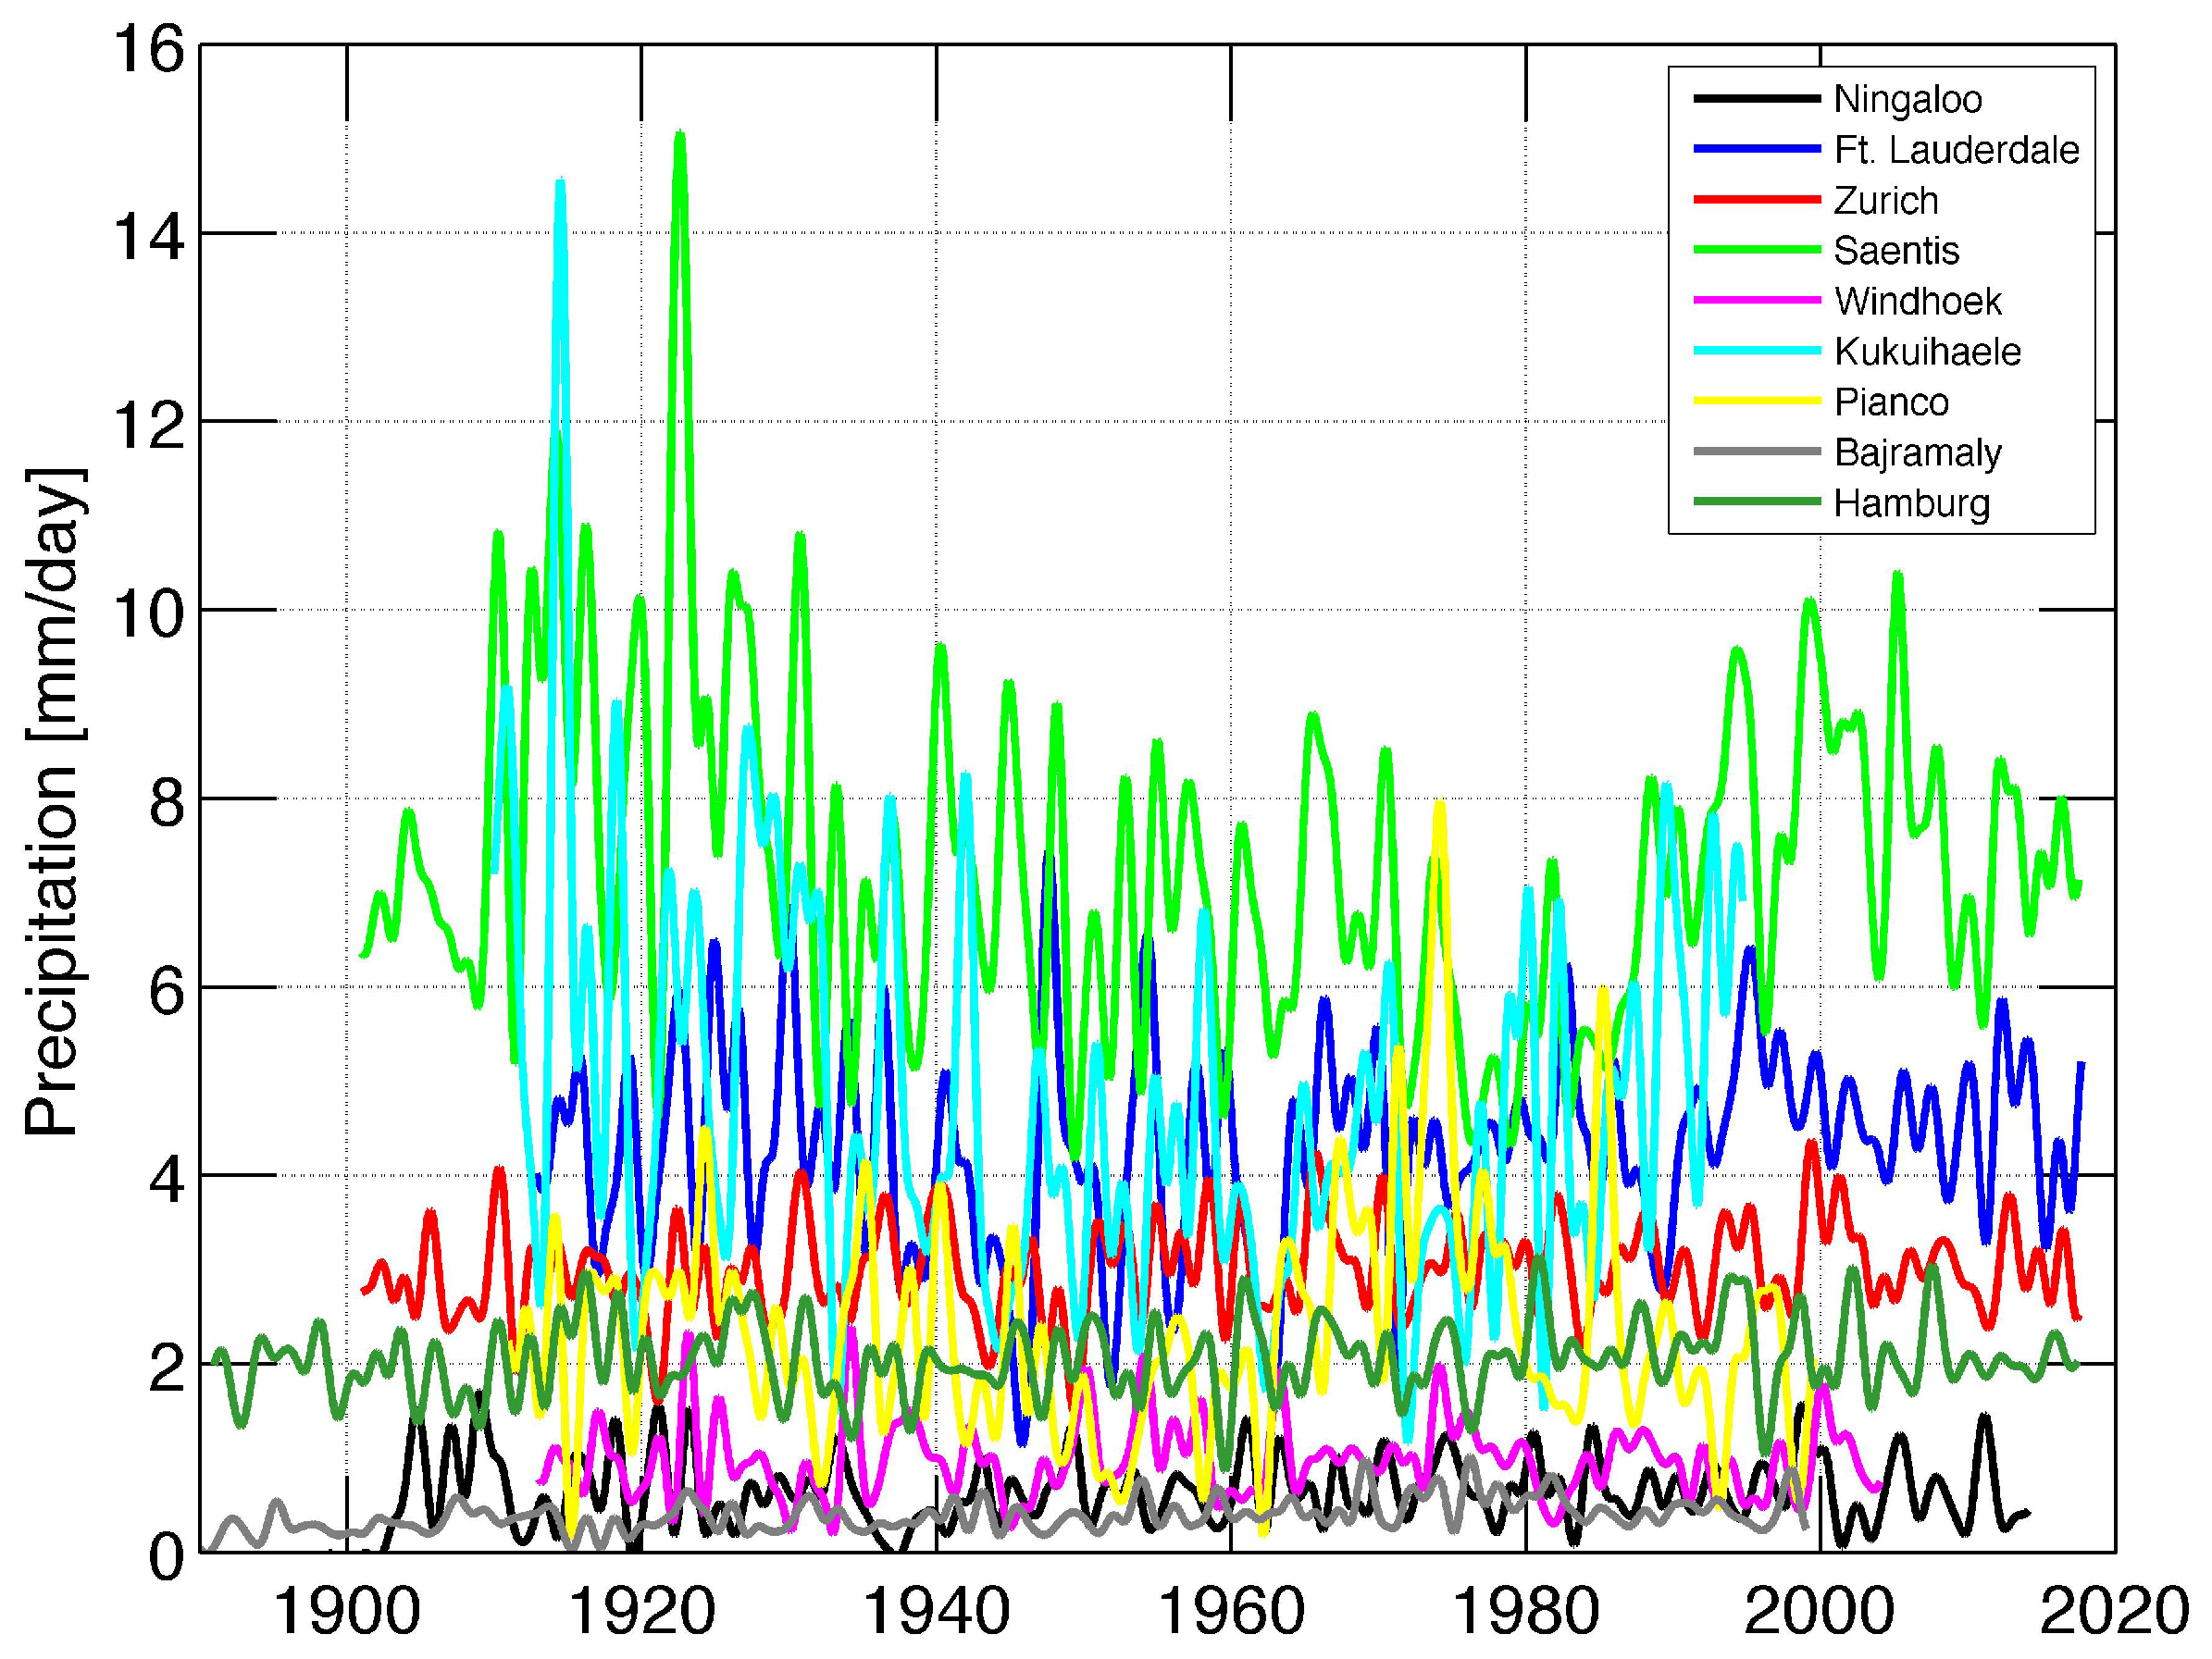
At first, the interannual variability of precipitation and the frequency of precipitation are analyzed. Figure 2 depicts the 1.5-year low pass filtered time series indicating the interannual variability of precipitation at the nine selected stations. Generally, the interannual variability has amplitudes of a few mm/day and periods from about two years to decades.
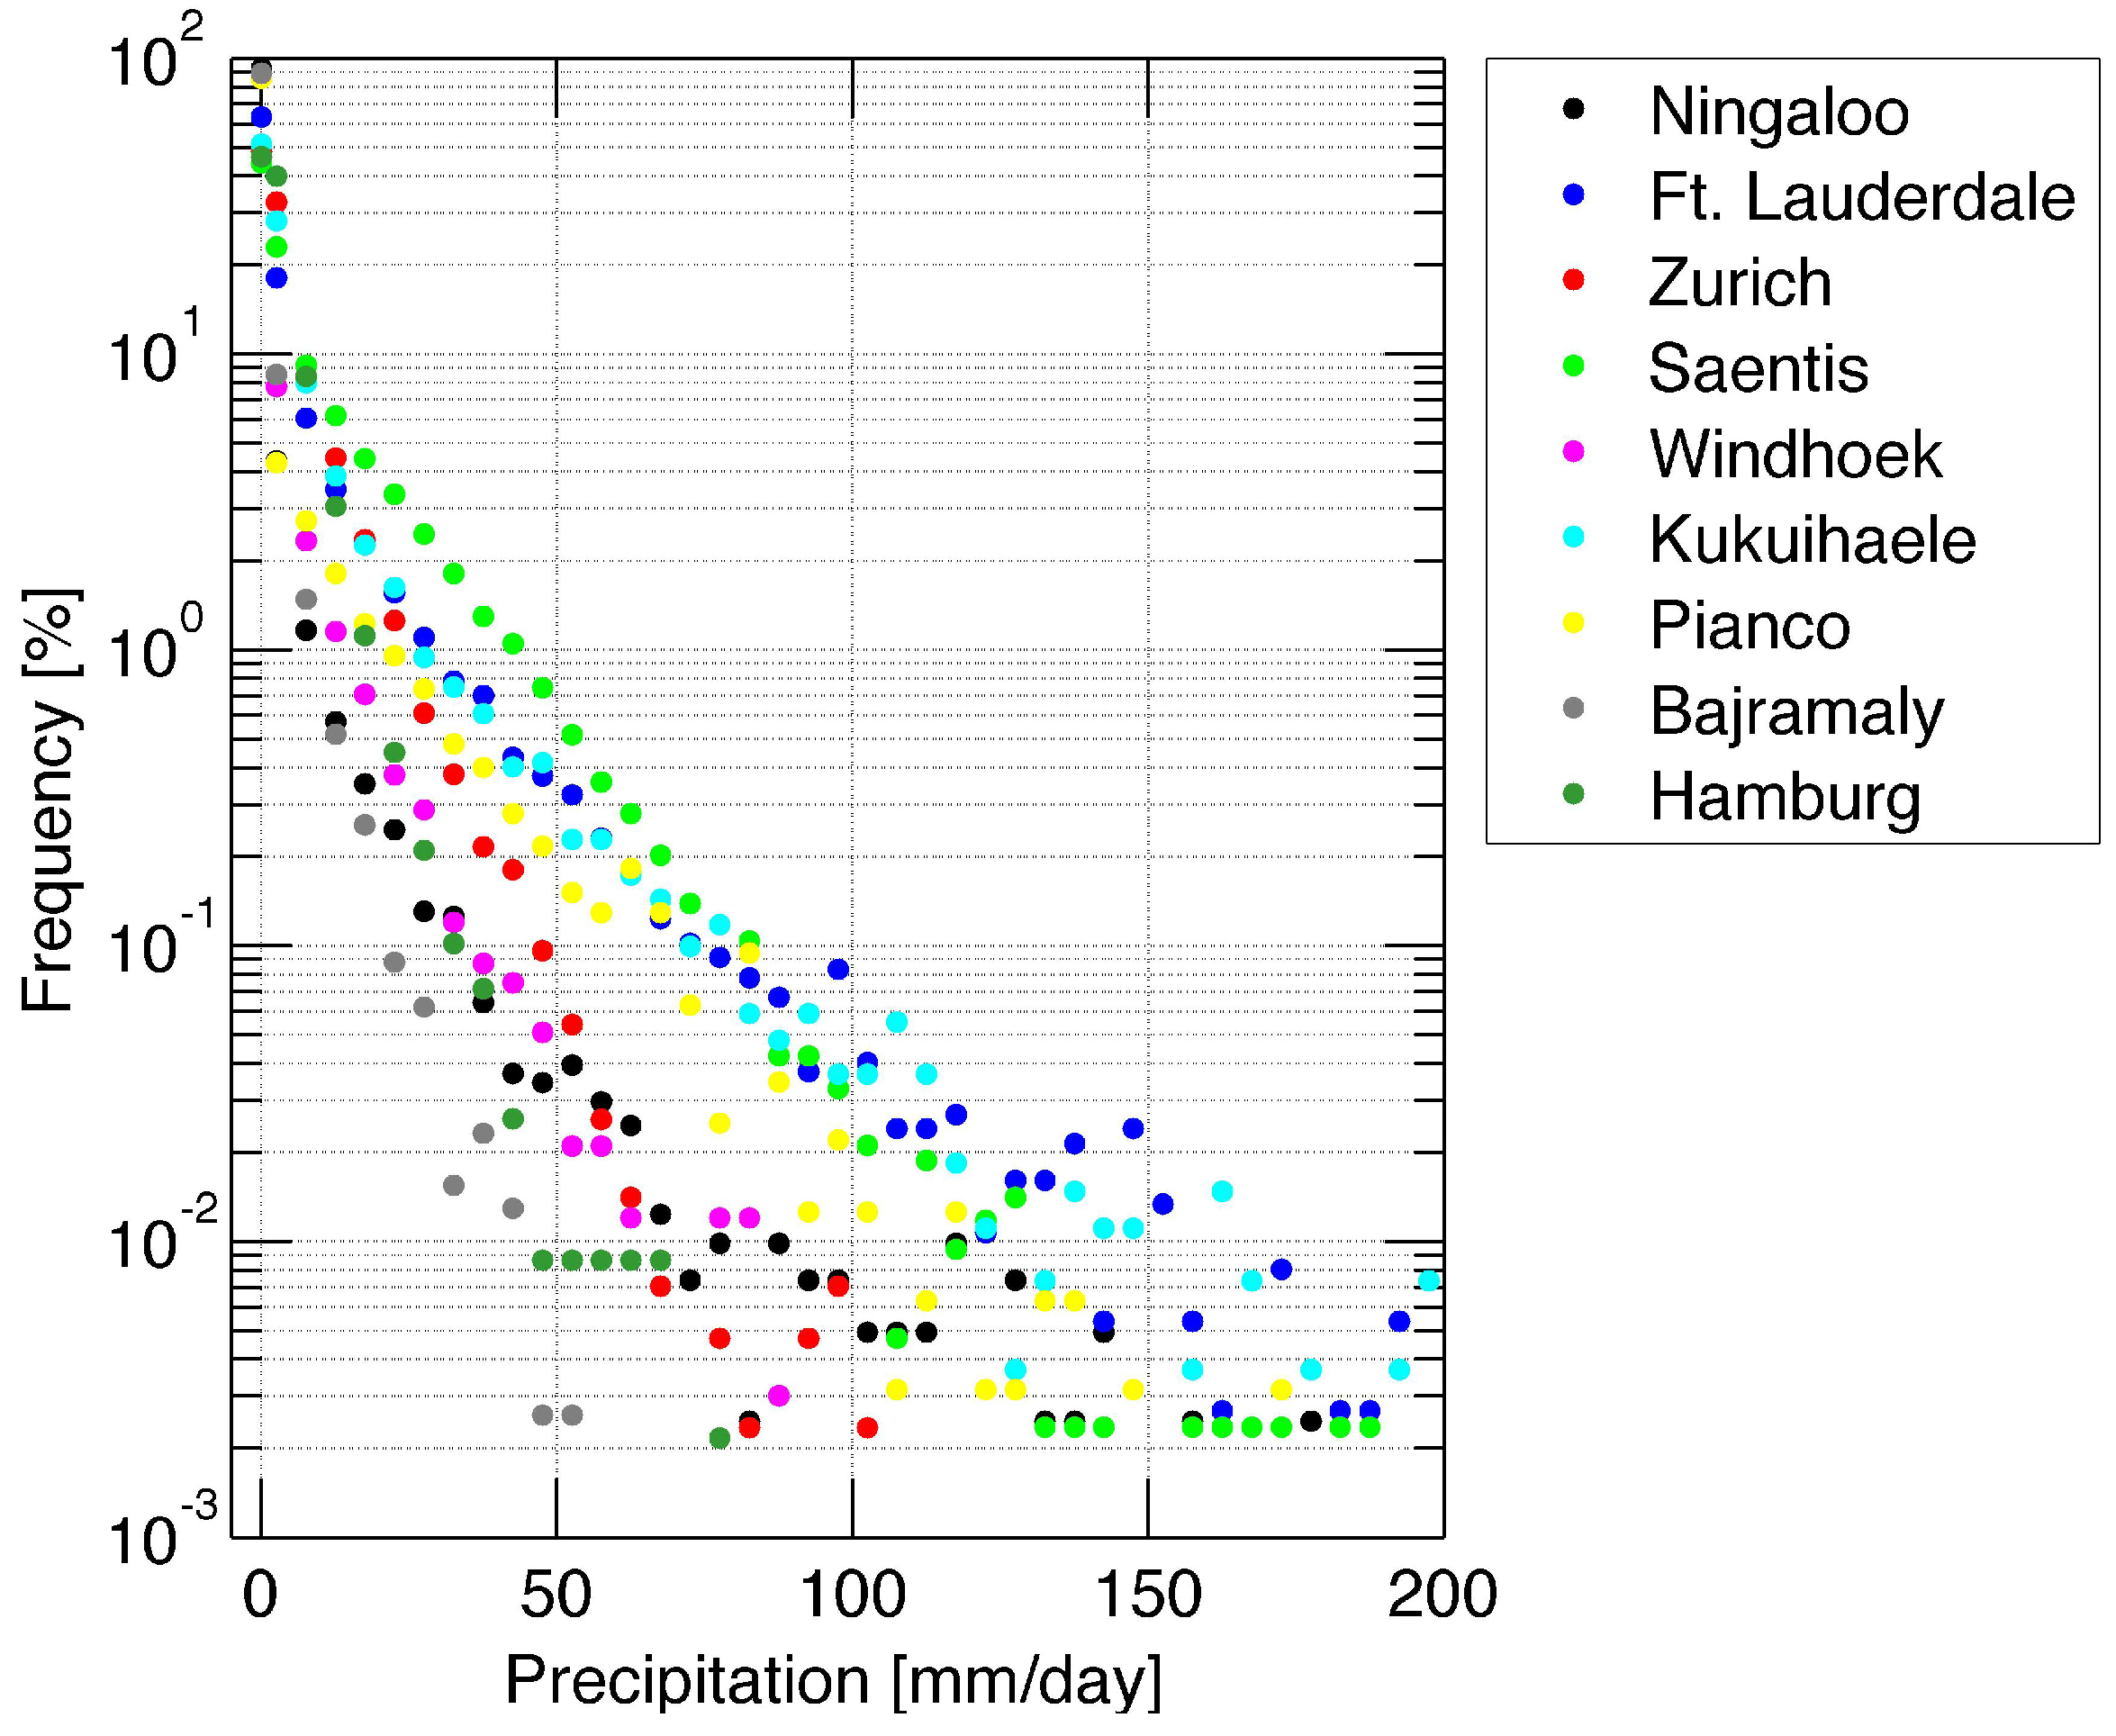
Figure 3 shows the frequency of precipitation as function of the strength of precipitation. It is obvious that the subtropical and tropical stations Ft. Lauderdale, Kukuihaele and Pianco have heavy rain more often. In addition, the mountain site Saentis in Switzerland often has heavy rain so that the Saentis is known as the wettest place of Switzerland.
Figure 4 depicts the amplitude spectra of precipitation for the period ranging from 2.3–200 days. The amplitudes were determined by band pass filtering as described in the section Data Analysis. The filtering can be regarded as a wavelet-like analysis, and upon the first view, it is knownthat the amplitude generally decreases with the increase of the period. This is different from the results of the fast Fourier transform (FFT) power spectra of precipitation of time intervals over an half year or more. In the case of FFT power spectra, the amplitudes of short-term precipitation of synoptical scale weather are suppressed since the phase changes from event to event. Figure 4 shows partly different inclinations of the amplitude spectra. In case of Pianco, a spectral peak at the semi-annual oscillation is present. Generally, all stations show that the amplitudes of oscillations with periods <20 days are greater than those of the period ranging from 20–100 days.
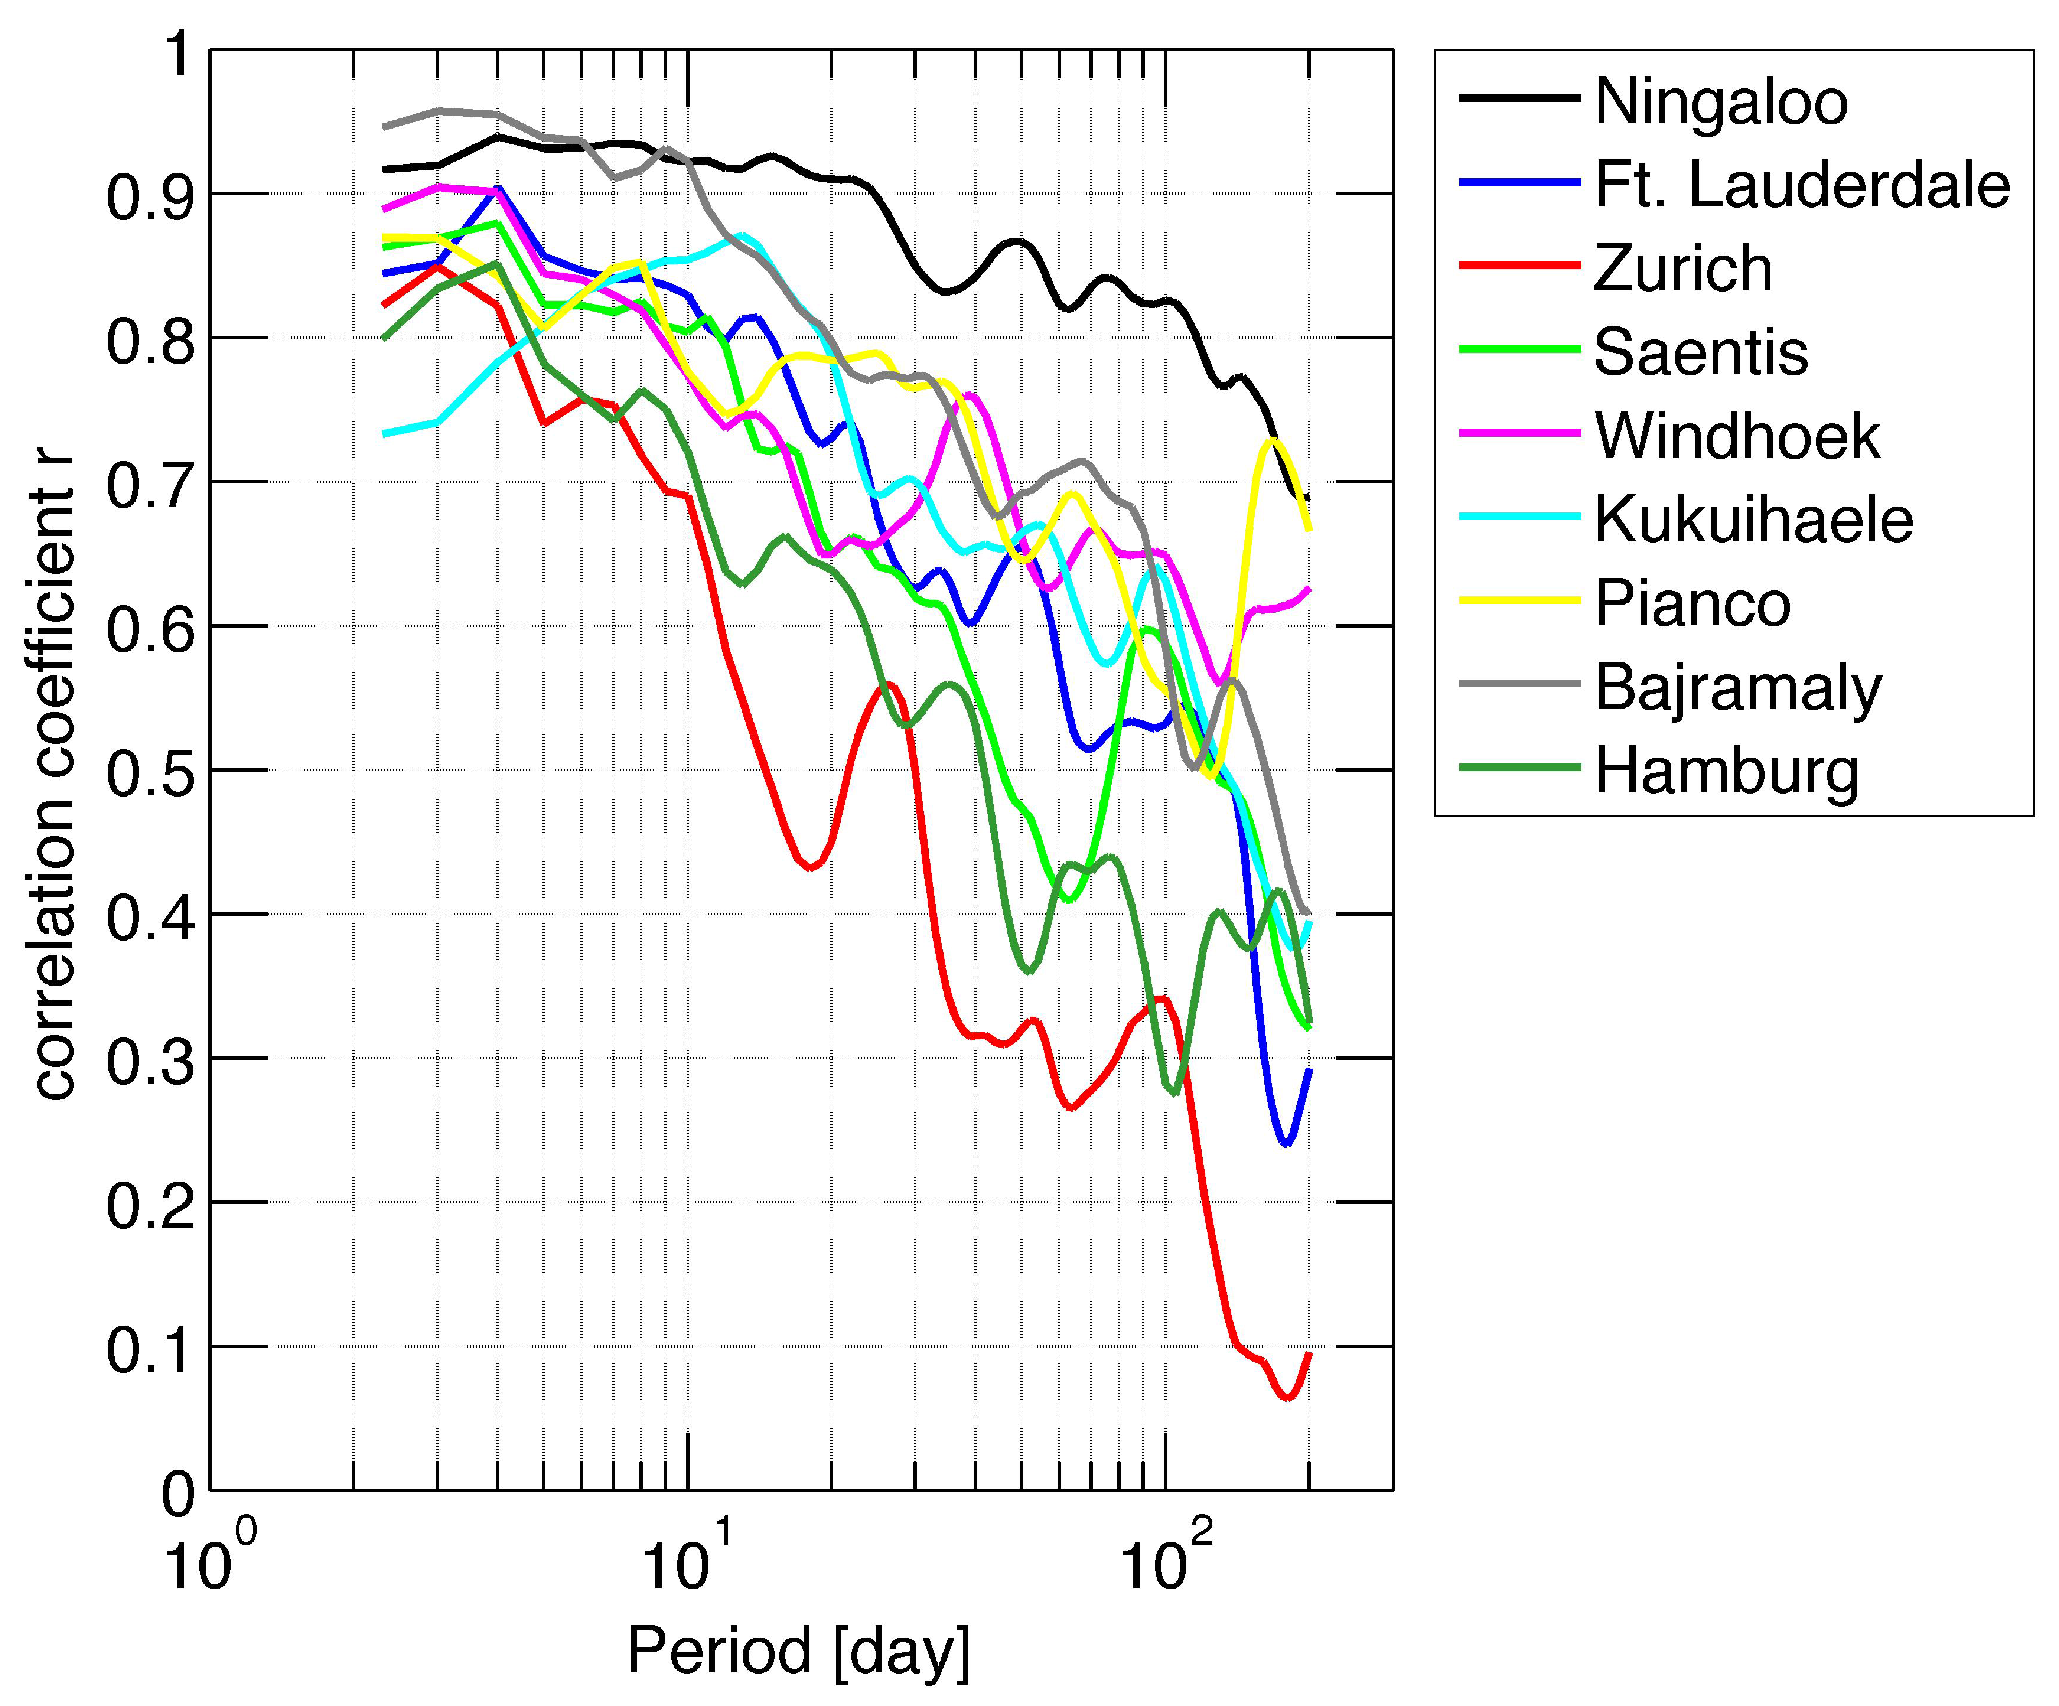
The main focus of the article is on the relation between short-term and long-term variations of precipitation. Figure 1b already showed a high correlation of between the low pass filtered amplitude series of the four-day oscillation and the interannual variability of precipitation at Ft. Lauderdale. Similar high correlations between short-term and long-term variations of precipitation are also present at the other stations as Figure 5 shows. The depicted values have a significance of the correlation greater than 95%, and relative uncertainties of r are less than 1% at the 95% confidence level.
The figure depicts the correlation coefficient r as a function of the period of the short-term variation of precipitation. For the calculation of r, two time series are correlated: one series represents the interannual variability (IAV) of precipitation, which is given by 1.5-year low pass filtering of the precipitation series. The other series represents the strength of the short-term variation of precipitation, which is given by band pass filtering. The positive amplitude series of the short-term variation is low pass filtered with a period of 1.5 years so that the slow amplitude modulation of the short-term variation is determined, and the correlation between IAV and the modulation of the short-term variation is calculated. Figure 5 indicates that correlation coefficients r greater than 0.7 are reached for short-term variations with periods less than eight days for all sites. The station Zurich has the steepest decrease of the correlation towards higher periods, while the station Ningaloo still has a high r of 0.82 at a period of 100 days. Generally, Figure 5 suggests a close relation between interannual variability and synoptical-scale variations of precipitation, which is in rough agreement with the findings of Fujinami [2]. However, in our analysis, the high frequency variations with periods less than seven days play the major role while Fujinami [2] reported that the intraseasonal oscillations with periods from 7–25 days have the strongest influence on the interannual variability of precipitation at Bangladesh. I did not include a time series from India in the analysis since the lengths of the Indian precipitation time series as provided by KNMIClimate Explorer were too short for my selection criterion.
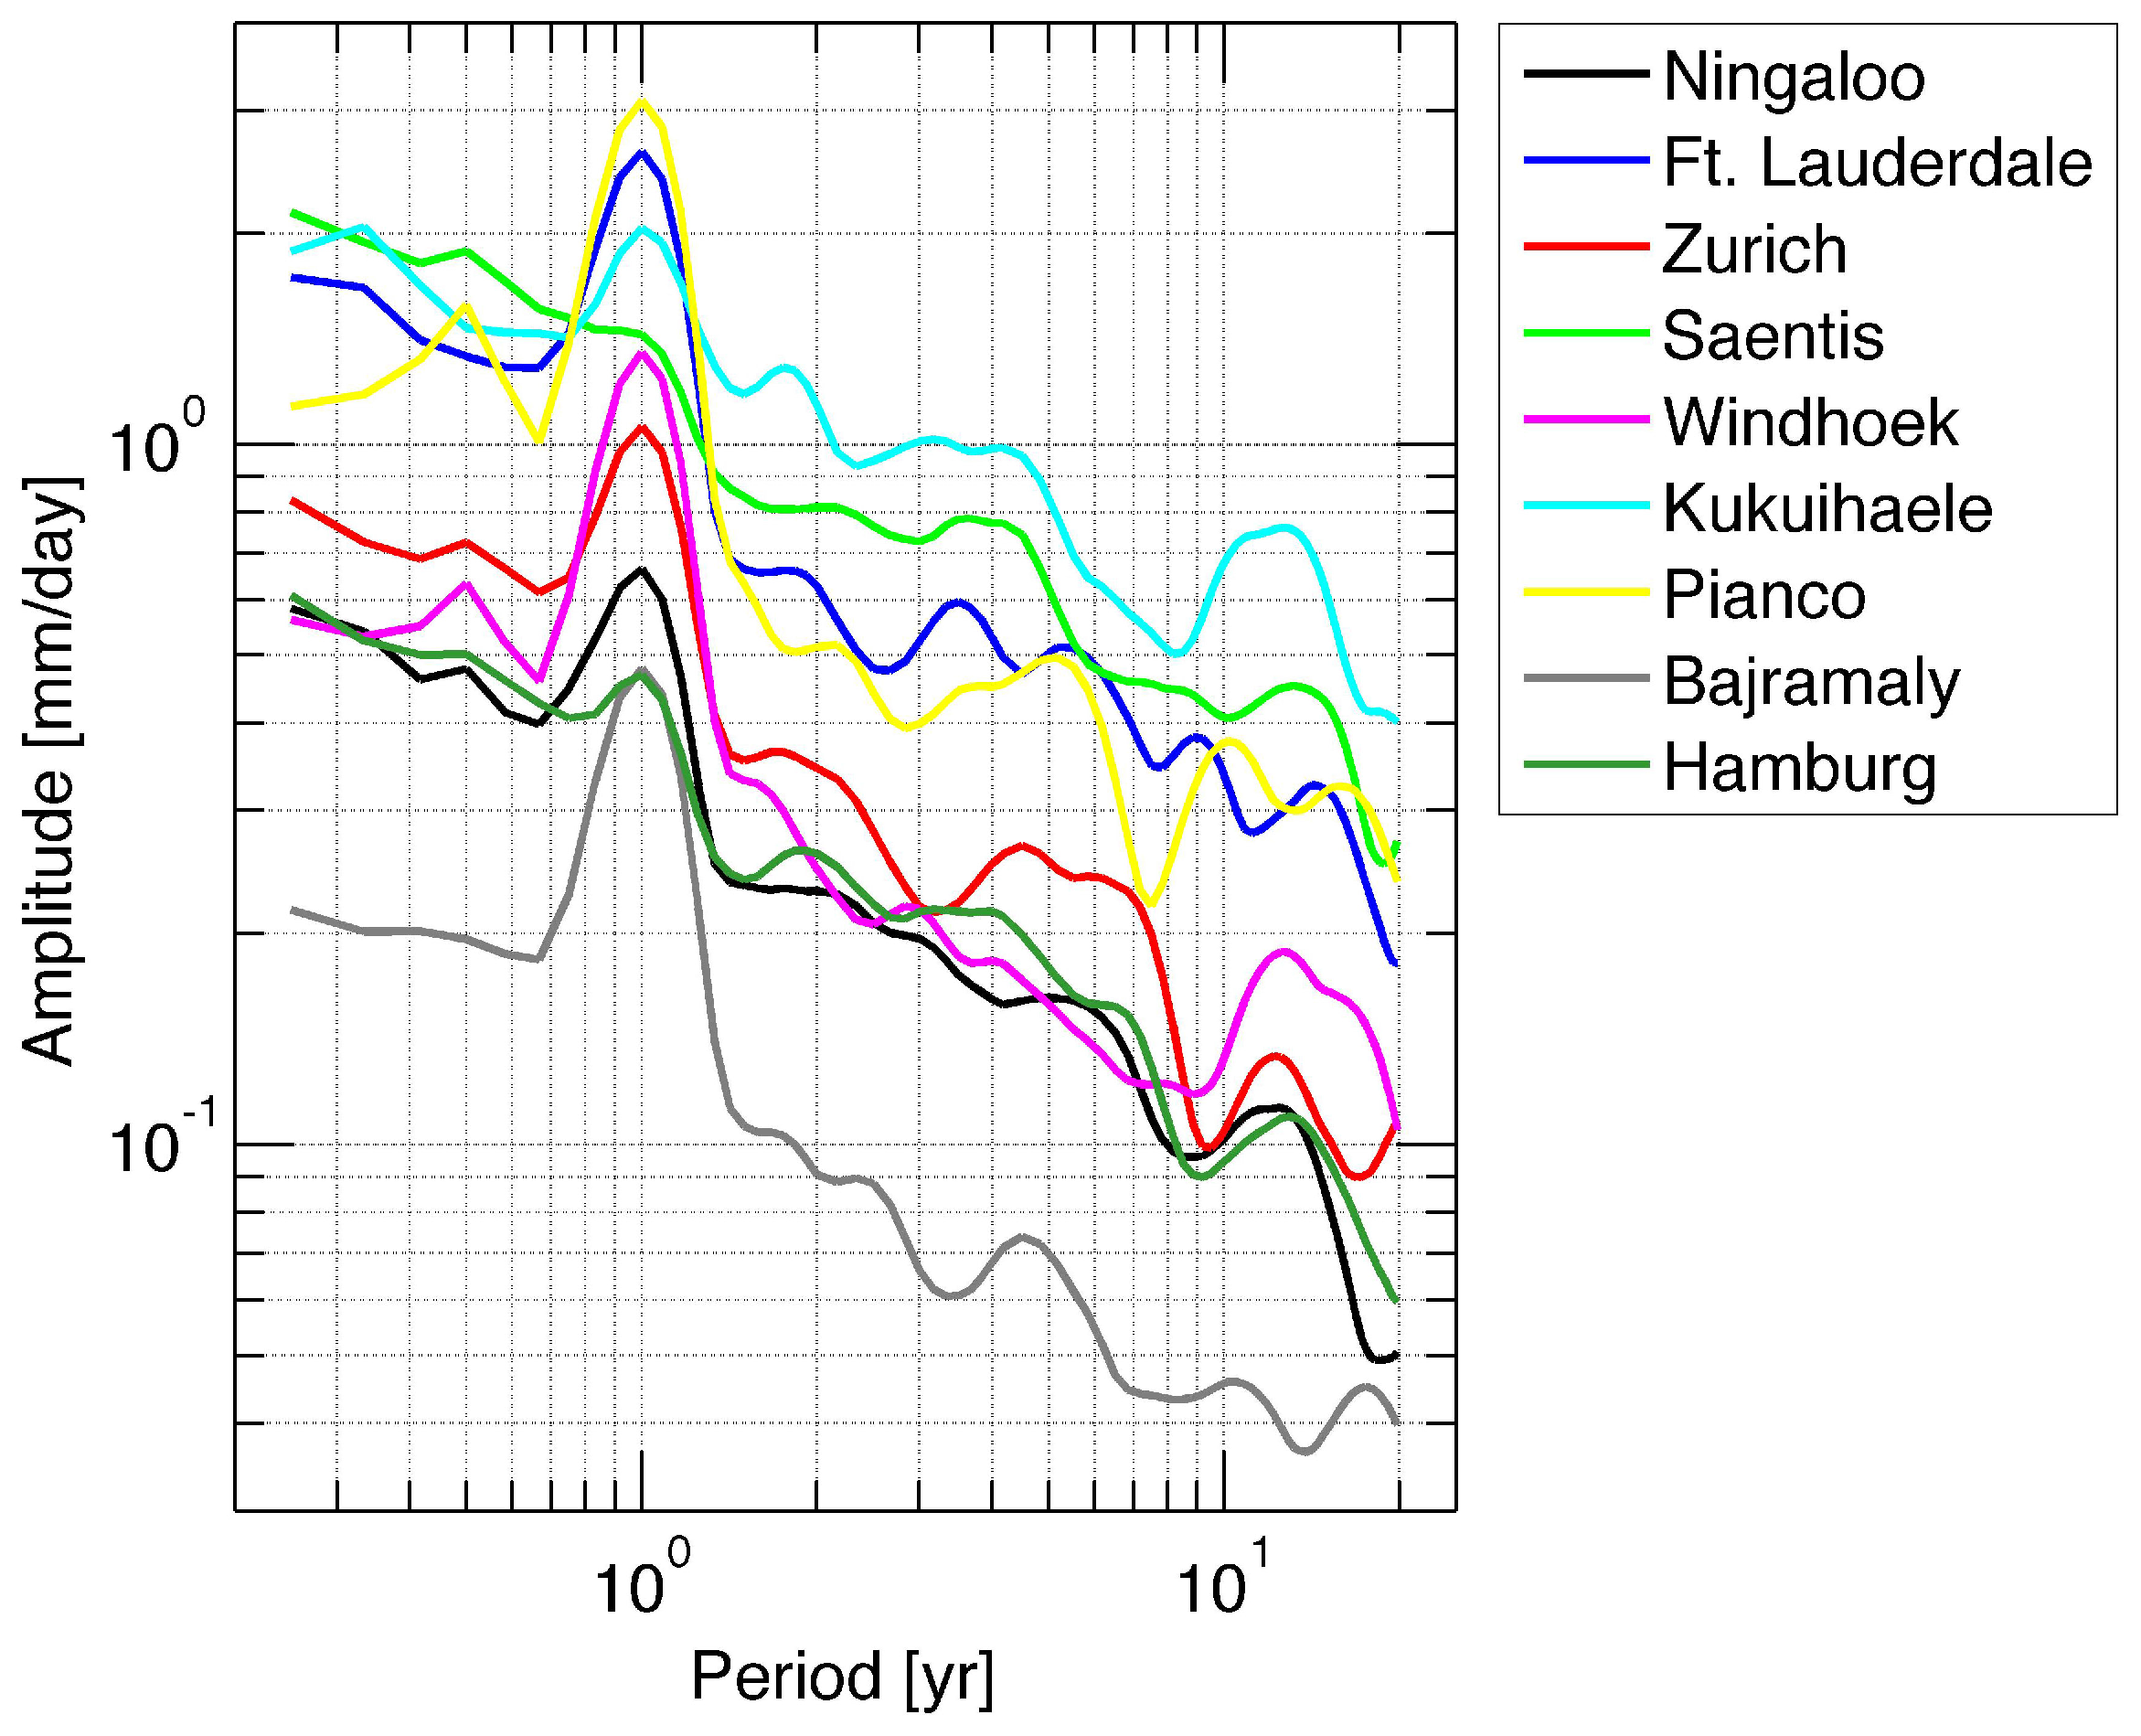
Next, the role of the annual oscillation is investigated. Figure 6 shows the amplitude spectra in the period range from 3 months–20 years. For the majority of the stations, the annual oscillation has the strongest amplitude. The highest amplitude of the annual oscillation is reached by the station Pianco, which also shows a spectral peak for the semi-annual oscillation. In differences of the FFT power spectra, the interannual oscillations at periods of 2, 4–5 and 12 years, are smaller than the annual oscillation, and they are also smaller than the amplitudes of the synoptical-scale variations of precipitation in Figure 4.
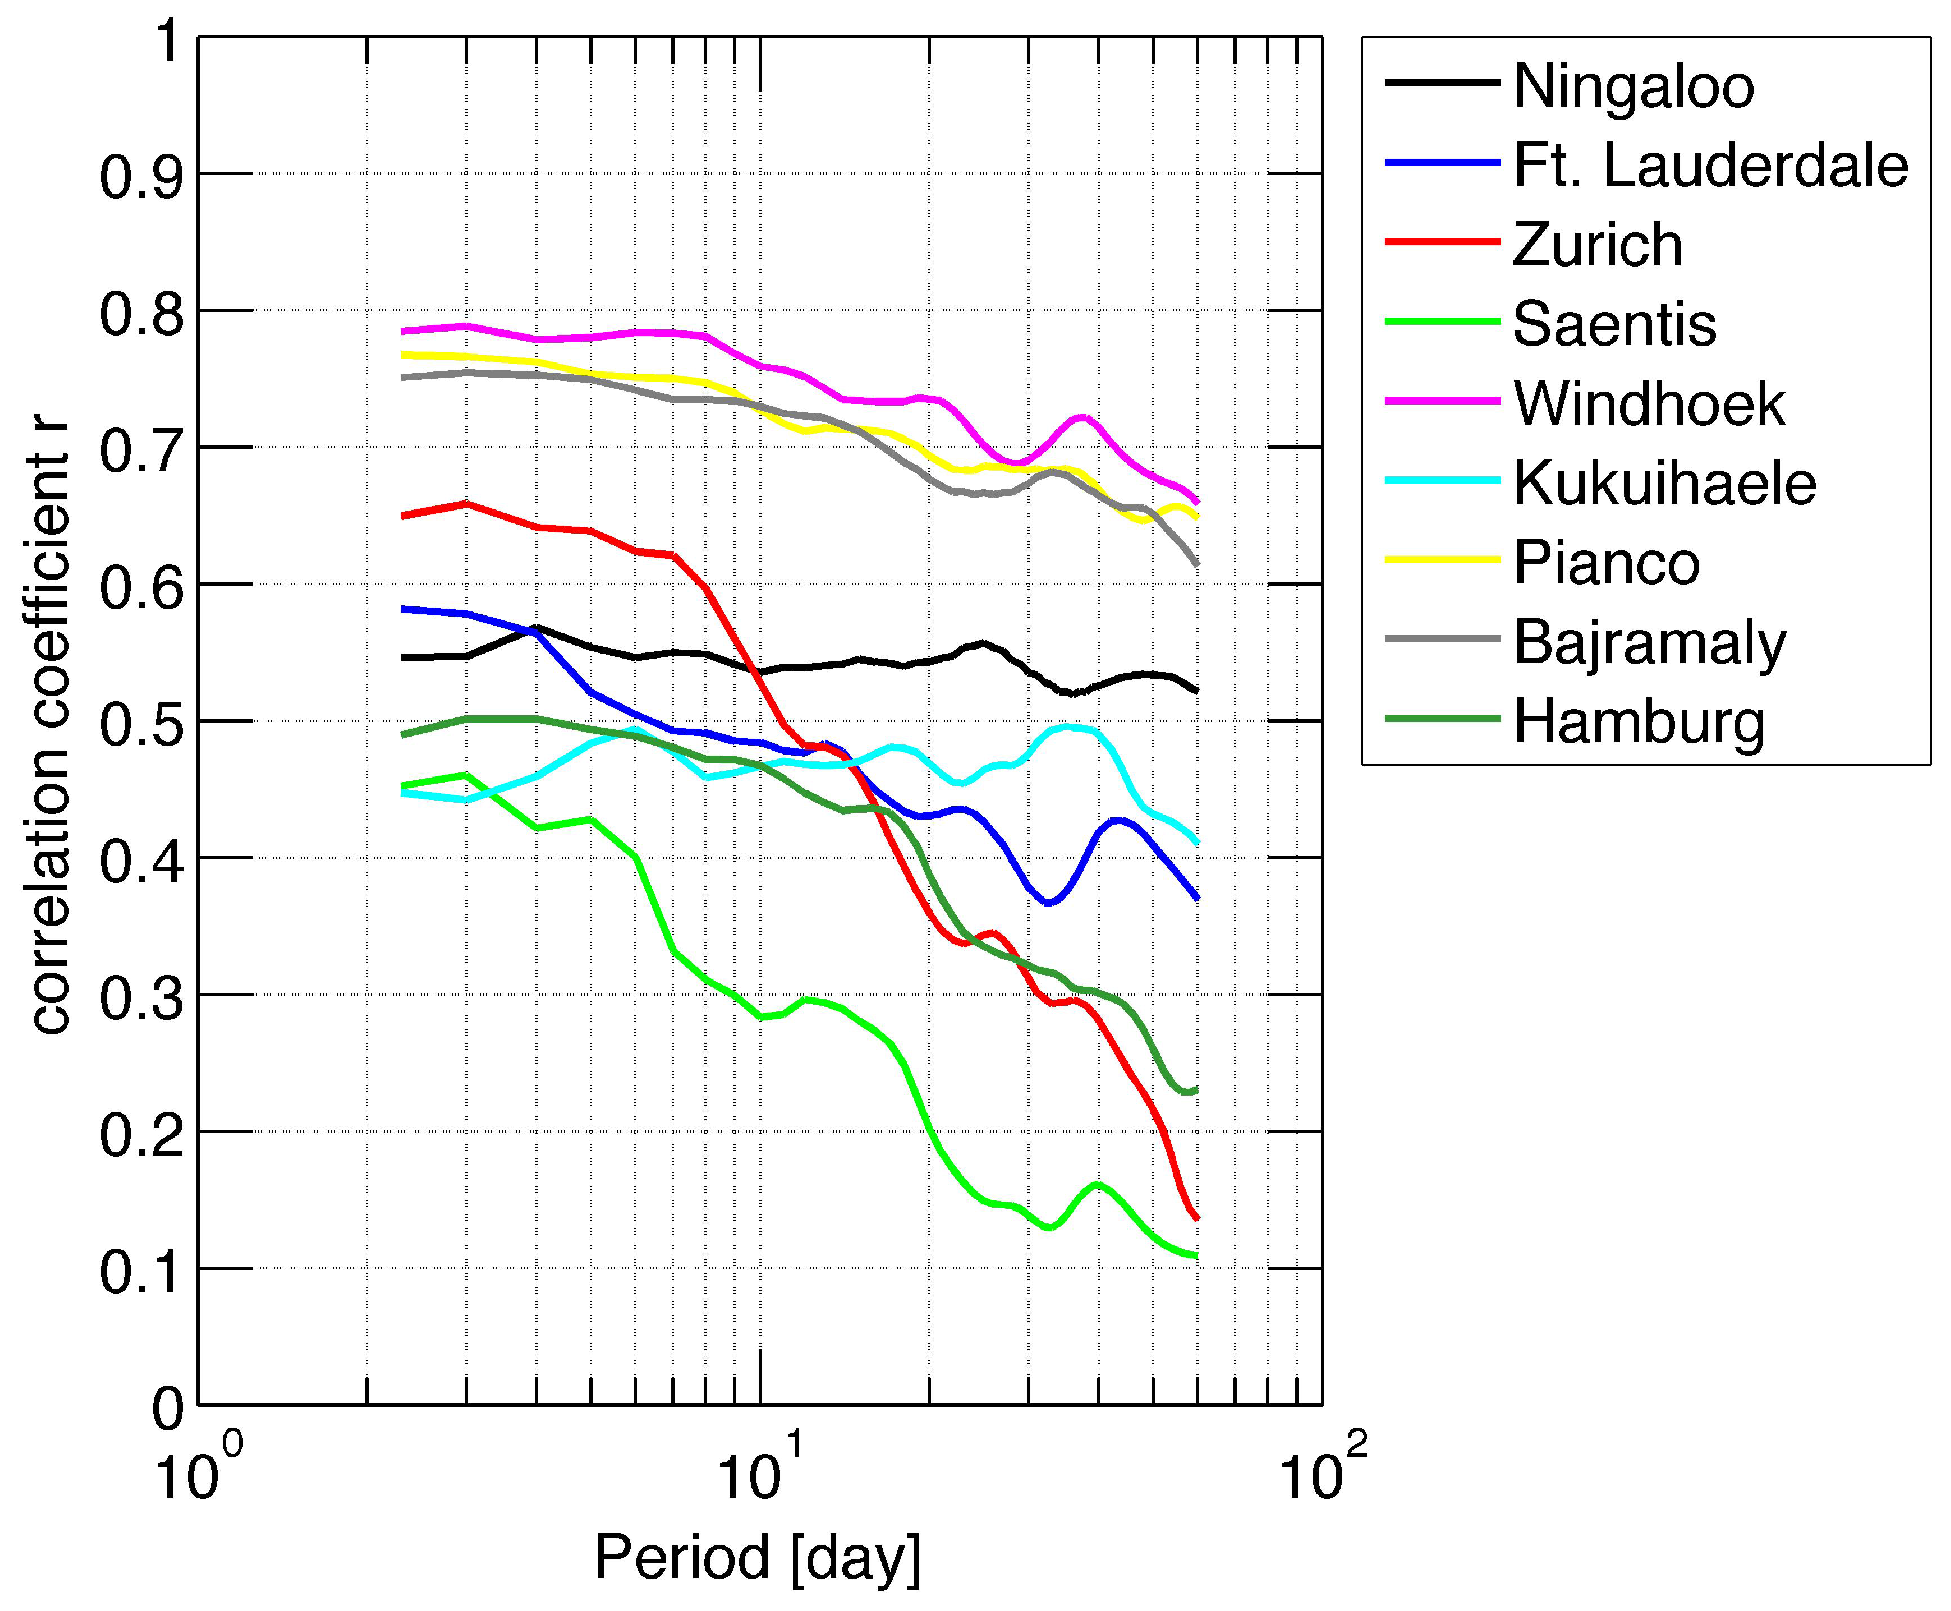
Next, the correlation between the annual oscillation and the intraseasonal oscillations is investigated. Figure 7 depicts the r values as a function of the period of the short-term variations. The amplitude series of the short-term variation is low pass filtered with a period of 90 days. It is obvious that r is quite different for each station. For short-term variations with periods less than 10 days, r is in the range from about 0.3–0.8, which is a moderate to good correlation. The significance of the correlation is greater than 95%, and relative uncertainties of r are less than 1% at the 95% confidence interval. However, the correlation between the annual oscillation and short-term variations is weaker than those between the interannual variability and short-term variations of precipitation.
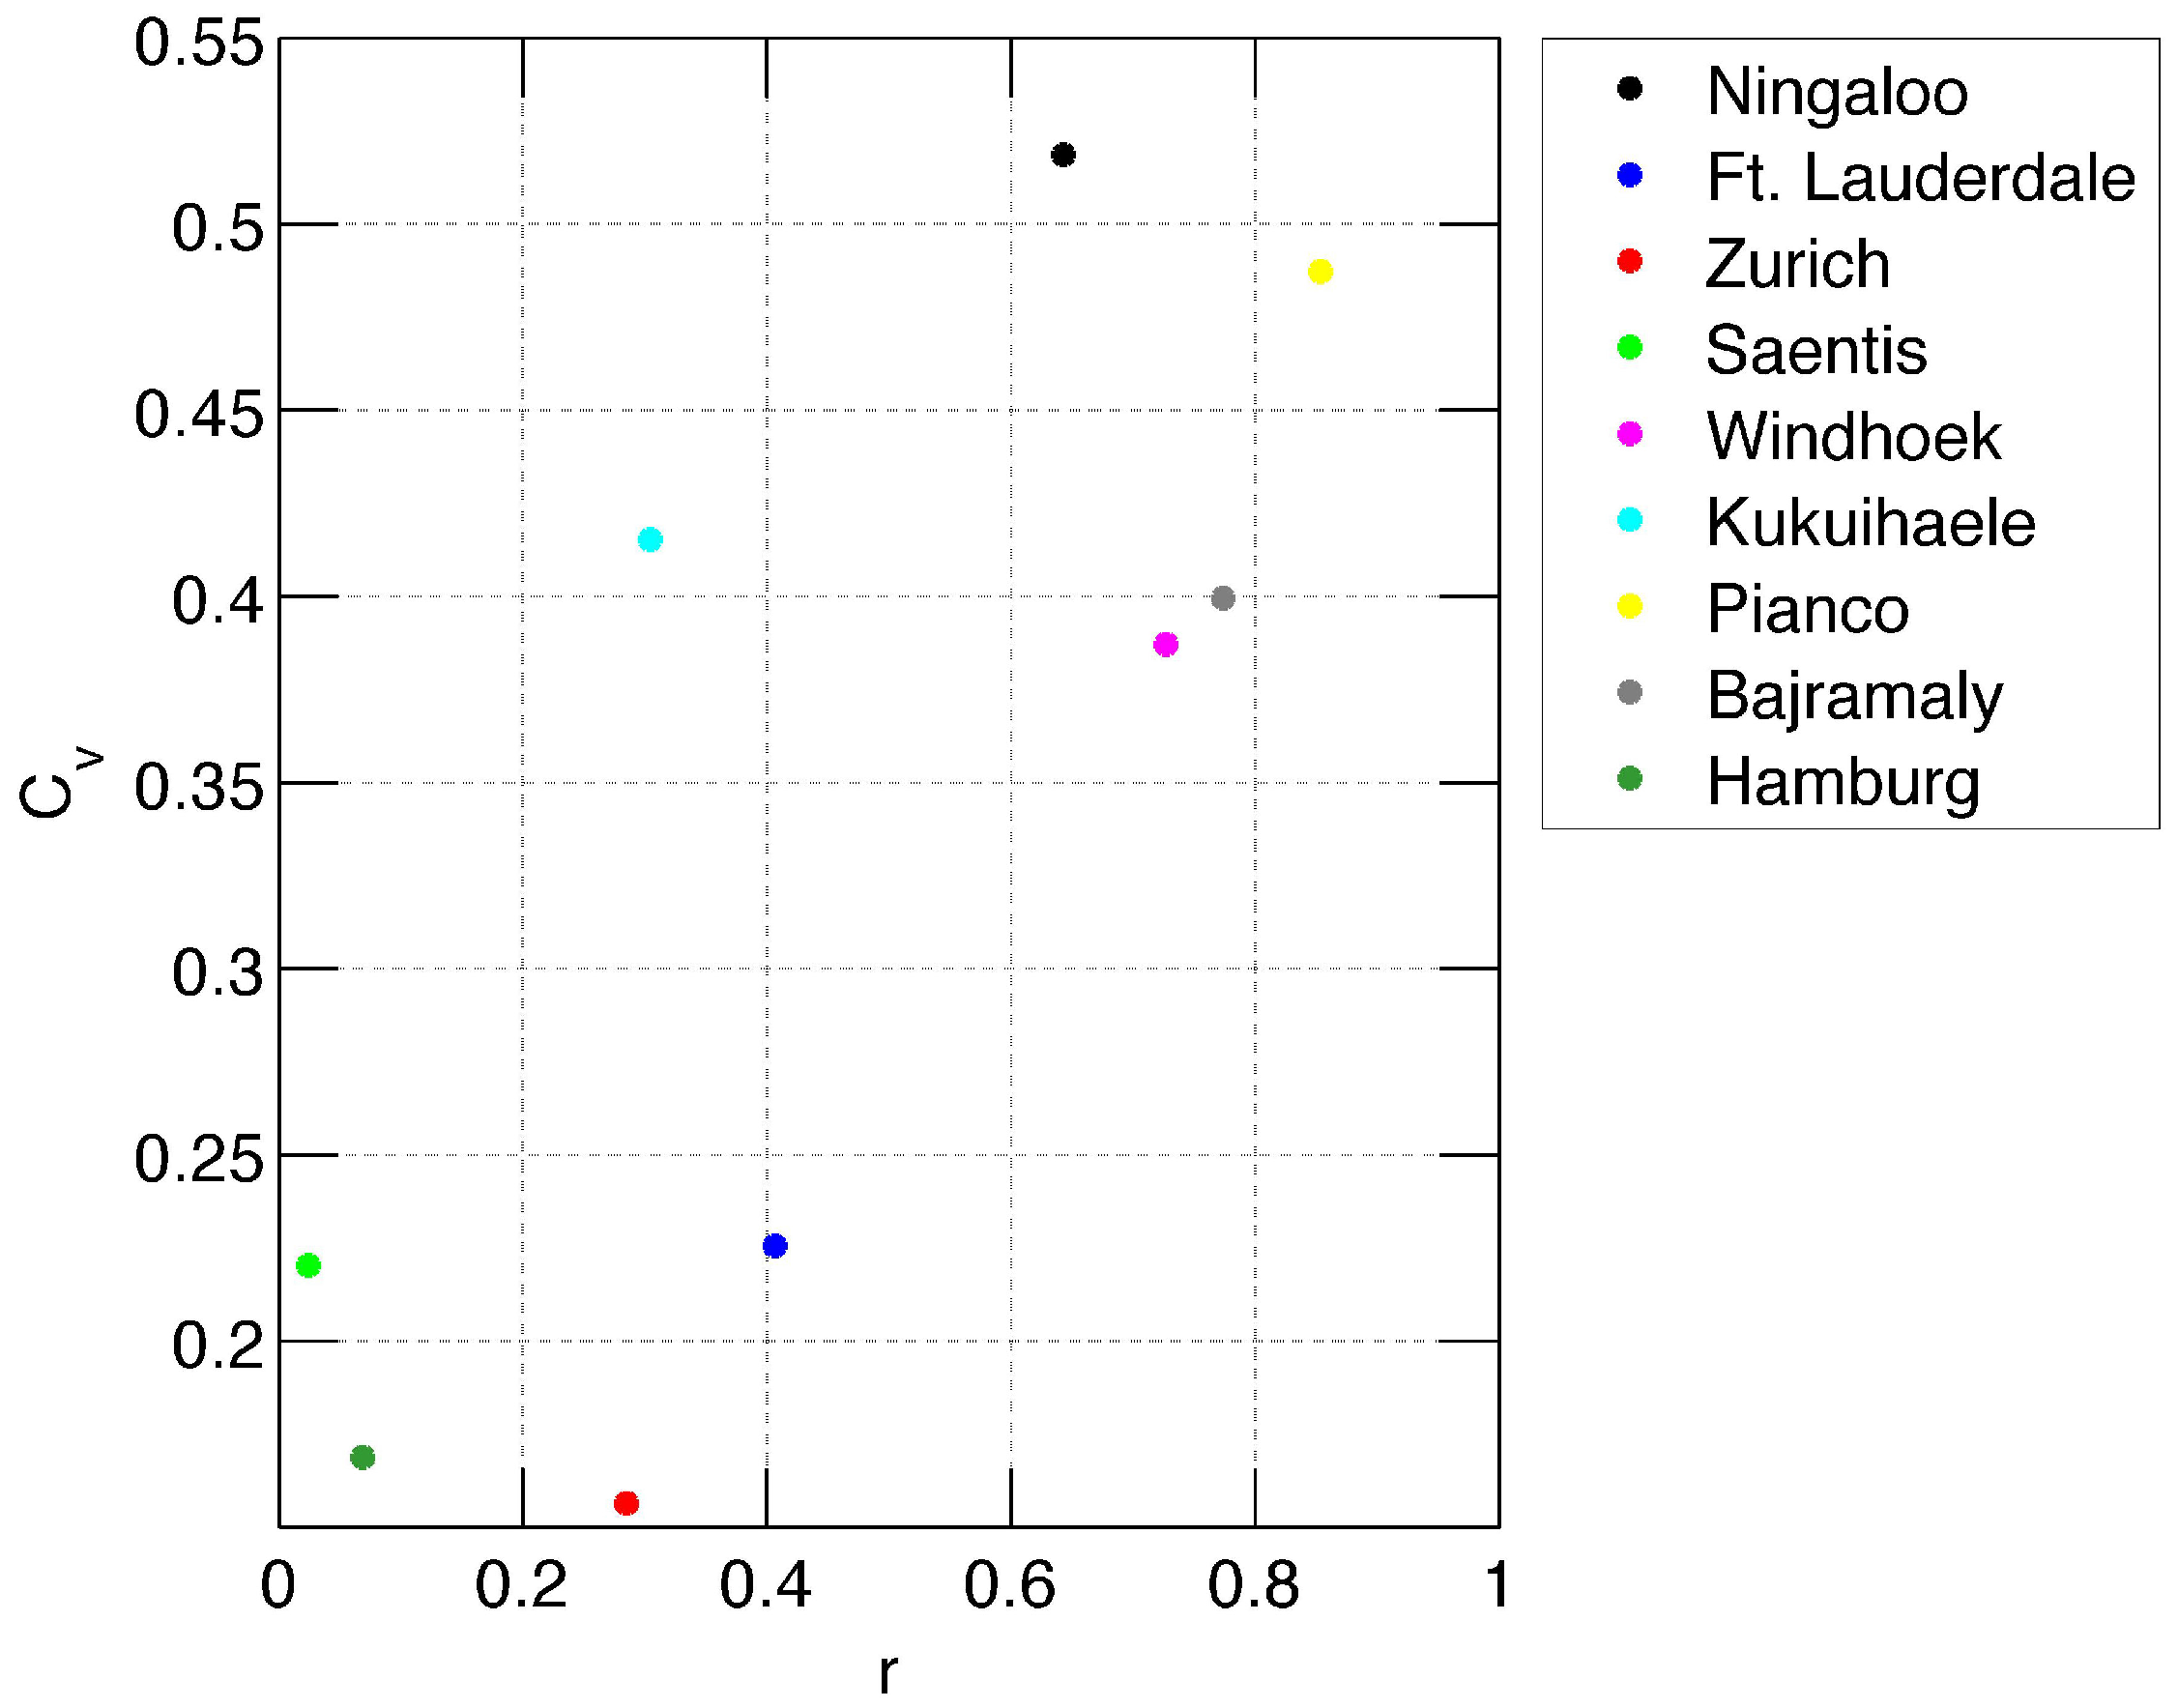
Finally, the correlation between the 1.5-year low pass filtered amplitude series of the annual oscillation and the interannual variability is analyzed. Figure 8 shows the coefficient of variation of annual precipitation as a function of the correlation r between the amplitude of the annual oscillation and the interannual variability. is defined as the quotient of the standard deviation of the annual precipitation series and its mean value [9]. Figure 8 indicates the value ranges of and r for the selected stations. Roughly, increases with the increase of r where r varies over a wide range from 0–0.9 for the selected stations. Generally, the correlation between the short-term variations and the interannual variability of precipitation (Figure 5) is the strongest correlation, which was found in the present study.
5. Conclusions
The study investigated the correlation between short-term precipitation of synoptical weather and interannual variations (IAV) of precipitation. Nine long-term series of daily precipitation values of the Global Historical Climatology Network (GHCN-D V2.0) were selected, which are representative of tropical, subtropical and extratropical climates. Generally, the mean amplitude of short-term variations increases (decreases) if there is a positive (negative) interannual anomaly of precipitation, respectively. In all cases, the amplitude of the short-term variations (periods < 10 days) clearly correlates with the long-term variations (periods >1.5 years) of precipitation. The correlation coefficient is between 0.7 and 0.95 at periods <8 days. For Kukuihaele (Hawaii), the correlation maximizes at a period of about 14 days. In the other cases, the maximum of the correlation is reached at periods <5 days. The correlations of the IAV and the short-term variations with respect to the annual oscillation are not so strong and vary between 0 and 0.9 for the IAV and 0.3 and 0.8 for the short-term variations. The main finding of the present study is a close relation between synoptical scale variations of precipitation (periods < 10 days) and interannual variability of precipitation, which establishes a link between weather and climate. This finding is a bit related to the study of Fujinami [2] who reported such a relation for the Indian monsoon. Our study shows that the relationship between short-term and long-term variations of precipitation is also present at other places of the Earth and for about eight decades. We did not find other studies about this important research topic. The wavelet-like amplitude spectra of the present study show that the synoptical scale variations have the largest amplitudes followed by the annual oscillation. The interannual variations are the smallest components in the amplitude spectra of the wavelet-like analysis. This finding is different from the results derived by FFT power spectra where usually the interannual variations prevail [10]. Temporal phase changes of the short-term variations possibly lead to a reduction of the amplitudes of the short-term variations if a large time window is selected.
Routines for data analysis and visualization are available upon request by K.H. The study utilized nine long-term series of daily precipitation values of the Global Historical Climatology Network (GHCN-D V2.0), which are provided via the Climate Explorer of Koninklijk Nederlands Meteorologisch Instituut (https://climexp.knmi.nl).
Acknowledgments
The study was supported by the Swiss National Science Foundation under Grant Number 200021-165516. We thank the reviewers for their helpful comments.
Conflicts of Interest
The author declares no conflict of interest.
References
- Latif, M. Reframing the Problem of Climate Change: From Zero Sum Game to Win-Win Solutions; Chapter Uncertainty in Climate Change Projections; Jaeger, C.C., Hasselmann, K., Leipold, G., Mangalagiu, D., Tabara, J.D., Eds.; Earthscan, Routledge: New York, NY, USA, 2012; pp. 17–34. [Google Scholar]
- Fujinami, H.; Hatsuzuka, D.; Yasunari, T.; Hayashi, T.; Terao, T.; Murata, F.; Kiguchi, M.; Yamane, Y.; Matsumoto, J.; Islam, M.N.; et al. Characteristic intraseasonal oscillation of rainfall and its effect on interannual variability over Bangladesh during boreal summer. Int. J. Climatol. 2011, 31, 1192–1204. [Google Scholar] [CrossRef]
- Suhas, E.; Neena, J.M.; Goswami, B.N. Interannual Variability of Indian Summer Monsoon arising from Interactions between Seasonal Mean and Intraseasonal Oscillations. J. Atmosp. Sci. 2012, 69, 1761–1774. [Google Scholar] [CrossRef]
- Hartmann, D.L.; Michelsen, M.L. Intraseasonal Periodicities in Indian Rainfall. J. Atmos. Sci. 1989, 46, 2838–2862. [Google Scholar] [CrossRef]
- Studer, S.; Hocke, K.; Kämpfer, N. Intraseasonal oscillations of stratospheric ozone above Switzerland. J. Atmos. Sol. Terr. Phys. 2012, 74, 189–198. [Google Scholar] [CrossRef]
- De Jongh, I.L.M.; Verhoest, N.E.C.; de Troch, F.P. Analysis Of A 105-year time series of precipitation observed at Uccle, Belgium. Int. J. Climatol. 2006, 26, 2023–2039. [Google Scholar] [CrossRef]
- Fatichi, S.; Ivanov, V.Y.; Caporali, E. Investigating Interannual Variability of Precipitation at the Global Scale: Is There a Connection with Seasonality? J. Clim. 2012, 25, 5512–5523. [Google Scholar] [CrossRef]
- Dai, A.; Fung, I.Y.; del Genio, A.D. Surface Observed Global Land Precipitation Variations during 1900–88. J. Clim. 1997, 10, 2943–2962. [Google Scholar] [CrossRef]
- Peel, M.C.; McMahon, T.A.; Finlayson, B.L. Variability of Annual Precipitation and Its Relationship to the El Niño-Southern Oscillation. J. Clim. 2002, 15, 545–551. [Google Scholar] [CrossRef]
- Lau, K.M.; Sheu, P.J. Annual cycle, quasi-biennial oscillation, and southern oscillation in global precipitation. J. Geophys. Res. Atmos. 1988, 93, 10975–10988. [Google Scholar] [CrossRef]
- Wang, B.; Yang, J.; Zhou, T.; Wang, B. Interdecadal Changes in the Major Modes of Asian–Australian Monsoon Variability: Strengthening Relationship with ENSO since the Late 1970s. J. Clim. 2008, 21, 1771–1789. [Google Scholar] [CrossRef]
- Torrence, C.; Webster, P.J. Interdecadal Changes in the ENSO–Monsoon System. J. Clim. 1999, 12, 2679–2690. [Google Scholar] [CrossRef]
Figure 1.
(a) Time series of precipitation at Ft. Lauderdale (blue line) and its interannual variability (red line), which was obtained by a 1.5-year low pass filter. (b) Time series of the amplitude of four-day fluctuation of precipitation at Ft. Lauderdale provided by a four-day band pass filter (cyan line). The black line denotes the 1.5-year low pass filtered data of the four-day amplitude series. For intercomparison, the interannual variability of (a) is also shown in (b) as a red line.
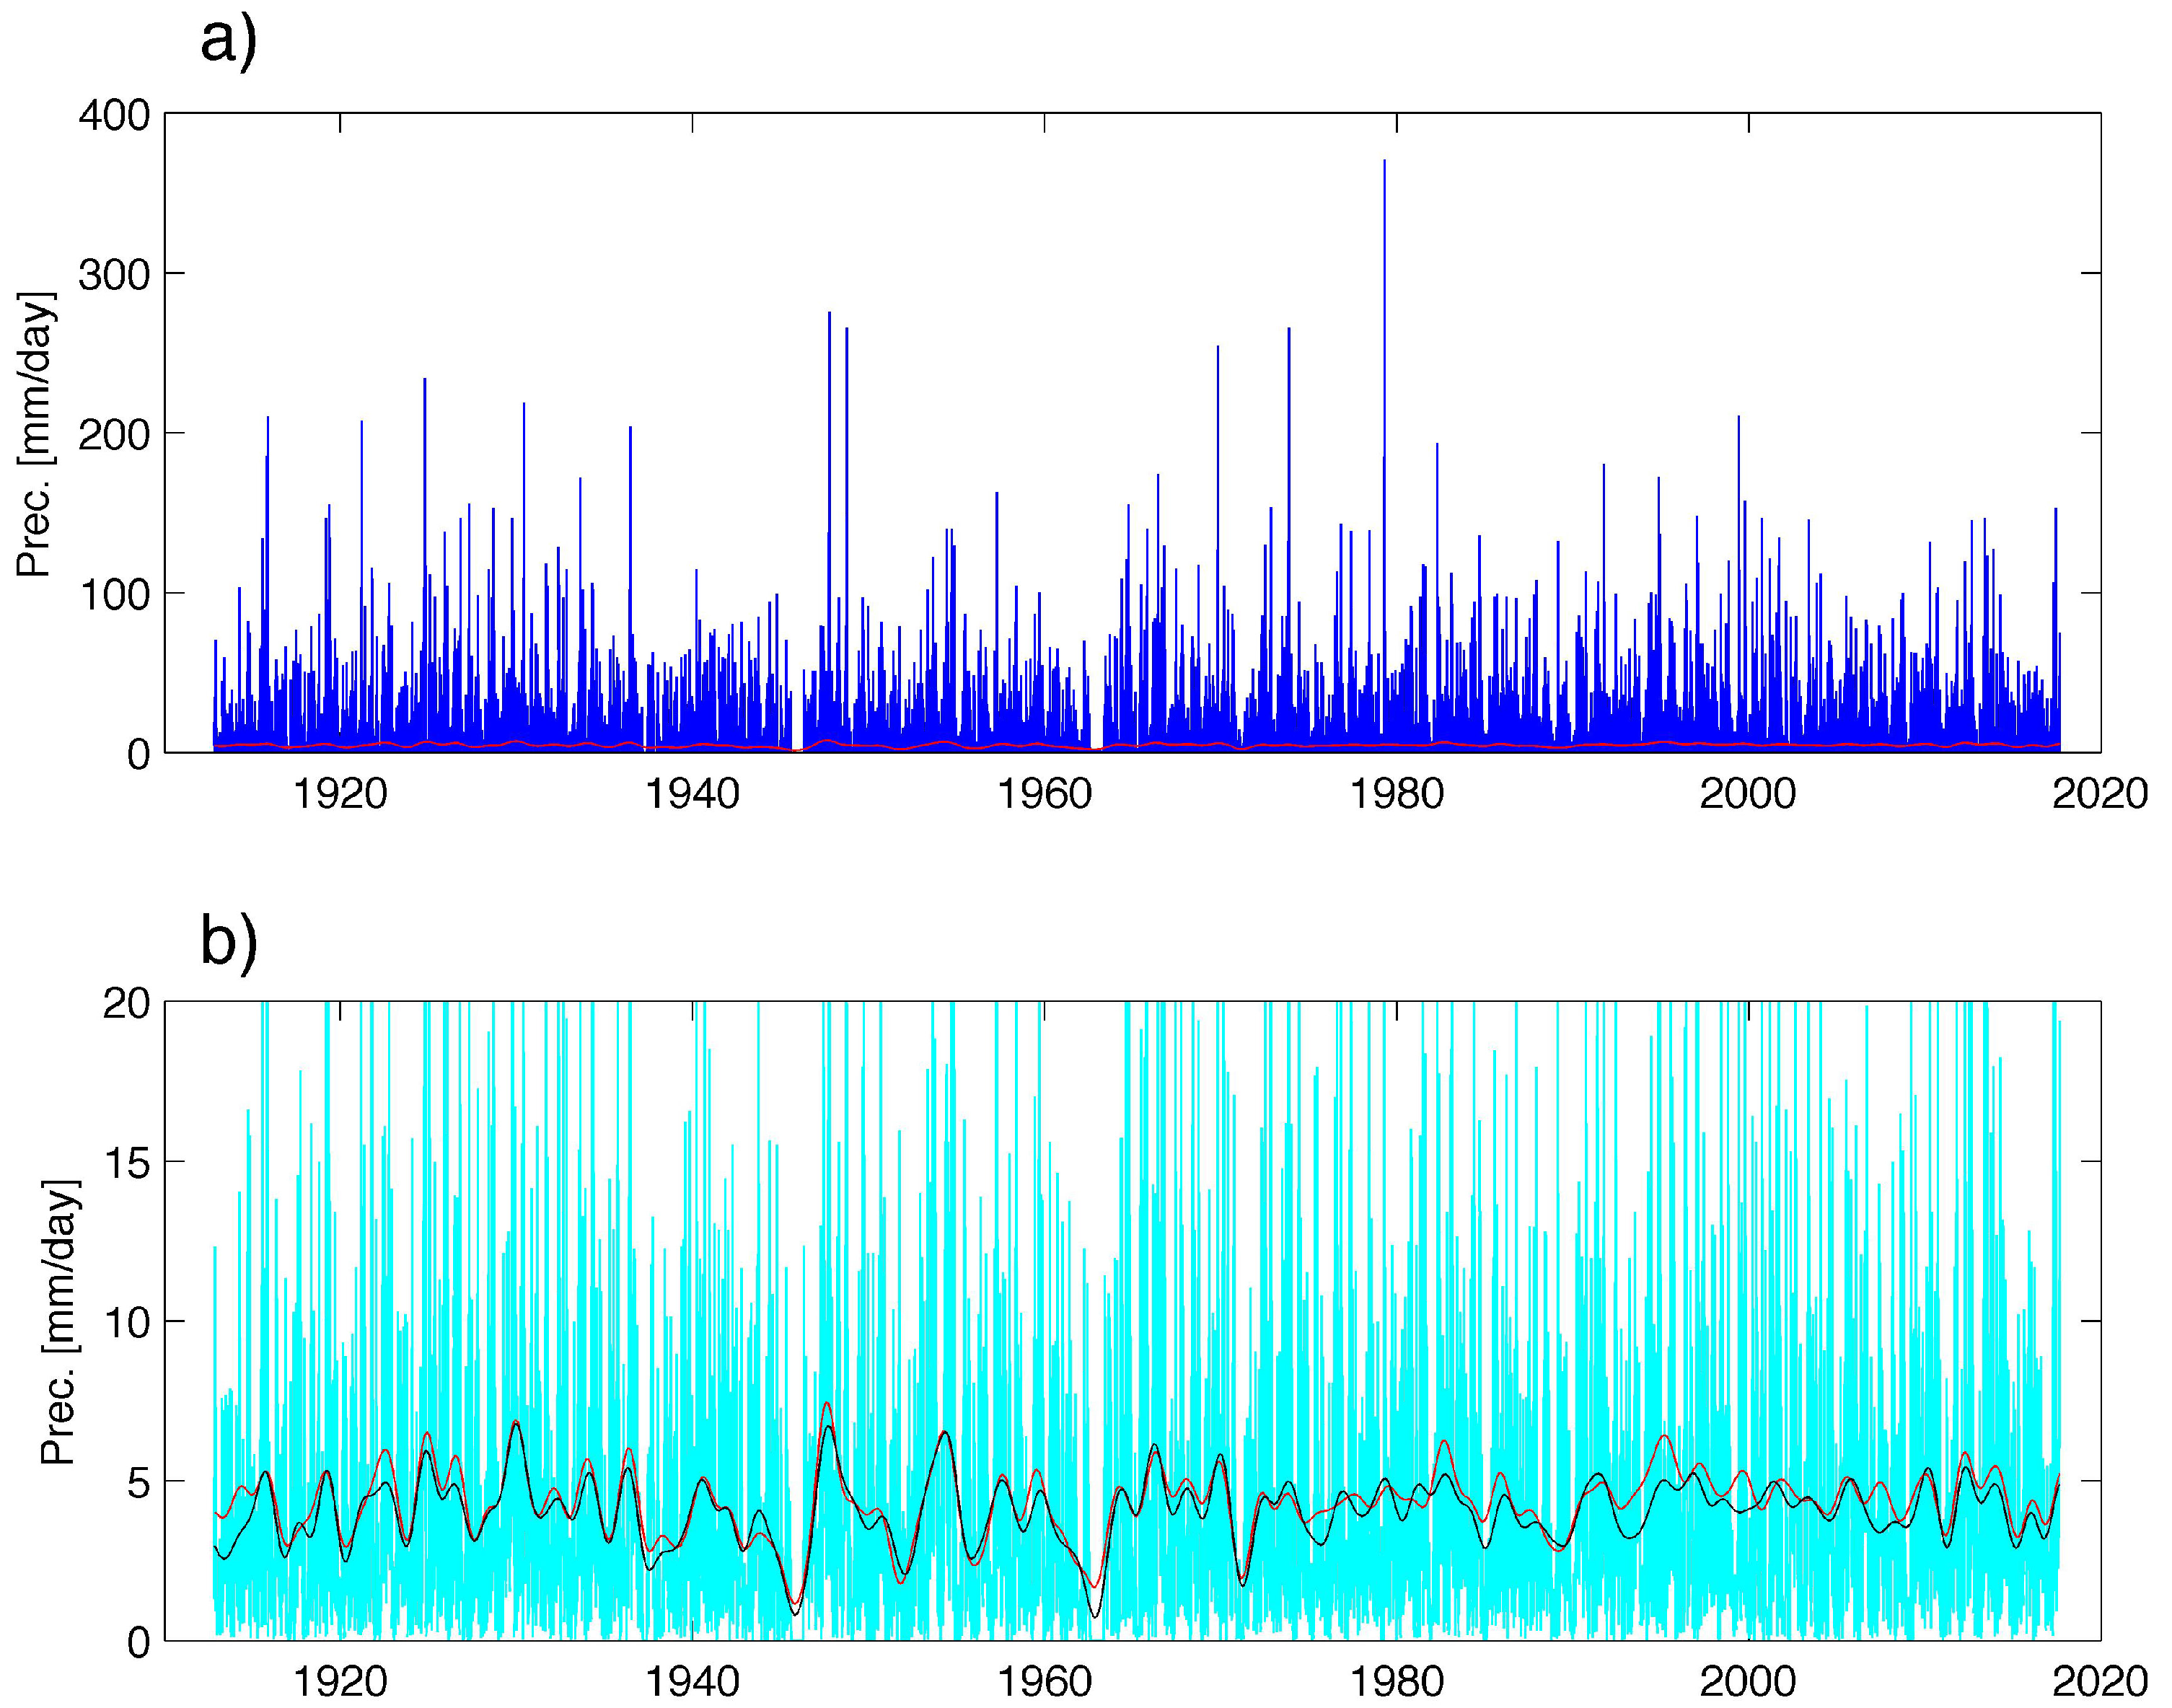
Figure 2.
Interannual variability of precipitation at the nine selected stations. The curves were obtained by filtering the precipitation series with a 1.5-year low pass filter.
Figure 2.
Interannual variability of precipitation at the nine selected stations. The curves were obtained by filtering the precipitation series with a 1.5-year low pass filter.

Figure 3.
Frequency of precipitation as a function of the intensity of precipitation for the nine selected stations.
Figure 3.
Frequency of precipitation as a function of the intensity of precipitation for the nine selected stations.

Figure 4.
Amplitude spectra of precipitation for the period range from 2.3–200 days. The amplitudes were determined by a wavelet-like analysis.
Figure 4.
Amplitude spectra of precipitation for the period range from 2.3–200 days. The amplitudes were determined by a wavelet-like analysis.
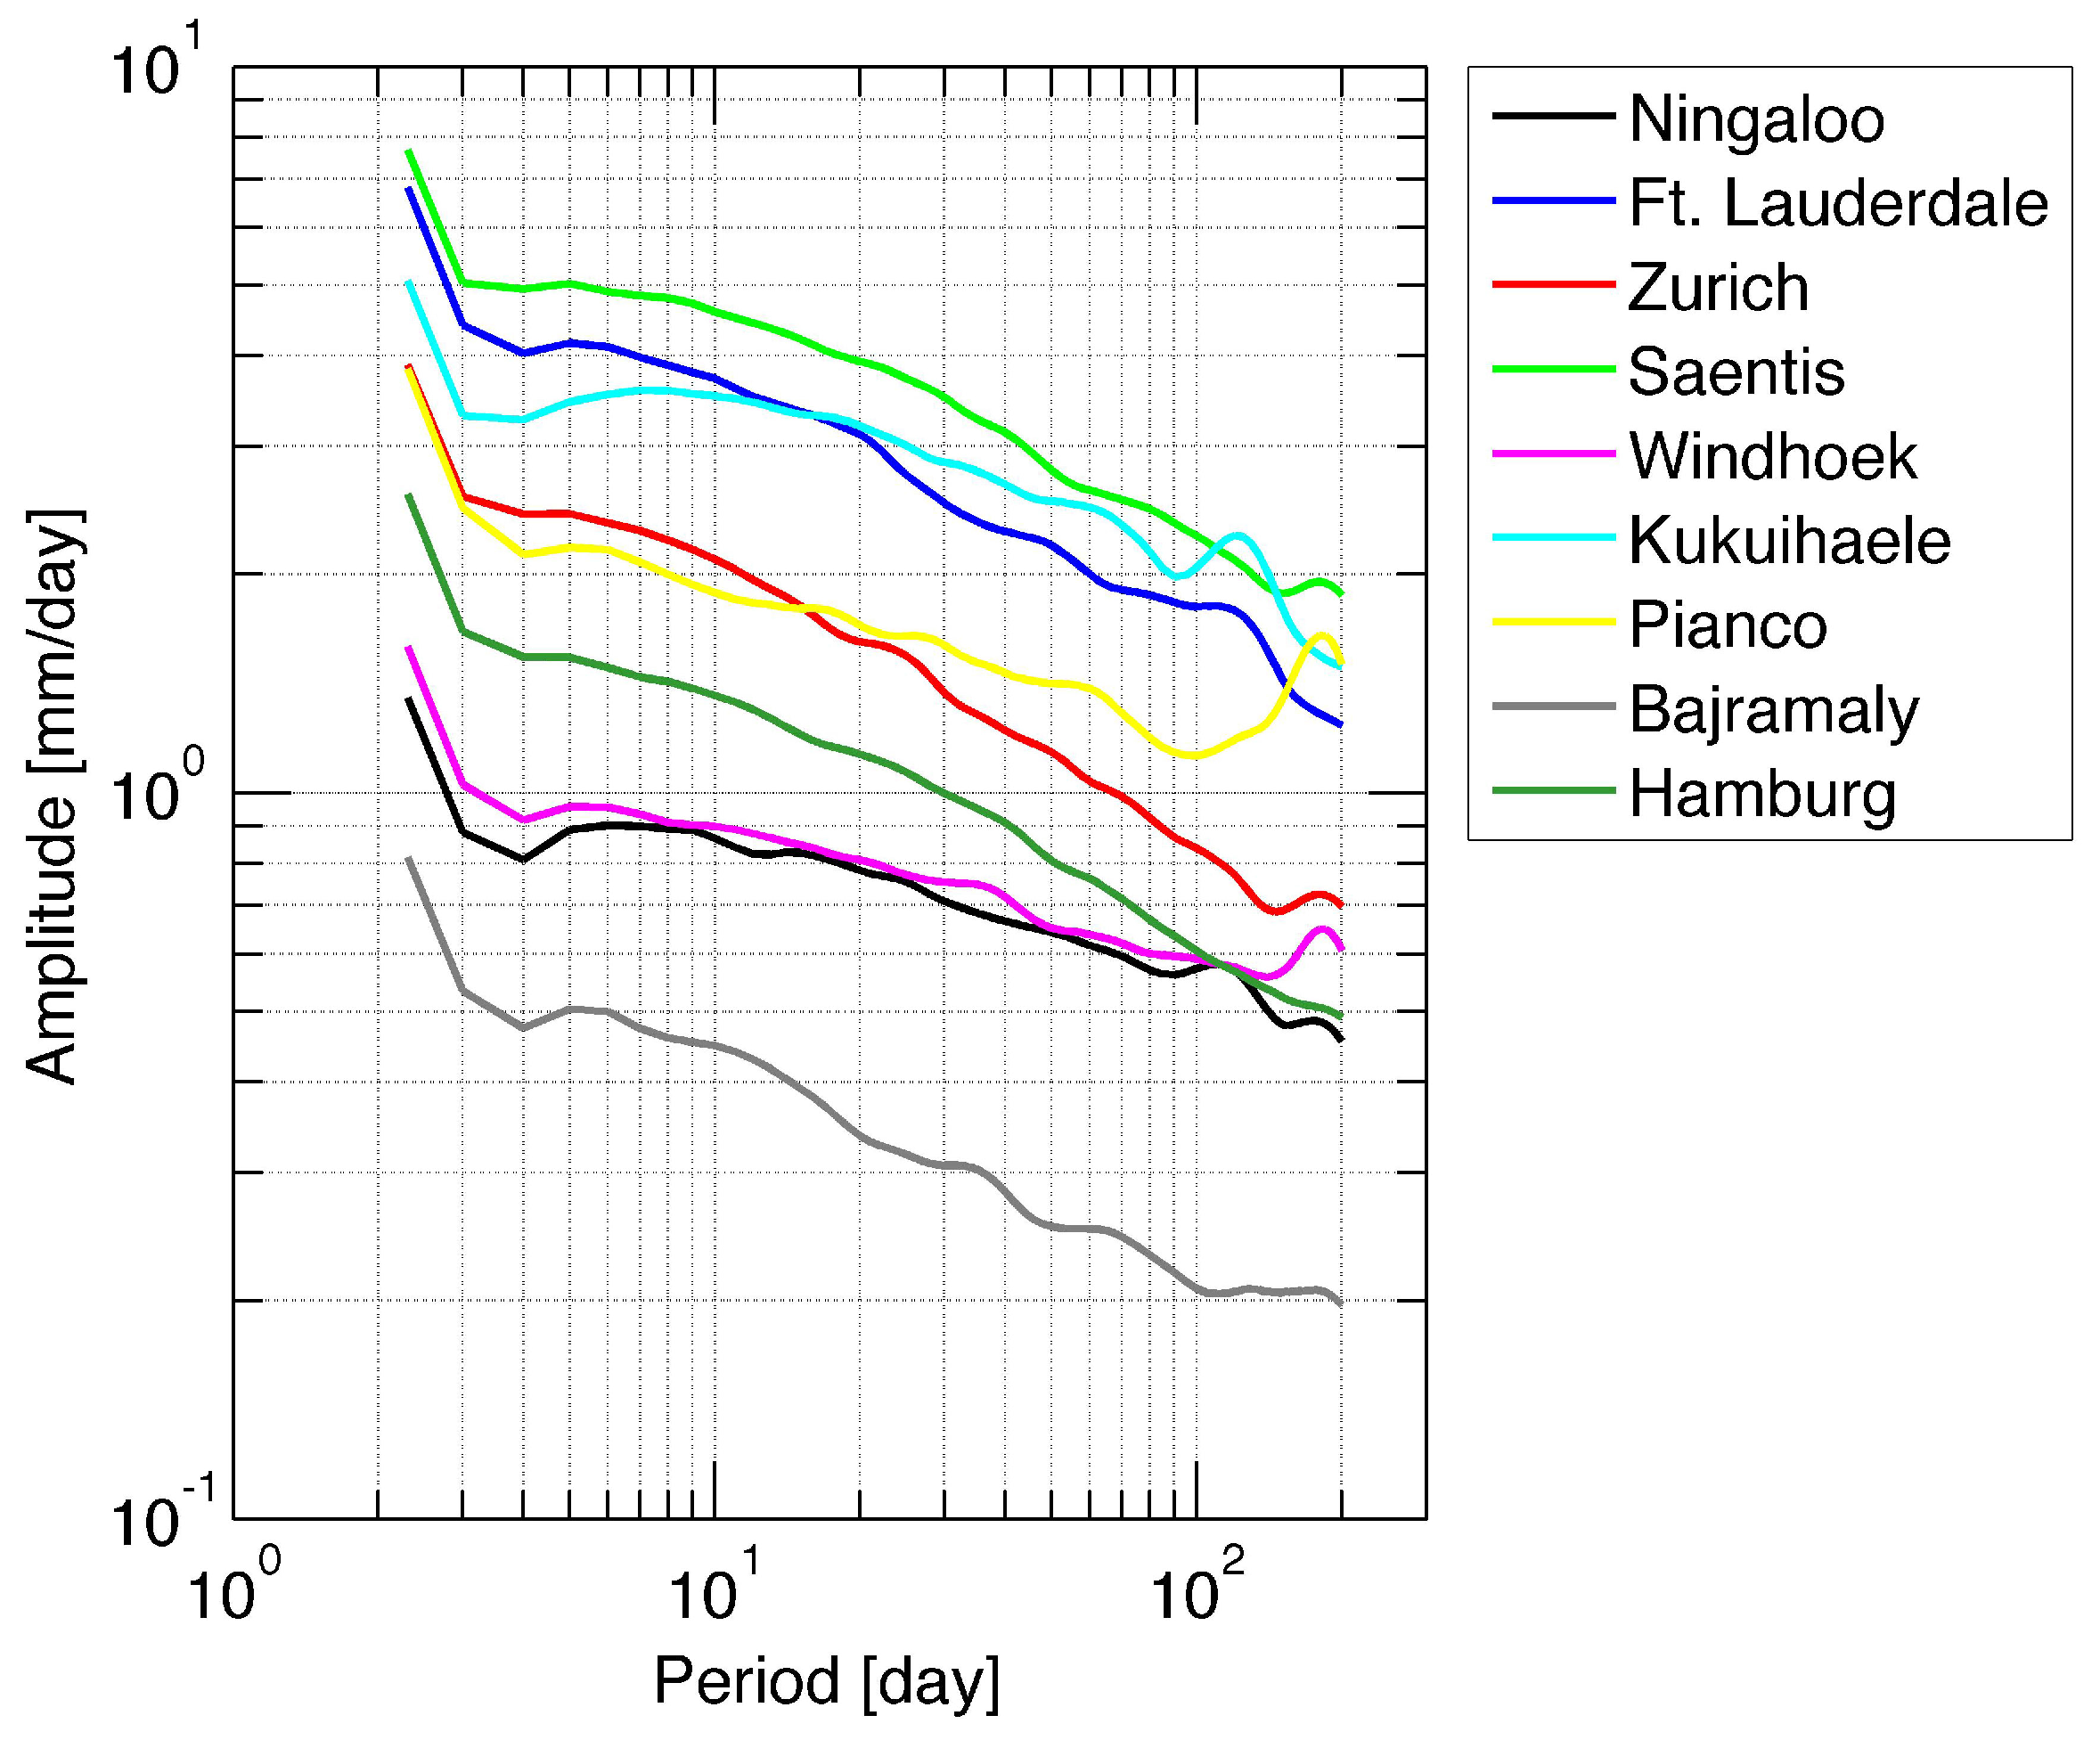
Figure 5.
Correlation between the interannual variation of precipitation and the amplitude series obtained by band pass filtering at periods in the range from 2.3 days–200 days. Before calculation of the correlation coefficient, the amplitude series were filtered by a 1.5-year low pass filter.
Figure 5.
Correlation between the interannual variation of precipitation and the amplitude series obtained by band pass filtering at periods in the range from 2.3 days–200 days. Before calculation of the correlation coefficient, the amplitude series were filtered by a 1.5-year low pass filter.

Figure 6.
Amplitude spectra of precipitation for the period range from 3 months–20 years. The amplitudes were determined by a wavelet-like analysis.
Figure 6.
Amplitude spectra of precipitation for the period range from 3 months–20 years. The amplitudes were determined by a wavelet-like analysis.

Figure 7.
Correlation between the annual oscillation of precipitation and the amplitude series obtained by band pass filtering at periods in the range from 2.3 days–200 days. Before calculation of the correlation coefficient, the amplitude series were filtered by a 90-day low pass filter.
Figure 7.
Correlation between the annual oscillation of precipitation and the amplitude series obtained by band pass filtering at periods in the range from 2.3 days–200 days. Before calculation of the correlation coefficient, the amplitude series were filtered by a 90-day low pass filter.

Figure 8.
Coefficient of variation of annual precipitation as a function of the correlation r between the amplitude of the annual oscillation and the interannual variability.
Figure 8.
Coefficient of variation of annual precipitation as a function of the correlation r between the amplitude of the annual oscillation and the interannual variability.

Table 1.
Precipitation measurements.
| Location | Lat., Lon., m.a.s.l. | Time | Mean p (mm/day) |
|---|---|---|---|
| Saentis (Switzerland) | 47.25 N, 9.35 E, 2502 | 1901–2017 | 7.28 |
| Kukuihaele (Hawaii, USA) | 20.13 N, 155.57 W, 91 | 1910–1994 | 4.79 |
| Ft. Lauderdale (Florida, USA) | 26.10 N, 80.20 W, 5 | 1912–2017 | 4.32 |
| Zurich (Switzerland) | 47.38 N, 8.57 E, 556 | 1901–2017 | 2.99 |
| Pianco (Brazil) | 7.21 S, 37.93 W, 250 | 1910–1999 | 2.35 |
| Hamburg (Germany) | 53.63 N, 9.99 E, 11 | 1891–2017 | 2.05 |
| Windhoek (Namibia) | 22.57 S, 17.10 E, 1700 | 1913–2003 | 0.98 |
| Ningaloo (Australia) | 22.70 S, 113.67 W, 10 | 1898–2014 | 0.64 |
| Bajramaly (Turkmenistan) | 37.60 N, 62.18 E, 240 | 1889–1998 | 0.39 |
© 2017 by the author. Licensee MDPI, Basel, Switzerland. This article is an open access article distributed under the terms and conditions of the Creative Commons Attribution (CC BY) license (http://creativecommons.org/licenses/by/4.0/).
Share and Cite
MDPI and ACS Style
Hocke, K. Relation between Short-Term and Long-Term Variations of Precipitation. Climate 2017, 5, 96. https://doi.org/10.3390/cli5040096
AMA Style
Hocke K. Relation between Short-Term and Long-Term Variations of Precipitation. Climate. 2017; 5(4):96. https://doi.org/10.3390/cli5040096
Chicago/Turabian StyleHocke, Klemens. 2017. "Relation between Short-Term and Long-Term Variations of Precipitation" Climate 5, no. 4: 96. https://doi.org/10.3390/cli5040096
Note that from the first issue of 2016, this journal uses article numbers instead of page numbers. See further details here.