Article

Relationship between City Size, Coastal Land Use, and Summer Daytime Air Temperature Rise with Distance from Coast

1
Department of Architecture, Kobe University, Kobe 657-8501, Japan
2
Department of Architecture, Hiroshima University, Higashi-Hiroshima 739-8527, Japan
3
Department of Architecture, Tohoku Institute of Technology, Sendai 982-8577, Japan
4
Department of Architecture, Kansai University, Suita 564-8680, Japan
*
Author to whom correspondence should be addressed.
Climate 2018, 6(4), 84; https://doi.org/10.3390/cli6040084
Submission received: 18 September 2018 / Revised: 24 October 2018 / Accepted: 25 October 2018 / Published: 27 October 2018
(This article belongs to the Special Issue Climate Change Resilience and Urban Sustainability)

Abstract

:
The relationship between city size, coastal land use, and air temperature rise with distance from coast during summer day is analyzed using the meso-scale weather research and forecasting (WRF) model in five coastal cities in Japan with different sizes and coastal land use (Tokyo, Osaka, Nagoya, Hiroshima, and Sendai) and inland cities in Germany (Berlin, Essen, and Karlsruhe). Air temperature increased as distance from the coast increased, reached its maximum, and then decreased slightly. In Nagoya and Sendai, the amount of urban land use in coastal areas is less than the other three cities, where air temperature is a little lower. As a result, air temperature difference between coastal and inland urban area is small and the curve of air temperature rise is smaller than those in Tokyo and Osaka. In Sendai, air temperature in the inland urban area is the same as in the other cities, but air temperature in the coastal urban area is a little lower than the other cities, due to an approximate one degree lower sea surface temperature being influenced by the latitude. In three German cities, the urban boundary layer may not develop sufficiently because the fetch distance is not enough.

1. Introduction

Urban heat island intensity is defined by the air temperature difference between an urban area and its surrounding suburbs. Oke [1] revealed that urban heat island intensity is proportional to the logarithm of the population, based on observations in a number of cities in North America and Europe. Fukuoka [2] and Park [3] both showed the same relationship in Japanese and Korean cities and revealed that the slope of the relationship is steep for cities with more than 300,000 people. Sakakibara and Kitahara [4] also showed a similar relationship for cities in Nagano Prefecture, Japan; however, the change in slope, such as that found by Fukuoka [2] and Park [3], was not obtained.
In these studies, population was used to indicate the degree of urbanization. An increase in population, for example, was associated with high-rise buildings and land use change, as well as with an expansion of the urban area. More specific indicators—such as urban area, artificial land coverage, and average building height—should be used to implement more effective heat island countermeasures. The mesoscale weather research and forecasting (WRF) model (Skamarock et al. [5]), which is used generically worldwide, is effective for these studies (Iizuka et al. [6], Kusaka et al. [7]). Moriyama et al. [8] have reported that air temperature is more influenced by the building coverage rate than the building height. When the building coverage rate is small or the building height is low, air temperature is low.
In this study, for the purpose of actual recognition of urban heat island phenomenon, as the target five coastal cities in Japan with different sizes and coastal land use (Tokyo, Osaka, Nagoya, Hiroshima, Sendai), we have analyzed the relationship between city size, coastal land use and air temperature rise with distance from coast during summer day, while the other factors such as the climatic environment depending on the surrounding topography, the shape of the coastline, and the location would be considered. In the previous study, the authors confirmed that air temperature near ground surface observed in the daytime during the summer days in Osaka city was explained by the distance from the coast, rather than building volume ratio, artificial exhaust heat, natural coverage ratio, roughness length (Takebayashi et al. [9]). Air temperature around the coast was about two degrees lower than that at about 10 km inland. However, both measurement sites are urbanized to almost the same extent. The purpose of this study is to analyze the air temperature distribution within the urban land use rather than the air temperature distribution due to different land use. From this point of view, we do not change the land use parameters for urban land use in both Japanese and German cities. Kusaka et al. [10] have simulated numerically the effects of land-use alternation on the sea breeze and daytime heat island in the Tokyo metropolitan area. By comparison between 1900 and 1985, they pointed out a clearer definiton of the sea breeze front, two hours delay of the sea breeze arrival to the inland area and the maximum temperature rise in the inland area. Yamaoto et al. [11] have investigated the relationship between sea breeze penetration and anomalously high summer daytime temperatures in the inland suburbs of Tokyo, with consideration of the relative position of sea breeze fronts, by using data from the high-density temperature observation network (Extended-METROS). The high temperature in the inland area was considered based on the penetration condition of the sea breeze. The original definition of urban heat island intensity by Oke [1] is the annual maximum air temperature difference. However, since the higher air temperature in the summer is noticed socially, which causes a deterioration of the thermal environment in outdoor space and an increase of energy consumption, the higher air temperature period of the summer was selected as the objective period in this study. It was targeted at 14:00, when the maximum temperature is likely to occur. Hardin et al. [12] have analyzed regional air temperature variability and urban heat island magnitude by using a high-density network of urban and rural weather stations. They pointed out the need for consideration of spatial distribution of air temperature for the analysis of urban heat island intensity. The spatial distribution of air temperature was treated as the object in this study. In addition, we have similarly analyzed inland cities (Berlin, Essen, and Karlsruhe in Germany).

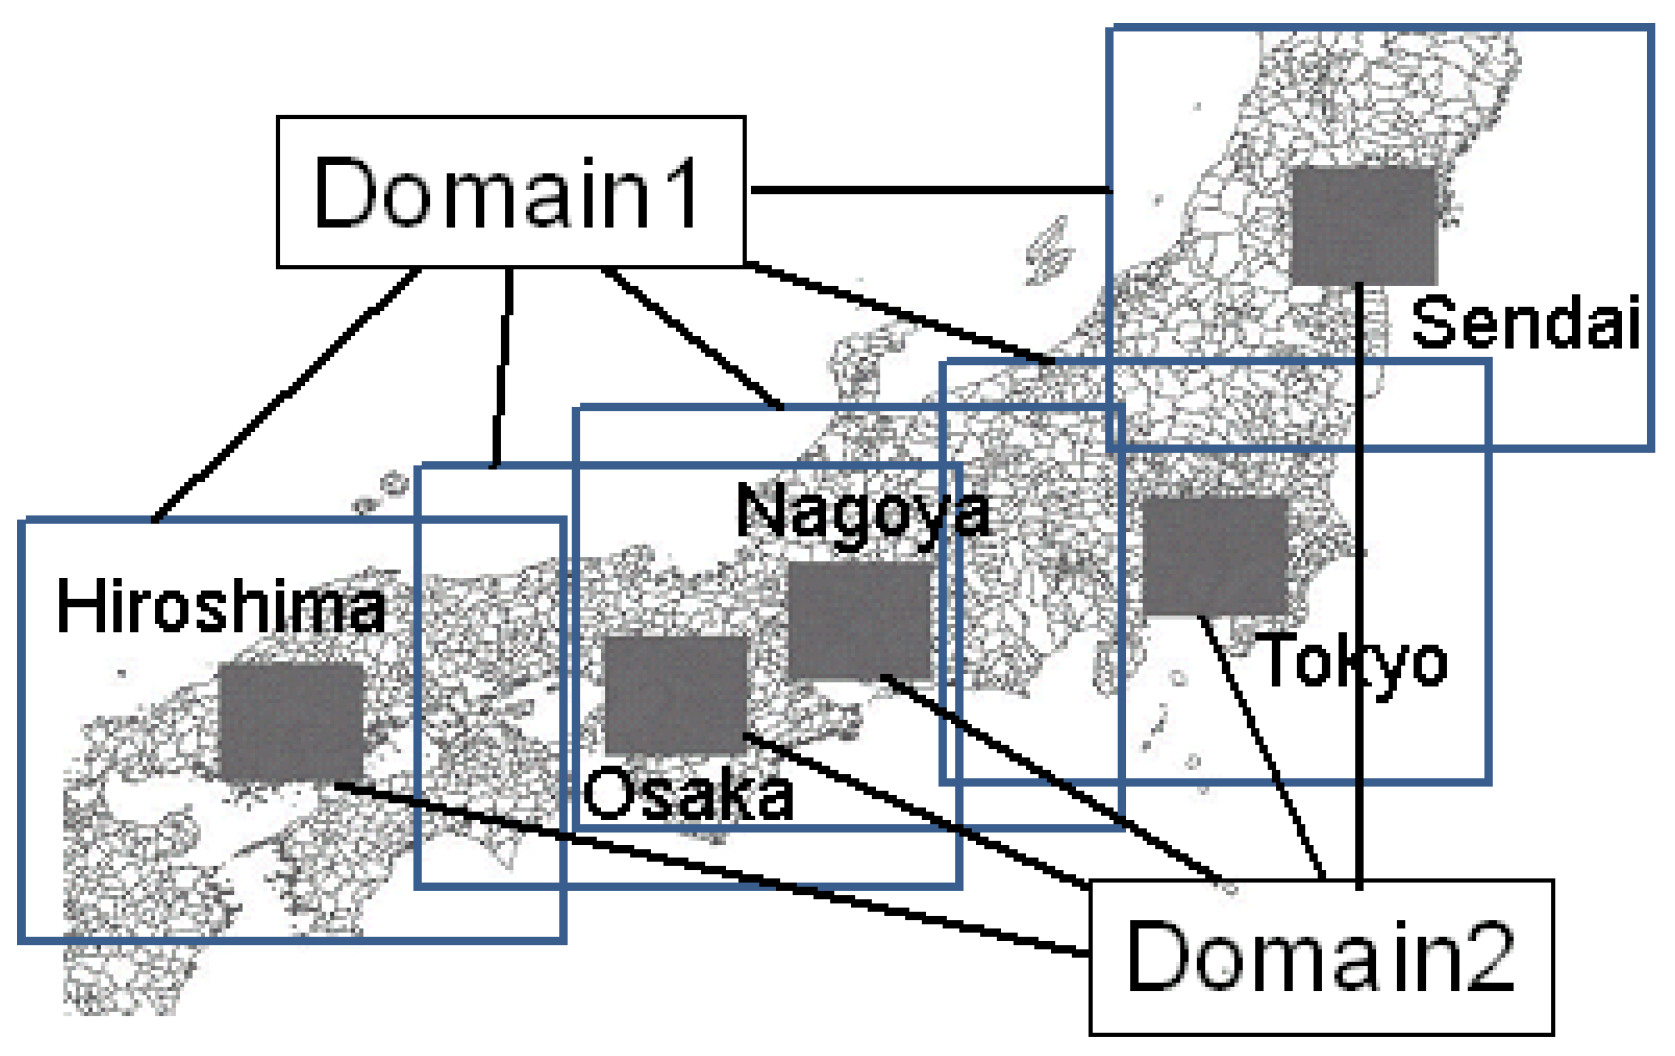
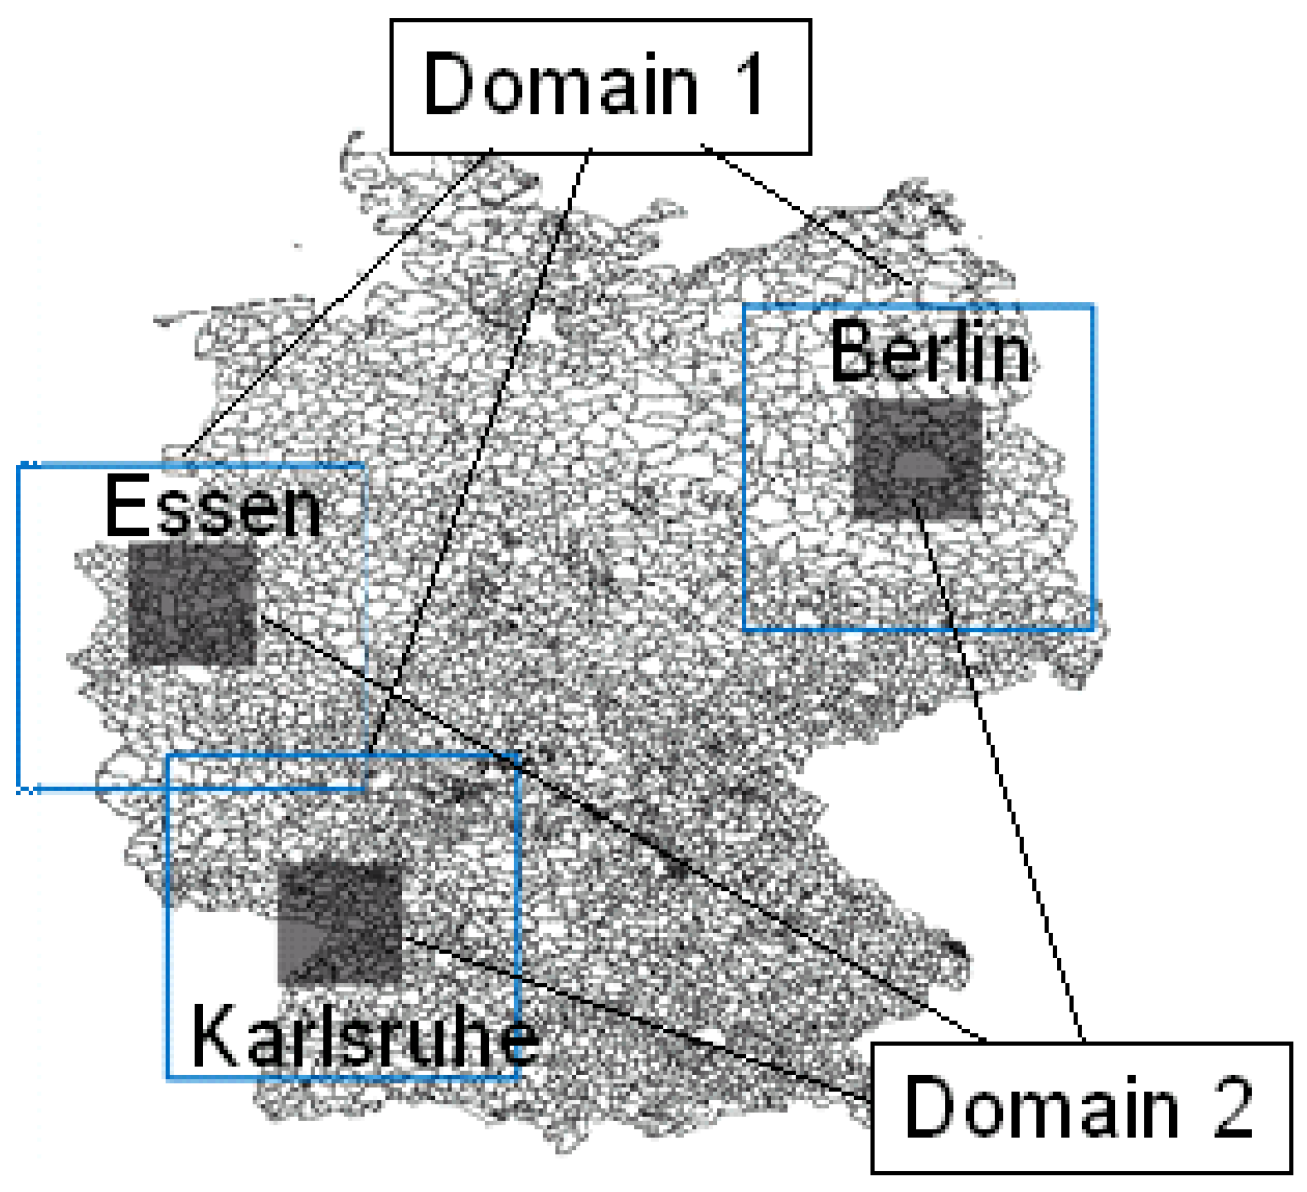
2. Outline of Calculation

We used mesoscale weather research and forecasting (WRF) model (version 3.0.1.1-ARW). For the turbulence model (planetary boundary layer scheme), we used the Mellor–Yamada–Janjic model. The Noah-LSM was used for the land surface model, and the urban canopy model was applied in urban areas (Kusaka et al. [13]). The objective study areas are shown in Figure 1 and Figure 2. The outer square is domain 1 (3 km grid, 360 km square) and the inner filled square is domain 2 (1 km grid, 103 km square). The nesting technique was used in each region. The latitude of each city is as follows; Tokyo: N35°, Osaka: N34°, Nagoya: N35°, Hiroshima: N34°, Sendai: N38°, Berlin: N52°, Essen: N51°, Karlsruhe: N49°. The calculation results of air temperature at 2 m high and wind velocity at 10 m high in domain 2 were used for the analysis.
Calculation conditions are shown in Table 1. The period for which calculations were done was from August 1 to 31, 2010 for Japanese cities, from July 23 to August 23, 2008 for German cities. In Japanese cities, based on digital national land information (spatial resolution of 100 m) and a normalized vegetation index (NVI) created from Landsat7 ETM+ data, urban areas were classified into three categories according to the previous study (Kitao et al. [14]), for using the urban canopy model (Kusaka et al. [13]); Urban A: high-rise and high-density (mean building height: 10 m, gross building ratio: 44 %), Urban B: middle-rise and moderate-density (mean building height: 7.5 m, gross building ratio: 38 %), Urban C: low-rise and low-density (mean building height: 5 m, gross building ratio: 29 %). In German cities, they were classified based on USGS data as shown in Table 1.
Land use conditions and number of urban meshes in Tokyo, Osaka, Nagoya, Hiroshima, and Sendai; and Berlin, Essen, and Karlsruhe are shown in Figure 3 and Figure 4. The numbers of urban land use meshes are 3,698 in Tokyo; 1,271 in Osaka; 1,416 in Nagoya; 364 in Hiroshima; 239 in Sendai; 460 in Berlin; 637 in Essen; and 38 in Karlsruhe. Frequency of urban land use at each distance point from the coast for Japanese cities is shown in Figure 5. Main wind direction is not specified for German cities where the natural land use is located around the city. Frequency of urban land use in Japanese cities is larger in the coastal area and decreases gradually in the inland area. In Tokyo, the number of urban land use meshes is very large in comparison with other cities all over the inland from the coast. The number of urban land use meshes along the coastal area in Nagoya and Sendai is slightly smaller compared to those for Tokyo, Osaka, and Hiroshima.

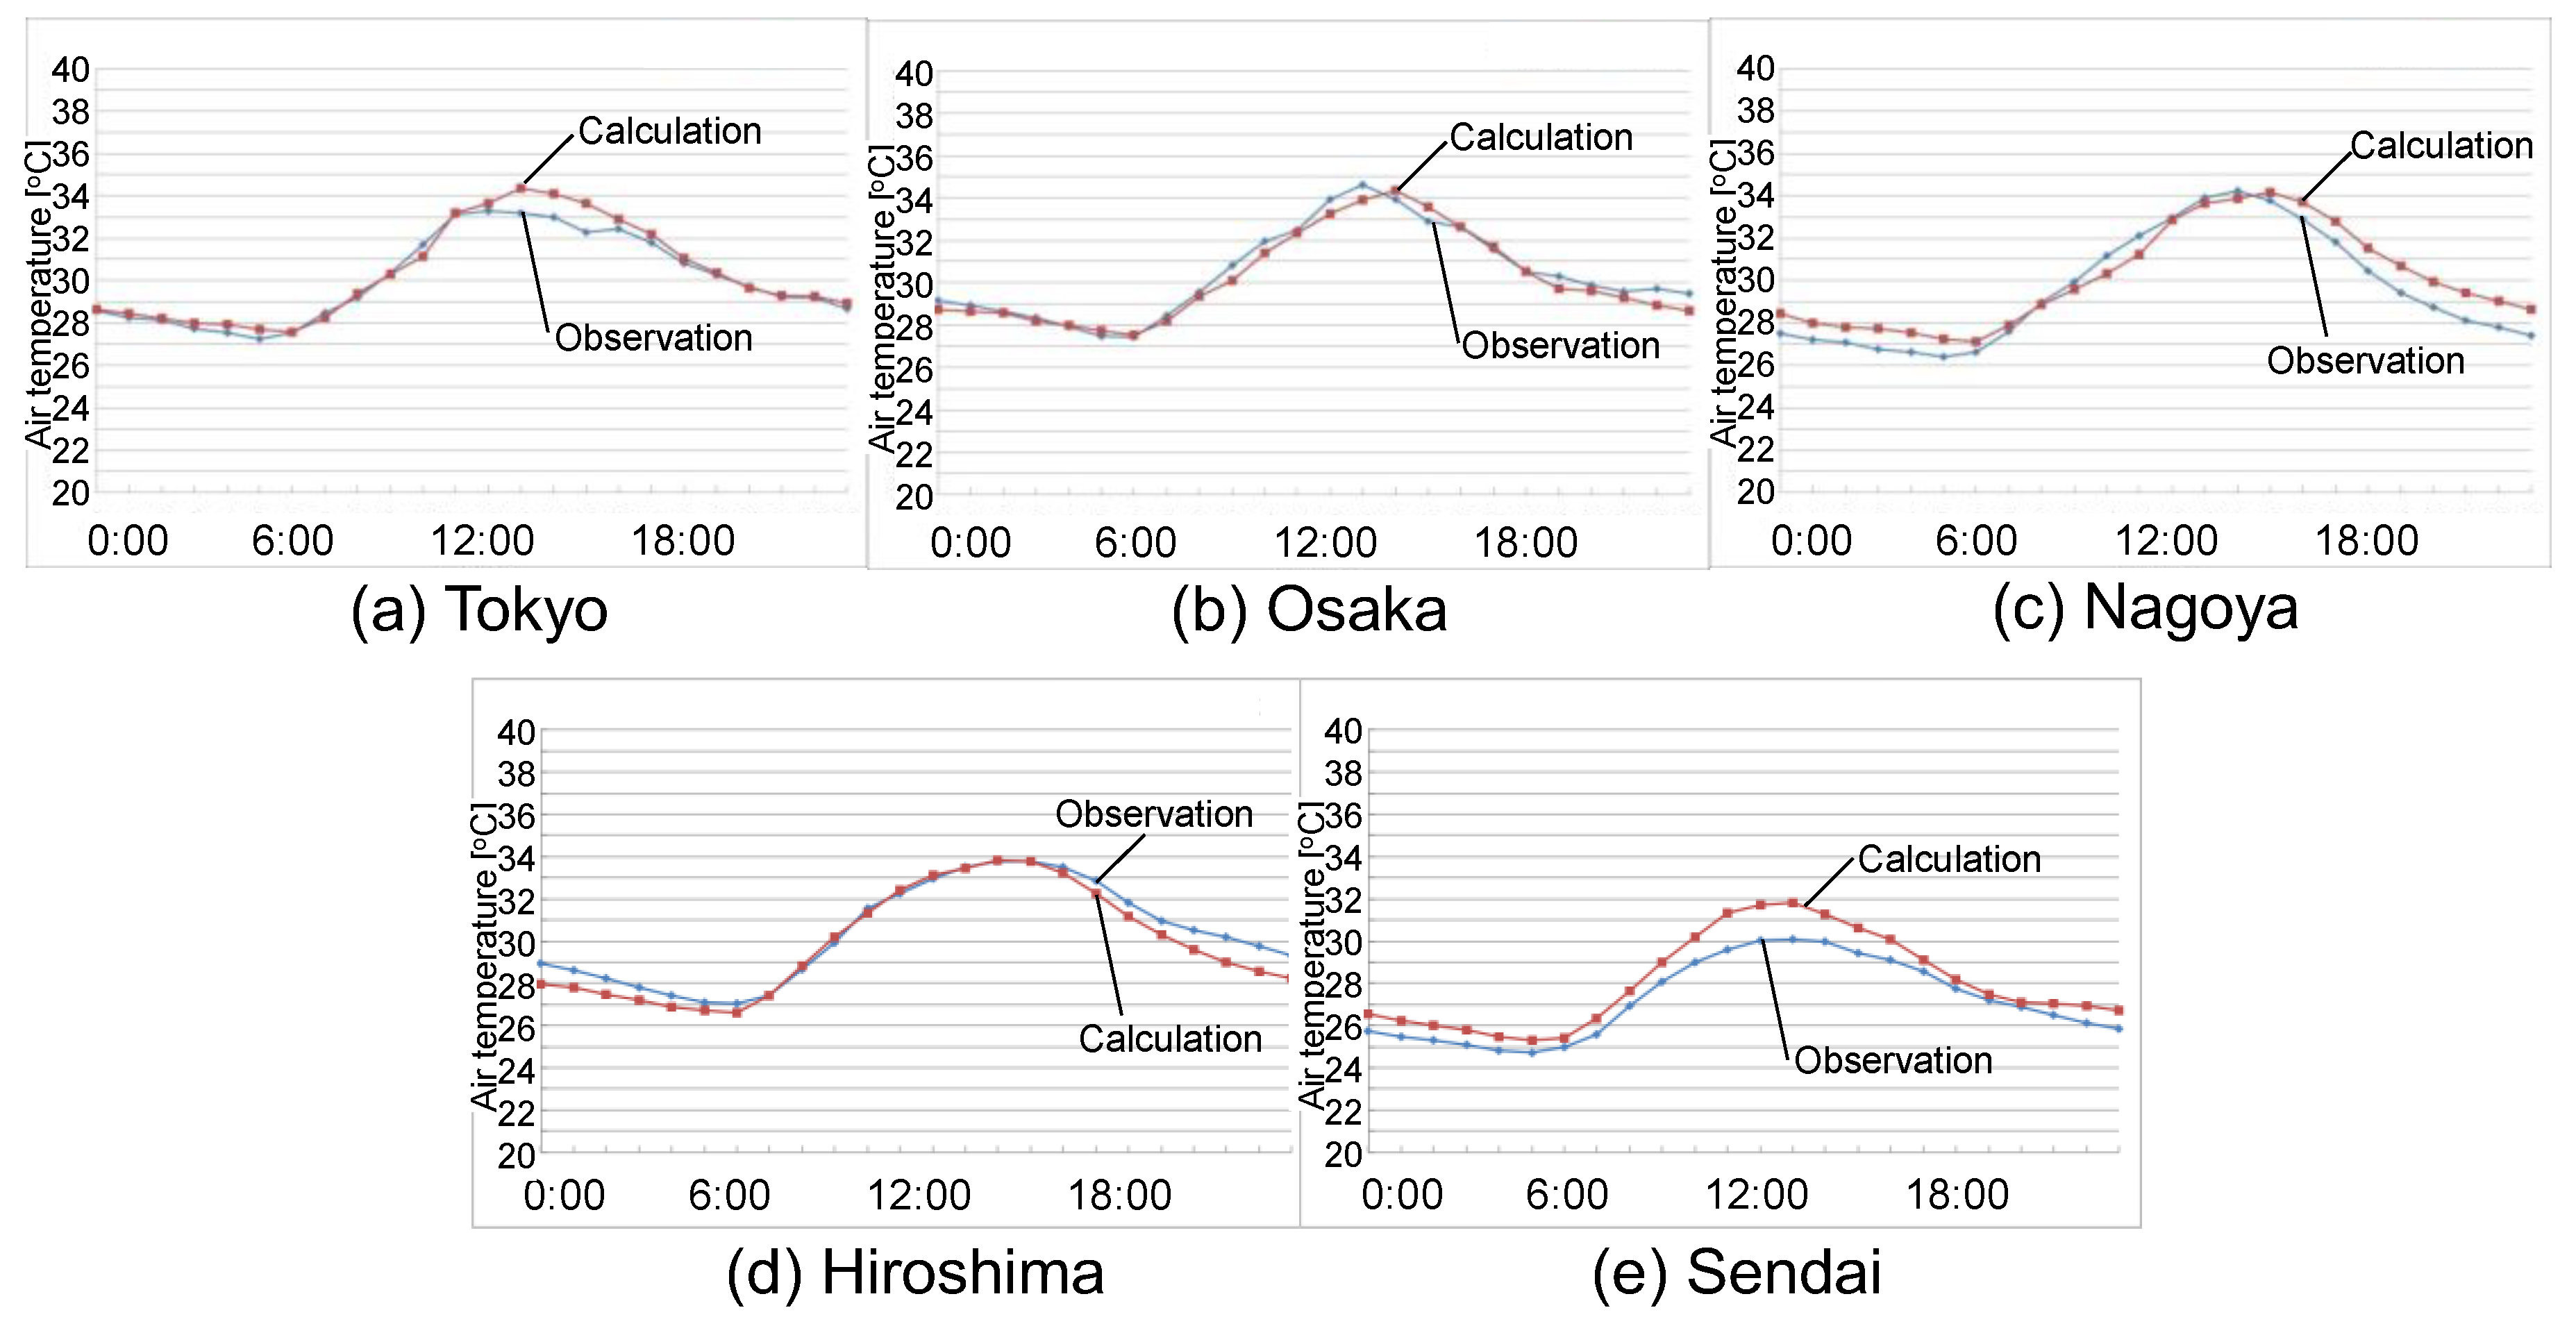
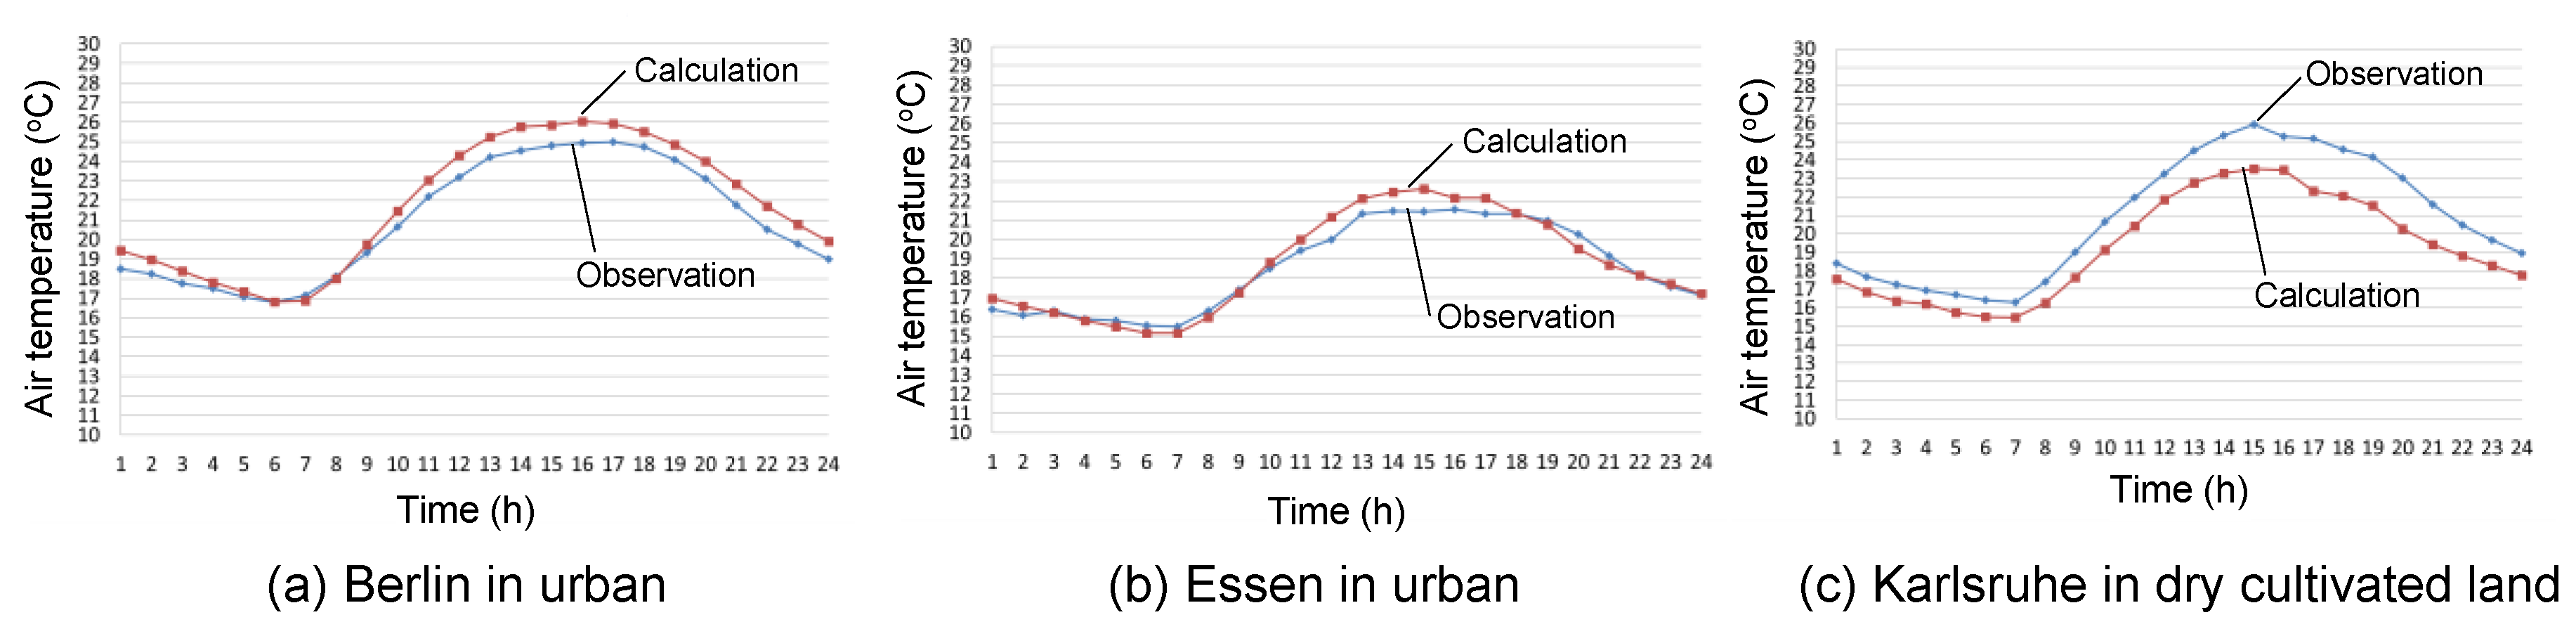
3. Calculation Accuracy

Fine days conditions were selected according to weather conditions as follows; weather: mostly sunny and sunny, sunlight hours: more than 7.0 hours, solar radiation: more than 19 MJ/m2, precipitation: less than 0.5 mm. Sea breeze conditions only for Japanese cities were selected according to weather conditions as follows; wind velocity: more than 2.0 m/s at observatory, wind direction: main wind direction at each observatory, duration time: more than six hours under the above conditions. The calculated values and observed values, which are instantaneous values every hour, are compared using observation station data in domain 2 of each city. Position of measurement sites are shown in Figure 6 and Figure 7. Since the number of measurement sites was limited, observation data in land use other than the urban land use were also used for verification. The calculation accuracies of air temperature and wind velocity for various observatories at Tokyo, Osaka, Nagoya, Hiroshima, and Sendai; and Berlin, Essen, and Karlsruhe are shown in Table 2 and Table 3. For the five Japanese cities, calculation accuracy is comparable to previous studies (Kitao et al., 2009 and Moriyama et al., 2014). The accuracy of the nighttime air temperature calculation results is a little worse than during the daytime. The error during the daytime was within 1 °C, while it was over 2 °C during the nighttime. Calculation results during the day are used for analysis in the following. Most of measurement sites in Tokyo, Osaka, and Nagoya areas are located within metropolitan areas, whereas most of measurement sites in Hiroshima and Sendai areas are located outside metropolitan areas. At measurement sites outside metropolitan areas, a bit of poor calculation precision of wind velocity is confirmed due to the local topography. It is a similar problem for Karlsruhe with a narrow metropolitan area. However, we judged that it does not significantly affect the study of air temperature distribution in the urban area. A comparison of observed and calculated period average air temperatures at the Tokyo, Osaka, Nagoya, Hiroshima, and Sendai; and Berlin, Essen, and Karlsruhe observatories are shown in Figure 8 and Figure 9. The difference was a little large in Sendai, but it was not noticeable in Table 2. It was recognized that the difference was large in Karlsruhe since the comparison could be carried out only in the land use other than urban, while it was done in the urban land use in Berlin and Essen.

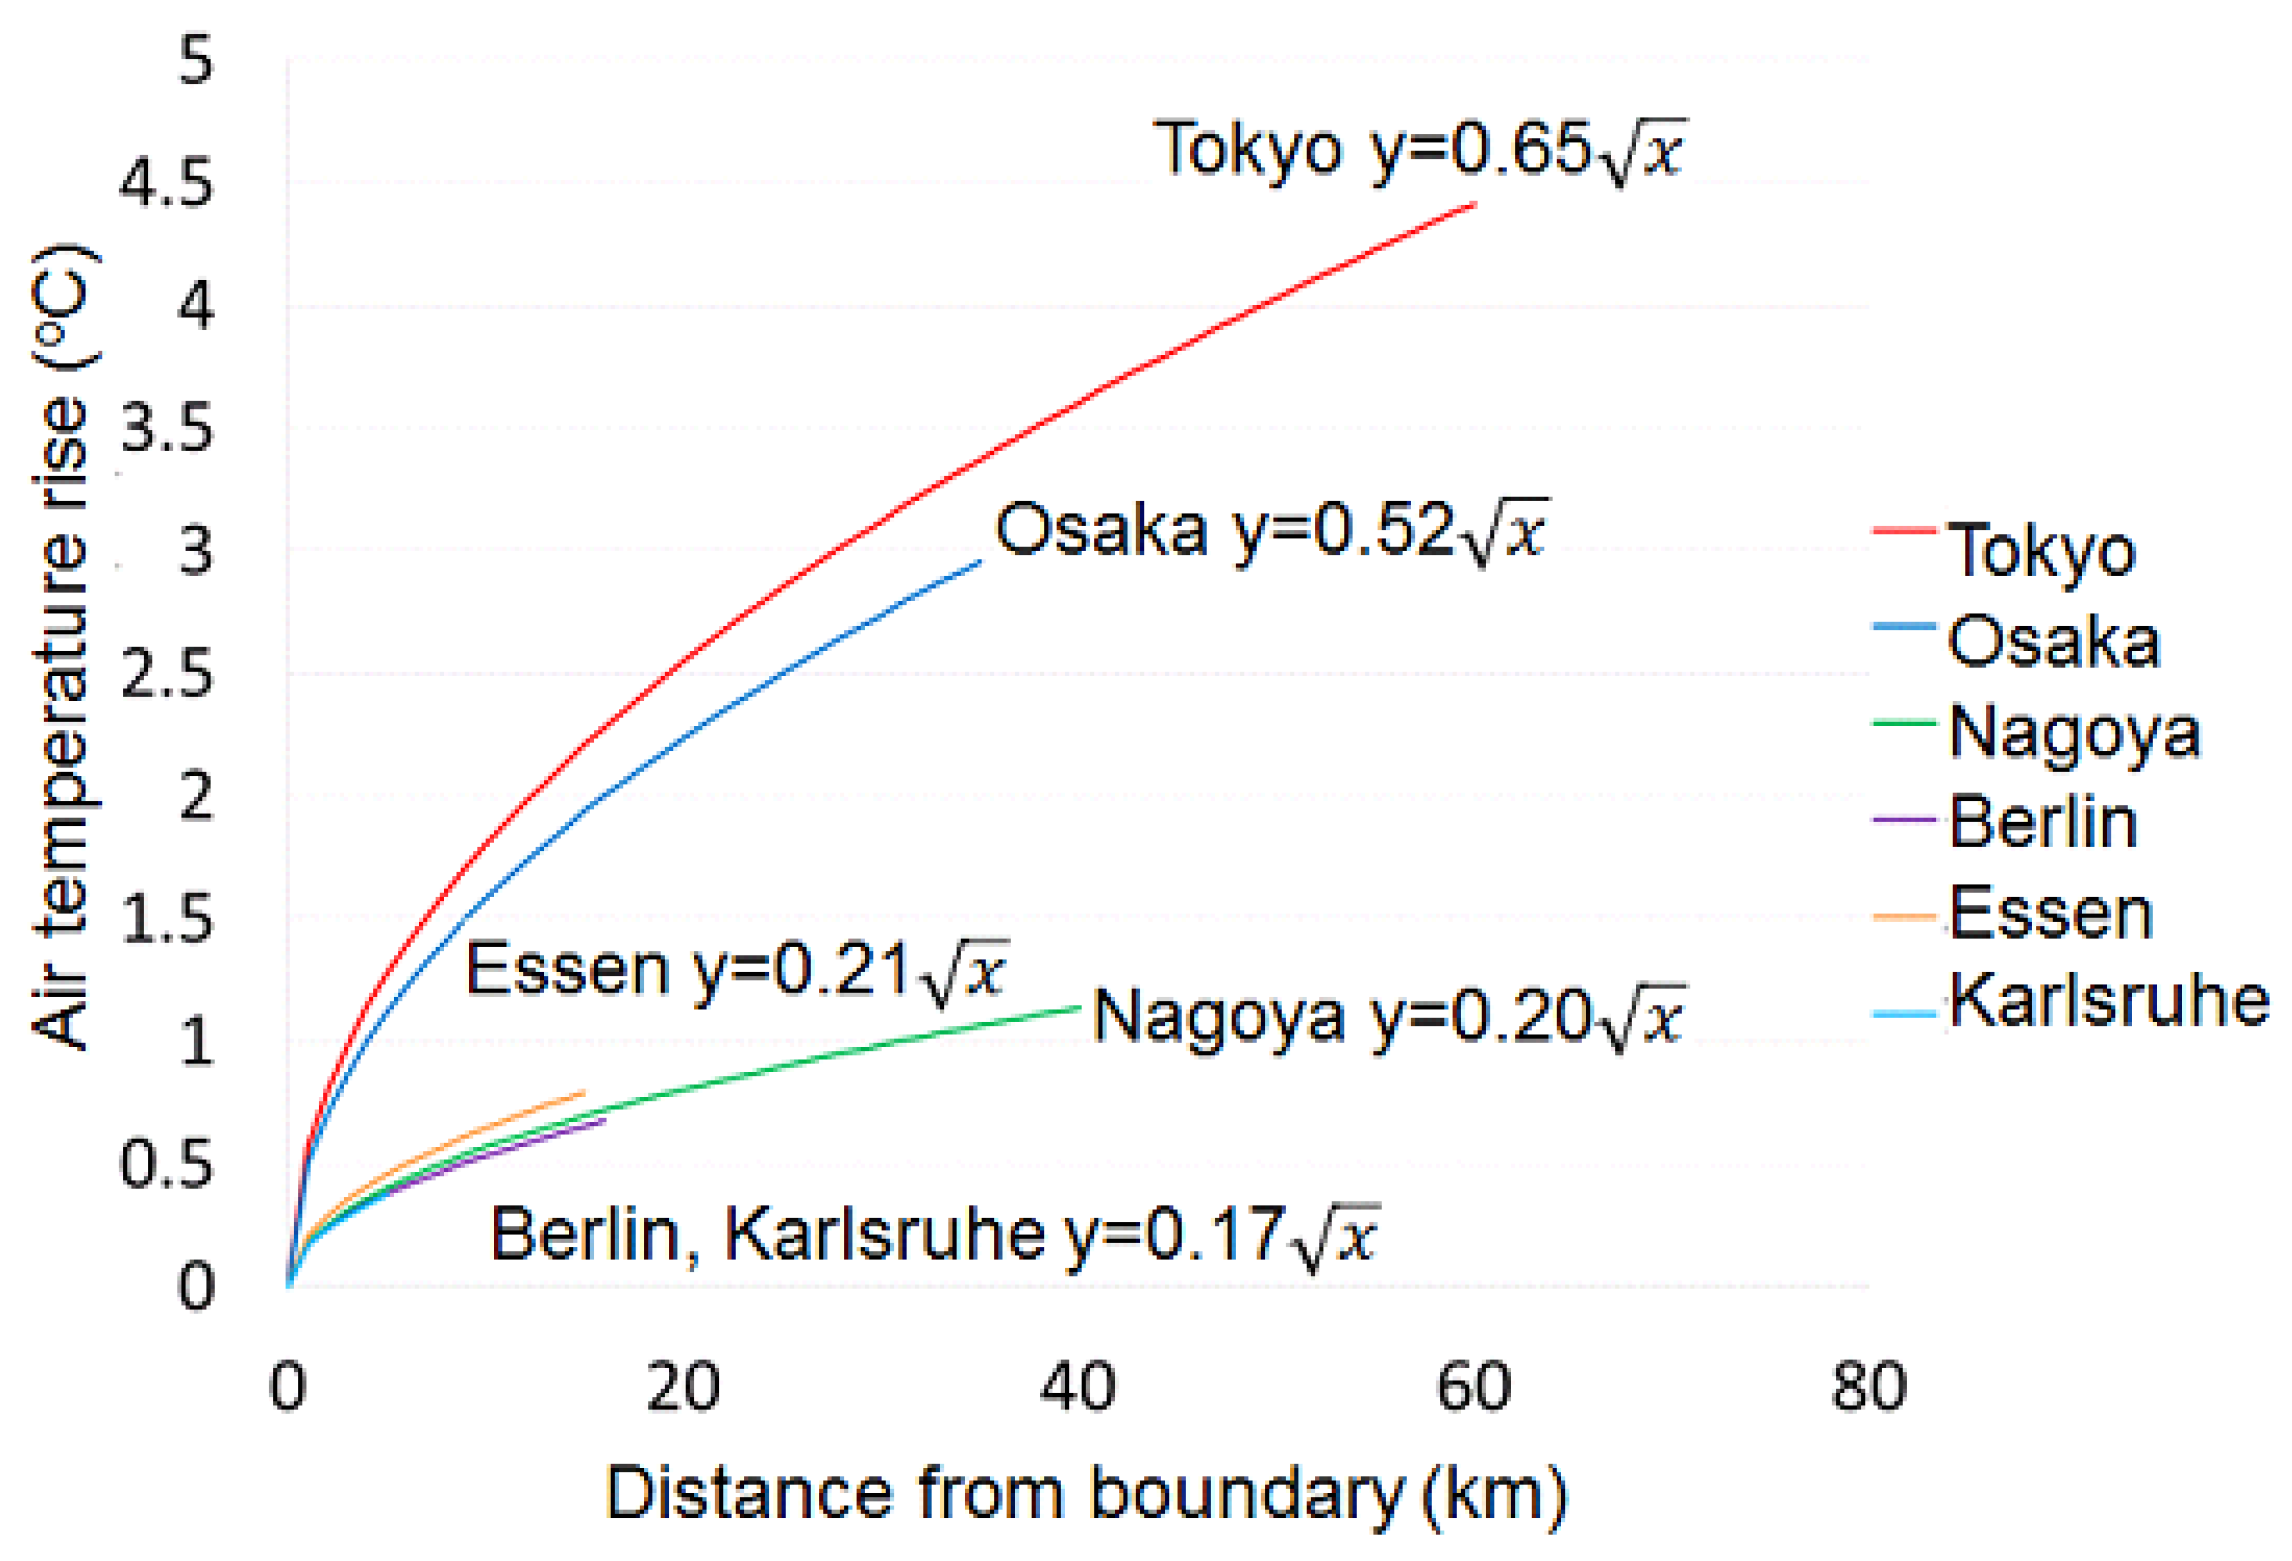
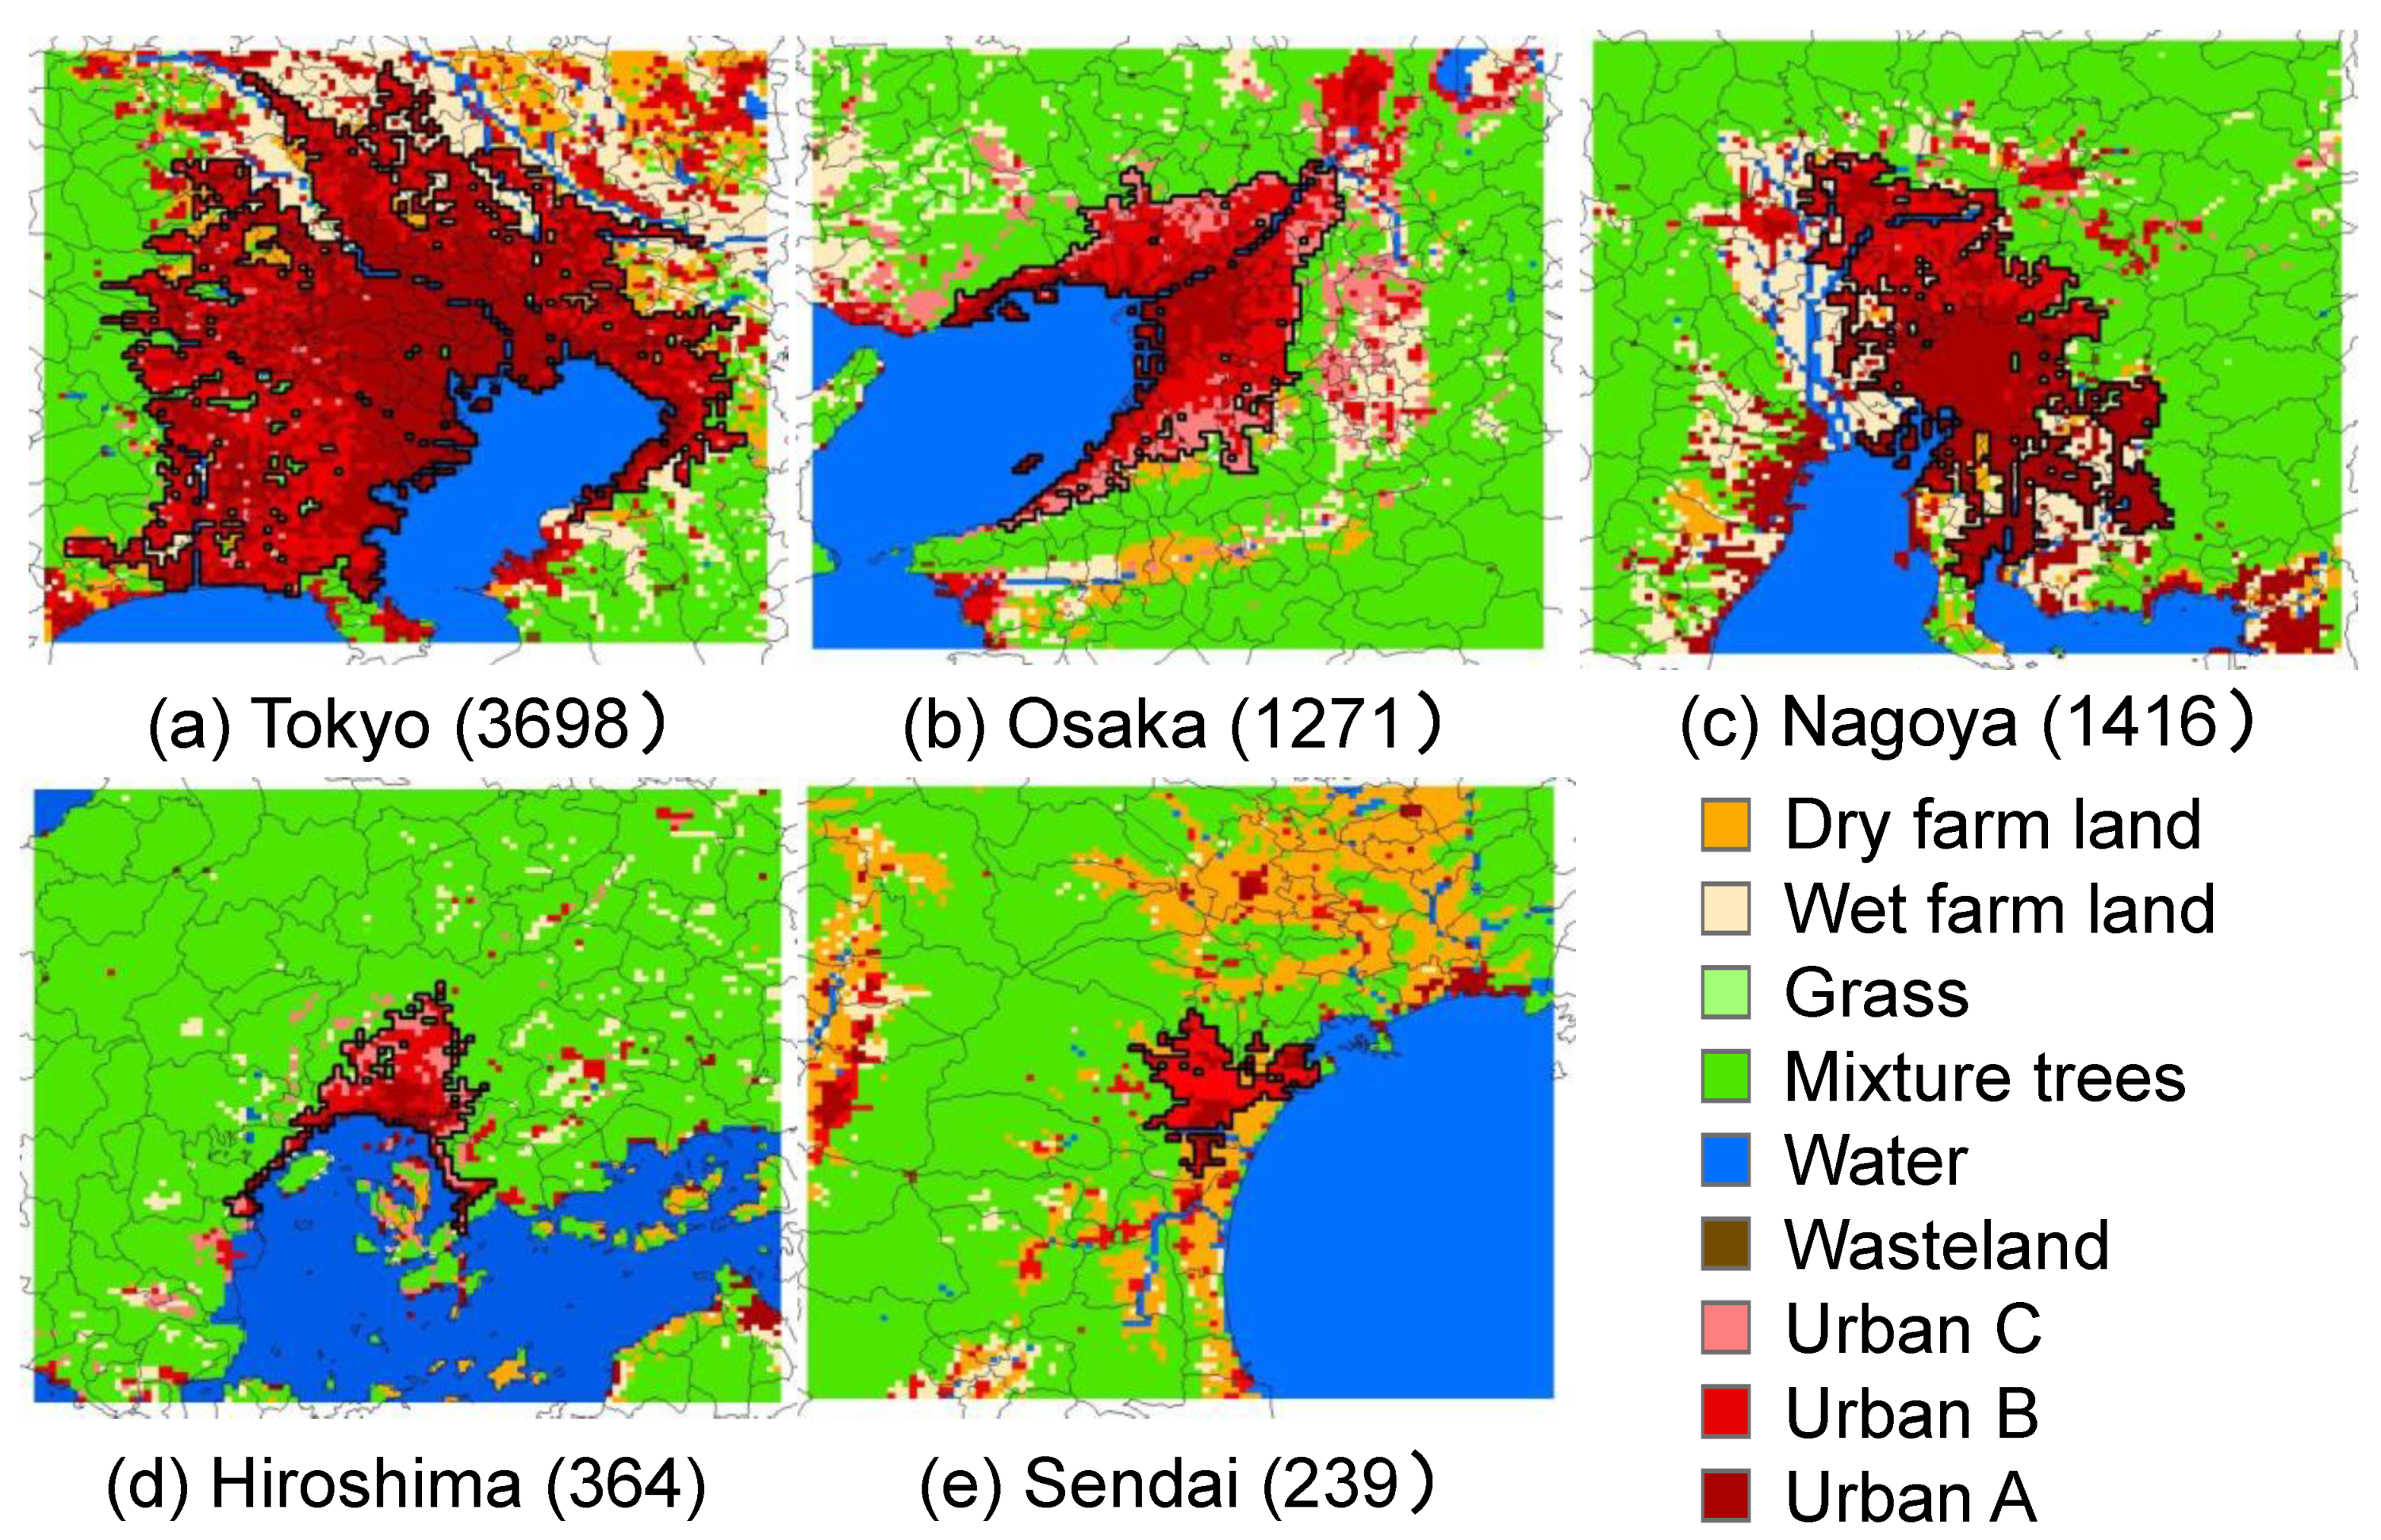
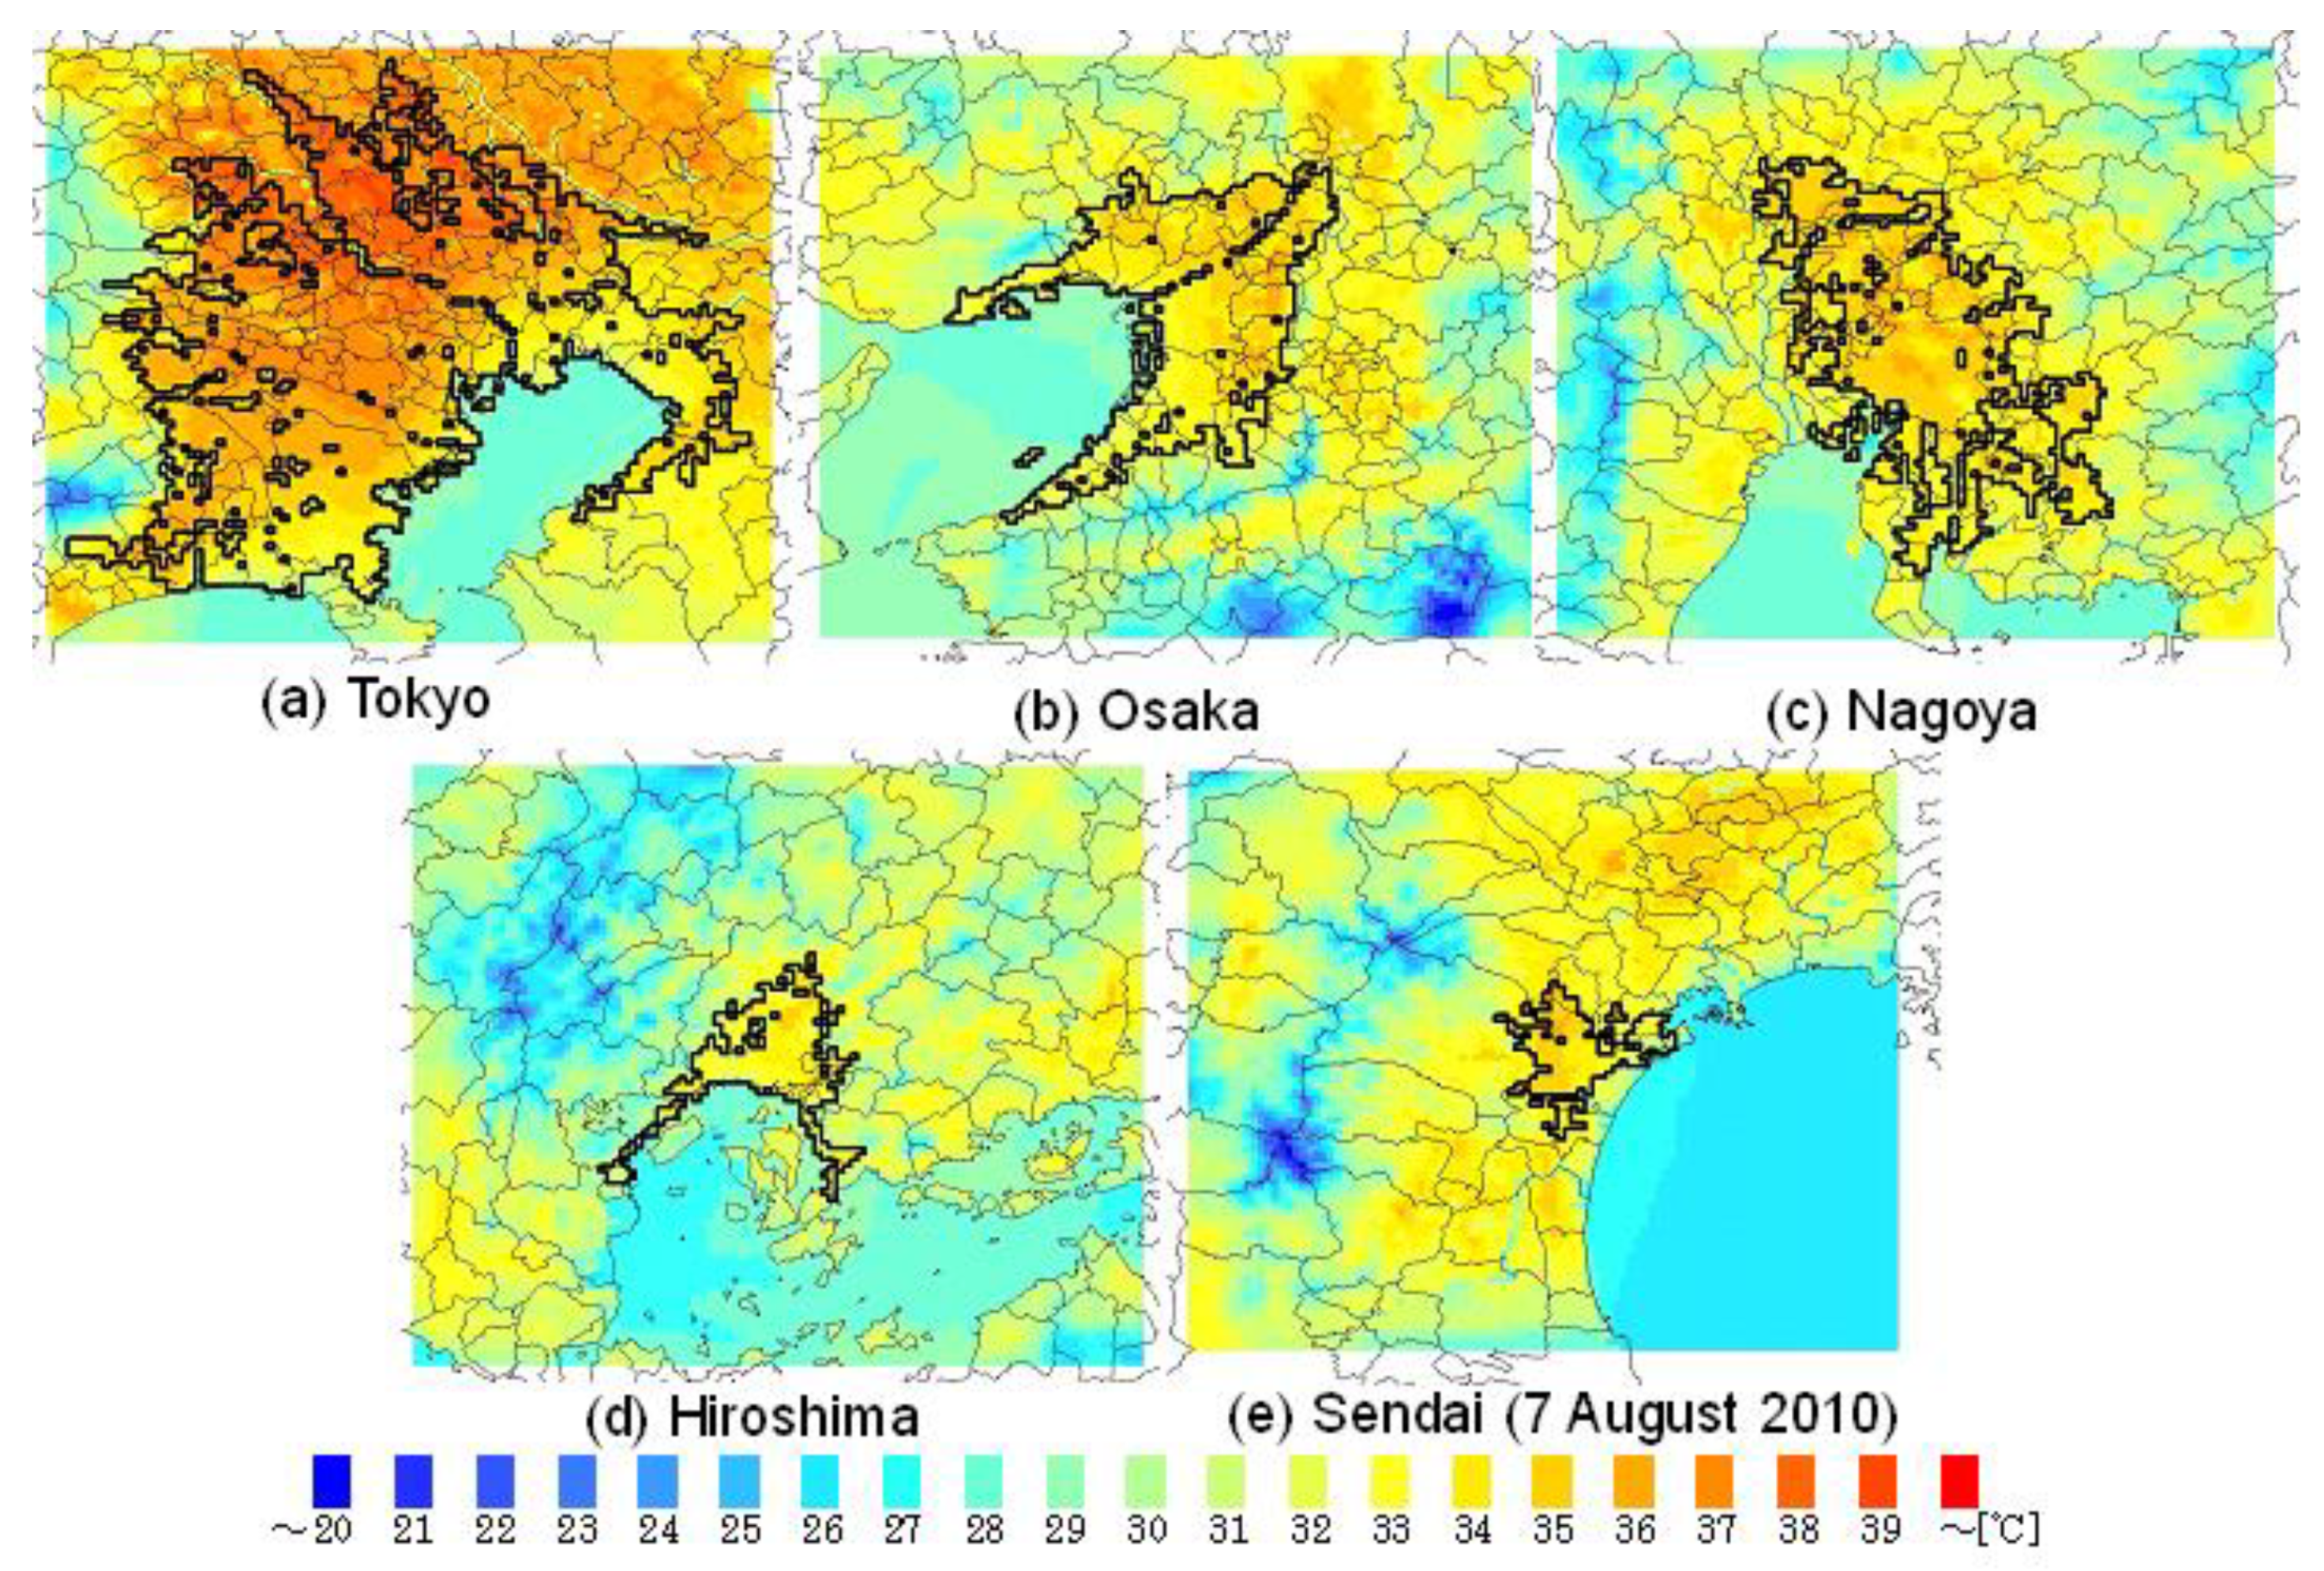
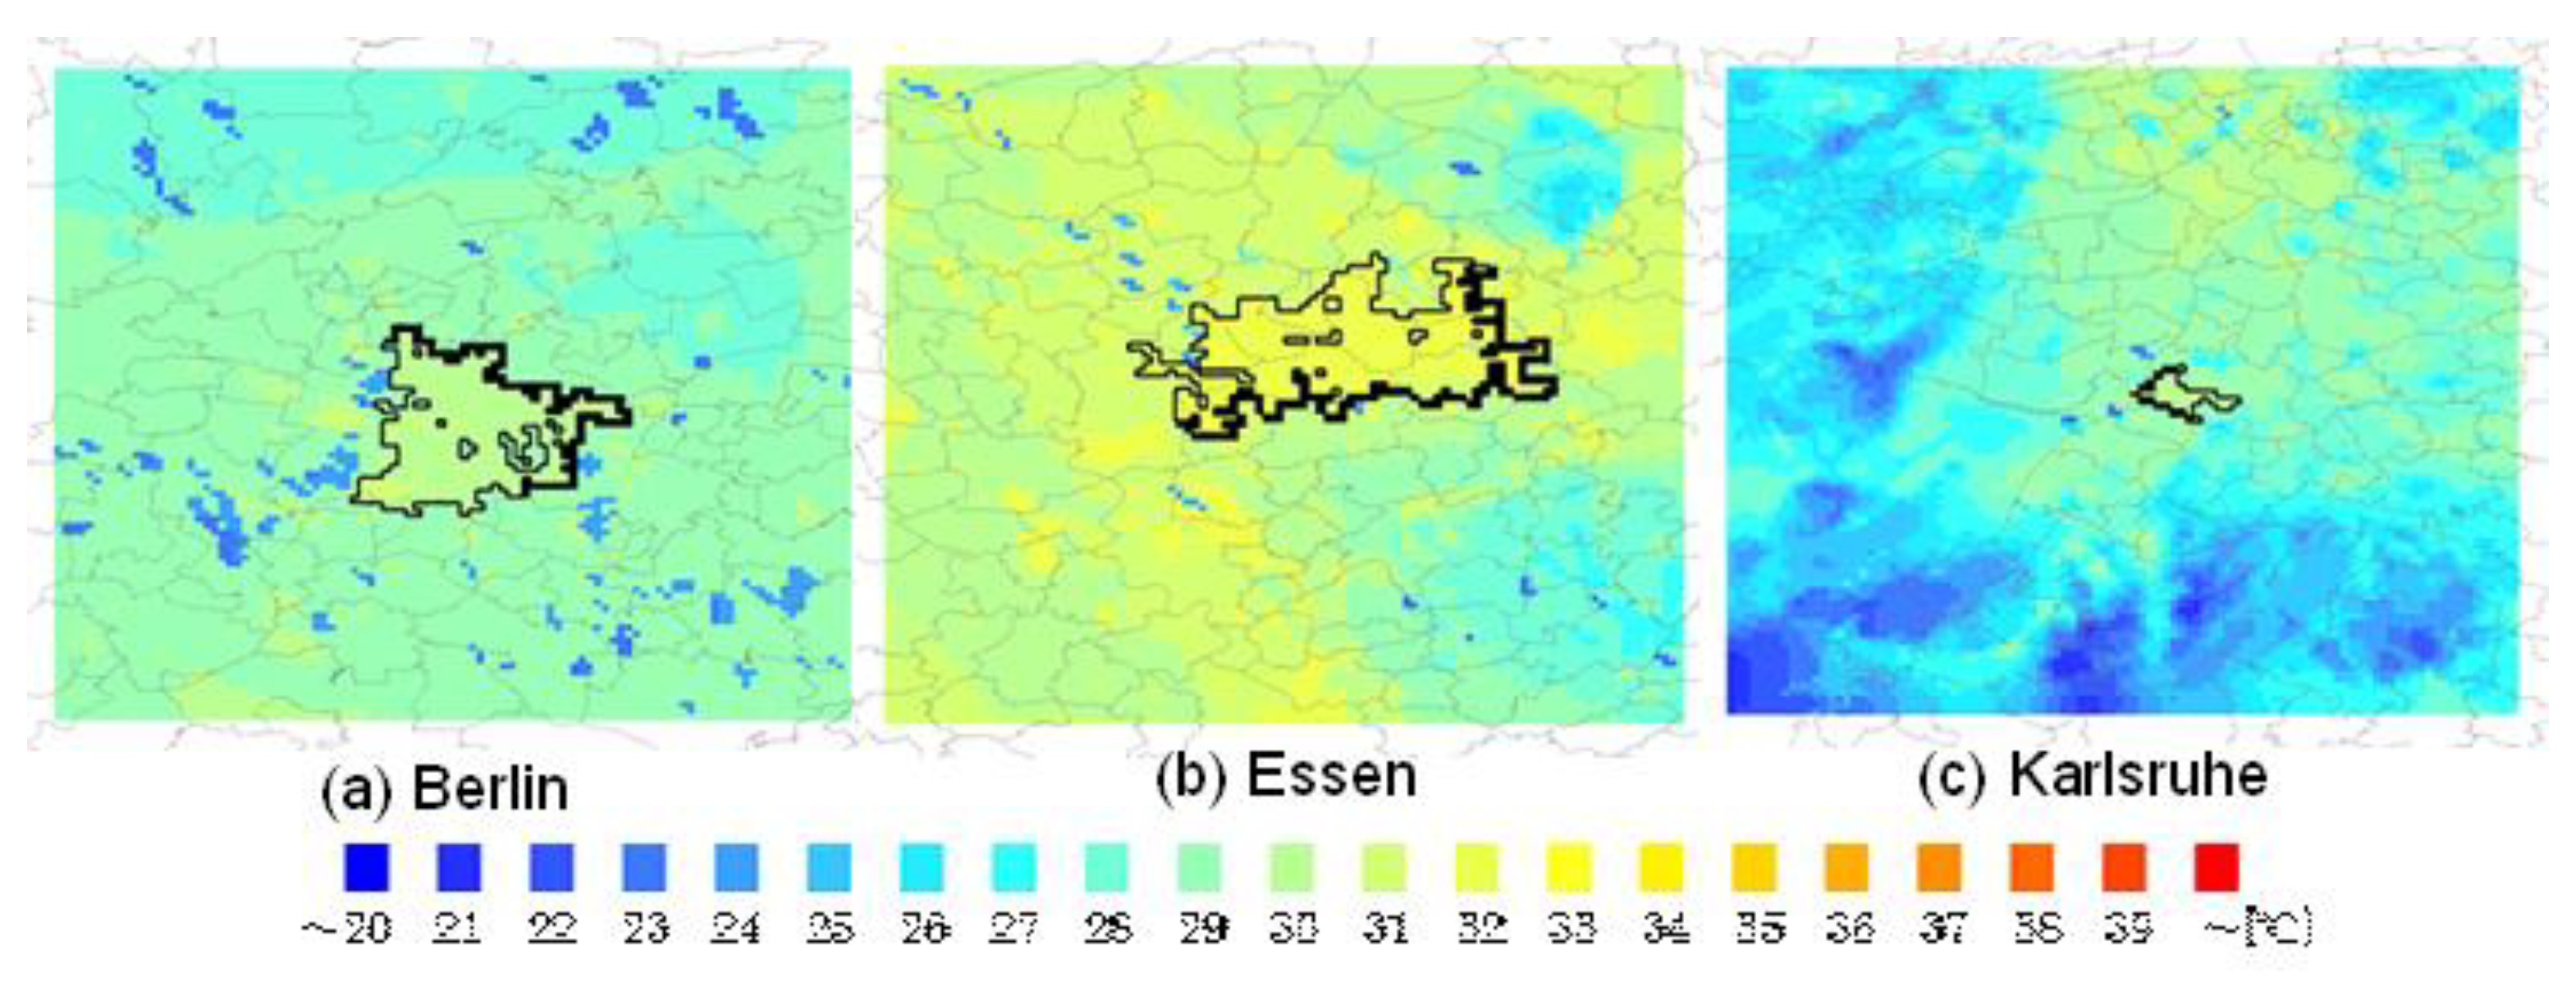
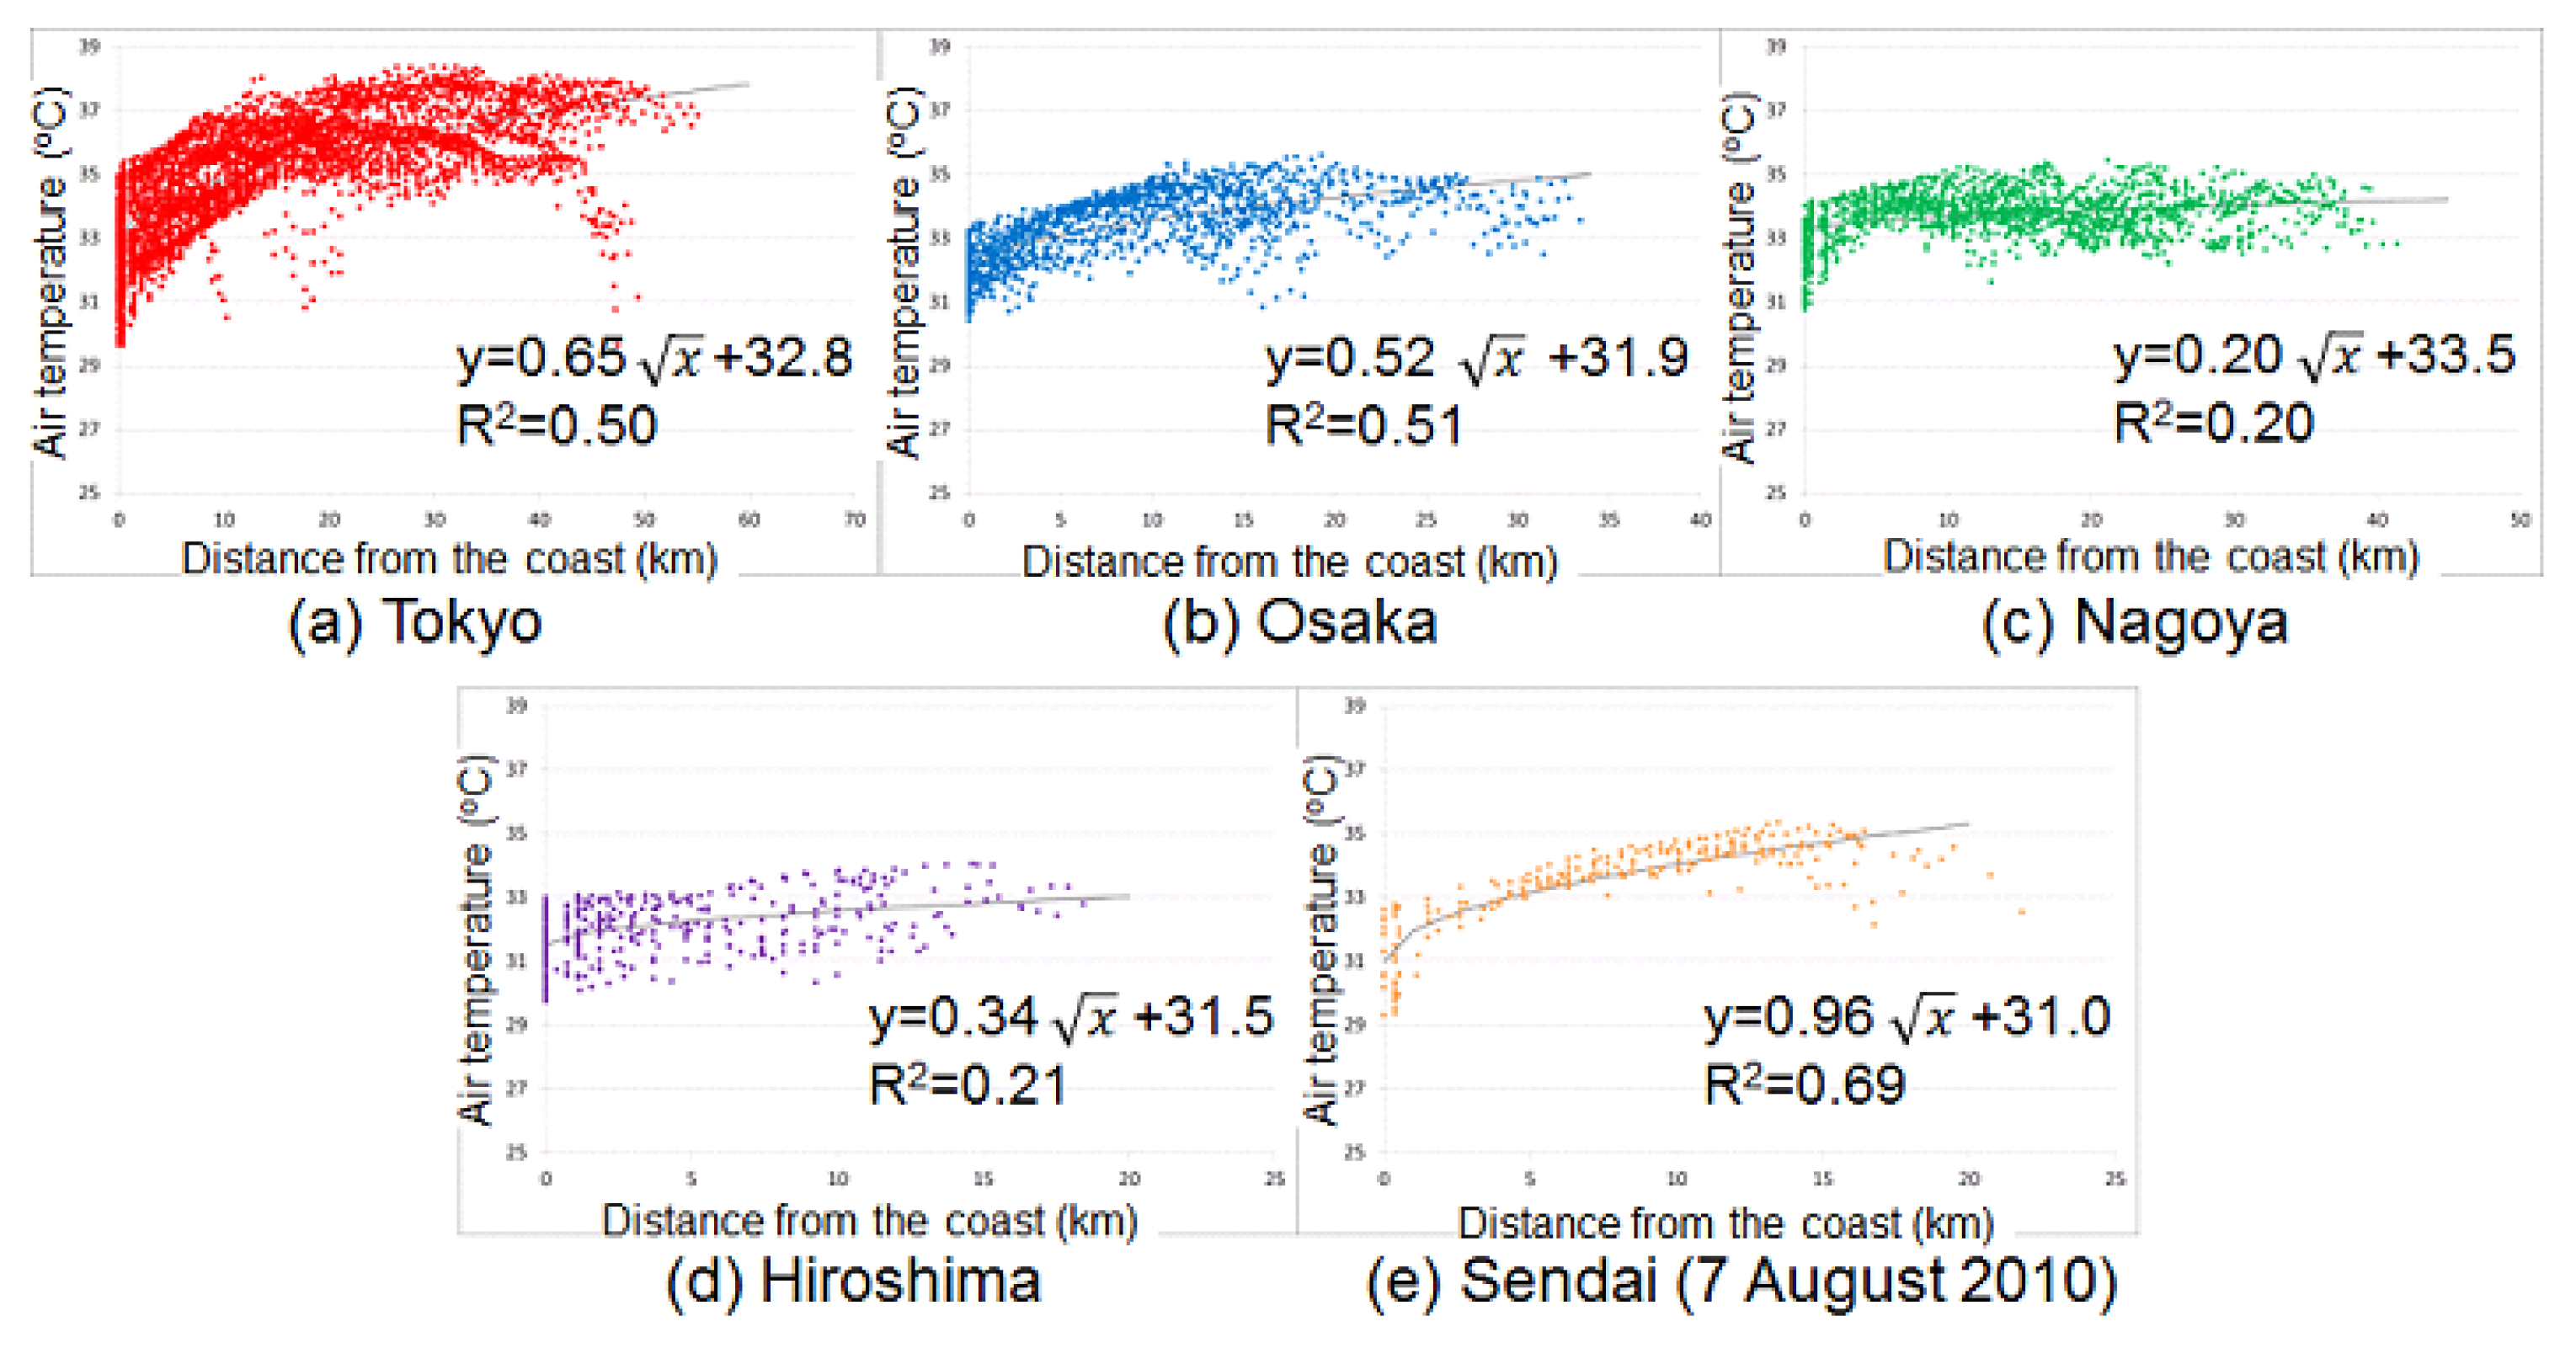
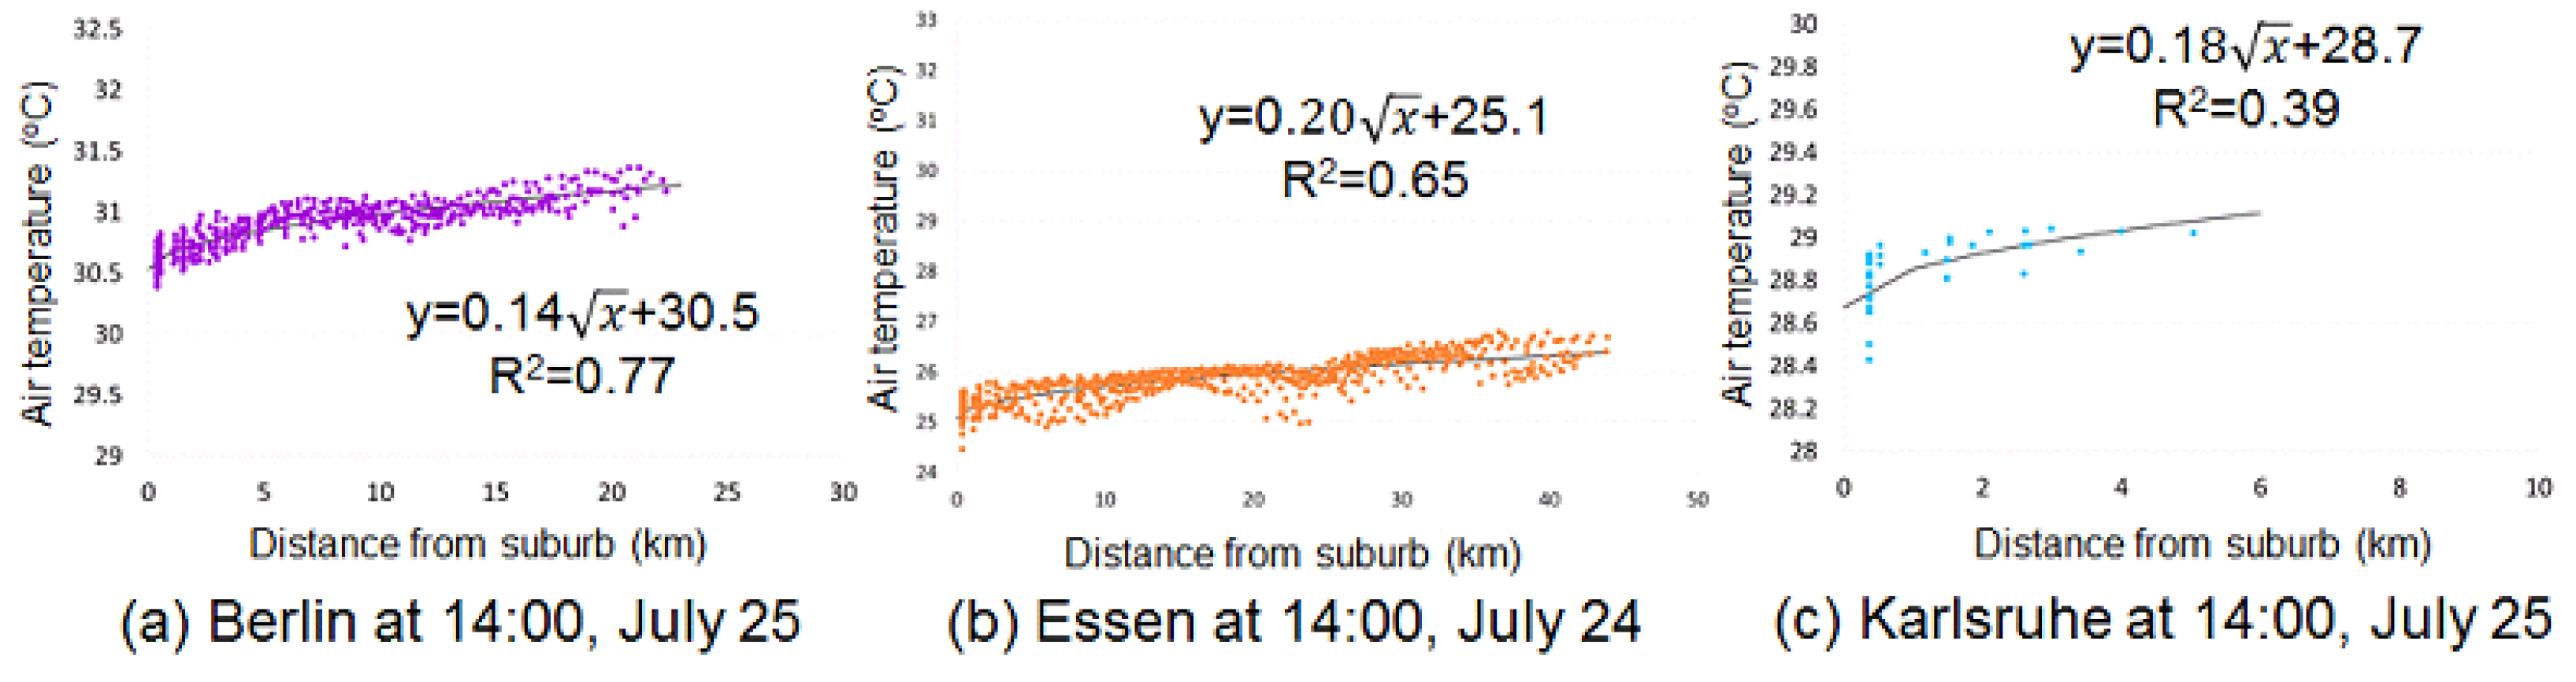
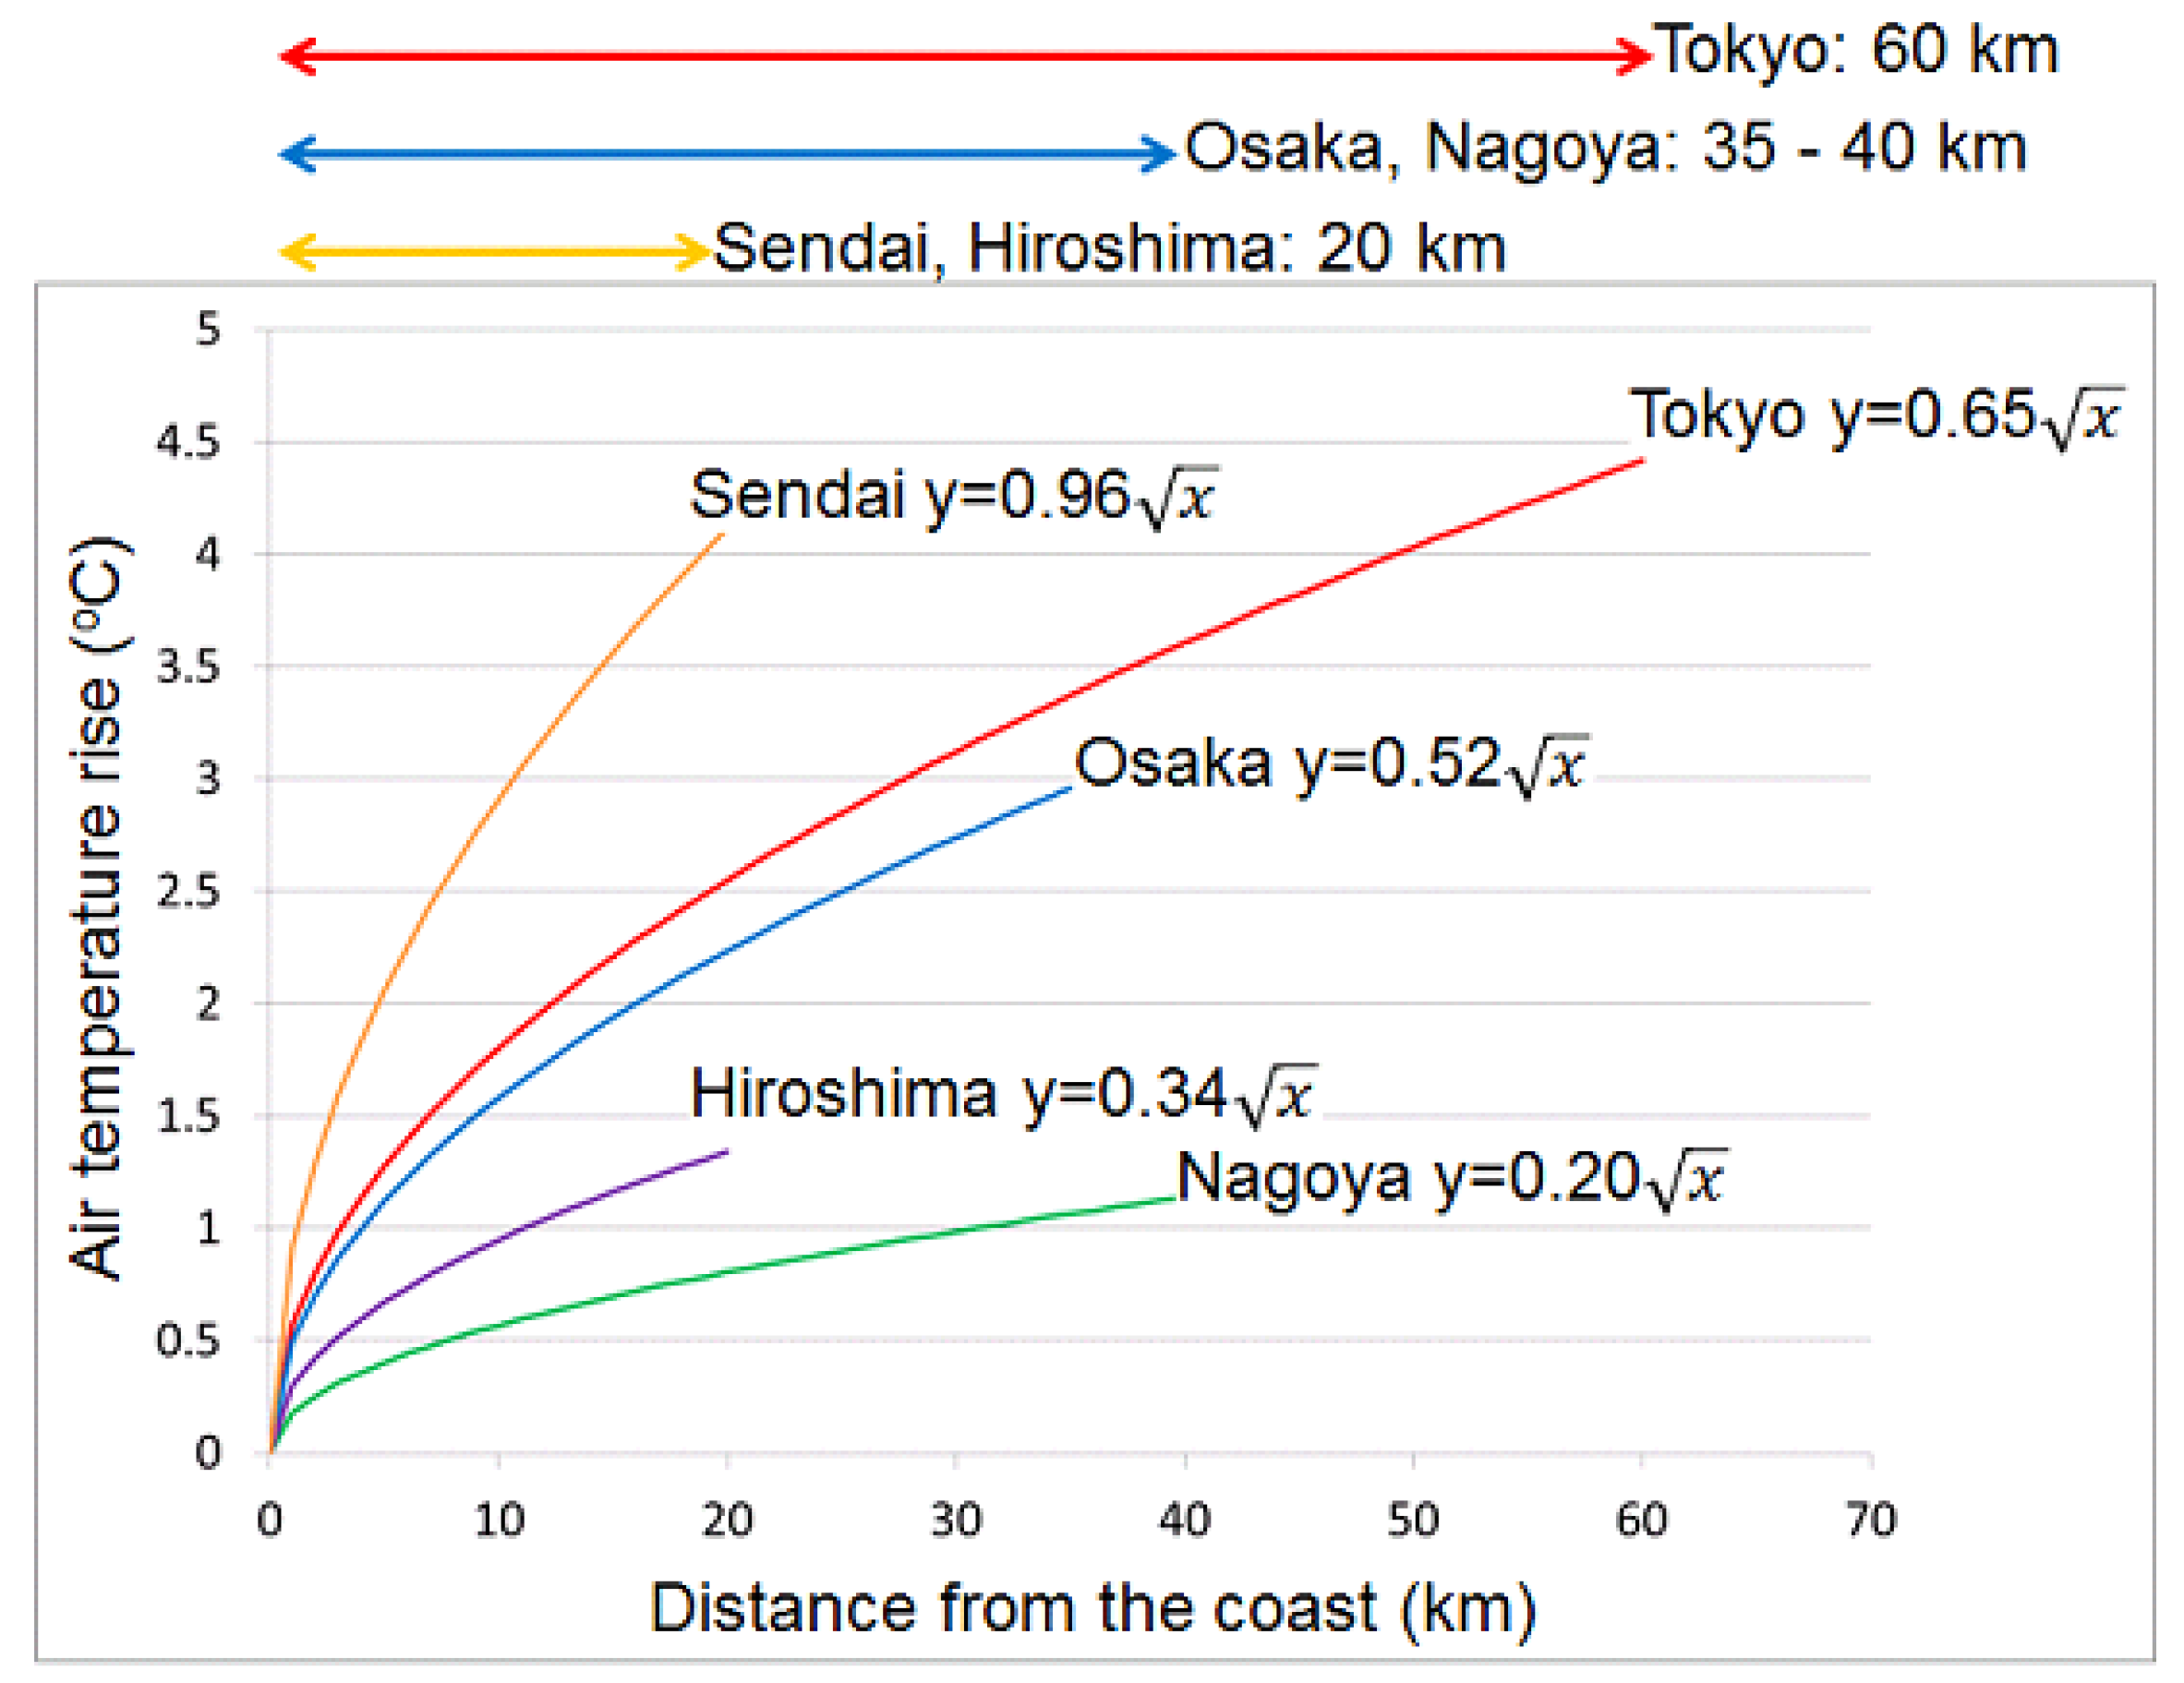
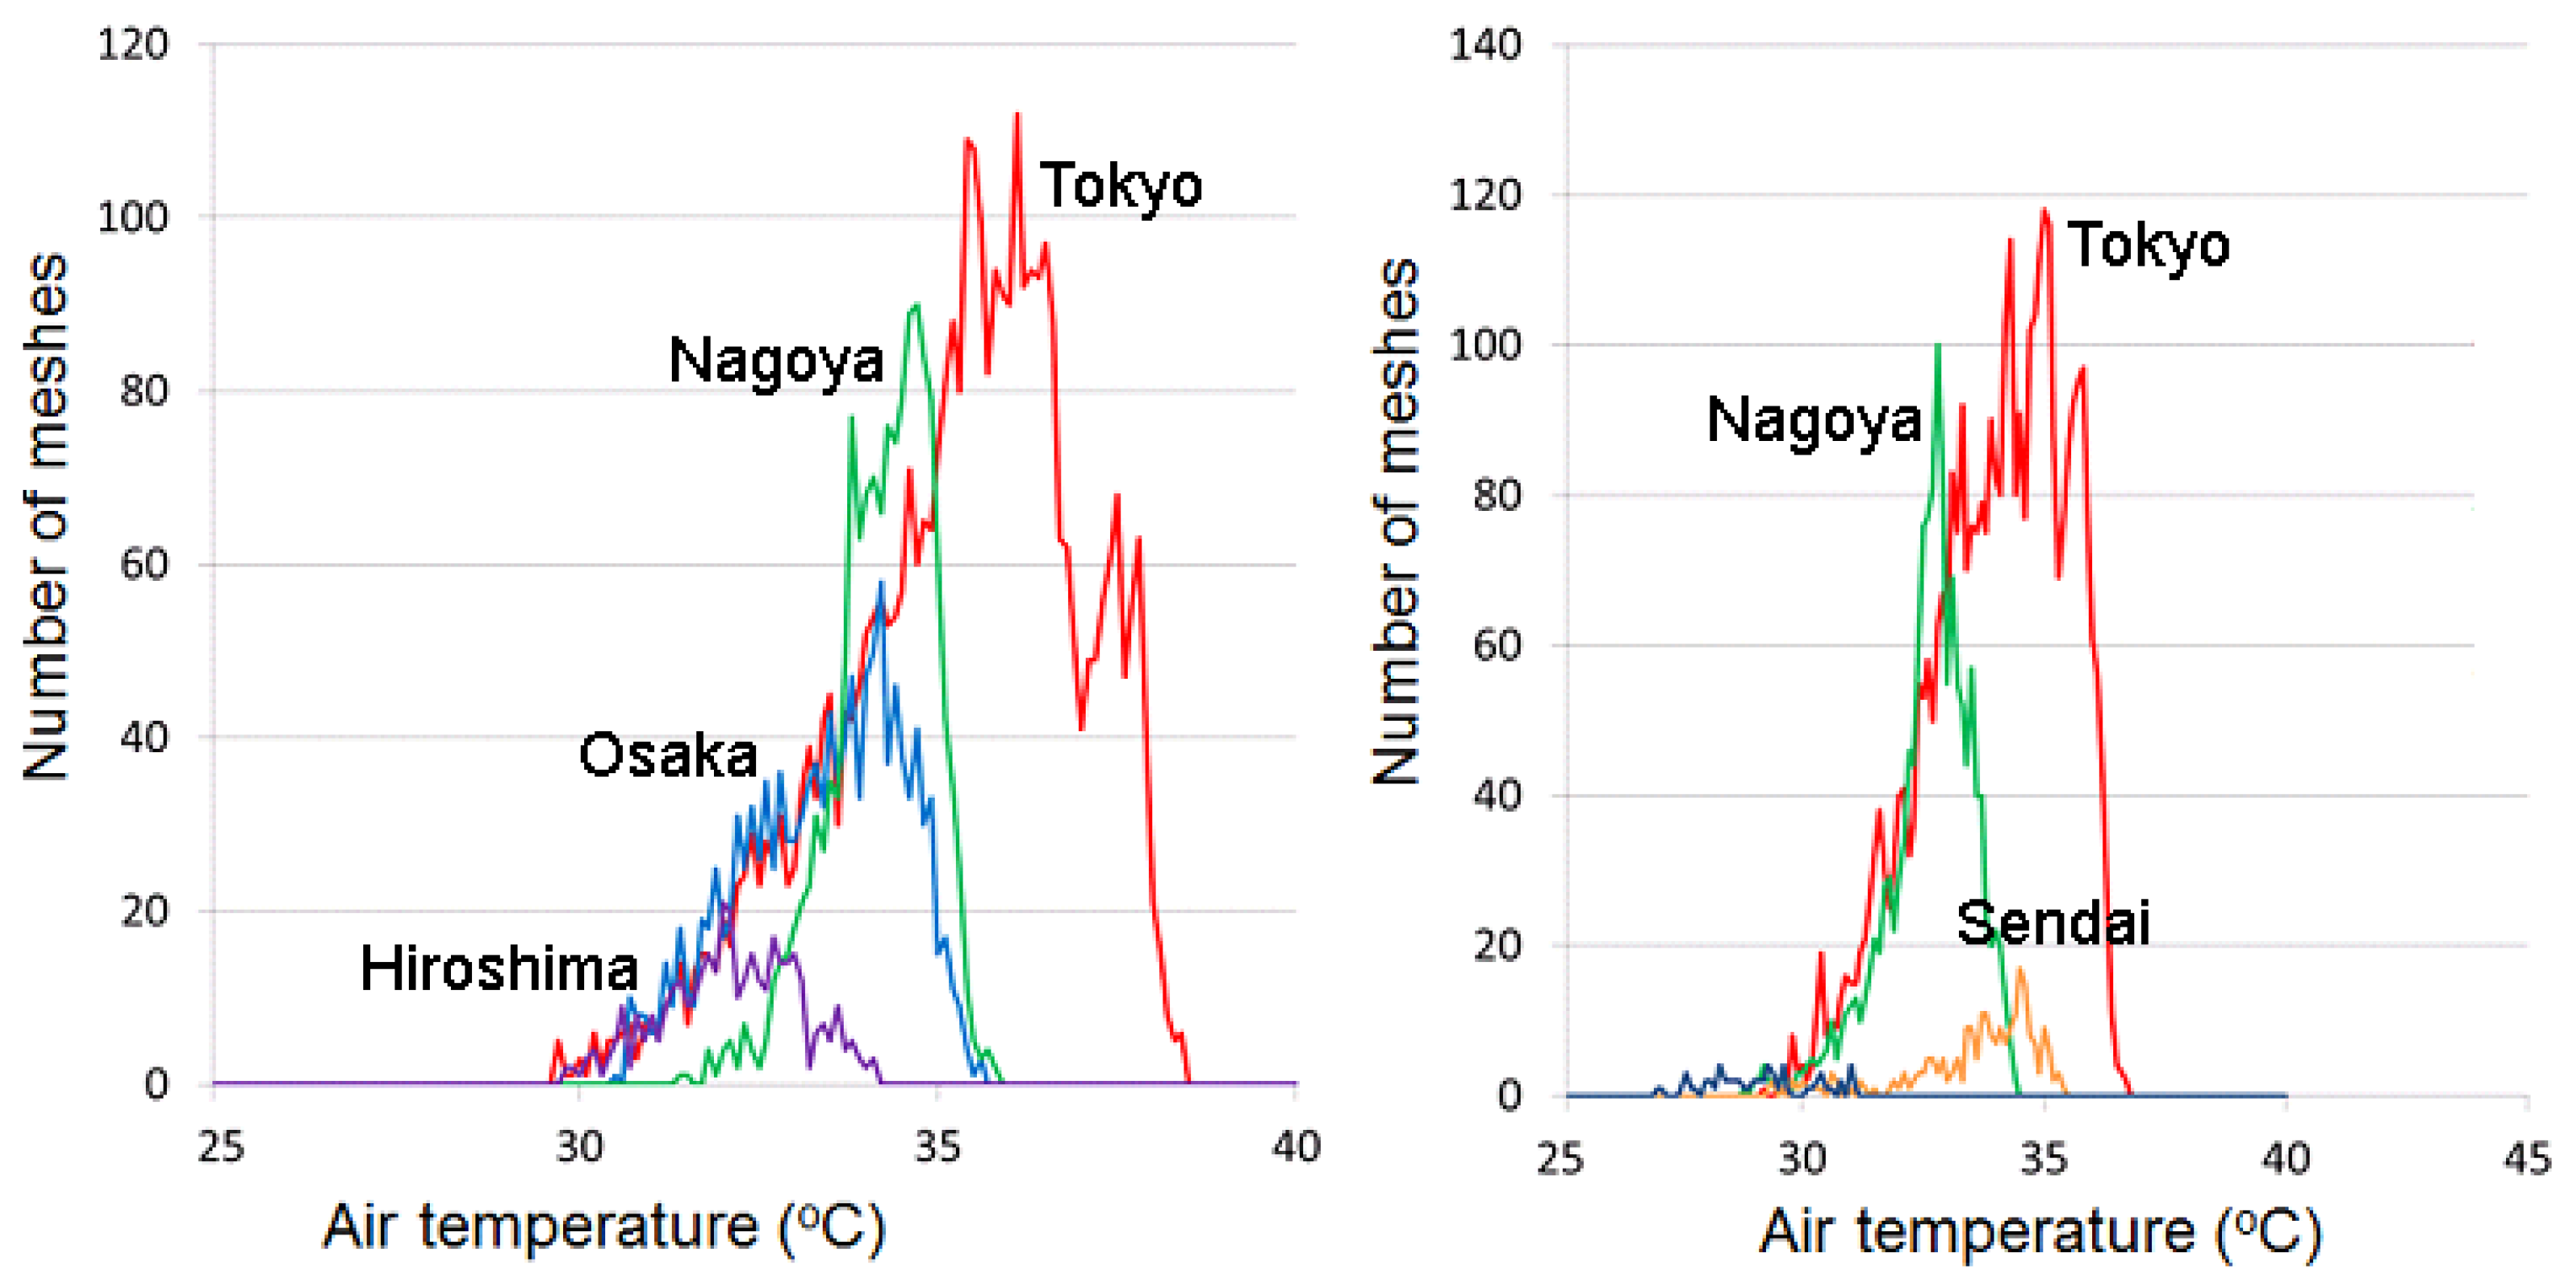
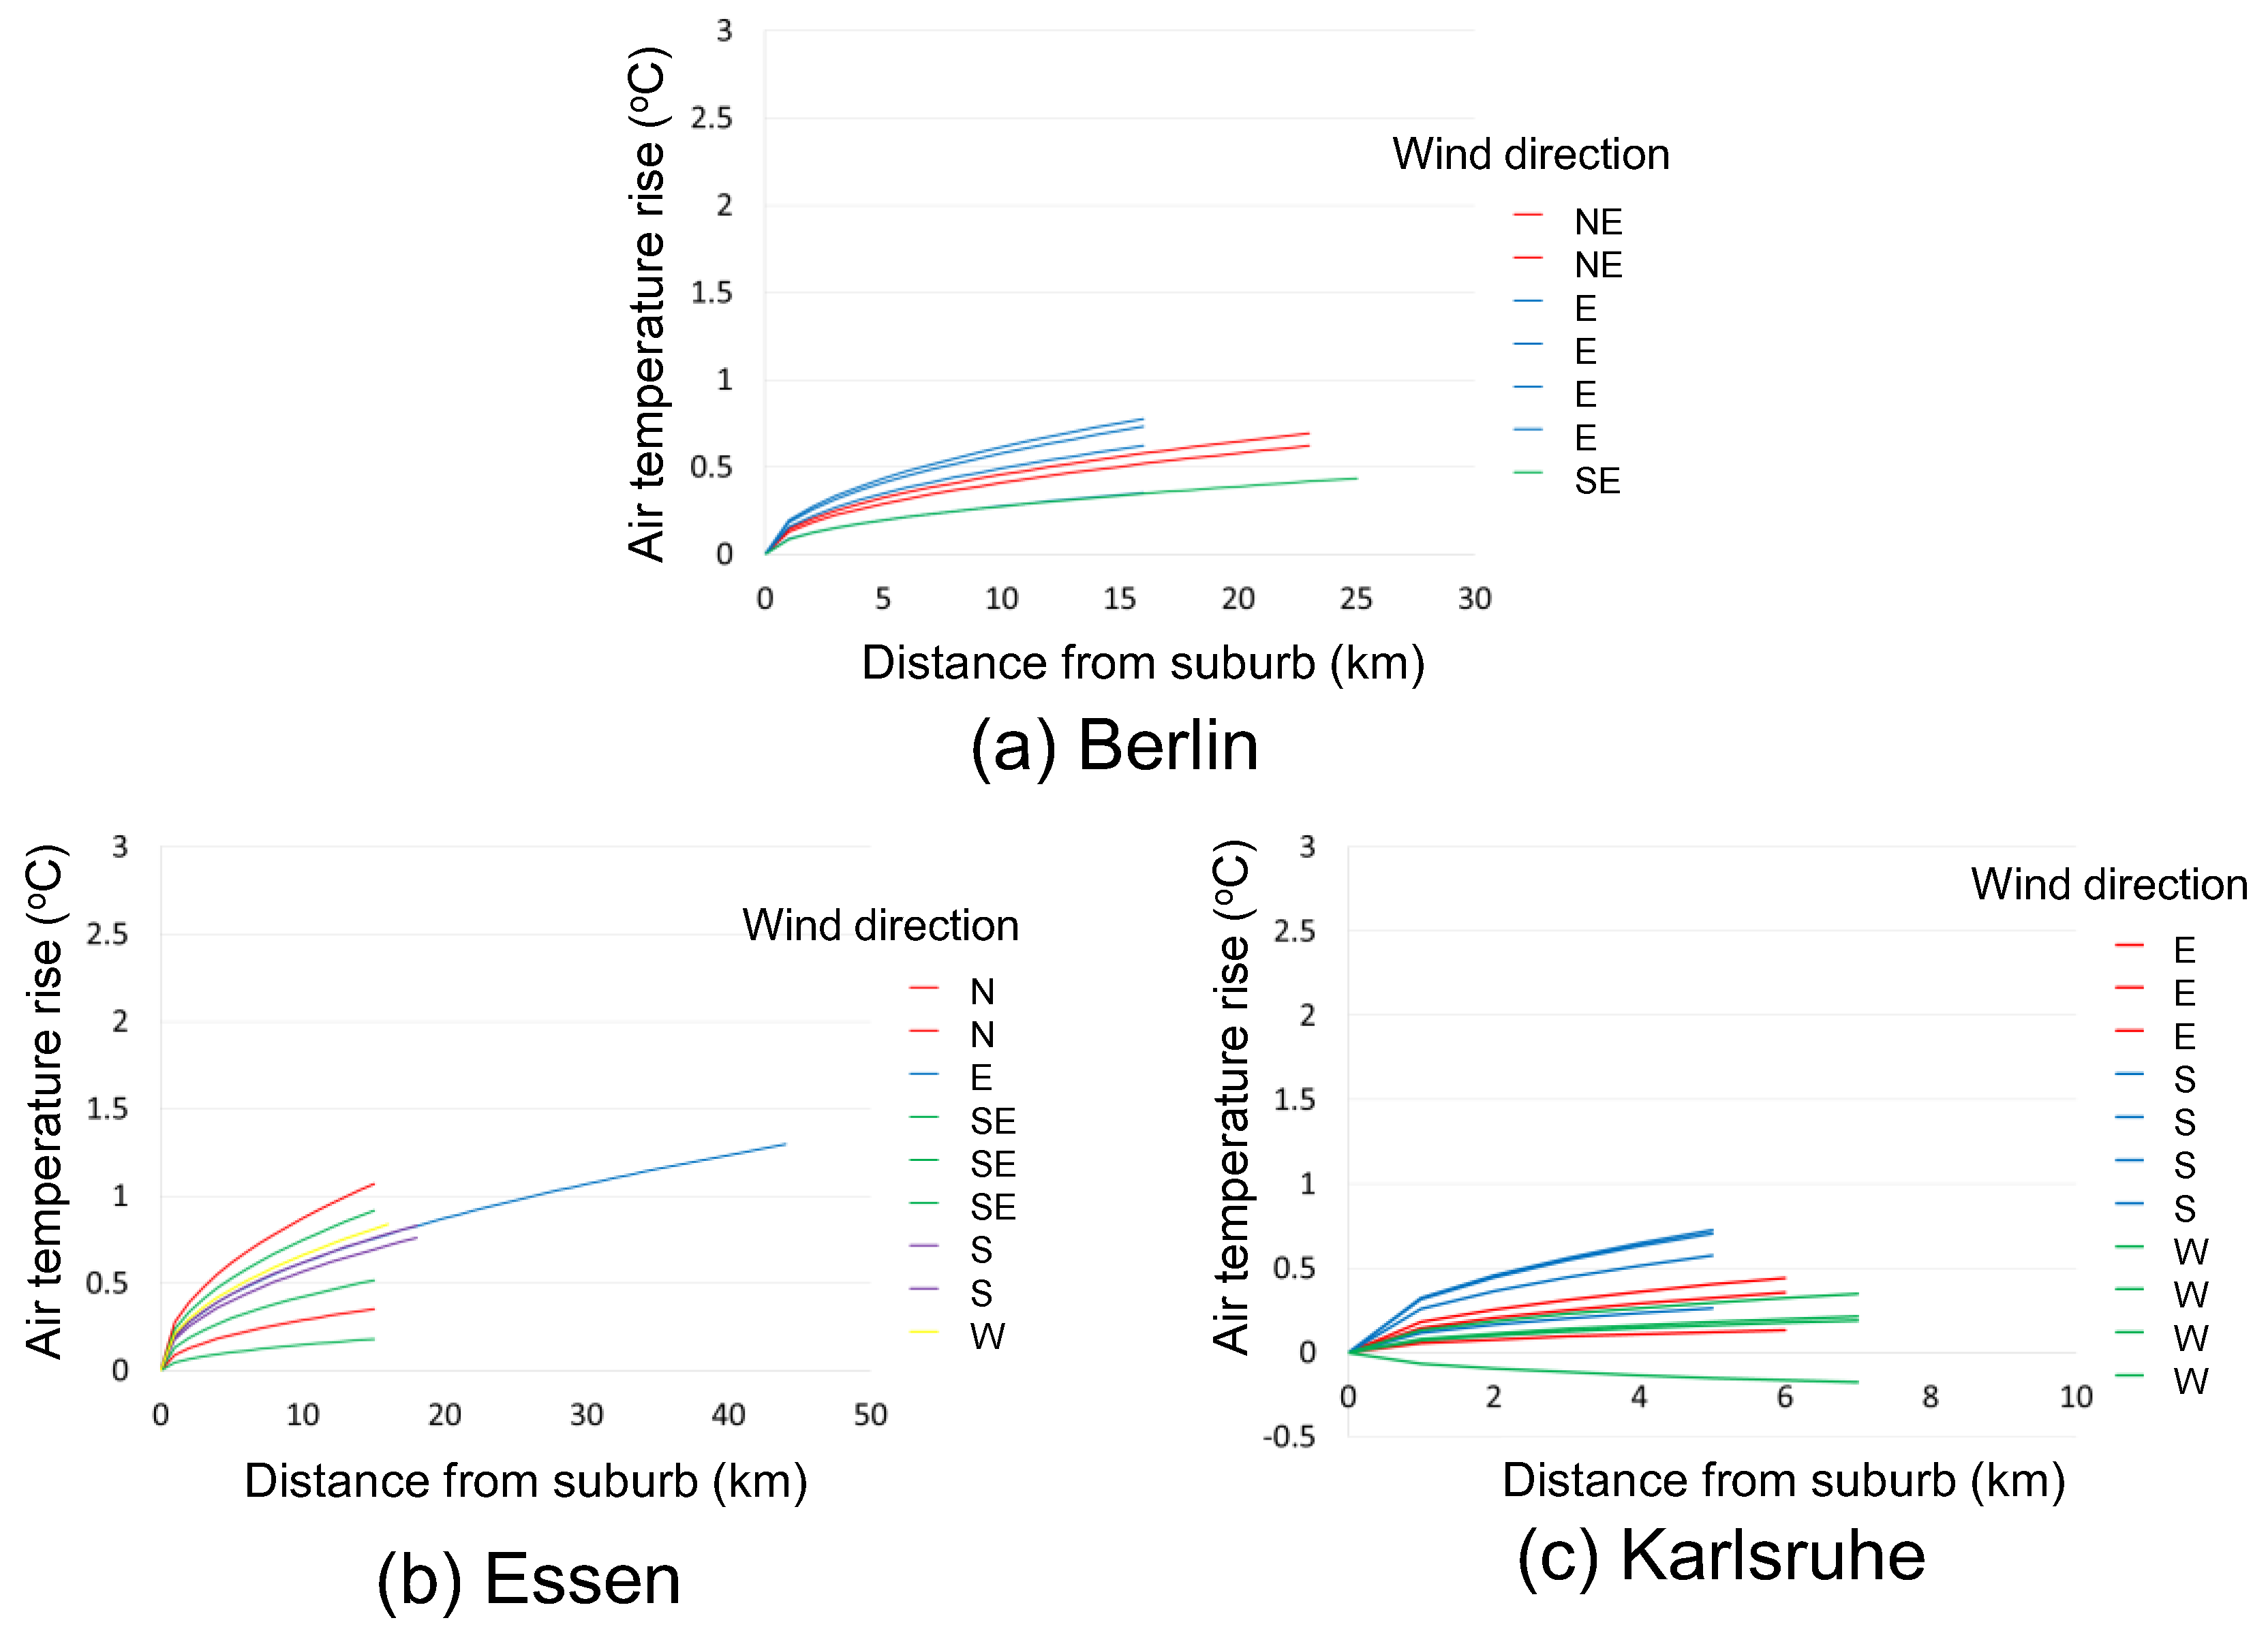
4. Analysis on Air Temperature Distribution

Air temperature distribution at 2 m height in Japanese cities, at 2:00 p.m., 25 August 2010 is shown in Figure 10. However, it is 7 August only in Sendai, due to weather condition. Air temperature was lower in the coastal areas and higher in the inland areas. Number of higher air temperature points in Tokyo was larger than those in the other cities, which are located mainly in the inland areas. Air temperature distribution at 2 m height at 2:00 p.m., in 25 July for Berlin and Karlsruhe, in 24 July for Essen, 2008 is shown in Figure 11. The time when maximum air temperature occurred was selected from the hottest period in Japan and Germany, respectively, based on statistical analysis of meteorological data measured on meteorological observatory. Air temperature was lower in the boundary areas with the suburbs and higher in inner urban areas. Although we selected for cities with relatively large and small metropolitan areas, since the metropolitan areas in Berlin and Essen are half or less of those in Osaka and Nagoya, it is difficult to confirm the trend of air temperature distribution in the urban area. It is especially difficult in Karlsruhe with a narrow metropolitan area. Relationship between distance from the coast and air temperature in Japanese cities at 2:00 p.m., 25 August 2010 is shown in Figure 12. In all five cities, as the distance from the coast increases, air temperature rises. The curve of air temperature rise varies in five cities. It is also different from day to day in a city. It is considered that the cause is the cloud amount during the night and the sea surface temperature during the day. In the previous study [15], we analyzed the relationship between wind velocity, altitude, and air temperature in the same way, but could not obtain higher correlation coefficients than those in Figure 12. Since the objective area is distinguished in only urban A, B, C, we cannot see the correlation with land use condition. Relationship between distance from the windward boundary with the suburbs and air temperature at 2:00 p.m., in 25 July for Berlin and Karlsruhe, in 24 July for Essen, 2008 is shown in Figure 13. In all three cities, as the distance from the suburb increased, air temperature rose.
The relationship between distance from the coast and air temperature at 14:00 averaged in fine weather conditions for Japanese cities is shown in Figure 14. Air temperature rise increases with distance from coast and they are nearly the same in Tokyo and Osaka. The number of higher air temperature points in Tokyo was larger than those in Osaka and Nagoya, which are located mainly in the inland areas. The heat island intensities of Osaka and Tokyo were almost the same at the same distance points from the coast regardless of different urban areas. There is no relationship between city size and air temperature rise. City size is indicated by the distance from the coast to the inland edge of each city as shown in Figure 14; Tokyo 60 km, Osaka and Nagoya 35–40 km, and Hiroshima and Sendai 20 km. In Hiroshima, the urban area is spread along coastal line as in Tokyo and Osaka, and the inland urban area is less than these cities, where air temperature is a little higher. As a result, the curve of air temperature rise in Hiroshima is smaller than those in Tokyo and Osaka.
Frequencies of air temperature at 2:00 p.m. on August 25 and 7, 2010 are shown in Figure 15. In these days, the cities indicated in the figure were fine and sea breeze condition. In Nagoya and Sendai, the number of urban land use in coastal areas is less than the other three cities, where air temperature is a little lower. As a result, air temperature difference between coastal and inland urban area is small and the curve of air temperature rise is smaller than those in Tokyo and Osaka. In Sendai, air temperature in the inland urban area is the same as in the other cities, but air temperature in the coastal urban area is a little lower than the other cities, due to an approximately 1-degree lower sea surface temperature influenced by the latitude. As a result, the air temperature difference between coastal and inland urban area is large and the curve of air temperature rise is larger than those in Tokyo and Osaka. As described above, coastal land use has a large influence on air temperature rise.

5. Discussion

Distance from boundary and air temperature rise in Tokyo, Osaka, Nagoya, Berlin, Essen, and Karlsruhe is shown in Figure 16. Air temperature rises in three German cities are almost the same as that in Nagoya. The development of the urban boundary layer is expressed by following equation (1), if the advection by the sea breeze is dominant, as a function of the distance from the boundary L (m). Air temperature distribution is affected by a wider range of pressure systems; however, since air temperature distribution only in the urban area is focused in this study, this equation is assumed.
Δ T = 2 ( 1 + k ) H L α C p ρ U
where k is the ratio of entrainment (0 to 1), H is the sensible heat flux from the ground surface (W/m2), which is calculated reflecting the advection effect on upper air by the sea breeze, α is air temperature gradient (K/m), Cp is the specific heat of air (=1000 J/(kgK)), ρ is air density (=1.2 kg/m3), and U is wind velocity (m/s). Assuming α = 0.006 (K/m), it becomes
Δ T = ( 0.0032 0.0045 ) H / U   L
Assuming H = 150 (W/m2), U = 5 (m/s), it becomes
Δ T = ( 0.55 0.78 ) x
where x (= 1000 L) is the distance from the boundary (km). Air temperature rises in Tokyo and Osaka are almost consistent with Equation (3). Approximate curves of air temperature rise of each day in fine days in German cities are shown in Figure 17. Although the distance from the inflow boundary to the outflow points in urban area differs according to the wind direction, they are almost 15 km in Berlin and Essen, and 5 km in Karlsruhe. In three German cities, the urban boundary layer may not develop sufficiently because the fetch distance is insufficient.

6. Conclusions

The relationship between city size, coastal land use, and air temperature rise with distance from coast during summer day is analyzed using the meso-scale weather research and forecasting (WRF) model in five coastal cities in Japan with different sizes and coastal land use (Tokyo, Osaka, Nagoya, Hiroshima, and Sendai). In addition, the similar analysis is carried out for inland cities (Berlin, Essen, and Karlsruhe in Germany). Air temperature increased as distance from the coast/the suburb increased, reached its maximum, and then decreased slightly. Air temperature increases with distance from coast and they are nearly the same in Tokyo and Osaka. The number of higher air temperature points in Tokyo was larger than those in Osaka and Nagoya, which are located mainly in the inland areas. The heat island intensities of Osaka and Tokyo were almost the same at the same distance points from the coast regardless of different urban areas. There is no relationship between city size and air temperature rise. In Nagoya and Sendai, the number of urban land use in coastal areas is less than the other three cities, where air temperature is a little lower. As a result, air temperature difference between coastal and inland urban area is small and the curve of air temperature rise is smaller than those in Tokyo and Osaka. In Sendai, air temperature in the inland urban area is the same as in the other cities, but air temperature in the coastal urban area is a little lower than the other cities, due to an approximately one-degree lower sea surface temperature influenced by the latitude. Coastal land use has an influence on air temperature rise. In three German cities, the urban boundary layer may not develop sufficiently because the fetch distance is not enough.
To summarize the above, in cities such as Tokyo and Osaka that have sufficiently large urban areas, the urban boundary layer develops from the windward boundary, and it is possible to explain air temperature distribution according to the distance from the boundary. However, it is difficult to confirm the development of the urban boundary layer in cities such as Nagoya, Hiroshima, Sendai and German cities where urban areas are not well developed. Analysis presented in this study is effective for cities with large metropolitan areas where air temperature distribution occurs within the urban land use. In that case, it is possible to discuss the thermal mitigation strategy by assuming air temperature rise with the half power of the distance from the boundary as an index. At present, discussions on adaptation measures to the extremely hot temperature influenced by heat waves are drawing attention around the world. It is often directed to a high temperature during the daytime, discussion on air temperature distribution influenced not only by land use, but advection would also be effective for situations such as this study.

Author Contributions

H.T. supervised the entire study. T.T. analyzed mainly in Hiroshima city. M.M. analyzed mainly in Tokyo and Nagoya cities. H.W. analyzed mainly in Sendai city. H.M. analyzed mainly in Osaka city. K.K. analyzed mainly in German cities.

Funding

This work was supported by JSPS KAKENHI grant number 16H04464.

Conflicts of Interest

The authors declare no conflict of interest.

References

  1. Oke, T.R. City size and the urban heat island. Atmos. Environ. 1973, 7, 769–779. [Google Scholar] [CrossRef]
  2. Fukuoka, Y. Physical climatological discussion on causal factors of urban temperature. Mem. Fac. Integr. Arts Sci. Hiroshima Univ. 1983, IV, 157–178. [Google Scholar]
  3. Park, H.C. Features of the heat island in Seoul and its surrounding cities. Atmos. Environ. 1986, 20, 1859–1866. [Google Scholar] [CrossRef]
  4. Sakakibara, Y.; Kitahara, Y. Relationship between Population and Heat Island Intensity in Japanese Cities. Tenki 2003, 50, 625–633. [Google Scholar]
  5. Skamarock, W.C.; Klemp, J.B.; Dudhia, J.; Gill, D.O.; Barker, D.M.; Duha, M.G.; Huang, X.Y.; Wang, W.; Powers, J.G. A description of advanced research WRF version 3. NCAR/TN-475+STR 2008. [Google Scholar] [CrossRef]
  6. Iizuka, S.; Xuan, Y.; Kondo, Y. Impacts of disaster mitigation/prevention urban structure models of future urban thermal environment. Sustain. Cities Soc. 2015, 19, 414–420. [Google Scholar] [CrossRef]
  7. Kusaka, H.; Iijima, N.; Ihara, T.; Hara, M.; Takane, Y.; Iizuka, S. Future projection of heat stroke and sleep disturbance for 2070’s August in Tokyo, Nagoya, and Osaka, Dynamical downscale experiments from multiple CMIP3-GCMs and health impact assessment by mid-point type methodology. J. Environ. Eng. AIJ 2013, 693, 873–881. [Google Scholar] [CrossRef]
  8. Moriyama, M.; Inui, Y.; Takebayashi, H. Study on Thermal Environmental Mitigation Effects Caused by Changes of Urban Form on a Large Scale Area. In Proceedings of the 7th Japanese-German Meeting on Urban Climatology, Hannover, Germany, 6–10 October 2014. [Google Scholar]
  9. Takebayashi, H.; Moriyama, M. Urban heat island phenomena influenced by sea breeze. AIJ J. Technol. Des. 2005, 21, 199–202. (In Japanese) [Google Scholar] [CrossRef]
  10. Kusaka, H.; Kimura, F.; Hirakuchi, H.; Mizutori, M. The effects of land-use alternation on the sea breeze and daytime heat island in the Tokyo metropolitan area. J. Meteorol. Soc. Japan 2000, 78, 405–420. [Google Scholar] [CrossRef]
  11. Yamamo, H.; Mikami, T.; Takahashi, H. Impact of sea breeze penetration over urban areas on midsummer temperature distributions in the Tokyo metropolitan area. Int. J. Climatol. 2017, 37, 5154–5169. [Google Scholar] [CrossRef]
  12. Hardin, A.W.; Liu, Y.; Gao, G.; Vanos, J.K. Urban heat island intensity and spatial variability by synoptic weather type in the northeast U.S. Urban Clim. 2018, 24, 747–762. [Google Scholar] [CrossRef]
  13. Kusaka, H.; Kondo, H.; Kikegawa, Y.; Kimura, F. A simple single-layer urban canopy model for atmospheric models, Comparison with multi-layer and slab models. Bound. Layer Meteorol. 2001, 101, 261–304. [Google Scholar] [CrossRef]
  14. Kitao, N.; Moriyama, M.; Nakajima, S.; Tanaka, T.; Takebayashi, H. The characteristics of urban heat island based on the comparison of temperature and wind field between present land cover and potential natural land cover. In Proceedings of the Seventh International Conference on Urban Climate, Yokohama, Japan, 29 June–3 July 2009. [Google Scholar]
  15. Takebayashi, H.; Senoo, M. Analysis of the relationship between urban size and heat island intensity using WRF model. Urban Clim. 2018, 24, 287–298. [Google Scholar] [CrossRef]
Figure 1. Objective study areas in Tokyo, Osaka, Nagoya, Hiroshima, and Sendai (Domain 1: 3 km grid, 360 km square, Domain 2: 1 km grid, 103 km square).
Climate 06 00084 g001
Figure 2. Objective study areas in Berlin, Essen, and Karlsruhe (Domain 1: 3 km grid, 360 km square, Domain 2: 1 km grid, 103 km square).
Climate 06 00084 g002
Figure 3. Land use conditions and number of urban meshes in (a) Tokyo, (b) Osaka, (c) Nagoya, (d) Hiroshima, and (e) Sendai (1 km grid, 103 km square).
Climate 06 00084 g003
Figure 4. Land use conditions and number of urban meshes in (a) Berlin, (b) Essen, and (c) Karlsruhe (1 km grid, 103 km square).
Climate 06 00084 g004
Figure 5. Frequency of urban land use at each distance point from the coast.
Climate 06 00084 g005
Figure 6. Position of measurement sites in (a) Tokyo, (b) Osaka, (c) Nagoya, (d) Hiroshima, and (e) Sendai (103 km square).
Climate 06 00084 g006
Figure 7. Position of measurement sites in (a) Berlin, (b) Essen, and (c) Karlsruhe (103 km square).
Climate 06 00084 g007
Figure 8. Comparison of observed and calculated period average air temperatures at the (a) Tokyo, (b) Osaka, (c) Nagoya, (d) Hiroshima, and (e) Sendai observatories.
Climate 06 00084 g008
Figure 9. Comparison of observed and calculated period average air temperatures at the (a) Berlin, (b) Essen, and (c) Karlsruhe observatories.
Climate 06 00084 g009
Figure 10. Air temperature distribution at 2 m height in Japanese cities (103 km square). (a) Tokyo, (b) Osaka, (c) Nagoya, (d) Hiroshima, and (e) Sendai.
Climate 06 00084 g010
Figure 11. Air temperature distribution at 2 m height in German cities (103 km square). (a) Berlin, (b) Essen, and (c) Karlsruhe.
Climate 06 00084 g011
Figure 12. Relationship between distance from the coast and air temperature in Japanese cities. (a) Tokyo, (b) Osaka, (c) Nagoya, (d) Hiroshima, and (e) Sendai.
Climate 06 00084 g012
Figure 13. Relationship between distance from the suburb and air temperature in German cities. (a) Berlin, (b) Essen, and (c) Karlsruhe.
Climate 06 00084 g013
Figure 14. Relationship between distance from the coast and air temperature at 2:00 p.m. averaged in fine weather condition for Japanese cities.
Climate 06 00084 g014
Figure 15. Frequencies of air temperature at 14:00 on August 25 (left) and 7 (right), 2010.
Climate 06 00084 g015
Figure 16. Distance from boundary and air temperature rise in Tokyo, Osaka, Nagoya, Berlin, Essen, and Karlsruhe.
Climate 06 00084 g016
Figure 17. Approximate curves of air temperature rise of each day in fine days in German cities. (a) Berlin, (b) Essen, and (c) Karlsruhe.
Climate 06 00084 g017
Table 1. Calculation conditions for WRF model.
For Japanese CitiesFor German Cities
PeriodAugust 1–31, 2010July 23–August 23, 2008
Vertical grid28 layers (surface - 100 hPa)
Horizontal gridDomain 1: 3 km (120 x 120 grids), Domain 2: 1 km (103 x 103 grids)
Meteorological dataJMA: Meso-scale analysis
(3 hourly, 10 km gird, 20 layer)
NCEP: final analysis (6 hourly, 1 degree grid, 17 layer)
Geographical dataTerrain heightDigital map (50 x 50 m resolution)United states geological survey (about 100 x 100 m resolution)
Land useDigital national land information
(about 100 x 100 m resolution) + NVI
Microphysics processPurdue Lin et al. scheme
Radiation processLong waveRRTM long wave scheme
Short waveDudhia short wave scheme
Planetary boundary layer processMellor–Yamada–Janjic PBL scheme
Surface processUrban areaUCM (urban canopy model)
Non-urban areaNoah LSM
Cumulus parameterizationNone
Four-dimensional data assimilationNone
Table 2. Calculation accuracies of air temperature and wind velocity for Japanese cities.
Air TemperatureWind Velocity
Measurement siteBias (°C)RMSE (°C)CorrelationBias (m/s)RMSE (m/s)Correlation
Tokyo
area
Tokyo0.500.720.92−0.380.540.78
Nerima0.720.790.921.741.850.63
Fuchu1.802.140.900.010.720.70
Saitama1.131.190.910.410.720.69
Tsukuba0.820.880.940.730.950.74
Chiba−0.240.280.90−0.971.030.78
Osaka
area
Osaka0.200.310.92−0.130.430.67
Kobe0.300.450.89−1.141.190.59
Sakai0.401.150.910.280.710.58
Toyonaka0.430.540.91−0.180.520.62
Yao0.920.980.92−0.710.920.56
Hirakata0.420.630.870.860.940.47
Nagoya
area
Nagoya0.710.800.90−0.460.560.64
Tokai0.240.480.890.971.020.53
Aisai−0.180.320.931.371.520.62
Toyota0.590.750.930.420.580.33
Gifu0.971.010.90−0.290.400.64
Tajimi0.470.840.930.460.590.53
Hiroshima
area
Hiroshima0.010.020.91−0.560.770.56
Kure−0.050.060.930.040.550.59
Otake0.050.050.86−0.700.740.41
Higashi hiroshima−0.080.080.94−0.500.770.30
Miiri0.030.030.89−1.381.680.01
Sendai
area
Sendai−0.030.040.90−0.190.440.46
Watari−0.060.060.81−0.360.620.31
Shiogama0.471.080.911.381.450.32
Zao−0.020.040.83−0.820.900.12
Ishinomaki−0.050.060.83−0.740.820.57
Table 3. Calculation accuracies of air temperature and wind velocity for German cities.
Air TemperatureWind Velocity
Measurement siteBias (°C)RMSE (°C)CorrelationBias (m/s)RMSE (m/s)Correlation
Berlin
area
Alexanderplatz0.110.610.93---
Buch−0.300.580.93---
Dahlem1.441.840.94---
Marzahn0.470.730.93---
Tegel0.590.780.941.291.350.84
Tempelhof0.730.840.940.971.080.82
Neuruppin−0.151.270.902.082.140.79
Potsdam−0.741.880.910.860.900.74
Zehdenick−0.280.950.91---
Heckelberg0.020.940.91---
Essen
area
Bochum−0.150.730.87---
Borken in Westfalen−0.531.840.90---
Essen-Bredeney0.470.760.921.371.400.74
Toenisvorst−0.690.950.92---
Wuppertal-Buchenhofen1.191.340.91---
Remscheid−0.560.820.90---
Luedinghausen-Brochtrup−0.820.920.92---
Duisburg-Baerl−1.001.320.91---
Waltrop-Abdinghof−0.120.450.92---
Gevelsberg-Oberbroeking−0.600.880.90---
Karlsruhe
area
Bergzabern-Ba−1.631.700.91---
Heidelberg−2.933.000.91---
Kaiserslautern−0.991.150.93---
Karlsruhe−1.601.730.92−0.540.610.73
Pforzheim-Ispringen−0.130.720.920.460.660.61
Rheinau-Memprechtshofen−0.440.710.91---
Neubulach-Oberhaugstett0.120.940.91---

