Article

GPS Precipitable Water Vapor Estimations over Costa Rica: A Comparison against Atmospheric Sounding and Moderate Resolution Imaging Spectrometer (MODIS)

by
Polleth Campos-Arias
1,
Germain Esquivel-Hernández
1,*,
José Francisco Valverde-Calderón
2,
Stephanie Rodríguez-Rosales
2,
Jorge Moya-Zamora
2,
Ricardo Sánchez-Murillo
1 and
Jan Boll
3
1
Stable Isotope Research Group, School of Chemistry, Universidad Nacional, Heredia 86-3000, Costa Rica
2
School of Topography, Surveying, and Geodesy, Universidad Nacional, Heredia 86-3000, Costa Rica
3
Department of Civil and Environmental Engineering, Washington State University, Pullman, WA 99164, USA
*
Author to whom correspondence should be addressed.
Climate 2019, 7(5), 63; https://doi.org/10.3390/cli7050063
Submission received: 20 February 2019 / Revised: 3 April 2019 / Accepted: 5 April 2019 / Published: 3 May 2019
(This article belongs to the Special Issue Climate and Atmospheric Dynamics and Predictability)

Abstract

:
The quantification of water vapor in tropical regions like Central America is necessary to estimate the influence of climate change on its distribution and the formation of precipitation. This work reports daily estimations of precipitable water vapor (PWV) using Global Positioning System (GPS) delay data over the Pacific region of Costa Rica during 2017. The GPS PWV measurements were compared against atmospheric sounding and Moderate Resolution Imaging Spectrometer (MODIS) data. When GPS PWV was calculated, relatively small biases between the mean atmospheric temperatures (Tm) from atmospheric sounding and the Bevis equation were found. The seasonal PWV fluctuations were controlled by two of the main circulation processes in Central America: the northeast trade winds and the latitudinal migration of the Intertropical Convergence Zone (ITCZ). No significant statistical differences were found for MODIS Terra during the dry season with respect GPS-based calculations (p > 0.05). A multiple linear regression model constructed based on surface meteorological variables can predict the GPS-based measurements with an average relative bias of −0.02 ± 0.19 mm/day (R2 = 0.597). These first results are promising for incorporating GPS-based meteorological applications in Central America where the prevailing climatic conditions offer a unique scenario to study the influence of maritime moisture inputs on the seasonal water vapor distribution.

1. Introduction

Although it constitutes only 0.001% of the planet’s water resources, water vapor plays an important role in atmospheric processes as it is one of the major radiative gases and a dynamic element in the atmosphere. Water vapor is a useful parameter to forecast severe weather conditions and precipitation formation and is also a key factor for studying the global water cycle, changing climatic conditions, and earth-atmosphere energy exchange [1,2,3]. Overall, water vapor is essential for the development of disturbed weather and influences the planetary radiative balance. In the lower atmosphere, it controls the heat exchange during the precipitation formation and the thermal structure of the troposphere, and it is the main source for precipitation in all weather systems [3,4]. Therefore, accurate estimates of atmospheric water vapor content are needed to improve the predictability of rainfall and the understanding of and feedback in climate related processes [5,6].
A quantifiable parameter useful for studying water vapor is the precipitable (or integrated) water vapor (PWV). Precipitable water vapor mainly comprises tropospheric water vapor and the less abundant stratospheric water and can be used to analyze water vapor variability and its contributions to climate change [6]. The classical approach to gather information about PWV is using atmospheric sounding based on radiosonde profiles [7]. However, due to high costs, radiosonde networks lack spatial and temporal resolutions and, thus, provide limited information to carry out detailed studies of weather and climate. For example, radiosondes are usually launched 1–2 times per day in monitoring stations spaced several hundred kilometers from each other. In recent years, the fast development of ground-based GPS networks allows a new source of water vapor information. As atmospheric water changes the atmospheric refractivity, satellite-receiver path delays provide a unique information on the total water vapor within the troposphere and stratosphere. Therefore, GPS has become a standard technique for measuring PWV with some noticeable advantages over radiosondes. For instance, GPS can be used in all weather conditions and has low operation costs, allowing for a high temporal resolution with numerous records throughout the daytime and nighttime [8,9,10]. In Costa Rica, there are 14 Global Navigation Satellite System (GNSS) stations in operation which are associated with the Sistema de Referencia Geocéntrico para las Américas (SIRGAS) network. Eight of these GNSS stations are officially administrated by the National Institute of Geography. Although there are other GPS stations operating in the country, access to these GPS data is rather limited.
Satellite remote sensing is also a feasible method to derive the PWV distribution. The Moderate Resolution Imaging Spectroradiometer (MODIS) installed at the Terra and Aqua satellites offers spatial and temporal PWV estimations [11,12]. Despite the high spatial coverage and resolution that these satellite-based PWV products offer, there are several sources of errors in water vapor column retrievals from these remote sensing platforms. These errors are mainly linked to an uncertainty in the spectral reflectance of the surface, an uncertainty in the sensor calibration, an uncertainty in the atmospheric temperature and moisture profile, and an uncertainty in the amount of haze [13,14]. Moreover, there are two other additional limitations related to a polar orbiting satellite like MODIS: i) most areas are sampled only once per day, depending on the latitude and the configuration of the instrument, and ii) the measurements are mainly restricted to cloud-free areas (especially during daytime) as clouds are opaque in the visible and NIR spectrum [15]. Unlike satellite-based water vapor estimations, the presence of clouds and precipitation does not affect GPS observations because the liquid water contribution to the refractivity is normally small, especially outside of clouds [16]. In order to assess the performance of satellite measurements, their PWV estimates have been evaluated against other conventional techniques (e.g., GPS PWV measurements) in several regions, for instance in China, in Spain, and in Tibet [6,9,12]. Nevertheless, limited knowledge exists for the Central American Isthmus regarding the application of remote sensing for PWV measurements and how well GPS delay data compare to classical water vapor measurements made by atmospheric sounding in complex tropical mountainous regions like those found in Costa Rica.
In this study, the objectives were i) to evaluate the GPS-based estimates of PWV against PWV based on radiosonde measurements and on the MODIS satellite radiometer, ii) to estimate the influence of the main circulation patterns in Costa Rica on the PWV variability using GPS-based estimations, and iii) to identify major meteorological variables controlling PWV seasonal variations. We selected two GPS stations located in the Pacific region of Costa Rica to calculate the mean daily PWV estimates during 2017. These GPS-based estimations were then compared to PWV measurements made using radiosondes at the only atmospheric sounding site in operation in Costa Rica, located in the Central Valley of the country. We further compared data from the MODIS satellite radiometer against the GPS and radiosonde estimations over the Central Valley of Costa Rica. GPS PWV estimates were also analyzed in combination with surface meteorological data and the Hybrid Single Particle Lagrangian Integrated Trajectory (HYSPLIT) model. We expect that this work will contribute to highlighting the opportunity of incorporating GPS-based meteorological applications in Central America, which can be useful to study the influence of maritime moisture inputs from the Caribbean Sea and Pacific Ocean on the seasonal water vapor distribution.

2. Materials and Methods

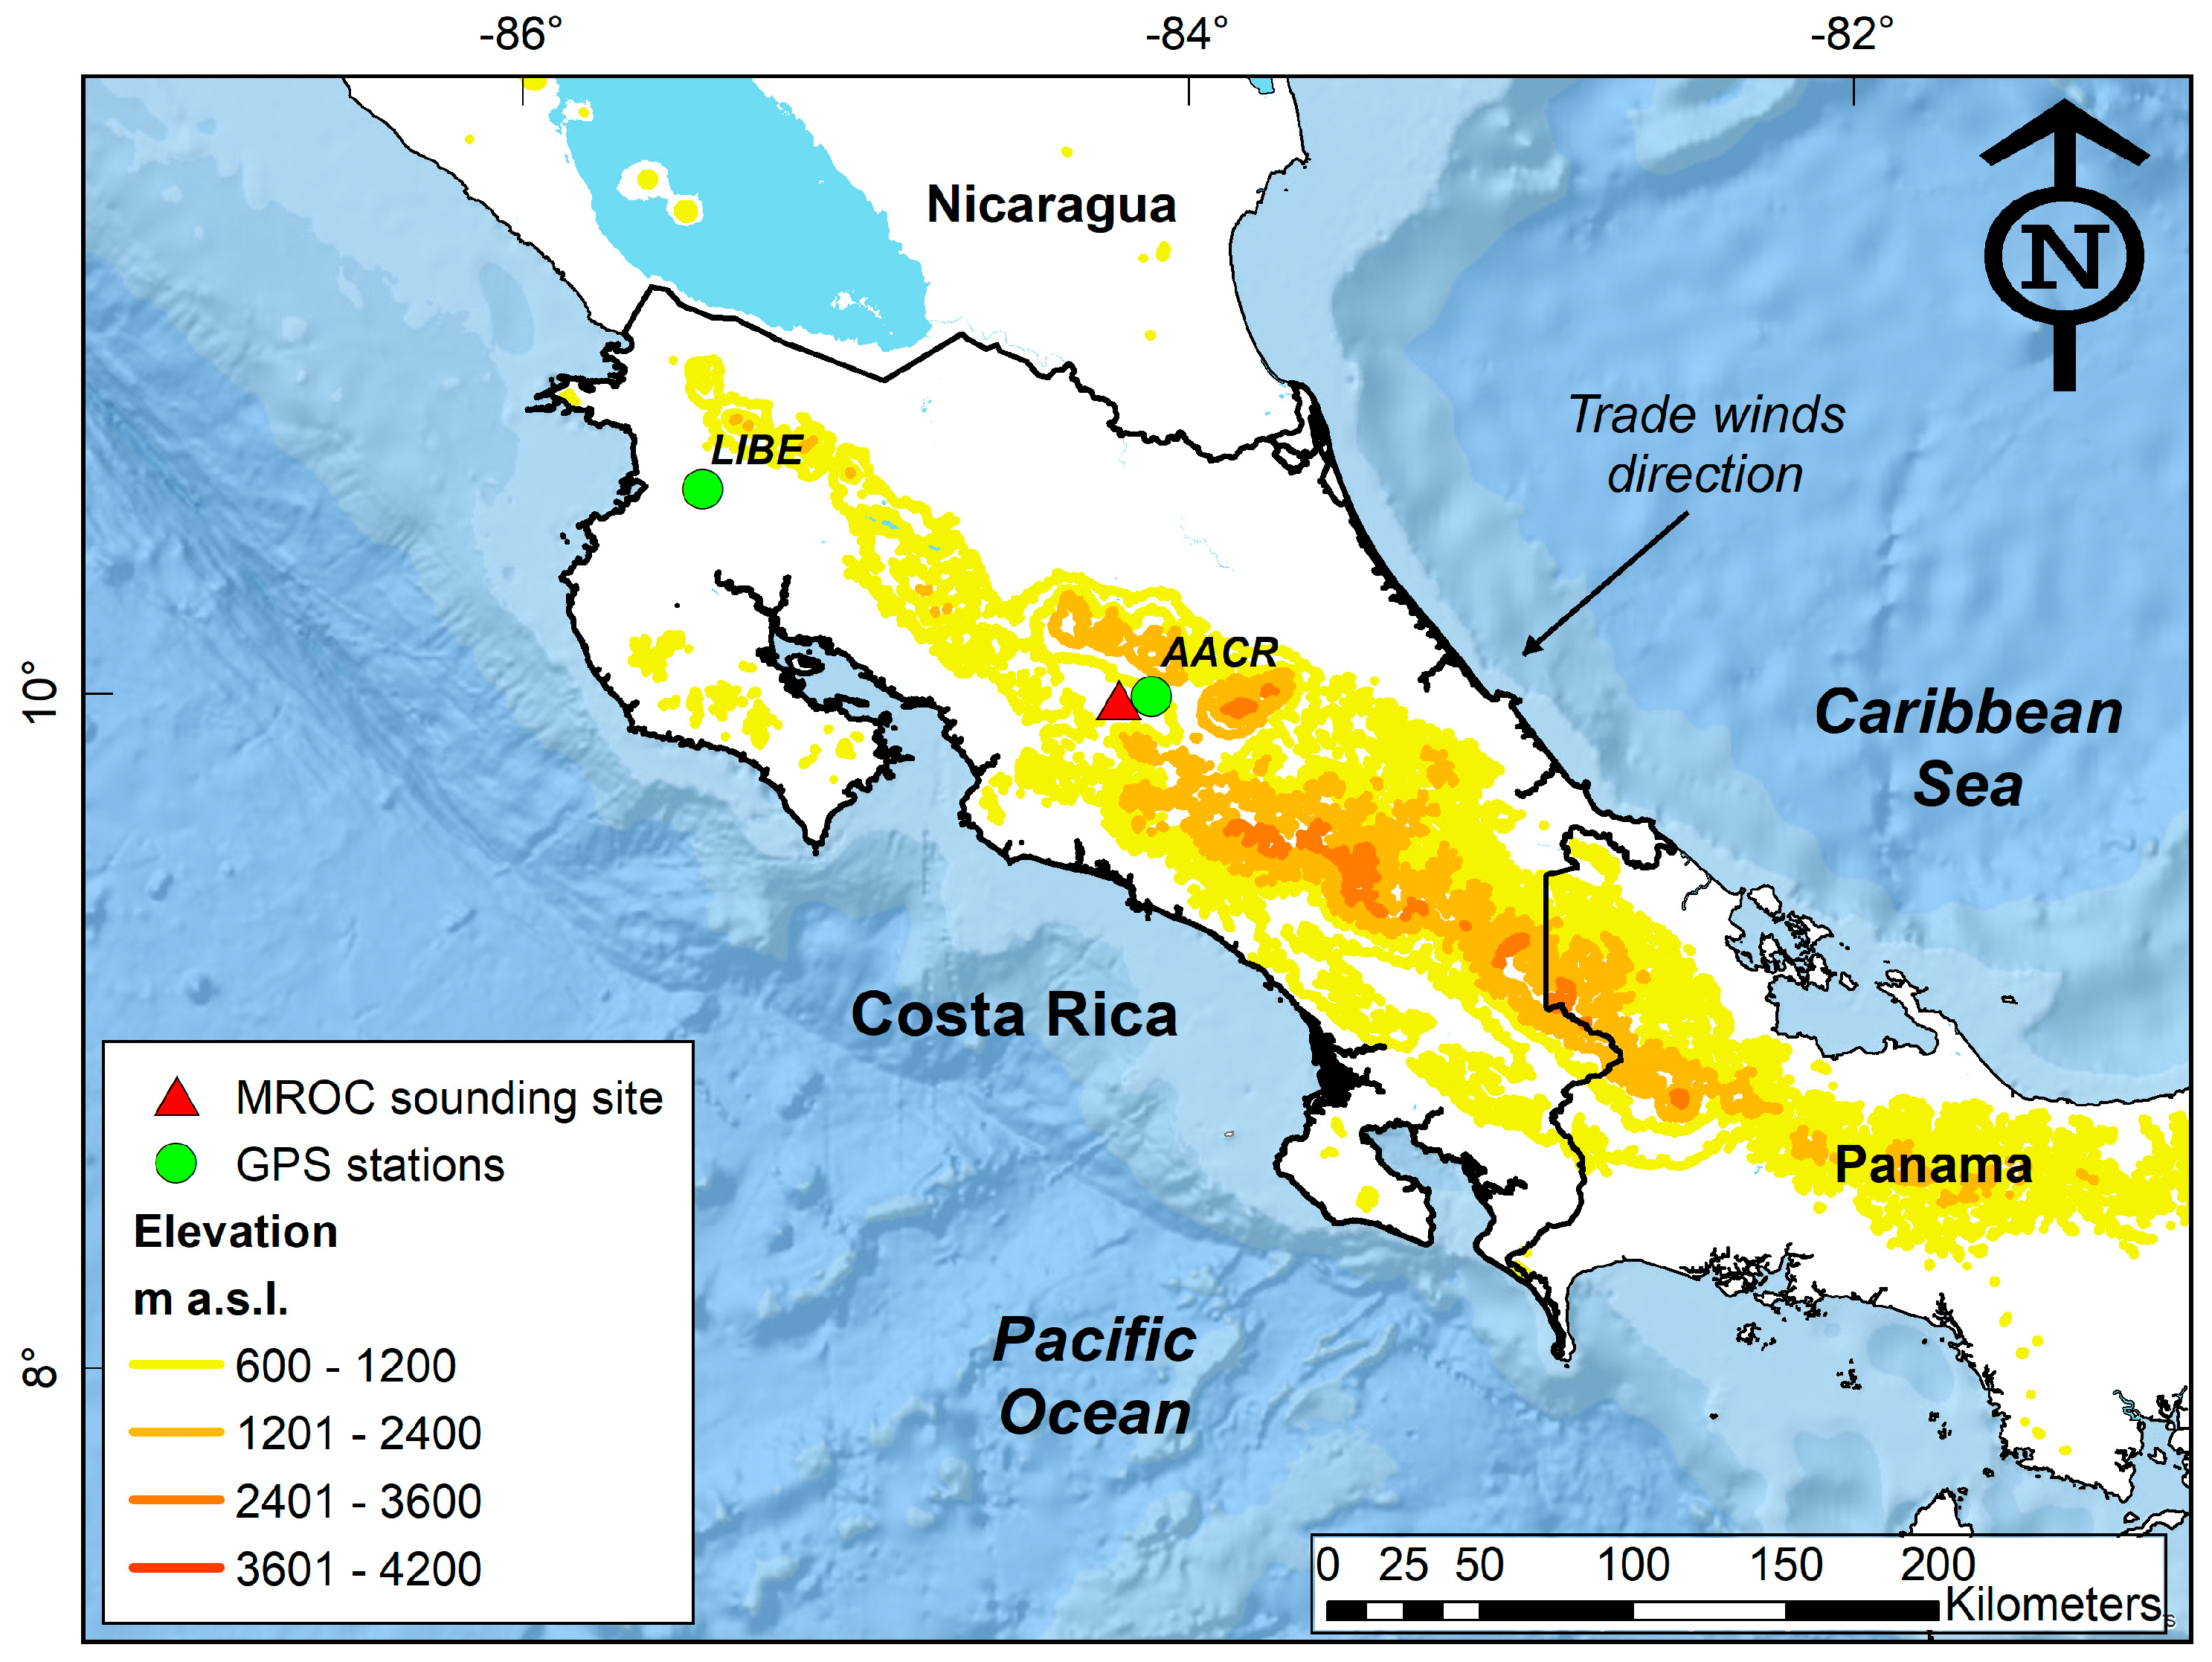
2.1. Climatic Characteristics of Costa Rica

Costa Rica is located in the tropics between 8°–11°N latitude and 82°–86°W longitude (Figure 1). The climate of Costa Rica is influenced by four regional air circulation types: NE trade winds, the latitudinal migration of the Intertropical Convergence Zone (ITCZ), cold continental outbreaks, and the sporadic Caribbean cyclones [17,18,19]. Strong orographic effects are caused by a NW to SE mountain range (or cordillera) with a maximum elevation of 3820 m above sea level (m a.s.l.), which divides the country into the Caribbean and Pacific regions, each region having a distinct precipitation regime. In the Pacific region of Costa Rica, the dry season ranges from December to April and the wet season ranges from May to November. There is a secondary humidity gradient along the Pacific coast where wetness increases from north to south [20,21]. The observed cyclic deviations in the ocean-atmosphere domain can be described as “wet” and “dry” years throughout Costa Rica and are mainly linked to changes in the sea surface temperature (SST), especially the warm/cold El Niño Southern Oscillation (ENSO) episodes [17,22].

2.2. GPS and Atmospheric Sounding Data

As stated above, there are 14 GNSS stations in operation in Costa Rica, which are associated with the SIRGAS network. We selected GPS data from two of these stations to estimate PWV: one located in the Central Valley (AACR) and one situated in the northern Pacific (Liberia or LIBE). As shown in Figure 1, AACR is located in the mountainous central region of the country known as the Central Valley and LIBE is situated on the northern Pacific region. We selected these two stations based on three criteria: i) at least one station must be as near as possible to an atmospheric sounding site (AACR), ii) at least one additional station must be included in the analysis and situated in the Pacific slope of the country (the climatic region where the Central Valley is located, LIBE), and iii) for each station, a weather station must be available to register the meteorological conditions, with no significant height differences between the GPS station and the weather station.
The GPS data were processed by the National Processing GNSS Data Center. The receiver and antenna types at AACR were Topcon TPS NET-G3A and Topcon TPSCR.G3 TPSH, respectively. At LIBE, the receiver and antenna model were Leica GRX 1200 + GNSS and Leica AT504GG LEIS respectively. GPS data were processed using the software GIPSY, version 6.4 from JPL [23], using the Precise Positioning Point (PPP) method based on the precise ephemerides computed by JPL. The parameters for the satellite and receiver antenna phase center calibration were set according to the JPL products. The tropospheric model incorporated a priori hydrostatic delay (PHD, m), computed as follows:
PHD = 1.013 2.27 e ( 0.00016 h ) ,
where h is the station height (m) above the ellipsoid. The PHD value was estimated as 0.1 m. The tropospheric gradient was estimated based Bar-Sever et al. [24]. The global mapping function (GMF) troposphere mapping functions were implemented, and an elevation cutoff angle was set at 7.5°.
The observations of AACR and LIBE stations were available from January 1st to December 31st, 2017. To obtain PWV radiosonde estimations, we used the only atmospheric sounding site in operation in Costa Rica, namely the International Airport of San José, Costa Rica (International Civil Aviation Organization code: MROC). The radiosonde launching was carried out by the National Meteorological Institute of Costa Rica using mainly Sprenger E085 (St. Andreasberg, Germany) sounding systems. The radiosonde data were obtained from the University of Wyoming [25]. The distances and elevation differences between the GPS stations and the atmospheric sounding site are summarized in Table 1. In situ meteorological observations were measured with a Vantage Pro2 weather station (Davis Instruments, Hayward, CA, USA), with no significant height difference between the GPS stations and the weather monitoring sites.

2.3. GPS Data Processing

In general, GPS data processing is based on the physics of the atmospheric propagation delay. GPS radio waves are delayed by the ionosphere and troposphere when they travel through the atmosphere from the satellite to GPS ground-receivers. The so-called “total or zenith atmospheric delay” (or ZTD, in millimeters) of the signal emitted by a GPS satellite consists of two parts, “hydrostatic delay” or ZHD and “wet delay” or ZWD:
ZTD = ZHD + ZWD
Overall, the ZHD is due to the effect of dry air, contributing to at least 90% of the total tropospheric delay, whereas the ZWD represents less than 10% of the signal. Therefore, the ZTD depends on the air mass between the receiver and satellite and can be expressed as a function of ground atmospheric pressure [26,27,28]:
ZHD = 0.002277   P surf 1 0.00266 cos ( 2   θ ) 0.00028 H site ,
where Psurf is the surface pressure (hPa), θ the geodetic latitude, and Hsite represents the height (km) above the geoid [26]. Once the ZHD is calculated, ZWD is estimated by subtracting ZHD from ZTD.
Overall, the computation of ZWD using GPS delay is commonly related to the precipitable or integrated humidity along the altitudinal profile over the local atmosphere (known as GPS PWV). GPS PWV represents the total mass of water vapor in an atmospheric column with a unit area and is measured in kg/m2, but it is usually reported as the height of an equivalent column of liquid water in millimeters [26,29]. We used the Bevis relationship to estimate GPS PWV using ZWD [8]:
PWV = kZWD ,   k = 10 6 ( k 3 T m + k 2 ) R v ρ ,
where k is a dimensionless water vapor conversion coefficient. In Equation (4), k3 and k’2 are empirical constants [30], Rv is the specific gas constant for water vapor, ρ is the liquid water density, and Tm is the mean temperature of the atmospheric column. To calculate Tm, we used the well-known Bevis equation [30]:
T m = 70.2 + 0.72 T s ,
where Ts is the surface air temperature. In order to test the validity of this relationship for the tropical atmosphere of Costa Rica, we used the radiosonde profiles available at MROC during the study period (N = 210) to estimate the Tm values for the local atmosphere. As Tm depends both on the temperature profile and the vertical distribution of water vapor, Tm was calculated using the following equation [31,32]:
T m = 0 P w T dz 0 P w T 2 dz ,
where Pw is the water vapor pressure and T is the air temperature.
Based on the atmospheric sounding data available at MROC during 2017, the composite atmospheric temperature profiles depict lapse rate changes for the tropopause and troposphere for the dry and wet seasons (Figure 2A). During the dry season, the mean lapse rate was −5.0 °C/km from the ground to the tropopause level (approx. 15–20 km), whereas during the wet season, the mean lapse rate was −4.8 °C/km. Tropospheric temperature variations (up to 15 km) were similar during the wet season (range: 198–296 K, mean: 256 ± 27 K) and the dry season (range: 199–297 K, mean: 258 ± 28 K). At MROC, the mean surface temperature (Ts) varied from 293–296 K during the dry season and from 289–296 K during the wet season. The corresponding Tm values were in the range 279–289 K (dry season) and in the range 277–302 K (wet season). When we fitted a straight line to the Tm data to obtain a Tm–Ts relationship for MROC (black line in Figure 2B), we found a poor Spearman’s correlation between Tm and Ts for our data (r = 0.0257, p > 0.05). Therefore, we compared the relative bias of the Bevis equation (Equation 5, plotted as a red line in Figure 2B) to the Tm calculations from the radiosonde data. The mean relative bias using the Bevis equation was −0.009 ± 0.008 for the dry season estimations (N = 70) and 0.004 ± 0.009 for the wet season calculation (N = 140). We also calculated a RMSE of 3.50 K for the dry season, with a RMSE of 2.72 K for the wet season. The estimated relative biases are equivalent to the mean error values of −2.6 ± 2.4 K (dry season) and 1.1 ± 2.5 K (wet season). In terms of GPS PWV, the mean error associated to these Tm deviations were in the range of −0.2 and 0.4 mm. Therefore, as the relative biases for the Bevis equation are smaller than the estimated precision for the mean daily PWV calculations, we decided to apply the Bevis equation to estimate Tm in the calculations of PWV at our study sites.
In this work, we report mean daily PWV estimations based on hourly calculated ZTD and ZHD values at AACR and LIBE. We decided to carry out our analysis on a daily basis because there is limited atmospheric sounding data for Costa Rica, with only one radiosonde station in operation. Therefore, sounding data can be only considered representative of the average daily atmospheric conditions. The average precisions associated with the mean daily PWV calculations are 1.3 mm and 1.1 mm for AACR and LIBE, respectively.

2.4. MODIS Data

MODIS is a radiometer on board the Terra (launched in 1999) and Aqua (launched in 2002) satellite platforms. The MODIS instruments on the Terra and Aqua image the same area on Earth approximately three hours apart, observing the entire Earth’s surface every 1 to 2 days. Terra’s sun-synchronous, near-polar circular orbit passes the equator from north to south (descending node), whereas Aqua’s sun-synchronous, near-polar circular orbit crosses the equator from south to north (ascending node). The water vapor remote sensing method is based on detecting the absorption by the water vapor of the reflected solar radiation after it has transferred down to the surface and back up through the atmosphere. The total vertical amount of water vapor can be estimated from a comparison between the reflected solar radiation in the absorption channel and the reflected solar radiation in nearby non-absorption channels. The solar radiation between 0.86 and 1.24 µm on the sun-surface-sensor path is subjected to atmospheric water vapor absorption but also to atmospheric aerosol scattering and surface reflection. Therefore, in order to estimate column water vapor from measurements of the solar radiation reflected by the surface, the absorption and scattering properties of the atmosphere and the surface near 1 µm must be considered [33]. The PWV products are derived from infrared (IR) and near-infrared (NIR) measurements. NIR bands are used for daytime measurements (solar radiation reflected by Earth + atmosphere), and IR bands are used during nighttime conditions (radiation emitted by Earth + atmosphere). If clouds are present, other channels in the range of the 0.8−2.5μm region can be used in order to estimate the absorption due to water vapor above and within clouds [13,14].
Among the available MODIS products, the Level-3 MODIS Atmosphere Daily Global Product contains roughly 600 statistical datasets that are derived from approximate 80 scientific parameters from four Level-2 MODIS Atmosphere Products: Aerosol, Water Vapor, Cloud, and Atmosphere Profile. There are two MODIS Daily Global data product files: MOD08_D3, containing data collected from the Terra platform, and MYD08_D3, containing data collected from the Aqua platform [11]. In this study, the level-3 MODIS Terra and Aqua products of the daily mean (MOD08_D3 and MYD08_D3, respectively) global grid with a spatial resolution of (1° × 1°) were used to conduct the GPS PWV comparison during 2017. We selected the square region of 30 × 30 km dimensions centered on the MROC sounding site to calculate the satellite PWV estimations [34]. MODIS data estimates were calculated as area-averaged values and were processed using the Earth Observing System Data and Information System (EOSDIS) Giovanni website [35]. A total of 299 and 267 PWV Aqua and Terra satellite estimations were available from the MODIS data product, respectively, for the study period. The typical uncertainty of the MODIS PWV estimations is approximately 5–10% [13].

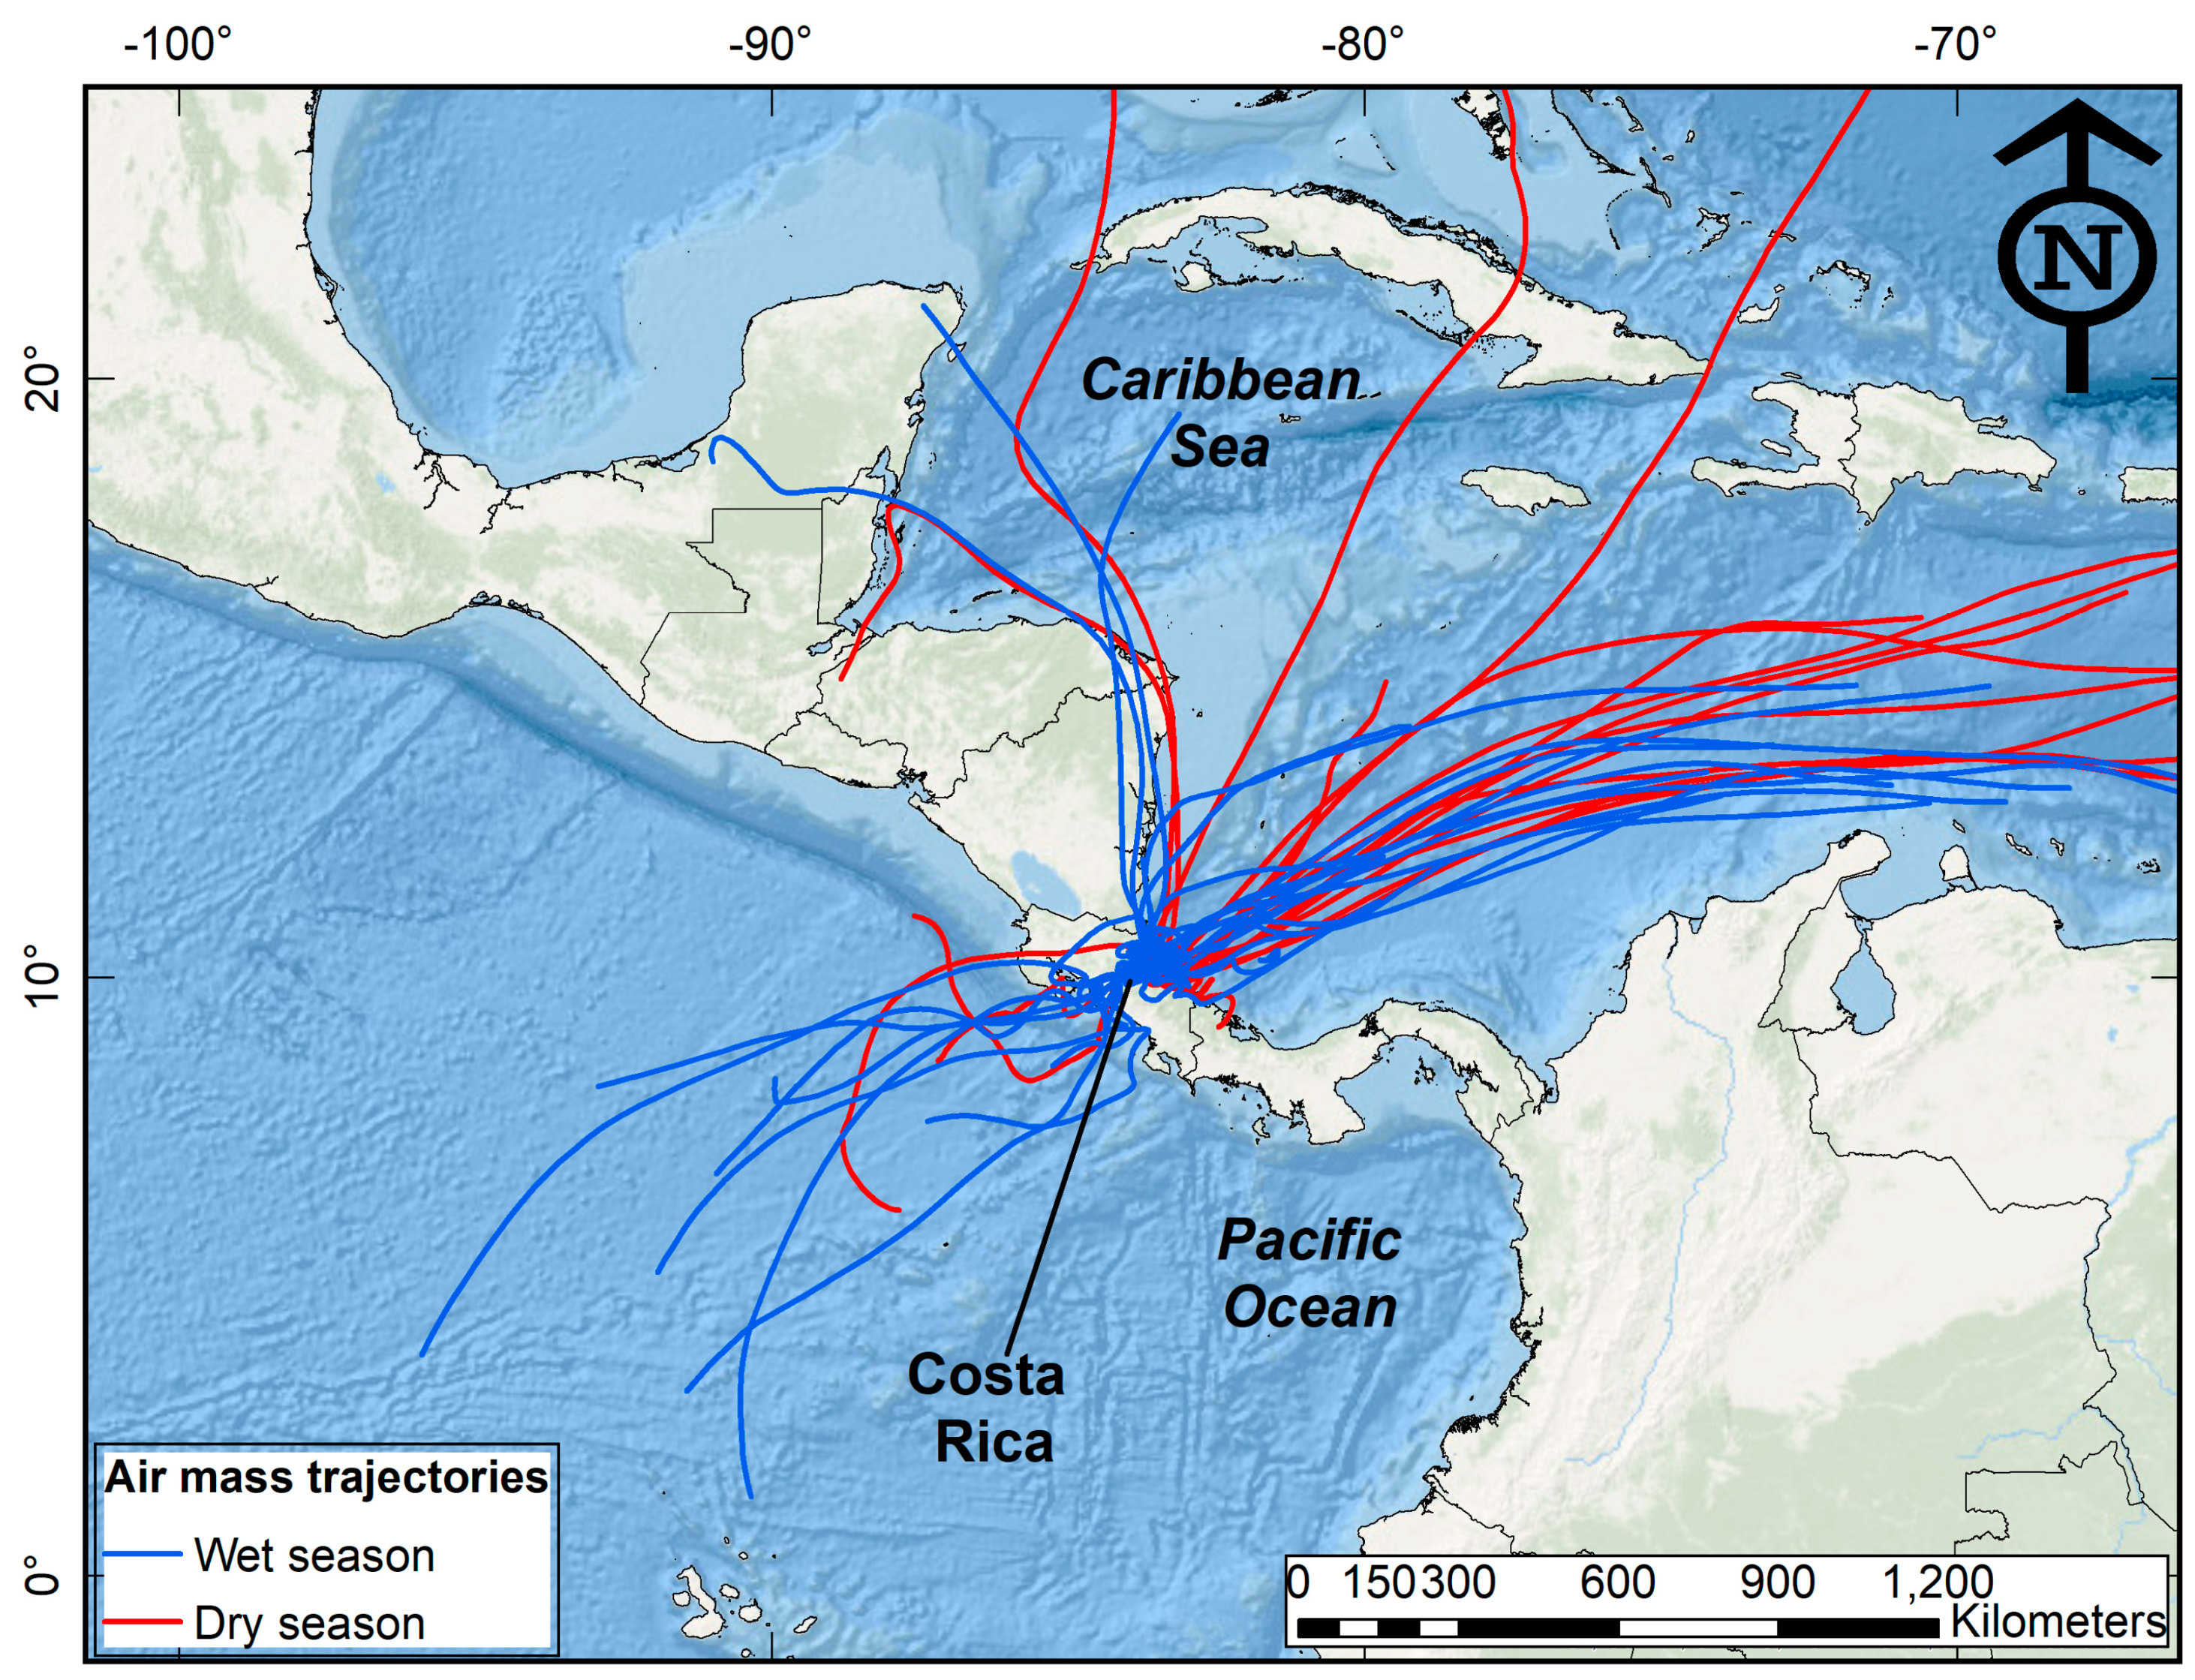
2.5. HYSPLIT Air Mass back Trajectory Analysis

Air mass back trajectory analyses were conducted using the HYSPLIT Lagrangian model developed by the Air Resources Laboratory (ARL) of the National Oceanic and Atmospheric Administration (NOAA, USA) [36,37]. Representative air parcel trajectories were estimated 72 h backwards in time due to the nearness of the Caribbean Sea and the Pacific Ocean. Each trajectory was calculated using NOAA’s meteorological data files (GDAS, global data assimilation system: 2006–present; 0.5° resolution) as input for the HYSPLIT model [38]. The ending altitude of air masses was set to the mean elevation of the Central Valley of Costa Rica (approx. 1,100 m a.s.l.). Trajectory analysis ending times at the Central Valley (AACR) were set to 12:00 UTC, which corresponds to a local time of 06:00 a.m. in Costa Rica. Given the estimated residence time of water in the atmosphere, ranging from around 4–10 days, weekly (N = 52, Figure 3), air mass back trajectories were calculated [38]. The ending dates for the trajectory analysis were set on Sunday of every week. These air masses were classified into two main groups, dry season (January–April) and wet season (May–December), to compare and identify the moisture transport pathways followed by the air masses that arrived at the Central Valley of Costa Rica.

2.6. Statistical Analysis

A Kruskal–Wallis non-parametric one-way analysis of variance on ranks was used to investigate if the GPS PWV stochastically dominates the other PWV estimations (i.e., atmospheric sounding and MODIS Aqua and Terra) during the dry and wet season [39]. A pairwise multiple comparison procedure was applied using Dunn’s method for those groups having a significant difference in PWV in order to isolate the stochastic dominance of the group or groups that differ from the others [40].
We also applied a multiple linear regression (MLR) model using surface meteorological data in order to identify the major variables controlling the PWV values in the Central Valley (AACR GPS station).
The cumulative annual precipitation for AACR during 2017 was 2586 mm with a mean daily precipitation during the dry season of 2 mm (range: 0 mm–54 mm) and 11 mm (range: 0 mm–85 mm) during the wet season. In LIBE, the corresponding cumulative annual precipitation was 2161 mm with a mean daily precipitation during the dry season of 1 mm (range: 0 mm–49 mm) and 9 mm (range: 0 mm–247 mm) during the wet season. At both sites, maximum daily precipitation values were recorded at the end of October (Figure 4A). Despite the differences in the cumulative annual precipitation, the relative humidity and air temperature variations were similar in the two regions. The mean relative humidity was 80.8 ± 5.6% (range: 39.0%–92.6%) and 82.4 ± 8.0% (range: 34.6%–93.6%) in AACR and LIBE, respectively (Figure 4B). The mean air temperatures were 21.0 ± 0.9 °C (range: 16.2 °C–23.2 °C) and 26.7 ± 1.3 °C (range: 22.5 °C–30.5 °C) in AACR and LIBE, respectively (Figure 4C). However, on a seasonal basis, the mean daily air temperatures and mean daily relative humidity were 6.3 °C and 2.1% greater in LIBE than in AACR during the dry season, respectively. During the wet season, the corresponding values were 5.2 °C and 1.2% greater in LIBE than in AACR, in that order.

3. Results

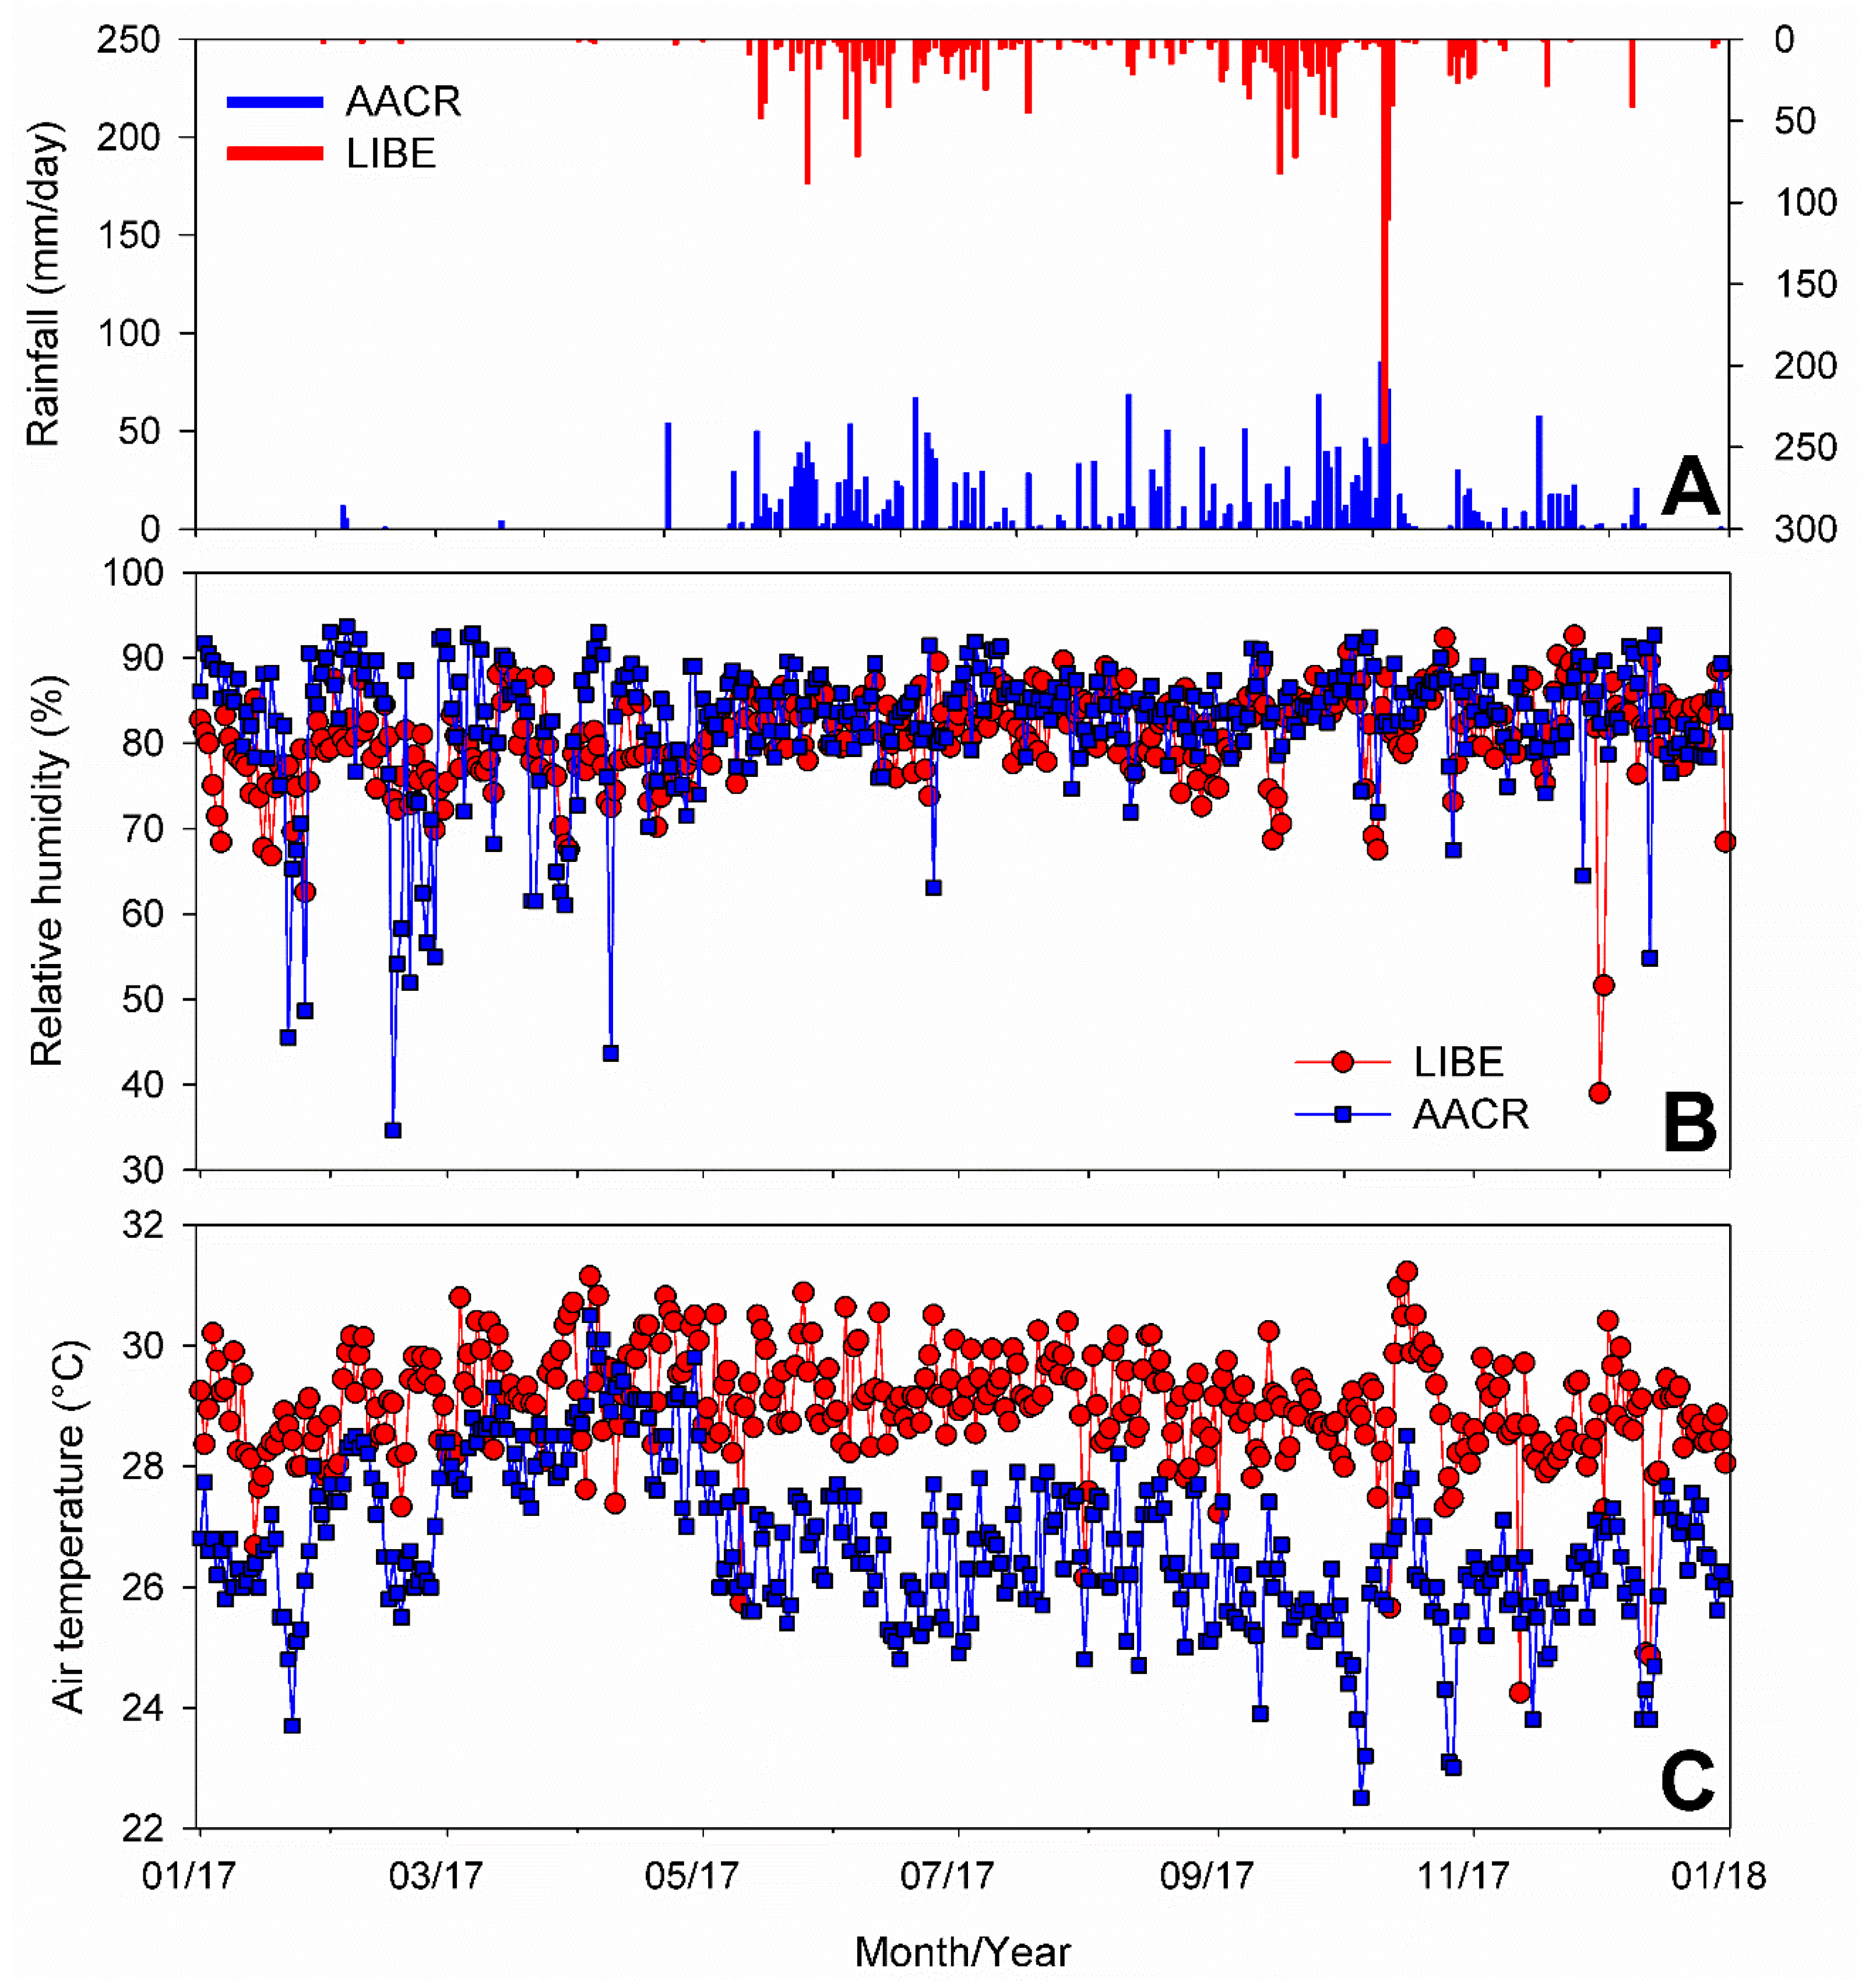
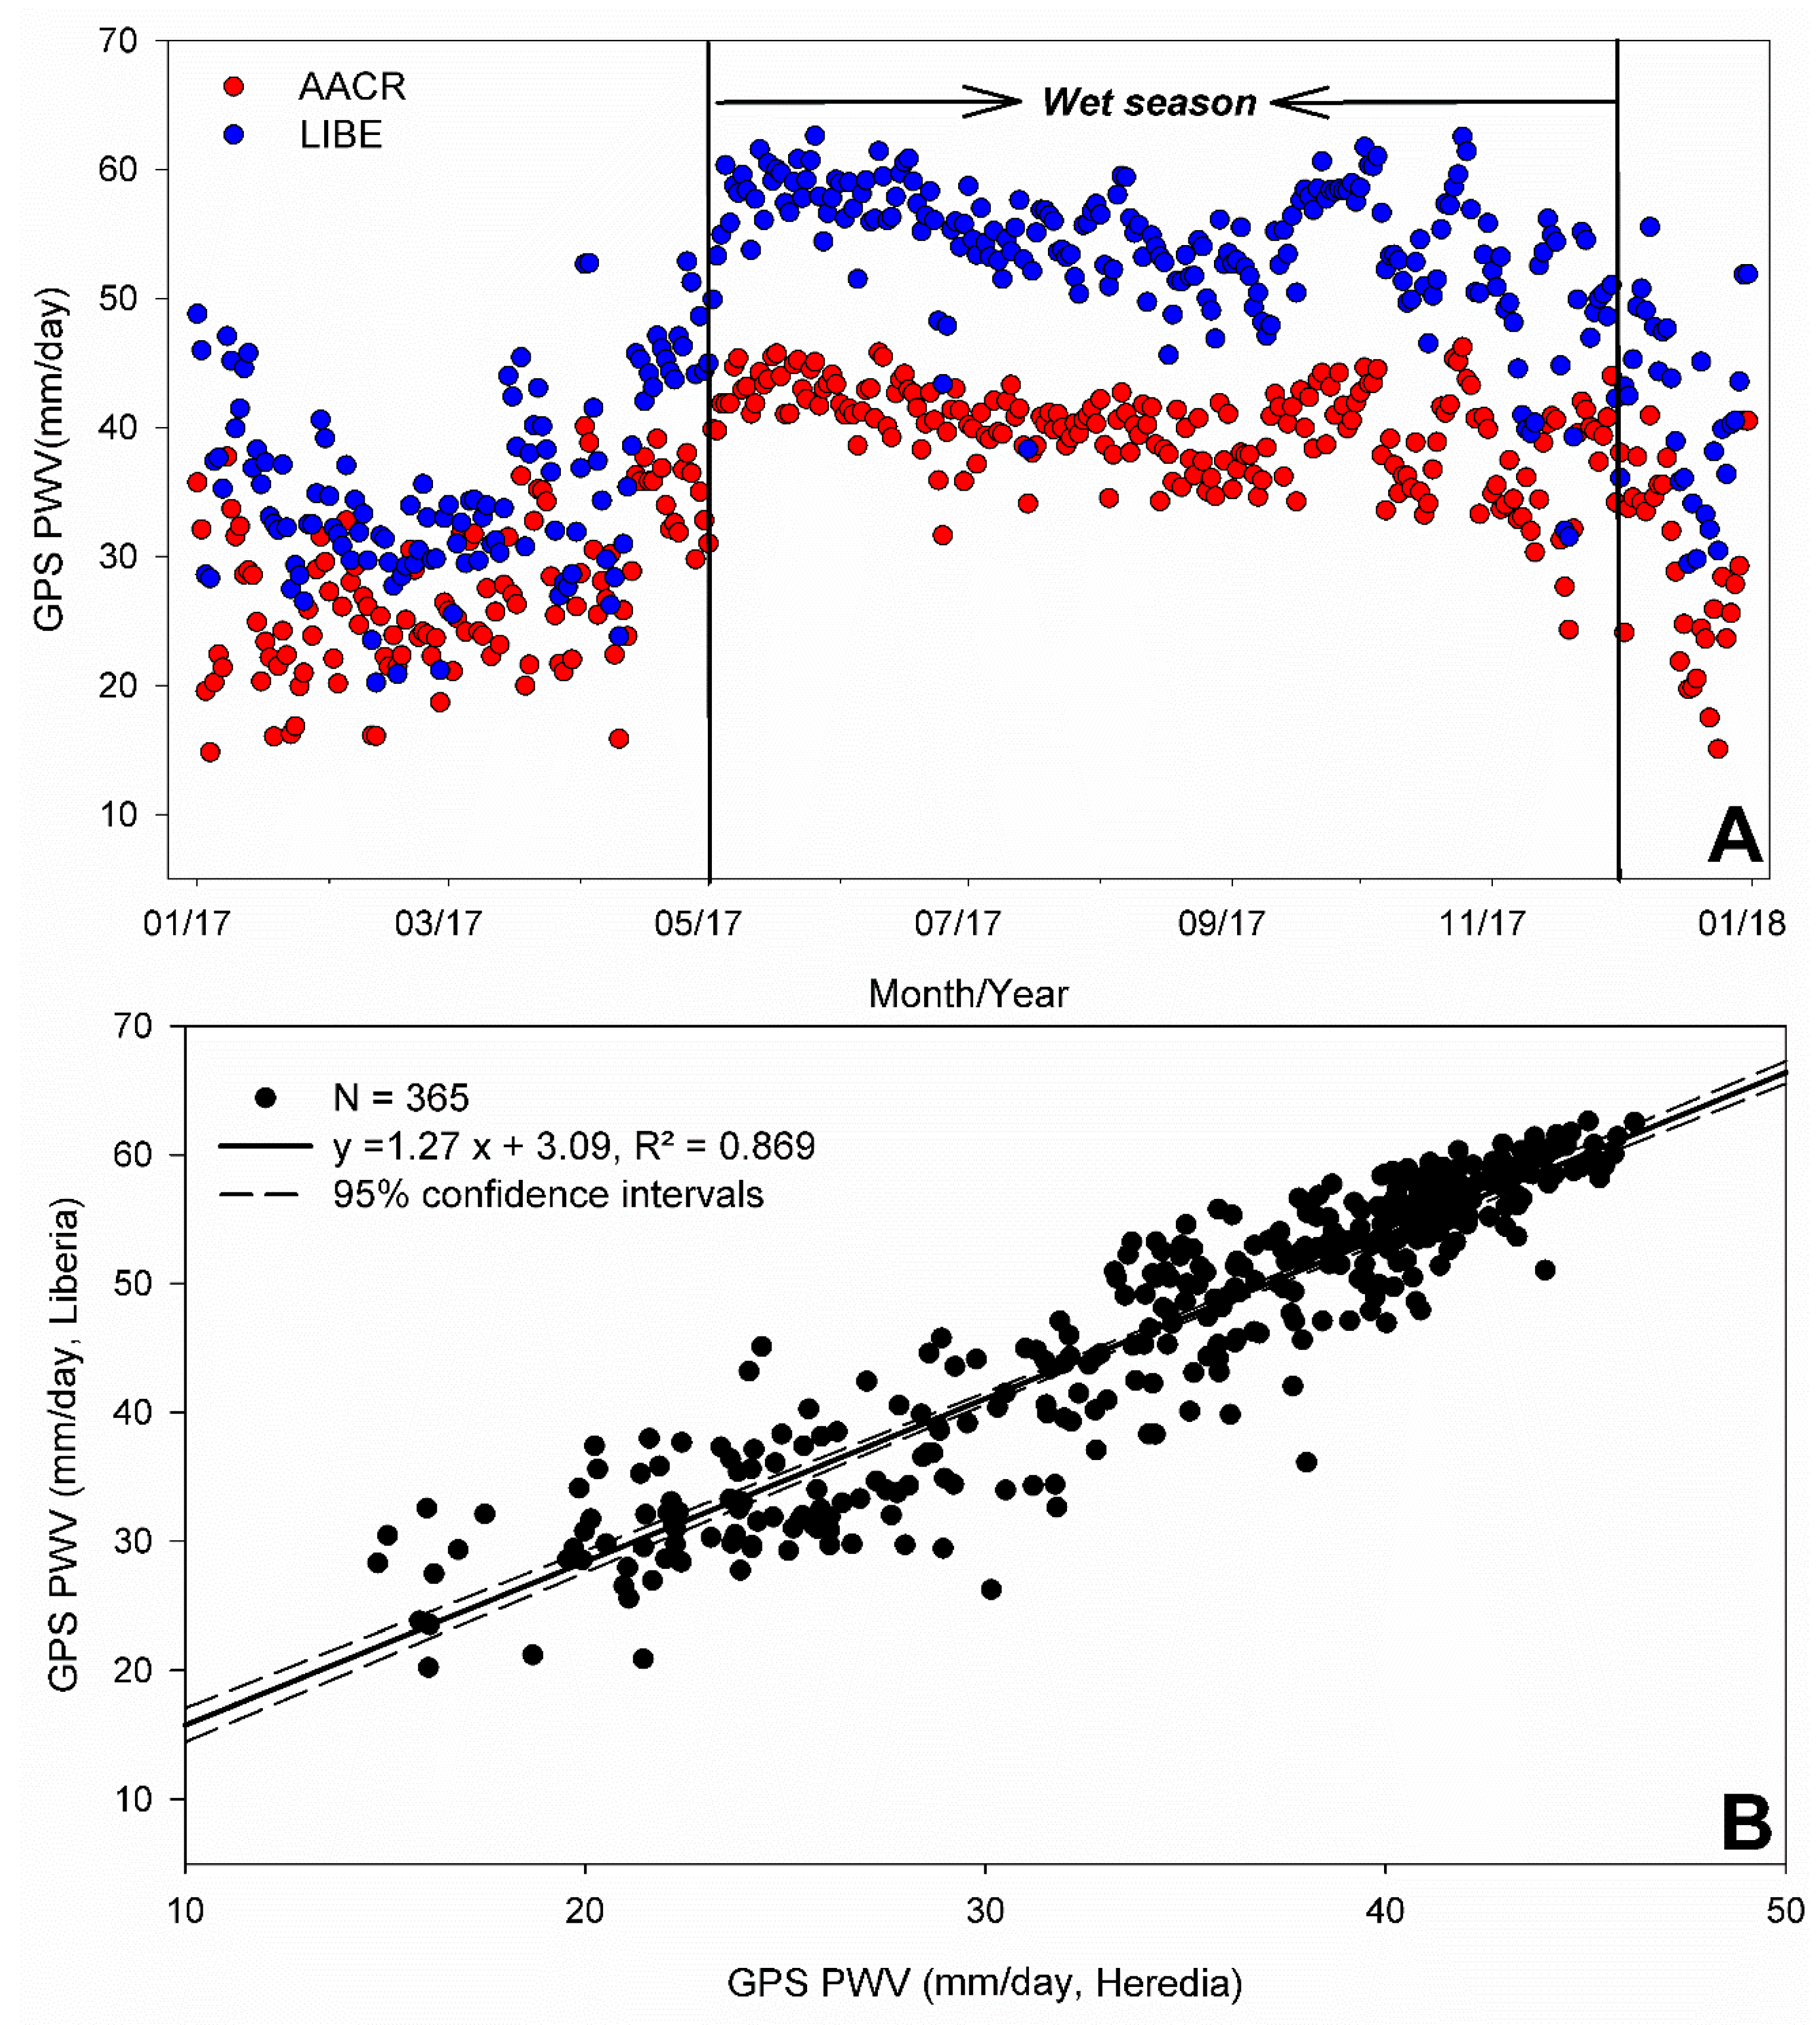
3.1. Seasonal Variations of GPS PWV in AACR and LIBE

During the study period, the HYSPLIT trajectory analyses identified that air masses reaching Costa Rica predominantly came from the southeastern Caribbean Sea with a less frequent contribution from the Pacific Ocean (Figure 3). Overall, the wind direction and speed in Costa Rica are mostly influenced by the seasonal migration of the ITCZ. Thus, during the dry season (December–April) when the ITCZ is located south of Costa Rica, air mass trajectories were associated with the influence of the NE trade winds. During the wet season (May–November), NE trade winds were weaker due to the passage of the ITCZ over Costa Rica, and cross-equatorial winds from the southern hemisphere transported moisture from the Pacific Ocean to the Central American Isthmus. This moisture transport pattern controlled the precipitation regimes observed at the Central Valley (AACR, Figure 4A) and the northern Pacific region of Costa Rica (LIBE, Figure 4A). During the study period, approx. 23% (N = 12) of the air masses arrived from the Pacific Ocean and the rest (approx. 77%, N = 40) came from the Caribbean Sea. Air masses arriving from the Pacific Ocean and the Caribbean Sea predominantly traveled over the eastern Pacific Ocean and the central and southern Caribbean Sea basins, respectively. No significant differences were found between the mean sea levels of the air masses that reached the Central Valley in the dry and wet seasons, with typical mean sea levels of 1500 m to 2000 m.
Seasonal GPS PWV variations were clearly defined at AACR and LIBE (Figure 5A). During the dry season, GPS PWV values varied from 14.8 mm to 40.9 mm in AACR (mean value: 27.6 ± 6.3 mm), whereas in LIBE, the variation was in the range 20.2 mm–55.5 mm (mean value: 36.9 ± 7.6 mm). We observed an increment in the GPS PWV values at both sites at the end of April and at the beginning of May that coincides with the onset of the wet season in Costa Rica, namely the passage of the ITCZ. During the wet season, at AACR, the GPS PWV estimates ranged from 24.3 mm to 46.2 (mean value: 39.7 ± 3.7 mm), and at LIBE, these GPS PWV values fluctuated from 31.5 mm to 62.6 mm (mean value: 54.1 ± 5.2 mm). At the end of November, when the transition wet-to-dry season began, we registered a decrease in the GPS PWV estimations related to the beginning of the dry season and the influence of the NE trade winds. Overall, the GPS PWV values were greater at LIBE than at AACR due to the elevation difference between the GPS stations (Δ1,027 m a.s.l.). For example, the mean differences between the estimations for AACR and LIBE were −9.5 ± 4.5 mm in the dry season and −14.4 ± 3.0 mm in the wet season. As shown in Figure 5A, these observed differences in the GPS PWV measurements at the GPS stations were more evident during the wet season when the ITCZ predominantly influenced the air circulation over Costa Rica. During the dry season, on the other hand, the differences between the GPS PWV values for AACR and LIBE were relatively more difficult to separate. However, although the GPS stations are situated approx. 160 km from each other (one in the Central Valley, AACR, and the other one in the northern Pacific region of Costa Rica, LIBE), we found a good Spearman’s correlation (r = 0.929, p > 0.001) between the GPS PWV values estimated for AACR and the corresponding estimations calculated for LIBE (Figure 5B). The best performing linear regression model shown in Figure 5B overall explained 86.9% of the variance for the GPS PWV estimates calculated for LIBE using the GPS PWV values at AACR. Overall, this finding confirms that the PWV variations at both sites are controlled by the climatic conditions of the Pacific slope which is also reflected in the precipitation patterns and air temperature/relative humidity variations shown in Figure 4A–C. This is an important result that demonstrates the applicability of PWV to monitor changes in the hydrometeorological conditions at regions that share similar climatic conditions. Additionally, our HYSPLIT analysis is able to identify the seasonal PWV variations at AACR. For instance, air masses arriving from the Pacific Ocean between May and October are associated with high PWV estimations with values between 39 and 44 mm/day. These values are practically equal to or greater than the 75th percentile of our data set (41 mm/day). In turn, air masses coming from the Caribbean Sea were associated with greater variations in the PWV estimations registered between November and April but also to smaller PWV estimations (up to 14 mm/day, Figure 5A).

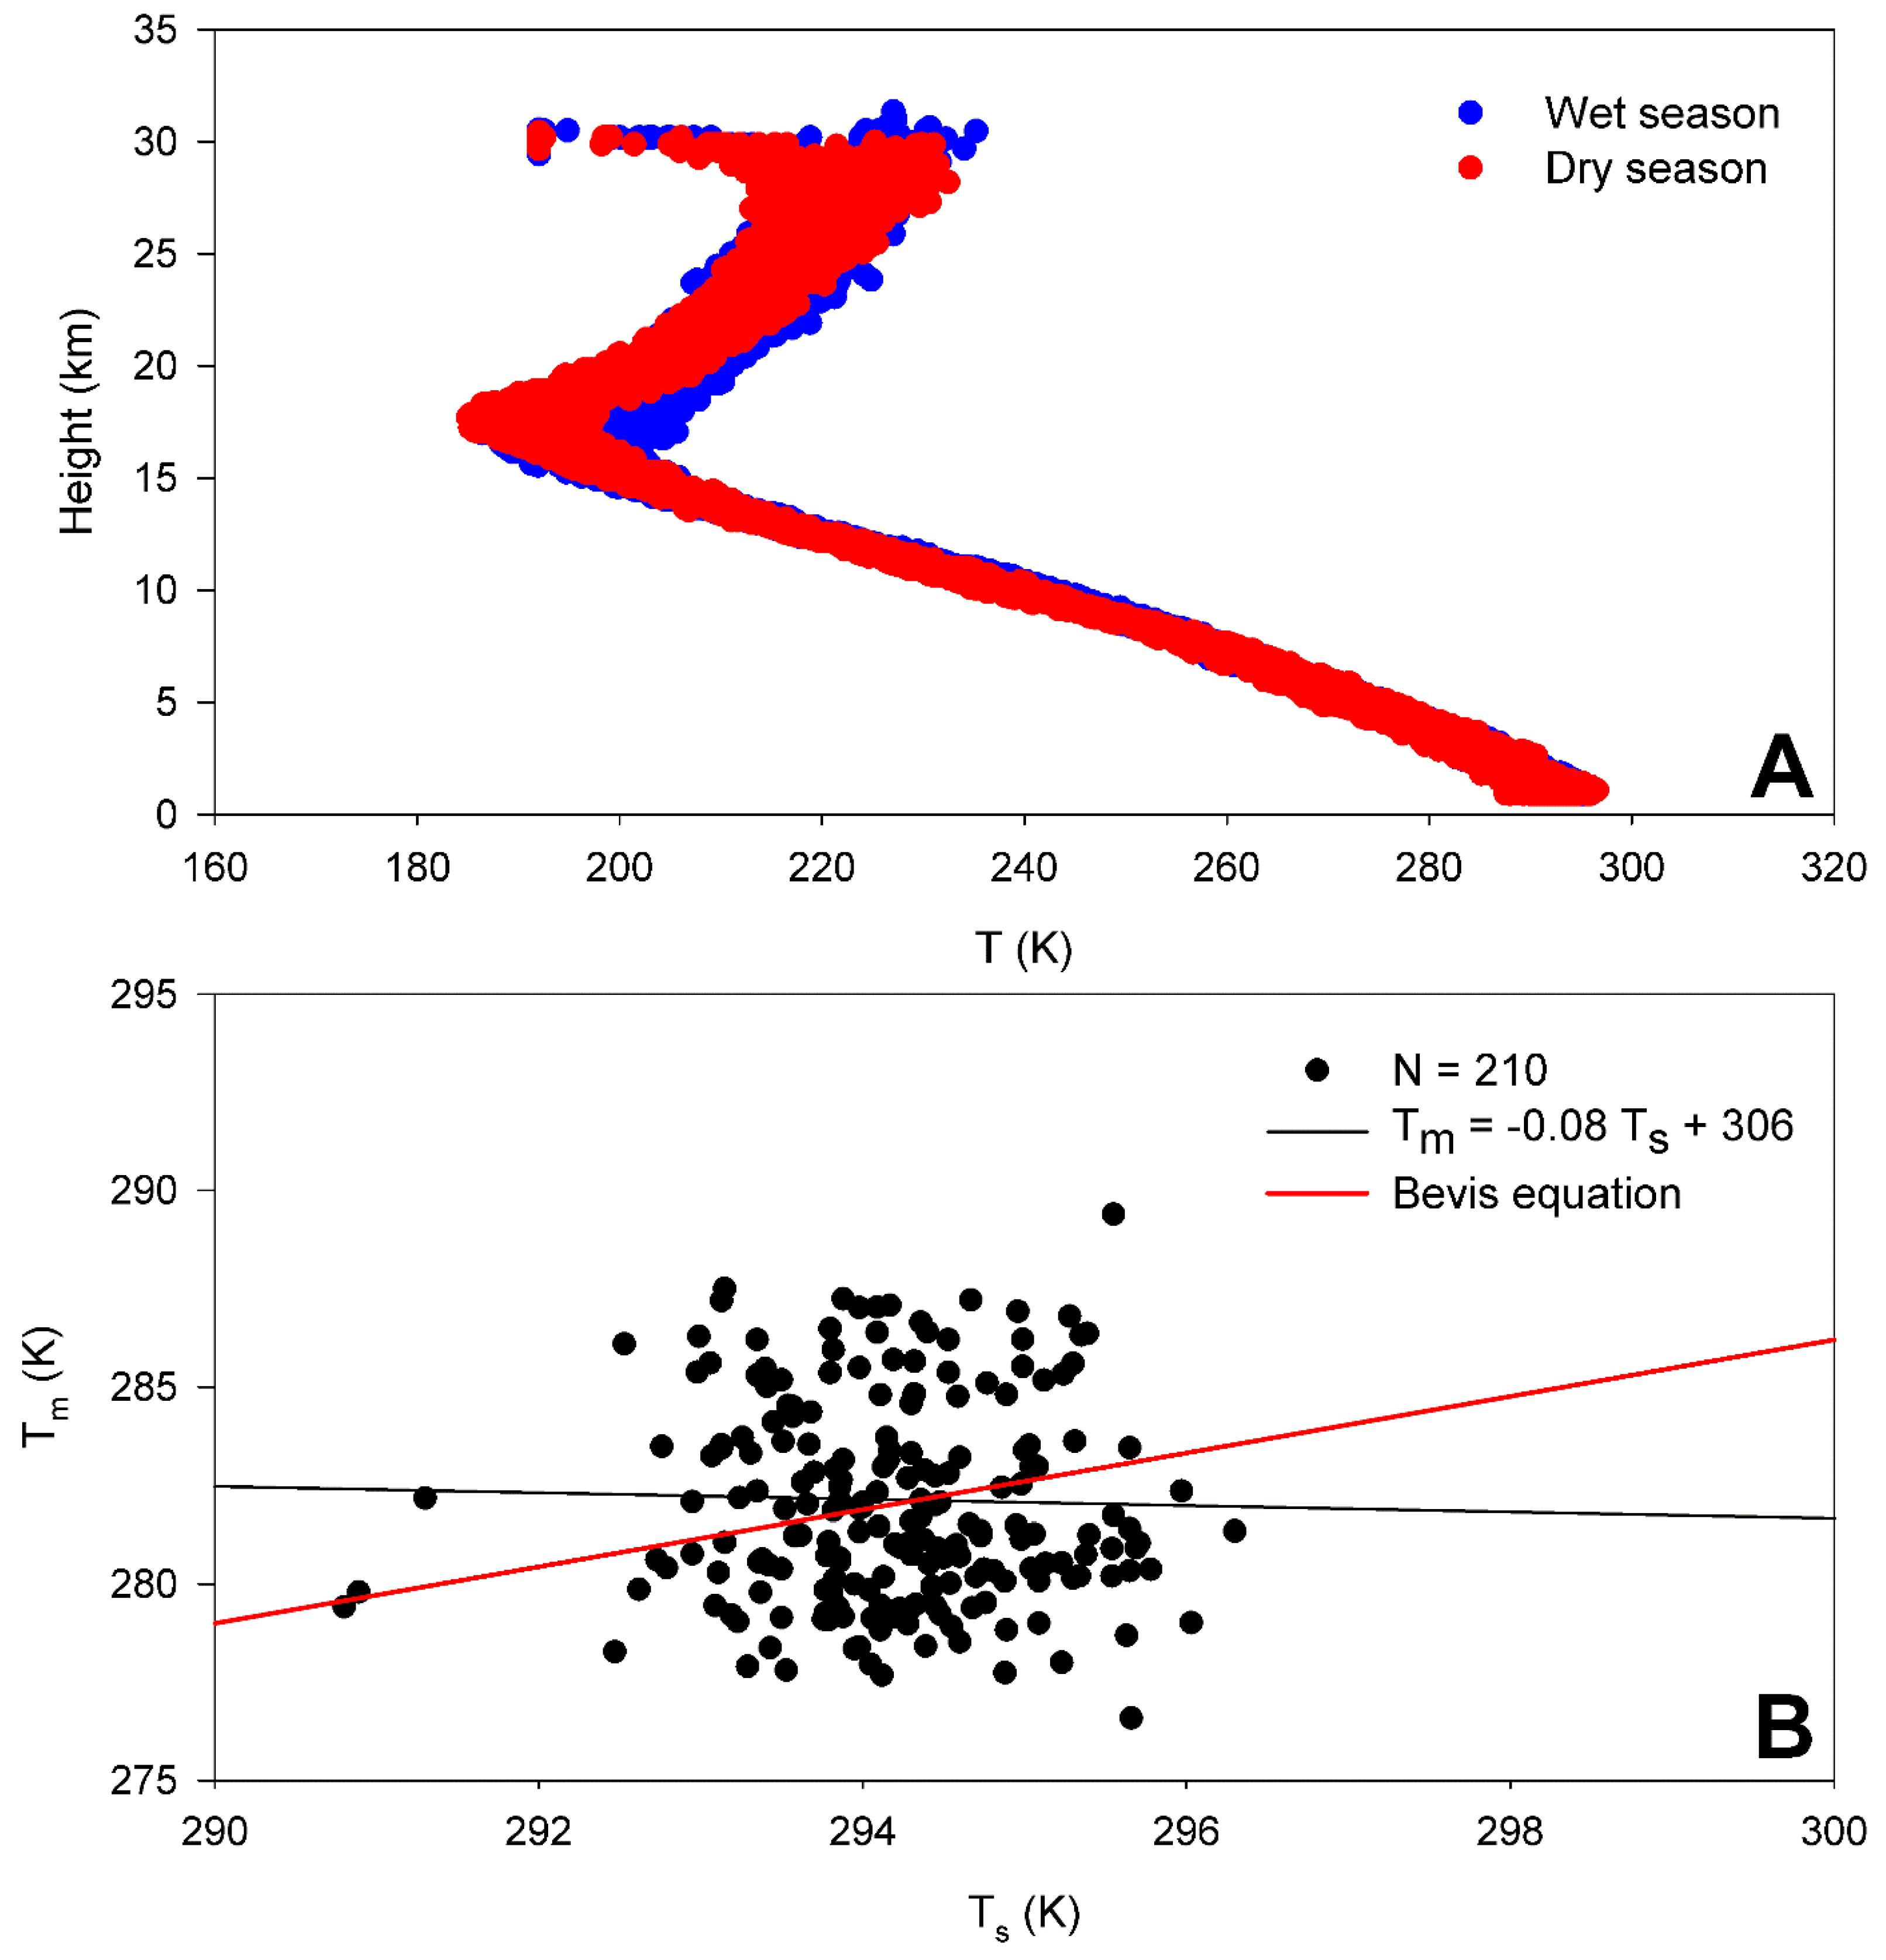
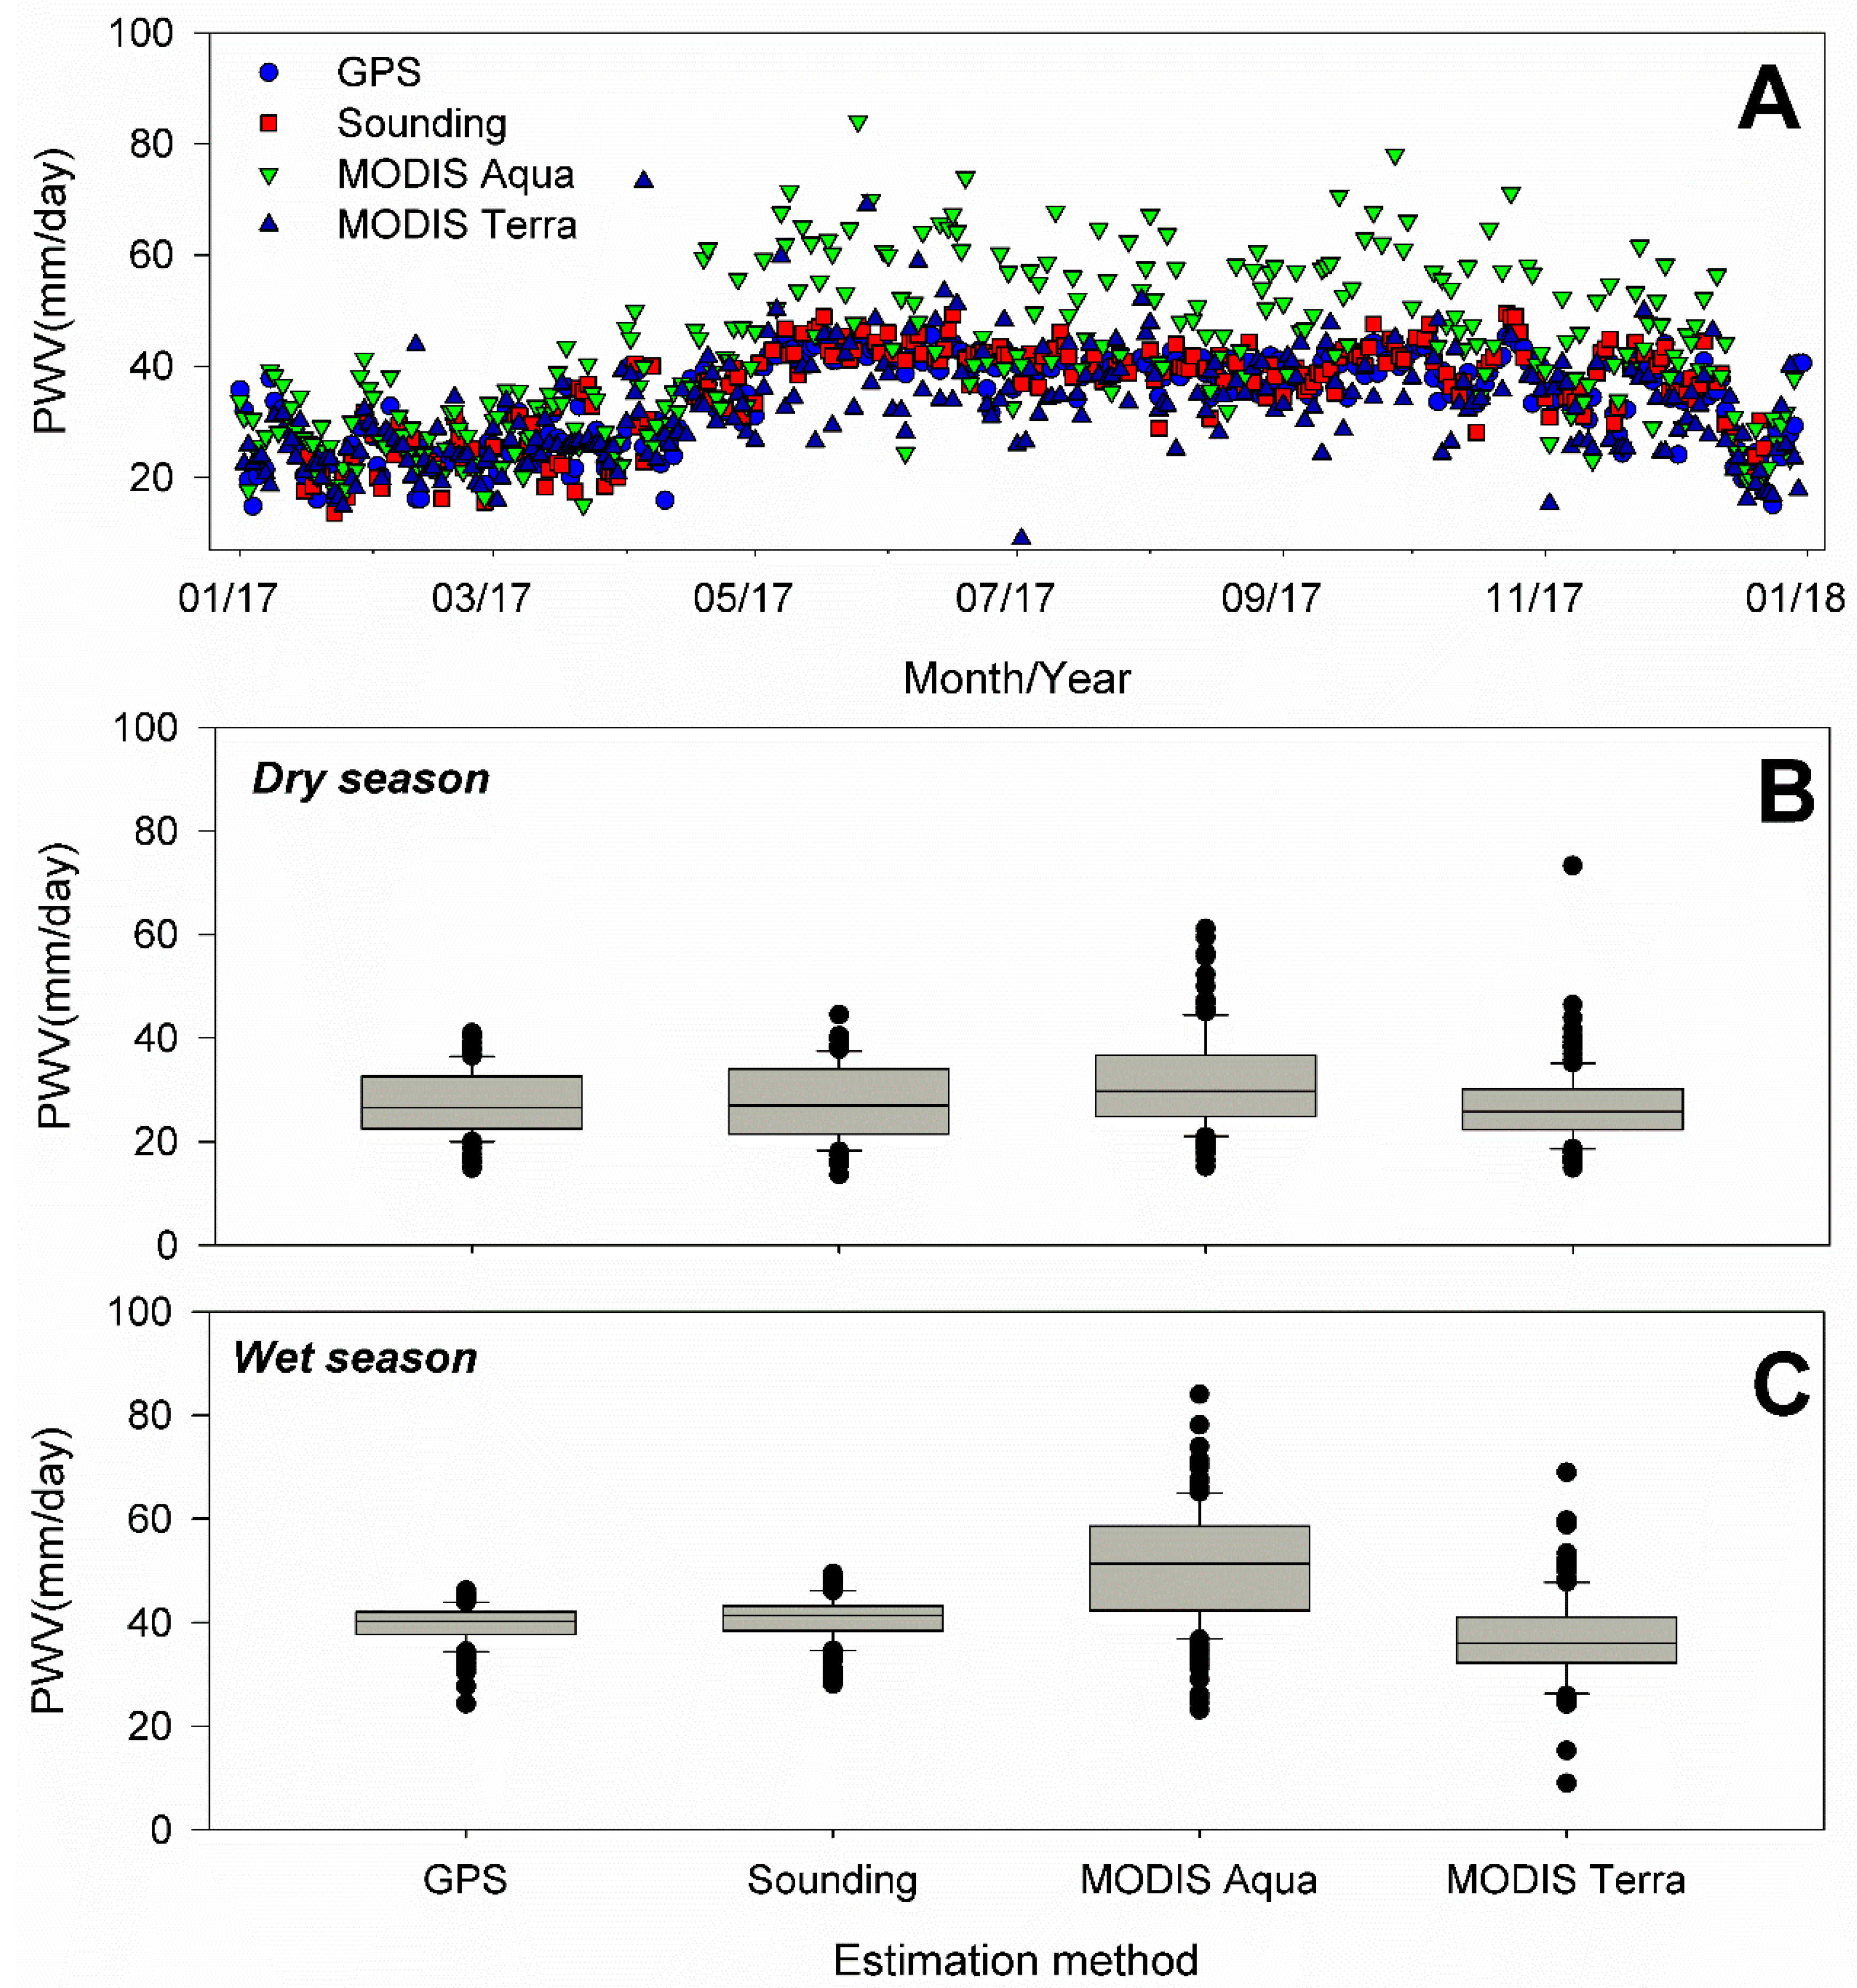
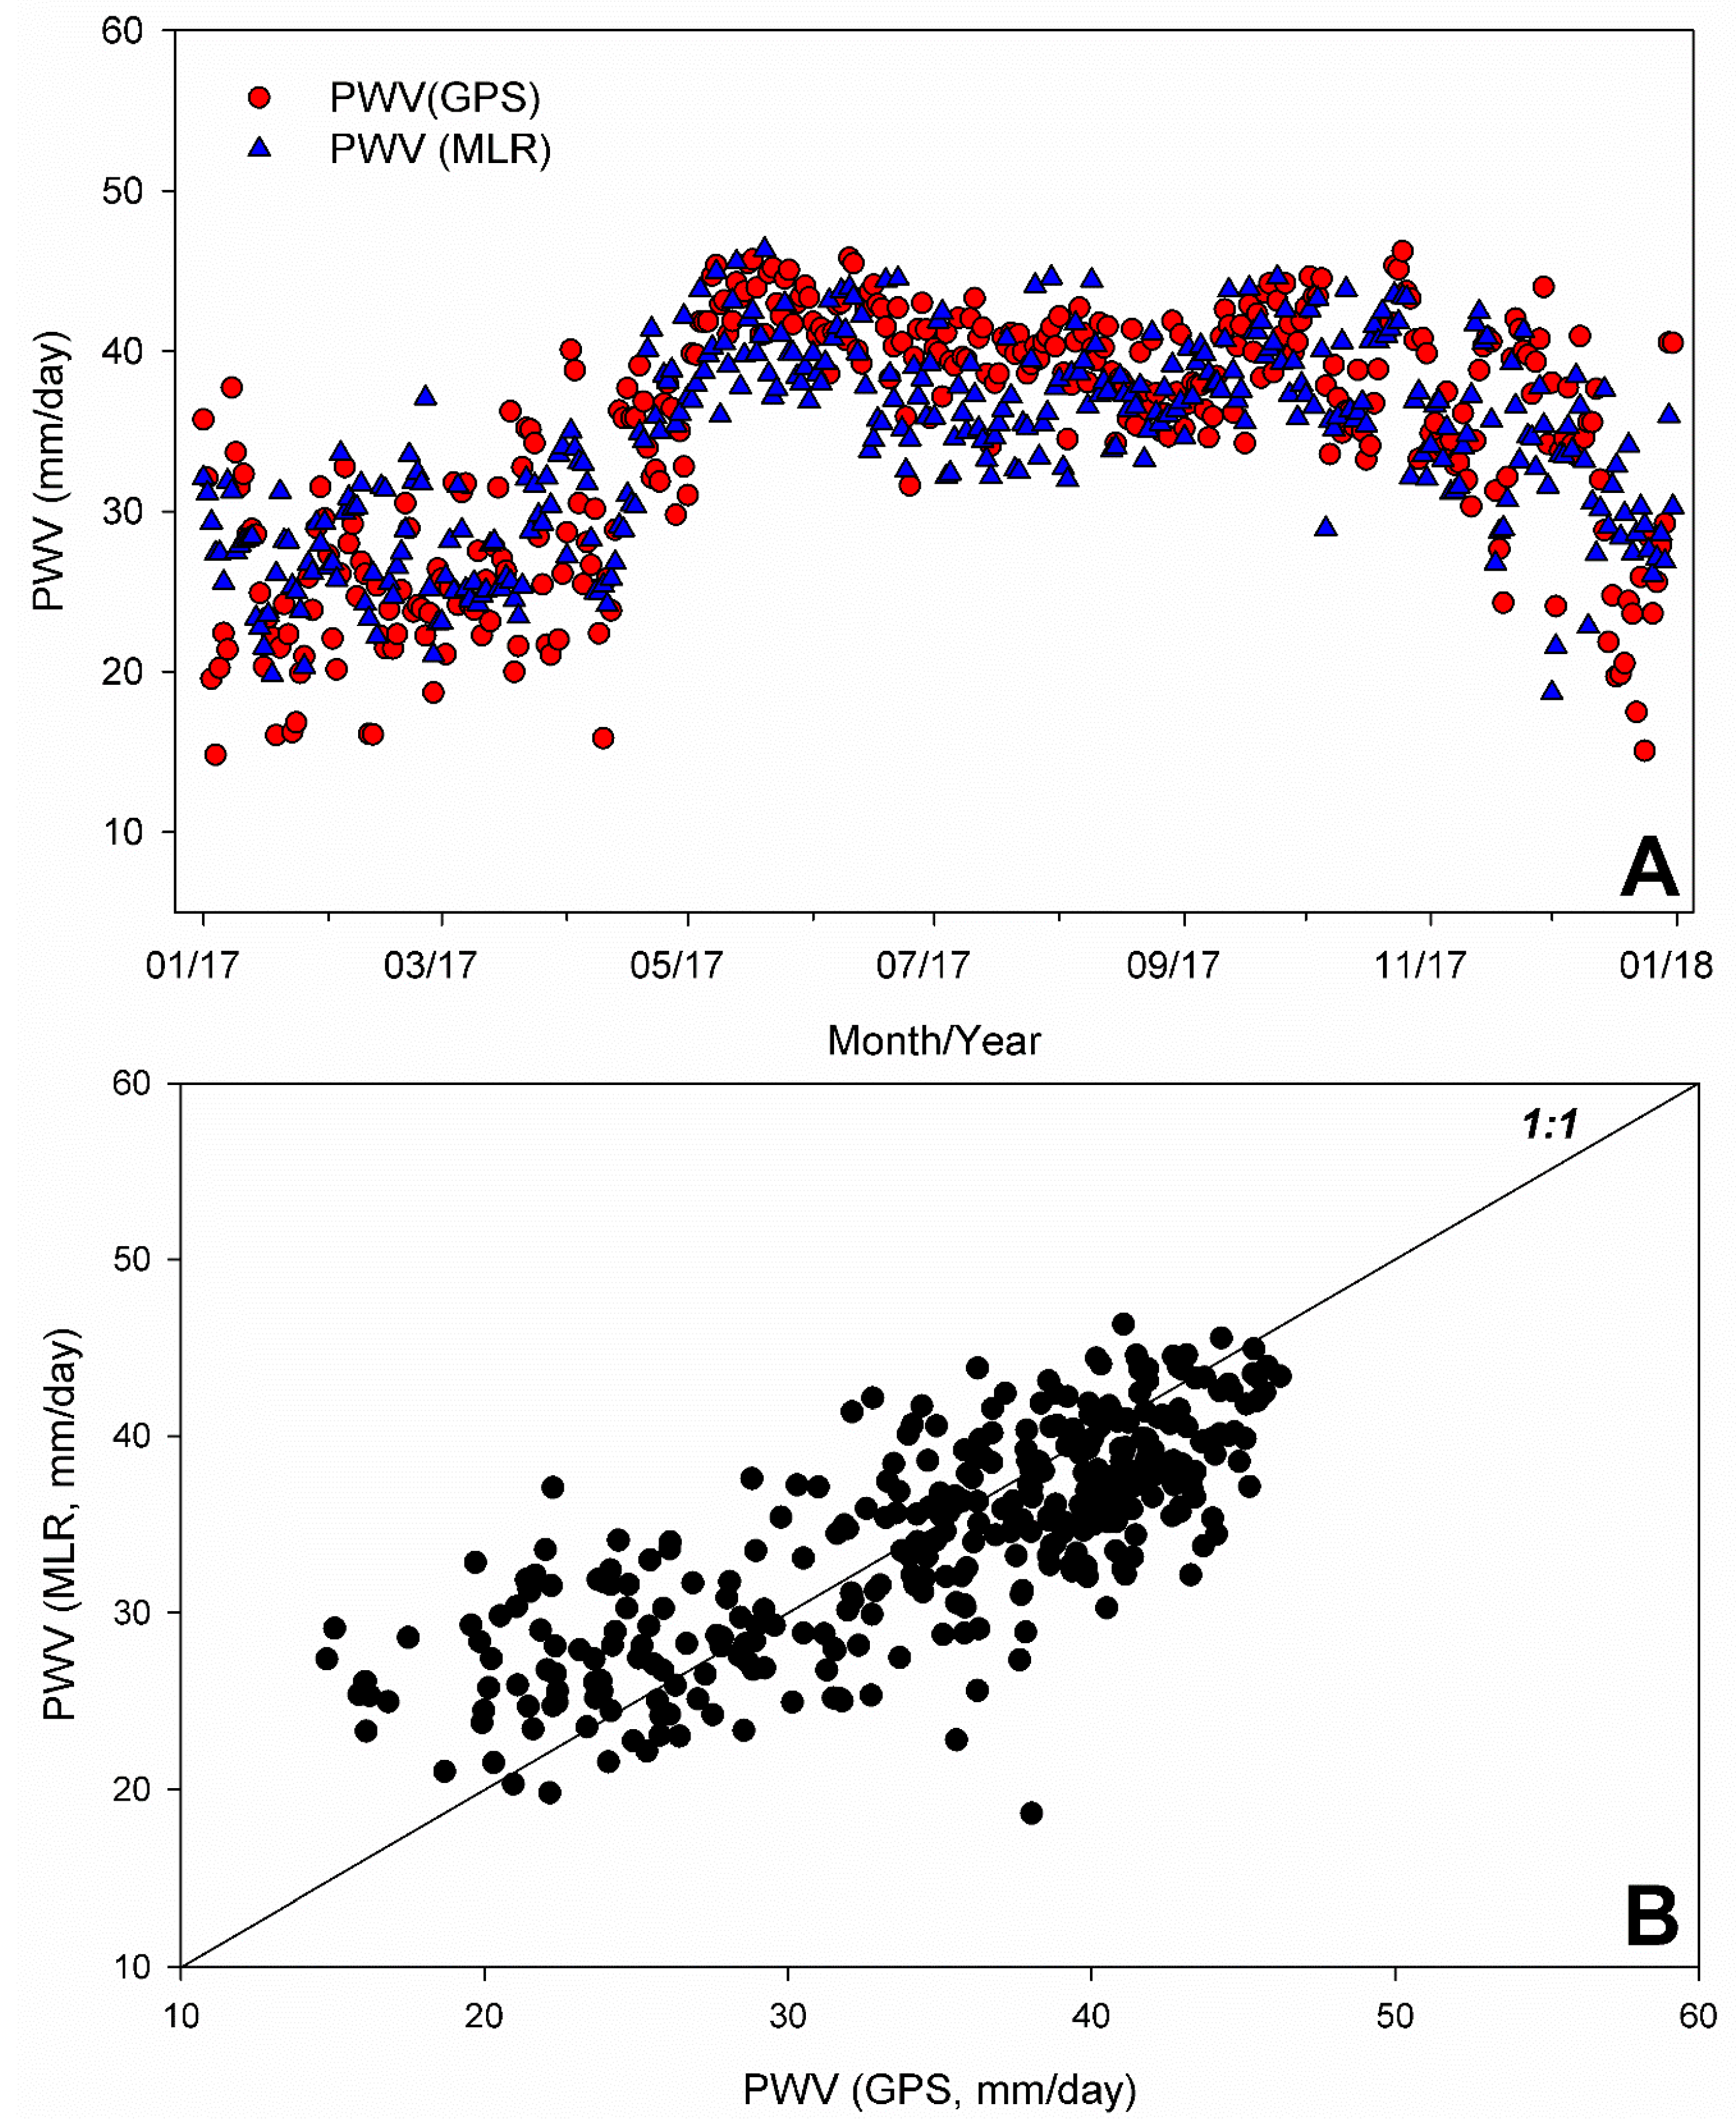
3.2. GPS PWV Comparison to Other Estimations Methods and MRL Analysis

GPS PWV observations at the Central Valley of Costa Rica (AACR) compared well to the atmospheric sounding measurements during the dry and wet season but only to the MODIS Terra estimations during the dry season. As shown in Figure 6A, GPS PWV observations followed the seasonal variations registered using the radiosonde data. The best performing satellite-based estimations were those retrieved from the MODIS Terra, which also followed the seasonal variations in the GPS and radiosonde PWV observations. Unlike MODIS Terra, MODIS Aqua PWV estimations showed a systematic positive bias with respect the GPS PWV values and the radiosonde data. To better identify the seasonal differences found after applying these PWV estimation methods, we split our data set into two groups: dry season and wet season estimations (Figure 6B,C). For the dry season, the GPS PWV median value (26.5 mm) was not significantly different from the radiosonde PWV median value and the MODIS Terra PWV median estimation (27.0 mm and 25.8 mm, respectively; p > 0.05). However, it was significantly different from the median value estimated using the MODIS Aqua PWV values (29.7 mm, p > 0.001). In turn, for the wet season, the GPS PWV median value (40.3 mm) was significantly different from the MODIS Terra and MODIS Aqua PWV median estimations (36.0 mm and 51.4 mm, respectively; p < 0.001) but not significantly different from the radiosonde PWV median value (41.4 mm, p > 0.05). The mean relative biases for MODIS Aqua PWV and MODIS Terra PWV were also calculated using the GPS PWV as a reference. During the dry season, these values corresponded to 0.16 ± 0.24 mm and 0.02 ± 0.30 mm, respectively, and were equivalent to RMSE values of 7.43 mm and 7.21 mm, in that order. During the wet season, the mean relative biases were 0.30 ± 0.24 mm and −0.06 ± 0.19 mm, respectively, corresponding to 15.2 mm and 8.05 mm, respectively.
Using the available surface meteorological data at AACR, we conducted a multiple linear regression (MLR) analysis to identify the major drivers controlling the seasonal variability of GPS PWV measurements made at the Central Valley of Costa Rica (AACR, Figure 7A). The best performing MLR model was calculated as
GPS PWV = 4.257 ( T ) + 0.355 ( RH ) 0.0486 ( FLUX ) 0.257 ( P ) 999.125 ,   R 2 = 0.597
where T is the mean daily air temperature (K), RH is the mean daily relative humidity (%), FLUX is the mean daily downward solar radiation flux (W/m2), and P is the mean daily atmospheric pressure (hPa). The mean relative bias associated with the estimations of GPS PWV values using this model during the dry season was 0.10 ± 0.25 mm, whereas for the wet season the mean relative bias was −0.04 ± 0.09 mm. The corresponding RMSE estimated for the dry and wet seasons were 6.09 mm and 4.02 mm, respectively. When this model was applied to estimate the sounding PWV measurements, the mean relative bias during the dry season and wet season were 0.12 ± 0.27 mm and −0.06 ± 0.10 mm, respectively. The RMSE values calculated for the dry and wet season were 6.83 mm and 4.72 mm, respectively. As shown in Figure 7B, the correlation between the GPS PWV data at MROC and the corresponding PWV values estimated from the MLR model was better for the values between 30 and 45 mm. As these values were mostly registered during the wet season, it seems that our MLR model performs better when the atmospheric conditions in the Central Valley are controlled by the seasonal migration of the ITCZ and worse during the less stable atmospheric conditions linked to the influence of NE trade winds.

4. Discussion

Because of the isthmian geographical environment of Costa Rica (with only a Pacific-to-Caribbean coast distance of approx. 400 km), the good correlation between the GPS PWV estimates at AACR and LIBE was an expected result of our analysis, as both sites are located on the Pacific slope and share similar climatological features (e.g., analogous precipitation patterns, Figure 4A). Moreover, we also confirm the good agreement between the GPS PWV calculations and the radiosonde-based measurements reported by others [6,9,26,27,41]. For example, Spearman’s correlation coefficients for the GPS PWV and the radiosonde-based calculations were 0.913 (p < 0.001) and 0.902 (p < 0.001) during the dry and wet season, respectively. With respect to the MODIS satellite estimations of PWV, our analysis yielded significant biases depending on the season of the year, which are related to the annual cycle of water vapor, the NE trade winds influence, and the ITCZ activity over the Central American Isthmus. For instance, only the MODIS Terra PWV estimations recorded during the dry season were not significant biased with respect the GPS PWV calculations. However, we also found good correlations between the MODIS Aqua and the GPS-based calculations, with Spearman’s correlation coefficients of 0.735 (p < 0.001) and 0.621 (p < 0.001) for the dry and wet season, respectively. The dry and wet season MODIS Terra Spearman’s correlation coefficients were 0.591 (p < 0.001) and 0.368 (p < 0.001), respectively. These correlation values were similar to those reported over different regions of the Iberian Peninsula, including island environments like Mallorca and several coastal sites [9]. Such relationships also allowed a further adjustment of the data to fit the observations by adopting a spatial bias (error) correction method like the one applied to precipitation data [21,42,43]. As mentioned above, due to the location of Costa Rica on the narrow land-bridge of Central America, the MODIS near-infrared water vapor retrieval algorithm could be greatly affected and the derived column water vapor values over coastal or water areas may vary significantly due to the lower signal-to-noise ratios of the measured spectra [13]. This effect on the MODIS retrieval algorithm was particularly evident in the MODIS Aqua PWV estimation which was somewhat high during both the dry and wet season. MODIS Terra also showed deviations but were related to an underestimation during the wet season which can be related to the so-called shielding effect (i.e., clouds are probably occulting water vapor underneath them) [13,44]. The differences between the MODIS Aqua and MODIS Terra estimations could be attributed to their different passing times over the Central American Isthmus (MODIS Aqua crosses the equator in the afternoon, whereas MODIS Terra does it in the morning) and to the use of different radiations to estimate the water vapor during the day and night. The MODIS Aqua estimations could be higher than the corresponding MODIS Terra values because the algorithm uses IR radiation during nighttime, which could be affected by the presence of clouds with water vapor, leading to overestimations. Overall, our HYSPLIT air mass trajectory analysis is consistent with the prevailing regional moisture transport mechanism during the dry season, the Caribbean Low Level Jet (CLLJ). During the wet season, in turn, there is an intensification in the genesis and development of deep convection systems on the Pacific coast of Costa Rica which is generally is associated with the presence of the “Chorro del Occidente Colombiano” or CHOCO jet [45]. These circulation patterns produced the two rainfall maxima observed on the Pacific slope, one in June and one in September, which were interrupted by a relative minimum between July–August, known as the Midsummer Drought, due to the intensification of trade winds over the Caribbean Sea [46]. The radiosonde data were also useful to validate the atmospheric conditions controlling the GPS PWV estimations. First, the composite temperature profiles calculated using the radiosonde data are in agreement with the previously reported structure of the upper troposphere and lower stratosphere over Costa Rica [47]. As shown in Figure 2A, the temperatures in both the dry and wet season are roughly the same at 25 km, but below this level (e.g., 15–20 km), the boreal winter (December to April) temperature profile is colder than in boreal summer (from May to October). This finding was previously attributed to the influence of wave-induced vertical motions across strong vertical gradients, the source variability in the air masses arriving at Costa Rica (e.g., tropical western Pacific or midlatitudes) resulting from horizontal transport and changes induced along parcel paths due to physical and/or chemical processes [47,48,49]. Secondly, despite these differences in the thermal structure of the tropical atmosphere of Costa Rica, the Tm calculations using the Bevis equation showed small differences with respect to the corresponding calculations based on radiosonde data. This finding also agrees with the calculations made in Algeria and Argentina where Namaoui et al. and Fernández et al. estimated the uncertainty of the Tm values and found that variations up to 15K produced small differences in the final estimation of GPS PWV, which did not exceed 2 mm [27,40]. Thirdly, the poor correlation observed between Ts and Tm at MROC deserves further discussion. It is generally considered that the most accurate method to obtain Tm is by using both temperature and humidity profiles from radiosonde data [42,50]. Therefore, we have confidence that our Tm estimations are good approximations of the temperature profiles over the Central Valley of Costa Rica. A possible explanation for this finding is the mountainous and isthmian characteristics of the Costa Rica territory. The atmospheric sounding site is located on the southwestern area of the Central Valley. From this site, the distance to the Pacific coast is only 55–60 km. Radiosondes typically head in that direction after they are launched. Therefore, it seems that the atmospheric profiles estimated from MROC are representative not only of atmospheric conditions over the Central Valley but also of the Pacific coast of Costa Rica. There is also a limitation regarding the time of day when the sounding is performed. At MROC, atmospheric sounding is only done once a day, typically at 12Z or 7:00 a.m. Central American time. Therefore, Tm estimations with respect to Ts represent only the atmospheric conditions prevailing during the morning when constant surface temperatures are observed (approx. 294K ± 1K; Figure 2B). In consonance with these results, it was decided to rely on the Bevis equation to estimate the hourly Tm values for the Pacific slope of Costa Rica as this model has been extensively applied to estimate weighted atmospheric temperatures in several regions.
The MLR model estimated for GPS PWV data at AACR clearly matched the seasonal changes correctly, simulating smaller GPS PWV values during the dry season (from December to April) and much greater values during the wet season (from May to November). The best-performing and most parsimonious model included, as expected, near-surface (T and RH, Equation 7) and vertical atmospheric predictor variables (FLUX and P, Equation 6). The GPS PWV values were positively correlated with air temperature (T) and relative humidity (RH), with Spearman’s correlation coefficients of 0.210 and 0.426 (p < 0.001), respectively, and were negatively correlated with solar radiation (FLUX) and air pressure (P), with Spearman’s correlation coefficients of −0.360 and −0.175 (p < 0.001), respectively. These correlation results can be considered physically meaningful and can explain the overall model performance, although it is worth mentioning that, like the MODIS satellite estimations, it suffers from seasonal biases, specially during the dry season when the small PWV measured by the ground GPS receivers were not reproduced. This worse performance of the model during the dry season compared to the wet season was also evident after biases and RMSE values were additionally estimated using the sounding PWV measurements.

5. Conclusions

The combined analysis of PWV using GPS-based estimations, MODIS satellite products, and atmospheric sounding in the Pacific region of Costa Rica provides the first comparison between different water vapor calculation techniques for the Central American region. The evaluation of GPS-based estimates of PWV confirms the good performance of these estimations in comparison to the traditional and standard technique based on radiosondes, with no significant differences during the dry and wet seasons. These first results demonstrate the feasibility of incorporating GPS-based meteorological applications in order to improve the study of moisture inputs on the seasonal water vapor distribution in Central America. However, the performed evaluation identified significant biases between the GPS PWV estimates and the MODIS Aqua PWV estimations under both dry and wet season conditions and only the MODIS Terra PWV estimations recorded during the dry season were not significantly biased relating to the GPS PWV calculations. These results open the opportunity to evaluate other satellite products that provide higher spatial and temporal resolutions in order to give better insights into the causes of disagreements. Our analysis was also able to identify the influence of the main circulation patterns in Costa Rica, namely the trade wind regime and the ITCZ passage on PWV variability, which resulted in the relatively greater variability of the smaller PWV values during the dry season in comparison to the relatively smaller variability of the greater PWV values observed during the wet season. The influence of these moisture transport patterns was identified using the HYSPLIT analysis done for the Central Valley of Costa Rica. The multiple linear regression model successfully applied to this region can simulate the seasonal PWV variations using major meteorological variables, namely the mean daily air temperature, the mean daily relative humidity, the mean daily downward solar radiation flux, and the mean daily atmospheric pressure. We consider that a further analysis based on hourly GPS data could better analyze these relations between water vapor and HYSPLIT calculations and could refine the mathematical modeling presented in this work.

Author Contributions

Methodology, G.E.-H., J.F.V-C., and J.M.-Z.; software, J.F.V-C., S.R.-R., and J.M.-Z.; validation, P.C.-A. and S.R.-R.; writing—original draft, P.C.-A. and G.E.-H.; writing—review and editing, R.S.-M. and J.B.

Funding

This research received no external funding.

Acknowledgments

Germain Esquivel-Hernández, José Francisco Valverde-Calderón, and Ricardo Sánchez-Murillo thank the Research Office of the National University of Costa Rica through Grant SIA-0457-16.

Conflicts of Interest

The authors declare no conflict of interest.

References

  1. Trenberth, K.E.; Fasullo, J.; Smith, L. Trends and variability in column-integrated atmospheric water vapor. Clim. Dyn. 2005, 24, 741–758. [Google Scholar] [CrossRef]
  2. Kumar, S.; Allan, R.P.; Zwiers, F.; Lawrence, D.M.; Dirmeyer, P.A. Revisiting trends in wetness and dryness in the presence of internal climate variability and water limitations over land. Geophys. Res. Lett. 2015, 42, 10867–10875. [Google Scholar] [CrossRef]
  3. Bosilovich, M.G.; Robertson, F.R.; Takacs, L.; Molod, A.; Mocko, D. Atmospheric Water Balance and Variability in the MERRA-2 Reanalysis. J. Clim. 2017, 30, 1177–1196. [Google Scholar] [CrossRef]
  4. Sherwood, S.C.; Roca, R.; Weckwerth, T.M.; Andronova, N.G. Tropospheric Water Vapor, Convection, and Climate. Rev. Geophys. 2010, 48, RG2001. [Google Scholar] [CrossRef]
  5. Giorgi, F. Climate change hot-spots. Geophys. Res. Lett. 2006, 33, L08707. [Google Scholar] [CrossRef]
  6. Lu, N.; Qin, J.; Yang, K.; Gao, Y.; Xu, X.; Koike, T. On the use of GPS measurements for moderate resolution imaging spectrometer precipitable water vapor evaluation over southern Tibet. J. Geophys. Res. 2011, 116, 1–7. [Google Scholar] [CrossRef]
  7. Jakobson, E.; Ohvril, H.; Elgered, G. Diurnal variability of precipitable water in the Baltic Region, impact on transmittance of the direct solar radiation. Boreal Environ. Res. 2008, 14, 45–55. [Google Scholar]
  8. Bevis, M.; Businger, S.; Herring, T.; Rocken, C.; Anthes, R.; Ware, R. GPS Meteorology: Remote sensing of atmospheric water vapor using the global positioning system. J. Geophys. Res. 1992, 97, 15787–15801. [Google Scholar] [CrossRef]
  9. Vaquero-Martínez, J.; Antón, M.; Ortiz de Galisteo, J.; Cachorro, V.; Costa, M.; Román, R.; Bennouna, Y. Validation of MODIS integrated water vapor product against reference GPS data at the Iberian Peninsula. Int. J. Appl. Earth Obs. 2017, 63, 214–221. [Google Scholar] [CrossRef] [Green Version]
  10. Koulali, A.; Ouazar, D.; Bock, O.; Fadil, A. Study of seasonal-scale atmospheric water cycle with ground-based GPS receivers, radiosondes and NWP models over Morocco. Atmos. Res. 2012, 104–105, 273–291. [Google Scholar] [CrossRef]
  11. MODIS Atmosphere. Available online: https://modis-atmosphere.gsfc.nasa.gov/products/daily (accessed on 15 January 2019).
  12. Gui, K.; Che, H.; Chen, Q.; Zeng, Z.; Liu, H.; Wang, Y.; Zheng, Y.; Sun, T.; Liao, T.; Wang, H.; et al. Evaluation of radiosonde, MODIS-NIR-Clear, and AERONET precipitable water vapor using IGS ground-based GPS measurements over China. Atmos. Res. 2017, 197, 461–473. [Google Scholar] [CrossRef]
  13. Gao, B.C.; Kaufman, Y.J. Water vapor retrievals using moderate resolution imaging spectroradiometer (MODIS) near-infrared channels. J. Geophys. Res. Atmos. 2003, 108, 1007–1021. [Google Scholar] [CrossRef]
  14. Vaquero-Martínez, J.; Antón, M.; Ortiz de Galisteo, J.P.; Cachorro, V.E.; Álvarez-Zapatero, P.; Román, R.; Loyola, D.; Costa, M.J.; Wang, H.; González Abad, G.; et al. Inter-comparison of integrated water vapor from satellite instruments using reference GPS data at the Iberian Peninsula. Remote Sens. Environ. 2018, 204, 729–740. [Google Scholar] [CrossRef]
  15. Diedrich, H.; Wittchen, F.; Preusker, R.; Fischer, J. Representativeness of total column water vapour retrievals from instruments on polar orbiting satellites. Atmos. Chem. Phys. 2016, 16, 8331–8339. [Google Scholar] [CrossRef] [Green Version]
  16. Nilsson, T.; Böhm, J.; Wijaya, D.D.; Tresch, A.; Nafisi, V.; Schuh, H. Path Delays in the Neutral Atmosphere. In Atmospheric Effects in Space; Böhm, J., Schuh, H., Eds.; Springer: Berlin, Germany, 2013; pp. 73–129. [Google Scholar]
  17. Waylen, M.E. Interannual variability of monthly precipitation in Costa Rica. J. Clim. 1996, 9, 2607–2613. [Google Scholar] [CrossRef]
  18. Hidalgo, H.G.; Amador, J.A.; Alfaro, E.J.; Quesada, B. Hydrological climate change projections for Central America. J. Hydrol. 2013, 495, 94–112. [Google Scholar] [CrossRef]
  19. Saénz, F.; Durán-Quesada, A.M.A. Climatology of low level wind regimes over Central America using a weather type classification approach. Front. Earth Sci. 2015, 3, 1–18. [Google Scholar] [CrossRef]
  20. Powell, G.V.N.; Barborak, J.; Rodriguez, S.M. Assessing representativeness of protected natural areas in Costa Rica for conserving biodiversity: A preliminary gap analysis. Biol. Conser. 2000, 93, 35–41. [Google Scholar] [CrossRef]
  21. Esquivel-Hernández, G.; Sánchez-Murillo, R.; Birkel, C.; Good, S.P.; Boll, J. Hydroclimatic and ecohydrological resistance/resilience conditions across tropical biomes of Costa Rica. Ecohydrology 2017. [CrossRef]
  22. Alfaro, E.J. Some Characteristics of the Annual Precipitation Cycle in Central America and their Relationships with its Surrounding Tropical Oceans. Top. Meteor. Ocean. 2002, 9, 103. [Google Scholar]
  23. Jet Propulsion Laboratory; California Institute of Technology. The Automatic Precise Positioning Service of the Global Differential GPS (GDGPS) System. Available online: http://apps.gdgps.net (accessed on 25 February 2018).
  24. Bar-Sever, Y.E.; Kroger, P.M.; Borjesson, J.A. Estimating horizontal gradients of tropospheric path delay with a single GPS receiver. J. Geophys. Res. 1998, 103, 5019–5035. [Google Scholar] [CrossRef] [Green Version]
  25. Atmospheric soundings. Available online: http://weather.uwyo.edu/upperair/sounding.html (accessed on 29 February 2018).
  26. Benevides, P.; Catalao, J.; Miranda, P.M.A. On the inclusion of GPS precipitable water vapor in the nowcasting of rainfall. Nat. Hazards Earth Syst. Sci. 2015, 15, 2605–2616. [Google Scholar] [CrossRef]
  27. Namaoui, H.; Kahlouche, S.; Belbachir, A.; Malderen, R.; Brenot, H.; Pottiaux, E. Water vapor and its comparison with radiosonde and ERA—Interim Data in Algeria. Adv. Atmos. Sci. 2017, 34, 623–634. [Google Scholar] [CrossRef]
  28. Saastamoinen, J. Atmospheric Correction for the Troposphere and Stratosphere in Radio Ranging Satellites. In The Use of Artificial Satellites for Geodesy; Henriksen, S.W., Mancini, A., Chovitz, B.H., Eds.; The American Geophysical Union: Washington, DC, USA, 1972; Volume 15, pp. 247–251. [Google Scholar]
  29. Wang, H.; Wei, M.; Li, G.; Zhou, S.; Zeng, Q. Analysis of precipitable water vapor from GPS measurements in Chengdu region: Distribution and evolution characteristics in autumn. Adv. Space Res. 2013, 52, 656–667. [Google Scholar] [CrossRef] [Green Version]
  30. Bevis, M.; Businger, S.; Chiswell, S.; Herring, T.A.; Anthes, R.A.; Rockend, C.; Ware, R.H. GPS meteorology: Mapping zenith wet delays onto precipitable water. J. Appl. Meteor. 1994, 33, 379–386. [Google Scholar] [CrossRef]
  31. Davis, J.L.; Herring, T.A.; Shapiro, I.I.; Rogers, A.E.E.; Elgered, G. Geodesy by radio interferometry: Effects of atmospheric modeling errors on estimates of baseline length. Radio Sci. 1985, 20, 1593–1607. [Google Scholar] [CrossRef] [Green Version]
  32. Ross, R.J.; Rosenfeld, S. Estimating mean weighted temperature of the atmosphere for Global Positioning System applications. J. Geophys. Res. 1997, 102, 21719–21730. [Google Scholar] [CrossRef] [Green Version]
  33. Atmosphere Discipline Team Imager Products. Water Vapor Algorithm Overview. Available online: https://modis-atmos.gsfc.nasa.gov/products/water-vapor/algorithm-overview (accessed on 3 April 2019).
  34. Mooney, P.A.; Mulligan, F.J.; Fealy, R. Comparison of ERA—40, ERA—Interim and NCEP/NCAR reanalysis data with observed surface air temperatures over Ireland. J. Clim. 2011, 31, 545–557. [Google Scholar] [CrossRef]
  35. Giovanni. The Bridge between Data and Science (v 4.28). Available online: https://giovanni.gsfc.nasa.gov/giovanni (accessed on 22 February 2018).
  36. Stein, A.F.; Draxler, R.R.; Rolph, G.D.; Stunder, B.J.B.; Cohen, M.D. NOAA’s HYSPLIT Atmospheric Transport and Dispersion Modeling System. Bull. Am. Meteor. Soc. 2015, 96, 2059–2077. [Google Scholar] [CrossRef]
  37. Su, L.; Yuan, Z.; Fung, J.C.H.; Lau, A.K.H. A comparison of HYSPLIT backward trajectories generated from two GDAS datasets. Sci. Total Environ. 2015, 506–507, 527–537. [Google Scholar] [CrossRef]
  38. van der Ent, R.J.; Tuinenburg, O.A. The residence time of water in the atmosphere revisited. Hydrol. Earth Syst. Sci. 2017, 21, 779–790. [Google Scholar] [CrossRef]
  39. Kruskal, W.H.; Wallis, W.A. Use of ranks in one-criterion variance analysis. J. Am. Stat. Assoc. 1952, 47, 583–621. [Google Scholar] [CrossRef]
  40. Dunn, O.J. Multiple comparisons among means. J. Am. Stat. Assoc. 1961, 56, 52–64. [Google Scholar] [CrossRef]
  41. Fernández, L.I.; Salio, P.; Natali, M.P.; Meza, A.M. Estimation of precipitable water vapour from GPS measurements in Argentina: Validation and qualitative analysis of results. Adv. Space Res. 2010, 46, 879–894. [Google Scholar] [CrossRef]
  42. Shi, F.; Xin, J.; Yang, L.; Cong, Z.; Liu, R.; Ma, Y.; Wang, Y.; Lu, X.; Zhao, L. The first validation of the precipitable water vapor of multisensor satellites over the typical regions in China. Remote Sens Environ. 2018, 206, 107–122. [Google Scholar] [CrossRef]
  43. Vernimmen RR, E.; Hooijer, A.; Mamenun, A.E.; van Dijk AI, J.M. Evaluation and bias correction of satellite rainfall data for drought monitoring in Indonesia. Hydrol. Earth Syst. Sci. 2012, 16, 133–146. [Google Scholar] [CrossRef] [Green Version]
  44. Román, R.; Antón, M.; Cachorro, V.E.; Loyola, D.; Ortiz de Galisteo, J.P.; de Frutos, A.; Romero Campos, P.M. Comparison of total water vapor column from GOME-2 on MetOp-A against ground-based GPS measurements at the Iberian Peninsula. Sci. Total Environ. 2015, 533, 317–328. [Google Scholar] [CrossRef] [Green Version]
  45. Durán-Quesada, A.M.; Gimeno, L.; Amador, J.A.; Nieto, R. Moisture sources for Central America: Identification of moisture sources using a Lagrangian analysis technique. J. Geophys. Res. 2010, 115, D05103. [Google Scholar]
  46. Magaña, V.; Amador, J.A.; Medina, S. The midsummer drought over Mexico and Central America. J. Clim. 2010, 12, 1577–1588. [Google Scholar] [CrossRef]
  47. Schoeberl, M.R.; Selkirk, H.B.; Vömel, H.; Douglass, A.R. Sources of seasonal variability in tropical upper troposphere and lower stratosphere water vapor and ozone: Inferences from the Ticosonde data set at Costa Rica. J. Geophys. Res. Atmos. 2015, 120, 9684–9701. [Google Scholar] [CrossRef]
  48. Selkirk, H.B.; Vömel, H.; Valverde, J.M.; Pfister, L.; Diaz, J.A.; Fernández, W.; Amador, J.; Stolz, W.; Peng, G.S. Detailed structure of the tropical upper troposphere and lower stratosphere as revealed by balloon sonde observations of water vapor, ozone, temperature, and winds during the NASA TCSP and TC4 campaigns. J. Geophys. Res. 2010, 115, D00J19. [Google Scholar] [CrossRef]
  49. Fujiwara, M.; Vömel, H.; Hasebe, F.; Shiotani, M.; Ogino, S.-Y.; Iwasaki, S.; Nishi, N.; Shibata, T.; Shimizu, K.; Nishimoto, E.; et al. Seasonal to decadal variations of water vapor in the tropical lower stratosphere observed with balloon-borne cryogenic frost point hygrometers. J. Geophys. Res. 2010, 115, D18304. [Google Scholar] [CrossRef]
  50. Wang, X.; Zhang, K.; Wu, S.; Fan, S.; Cheng, Y. Water vapor-weighted mean temperature and its impact on the determination of precipitable water vapor and its linear trend. J. Geophys. Res. Atmos. 2016, 121, 833–852. [Google Scholar] [CrossRef]
Figure 1. The location of the GPS stations (Liberia, LIBE and Central Valley, AACR, green circles) in Costa Rica and the atmospheric sounding site at the San José International Airport (International Civil Aviation Organization code: MROC, red triangle): The AACR and the MROC sounding site are situated in the central mountainous region of Costa Rica (Central Valley), whereas LIBE is located on the dry corridor of Central America (northern Pacific of Costa Rica).
Climate 07 00063 g001
Figure 2. (A) A composite atmospheric temperature (K) profile constructed using radiosonde measurements at the MROC sounding site during the dry season (N = 70, red dots) and wet season (N = 140, blue dots). (B) The surface temperature (Ts, K) vs. mean temperature of the atmospheric column (Tm, K) used to calculate the Tm–Ts relationship for the Central Valley of Costa Rica (black line) and the Bevis equation [8] (red line).
Climate 07 00063 g002
Figure 3. Representative 72-h air mass back trajectories for the dry (red) and wet (blue) seasons in 2017 calculated using the HYSPLIT Lagrangian model [26].
Climate 07 00063 g003
Figure 4. The time series of (A) the daily precipitation (mm/day) recorded in Heredia (blue bars) and in Liberia (red bars) during 2017: The left y-axis corresponds to Heredia, whereas the right y-axis shows the data of Liberia. (B,C) The average daily relative humidity (%) and air temperature (°C) for Heredia (blue circles) and Liberia (red circles).
Climate 07 00063 g004
Figure 5. (A) The time series of GPS precipitable water vapor (PWV) (mm/day) estimated for AACR (blue circles) and LIBE (red circles): The wet season period 2017 (May–November) is delimited in the graph. (B) The graph shows the relationship between the GPS PWV estimated for ACCR and LIBE (p < 0.001, N = 365). The 95% confidence limits are also shown (dashed lines).
Climate 07 00063 g005
Figure 6. (A) The time series of PWV (mm/day) estimated for AACR using GPS (blue circles), atmospheric sounding (red squares), MODIS Aqua (green inverted triangles), and MODIS Terra (blue triangles). (B,C) Box plots of the PWV (mm/day) estimated using GPS, atmospheric sounding, MODIS Aqua, and MODIS Terra for the dry season and wet season in AACR, respectively: The grey box indicates the 25th and 75th percentiles with the median in middle. The error bars indicate the minimum and maximum values. The black circles indicate outliers (1.5 times the central box).
Climate 07 00063 g006
Figure 7. (A) The simulated PWV (mm/day) time series (blue triangles) in relation to the estimated GPS PWV (mm/day) at AACR (red circles). (B) The GPS PWV (mm/day) vs. simulated PWV at AACR shows the goodness-of-fit of the multiple linear regression (MLR) model.
Climate 07 00063 g007
Table 1. The location details for AACR and LIBE GPS receivers in the Central Valley and northern Pacific region of Costa Rica and for the MROC radiosonde site used in this study.
StationAACRLIBEMROC
Latitude (decimal degrees)9.938610.63059.9944
Longitude (decimal degrees)−84.1179−85.4380−84.2079
Elevation (m a.s.l.)1159132912
Δ distance (km) 111.5152--
Δ elevation (m a.s.l.) 1+247−780--
1 Δ the distance and Δ the elevation in relation to the MROC sounding site.

