Climate Shocks and Responses in Karnali-Mahakali Basins, Western Nepal
by
Vishnu Prasad Pandey
1,*, 
Akriti Sharma
1,
Sanita Dhaubanjar
1,
Luna Bharati
1 and
Indu Raj Joshi
2 1
International Water Management Institute (IWMI), Nepal Office, Lalitpur 44600, Nepal
2
Square One Research and Training, Lalitpur 44700, Nepal
*
Author to whom correspondence should be addressed.
Climate 2019, 7(7), 92; https://doi.org/10.3390/cli7070092
Submission received: 12 June 2019
/
Revised: 10 July 2019
/
Accepted: 11 July 2019
/
Published: 18 July 2019
(This article belongs to the Special Issue Social-Ecological Systems, Climate and Global Change Impacts)
Abstract
:The Himalayas are highly susceptible to the impacts of climate change, as it consequently increases the vulnerability of downstream communities, livelihoods and ecosystems. Western Nepal currently holds significant potential as multiple opportunities for water development within the country are underway. However, it is also identified as one of the most vulnerable regions to climate change, with both an increase in the occurrence of natural disasters and exacerbated severity and impacts levels. Regional climate model (RCM) projections indicate warmer weather with higher variability in rainfall for this region. This paper combines bio-physical and social approaches to further study and understand the current climate shocks and responses present in Western Nepal. Data was collected from 3660 households across 122 primary sampling units across the Karnali, Mahakali and Mohana River basins along with focus group discussions, which provided a rich understanding of the currently perceived climatic shocks and related events. Further analysis of climatology was carried out through nine indices of precipitation and temperature that were found to be relevant to the discussed climate shocks. Results show that 79% of households reported experiencing at least one type of climate shock in the five-year period and the most common occurrence was droughts, which is also supported by the climate data. Disaggregated results show that perception varies with the region and among the basins. Analysis of climatic trends further show that irregular weather is most common in the hill region, although average reported frequency of irregular weather is higher in the mountain. Further analysis into the severity and response to climatic shocks suggest an imminent need for better adaptation strategies. This study’s results show that a vast majority of respondents lack proper access to knowledge and that successful adaptation strategies must be adapted to specific regions to meet communities’ local needs.
1. Introduction
Responding to climate change and developing resiliency has become a global priority. Climate action, however, is very context specific. Therefore, case studies that highlight better characterization and understanding of climate change/variability, severity of stresses and impacts, and response mechanisms and their effectiveness at basin or sub-basin levels are very important. Such studies from the Himalayan regions are of further interest as the Himalayas are highly sensitive to climate change and variability [1]. In the Hindu Kush Himalayan (HKH) region, climate change will have varying implications for various sectors such as agriculture, energy and water resources, among others [2]. Regional climate model (RCM) projections suggest that the future climate in the Karnali and Mahakali basins in the HKH region will be warmer with higher variability in rainfall dominated by sporadic high intensity rains [3]. Under such future climate, these Himalayan rivers flowing through Western Nepal are projected to see changes in water availability and its spatio-temporal distribution [4,5]. Furthermore, access to clean water, which is a prerequisite for peoples’ health, will be a challenge. Changes in water availability and its access will therefore greatly affect peoples’ health as well as the agricultural sector, which contributes to 39% of Nepal’s gross domestic product (GDP) and employs nearly 75% of the country’s workforce [6]. Therefore, impacts of climate change on water and agriculture sectors will affect the national economy.
Western Nepal spreads over 50,000 km2 of the headwaters of the Ganges basin in South Asia. Any impacts in the headwater will have implications in the downstream communities and ecosystems in the Ganges basin as well. Western Nepal has high potential for economic development. However, the region is also vulnerable to climate change [7]. Under projected changes in future climate, people and ecosystems are likely to suffer even more, with or without further development of the region. New studies are emerging to understand and quantify the threats of climate change [5,8,9]. However, the consideration of climate shocks, defined here as the events that outstrip the capacity of a society to cope with it, including events such as drought, floods, irregular weather, etc.; as defined in [8], is still missing. Understanding the occurrence of climatic shocks, the stresses and risks induced by the shocks, and suitable set of adaptation strategies across different locations are necessary for enhancing climate-resilience of large underdeveloped basins like Karnali and Mahakali (please refer Figure 1 for their locations).
Natural disasters such as flooding, droughts and untimely rains are natural weather events that communities have faced and dealt with for generations. However, over the past two decades, climate change/variability has accelerated the frequency, intensity and severity at which these natural disasters occur. Adaptation to climate change impacts is emerging as a key development agenda across the globe and in Nepal as well. The national adaptation plan of action (NAPA) and subsequent local adaptation plan of action (LAPA) are designed to provide a guiding framework for the mitigation and adaptation to climate change specific to Nepal [9]. However, there are missing links between the extent of climate change, level of impacts, and suitability of various adaptations strategies in the context of Nepal. Past studies narrowly focused on either a bio-physical approach (analysis of hydro-climatic data), or a social approach (analysis of perception of shocks based on social survey). This study aims to combine the two approaches, as was done in [10], and further elaborate with the aid of people’s perception and traditional knowledge in the study area. We integrate data generated from both social and bio-physical studies to analyse different types of climate shocks, severity of stress and risks associated with the shocks, and evaluate response mechanism considering the case of Western Nepal. Such an inter-disciplinary approach is on rise in recent time recognizing the need to address the multitude of factors that define climate shocks and a community’s adaptive capacity (e.g., [11,12,13]).
There is no universal response strategy and mechanism that works for all. Local response strategies and mechanism may vary across any basin depending upon frequency of stressors, awareness of community, and capacity (financial and technical) to recover from a shock. The strategies for coping with a climate shock can generally be categorized into structural, technical, management, socio-economic, and regulatory measures [9]. For example, when considering drought as the climate shock, potential structural measures could include construction of water storage reservoir and irrigation infrastructures [12]; whereas strategies geared towards developing drought-tolerant varies, such as promoting micro-irrigation, and changing crop patterns could be potential technical measures [14,15,16]. Similarly, economic measures against droughts are crop insurance, migration for supplementary income, and crop sharing [17,18]. In case of floods, the adaptation strategies could be the construction of dykes/weirs (structural measure); flood forecasting and construction of houses with a floodable ground floor (technical measure); building institutional capacity and improving institutional arrangements for flood response (management measure); insurances for damages to crops/property/lives (economic measures); and floodplain zoning and development of flood prevention standards (regulatory measures) [19,20,21,22,23]. Additionally, designing an appropriate set of strategies for any location should take peoples’ perception of climate shocks and associated severity of the risks into account.
Some studies (e.g., [24,25,26,27] have highlighted potential adaptation options for Nepal. However, no studies explore the status of climate shocks and responses specifically for Karnali, Mahakali and Mohana basins in Western Nepal. More importantly, in order to design better strategies and create better policies, there is a need to understand the impacts of climate change/variability on people, the predicted worsening, local people’s perception, and how they adapt. This study therefore aims to address the gap by answering the following four research questions: (i) What type of climate shocks have people perceived? (ii) What are observed climatological trends and their link to the perceived climate shocks? (iii) How severe are the risks of climate shocks that people have perceived? (iv) What are the existing response mechanisms to address the risks and how effective are they?
2. Materials and Methods
2.1. Study Area
The Karnali and Mahakali are the two largest basins located in Western Nepal (Figure 1). The Mahakali River descends from 3600 m at Kalapani in Nepal to 200 m as it enters the Tarai plains. The river flows through Uttaranchal in India, boarders between India and Nepal and continues to flow down India. Only 32.4% of the basin area falls within Nepalese territory. Two important tributaries of the Mahakali River in Nepal are Chamelia and Limpiyadhura rivers. The Karnali starts in the High Mountains at an altitude covering 5500 m up to 7726 m, with the headwater lying at about 230 km North from Chisapani (mainstream Karnali River length).
The Mohana River, lying in south of the Karnali Basin, descends from the Churia range, flows through the Tarai plain and meets with the Karnali River at the Nepal-India border. The watershed area of the Mohana delineated above the Nepal-India border is 3730.3 km2. The combined basin area of Karnali-Mohana (KarMo) above the Nepal-India border is 49,889 km2. About 6.9% of the KarMo basin lies in China. Major tributaries of the Karnali River are grouped in this study into Bheri-Karnali (comprising Thuli Bheri and Sani Bheri), Seti-Karnali (comprising West Seti and Budhi Ganga) and Karnali-Main (comprising Mugu Karnali, Humla Karnali, and other remaining areas). Table 1 highlights the key bio-physical characteristics of Mahakali, Karnali and Mohana. Being largely snow-fed basins, they are also vulnerable to climate change impacts. These rivers see a short-term increase in water availability during the dry season followed by long bouts of dwindling water availability. Therefore, it is best that communities adopt locale specific adaptation strategies.
2.2. Methodology
The overall methodological flowchart adopted in assessing climate shocks and responses in the Karnali-Mahakali river basins are shown in Figure 2. It consists of identifying potential climate shocks in the study area through literature reviews, focus group discussions (FGDs) and key informant interviews (KIIs); designing and implementing questionnaire surveys for perception analysis; analysis of climate shocks and severity of risks; analysis of climatological trends and their links to the climate shocks; and evaluation of response mechanisms. The questionnaire used in basin-wide survey is available at http://djb.iwmi.org/outputs/. The methods used in this study are described in the following sub-sections.
2.2.1. Survey Design and Implementation
A structured questionnaire was designed utilizing prior experience of the authors (e.g., [13,15]) on designing a similar type of study. The draft questionnaire was further refined based on inputs from FGDs carried out in the region. The survey questions addressed various aspects of water and its uses, agriculture, climate shocks and responses, among others. The questions related to climate shocks and responses were included in Sections 13 and 14 of a larger basin-wide survey targeted at overall socio-economic characterization of water resource uses in the basins. These questions focused on perceived climate shocks, risks associated with the shocks, especially extreme events such as floods and droughts, and responses made to deal with the impacts.
The survey consists of a representative sample of 3660 households from 122 primary sampling units (PSUs), which are defined as wards that represent the lowest administrative unit in Nepal, applying multi-step sampling procedure. These PSUs were selected from 21 domains using probability proportional to size (PPS) sampling method, where size is measured based on the number of households. The domains were identified from five major river basins (i.e., Bheri-Karnali, Seti-Karnali, Main-Karnali, Mohana, and Mahakli), three ecological regions (i.e., mountain, hill and Tarai plains), and the presence/absence of hydropower projects. The disaggregation of the sample size across the 21 strata is summarized in Table A1.
From each PSU, 30 households were selected using systematic random sampling method. The sampling interval n depends on the number of households in a given PSU; that is, n = number of households/30. While selecting a random household, a landmark was identified and every nth household was selected for interview thereafter. Households were eligible for the sample if they were a permanent resident of the ward and if the chief wage earner or alternative knowledgeable house member was available and willing to participate. Respondents living in the ward for at least one year were considered permanent residents. If the sample household failed to meet the inclusion criterion or refused to participate, the next neighboring household was selected in its place.
The survey questionnaire, originally designed in English, was translated into Nepali for implementation. The survey was carried out during June–July 2017 through paper-based questionnaires simultaneously by 14 survey teams consisting of over 40 enumerators, supervisors and monitors trained by the Nepal Water Conservation Foundation (NWCF). A 6-day training period was conducted from 4–9 June 2017 for the enumerators and supervisors. No issues were reported during the survey. No refusal to participate cases were reported by the survey team. Supervisors coded and verified the collected data before entering into CSpro 5.0.
2.2.2. Analysis of Climate Shocks and Associated Risks
Eight climate shocks were identified as relevant to the region based on scoping studies and FGDs carried out by the research team across various locations in the study area. These eight climate shocks are therefore included in the questionnaire and are the following: droughts, untimely rains, irregular weather, hailstorm, floods, animal disease, serious pest damage to crops, and market shocks. Furthermore, an “other” category was also listed to allow for the identification of other climate shocks that people have perceived in the locality. Respondents were asked to answer the survey questions considering climate-related shocks they may have experienced in the last five years. Data gathered on perceived shocks was analysed in terms of type of shocks, quantified as percentage of respondents that have perceived specific type of shocks, and also discussed as frequency of occurrence of the shock as perceived by the respondents. The severity of the risks associated with the shocks were analysed in qualitative terms (i.e., low, medium, and high). Both frequency of shocks and severity of risks were disaggregated further by physiographic regions (i.e., mountain, hill, and Tarai), and river basins (i.e., Karnali-Main, Seti-Karnali, Bheri-Karnali, Mahakali, and Mohana) to understand the variation of perceived shocks across Western Nepal. Chi-squared test of independence was conducted to provide p-values to test statistical significance of the presented results. The p-value of p < 0.005 suggests the results to be significant (at 95% level of significance), while those with p-values of p < 0.001 (at 99.9% level of significance) suggest the results to be highly significant. The survey responses were analysed in STATA, a statistical analysis software.
2.2.3. Analysis of Climatology of Climate Shocks
Nine indices of precipitation and temperature relevant to the climate shocks considered here were identified from the comprehensive list of World Meteorological Organization (WMO) Commission for Climatology (CCl) expert team on Sector-specific Climate Indices (ET-SCI). Selected references are defined in Table 2. Literature review and expert opinion was used to subjectively relate the indices to five of the eight climate shocks considered here, namely: drought, irregular weather, floods, animal disease and serious pest damage to crops. The “untimely rain” is not considered as it cannot be sufficiently described by the climate change indices defined at annual scale here. Hailstorms are not considered as the formation of hails but are governed by the combination of thunderstorms, wind updrafts and freezing temperatures of clouds higher in the atmosphere. The ET-SCI indices only consider rainfall and surface temperatures, which are not sufficient to account for hailstorm conditions. Market shocks are also not directly related to the indices. Upholding the principal of parsimony, the 10 indicators were selected so that a minimum number of indicators relatable to multiple shocks may be considered.
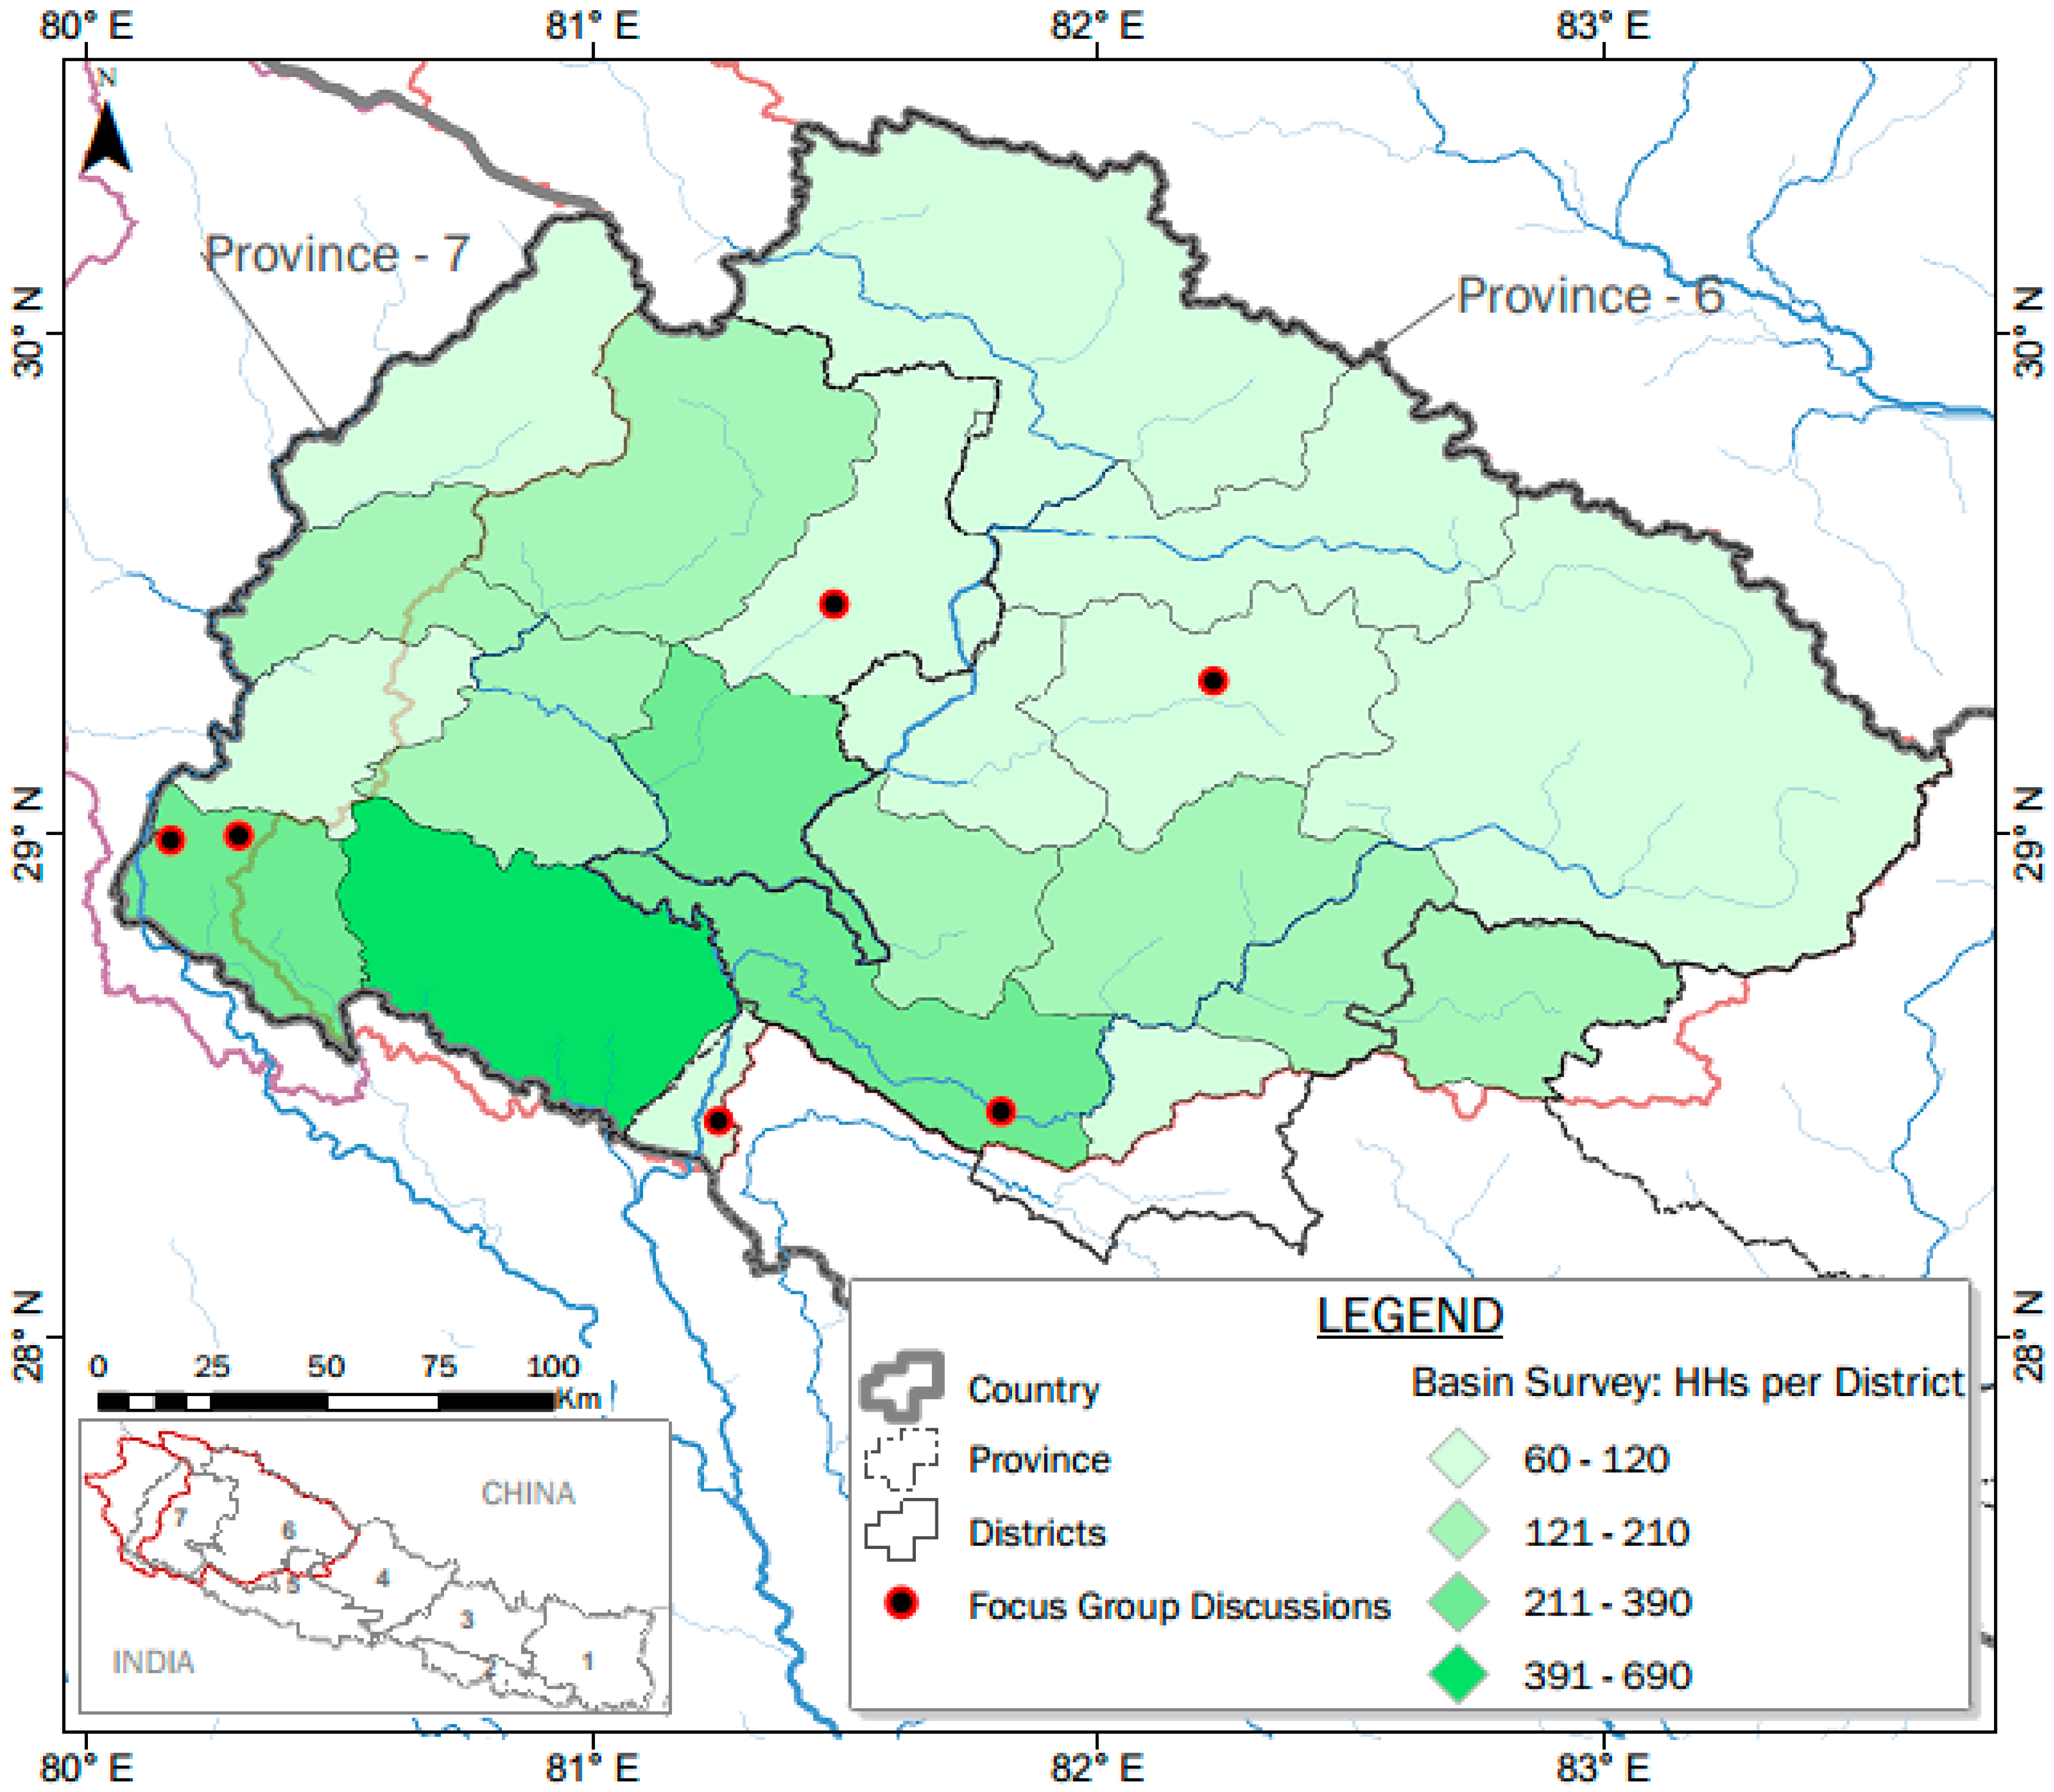
The R-based ClimPACT2 tool developed by the ET-SCI was used to calculate the relevant indices at nine representative stations (shown in Figure 1) with good quality long-term data for 1980–2005 across Western Nepal. Two of the stations fall in the mountain region, four in the hill region and three in the Tarai region, the southern plains of Nepal, providing a basis for comparison of region-specific implications of the climate indices. Further discussion of selection of the nine stations for climate change analysis is provided in [30]. Quality of data at all nine stations were checked in ClimPACT2 and all identified outliers were reviewed prior to index calculation. Next, trends in the climatic indices were evaluated by calculating the Mann Kendall Trend (MKT) test [31,32] and Sen’s slope statistics [31]. Further details on the implementation of the analysis is provided in [32].
3. Results
Figure 3 presents the coverage of the sampled households (HHs) in the survey. A total of 3660 HHs were surveyed across the Karnali, Mahakali and Mohana river basins. Respondents from the hill, mountain, and Tarai regions were 50%, 20%, and 30%, respectively. In terms of gender disaggregation, 71% of the respondents were male. The surveyed HHs have average population of seven persons/HH, with minimum of one (1) and maximum of 25. While the average HH size remains similar across all basins, results show that it is highest among the Dalit population, with a 7.5 average. Approximately 60% of the sample were either Brahmin or Chettri, followed by 20% of indigenous and 20% of Dalit and less than 1% of Muslim or other unidentified castes. The proportion of female-headed HHs were consistent across ethnicity stratification and ranged from 14% to 17%. Thirty-one percent of the population was between 0–14 years of age, 62% between 15–59 years while 8% were over 64 years. Details on perceived climate shocks, severity of risks, climatological analysis, and learnings from the responses are discussed in the following sub-sections.
3.1. Perceived Climate Shocks
Figure 4 present the type of shocks perceived by HHs in the last five years across Western Nepal and disaggregated by the three eco-regions: mountain, hill and Tarai plains. Floods and droughts were identified as the two key climate risks that are affecting agriculture and livelihoods in the study region. The p-value based on Chi-squared statistic is also presented in the Table 3 as a measure of statistical significance as well as the goodness of fit of data, or the probability of the event occurring. Out of 3660 surveyed HHs across Western Nepal basin, 79% reported experiencing at least one type of climate shock. In an aggregate, 54% of the respondents have perceived drought, whereas hailstorm is experienced by 52%, untimely rain by 33%, and serious crop damage by some 24%. Though drought is the dominant shock at the scale of Western Nepal, it is not the dominant shock at the individual eco-region level.
Disaggregated results show that perception varies with the region. A majority of respondents who had experienced most of the considered shocks came from the hill region (e.g., drought, untimely rain, irregular weather, hailstorm, etc.). Floods on the other hand, are the most common in Tarai. Due to the topography of the Tarai plains, the entire region is vulnerable to flooding and inundation. Meanwhile market shock emerged as the dominant shock in the mountain region. The mountain region in Karnali is one of the poorest and remotest areas in Nepal with limited to no road access in many areas. Given the low income level in the region, accommodating to high fluctuations in market prices on top of the already high cost of air transport may be a high risk factor for mountain communities. However, it should be noted that the mountain region, comprising over 50% of Western Nepal, is not as densely covered by the surveyed sample as the Tarai which comprises about 15% (Figure 4).
Across the regional scale, the pre-dominant climate shocks were droughts (54%), hailstorms (52%), and untimely rains (33%) (Figure 4a). However, the results vary across the physiographic regions. For example, the climate shock pre-dominant in Tarai is the flood (60%) and followed by serious pest damage to crop (54%) and market shocks (50%) (Figure 4b). It is more likely for HHs in Tarai to have access to and own comparatively larger plots of land to undertake commercial farming. Agriculture in the hills and mountains, especially in Western Nepal are largely for subsistence farming, hence pest damage may not be as big of a concern. Additionally, tropical temperatures in the Tarai could also contribute to high amounts of pest infestation and damage. In case of the hill region, untimely rain is the pre-dominant climate shocks (63%) followed by hailstorm (61%), and irregular weather (59%) (Figure 4b); whereas for the Mountains, market shocks (41%), animal disease (33%), droughts (29%), hailstorm (29%), and irregular weather (29%) are the prevailing form of climate shocks (Figure 4b).
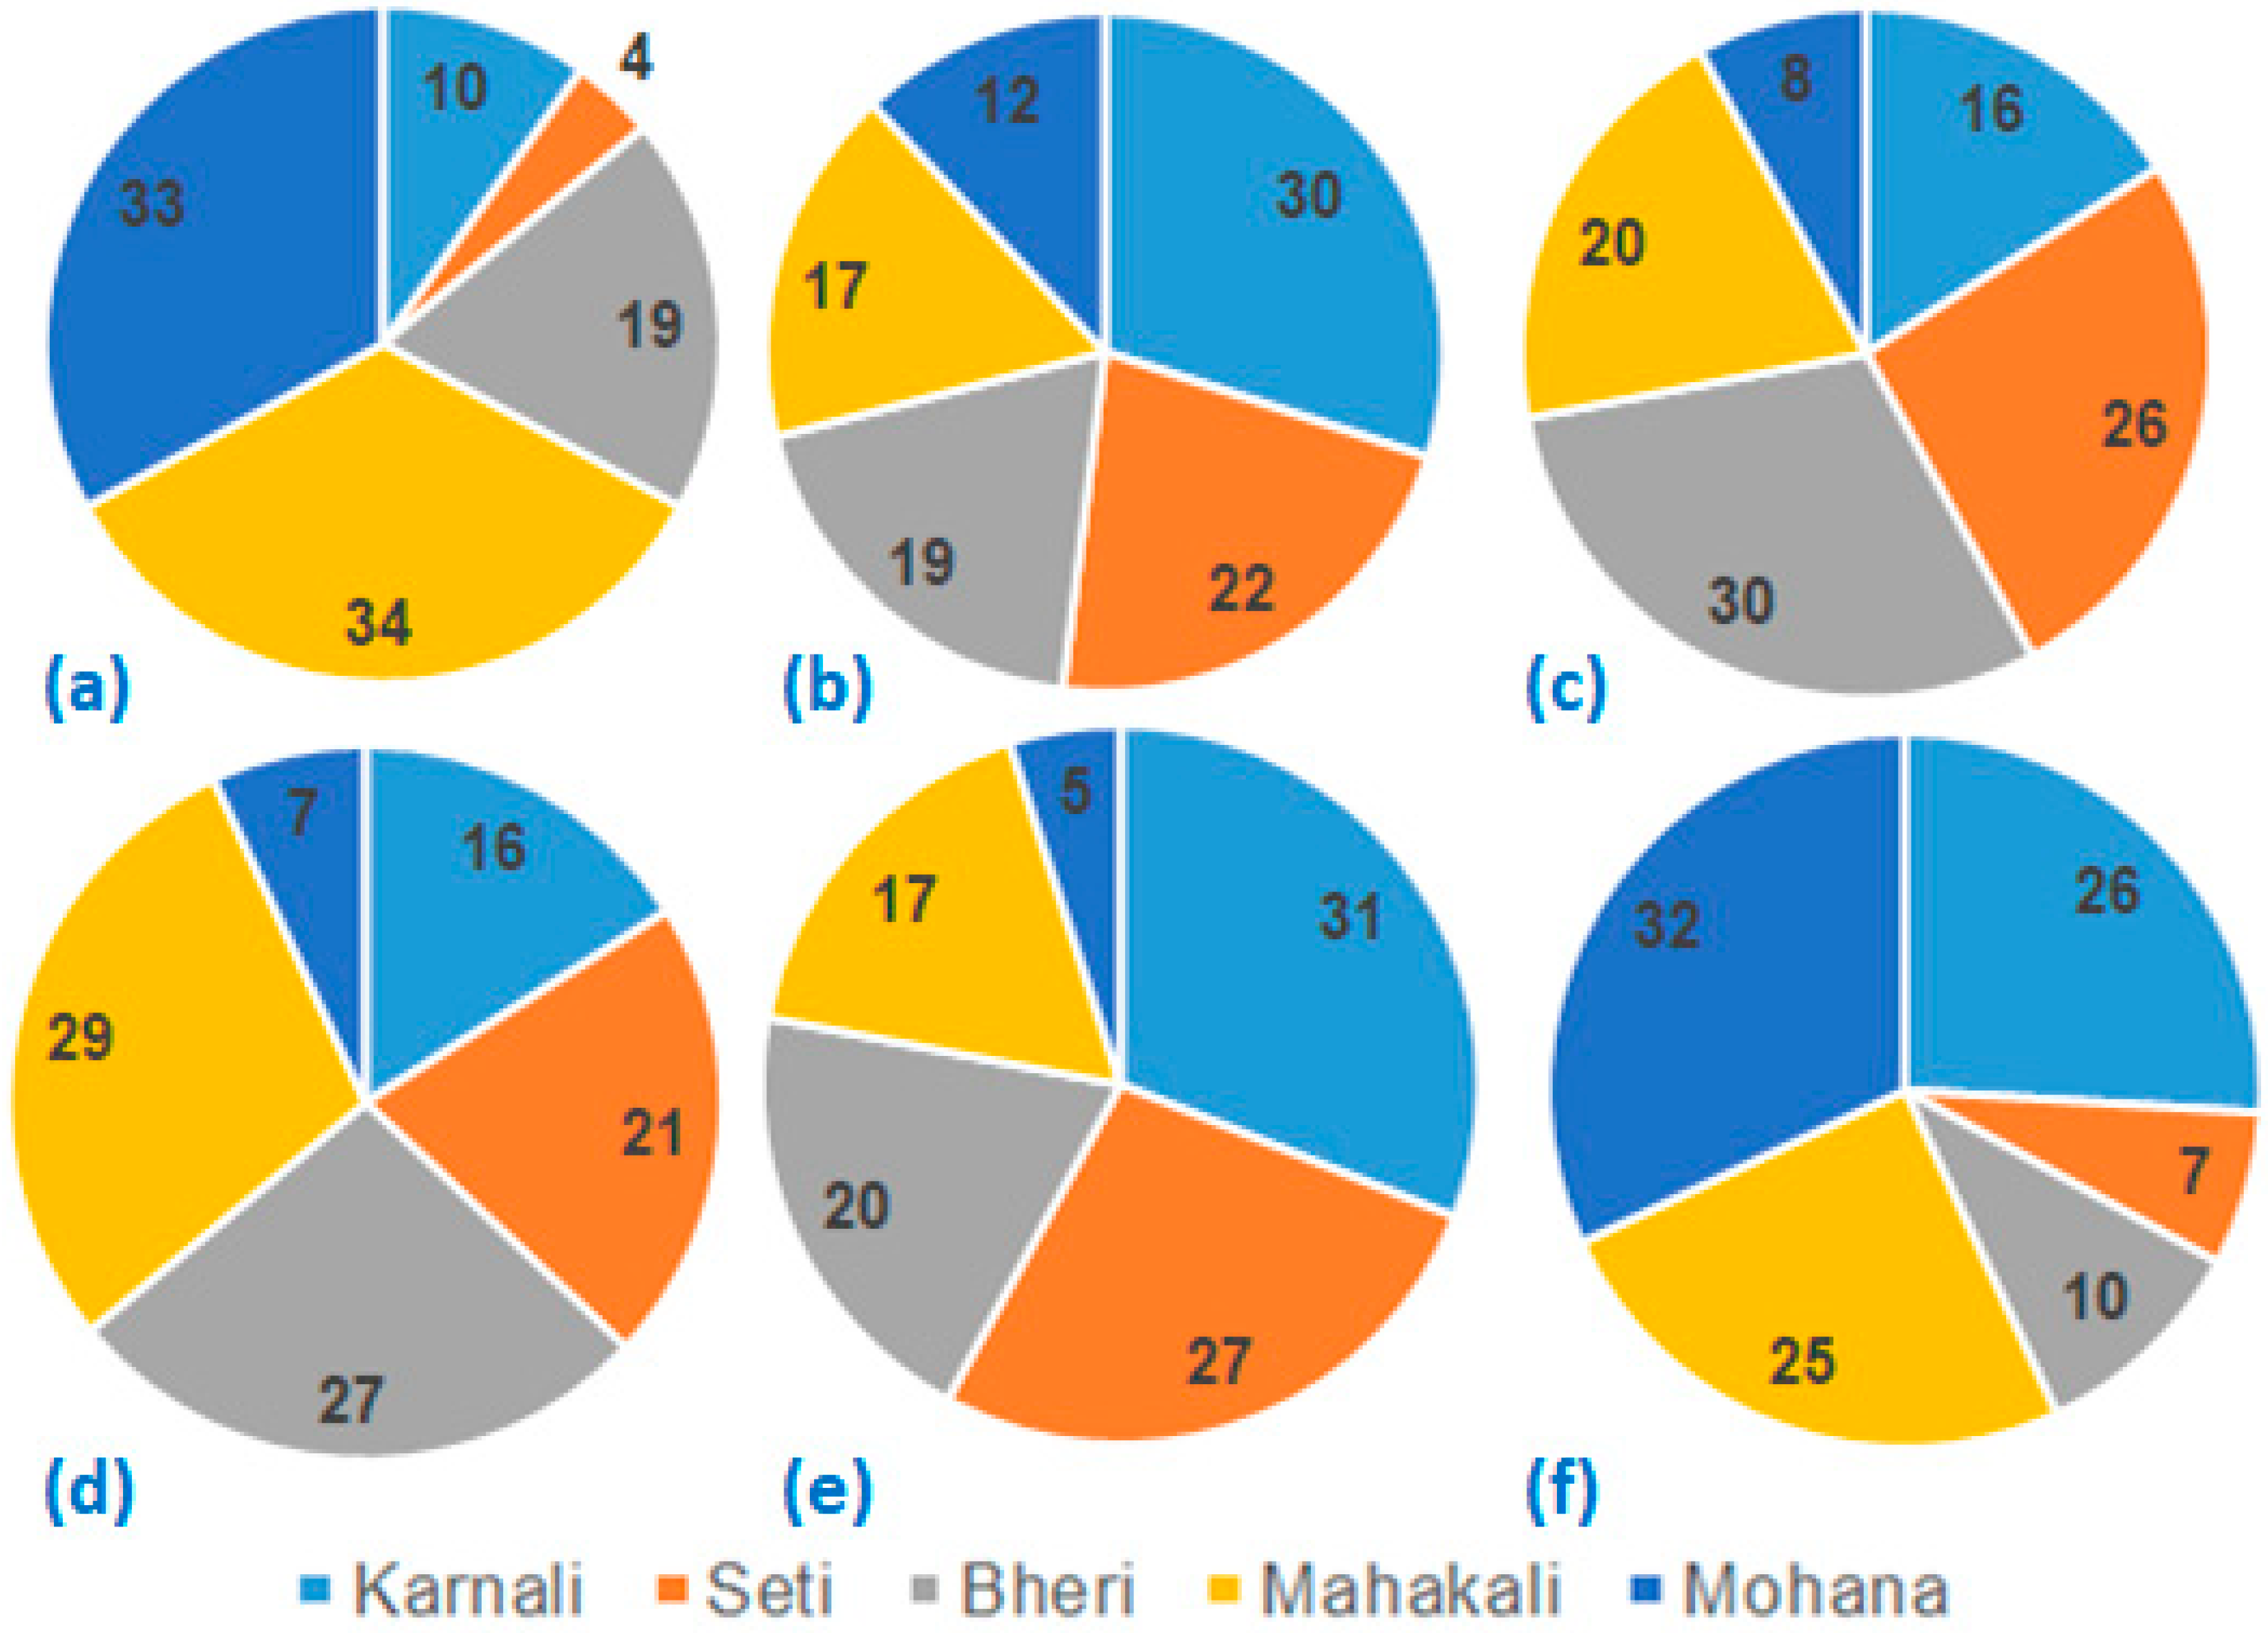
Survey results were also disaggregated by five sub-basins as shown in Figure 5. Among the five basins considered, respondents from the Karnali-Main, comprising largely of the mountain and hill regions, experienced hailstorms and droughts the most, while flooding (Figure 5a) was experienced the most in the Mahakali and Mohana basins. However, the dominance of specific shocks is not as persistent at basin scale as seen in regional scales with values lower than 40% reported for most shocks across the basins. Thirty percent and 17% of the respondents in Karnali-Main and Seti-Karnali basins have experienced droughts in the last five years, respectively. Drought, hailstorm, untimely rain and irregular weather were less prevalent in the Mohana basin compared to other basins. However, flood and serious pest damage to the crops are the most dominant in the Mohana, the basin originating in the mid-hills and most of the areas lying in southern plain of Nepal.
In terms of frequency of climate shocks, as tabulated in Table A2 and Table A3, floods were noted on an average of three times over the last five-year period, with some respondents saying they had experienced flooding events up to 65 times within the same time frame. Similarly, respondents noted that droughts occurred at least twice in the five years, with the maximum frequency reported at 36. Serious pest damage to crops followed closely at approximately three times over a five-year period. When observing this data through the regional and basin lenses it can be noted that both droughts and untimely rains were perceived to occur at similar frequencies across all three geographical regions. However, flooding was noticeably higher with the average frequency of flooding in the Tarai at 3.56 times in five years, while the hill respondents reported nearly 2.25 times. Across the sub basins we see that flooding was reported to occur most often in the Mohana and Seti-Karnali basins at 3.73 and 3.05 times, respectively.
Climate change/variability may lead to an increase in the occurrence of natural disasters like floods and droughts and exacerbates their risks and impacts. Climate extremes inducing climate shocks will continue to affect various sectors and communities. Survey results showed that HHs across the studied region have repeatedly perceived these shocks and felt their negative impacts even over the relatively short timeframe of the past five years.
3.2. Climatological Trends in Climate Shocks
Climatological trends at nine stations spread across three ecological regions and five basins were analysed based on selected climatic-indices and their linkage with perceived climatic shocks. Quality of time series data, both temperature and precipitation, were assessed using ClimPACT2. Nine ET-SCI indices summarized in Table 2 were identified as relevant to the shocks. Figure 1 shows the relative location of the nine stations while Figure 6 shows the trend values in terms of the p-value for the MKT and the Sen’s slope. Tabulated values are provided as Table A4. The Sen’s slope and MKT could not be evaluated for some stations due to gaps in the data. The stations spread over the three eco-regions provide a basis to compare the trends across the mountain, hill and Tarai stations. In Figure 6, nearly 80% of cases do not show statistical significance at 5% confidence level. The majority of the statistically significant p-values considering 5% confidence (or p < 0.05) appear in the mountain (two cases) and hill (eight cases) stations for the temperature parameters. Highly statistically significant trends with p < 0.001 are only reported six times. In Figure 6b, stations in the same regions are not always showing the consistent direction and magnitude for the Sen’s slope.
Six of the climate shocks considered here have been related to a subset of climate indices for the comparison of people’s perception and historical data trends on climate extremes. Note that the trends are analysed for 1980–2005, whereas the survey conducted in 2017 represents the impression from the last five years; tentatively 2012–2017. Hence, people’s perception and historic trends based on climate data may not match perfectly. Droughts were reported as the dominant shock which the majority of respondents experienced across Western Nepal.
Droughts represent conditions with extended periods of dryness with no rainfall and high temperatures. Thus, the temperature (tn90p, wsdi) and precipitation (cdd, spei) indices, indicative of such conditions, are related with drought here. The tn90p represents the percentage of days with high temperatures indicated by nights with minimum temperatures higher than the 90th percentile. The wsdi tracks the consecutive occurrence of days with maximum temperatures higher than the 90th percentile. Similarly, cdd represents occurrence of consecutive dry days with precipitation lower than 1 mm. spei is a standard measure of drought. The trend for tn90p indicated by Sen Slope in Figure 6b is positive across all stations except station 104 in the hills. For stations 202, 303 in the mountains, 194 in the hills and 209 in the Tarai, these positive trends are statistically significant. The trend in wsdi is highly positive for all hill stations, statistically significant for station 104 and zero for the rest. Similarly, cdd is highly positive across all stations and regions, with a statistically significant value in hill station 513. The spei values across all stations are near zero.
Irregular weather is related here to indices r10mm, rx5day, cdd and cwd. r10mm indicating number of days with rainfall exceeding 10 mm is selected to analyse deviation in occurrence of normal wet days. rx5day represents the quantity of the maximum annual five-day total rainfall, respectively. The cwd is similar to cdd but represents the occurrence of consecutive wet days. Rx5day, cwd and cdd are selected to capture the irregularities in weather pattern caused by extreme rainfall. R10mm has the positive trend for most of the hill and Tarai stations but a negative trend for mountain stations. Rx5day consistently shows an alarming negative slope across all stations, except stations 202 and 514 while cdd is consistently positive. The trend in cwd is not strong or consistent across the stations. As shown in Figure 4, irregular weather is perceived the most in the hills, with 59% respondents reporting it. However, the average frequency of irregular weather reported in the survey (Table A2) is the highest for the mountain. The four indices hint towards irregularity in terms of decline in rainfall. A tighter definition of irregular weather would help direct comparison of perceptions and climate data. Note however that trends in these four parameters are not statistically significant for all stations except for hill station 513 for cdd.
3.3. Perceived Severity of Risk from the Climate Shocks
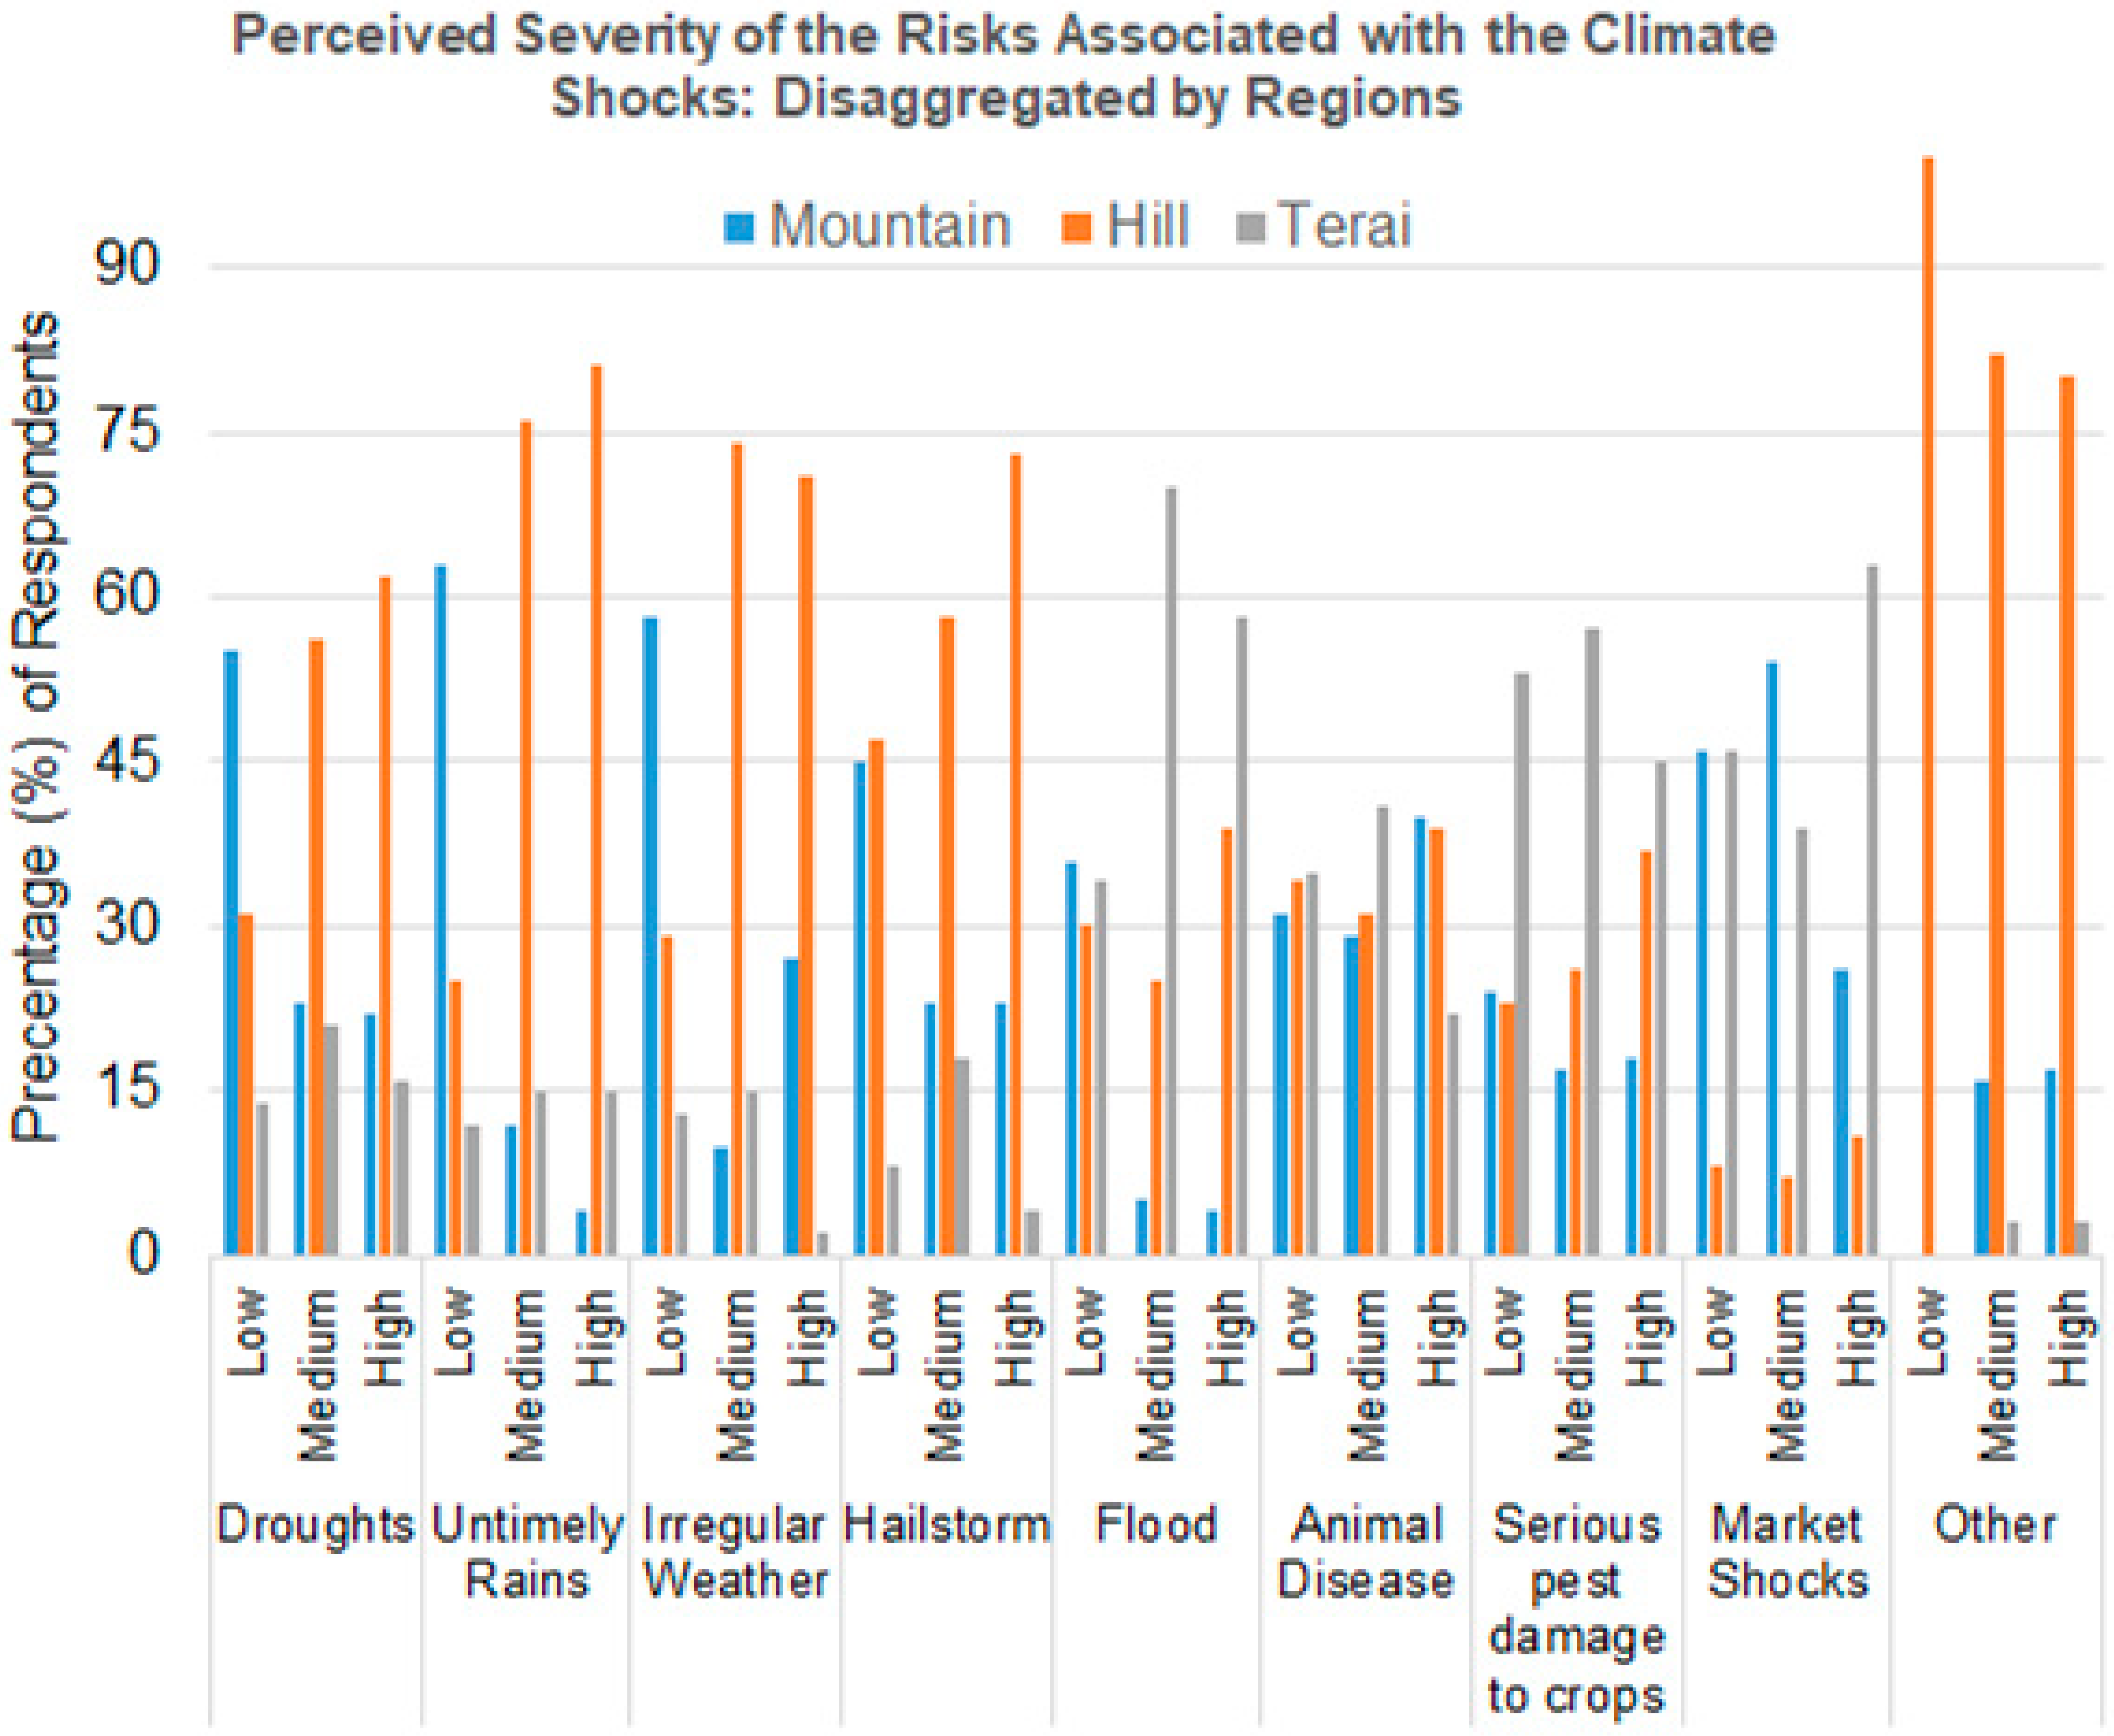
Further information on the severity of risks to the shocks was gathered from the HHs that experienced shocks. In order to know the severity of the climate-induced shocks, respondents were asked to classify the impacts as either low, medium, or high. Severity is defined low if no major harm was done to the household, medium if manageable damage occurred and high if loss of land or life threating events occurred. Results disaggregated by basins are shown in Table 3 and with ecological regions are presented in Figure 7 (please refer Table A5 for data). The highest proportion of the HHs perceived medium severity of risks to the shocks for droughts (45%), untimely rain (55%), irregular weather (46%), animal disease (49%), serious crop damage (61%), and market shocks (49%). It is worthy to note that the most commonly reported shock earlier was droughts, with 54% of the respondents having experienced them, however, their perceived risks are medium across all regions. Over 53% reported high severity of the risks for flood and 41% for hailstorm. In the recent years within Nepal, especially in the Tarai, catastrophic flooding has left many people homeless, with a loss of resources and even the loss of lives. Still, little assistance has been provided to locals to help develop adaptation strategies against floods that in-evidently come with the monsoon every year.
Across the basin categories, it is observed that droughts were most commonly felt in the Karnali basin, with a majority (46%) of the respondents describing the severity as medium. The severity of risks from flooding is consistently considered as “medium” across all three basins with 32%, 35% and 44% of respondents in the Karnali, Mahakali and Mohana, respectively, experiencing medium severity of the risks (Table 3). However, respondents across the study area during the survey as well as FGDs perceive that the damage potential of the recent flood events are increasing. This further supports the need for better adaptation strategies from floods whose frequency might be relatively low, but impacts might be severe.
In general, perceived severity of risks associated with most of the climate shocks is medium. On average, over the past five years, a HH in the Tarai experienced flooding more frequently (3.56 times) than those households in the mountain (2.32 times) and hill (2.25 times) regions (Table A2). However, on further investigation we find that floods are ranked as a high risk shock in the Tarai region more often, while droughts and untimely rains are high impact shocks in the hill region. There is comparatively little dependency on rainwater in the Tarai than in the hills and mountain regions due to easy access to surface water in rivers or groundwater. As a result, untimely rains are less likely to affect communities in the Tarai as much. In the hill region, irrigation sources are mostly river water along with rainwater, and without the seasonal rains, the region is very vulnerable to harvest damage.
3.4. Response to the Shocks
Sixteen potential responses to the climatic shocks, as can be seen in Table 4, were listed in the questionnaire. The respondents were requested to list their response (one or more) to different shocks from the list of 16. Despite the prevalence of climate shocks like floods and droughts in many parts of Western Nepal, communities lack measures for-post disaster recovery. Results showed that the most common response to the climatic shocks was “doing nothing”. This further strengthens the argument that there is a knowledge gap amongst households on how to effectively adapt to the various climate risks that they face on a day to day basis. The only instance where the outcome was varied was for “serious pest damage to crops”, where the response is “use of pesticides”. Farmers have known how to combat pest damage for generations, making this climate shock one that they are familiar with, and well equipped for. The fear of financial loss or the threats to food security from “serious pest damage to crops” has potentially provided locals with the incentive to develop adaption measures that they can apply at individual level to curb such risks. Shocks like floods and droughts may not be similarly managed as easily and cheaply at the individual level.
Top three responses for droughts, untimely rains, irregular weather, and hailstorm were doing nothing, left the land fallow, and borrow money from relatives/others (Table 4). The percentages of responses, however, varied for different shocks, even though doing nothing was reported by more than 70% in all these shocks. In case of flooding, in addition to doing nothing and leaving the land fallow, 5% of the respondents also answered “reduced food consumption”. This could be due to several factors including crop damage, food rations ruined or depleted by the flood water, and delays in providing food supply or relief material to the affected communities. In case of animal disease, selling livestock and in case of pest damage to crops, changing cropping patterns are new types of responses compared to the other shocks that the community are practicing. When there are market shocks, 15% of respondents reacted by borrowing money from relatives/others and reducing food consumption.
In addition to self-responses, this study also analysed the pattern of support services provided by other agencies, including government, to assess the effectiveness of the provided services. A very low percentage, only 3.3%, of the sample households received support services of some form (Table 5). However, whether the post-disaster support was accessed with pro-activeness of community themselves or those of supporting agencies are not evident due to lack of adequate data. It was noted that a higher proportion of marginalized Dalit households (7.1%) said that they got support for aftershocks than other ethnic groups. Although the percentage of households receiving some support was very low, less than 10%, the level of support that mountain household received after the shocks was higher (6.4%) compared to hill (2.2%) and Tarai (2.9%).
Furthermore, respondents who received any assistance were asked to indicate the agency responsible for aiding in the post-recovery process. More than two-thirds of the respondents (67%) indicated that the government agencies were major service providers for climatic shocks (Table 5). Other notable service providers included relief agencies, and groups in the communities. Table 6 summarizes the responsible party for providing support services across all climate-related events. However, support from family and local community groups were found to be the most time sensitive, occurring only at the time of the shock. Interestingly, saving community groups and friends are also the leading source for loans among the surveyed population, at 30% and 24%, suggesting a higher propensity to depend on these sources.
Government agencies—National Government Agencies, District Development Committee (DDC) and Village Development Committee (VDC)—were noted to have delays when providing their relief services. In the past, the response lag time from the government agencies could be explained by the presence of bureaucracies, systematic nuances, and inadequate systems. Now that the municipalities hold more authority in the federal government, the documentation and relief efforts are expected to have a quicker response time. Only 30% of the respondents said that government agencies provide support services immediately at the time of the climatic shock. This highlights the need for better transfer systems as relief in the form of monetary funds, sustenance and transportation (such as boats) is the most crucial following the immediate onset of natural disasters. Communities within Karnali district lamented how boats were not provided as a timely response to the massive flooding that occurs each year with the monsoon rains, hereby restricting their mobility and hindering the process of ration collection. The current LAPAs have helped individuals across an array of thematic areas including agriculture, livestock, and food security. Incorporating resilience strategies prior to climate shocks can further help communities improve and protect their livelihoods. Further, NAPA and LAPA strategies must be gender-responsive and must incorporate local existing knowledge, innovations by communities through collective action and other local practices into its policies too.
5. Discussion and Conclusions
Nepal’s geographical landscape already makes it vulnerable to an array of climate shocks. Over the past decades, climate-induced changes have contributed in increased frequency, duration and severity of the risks to many of the climate shocks experienced by communities in Nepal. Additionally, a large number of communities living in these flood and drought prone areas are low to middle income households, hereby having limited access to the necessary resources to equip them with relevant adaptation strategies. The increased risks to climate/non-climatic shocks on water and agriculture sectors are likely to have significant implications on communities, hereby affecting the national economy that relies so heavily on natural resources. It is imperative that Nepal also adopts necessary adaptation strategies to better equip communities with the tools and knowledge required to protect themselves against future climatic hazards.
Western Nepal has a significant potential to contribute to national prosperity with a variety of comparative advantages. However, the region is relatively more vulnerable to climate change impacts. Therefore, understanding the level of climate shocks/stress, severity of risks to the shocks, and the past responses across different locations are important for future climate-resilient development planning. This study assessed perceived climatic shocks, climatological trends and their links to the perceived shocks, perceived severity of risks, and responses in the Karnali-Mahakali river basin in Western Nepal. A large-scale (3660 household) basin-wide survey was carried out to assess perceptions on climatic shocks, perceived severity of risks to the shocks, and responses; and climatological data from nine stations were analysed for trends in climatic indices.
One or more kind of climate shocks are perceived by approximately 80% of the respondents. Droughts and hailstorms are perceived by more than half of the respondents, whereas 33% and 24% have perceived untimely rains and serious crop damage, respectively. A household in the Tarai experiences flooding more often (>3.56 times) than in the mountain (2.32 times) and hill (2.25 times) regions. Floods are a high-risk shock in the Tarai region, while droughts and untimely rains are high-risk shocks in the hill region. Previous research also highlighted that the Karnali and Mahakali, two out of the four largest rivers in Nepal, are comparatively less vulnerable to flooding in the mountain and hill regions, but more likely to create damage in the Tarai plains [34]. Such variation in perception of floods across the regions may also stem from communities in hill and mountain regions, residing largely in hill and mountain tops, where rising water levels in the river may not necessarily impact livelihoods. In contrast, agricultural lands in Tarai lie closer to riverbanks for easier access to water for irrigation, making them more susceptible to floods. Prevalence of rain-fed agriculture in the hill as compared to Tarai may explain the higher perception of untimely rains, hailstorm and irregular weather that directly impact crop production in the hills. The results also vary across the basins; respondents from the Karnali-Main comprising largely of the mountain and hill regions, experienced hailstorms and droughts the most, while most people in Mahakali and Mohana experienced flooding. Mohana basin, lying entirely in the Tarai, comprises of a parallel network of streams originating in the steep mid-hills and abruptly flattening into the plains. The streams are characterized by peak flows and flash floods during the monsoon. As a result, it experiences more flooding as well as serious damage to crops. As a majority of agricultural activities in Western Nepal rely on water resources, various climate shocks that directly and indirectly affect water availability can quickly ruin yield and disrupt crop harvesting. The impact of one shock can have differing levels of severity across the various ecological regions and basins. For instance, HHs in the Tarai have access to groundwater, making them less reliant on rainwater for agriculture than HHs in the hill and mountain regions. The Nepali agriculture industry contributes to 27.04% (https://www.statista.com/statistics/425750/nepal-gdp-distribution-across-economic-sectors/) of the GDP. As a result, the implications of climate change on agriculture in Nepal can have significant impacts on livelihood security of local communities and the national economy.
The climatological trends of nine selected indices at nine stations spread across the three ecological regions and five basins also complements the perceived climate shocks. The results indicate increases in dry and warmer conditions with a majority of the temperature indices trending towards rise in temperatures, while precipitation indices like rx5day and cwd indicate a decline in rainfall. More extreme events like floods and droughts are therefore already experienced, which are likely to increase in future as well. The positive historical trends in tn90p and cdd support the high perception of droughts. The positive trend in wsdi, which only occurred in the hills and higher Sen’s slope for cdd in the hills, may support the perception of drought as the fourth most reported shock perceived by 53% of respondents in the hills. The higher frequency of occurrence of droughts in mountains than in the hills, however, cannot be supported by the trend data. Flood is related to r20mm, cwd and rx5day, all of which do not show statistical significance trends at 95% level of confidence. All three indices consider high rainfall situations that are likely to trigger floods. The highly negative trend in rx5day for Tarai stations 209 and 207 in comparison to the mountain and hill stations do not support people’s perception of higher dominance and frequency of floods in the Tarai. The majority of the stations also have negative slopes for r20mm, except for station 514 in the hill. Climate shocks like animal disease and serious pest damage to crops have been related to the temperature indices tmm and tn90p, considering the higher likelihood of occurrence, growth and spread of disease causing pests and microbes in higher temperatures. The tmm represents mean temperature while tn90p is the percentage of warm days. Except station 514 in the hill and 207 and 405 in the Tarai, for which Sen’s slope could not be evaluated, the trends in tmm and tn90p are significant or highly significant. All stations report a positive trend, except station 104 in the hill reporting a high negative value that is also statistically significant. There is no differentiable trend across the three ecological regions. However, the general rise in temperature across all regions supports the prominence of the pest damage to crops in Tarai where large scale and commercial agriculture is more common than in other regions. Overall, the emerging trends hint towards an increase in dry and warmer conditions with the majority of the temperature indices trending towards rise in temperatures while precipitation indices like rx5day and cwd indicate a decline in rainfall. Such historic trends can explain the survey reports on occurrence of droughts, temperature rise conducive to pest damage to crops, and irregular weather.
Perceived severity of risks from climate shocks were also analyzed. The highest proportion of households have perceived a medium severity for drought, untimely rain, irregular weather, animal disease, serious crop damage, and market shocks. More than half of the respondents have perceived high severity of the risks to flood and 41% for hailstorm. Literature supports that the topography of the Tarai plains makes the entire region more vulnerable to flooding and inundation [34]. A large proportion of households in Nepal, and the Tarai depend on agriculture and rural livelihoods for their income and food security. The susceptible geographical topography in the Tarai, coupled with the dependency on agriculture, further aggravates the severity risks to floods as families have a lot at stake. Research conducted by [34], highlights that the Karnali and Mahakali Rivers, two of the four largest in Nepal, are comparatively less vulnerable in the mountain and hill regions. Floods are more likely to create damage in the Tarai plains, and as the paper points out, this is further exacerbated by climate change.
Despite the prevalence of climate shocks like floods and droughts in many parts of Western Nepal, communities lack measures for post disaster recovery. With 70% of the households relaying that their response to climatic shocks has been “doing nothing”, this study highlights the imminent need to better equip Nepalese communities to adopt adaptation strategies. A small percentage of respondents were forced to sell their productive assets, including livestock, while some reduced food consumption in response to flooding. Local communities frequently have limited access to resources and knowledge that can protect them against these climate risks. It is also more likely that these vulnerable communities do not have the required information to access available government or non-government- based assistances. As a result, more often than not, communities are unable to do anything in response to climate shocks. A small portion of the respondents, who potentially have access to information and resources, and have more flexibility in use of available resources, are responding in different ways such as selling livestock in case of animal disease, changing cropping patterns and using pesticides in case of pest damage to crops. There are also cases where farmers left their land fallow as it was damaged due to irregular weather. Some cases of “reducing food consumption” as a response for shocks was also reported, indicating the extreme response which is of concern on a humanitarian ground.
Climate change continues to be a challenge for development, and without building the resilience of communities and ecosystems, rural communities will continue to lose assets including land, crops, housing, livestock and health. The design of adaptation strategies and response mechanisms to deal with climate shocks and associated impacts will therefore need to take these aspects into consideration. In order to empower communities across Nepal with the necessary skillset, there should be improved access to resources, services, markets, technologies, and decision making agencies that are tailored to their local and physiographic needs.
Finally, the methodology adopted in this study is applicable to other areas as well. Depending upon location and dominance of issues, the questionnaire may need to be customized appropriately to ensure that adequate information is collected to support for appropriate interpretation of results.
Author Contributions
Conceptualization, V.P.P. and L.B.; methodology, V.P.P., S.D., and I.R.J.; software, A.S. and S.D.; validation, I.R.J. and V.P.P.; formal analysis, A.S., S.D. and V.P.P.; investigation; V.P.P. and I.R.J.; resources, L.B.; data curation, A.S., I.R.J. and S.D.; original draft preparation, V.P.P., A.S., and S.D.; review and editing, I.R.J. and L.B.; visualization, V.P.P. and L.B.; supervision, L.B.; project administration, L.B. and V.P.P.; funding acquisition, L.B.
Funding
This research was funded by the United States Agency for International Development (USAID), award number AIT-367-IO-16-00002.
Acknowledgments
This study is made possible by the generous support of the American people through the United States Agency for International Development (USAID) under Digo Jal Bikas (DJB) project. The contents are the responsibility of the authors and do not necessarily reflect the views of USAID or the United States Government. We also would like to acknowledge Nepal Water Conservation Foundation (NWCF) for helping with the basin-wide survey and data digitization and the local people/respondents for kindly agreeing to respond to the questionnaire.
Conflicts of Interest
The authors declare no conflict of interest. The funders had no role in the design of the study; in the collection, analyses, or interpretation of data; in the writing of the manuscript, or in the decision to publish the results.
Abbreviations and Acronyms
| CCI | Commission for Climatology |
| CDD | Consecutive Dry Days |
| CWD | Consecutive Wet Days |
| DADO | District Agriculture Development Office |
| DDC | District Development Committee |
| DOI | Department of Irrigation |
| DWIDM | Department of Water-Induced Disaster Management |
| ET-SCI | Expert Team on Sector-specific Climate Indices |
| FGD | Focus Group Discussion |
| GDP | Gross Domestic Product |
| HHs | Households |
| HKH | Hindu Kush Himalayan (HKH) |
| KarMo | Karnali-Mohana |
| KII | Key Informant Interview |
| Km2 | Square Kilometers |
| LAPA | Local Adaptation Plan of Action |
| masl | Meters Above Mean Sea Level |
| MKT | Mann Kendal Test |
| MW | Mega Watt |
| NAPA | National Adaptation Plan of Action |
| NWCF | Nepal Water Conservation Foundation |
| PSUs | Primary Sampling Units |
| RCM | Regional Climate Model |
| SPEI | Standardised Precipitation Evapotranspiration Index |
| VDC | Village Development Committees |
| WMO | World Meteorological Organization |
Appendix A

Table A1.
Selected sample size by PSUs. HP is hydropower. PSU is primary sampling unit.
| Basin | Eco-Region | Hydro Clusters | Population | Population Proportion | Sample Size | Sample PSUs | Adjusted Sample Size |
|---|---|---|---|---|---|---|---|
| Bheri-Karnali | Mountain | HP | 8095 | 0.2 | 7 | 1 | 30 |
| None HP | 24,281 | 0.6 | 21 | 1 | 30 | ||
| Hill | HP | 241,428 | 5.8 | 209 | 7 | 210 | |
| None HP | 556,754 | 13.4 | 481 | 16 | 480 | ||
| Main-Karnali | Mountain | HP | 25,868 | 0.6 | 22 | 1 | 30 |
| None HP | 376,937 | 9.1 | 326 | 11 | 330 | ||
| Hill | HP | 138,480 | 3.3 | 120 | 4 | 120 | |
| None HP | 264,786 | 6.4 | 229 | 8 | 240 | ||
| Tarai | HP | 6027 | 0.1 | 5 | 1 | 30 | |
| None HP | 17,0138 | 4.1 | 147 | 5 | 150 | ||
| Seti- Karnali | Mountain | HP | 87,602 | 2.1 | 76 | 3 | 90 |
| None HP | 191,047 | 4.6 | 165 | 6 | 150 | ||
| Hill | HP | 60,395 | 1.5 | 52 | 2 | 60 | |
| None HP | 362,092 | 8.7 | 313 | 10 | 300 | ||
| Mahakali | Mountain | HP | 51,719 | 1.2 | 45 | 2 | 60 |
| None HP | 81,655 | 2.0 | 71 | 2 | 60 | ||
| Hill | HP | 28,976 | 0.7 | 25 | 1 | 30 | |
| None HP | 254,117 | 6.1 | 220 | 7 | 210 | ||
| Tarai | HP | 0 | 0.0 | 0 | 0 | 0 | |
| None HP | 281,129 | 6.8 | 243 | 8 | 240 | ||
| Mohana | Hill | HP | 0 | 0.0 | 0 | 0 | 0 |
| None HP | 7436 | 0.2 | 6 | 1 | 30 | ||
| Tarai | HP | 0 | 0.0 | 0 | 0 | 0 | |
| None HP | 920,830 | 22.2 | 796 | 26 | 780 | ||
| Summary | 12 | 21 valid clusters | 4,139,792 | 100.0 | 3579 | 122 | 3660 |
Table A2.
Frequency of climate shocks across the regions.
| Climate Shocks | Statistics | Mountain | Hill | Tarai | Total |
|---|---|---|---|---|---|
| Droughts | Mean | 2.61 | 2.17 | 2.33 | 2.32 |
| Minimum | 1 | 1 | 1 | 1 | |
| Maximum | 36 | 32 | 8 | 36 | |
| Untimely rains | Mean | 2.31 | 2.48 | 2.41 | 2.43 |
| Minimum | 1 | 1 | 1 | 1 | |
| Maximum | 5 | 6 | 7 | 7 | |
| Irregular weather | Mean | 2.51 | 2.26 | 1.92 | 2.3 |
| Minimum | 1 | 1 | 1 | 1 | |
| Maximum | 5 | 5 | 12 | 12 | |
| Hailstorm | Mean | 2.82 | 1.99 | 2.16 | 2.25 |
| Minimum | 1 | 1 | 1 | 1 | |
| Maximum | 10 | 7 | 7 | 10 | |
| Flood | Mean | 2.32 | 2.25 | 3.56 | |
| Minimum | 1 | 1 | 1 | 1 | |
| Maximum | 5 | 65 | 12 | 65 | |
| Animal disease | Mean | 1.96 | 1.66 | 1.98 | 1.866 |
| Minimum | 1 | 1 | 1 | 1 | |
| Maximum | 5 | 5 | 10 | 10 | |
| Serious pest damage to crops | Mean | 2.23 | 2.63 | 2.61 | 2.55 |
| Minimum | 1 | 1 | 1 | 1 | |
| Maximum | 6 | 10 | 50 | 50 | |
| Market shocks | Mean | 2.76 | 2.59 | 3.79 | 3.26 |
| Minimum | 1 | 1 | 1 | 1 | |
| Maximum | 23 | 5 | 25 | 25 | |
| Other | Mean | 2.18 | 3.8 | 3.5 | 3.54 |
| Minimum | 1 | 1 | 1 | 1 | |
| Maximum | 4 | 15 | 5 | 15 |
Table A3.
Frequency of climate shocks across the sub-basins.
| Climate Shocks | Statistics | Karnali | Seti | Bheri | Mahakali | Mohana | Total |
|---|---|---|---|---|---|---|---|
| Droughts | Mean | 2.41 | 2.38 | 1.93 | 2.63 | 2.18 | 2.32 |
| Minimum | 1 | 1 | 1 | 1 | 1 | 1 | |
| Maximum | 32 | 36 | 5 | 5 | 8 | 36 | |
| Untimely rains | Mean | 2.42 | 2.51 | 2.27 | 2.68 | 2.13 | 2.43 |
| Minimum | 1 | 1 | 1 | 1 | 1 | 1 | |
| Maximum | 7 | 5 | 5 | 6 | 5 | 7 | |
| Irregular weather | Mean | 2.29 | 2.6 | 1.87 | 2.57 | 1.87 | 2.3 |
| Minimum | 1 | 1 | 1 | 1 | 1 | 1 | |
| Maximum | 5 | 5 | 5 | 5 | 12 | 12 | |
| Hailstorm | Mean | 2.45 | 2.21 | 1.85 | 2.5 | 2.05 | 2.25 |
| Minimum | 1 | 1 | 1 | 1 | 1 | 1 | |
| Maximum | 10 | 7 | 5 | 5 | 7 | 10 | |
| Flood | Mean | 2.68 | 3.05 | 2.52 | 2.75 | 3.73 | 3.04 |
| Minimum | 1 | 1 | 1 | 1 | 1 | 1 | |
| Maximum | 12 | 5 | 65 | 6 | 12 | 65 | |
| Animal disease | Mean | 1.96 | 1.85 | 1.63 | 1.93 | 1.74 | 1.87 |
| Minimum | 1 | 1 | 1 | 1 | 1 | 1 | |
| Maximum | 10 | 5 | 5 | 5 | 5 | 10 | |
| Serious pest damage to crops | Mean | 2.25 | 2 | 3.4 | 3.26 | 2.09 | 2.55 |
| Minimum | 1 | 1 | 1 | 1 | 1 | 1 | |
| Maximum | 10 | 7 | 5 | 50 | 5 | 50 | |
| Market shocks | Mean | 2.48 | 3.78 | 2.67 | 3.75 | 3.51 | 3.26 |
| Minimum | 1 | 1 | 1 | 1 | 1 | 1 | |
| Maximum | 5 | 23 | 5 | 25 | 11 | 25 | |
| Other | Mean | 3.27 | 2.72 | . | 6.9 | 5 | 3.53 |
| Minimum | 1 | 1 | . | 1 | 1 | 1 | |
| Maximum | 15 | 5 | . | 10 | 5 | 15 |
Table A4.
Climatological trends in nine ET-SCI climatic indices. Slope is Sen’s slope and p-value is MKT p-value. Red-shading indicate p-values < 0.001, which indicate a high statistical significance while yellow-shading indicate p-values < 0.05, which show a statistical significance at 5% confidence level.
| Parameter Trend Over [1980–2005] | s202 @ Mountain | s303 @ Mountain | s514 @ Hill | |||
| Slope | p-Value | Slope | p-Value | Slope | p-Value | |
| tmm | 0.048 | 0.000 | 0.028 | 0.107 | ||
| tn90p | 0.272 | 0.047 | 0.236 | 0.010 | ||
| r10mm | −0.333 | 0.061 | −0.221 | 0.203 | 0.444 | 0.176 |
| wsdi | 0.000 | 0.062 | 0.000 | 0.931 | 0.000 | 0.609 |
| r20mm | −0.200 | 0.063 | −0.067 | 0.216 | 0.429 | 0.059 |
| cdd | 0.500 | 0.315 | 0.258 | 0.674 | 0.545 | 0.383 |
| cwd | 0.185 | 0.095 | −0.059 | 0.510 | −0.100 | 0.633 |
| rx5day | −0.511 | 0.640 | −0.596 | 0.362 | 0.058 | 1.000 |
| spei | −0.003 | 0.000 | −0.005 | 0.000 | ||
| Parameter Trend Over [1980–2005] | s104 @ Hill | s406 @ Hill | s513@Hill | |||
| Slope | p-Value | Slope | p-Value | Slope | P-Value | |
| tmm | 0.055 | 0.001 | 0.030 | 0.005 | 0.029 | 0.028 |
| tn90p | −0.487 | 0.001 | 0.088 | 0.591 | 0.166 | 0.176 |
| r10mm | −0.300 | 0.122 | 0.059 | 0.740 | 0.000 | 1.000 |
| wsdi | 0.633 | 0.001 | 0.212 | 0.052 | 0.300 | 0.184 |
| r20mm | −0.267 | 0.097 | 0.000 | 0.912 | 0.000 | 0.921 |
| cdd | 0.720 | 0.365 | 1.444 | 0.112 | 1.244 | 0.024 |
| cwd | −0.231 | 0.063 | 0.000 | 0.965 | 0.000 | 1.000 |
| rx5day | −0.400 | 0.724 | −1.342 | 0.332 | −0.528 | 0.568 |
| spei | −0.007 | 0.000 | −0.002 | 0.002 | −0.001 | 0.086 |
| Parameter Trend Over [1980–2005] | s209 @ Plain | s207 @ Plain | s405@Plain | |||
| Slope | p-Value | Slope | p-Value | Slope | p-Value | |
| tmm | 0.034 | 0.065 | ||||
| tn90p | 0.243 | 0.032 | ||||
| r10mm | 0.056 | 0.730 | 0.000 | 0.842 | 0.200 | 0.369 |
| wsdi | 0.000 | 1.000 | ||||
| r20mm | −0.118 | 0.441 | −0.100 | 0.671 | 0.000 | 0.901 |
| cdd | 0.059 | 0.895 | 0.444 | 0.632 | 1.000 | 0.197 |
| cwd | 0.000 | 0.979 | 0.000 | 0.954 | 0.000 | 1.000 |
| rx5day | −1.978 | 0.398 | −2.958 | 0.463 | 0.378 | 0.747 |
| spei | 0.001 | 0.227 | −0.003 | 0.000 | 0.001 | 0.339 |
Table A5.
Perceived impacts of the climate shocks as per ecological regions.
| Climate Shocks | Severity | Total | Region | p-Value | |||||||
|---|---|---|---|---|---|---|---|---|---|---|---|
| Mountain | Hill | Tarai | |||||||||
| No | % | No | % | No | % | No | % | ||||
| Droughts | Low | 413 | 11 | 226 | 55 | 128 | 31 | 59 | 14 | 0.00 | |
| Medium | 895 | 24 | 203 | 23 | 502 | 56 | 190 | 21 | |||
| High | 676 | 18 | 149 | 22 | 422 | 62 | 105 | 16 | |||
| Total | 1984 | 54 | 578 | 29 | 1052 | 53 | 354 | 18 | |||
| Untimely rains | Low | 291 | 8 | 183 | 63 | 72 | 25 | 36 | 12 | 0.00 | |
| Medium | 656 | 18 | 77 | 12 | 497 | 76 | 100 | 15 | |||
| High | 256 | 7 | 11 | 4 | 207 | 81 | 38 | 15 | |||
| Total | 1203 | 33 | 271 | 23 | 758 | 63 | 174 | 14 | |||
| Irregular weather | Low | 215 | 6 | 125 | 58 | 62 | 29 | 28 | 13 | 0.00 | |
| Medium | 305 | 8 | 32 | 10 | 226 | 74 | 47 | 15 | |||
| High | 147 | 4 | 39 | 27 | 105 | 71 | 3 | 2 | |||
| Total | 667 | 18 | 196 | 29 | 393 | 59 | 78 | 12 | |||
| Hailstorm | Low | 516 | 14 | 234 | 45 | 243 | 47 | 39 | 8 | 0.00 | |
| Medium | 619 | 17 | 145 | 23 | 361 | 58 | 113 | 18 | |||
| High | 777 | 21 | 176 | 23 | 570 | 73 | 31 | 4 | |||
| Total | 1912 | 52 | 555 | 29 | 1174 | 61 | 183 | 10 | |||
| Flood | Low | 47 | 1 | 17 | 36 | 14 | 30 | 16 | 34 | 0.00 | |
| Medium | 166 | 5 | 8 | 5 | 41 | 25 | 117 | 70 | |||
| High | 238 | 7 | 9 | 4 | 92 | 39 | 137 | 58 | |||
| Total | 451 | 12 | 34 | 8 | 147 | 33 | 270 | 60 | |||
| Animal disease | Low | 89 | 2 | 28 | 31 | 30 | 34 | 31 | 35 | 0.00 | |
| Medium | 244 | 7 | 70 | 29 | 75 | 31 | 99 | 41 | |||
| High | 166 | 5 | 66 | 40 | 64 | 39 | 36 | 22 | |||
| Total | 499 | 14 | 164 | 33 | 169 | 34 | 166 | 33 | |||
| Serious pest damage to crops | Low | 112 | 3 | 27 | 24 | 26 | 23 | 59 | 53 | 0.00 | |
| Medium | 548 | 15 | 94 | 17 | 140 | 26 | 314 | 57 | |||
| High | 232 | 6 | 41 | 18 | 86 | 37 | 105 | 45 | |||
| Total | 892 | 24 | 162 | 18 | 252 | 28 | 478 | 54 | |||
| Market shocks | Low | 13 | 0 | 6 | 46 | 1 | 8 | 6 | 46 | 0.00 | |
| Medium | 100 | 3 | 54 | 54 | 7 | 7 | 39 | 39 | |||
| High | 91 | 2 | 24 | 26 | 10 | 11 | 57 | 63 | |||
| Total | 204 | 6 | 84 | 41 | 18 | 9 | 102 | 50 | |||
| Other | Low | 1 | 0 | 0 | 0 | 1 | 100 | 0 | 0 | 0.99 | |
| Medium | 38 | 1 | 6 | 16 | 31 | 82 | 1 | 3 | |||
| High | 30 | 1 | 5 | 17 | 24 | 80 | 1 | 3 | |||
| Total | 69 | 2 | 11 | 16 | 56 | 81 | 2 | 3 | |||
References
- Shrestha, A.B.; Aryal, R. Climate change in Nepal and its impact on Himalayan glaciers. Reg. Environ. Chang. 2011, 11, 65–77. [Google Scholar] [CrossRef]
- Wester, P.; Mishra, A.; Mukherji, A.; Shrestha, A.B. The Hindu Kush Himalaya Assessment; Cham: Springer International Publishing: Basel, Switzerland, 2019. [Google Scholar]
- Dhaubanjar, S.; Pandey, V.P.; Bharati, L.; Khadka, A.; Matheswaran, K.; Okwany, R.; Chinnasamy, P.; Shrestha, S.L. Characterization of Spring-Dominated Micro-Watersheds in Western Nepal—The Case of Springs in Shikharpur and Banlek; International Water Management Institute (IWMI): Colombo, Sri Lanka, 2019. [Google Scholar]
- Pandey, V.P.; Dhaubanjar, S.; Bharati, L.; Thapa, B.R. Hydrological response of Chamelia watershed in Mahakali Basin to climate change. Sci. Total Environ. 2019, 650, 365–383. [Google Scholar] [CrossRef] [PubMed]
- Pandey, V.P.; Dhaubanjar, S.; Bharati, L.; Thapa, B.R. Modeling hydrology in large basins using multi-site calibration approach: A case of Karnali-Mohana basin, Western Nepal. (Under Review). Hydro-Environ. Res. 2019. under review. [Google Scholar]
- NARC. NARC’s Strategic Vision for Agricultural Research 2011–2030; Ministry of Agriculture Development (MoAD): Lalitpur, Nepal, 2010.
- Siddiqui, S.; Bharati, L.; Gurung, P.; Maharjan, L. Climate Change and Vulnerability Mapping in Watersheds in Middle and High Mountains of Nepal; IWMI: Colombo, Sri Lanka, 2012. [Google Scholar]
- Niles, M.T.; Salerno, J.D. A cross-country analysis of climate shocks and smallholder food insecurity. PLoS ONE 2018, 13, e0192928. [Google Scholar] [CrossRef] [PubMed]
- Bastakoti, R.C.; Bharati, L.; Bhattarai, U.; Wahid, S.M. Agriculture under changing climate conditions and adaptation options in the Koshi Basin. Clim. Dev. 2017, 9, 634–648. [Google Scholar] [CrossRef]
- Devkota, R.P.; Pandey, V.P.; Bhattarai, U.; Shrestha, H.; Adhikari, S.; Dulal, K.N. Climate change and adaptation strategies in Budhi Gandaki River Basin, Nepal: A perception-based analysis. Clim. Chang. 2017, 140, 195–208. [Google Scholar] [CrossRef]
- Devkota, R.P.; Bhattarai, U. Assessment of climate change impact on floods from a techno-social perspective. J. Flood Risk Manag. 2018, 77, S186–S196. [Google Scholar] [CrossRef]
- Turral, H.; Svendsen, M.; Faures, J.M. Investing in irrigation: Reviewing the past and looking to the future. Agric. Water Manag. 2010, 97, 551–560. [Google Scholar] [CrossRef]
- Jongdee, B. Agricultural Water Management; Elsevier: Amsterdam, The Netherlands, 2006. [Google Scholar]
- Waha, K.; Müller, C.; Bondeau, A.; Dietrich, J.P.; Kurukulasuriya, P.; Heinke, J.; Lotze-Campen, H. Adaptation to climate change through the choice of cropping system and sowing date in sub-Saharan Africa. Glob. Environ. Chang. 2013, 23, 130–143. [Google Scholar] [CrossRef]
- Conway, D.; Lisa, E.; Schipper, F. Adaptation to climate change in Africa: Challenges and opportunities identified from Ethiopia. Glob. Environ. Chang. 2011, 21, 227–237. [Google Scholar] [CrossRef]
- Mwinjaka, O.; Gupta, J.; Bresser, T. Adaptation strategies of the poorest farmers in drought-prone Gujarat. Clim. Dev. 2010, 2, 346–363. [Google Scholar] [CrossRef]
- Adger, W.N.; Arnell, N.W.; Tompkins, E.L. Successful adaptation to climate change across scales. Glob. Environ. Chang. 2005, 145, 77–86. [Google Scholar] [CrossRef]
- Dawson, R.J.; Ball, T.; Werritty, J.; Werritty, A.; Hall, J.W.; Roche, N. Assessing the effectiveness of non-structural flood management measures in the Thames Estuary under conditions of socio-economic and environmental change. Glob. Environ. Chang. 2011, 21, 628–646. [Google Scholar]
- Huntjens, P.; Lebel, L.; Pahl-Wostl, C.; Camkin, J.; Schulze, R.; Kranz, N. Institutional design propositions for the governance of adaptation to climate change in the water sector. Glob. Environ. Chang. 2012, 22, 67–81. [Google Scholar] [CrossRef]
- Kuntiyawichai, K.; Schultz, B.; Uhlenbrook, S.; Suryadi, F.X.; van Griensven, A. Comparison of flood management options for the Yang River Basin, Thailand. Irrig. Drain. 2011, 60, 526–543. [Google Scholar]
- Næss, L.O.; Bang, G.; Eriksen, S.; Vevatne, J. Institutional adaptation to climate change: Flood responses at the municipal level in Norway. Glob. Environ. Chang. 2005, 15, 125–138. [Google Scholar]
- Bharati, L.; Gurung, P.; Jayakody, P.; Smakhtin, V.; Bhattarai, U. The Projected Impact of Climate Change on Water Availability and Development in the Koshi Basin, Nepal. Mt. Res. Dev. 2014, 34, 118–130. [Google Scholar]
- Dixit, A.; Upadhya, M.; Dixit, K.; Pokhrel, A.; Rai, D.R. Living with water stress in the hills of the Koshi Basin, Nepal. In Living Water Stress Hills Koshi Basin Nepal; ICIMOD: Lalitpur, Nepal, 2009. [Google Scholar]
- Manandhar, S.; Pandey, V.P.; Kazama, F. Hydro-climatic trends and people’s perceptions: Case of Kali Gandaki River Basin, Nepal. Clim. Res. 2012, 54, 167–179. [Google Scholar]
- Moors, E.J.; Groot, A.; Biemans, H.; van Scheltinga, C.T.; Siderius, C.; Stoffel, M.; Huggel, C.; Wiltshire, A.; Mathison, C.; Ridley, J.; et al. (Eds.) Adaptation to changing water resources in the Ganges basin, northern India. Environ. Sci. Policy 2011, 14, 758–769. [Google Scholar] [CrossRef]
- Mann, H.B. Nonparametric Tests against Trend. Econometrica 1945, 13, 245–259. [Google Scholar] [CrossRef]
- Kendall, M.G. Rank Correlation Methods, 4th ed.; Charles Griffin: London, UK, 1975. [Google Scholar]
- National Aeronautics and Space Administration Jet Propulsion Laboratory. ASTER Global Digital Elevation Model V002 [Data Set]; National Aeronautics and Space Administration Jet Propulsion Laboratory: Pasadena, CA, USA, 2009. [Google Scholar]
- Ives, J.D.; Shrestha, R.B.; Mool, P.K.P.K. Formation of Glacial Lakes in the Hindu Kush-Himalayas and GLOF Risk Assessment; ICIMOD: Kathmandu, Nepal, 2010; pp. 10–11. [Google Scholar]
- Dhaubanjar, S.; Pandey, V.P.; Bharati, L. Climate futures for Western Nepal based on CORDEX South Asia Regional Climate Models. Inter. J. Clim. 2019, in press. [Google Scholar]
- Sen, P.K. Estimates of the Regression Coefficient Based on Kendall’s Tau. J. Am. Stat. Assoc. 1968, 63, 1379–1389. [Google Scholar] [CrossRef]
- Dhaubanjar, S.; Bharati, L.; Pandey, V.P.; Blauth, K. Unpacking climate change: Assessment of sector-wise impact in Western Nepal. Manuscript.
- Zhang, X.; Yang, F. RClimDex (1.0) User Manual. Available online: http://etccdi.pacificclimate.org/software.shtml (accessed on 12 June 2019).
- Adhikari, B.R. Flooding and inundation in Nepal Terai: Issues and Concerns. Hydro Nepal 2013, 12, 59–65. [Google Scholar] [CrossRef]
Figure 1.
Location of study area in Western Nepal along with other relevant layers. Color squares are regional climate model (RCM) grid cells; blue indicating mountain grids, orange as hill, and green as Tarai grids for future climate projection.
Figure 1.
Location of study area in Western Nepal along with other relevant layers. Color squares are regional climate model (RCM) grid cells; blue indicating mountain grids, orange as hill, and green as Tarai grids for future climate projection.

Figure 2.
Methodological flow chart for assessing climate shocks and responses in Karnali-Mahakali basin.
Figure 2.
Methodological flow chart for assessing climate shocks and responses in Karnali-Mahakali basin.

Figure 3.
Spatial distribution of 3660 survey households across districts in Western Nepal based on stratification along 21 strata.
Figure 3.
Spatial distribution of 3660 survey households across districts in Western Nepal based on stratification along 21 strata.

Figure 4.
Percentage of respondents perceiving different types of shocks in the last five years—(a) across the entire Western Nepal; and (b) across the three ecological regions (i.e., mountain/hill/Tarai).
Figure 4.
Percentage of respondents perceiving different types of shocks in the last five years—(a) across the entire Western Nepal; and (b) across the three ecological regions (i.e., mountain/hill/Tarai).

Figure 5.
Percentage of respondents perceiving different types of shocks in the last five years disaggregated by sub-basins: (a) flood; (b) drought; (c) untimely rainfall; (d) irregular weather; (e) hailstorm; and (f) serious pest damage to crops.
Figure 5.
Percentage of respondents perceiving different types of shocks in the last five years disaggregated by sub-basins: (a) flood; (b) drought; (c) untimely rainfall; (d) irregular weather; (e) hailstorm; and (f) serious pest damage to crops.

Figure 6.
Historical (1980–2005) trends in nine selected ETCCDI indices across stations: two in mountain (blue), four in hill (yellow) and three in Tarai (green). (A) p-value for the Mann-Kendall test (B) Sen’s slope value for each of the indices.
Figure 6.
Historical (1980–2005) trends in nine selected ETCCDI indices across stations: two in mountain (blue), four in hill (yellow) and three in Tarai (green). (A) p-value for the Mann-Kendall test (B) Sen’s slope value for each of the indices.

Figure 7.
Severity of the risks to shocks perceived by households in the Karnali-Mahakali Basins—disaggregated by the type of shocks as well as physiographic regions.
Figure 7.
Severity of the risks to shocks perceived by households in the Karnali-Mahakali Basins—disaggregated by the type of shocks as well as physiographic regions.

Table 1.
Bio-physical characteristics of the three river basins in Western Nepal.
| Characteristic | Karnali | Mohana | Mahakali |
|---|---|---|---|
| Originates in | Tibetan plateaus and high mountains | Nepalese Churia hills | High mountains |
| Basin area (delineated above Nepal-India border) | 46,151 km2 | 3730 km2 | 17,371 km2 |
| Elevation range (elevation range as seen in ASTER GDEM V2 [28]) | 5500–7726 masl (upstream of Chisapani) | 113–1928 masl | 83–7378 masl |
| Location | Transboundary between China and Nepal (6.9% in China) | Nepal | Transboundary between India and Nepal (68% in India) |
| Stream network | Dendritic | Parallel | Dendritic |
| Glaciers and glacial lakes [29]) | 1361 glaciers over 1740 km2 (127.81 km3 of ice reserve) 907 glacial lakes over 37.67 km2 | - | 87 glaciers over 143 km2 (10.06 km3 of ice reserve) 16 glacial lakes over 0.38 km2 |
| Hydropower projects in Nepalese territory | 127 proposed projects ranging from 0.5–1000 Mega Watt (MW) | - | 2 operational, 3 under-construction and 5 proposed projects ranging from 0.99–6720 MW |
Table 2.
ET-SCI indices analyzed to understand trends in climate shocks in Western Nepal (Source: modified after [33]).
Table 2.
ET-SCI indices analyzed to understand trends in climate shocks in Western Nepal (Source: modified after [33]).
| ET-SCI Index | Description | Related to |
|---|---|---|
| tmm | Mean annual daily temperature | Animal disease; serious pest damage to crops |
| tn90p | Annual percentage of days with warm nights (i.e., Tmin > 90th percentile) | Droughts; animal disease; serious pest damage to crops |
| r10mm | Annual number of days when precipitation ≥10 mm | Irregular weather; flood |
| wsdi | Annual number of days contributing to events where six or more consecutive days experience Tmax > 90th percentile | Droughts |
| r20mm | Annual number of days when precipitation ≥20 mm | Flood |
| cdd | Maximum annual number of consecutive dry days (when precipitation <1.0 mm) | Droughts; irregular weather |
| cwd | Maximum annual number of consecutive wet days (when precipitation ≥1.0 mm) | Flood; irregular weather |
| rx5day | Maximum annual five-day total precipitation | Flood; irregular weather |
| spei | Measure of “drought” using the standardised precipitation evapotranspiration index (SPEI) on time scales of 12 months | Droughts |
Table 3.
Severity of the risks to shocks perceived by households in the Karnali-Mahakali Basins. The p-values are based on Chi-squared test.
Table 3.
Severity of the risks to shocks perceived by households in the Karnali-Mahakali Basins. The p-values are based on Chi-squared test.
| Shocks | Severity of Risks | Basin | Total | p-Value | ||||||
|---|---|---|---|---|---|---|---|---|---|---|
| Karnali | Mahakali | Mohana | ||||||||
| Drought | n | % | n | % | n | % | n | % | ||
| Low | 332 | 24 | 40 | 12 | 41 | 17 | 413 | 21 | 0.00 | |
| Medium | 648 | 46 | 121 | 35 | 126 | 52 | 895 | 45 | ||
| High | 420 | 30 | 180 | 53 | 76 | 31 | 676 | 34 | ||
| Untimely rain | ||||||||||
| Low | 260 | 30 | 15 | 6 | 16 | 17 | 291 | 24 | 0.00 | |
| Medium | 476 | 55 | 125 | 51 | 55 | 59 | 656 | 55 | ||
| High | 130 | 15 | 104 | 43 | 22 | 24 | 256 | 21 | ||
| Irregular weather | ||||||||||
| Low | 180 | 42 | 18 | 9 | 17 | 38 | 215 | 32 | 0.00 | |
| Medium | 177 | 41 | 100 | 51 | 28 | 62 | 305 | 46 | ||
| High | 70 | 16 | 77 | 39 | 0 | 0 | 147 | 22 | ||
| Hailstorms | ||||||||||
| Low | 449 | 30 | 53 | 17 | 14 | 14 | 516 | 27 | 0.00 | |
| Medium | 454 | 30 | 108 | 34 | 57 | 59 | 619 | 32 | ||
| High | 595 | 40 | 156 | 49 | 26 | 27 | 777 | 41 | ||
| Flood | ||||||||||
| Low | 29 | 19 | 5 | 3 | 13 | 9 | 47 | 10 | 0.00 | |
| Medium | 48 | 32 | 53 | 35 | 65 | 44 | 166 | 37 | ||
| High | 73 | 49 | 94 | 62 | 71 | 48 | 238 | 53 | ||
| Animal disease | ||||||||||
| Low | 59 | 17 | 12 | 18 | 18 | 23 | 89 | 18 | 0.63 | |
| Medium | 171 | 49 | 37 | 54 | 36 | 45 | 244 | 49 | ||
| High | 121 | 34 | 19 | 28 | 26 | 33 | 166 | 33 | ||
| Serious crop damage | ||||||||||
| Low | 53 | 14 | 17 | 8 | 42 | 15 | 112 | 13 | 0.04 | |
| Medium | 244 | 63 | 145 | 65 | 159 | 56 | 548 | 61 | ||
| High | 90 | 23 | 60 | 27 | 82 | 29 | 232 | 26 | ||
| Market Shocks | ||||||||||
| Low | 8 | 9 | 4 | 6 | 1 | 2 | 13 | 6 | 0.02 | |
| Medium | 54 | 59 | 29 | 40 | 17 | 41 | 100 | 49 | ||
| High | 29 | 32 | 39 | 54 | 23 | 56 | 91 | 45 | ||
Table 4.
Top three responses for each shock.
| Shocks and Responses | Respondents | Shocks and Responses | Respondents | ||
|---|---|---|---|---|---|
| Total | % | Total | % | ||
| Droughts | 1978 | 54 | Flood | 445 | 12 |
| ● Did nothing | 1386 | 70 | ● Did nothing | 330 | 74 |
| ● Left the land fallow | 409 | 21 | ● Left the land fallow | 26 | 6 |
| ● Borrow money from others | 71 | 4 | ● Reduced food consumption | 21 | 5 |
| Untimely rains | 1205 | 33 | Animal disease | 493 | 13 |
| ● Did nothing | 1018 | 84 | ● Did nothing | 319 | 65 |
| ● Left the land fallow | 81 | 7 | ● Sold livestock | 84 | 17 |
| ● Borrow money from others | 31 | 3 | ● Used pesticides | 23 | 5 |
| Irregular weather | 668 | 18 | Pest damage to crops | 892 | 24 |
| ● Did nothing | 525 | 79 | ● Used pesticides | 481 | 54 |
| ● Left the land fallow | 64 | 10 | ● Did nothing | 342 | 38 |
| ● Borrow money from others | 44 | 7 | ● Changed cropping patters | 19 | 2 |
| Hailstorm | 1910 | 52 | Market shocks | 202 | 6 |
| ● Did nothing | 1606 | 84 | ● Did nothing | 156 | 77 |
| ● Borrow money from others | 114 | 6 | ● Borrow money from others | 16 | 8 |
| ● Left the land fallow | 80 | 4 | ● Reduced food consumption | 15 | 7 |
Table 5.
Percentage of households who received any sort of assistance to dealing with the shocks.
| Category | % of Household | Category | % of Household |
|---|---|---|---|
| By basin | Region | ||
| Karnali | 3.4 | Mountain | 6.4 |
| Mahakali | 4.3 | Hill | 2.2 |
| Mohana | 2.4 | Tarai | 2.9 |
| By gender of HH head | Ethnicity | ||
| Male | 3.4 | Non marginalized | 2.0 |
| Female | 2.8 | Marginalized Janajati, and Madhesi | 3.3 |
| Dalit | 7.1 | ||
| Total | 3.3 |
Table 6.
Support services and timing of services received by households from different institutions.
Table 6.
Support services and timing of services received by households from different institutions.
| HH Receiving any Support (N = 122) | Timing of Services Received (%) | |||||
|---|---|---|---|---|---|---|
| Supporting Agency | n | % | At the Time of Shock | Within a Week | Within a Month | Within 6 Months |
| National government agency (e.g., DADO, DOI, DWIDM, etc.) Government support | 44 | 36 | 30 | 23 | 23 | 23 |
| District-level government (i.e., DDC) | 6 | 5 | 33 | 0 | 16 | 67 |
| VDC-level government | 32 | 26 | 0 | 3 | 16 | 81 |
| Relief agency | 29 | 24 | 48 | 28 | 21 | 3 |
| Saving groups | 7 | 6 | 29 | 71 | 0 | 0 |
| Community/Social groups | 4 | 3 | 75 | 25 | 0 | 0 |
| Others in community | 21 | 17 | 88 | 6 | 6 | 0 |
| Extended family | 3 | 2 | 100 | 0 | 0 | 0 |
Notes: DDC—District Development Committee; DADO—District Agriculture Development Office; DOI—Department of Irrigation; DWIDM—Department of Water-Induced Disaster Management; HH—household; VDC—village development committee.
© 2019 by the authors. Licensee MDPI, Basel, Switzerland. This article is an open access article distributed under the terms and conditions of the Creative Commons Attribution (CC BY) license (http://creativecommons.org/licenses/by/4.0/).
Share and Cite
MDPI and ACS Style
Pandey, V.P.; Sharma, A.; Dhaubanjar, S.; Bharati, L.; Joshi, I.R. Climate Shocks and Responses in Karnali-Mahakali Basins, Western Nepal. Climate 2019, 7, 92. https://doi.org/10.3390/cli7070092
AMA Style
Pandey VP, Sharma A, Dhaubanjar S, Bharati L, Joshi IR. Climate Shocks and Responses in Karnali-Mahakali Basins, Western Nepal. Climate. 2019; 7(7):92. https://doi.org/10.3390/cli7070092
Chicago/Turabian StylePandey, Vishnu Prasad, Akriti Sharma, Sanita Dhaubanjar, Luna Bharati, and Indu Raj Joshi. 2019. "Climate Shocks and Responses in Karnali-Mahakali Basins, Western Nepal" Climate 7, no. 7: 92. https://doi.org/10.3390/cli7070092
Note that from the first issue of 2016, this journal uses article numbers instead of page numbers. See further details here.