A Weather-Pattern-Based Evaluation of the Performance of CMIP5 Models over Mexico


1
Posgrado en Ciencias de la Tierra, Universidad Nacional Autónoma de México, Ciudad de México 04510, Mexico
2
Centro de Ciencias de la Atmósfera, Universidad Nacional Autónoma de México, Ciudad de México 04510, Mexico
*
Author to whom correspondence should be addressed.
†
Current address: Av. Universidad 3000, Circuito Exterior S/N, Ciudad Universitaria, Delegación Coyoacán, Ciudad de México 04510, Mexico.
‡
These authors contributed equally to this work.
Climate 2020, 8(1), 5; https://doi.org/10.3390/cli8010005
Submission received: 28 November 2019
/
Revised: 22 December 2019
/
Accepted: 27 December 2019
/
Published: 5 January 2020
Abstract
:The fifth phase of the Coupled Model Inter-Comparison Project (CMIP5) is frequently used to force regional climate models for dynamic downscaling and projections, which decision makers in turn use for future plans in different sectors. It is, therefore, highly important to assess their performance in order to use them as reliable tools. A weather-type approach for the evaluation of the performance of CMIP5 models is employed in this study, with the objective of providing insight into model errors under a set of distinct synoptic conditions and circulation types associated with the rainy season over Mexico and Central America. The Self-Organizing Maps algorithm is used to identify the main weather regimes (constructed from sea level pressure, specific humidity, and low-level winds at a daily time-scale), which are then evaluated against reanalysis. The results show that model performance depends on the weather type in all of the variables except for sea level pressure, which confirms the usefulness of this approach. The models simulate better the humidity patterns that show weak deviations from the climatological norm. In addition, the wind pattern representing the Caribbean Low Level Jet is well reproduced by all the models. The results show the capacity of this methodology for determining the extent to which climate models represent the main circulation patterns that characterize the climate and local weather in Mexico.
1. Introduction
Climate models are the primary tools available to investigate the responses of the climate system to various forces in order to make predictions on seasonal to decadal time scales and to make projections of future climate over this century and beyond [1]. Therefore, it is important to assess model performance in order to determine their reliability. The traditional methods to evaluate models include comparing model output with observations (or reanalysis) over long periods of time and analyzing the resulting difference. Typically, statistical parameters are used to quantify the differences between models and reanalysis, such as the bias, root mean square error, correlation, standard deviation, etc., which provide information on the model’s ability to represent a given variable over a region.
In the fifth phase of the Coupled Model Inter-Comparison Project (CMIP5), several integrated experiments have been performed using atmosphere–ocean global climate models (AOGCMs) and Earth system models (ESMs) [2], which provide a multimodel context to a range of climate applications. The evaluation of those CMIP5 models has been addressed by various authors in recent years, such as [3,4,5,6,7,8,9,10,11,12,13,14,15,16,17,18,19,20], among others. In most of these studies, the main focuses have been mid-latitude weather and climate processes, and there is a need for more studies evaluating model performance in the tropics.
Some authors have focused on the assessment of climate model simulations over Tropical North America. The main variables evaluated include temperature, humidity and winds at lower levels, precipitation, sea surface temperature, and some hydrological variables at several timescales [21,22,23], as well as other fields such as mean sea level pressure [24]. In addition, several studies [25,26,27,28,29,30] have evaluated the modes of variability, teleconnection patterns, and climate features that affect the North and Central American regions at different temporal scales. All of these studies have used statistical metrics based on standard measures like the bias, root mean squared error, and spatial correlation.
In all of these studies with emphasis in the tropics, the general consensus related to CMIP5 General Circulation Models (GCMs) is that the performance of models remains sensitive to the variable, and is also dependent on the metric utilized. Some authors have found that the largest discrepancies between GCMs and observations are for spatial variability of rainfall, since models incorrectly simulate the Inter-tropical Convergence Zone and misplace the daily maximum of the precipitation rate [22,23,24]. Other authors claim that there are systematic biases in precipitation, and that larger errors are found in the representation of extreme values of variables based on temperature and precipitation [21]. Sheffield et al. [25] found that some important features of intra-seasonal variability in Central America—such as the midsummer drought—are captured by most CMIP5 models (in a set of 17), while almost half of them can reproduce observed variability in the eastern North Pacific, with only a few of them being able to reproduce the east and central Pacific types of El Niño–Southern Oscillation (ENSO). Regarding the ENSO teleconnections in the southern section of North America, Langenbrunner and Neelin [26] reported that the spatial patterns exhibit substantial departures from observations. In addition, Hidalgo and Alfaro [28] documented a low skill of CMIP5 models in representing the sea-surface temperature pattern characteristic of ENSO, even though the ENSO–precipitation teleconnection is better simulated by models analyzed by them. They also found that some of the GCMs skillfully reproduced the seasonal distribution of the Caribbean Low-Level Jet Index. In their results, model skill is generally low for mean precipitation patterns at monthly timescales. The CMIP5 simulations of the North American Monsoon System (NAMS) were assessed by Geil et al. [27]; they determined that there was no improvement in CMIP3 regarding the magnitude of the mean annual cycle of monthly precipitation over the monsoon region, while some improvement in the phasing of the seasonal cycle in precipitation is notable. Simon Wang et al. [29] examined the winter anomaly dipole over North America and claimed that CMIP5 models capture the association of the dipole with ENSO as a precursor of this system.
It is remarkable that most of those studies are generally focused on individual variables or derived climatic indexes. In addition, the traditional methodologies for model evaluation provide information about errors and overall performance, but they do not take into account how well individual models simulate the dominant daily synoptic patterns in a region or their frequency. The weather-pattern-based method of model evaluation employed in this paper allows for an analysis over a long period of time and provides information about model errors under different synoptic situations. It is important for model users to understand that models do not perform with equal accuracy under different synoptic weather patterns [31]. It is also noteworthy that model biases in precipitation and its extremes are likely related to differences in large-scale circulation and sea-surface temperature patterns, as well as potential problems in representing features of the regional climate [21], so pattern evaluation becomes essential. Some studies have already used this methodology to assess regional and climate models over different regions of the globe, proving that it has the ability to provide model developers and users with additional guidance regarding model performance [31,32,33,34,35,36,37,38,39]. However, there are no previous studies employing this methodology that focus on the tropical region of Mexico.
In the present work, we apply a weather-pattern-based model evaluation to a set of CMIP5 models, in order to characterize their ability to represent the prevalent weather regimes over Mexico and adjacent areas. A clustering algorithm—Self-Organizing Maps (SOMs; [40])—is employed to identify the dominant synoptic patterns in the region of interest. SOMs have been shown to be a powerful tool for model evaluation, allowing a detailed examination of the differences between simulated and observed atmospheric circulations [34]. The evaluation of CMIP5 models is relevant to climate change impact studies in the region, by increasing the reliability of projections which are important to hydrological and economical decision making in Mexico. The evaluation of the main synoptic features in the region is particularly important, since they are related to precipitation over Southeastern Mexico [41].
2. Materials and Methods
2.1. Study Area
A large area centered in eastern Mexico (10.0°–30.0° N; 120.0°–60.0° W) was selected for the study (Figure 1). This area comprises not only Mexico, but also the tropical eastern Pacific, Gulf of Mexico, Caribbean Sea, and a section of the tropical North Atlantic Ocean. Some studies [42,43] indicate that these adjacent oceanic regions play a role in the modulation of precipitation over Mexico. The long-term seasonal average—from May to October—shows the North Atlantic Subtropical High (NASH) of the Azores–Bermuda above a large section of the area, with a mostly easterly wind circulation and the strongest winds south of 20° N and east of 90° W.
2.2. CMIP5 Output and Reference Data
This study focuses on the weather-pattern-based evaluation of a set of four CMIP5 models—shown in Table 1—based on historical simulations up to 2005. The daily outputs of atmospheric variables were analyzed for the rainy season in Mexico, i.e., from May to October (MJJASO). The models selected have high spatial resolutions when compared with the rest of the CMIP5 models; high spatial resolution is important to adequately resolve dynamic and thermodynamic features in coastal regions and complex topography (as is the case in the region of this study). Note that only one member of the ensemble (r1i1p1) of the selected CMIP5 models was employed, since it is the only member that has all of the variables needed for this study available at the daily time scale. The historical simulations were employed, which were forced with prescribed changing atmospheric conditions (i.e., concentration of well-mixed greenhouse gases, volcanic aerosols, solar forcing, land use, etc.), consistent with the historical observations. Data are provided in several pressure levels; however, we selected only two levels for the analysis. All of the output fields were interpolated to the grid of the reference dataset to enable the comparison.
The CMIP5 historical simulations were evaluated against the European Centre for Medium-Range Weather Forecast (ECMWF) reanalysis ERA-Interim for the period 1980–2005 (26 years). This dataset was taken as a reference because it was produced with an assimilation system of meteorological observations, such as in situ measurements and satellites. In addition, it presents a more realistic stratospheric circulation and better temporal consistency on a range of time-scales, with respect to previous versions of ECMWF reanalysis [44]. This 26 year period contains complete and accurate observational data, largely because of the expansion of and advances in space-based remote sensing [45]. It is well known that the ideal evaluation should be based on direct measurements of atmospheric variables. Although reanalyses are not observations, the lack of a consistent and long-term observational record in the area of study makes ERA-Interim a good alternative for the representation of many essential climate variables. Daily data on a regular grid of 1° × 1° were employed. The following variables were selected for the analysis: Mean sea level pressure (mslp), specific humidity at 700 hPa (q700), and zonal and meridional wind components at 700 hPa (u700, v700).
2.3. Weather Pattern Identification
The weather-pattern-based CMIP5 model evaluation requires the identification of a group of patterns that occur in the region of interest, which will then be compared to those in the ERA-Interim dataset. In order to identify the synoptic-scale patterns, we employed the SOM technique, which is an artificial neural network characterized by unsupervised and competitive learning, that allows the objective classification of a dataset in a user-defined set of modes, patterns, or weather regimes. A detailed description of the SOM method can be found in many papers, such as in [40,46,47]. The methodology for the detection of weather patterns is similar to that of [41], in which a batch training algorithm is employed, which is fast and computationally more economic than other implementations of the SOM. The following combination of parameters was selected: A rectangular lattice, a pseudo-Gaussian neighborhood function, and a linear initialization of the weight vectors.
The cluster analysis was performed on the anomalies of atmospheric fields that were computed by subtracting the long-term mean for the period 1980–2005 from daily values. The analysis was focused on the rainy season in southern Mexico (from 1 May to 31 October), so that the total number of days equals 4784. The anomalies were normalized and weighted by the cosine of latitude, and arranged on a matrix of days by grid points.
The next step in the weather pattern identification was to determine the size of the SOM grid, i.e., the number of nodes in the network. A large number of SOM nodes provides a good representativeness of the synoptic conditions, allowing the continuum of the atmospheric events; however, it makes the analysis more difficult and complex. Therefore, we chose a more generalized classification of the atmospheric conditions by selecting a small SOM grid of 2 × 3, ensuring that only the primary and dominant atmospheric modes would be identified. In addition, this choice of SOM size had the benefit of allowing an easier comparison between patterns in models and reanalysis.
The SOM algorithm was applied to each of the variables (mslp, q700, u700, and v700); as a result, a set of dominant patterns for every variable in the area of interest was created.
2.4. Evaluation Method
The evaluation consisted of applying the SOM algorithm to the daily CMIP5 model output, choosing a grid size equal to that of the SOM analysis of the reference dataset, and then examining if the patterns detected in the models resembled the ones found in the reference dataset. This was quantified by the measure of the spatial or map correlation between CMIP5 and ERA-Interim patterns (Equation (1)).
Once the clusters in the CMIP5 models and their counterparts in the reference data were identified, the ability of each model in reproducing those synoptic patterns was assessed by statistical metrics in terms of relevant atmospheric variables.
Some of these metrics provided information on the ability of models to simulate the mean climatology as well as the inter-annual variability; for example, the typical model error (TME) [45]—which is defined as the median of the root mean squared error (RMSE) of all models—for each variable. We computed this index as a function of the identified weather regimes, since our main goal was to characterize model errors under different synoptic patterns.
Another metric employed was the relative model performance index (RMPI) [45], defined in Equation (2), where RMSE is the root mean squared error for each model and variable, as a function of the weather regimes. As this index is normalized by the typical model error, it allows to compare a given model performance with respect to the typical or average error of all models.
The next metric was the variance ratio (Equation (3)) [45], which is the ratio of simulated to observed variances for each model and variable. It indicates how well the variance of simulated anomalies for a given variable compares with reanalysis: If variances are similar, if the simulated variability is smaller than in reanalysis, and if it is larger.
3. Results
3.1. Weather Patterns from ERA-Interim
Figure 2 shows the six weather patterns (WPs) of sea level pressure anomalies obtained from ERA-Interim for the period 1980–2005. These weather patterns encompass a range of synoptic situations, from a positive pressure anomaly in the north of the region in WP 1,3, to a negative pressure anomaly in WP 2,1. A dipole of pressure anomalies resembling a large-scale mid-latitude wave is observed in WPs 1,2, with its opposite pattern in WP 2,2. Another positive pressure anomaly more displaced towards the Atlantic is seen in WP 2,3, with a corresponding opposite pattern in 1,1, denoting the oscillations in intensity and locations of the NASH, typical of the summer season in the Northern Hemisphere. The strength and shift of the NASH are coupled with the North Atlantic Oscillation (NAO) phases, and also are associated with the variations of the easterly flow towards the Caribbean Sea. The NASH intensification affects the sea-level pressure gradient in the Caribbean, impacting the sea surface temperature, therefore influencing the rainfall variability in the region, including southern Mexico. The relationship between this sea-level pressure pattern and local features of weather in Mexico have been well documented by several authors, e.g., [48,49], among others. More importantly, the westward extension of the subtropical high exerts a large influence on tropical cyclone tracks [50,51], which are extremely important for eastern regions of Mexico during the summer season.
Figure 3 represents the six WPs of specific humidity anomalies at 700 hPa. It is important to specify that WPs in a particular position in the q700 SOM grid (i.e., 1,1; 1,2; etc.) do not necessarily correspond to those in the mslp SOM grid, since the algorithm groups patterns in random positions. Note that opposite patterns are seen in the corners of the SOM matrix: 2,1 vs. 1,3; 1,1 vs. 2,3; 1,2 vs. 2,2. As can be noticed, a couple of patterns (2,1 and 2,2) evidence positive moisture anomalies over the Caribbean and southeastern Mexico. As expected, those patterns are associated with above-normal precipitation in the region (Figure S1 of Supplementary Materials). In contrast, WP 1,3 shows negative anomalies of specific humidity (∼−1 g kg), and it is associated with below-normal precipitation (Figure S1 of Supplementary Materials). The impact of those WPs in the hydrological cycle is therefore remarkable, because their persistence and frequency of occurrence can induce either very wet summers or droughts over southern Mexico.
The WPs of wind anomalies at 700 hPa are presented in Figure 4 (u component) and Figure 5 (v component). The SOM analysis detected important features of the low-level winds in the study region. For example, WPs 2,2 and 2,3 of u (Figure 4) show negative anomalies in the southern Caribbean Sea, evidencing the increase of the zonal component of wind in the East–West direction, consistent with the Caribbean Low Level Jet (CLLJ). The CLLJ is a climate feature observed in the lower troposphere during summer [52], which influences local weather in Central America and nearby regions. On the other hand, WPs 1,1 and 1,2 show an enhancement of the westerly flow equatorward of 20° N (note the large positive anomalies), while a strengthening of the trade-wind flow is observed northward of 20° N. Similarly, WPs of the v component (Figure 5) demonstrate the main characteristics of the regional winds, such as a mid-latitude wave pattern, whose troughs and ridges reach the tropical regions and affect Eastern Mexico. Additionally, during the rainy season, zonal geopotential gradients associated with summer heating over Central America and Mexico induce a meridional flow toward the central US [53], which has implications for moisture transport over regions of Mexico. That strengthening of the meridional circulation is captured by WPs 1,2 and 2,2. Notice that those modes have the largest relative frequency within the period (17.73% and 17.20%), denoting their importance for the weather and climate in the region.
3.2. Comparison between CMIP5 and ERA-Interim Patterns
The spatial correlation between CMIP5 and ERA-Interim patterns was computed, obtaining one correlation matrix for each model and for each variable (a total of 16 matrices). In those correlation matrices, large positive values indicate a high correspondence of simulated and reference weather regimes, hence allowing the association of the WPs in CMIP5 models with those in ERA-Interim by selecting the one that evidenced the largest positive spatial correlation. Tables S1–S4 of the Supplementary Materials summarize the spatial correlation between CMIP5 and corresponding ERA-Interim patterns for all of the variables. Note that correlations are high in the vast majority of cases, which validates the use of this criterion for the evaluation.
In some cases, all six regimes from the reference data (from 1,1 to 2,3) were completely identified, providing a one-to-one association for that specific model and variable. However, in other cases, the six regimes from ERA-Interim were not entirely captured by the models, denoted by the blanks in Tables S2 and S3. This means that either CMIP5 models simulated fewer regimes than the reanalysis—unable to capture the variety of patterns in the reference dataset—or that models identified some regimes that are not contained in the reanalysis. This may possibly be related to the fact that only one realization of the CMIP5 models (ensemble member r1i1p1) is analyzed here, since it was the only one available in the data repository for the period, daily timescale, and variables considered in this study.
Figure 6 shows Taylor diagrams for the root mean squared error versus the spatial correlation between CMIP5 models and ERA-Interim patterns. The advantage of this type of plot is that it allows detection if the highly correlated regimes (more spatially similar to each other) also have lower errors with respect to the reference dataset.
For mslp (Figure 6a), all models managed to capture the six regimes identified in ERA-Interim, with the lowest spatial correlations observed for MPI-ESM-LR, while the rest of the models correlate very well with the reanalysis (above 0.93). The RMSE is fairly similar for all WPs, with the model MPI-ESM-LR being the one with the larger errors. The WPs from the q700 reanalysis field were not all captured by MPI-ESM-LR and ACCESS1.3 (blank spaces in Table S2), while MRI-ESM1 and CMCC-CM were able to detect all six regimes (Figure 6b). Note that correlations for this variable are not as high as for mslp, but are still statistically significant. It is notable how WPs 1,2 and 2,2 (black and yellow, respectively) have the lowest spatial correlations for all models, although the RMSE is also small, indicating a good agreement between the anomalies. For u700 (Figure 6c), only model MRI-ESM1 failed to identify the full range of regimes, detecting only four out of six (blank spaces in Table S3). Correlations range between 0.67 and 0.96. The v700 (Figure 6d) WPs were well captured by all models, with a strong association denoted by the high correlations (above 0.85). For both u700 and v700, patterns 1,2 and 2,2 (black and yellow, respectively) from CMIP5 models have small RMSEs, with values below 0.4 m s. This suggests a good performance of the models for these weather patterns.
These results can also be evidenced in Figures S2 and S3 of Supplementary Material, where the percentage of area with absolute errors above a certain threshold is plotted. It is remarkable that for both u700 and v700, patterns 1,2 and 2,2 from the CMIP5 models have few points that exceed an error of 0.4 with respect to the reference dataset, with values below 40 and 20% for u and v, respectively. As indicated before, this can imply that models have ability in the representation of those atmospheric regimes.
3.3. Comparison between Frequencies of Occurrence
In the previous subsections, we have seen that models have larger or smaller errors depending on the weather pattern considered. Here, we want to assess if the frequency of occurrence of the weather patterns is similar in CMIP5 models and in reanalysis. If WPs’ frequencies in models and the reference dataset are comparable, this implies that each anomaly pattern in a CMIP5 model occurs as often as its counterpart in the ERA-Interim dataset over the historical period. Figure 7 displays the error bars of the relative frequencies of occurrence of models with respect to ERA-Interim.
For mslp, CMIP5 models do not reproduce the frequencies of WPs 1,1 and 1,3 very well, indicated by an error of about 2%, while for the rest of the patterns, the error remains around or below 1%. In contrast, WPs for q700 have a large dispersion between simulated and reanalysis frequencies, particularly for WPs 1,3 and 2,3, with differences between 2% and 4.2%. In the case of 1,3, the discrepancy in frequencies occurs despite the large spatial correlation found for this regime in all models (above 0.85, see Table S2 of Supplementary Materials). Interestingly, for WP 2,2, the frequencies of models and reanalysis are similar (errors below 1%) although there is low spatial correlation between the CMIP5 patterns and ERA-Interim. For u700, most of the CMIP5 regimes (1,1; 1,2; 2,1, and 2,3) occur at roughly the same frequencies as those of their corresponding regimes in ERA-Interim, with errors below 1%; for v700, the errors are slightly larger and are independent of the WP.
In summary, there is a general correspondence between the frequency of occurrence of modeled and reference patterns. Note however, that modeled frequencies of WPs for the specific humidity show larger dispersion than for the rest of the variables considered.
3.4. Characterization of Model Performance
The assessment of models’ performances in terms of their ability to represent the main synoptic features of the region is further quantified by some additional metrics, as discussed in Section 2.4. Figure 8 shows the typical model error for each variable as a function of the WPs. Recall that the TME is equal to the median of the RMSE of all models and thus provides information about the general abilities of models in representing specific patterns, assigning less weight to extreme values. Note that the TME for mslp seems to be independent of the weather pattern, since the errors oscillate around 0.2 hPa for all regimes. This result of the TME is important because it indicates that the typical model behavior exhibits relatively low sensitivity to the weather patterns for this variable.
The WP 1,2 for q700 shows lower TME values with respect to the other WPs; this regime displays negative anomalies of specific humidity over the Caribbean sea, the Western Atlantic, southern Mexico, and Central America, and positive anomalies at the Pacific and central Mexico. In general, the anomalies are weak for this WP, with values between −0.1 and −0.6 g kg, which means that it is not far from the seasonal average of specific humidity in the rainy season, which could explain the fact that models have more skill in representing this particular pattern. While this WP for q700 has the largest frequency of occurrence in reanalysis, note that models fail to reproduce its frequency during the study period (see Figure 7b).
Although for most of the WPs of u and v, the TME is similar (∼0.6 and 0.7 m s), it is remarkable that models perform much better for WPs 1,2 and 2,2—at the center of the SOM grid. In the case of u700, those WPs represent an intensification of the trade-wind zonal component regime above 20° N (WP 1,2) and the maximum in the CLLJ (WP 2,2). Although those WPs do not display the largest frequencies of occurrence, they are remarkably important in the region because they strongly influence the weather of southeastern Mexico and Central America during the rainy season. For example, several authors have documented the important relationship of the CLLJ with precipitation during what is known as the mid-summer drought in Central America and southern Mexico [49,54,55,56]. A strengthening of the CLLJ during summer is significantly associated with a decrease in precipitation in southern Mexico. Therefore, the representation of the CLLJ in GCMs has important implications for projections of future climate in the Caribbean and surrounding regions [57].
In the case of v700, the lower TME values correspond to WPs 1,2 and 2,2 associated with a strengthening of the meridional component of wind over the northern region of the area of study. The northerly flow (WP 1,2) contributes to the advection of more moisture toward the US, which benefits rainfall processes in that region. However, it also leads to less humidity available for precipitation in local regions, such as southeastern Mexico. As can be seen, those patterns influence local weather and precipitation processes in Mexico, and also have a large frequency of occurrence; therefore, it is very important that models tend to reproduce them well. For the rest of the WPs, the TME is similar (around 0.4 m s).
Figure 9 presents the relative model performance index for every CMIP5 model and WP. As this index is normalized by the TME, negative values (cold colors) indicate that model performance is higher than the typical skill of all models, since its RMSE is lower. Likewise, large positive values (warm colors) denote a poorer-than-typical behavior of a particular model, because the RMSE is greater than the TME. Thus, near-zero values (white) indicate that model performance is close to the typical model behavior. For mslp (Figure 9, first panel), the MPI-ESM-LR shows above-typical errors and therefore a poor representation of the WPs. MRI-ESM1 also performs around 40% worse than the typical model for WPs 1,3 and 2,1 of mslp. The rest of the models perform better than normal for all WPs. CMCC-CM and MPI-ESM-LR appear to be worse than others in simulating most of the moisture patterns (Figure 9, second panel), while ACCESS1.3 and MRI-ESM1 have either equal or lower-than-typical RMSEs for almost all the WPs. For the case of u700 (Figure 9, third panel), the models MPI-ESM-LR and MRI-ESM1 indicate errors larger than average for the majority of WPs, while ACCESS1.3 performs better than normal, independently of the prevalent atmospheric regime. In the case of the v700 (Figure 9, fourth panel), models have RMPIs around zero, indicating that they tend to have average errors in all of the regimes. An exception is seen for MRI-ESM1 in WPs 1,3 and 2,1, where the errors are around 50% lower than average. As a summary, this metric seems to indicate that MPI-ESM-LR has the poorest performance for all variables and WPs, while ACCESS1.3 seems to have the best skill for most of variables and WPs.
Figure 10 shows the average variance ratio between models and reference WPs over the period analyzed. Here, values larger than 1 (warm colors) indicate that models overestimate the spatial variance when representing the WPs, while values lower than 1 (cold colors) indicate the opposite. Therefore, values around 1 (white) indicate that models and reference WPs have comparable variances. Models indicate more variance than the reference in almost all of the WPs for the sea-level pressure (Figure 10, first panel), particularly for WPs 1,1 and 2,3 (patterns associated with oscillations in intensity and location of the NASH during the summer), which means that those models do not accurately represent this important synoptic feature for the region. The variance in two models for WP 2,1 compares adequately with reanalysis. Model MPI-ESM-LR largely overestimates the variance of ERA-Interim for all regimes. The variance ratio for q700 (Figure 10, second panel) shows values around 1 (which indicates similar variability between models and reference), particularly for WP 1,2. This pattern has been shown previously to have the lowest errors in all models. The variance ratio for the low-level winds shows values around 1 for most of the WPs. The model variance ratio for u700 (Figure 10, third panel) is also around 1 for ACCESS1.3 and MRI-ESM1, while MPI-ESM-LR and CMCC-CM tend to overestimate the variance seen in reanalysis. A similar behavior is found for v700.
The analysis of this metric indicates that MPI-ESM-LR and CMCC-CM simulate more variance than the reference dataset for all variables, and that their variance is independent of WPs. This suggests that the spatio-temporal variance in the reanalysis dataset is not reproduced correctly by those models. Instead, models simulate a larger range of daily synoptic conditions than reanalysis, and therefore, fail to correctly represent the dominant atmospheric conditions that determine weather and climate in the region of study.
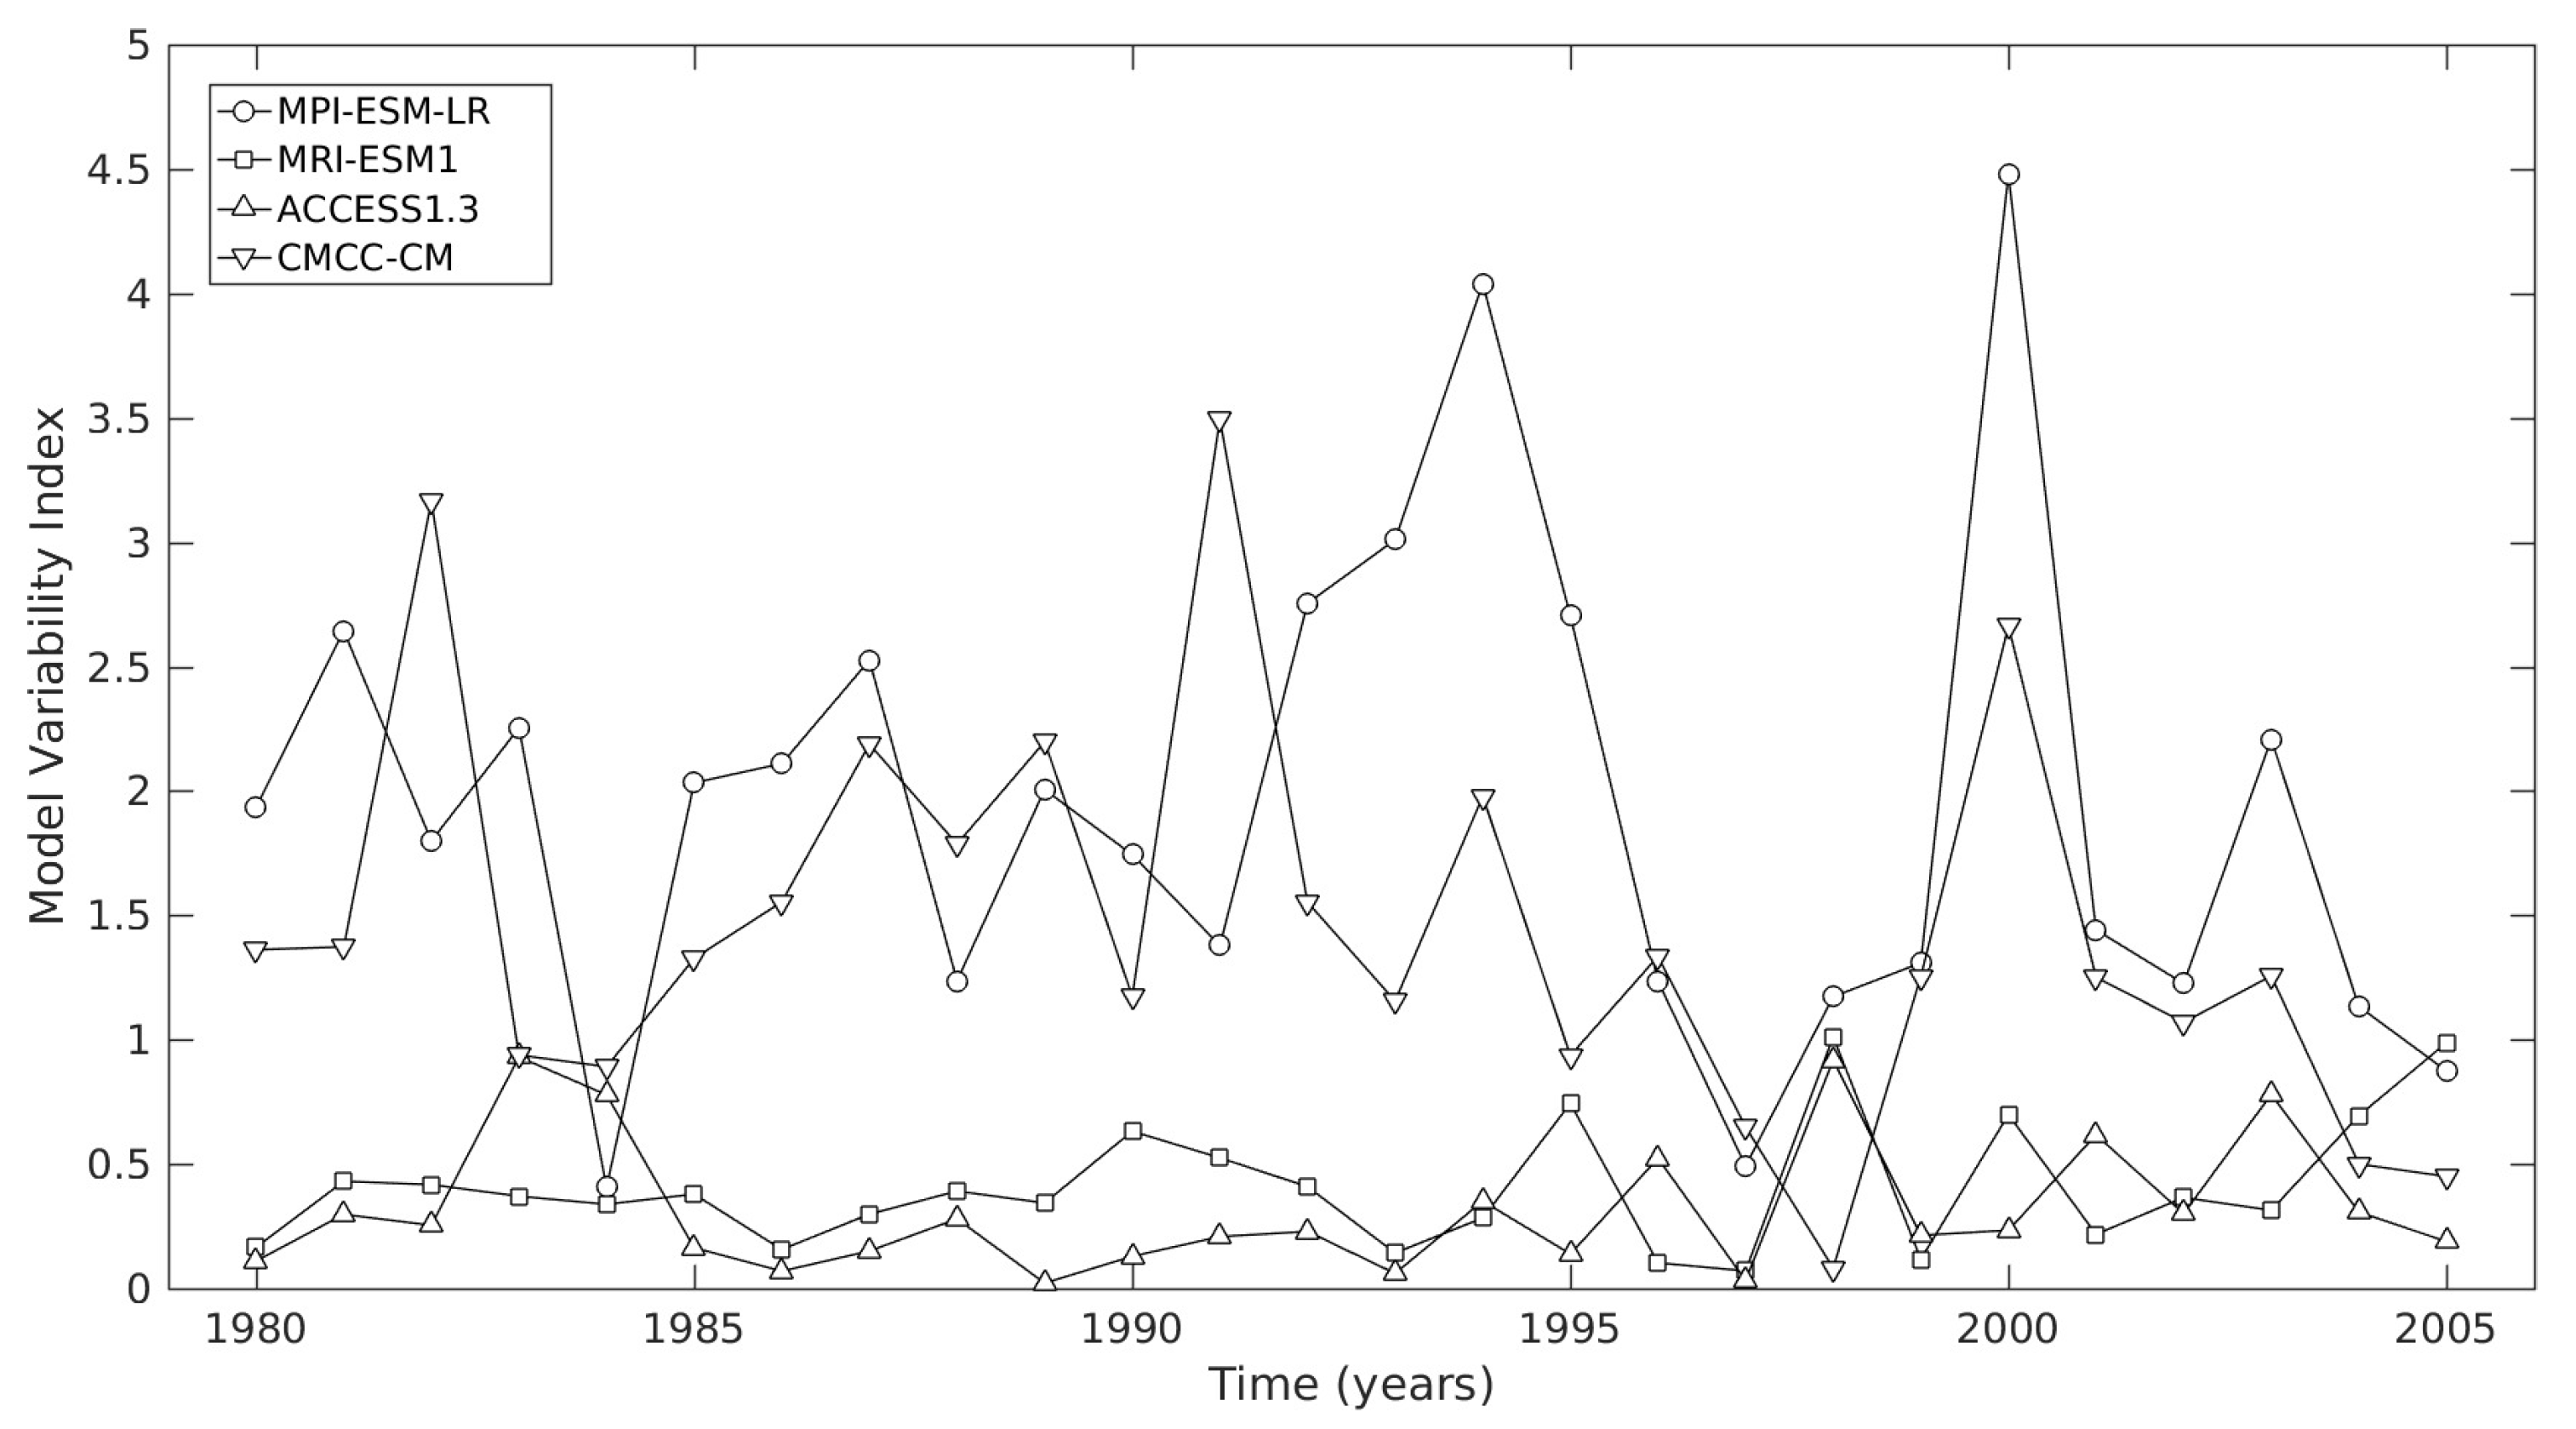
Finally, the model variability index (MVI), which takes into account all WPs and variables (Figure 11), is calculated to further assess the time evolution of model performance throughout the studied period. The advantage of using this metric is that it includes the variance of all the WPs for each variable, allowing the determination of an overall variance in the model forecast of each of the variables. Since the MVI is calculated according to Equation (4), near-zero values indicate similarity between the fields’ standard deviations in models and the reference dataset.
Note that ACCESS1.3 and MRI-ESM1 display the lowest index, remaining close to zero for the whole period, which indicates the similarity of their variances to that of ERA-Interim. In contrast, MPI-ESM-LR and CMCC-CM have the largest values of the index, indicating much more variance than the reanalysis, supporting the previous analysis for each WP. The MVI is particularly large for some specific years, indicating a poor correspondence between their variance and that of ERA-Interim.
4. Summary and Conclusions
In this paper, we applied a weather pattern evaluation to some CMIP5 models to show the value of this approach for the assessment of the models’ behaviors under different atmospheric regimes that affect local weather in Mexico. Such a task is relevant for the region because decision-making will depend on climate projections from these models. The advantage of this approach is that it allows the examination of the models’ abilities to simulate the main synoptic patterns associated with local weather in the region and thus quantify the errors under different weather patterns that are known to occur in the current climate. The weather patterns identified from models have been evaluated against those from ECMWF reanalysis ERA-Interim, taking into account the errors and the spatial similarity, as well as the differences between their frequencies of occurrence. Some additional metrics allowed the characterization of models skills. In turn, this allows the identification of a skill hierarchy of models for the representation of a specific variable in the region of study.
The analysis of the errors demonstrated that, in some cases, model performance varies as a function of the weather pattern. For example, the four CMIP5 models performed more accurately on one particular humidity pattern—1,2. This WP has negative anomalies over the Caribbean Sea, the Western Atlantic, southern Mexico, and Central America, and positive anomalies over the eastern Pacific and central Mexico. One particular characteristic of this WP is that anomalies are weak over most of the area (see Figure 3), indicating that this pattern is close to the seasonal climatological mean of humidity, which most of the GCMs are able to simulate correctly. However, the frequency of occurrence of this pattern is not well captured by the models. This analysis also indicates that moisture regimes that particularly deviate from the long-term seasonal mean remain poorly represented by models, which has serious implications for precipitation projections in the region.
Similarly, models display different abilities under certain weather patterns identified from the wind components. In general, models perform better in the presence of two particular regimes associated with the zonal component: (i) The strengthening of the trade-wind flow north of 20° N (1,2), and (ii) the maximum in the CLLJ (2,2). Both WPs influence local weather over southeastern Mexico and have significant relevance to seasonal prediction. For example, the positive association of the CLLJ with negative precipitation anomalies is well documented in the literature. Similarly, the intensification of the trade-wind regime above 20° N causes an increase in the vertical shear, thus inhibiting the transition from shallow to deep convection and the formation of precipitation. Therefore, it is very important to determine that CMIP5 models can represent these WPs accurately. For the meridional component, models demonstrate more skill in simulating the two regimes at the center of the SOM grid: 1,2 and 2,2. These WPs are opposite patterns representing strong anomalies, indicating the strengthening of the meridional flow over the Gulf of Mexico. This feature has implications for moisture transport in the region, since strong northerly flow carries most of the humidity to the US, limiting the amount of moisture that is available for convection development in eastern Mexico. Also, these WPs are important because their relative frequency in reanalysis over the period analyzed is the largest with respect to the other WPs (17.73% and 17.20%), which, in the case of WP 2,2, is correctly reproduced by CMIP5 models.
Models can adequately represent the sea-level pressure for all WPs. The errors have similar values, suggesting that in most cases, model ability was independent of WPs. Models can generally reproduce the mslp WPs at about the same frequency as in the reference dataset.
This methodology also allowed the ranking of the models, taking into account the indexes related to models’ performances and dispersion of the data. Our results indicate that MPI-ESM-LR in the region of interest and the period selected has the worst performance for all variables and weather patterns, which is possibly associated with the large variance of simulated patterns compared with the variance of the ERA-Interim dataset. Alternatively, ACCESS1.3 proved to have the best skill for most of the variables and weather patterns.
The type of study presented here is an important precursor to specific applications such as regional impacts of climate change. There has been an increased demand from policymakers to rely on climate model projections to plan adaptation and mitigation strategies; these studies help identify models that simulate more or less adequately the dominant weather patterns in certain regions. Specifically, there is a pressing need to assess model performance in the tropics, where models often have lower ability –compared than in mid-latitudes– in simulating variables related to precipitation. Further work along these lines should address the evaluation of climate models in the tropics, focusing on other simulated fields such as clouds and precipitation.
Supplementary Materials
Supplementary materials can be found at https://www.mdpi.com/2225-1154/8/1/5/s1.
Author Contributions
Conceptualization, G.B.R.; Data curation, Y.D.-E.; Formal analysis, Y.D.-E., G.B.R., and O.O.D.R.; Funding acquisition, G.B.R.; Methodology, Y.D.-E., G.B.R., and O.O.D.R.; Resources, G.B.R.; Software, Y.D.-E.; Supervision, G.B.R.; Visualization, Y.D.-E. and O.O.D.R.; Writing—original draft, Y.D.-E.; Writing—review & editing, G.B.R. All authors have read and agreed to the published version of the manuscript.
Funding
This research was partially funded by grants IN102818 and IN109720 from PAPIIT at UNAM, and by grant FC-2164 from CONACYT in Mexico. Y. Díaz-Esteban and O. Díaz Rodríguez also acknowledge the support of CONACYT.
Acknowledgments
Y. Díaz-Esteban and O. Díaz Rodríguez acknowledge the support of CONACYT in Mexico. This study was partially funded by grants IN102818 and IN109720 from PAPIIT at UNAM and by grant FC-2164 from CONACYT. G. Raga acknowledges the support of the Senior Associate Program of the International Centre for Theoretical Physics (ICTP). We also acknowledge the World Climate Research Programme’s Working Group on Coupled Modelling, which is responsible for CMIP, and we thank the climate modeling groups for producing and making their model output available. The availability of the public data sets of ECMWF was highly helpful for this work.
Conflicts of Interest
The authors declare no conflict of interest.
References
- Flato, G.; Marotzke, J.; Abiodun, B.; Braconnot, P.; Chou, S.; Collins, W.; Cox, P.; Driouech, F.; Emori, S.; Eyring, V.; et al. Climate Change 2013: The Physical Science Basis. Contribution of Working Group I to the Fifth Assessment Report of the Intergovernmental Panel on Climate Change; Chapter Evaluation of Climate Models; Cambridge University Press: Cambridge, UK; New York, NY, USA, 2013. [Google Scholar]
- Taylor, K.E.; Stouffer, R.J.; Meehl, G.A. An overview of CMIP5 and the experiment design. Bull. Am. Meteorol. Soc. 2012, 485–498. [Google Scholar] [CrossRef] [Green Version]
- Kim, H.; Webster, P.; Curry, J. Evaluation of short-term climate change prediction in multi-model CMIP5 decadal hindcasts. Geophys. Res. Lett. 2012, 39, L10701. [Google Scholar] [CrossRef]
- Knutti, R.; Sedláček, J. Robustness and uncertainties in the new CMIP5 climate model projections. Nat. Clim. Chang. 2013, 3, 369–373. [Google Scholar] [CrossRef]
- Neelin, J.; Langenbrunner, B.; Meyerson, J.; Hall, A.; Berg, N. California winter precipitation change under global warming in the coupled model intercomparison project phase 5 ensemble. J. Clim. 2013, 26. [Google Scholar] [CrossRef]
- Polade, S.; Gershunov, A.; Cayan, D.; Dettinger, M.; Pierce, D. Natural climate variability and teleconnections to precipitation over the Pacific-North American region in CMIP3 and CMIP5 models. Geophys. Res. Lett. 2013, 40, 2296–2301. [Google Scholar] [CrossRef]
- Zappa, G.; Shaffrey, L.; Hodges, K. The Ability of CMIP5 Models to Simulate North Atlantic Extratropical Cyclones. J. Clim. 2013, 26, 5379–5396. [Google Scholar] [CrossRef]
- Sillmann, J.; Kharin, V.V.; Zhang, X.; Zwiers, F.W.; Bronaugh, D. Climate extremes indices in the CMIP5 multimodel ensemble:Part 1. Model evaluation in the present climate. J. Geophys. Res. Atmos. 2013, 118, 1716–1733. [Google Scholar] [CrossRef]
- Maloney, E.D.; Camargo, S.J.; Chang, E.; Colle, B.; Fu, R.; Geil, K.L.; Hu, Q.; Jiang, X.; Johnson, N.; Karnauskas, K.B.; et al. North American Climate in CMIP5 Experiments: Part III: Assessment of Twenty-First-Century Projections. J. Clim. 2014, 27, 2230–2270. [Google Scholar] [CrossRef]
- Thibeault, J.; Seth, A. A Framework for Evaluating Model Credibility for Warm-Season Precipitation in Northeastern North America: A Case Study of CMIP5 Simulations and Projections. J. Clim. 2014, 27, 493–510. [Google Scholar] [CrossRef]
- Mehran, A.; AghaKouchak, A.; Phillips, T. Evaluation of CMIP5 continental precipitation simulations relative to satellite-based gauge-adjusted observations. J. Geophys. Res. Atmos. 2014, 119, 1695–1707. [Google Scholar] [CrossRef] [Green Version]
- Grainger, S.; Frederiksen, C.S.; Zheng, X. Assessment of Modes of Interannual Variability of Southern Hemisphere Atmospheric Circulation in CMIP5 Models. J. Clim. 2014, 27, 8107–8125. [Google Scholar] [CrossRef]
- Elguindi, N.; Giorgi, F.; Turuncoglu, U. Assessment of CMIP5 global model simulations over the subset of CORDEX domains used in the Phase I CREMA. Clim. Chang. 2014, 125, 7–21. [Google Scholar] [CrossRef]
- Elguindi, N.; Grundstein, A.; Bernardes, S.; Turuncoglu, U.; Feddema, J. Assessment of CMIP5 global model simulations and climate change projections for the 21st century using a modified Thornthwaite climate classification. Clim. Chang. 2014, 122, 523–538. [Google Scholar] [CrossRef]
- Stanfield, R.E.; Dong, X.; Xi, B.; Kennedy, A.; Del Genio, A.; Minnins, P.; Jiang, J.H. Assessment of NASA GISS CMIP5 and Post-CMIP5 Simulated Clouds and TOA Radiation Budgets Using Satellite Observations. Part I: Cloud Fraction and Properties. J. Clim. 2014, 27, 4189–4208. [Google Scholar] [CrossRef]
- Stanfield, R.E.; Dong, X.; Xi, B.; Del Genio, A.; Minnis, P.; Doelling, D.; Loeb, N. Assessment of NASA GISS CMIP5 and Post-CMIP5 Simulated Clouds and TOA Radiation Budgets Using Satellite Observations. Part II: TOA Radiation Budget and CREs. J. Clim. 2015, 28, 1842–1864. [Google Scholar] [CrossRef]
- Koutroulis, A.; Grillakis, M.G.; Tsanis, I.K.; Papadimitriou, L. Evaluation of precipitation and temperature simulation performance of the CMIP3 and CMIP5 historical experiments. Clim.Dyn. 2016, 47, 1881–1898. [Google Scholar] [CrossRef]
- Ning, L.; Bradley, R.S. NAO and PNA influences on winter temperature and precipitation over the eastern United States in CMIP5 GCMs. Clim. Dyn. 2016, 46, 1257–1276. [Google Scholar] [CrossRef]
- Masato, G.; Woollings, T.; Williams, P.; Hoskins, B.; Lee, R. A regime analysis of Atlantic winter jet variability applied to evaluate HadGEM3-GC2. Q. J. R. Meteorol. Soc. 2016, 142, 3162–3170. [Google Scholar] [CrossRef] [Green Version]
- Parsons, L.; Loope, G.; Overpeck, J.; Ault, T.; Stouffer, R.; Cole, J. Temperature and Precipitation Variance in CMIP5 Simulations and Paleoclimate Records of the Last Millennium. J. Clim. 2017, 30, 8885–8912. [Google Scholar] [CrossRef] [Green Version]
- Sheffield, J.; Barrett, A.P.; Colle, B.; Nelun Fernando, D.; Fu, R.; Geil, K.L.; Hu, Q.; Kinter, J.; Kumar, S.; Langenbrunner, B. North American Climate in CMIP5 Experiments. Part I: Evaluation of Historical Simulations of Continental and Regional Climatology. J. Clim. 2013, 26, 9209–9245. [Google Scholar] [CrossRef] [Green Version]
- Carvalho, L.; Jones, C. CMIP5 Simulations of Low-Level Tropospheric Temperature and Moisture over the Tropical Americas. J. Clim. 2013, 26, 6257–6286. [Google Scholar] [CrossRef] [Green Version]
- Stanfield, R.E.; Jiang, J.H.; Dong, X.; Xi, B.; Su, H.; Donner, L.; Rotstayn, L.; Wu, T.; Cole, J.; Shindo, E. A quantitative assessment of precipitation associated with the ITCZ in the CMIP5 GCM simulations. Clim. Dyn. 2016, 47, 1863–1880. [Google Scholar] [CrossRef]
- Grose, M.R.; Brown, J.N.; Narsey, S.; Brown, J.R.; Murphy, B.F.; Langlais, C.; Sen Gupta, A.; Moise, A.F.; Irving, D.B. Assessment of the CMIP5 global climate model simulations of the western tropical Pacific climate system and comparison to CMIP3. Int. J. Climatol. 2014, 34, 3382–3399. [Google Scholar] [CrossRef]
- Sheffield, J.; Camargo, S.J.; Fu, R.; Hu, Q.; Jiang, X.; Johnson, N.; Karnauskas, K.B.; Kim, S.T.; Kinter, J.; Kumar, S.; et al. North American Climate in CMIP5 Experiments. Part II: Evaluation of Historical Simulations of Intraseasonal to Decadal Variability. J. Clim. 2013, 26, 9247–9290. [Google Scholar] [CrossRef]
- Langenbrunner, B.; Neelin, J. Analyzing ENSO teleconnections in CMIP models as a measure of model fidelity in simulating precipitation. J. Clim. 2013, 26, 4431–4446. [Google Scholar] [CrossRef]
- Geil, K.L.; Serra, Y.L.; Zeng, X. Assessment of CMIP5 Model Simulations of the North American Monsoon System. J. Clim. 2013, 26, 8787–8801. [Google Scholar] [CrossRef]
- Hidalgo, H.; Alfaro, E. Skill of CMIP5 climate models in reproducing 20th century basic climate features in Central America. Int. J. Climatol. 2015, 35, 3397–3421. [Google Scholar] [CrossRef] [Green Version]
- Simon Wang, S.Y.; Huang, W.R.; Yoon, J.H. The North American winter ‘dipole’ and extremes activity: A CMIP5 assessment. Atmos. Sci. Lett. 2015, 16, 338–345. [Google Scholar] [CrossRef] [Green Version]
- Fuentes-Franco, R.; Giorgi, F.; Coppola, E.; Kucharski, F. The role of ENSO and PDO in variability of winter precipitation over North America from twenty first century CMIP5 projections. Clima. Dyn. 2016, 46, 3259–3277. [Google Scholar] [CrossRef]
- Nigro, M.; Cassano, J.; Seefeldt, M. A Weather-Pattern-Based Approach to Evaluate the Antarctic Mesoscale Prediction System (AMPS) Forecasts: Comparison to Automatic Weather Station Observations. Weather Forecast. 2011, 26, 184–198. [Google Scholar] [CrossRef]
- Schuenemann, K.; Cassano, J. Changes in synoptic weather patterns and Greenland precipitation in the 20th and 21st centuries: 1. Evaluation of late 20th century simulations from IPCC models. J. Geophys. Res. 2009, 114, D20113. [Google Scholar] [CrossRef] [Green Version]
- Finnis, J.; Cassano, J.; Holland, M.; Serrezed, M.; Uotila, P. Synoptically forced hydroclimatology of major Arctic watersheds in general circulation models; Part 1: The Mackenzie River Basin. Int. J. Climatol. 2009, 29, 1226–1243. [Google Scholar] [CrossRef]
- Radić, V.; Clarke, G. Evaluation of IPCC Models’ Performance in Simulating Late-Twentieth-Century Climatologies and Weather Patterns over North America. J. Clim. 2011, 24, 5257–5274. [Google Scholar] [CrossRef] [Green Version]
- Perez, J.; Menendez, M.; Mendez, F.J.; Losada, I.J. Evaluating the performance of CMIP3 and CMIP5 global climate models over the north-east Atlantic region. Clim. Dyn. 2014, 43, 2663–2680. [Google Scholar] [CrossRef]
- Muñoz, A.G.; Yang, X.; Vecchi, G.A.; Robertson, A.W.; Cooke, W.F. A Weather-Type-Based Cross-Time-Scale Diagnostic Framework for Coupled Circulation Models. J. Clim. 2017, 30, 8951–8972. [Google Scholar] [CrossRef]
- Frederiksen, C.S.; Ying, K.; Grainger, S.; Zheng, X. Modes of interannual variability in northern hemisphere winter atmospheric circulation in CMIP5 models: Evaluation, projection and role of external forcing. Clim. Dyn. 2018, 1–21. [Google Scholar] [CrossRef]
- Brigode, P.; Gérardin, M.; Bernardara, P.; Gailhard, J.; Ribstein, P. Changes in French weather pattern seasonal frequencies projected by a CMIP5 ensemble. Int. J. Climatol. 2018, 38, 3991–4006. [Google Scholar] [CrossRef] [Green Version]
- Wang, J.; Dong, X.; Kennedy, A.; Hagenhoff, B.; Xi, B. A Regime-Based Evaluation of Southern and Northern Great Plains Warm-Season Precipitation Events in WRF. Weather Forecast. 2019, 34, 805–831. [Google Scholar] [CrossRef] [Green Version]
- Kohonen, T. Self-Organizing Maps, 3rd ed.; Springer-Verlag: Berlin/Heidelberg, Germany, 2001. [Google Scholar]
- Díaz-Esteban, Y.; Raga, G. Weather regimes associated with summer rainfall variability over southern Mexico. Int. J. Climatol. 2018, 38, 169–186. [Google Scholar] [CrossRef]
- Méndez, M.; Magaña, V. Regional aspects of prolonged meteorological droughts over Mexico and Central America. J. Clim. 2010, 23, 1175–1188. [Google Scholar] [CrossRef] [Green Version]
- Curtis, S. Daily precipitation distributions over the intra-Americas seas and their inter-annual variability. Atmósfera 2013, 26, 243–259. [Google Scholar] [CrossRef] [Green Version]
- Dee, D.; Uppala, S.; Simmons, A.; Berrisford, P.; Poli, P.; Kobayashi, S.; Andrae, U.; Balmaseda, M.; Balsamo, G.; Bauer, P.; et al. The ERA-Interim reanalysis: Configuration and performance of the data assimilation system. Q. J. R. Meteorol. Soc. 2011, 137, 553–597. [Google Scholar] [CrossRef]
- Glecker, P.; Taylor, K.; Doutriaux, C. Performance metrics for climate models. J. Geophys. Res. 2008, 113, L06711. [Google Scholar] [CrossRef]
- Vesanto, J.; Alhoniemi, E. Clustering of the self-organizing map. IEEE Trans. Neural Netw. 2000, 11, 586–600. [Google Scholar] [CrossRef] [PubMed]
- Elghazel, H.; Benabdeslem, K. Different aspects of clustering the self-organizing maps. Neural Process. Lett. 2014, 39, 97–114. [Google Scholar] [CrossRef]
- Romero-Centeno, R.; Zavala-Hidalgo, J.; Raga, G.B. Midsummer Gap Winds and Low-Level Circulation over the Eastern Tropical Pacific. J. Clim. 2007, 20, 3768–3784. [Google Scholar] [CrossRef] [Green Version]
- Wang, C. Variability of the Caribbean low-level jet and itsrelations to climate. Clim. Dyn. 2007, 29, 411–422. [Google Scholar] [CrossRef] [Green Version]
- Wang, C.; Lee, S. Atlantic warm pool, Caribbean low-level jet, and their potential impact on Atlantic hurricanes. Geophys. Res. Lett. 2007, 34, L02703. [Google Scholar] [CrossRef] [Green Version]
- Colbert, A.J.; Soden, B.J. Climatological Variations in North Atlantic Tropical Cyclone Tracks. J. Clim. 2012, 25, 657–673. [Google Scholar] [CrossRef]
- Amador, J.A. The intra-Americas sea low-level jet, overview and future research. Ann. N. Y. Acad. Sci. 2008, 1146, 153–188. [Google Scholar] [CrossRef] [Green Version]
- Cook, K.H.; Vizy, E.K. Hydrodynamics of the Caribbean Low-Level Jet and Its Relationship to Precipitation. J. Clim. 2010, 23, 1477–1494. [Google Scholar] [CrossRef]
- Magaña, V.; Amador, J.; Medina, S. The midsummer drought over Mexico and Central America. J. Clim. 1999, 12, 1577–1588. [Google Scholar] [CrossRef]
- Muñoz, E.; Busalacchi, A.; Nigam, S.; Ruiz-Barradas, A. Winter and summer structure of the Caribbean low-level jet. J. Clim. 2008, 21, 1260–1276. [Google Scholar] [CrossRef]
- Whyte, F.; Taylor, M.; Stephenson, T.; Campbell, J. Features of the Caribbean low level jet. Int. J. Climatol. 2008, 28, 119–128. [Google Scholar] [CrossRef]
- Martin, E.R.; Schumacher, C. The Caribbean Low-Level Jet and Its Relationship with Precipitation in IPCC AR4 Models. J. Clim. 2011, 24, 5935–5950. [Google Scholar] [CrossRef]
Figure 1.
Study area with the long-term seasonal climatology of mean sea level pressure (shaded, in hPa), 700 hPa winds (vectors, in m s), and 700 hPa specific humidity (isolines, in g kg), from ERA-Interim.
Figure 1.
Study area with the long-term seasonal climatology of mean sea level pressure (shaded, in hPa), 700 hPa winds (vectors, in m s), and 700 hPa specific humidity (isolines, in g kg), from ERA-Interim.

Figure 2.
Reference weather patterns for mean sea level pressure (mslp) obtained from self-organizing maps (SOM) with ERA-Interim data for the period 1980–2005. The patterns are expressed in anomalies with respect to the long-term mean. The position (i, j) of each pattern in the matrix, relative frequency (in %), and total number of days are indicated at the top of each map.
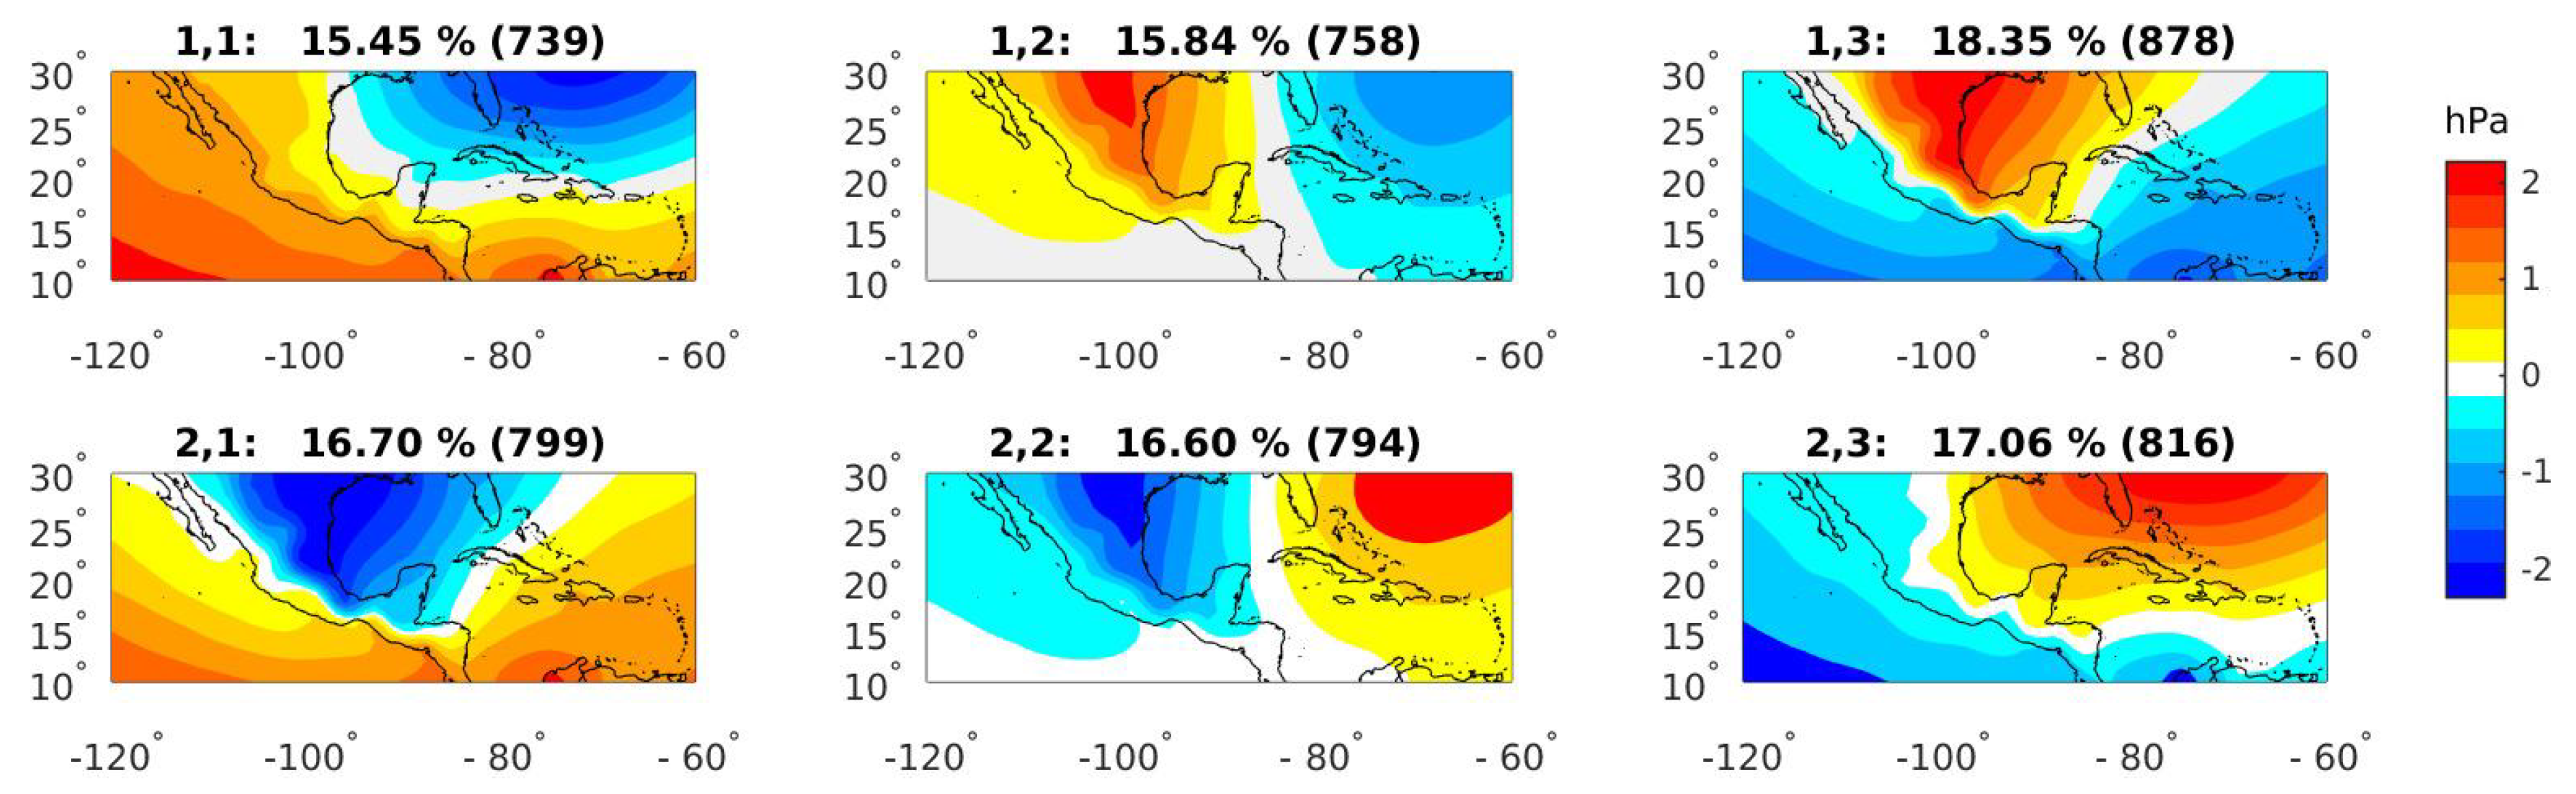
Figure 3.
Same as Figure 2, but for q700.
Figure 3.
Same as Figure 2, but for q700.

Figure 4.
Same as Figure 2, but for component u of wind at 700 hPa.
Figure 4.
Same as Figure 2, but for component u of wind at 700 hPa.
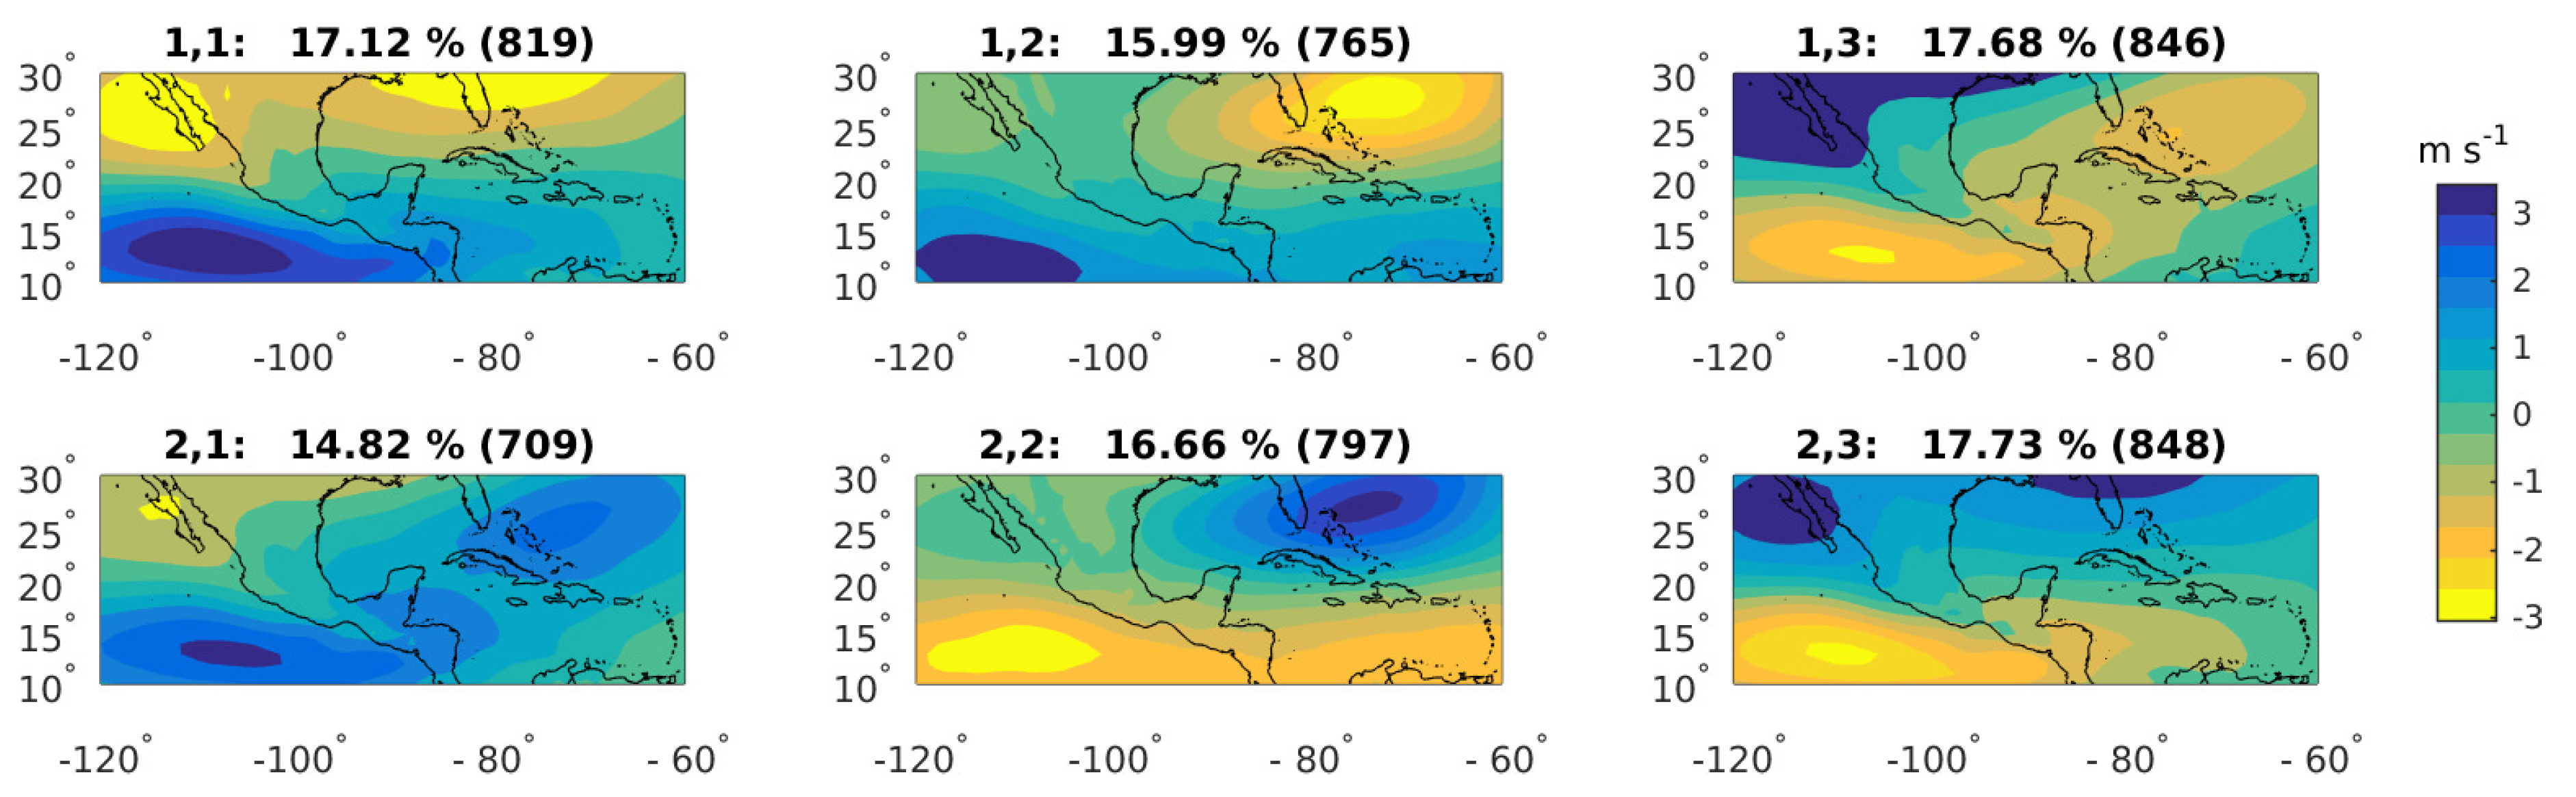
Figure 5.
Same as Figure 2, but for component v of wind at 700 hPa.
Figure 5.
Same as Figure 2, but for component v of wind at 700 hPa.

Figure 6.
Taylor diagrams for root mean squared error versus spatial correlation for all the weather patterns (WPs) and fifth-phase Coupled Model Inter-Comparison Project (CMIP5) models: (a) mslp, (b) q700, (c) u700, and (d) v700. The distance from the origin to a certain point indicates the root mean squared error and the angle from the vertical axis represents the spatial correlation between WPs from models and ERA-Interim.

Figure 7.
Absolute error in the frequency of occurrence (in %) of WPs in models with respect to ERA-Interim: (a) mslp, (b) q700, (c) u700, and (d) v700.
Figure 7.
Absolute error in the frequency of occurrence (in %) of WPs in models with respect to ERA-Interim: (a) mslp, (b) q700, (c) u700, and (d) v700.
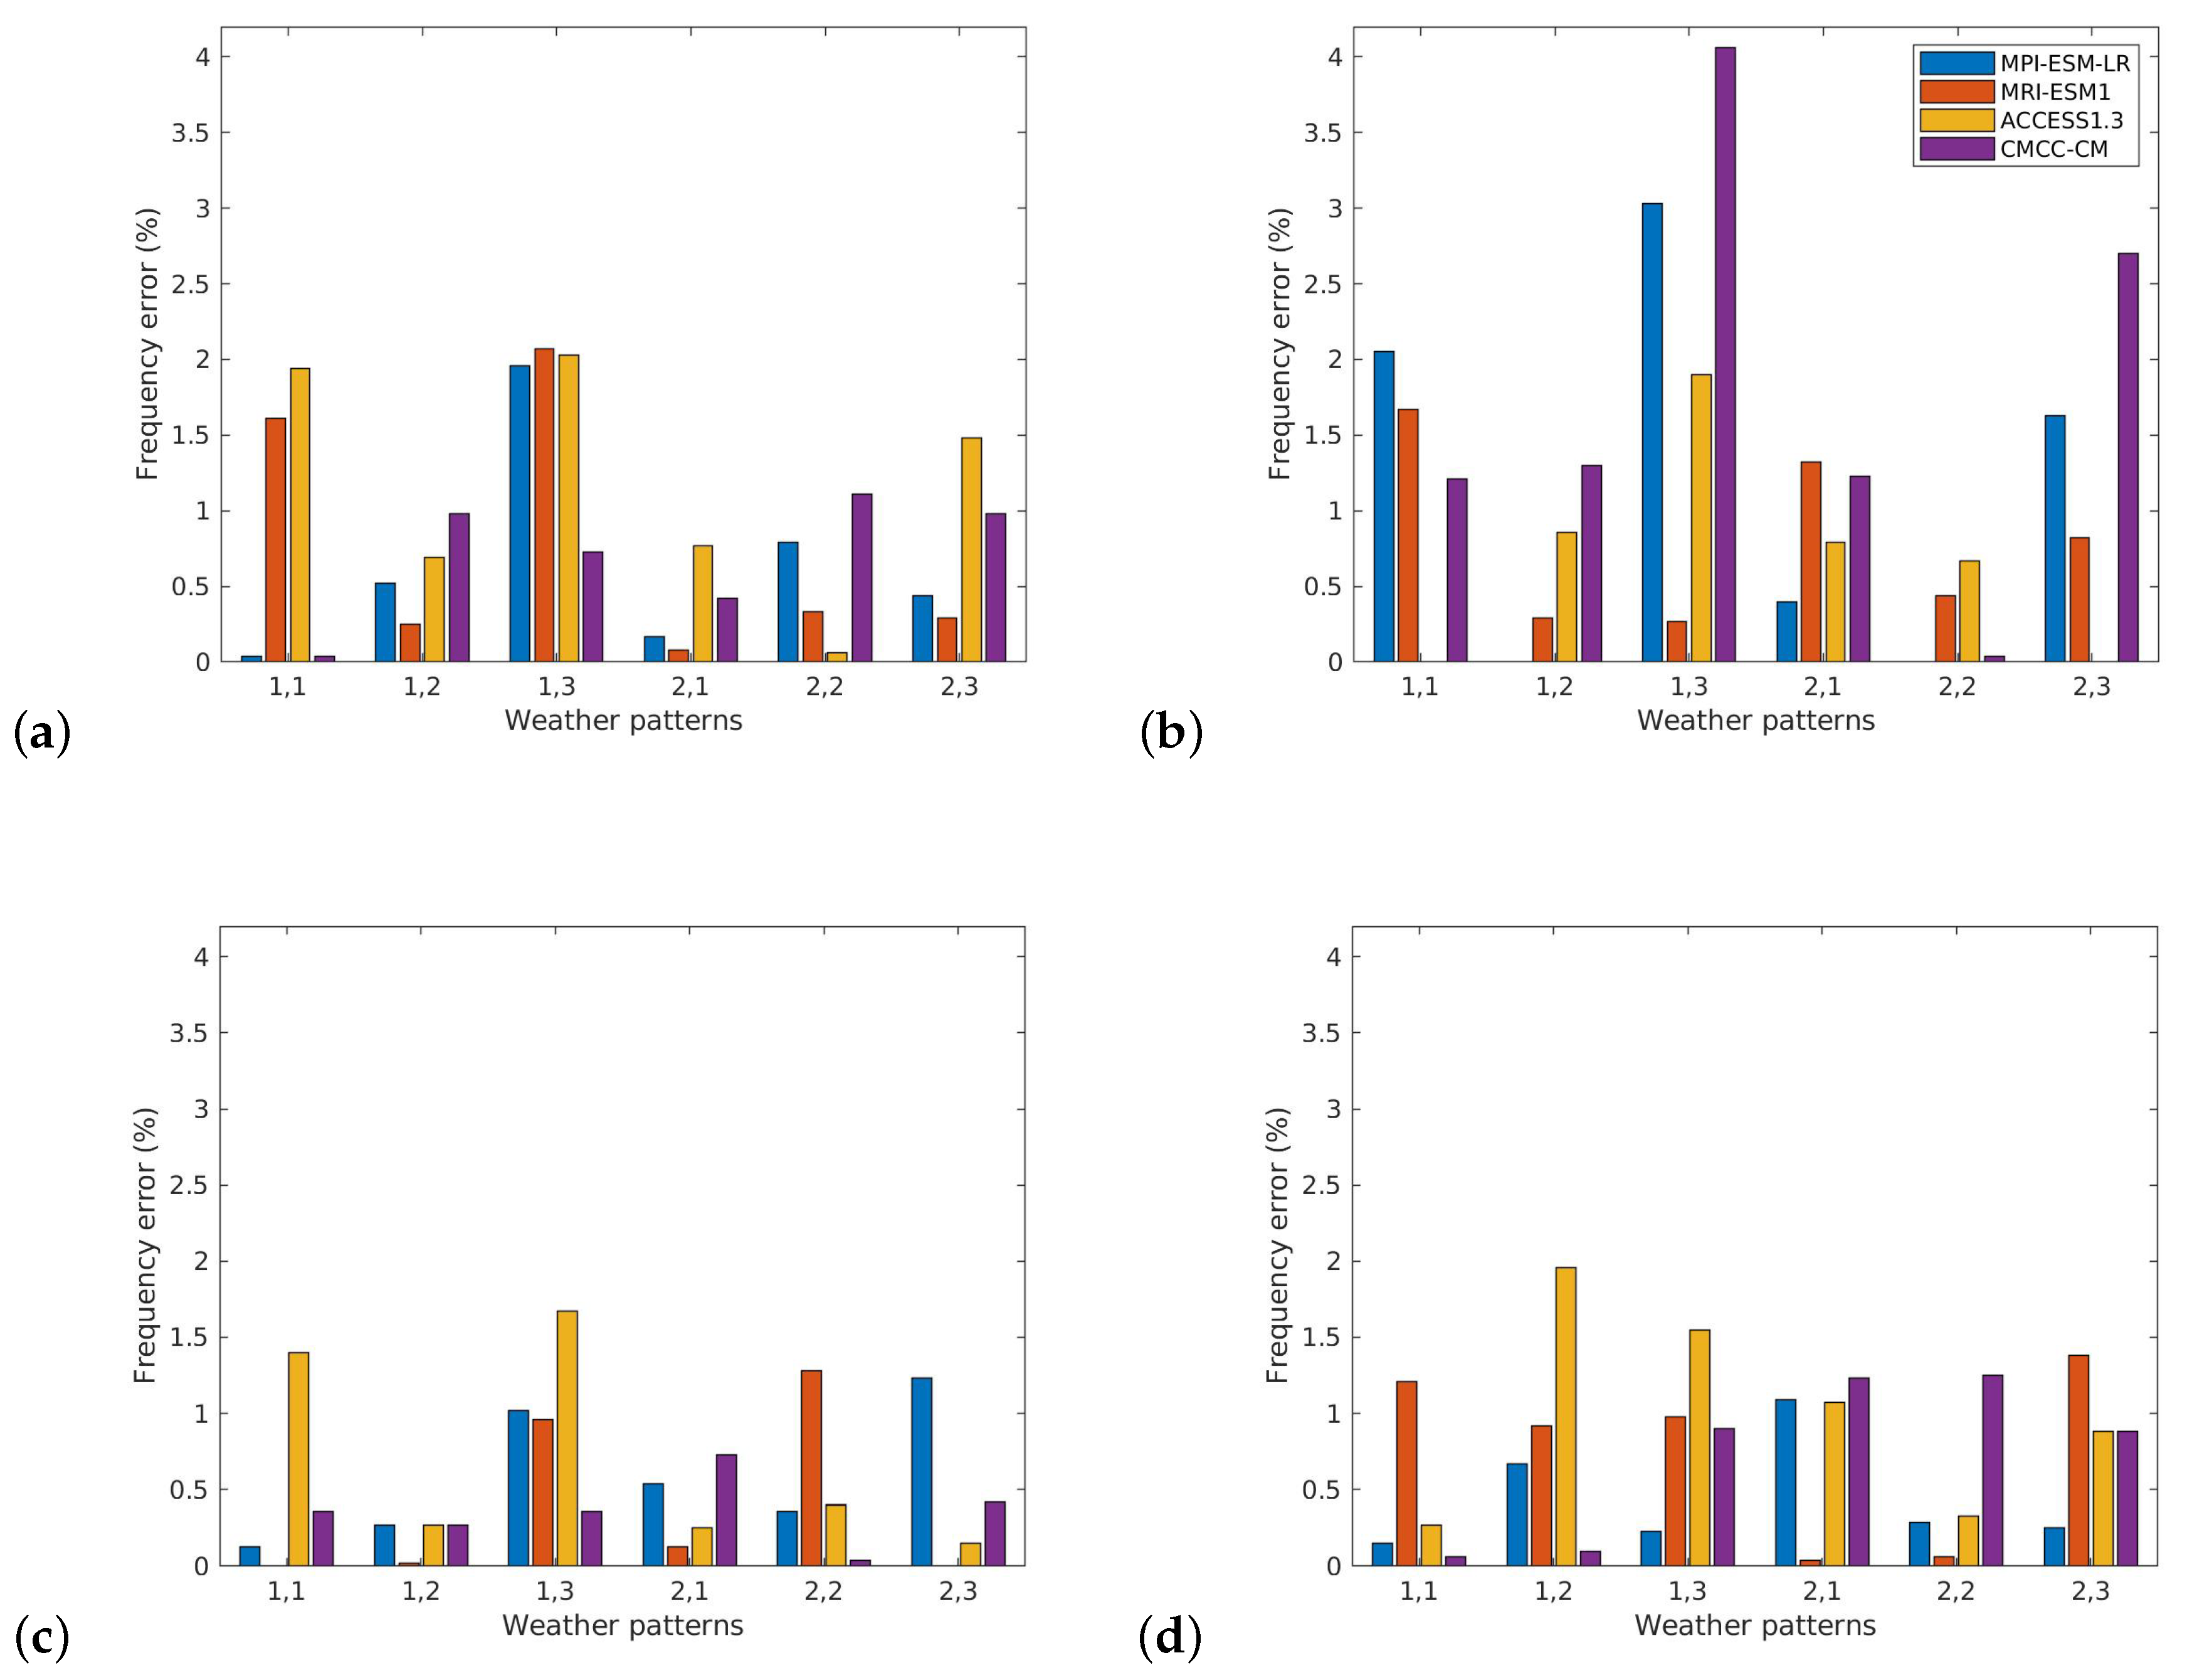
Figure 8.
Typical model error for every variable as a function of the weather patterns.
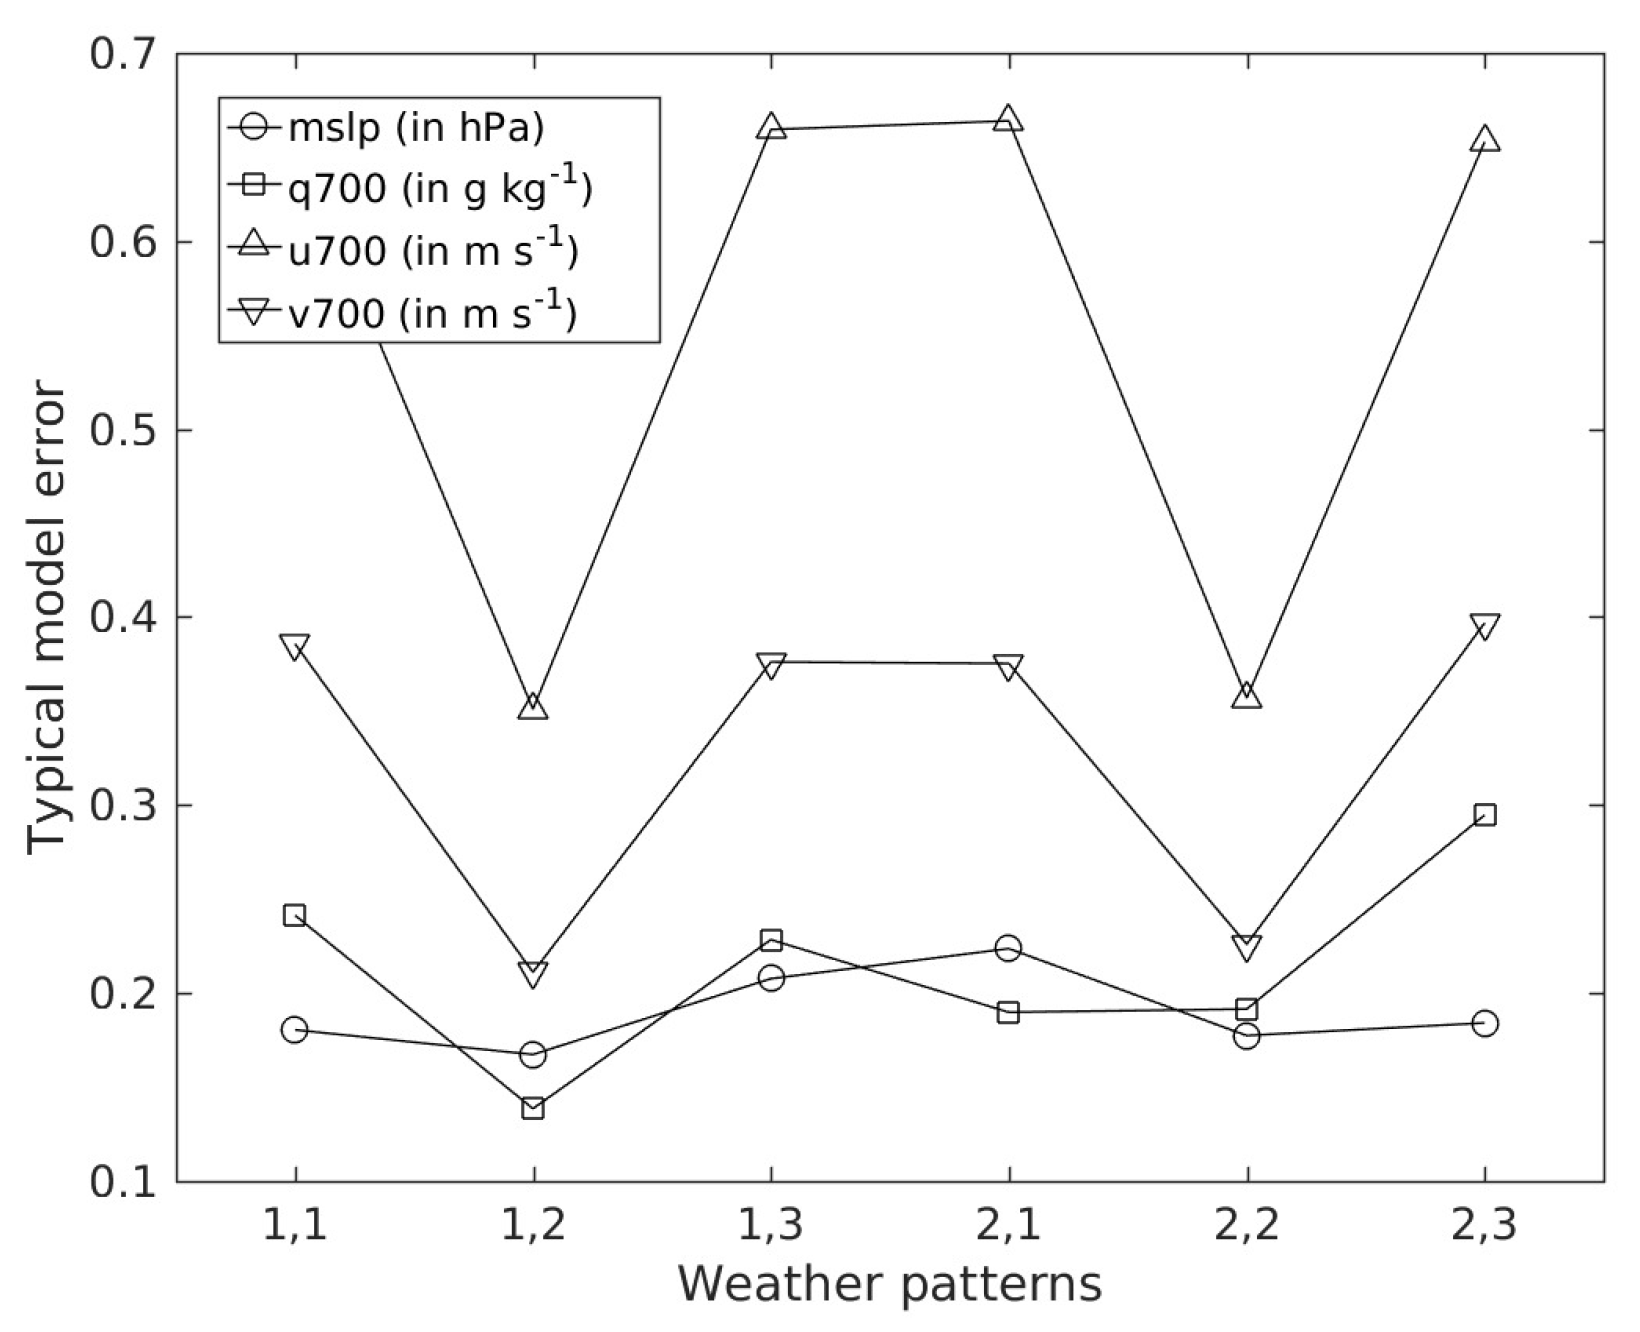
Figure 9.
Relative model performance index as a function of weather patterns for mslp, q700, u700, and v700. Weather regimes that were not captured by models are marked with the “×” symbol, in accordance with the blank spaces in Tables S2 and S3 of Supplementary Materials.
Figure 9.
Relative model performance index as a function of weather patterns for mslp, q700, u700, and v700. Weather regimes that were not captured by models are marked with the “×” symbol, in accordance with the blank spaces in Tables S2 and S3 of Supplementary Materials.
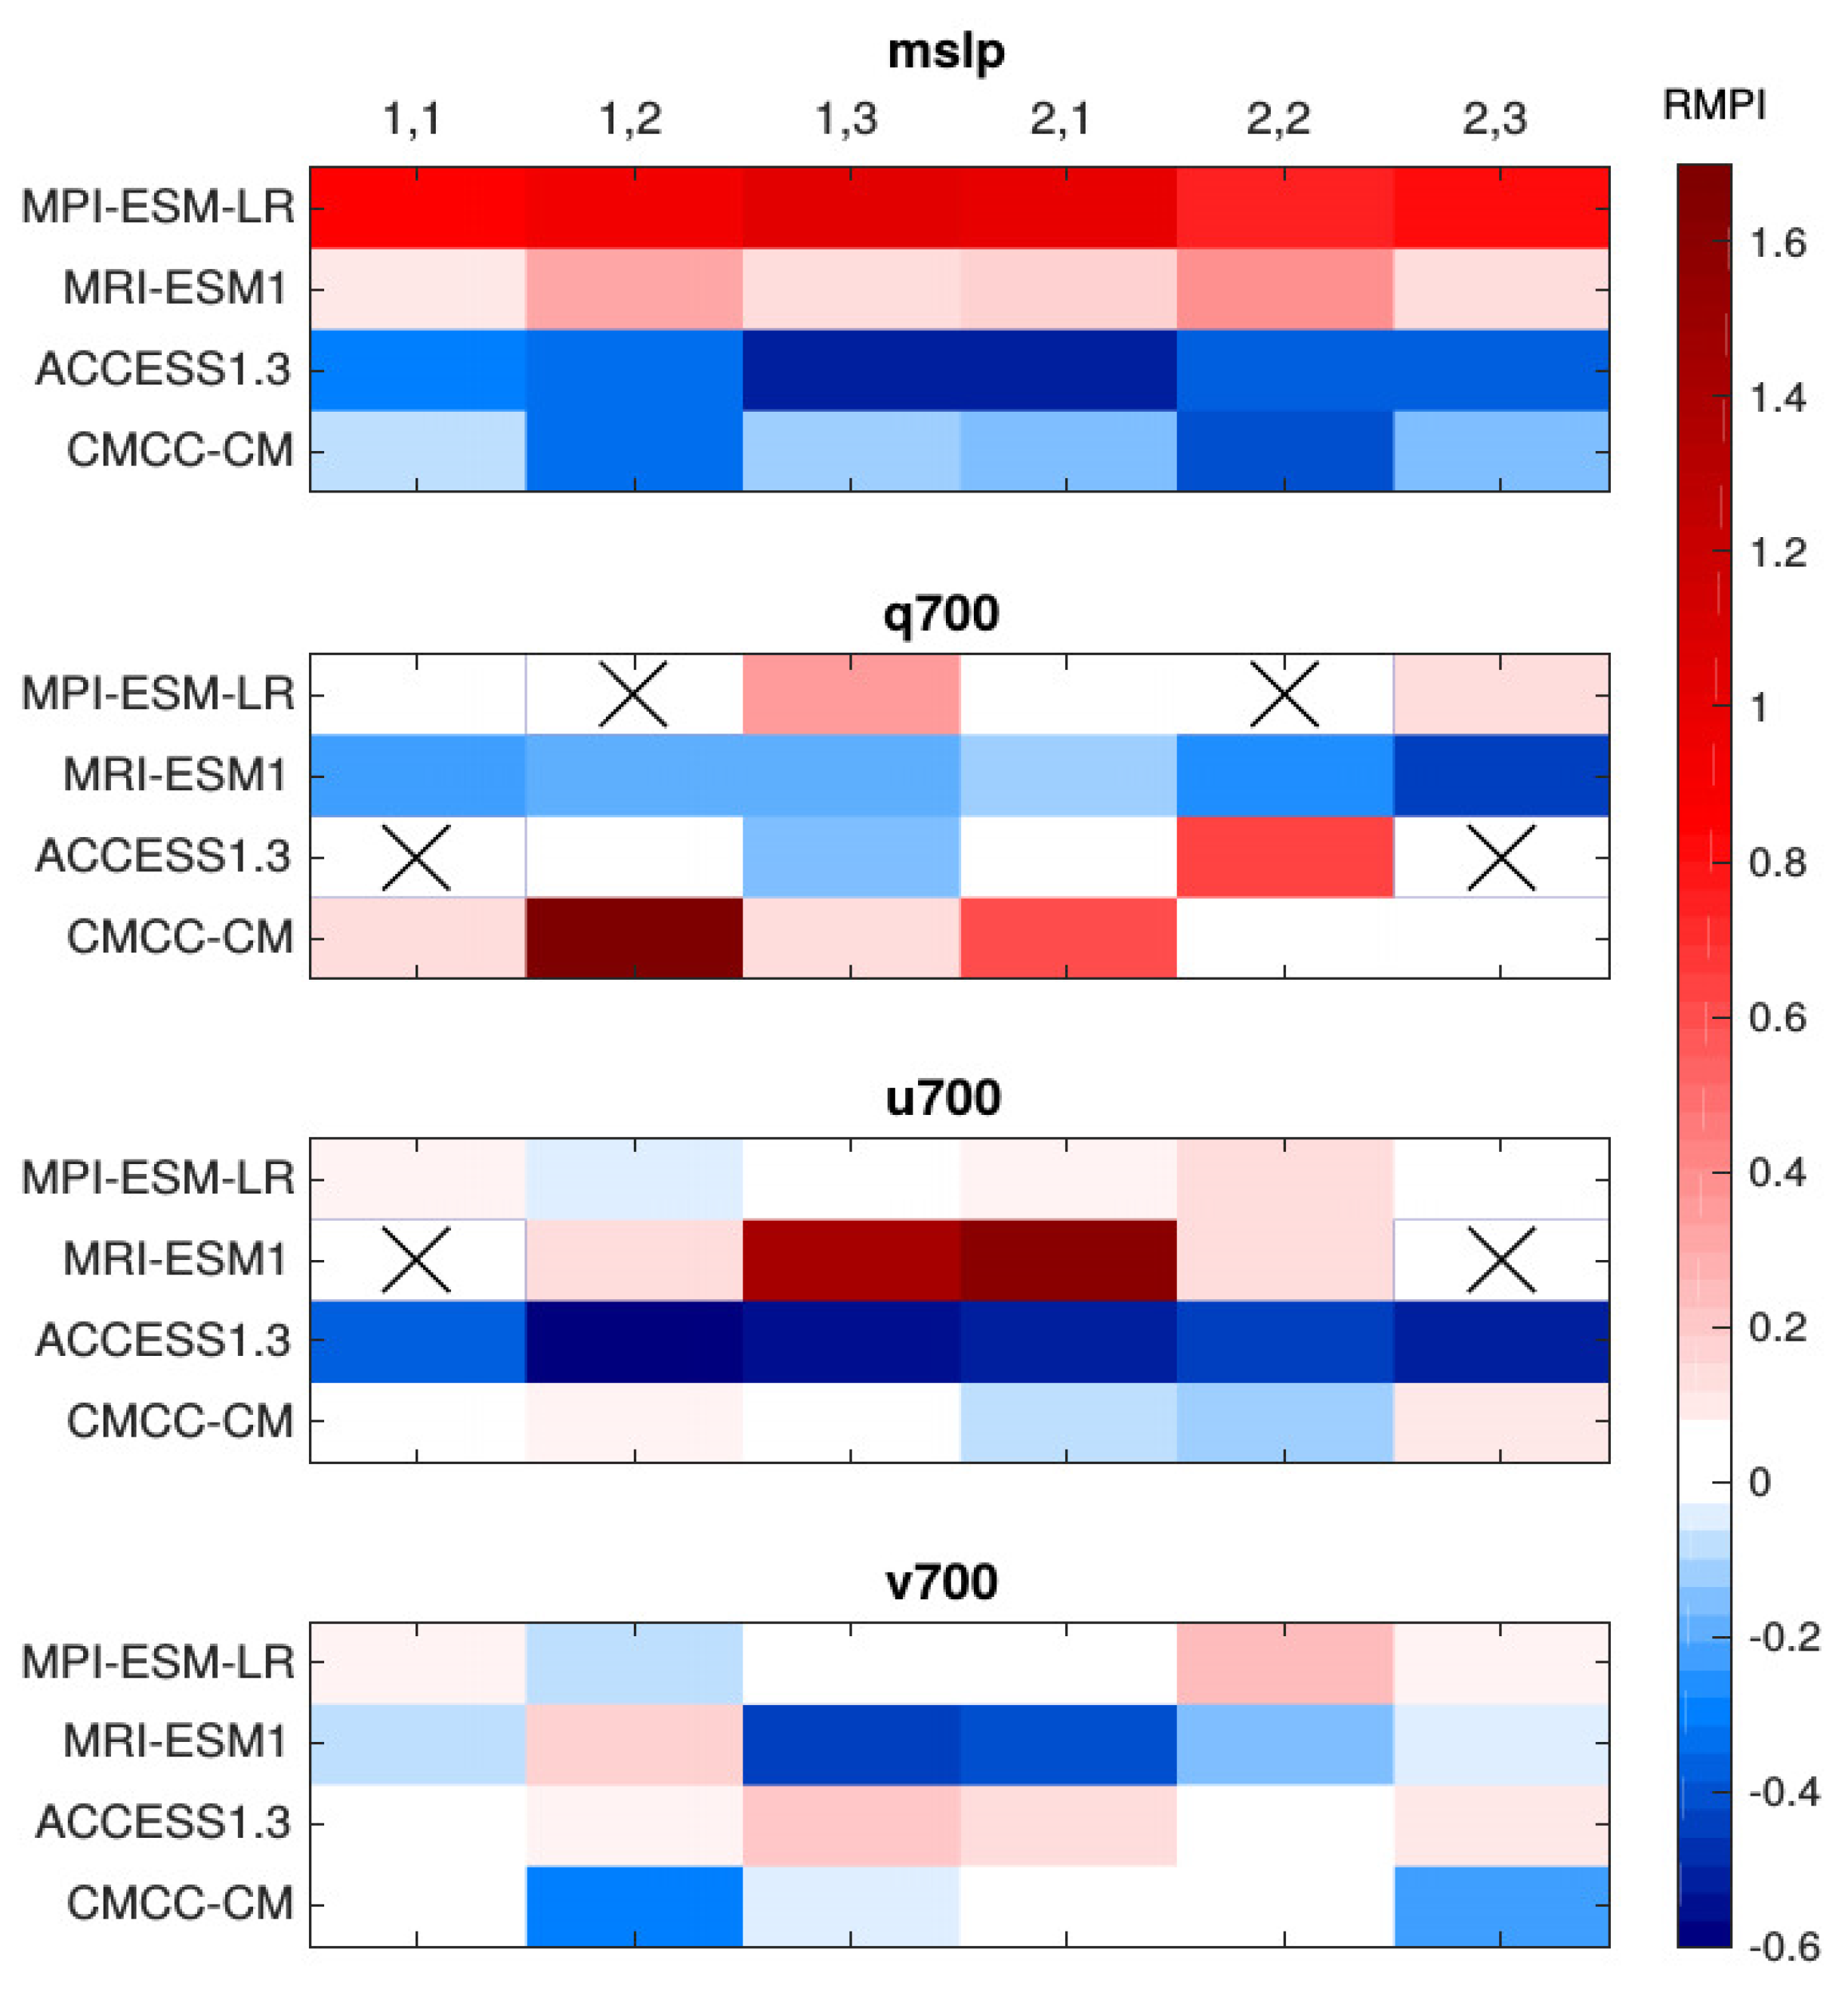
Figure 10.
Spatial variance ratio as an average for the period of study for mslp, q700, u700, and v700. Weather regimes that were not captured by models are marked with the “×” symbol, in accordance with the blank spaces in Tables S2 and S3 of Supplementary Materials.
Figure 10.
Spatial variance ratio as an average for the period of study for mslp, q700, u700, and v700. Weather regimes that were not captured by models are marked with the “×” symbol, in accordance with the blank spaces in Tables S2 and S3 of Supplementary Materials.

Figure 11.
Model variability index as a function of time, computed taking into account all of the WPs and variables.
Figure 11.
Model variability index as a function of time, computed taking into account all of the WPs and variables.

Table 1.
Model acronym, institution, and atmospheric resolution.
| Model | Institution | Spatial Resolution (Lat × Lon) | Temporal Resolution |
|---|---|---|---|
| MPI-ESM-LR | Max Planck Institute for Meteorology | 1.87° × 1.88° | Daily |
| MRI-ESM1 | Meteorological Research Institute | 1.12° × 1.13° | Daily |
| ACCESS1.3 | CSIRO (Commonwealth Scientific and Industrial Research Organization, Australia), and BOM (Bureau of Meteorology, Australia) | 1.25° × 1.88° | Daily |
| CMCC-CM | Centro Euro-Mediterraneo per I Cambiamenti Climatici | 0.75° × 0.75° | Daily |
© 2020 by the authors. Licensee MDPI, Basel, Switzerland. This article is an open access article distributed under the terms and conditions of the Creative Commons Attribution (CC BY) license (http://creativecommons.org/licenses/by/4.0/).
Share and Cite
MDPI and ACS Style
Díaz-Esteban, Y.; Raga, G.B.; Díaz Rodríguez, O.O. A Weather-Pattern-Based Evaluation of the Performance of CMIP5 Models over Mexico. Climate 2020, 8, 5. https://doi.org/10.3390/cli8010005
AMA Style
Díaz-Esteban Y, Raga GB, Díaz Rodríguez OO. A Weather-Pattern-Based Evaluation of the Performance of CMIP5 Models over Mexico. Climate. 2020; 8(1):5. https://doi.org/10.3390/cli8010005
Chicago/Turabian StyleDíaz-Esteban, Yanet, Graciela B. Raga, and Oscar Onoe Díaz Rodríguez. 2020. "A Weather-Pattern-Based Evaluation of the Performance of CMIP5 Models over Mexico" Climate 8, no. 1: 5. https://doi.org/10.3390/cli8010005
Note that from the first issue of 2016, this journal uses article numbers instead of page numbers. See further details here.