Article

Expected Impacts of Mixing European Beech with Silver Fir on Regional Air Quality and Radiation Balance

1
Chair of Tree Physiology, Institute of Forest Sciences, Albert-Ludwigs-Universität, 79110 Freiburg im Breisgau, Germany
2
Department of Forest Ecology and Management, Swedish University of Agricultural Sciences, 90183 Umeå, Sweden
3
Chair of Environmental Meteorology, Albert-Ludwigs-Universität, 79085 Freiburg im Breisgau, Germany
4
Chair of Forestry Economics and Forest Planning, Institute of Forest Sciences, Albert-Ludwigs-Universität, 79106 Freiburg im Breisgau, Germany
5
Institute of Meteorology and Climate Research—Atmospheric Environmental Research (IMK-IFU), Karlsruhe Institute of Technology (KIT), Kreuzeckbahnstr. 19, 82467 Garmisch-Partenkirchen, Germany
*
Author to whom correspondence should be addressed.
Current Address: Ministerium für Umwelt, Energie, Ernährung und Forsten (MUEEF) Rheinland-Pfalz, 55116 Mainz, Germany.
Current Address: Regierungspräsidium Freiburg, Abteilung Umwelt, 79114 Freiburg, Germany.
Climate 2020, 8(10), 105; https://doi.org/10.3390/cli8100105
Submission received: 26 August 2020 / Revised: 24 September 2020 / Accepted: 24 September 2020 / Published: 26 September 2020

Abstract

:
The anticipated climate change during the next decades is posing crucial challenges to ecosystems. In order to decrease the vulnerability of forests, introducing tree species’ mixtures are a viable strategy, with deep-rooting native Silver fir (Abies alba) being a primary candidate for admixture into current pure stands of European beech (Fagus sylvatica) especially in mountainous areas. Such a change in forest structure also has effects on the regional scale, which, however, have been seldomly quantified. Therefore, we measured and modeled radiative balance and air chemistry impacts of admixing Silver fir to European beech stands, including changes in biogenic volatile organic compound emissions. An increased fraction of Silver fir caused a smaller albedo and a (simulated) larger evapotranspiration, leading to a dryer and warmer forest. While isoprene emission was negligible for both species, sesquiterpene and monoterpene emissions were larger for fir than for beech. From these differences, we derived that ozone concentration as well as secondary organic aerosols and cloud condensation nuclei would increase regionally. Overall, we demonstrated that even a relatively mild scenario of tree species change will alter the energy balance and air quality in a way that could potentially influence the climate on a landscape scale.

Graphical Abstract

1. Introduction

Climate change will have multiple impacts on temperate forests’ monospecific stands, which will be particularly vulnerable [1,2,3]. Therefore, forest management aims to increase the proportion of mixed forests in order to improve the resilience of future forests [4,5]. Based on this expectation, it is essential to investigate various stand structures and species compositions, and to evaluate their growth performance and susceptibility to future stressors [2,6,7,8]. Changes in forest structure and species composition, however, interact with the regional environment and affect the radiation budget, water balance through cloud condensation nuclei [9], and air quality through deposition of pollutants and emission of compounds [10]. While these feedbacks are known to be crucial on the regional to global scale [11,12,13], and the processes are often derived from studies at the local scale, the impacts that can be expected also on subregional scales due to altered species composition are not well investigated.
Introducing Silver fir (Abies alba Mill.) into European beech (Fagus sylvatica L.) stands has been proposed as a promising strategy to increase resilience of forests in Central Europe [14]. Silver fir, indicated as fir in the following, is less sensitive to spring drought events [15] and is generally expected to thrive under a warmer climate with somewhat less precipitation [16]. Thus, it can be expected that more wood growth and thus more carbon sequestration will be possible with than without implementing increased fir abundance, with beneficial impacts on general greenhouse gas balance. In addition, fir admixture may well increase the soil organic carbon content relative to pure beech forests, further increasing the long-term sequestration of the greenhouse gas CO2 [17]. On the other hand, an increase in the fraction of fir relative to European beech, indicated as beech in the following, may lead to impacts on air chemistry and the subregional climate (see Figure 1 for illustration), for example, due to the different albedos of deciduous and evergreen species. Also, annual evapotranspiration has been estimated to be slightly higher, resulting from deep rooting as well as a high interception [18,19]. A major impact on air chemistry may also result from changes in the emission of biogenic volatile organic compounds (BVOCs) such as isoprene (ISO), mono- (MT), and sesquiterpenes (SQT) since beech and fir have different emission patterns regarding MT and SQT [20,21]. While it has been demonstrated to be absent in beech e.g., [22], it is still a debated question for fir [21,23]. In addition, emission patterns may respond differently to stress [24,25]. While terpenes tend to increase aerosol formation and thus the abundance of cloud condensation nuclei, ISO emission generally favors the formation of ozone and may reduce aerosol mass yield and cloud condensation nuclei from terpenes [26,27,28].
In the present work, we studied the influence of intermixing fir into pure beech forests on radiation balances and resulting changes in air temperatures, evaporation, and emission regime. The investigation was based on several years of research at a number of monitoring plots in the Black Forest, Southwestern Germany, where Silver fir constitutes an autochthonous tree species. Furthermore, we aimed to evaluate the secondary effects of ozone and aerosol formation and discuss the feedbacks on the radiation budget, air quality, and vegetation, e.g., due to potentially dangerous ozone levels. While decisions on tree species’ selections have previously been based on growth, productivity, and susceptibility to disturbances [14,29,30], this study supports additional considerations of regional climatic feedback.

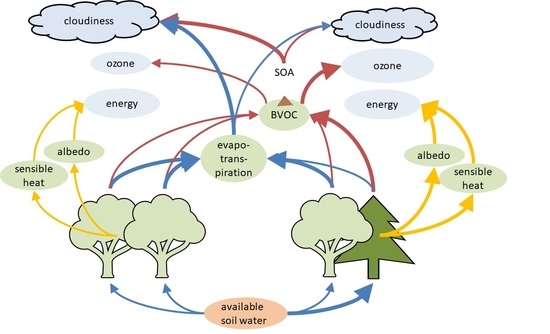
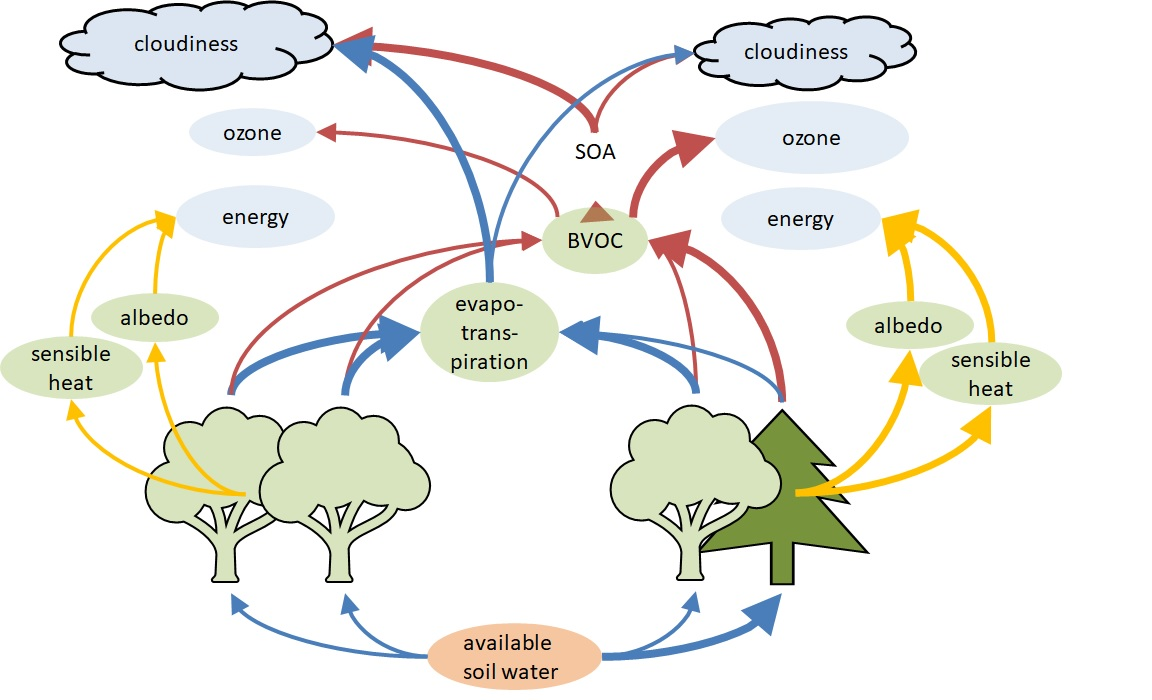
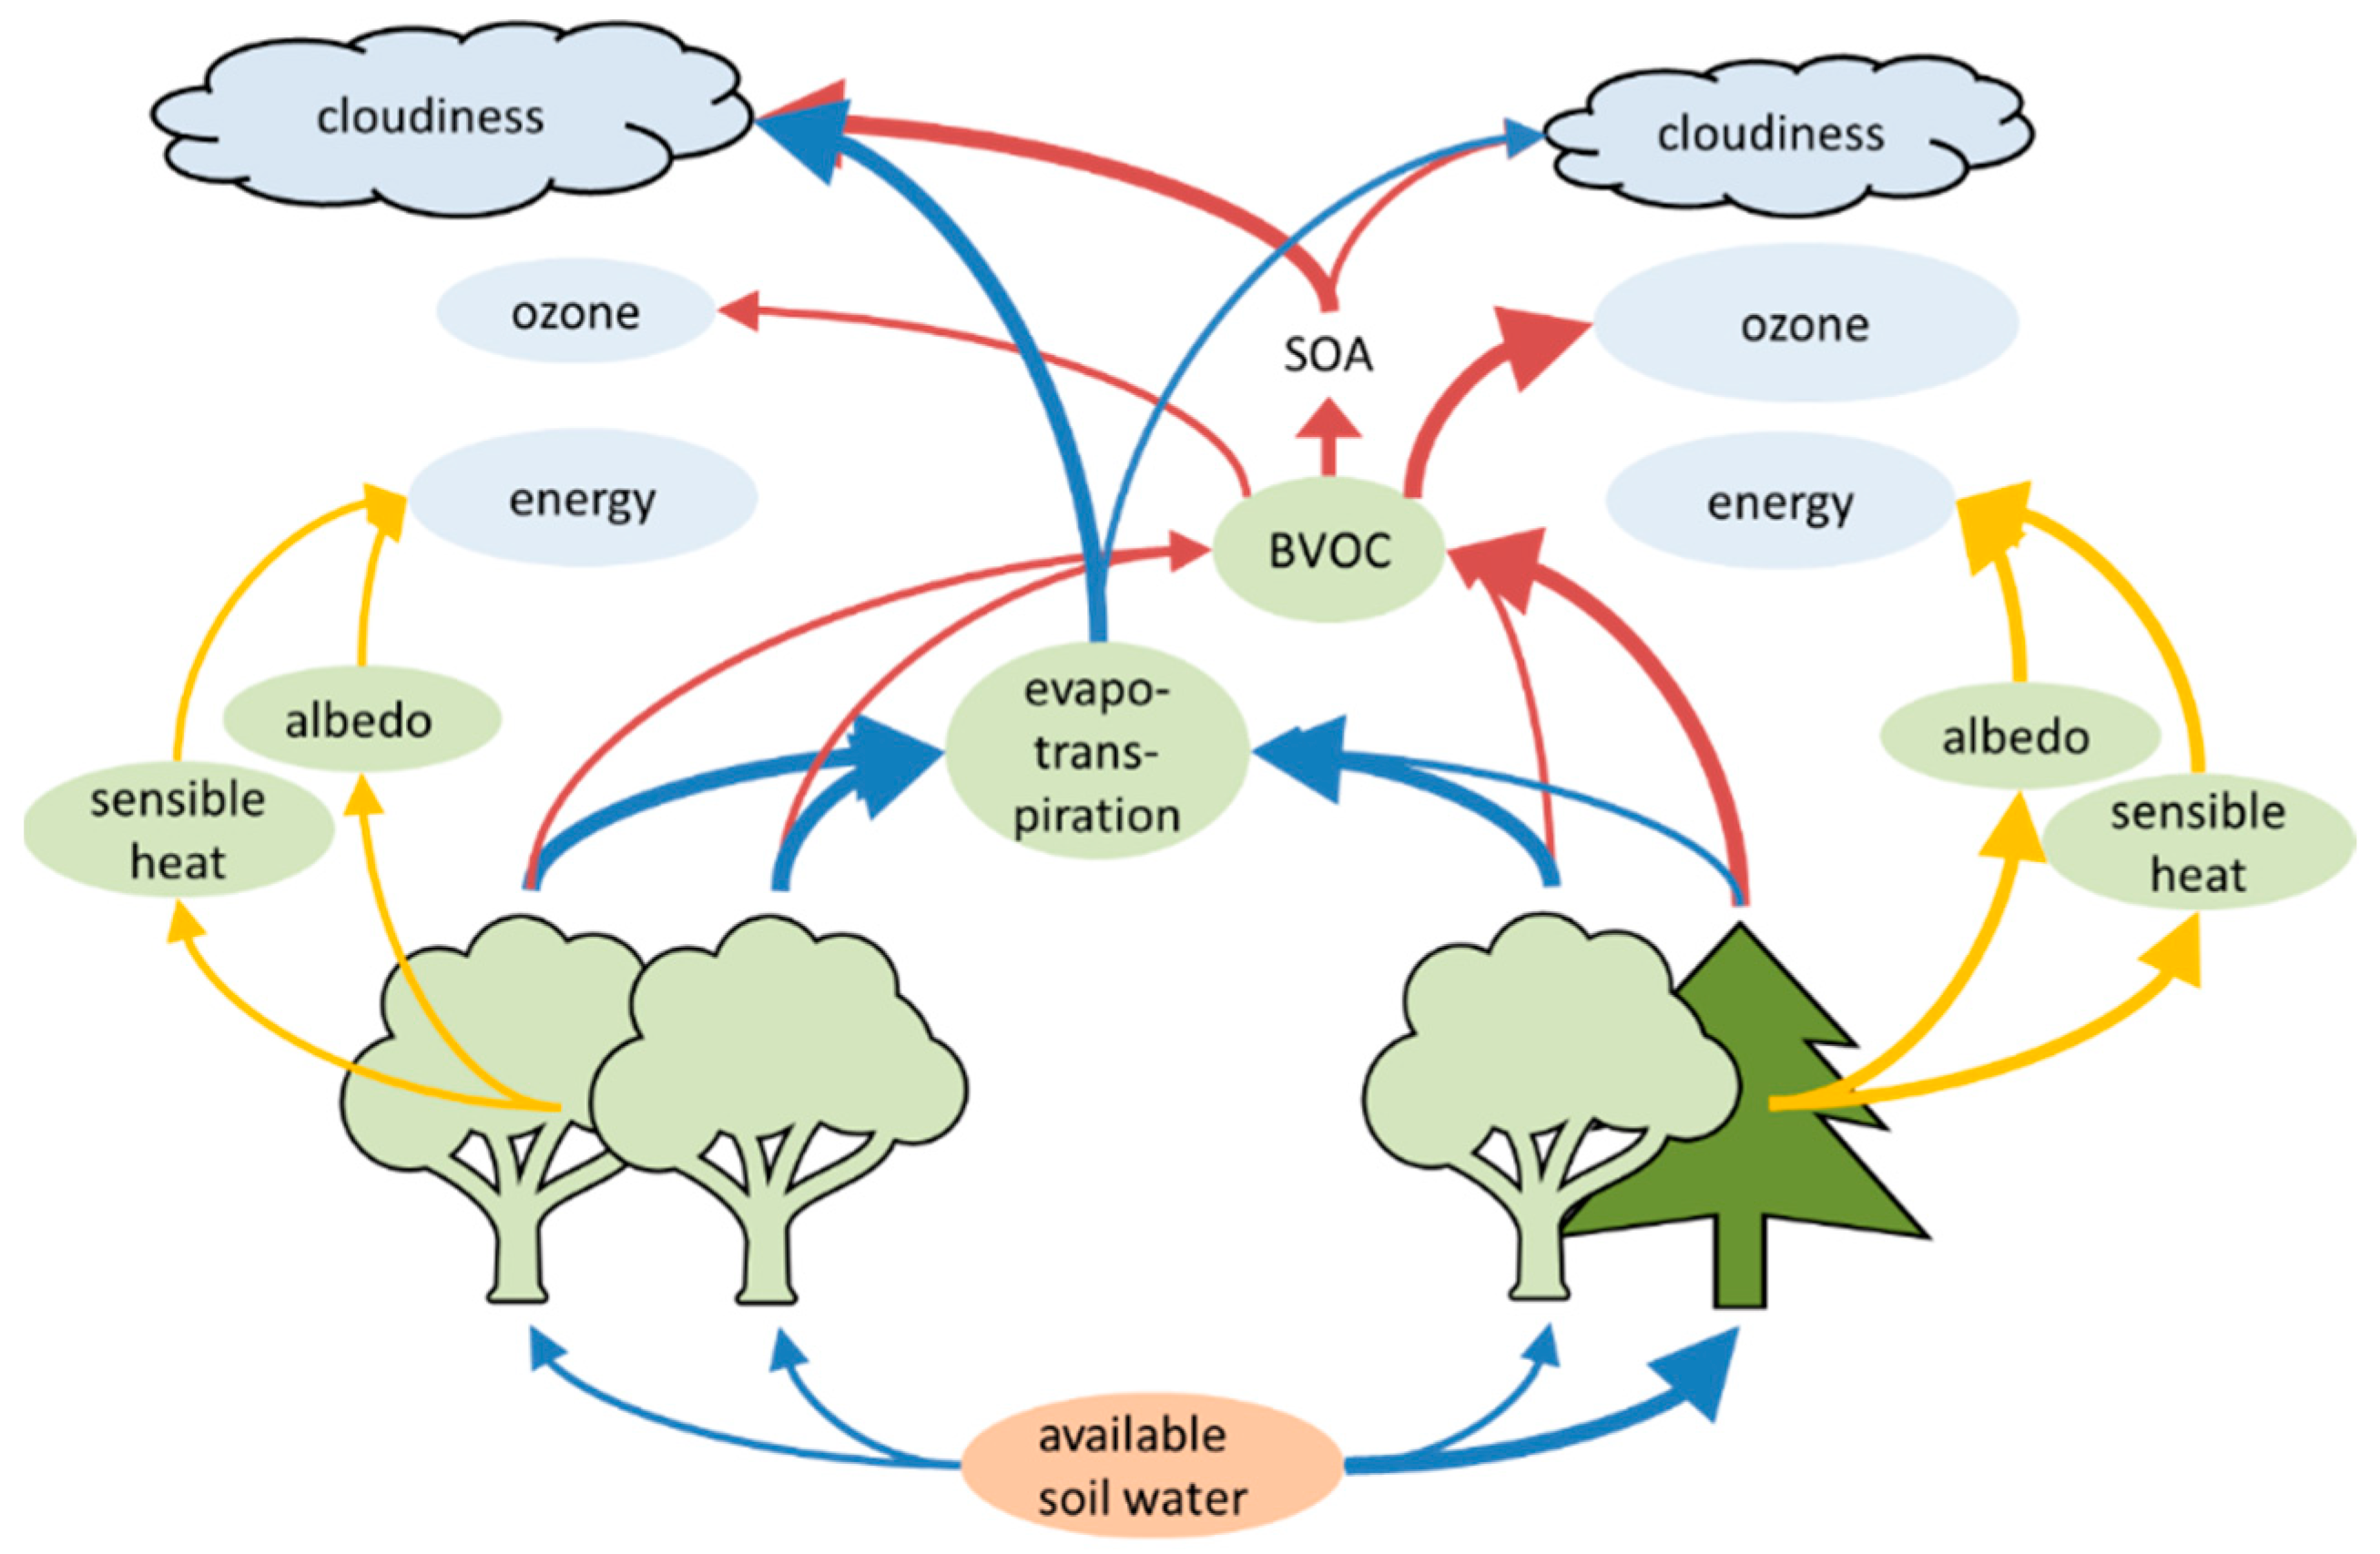
2. Materials and Methods

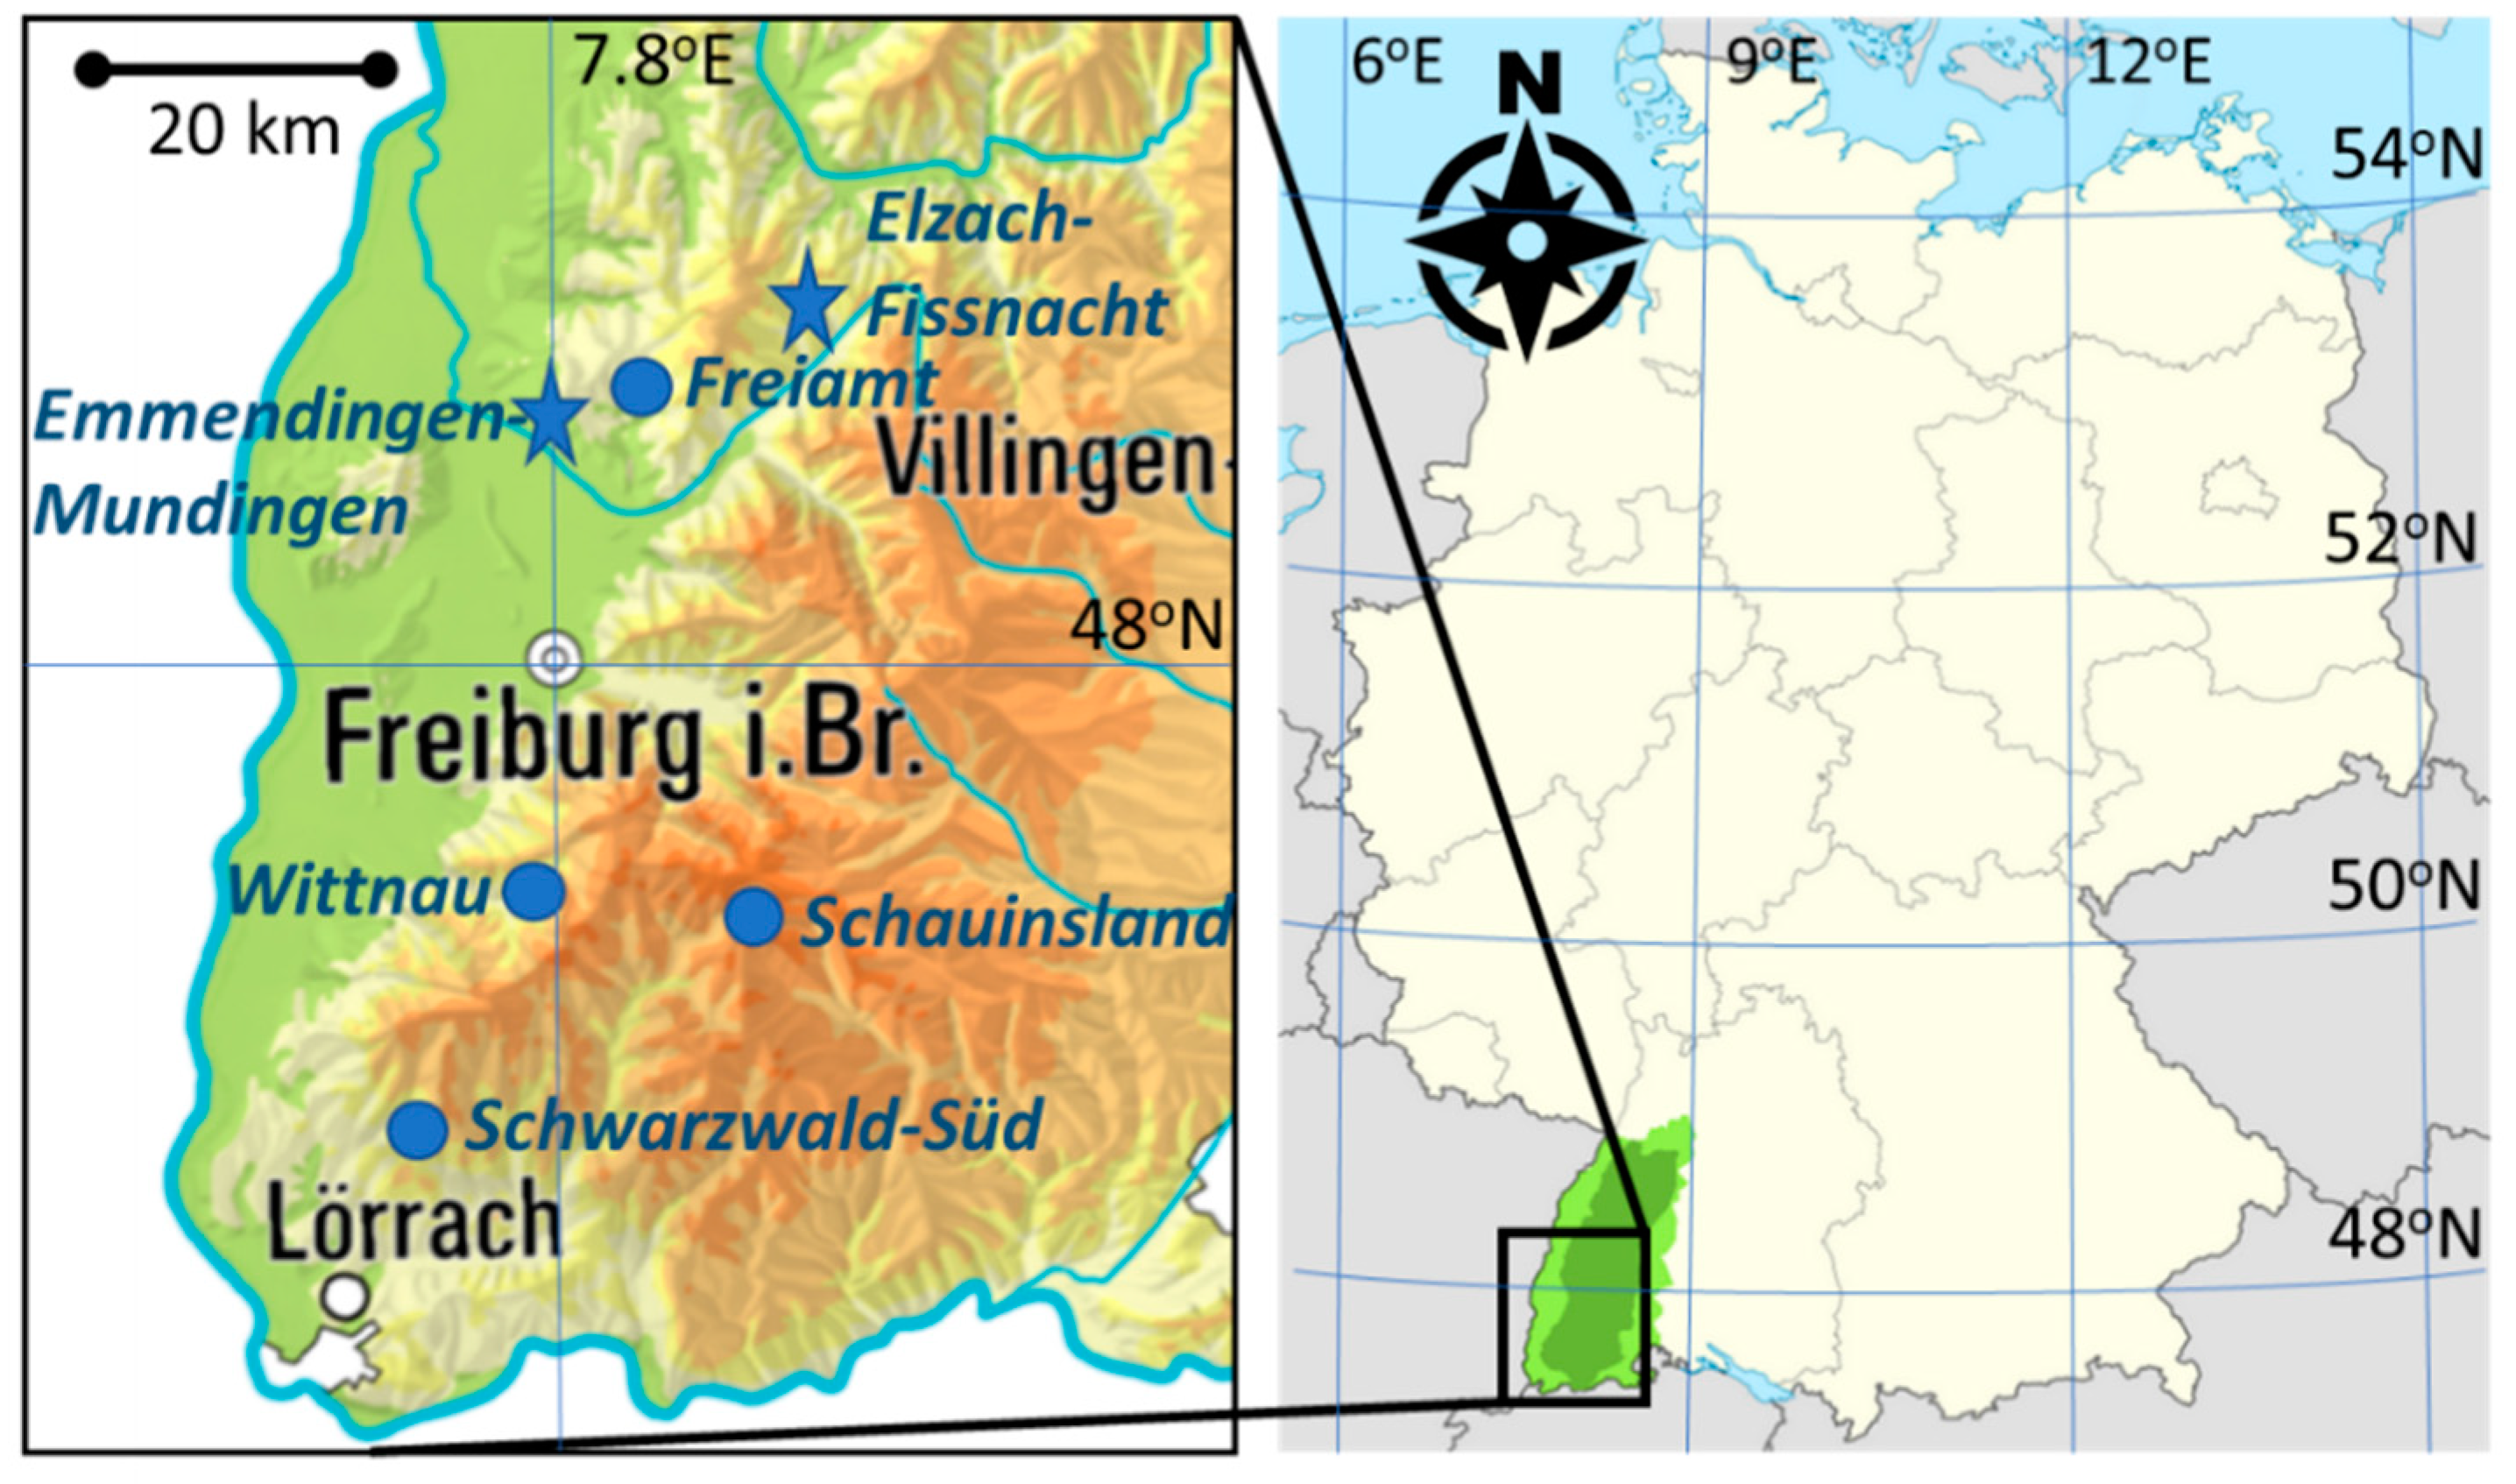
2.1. Investigated Area

The investigations were carried out in the Black Forest, which is situated in the Federal State of Baden-Württemberg, Southwestern Germany (Figure 2, right). The Black Forest holds various tree species with Norway spruce (Picea abies L.) being the most abundant and beech and fir contributing considerable fractions (Table 1). Experimental field studies (sap flow and exchange of trace gases’ measurements) were carried out at Freiamt (48.15° N, 7.91° E, ca. 400 m above sea level (a.s.l.)). Two different plots within this area were chosen to investigate the impact of fir admixture as possible future stand composition [14,19,30]: One is a monospecific beech forest (BB), the second is a forest in which beech and fir contribute approximately equal to total basal trunk area (BF). A more detailed description of both sites is provided in Table 2. Surface albedo of fir was determined at a rather pure fir stand at Wittnau (47.93° N, 7.84° E, ca. 650 m a.s.l.).
Mean annual air temperature and total annual amount of precipitation are 9.6 ± 6.5 °C and 1100 ± 554 mm (1984–2014, station 1440, Freiamt-Ottoschwanden, German Weather Service), respectively. The soil has a sandy loam structure that originates from a red sandstone and was classified as a Dystric Cambisol (according to the Food and Agriculture Organization of the United Nations (FAO) Soil Unit Classification [31]) with sandy loam texture [17]. A climate station for long-term observations set up by MeteoGroup (Berlin, Germany) in 2015 is situated at 440 m a.s.l., about 700 m north of the site at a cleared area. It supplied basic meteorological data in 20-min time resolution. Annual mean global radiation amounted to 135 ± 13 W m−2, mean annual air temperature to 10.8 ± 0.8 °C, and total annual mean precipitation to 1010 ± 17 mm yr−1 (2016: 997 mm yr−1, 2017: 1022 mm yr−1). For occasional gap filling and quality check, three nearby German Weather Service sites were used (Freiburg, Emmendingen-Mundingen, and Elzach-Fisnacht, https://www.dwd.de/DE/klimaumwelt/cdc/cdc_node.html). Additional information on air pollutants, particularly concentrations of O3 and nitrogen oxides (NOx), were obtained from the State Institute of the regional Baden-Württemberg office for Environment (LUBW) at the station Schwarzwald-Süd (47.81° N, 7.76° E, 905 m a.s.l.). Additionally, aerosol particle characteristics were obtained from the German Ultrafine Aerosol Network GUAN, [32]]) station at Schauinsland (47.91°N, 7.91°E, 1205 m a.s.l.) (for all station locations see Figure 2, left).

2.2. Radiation Budget Overview
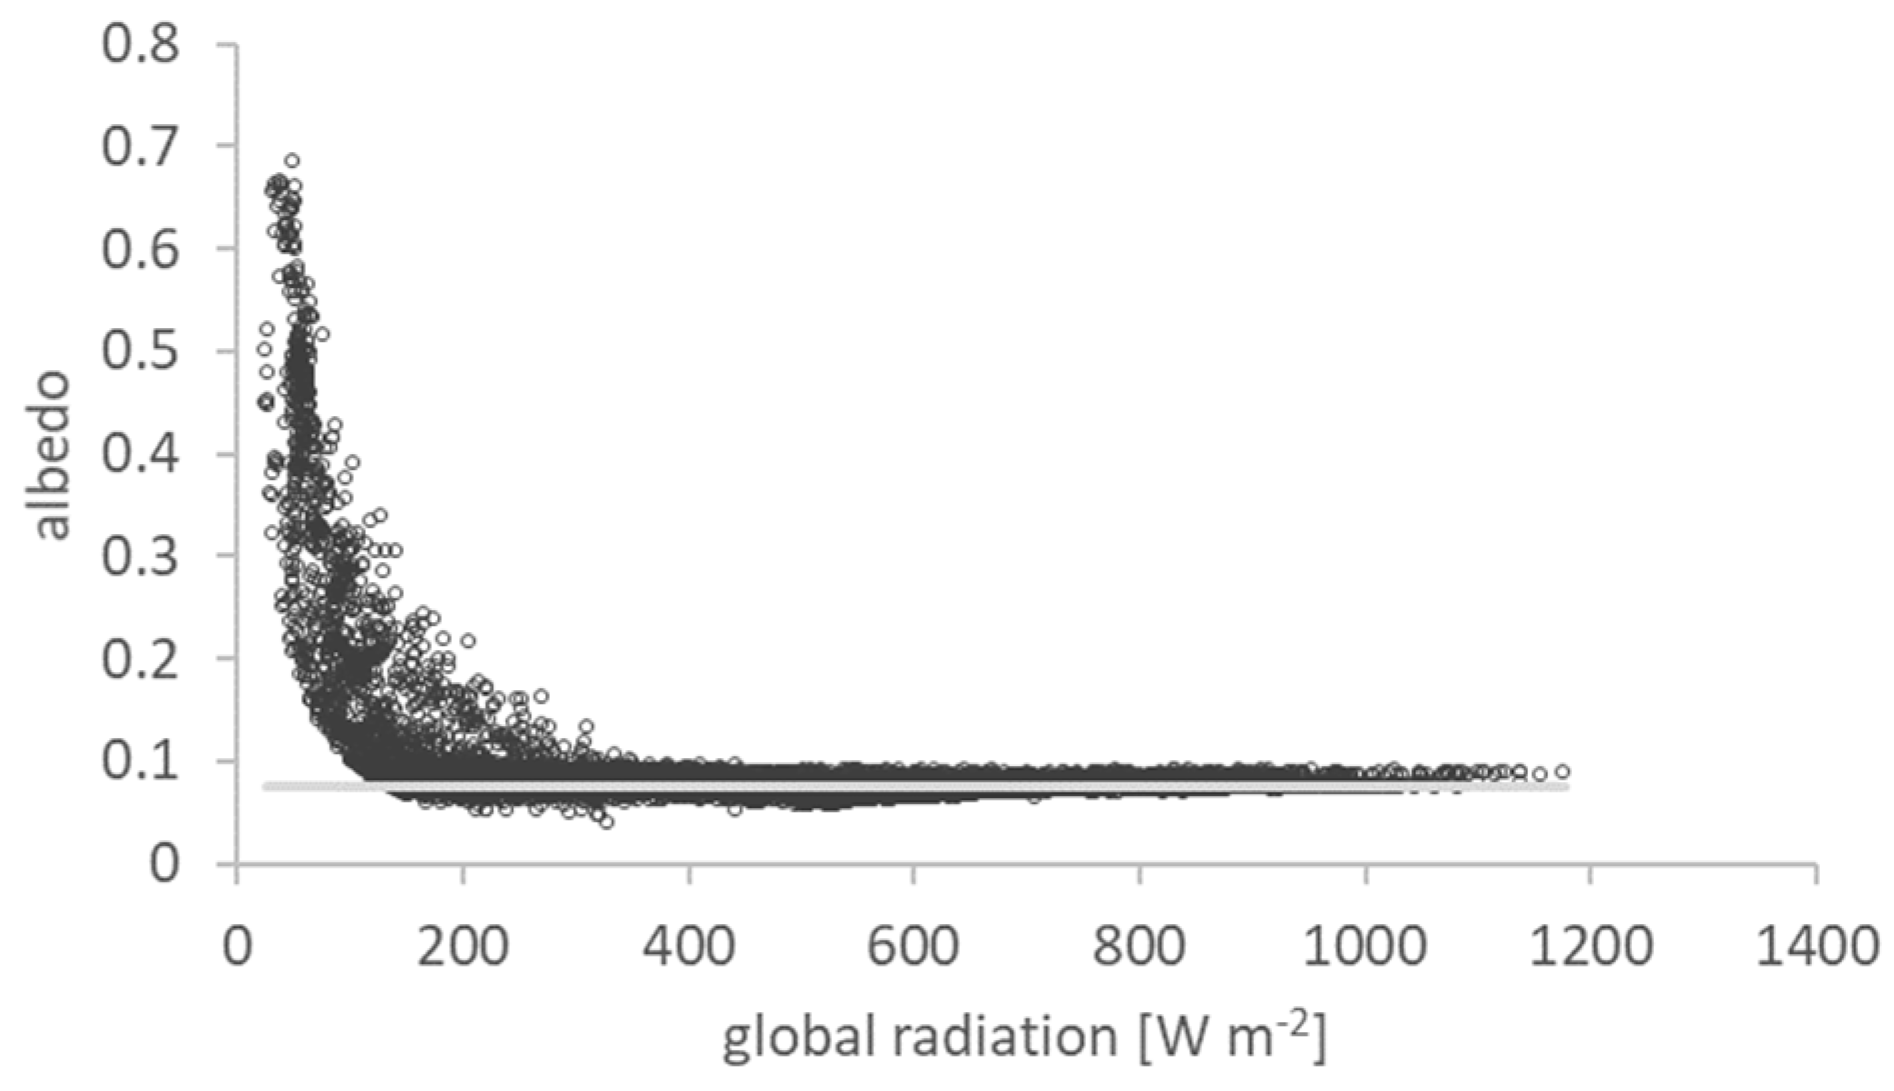
The radiation budget at the top of the forest was calculated based on the following considerations: Subsequent to atmospheric interactions, a fraction of solar radiation reaches the Earth’s surface as global radiation (Fglobal), part of which is reflected (albedo α), while the rest (1 − α) is absorbed. The energy absorbed is converted into latent heat (FET, phase transfer of water), sensible heat (FH), and into changes of the heat storage within the vegetation (dHveg) and the soil (dHsoil). Only a small amount of Fglobal (<2% of net radiation budget) is directly used by photosynthesis [35], which was neglected henceforth. Therefore, the radiation budget on the local scale can be written as:
F g l o b a l · ( 1 α ) = F H + F E T + d H s o i l + d H v e g
At the regional scale, the input of energy is better described by differentiating direct global radiation (Fglobal_d) and the energy that originates from longwave downward radiation (Fatmos) that has been absorbed and re-emitted by greenhouse gases, clouds, and aerosol particles in the atmosphere.
F g l o b a l _ d · ( 1 α ) + F a t m o s = F H + F E T + d H s o i l + d H v e g
With
F a t m o s = ( 1 + 0.26 · N ) · ( 1 ( 1 + ω ) · exp ( ( 1.2 + 3 · ω ) 0.5 ) ) · σ · T a 4
considering the humidity correction factor ω according to Prata [36]
ω = 46.5 · v p T a
with vp being water vapor pressure (hectopascal), Ta ambient temperature (K), and σ the Stefan–Boltzmann constant (5.67·× 10−8 W m−2 K−4). N is the cloudiness-covered fractions from zero to eight.
With Fglobal_d defined, the terms albedo α, latent heat FET, heat storage change (dHveg, dHsoil), and sensible heat (FH) need to be calculated in dependence on vegetation properties and, thus, on species’ composition. In order to solve the radiation budget, we newly measured α for firs and used literature data regarding beeches (Section 2.3). Although heat storage change can be regarded as negligible in the long term, it has been calculated to consider changes in seasonality based on directly measured differences in soil temperature and biomass storage (Section 2.4). FET is determined from mechanistic models that were evaluated with sap-flow measurements (Section 2.5). In addition, the effect of species’ composition change on Fatmos was estimated, considering the change in cloud properties and ozone concentration that can be expected with different BVOC emissions (Section 2.6). Therefore, the sensible heat flux FH can be calculated iteratively, rearranging Equation (2):
F H = F g l o b a l _ d · ( 1 α ) + F a t m o s F E T d H
As FH is directly related to canopy surface temperature, a change in radiation flux can be transferred to a change in local temperature.
Δ T s = ( Δ F H , m i x ε · σ ) 1 4 ( Δ F H , b e e c h ε · σ ) 1 4
with the emissivity ε assumed to be specific for deciduous trees (0.975) and conifers (0.99) [37]

2.3. Albedo

Surface albedo α of fir was derived from measurements of global radiation (Fglobal) and reflected shortwave radiation (Freflect) using a component net radiometer (CNR4, Kippen & Zonen B.V., Delft, The Netherlands). The instrument was positioned at a forest plot in the vicinity of Wittnau (see Figure 2), which represented a closed canopy of pure firs that were about 30 years old and 14 m in height. The site had a negligible slope and was homogeneous across several hundred square meters, sufficient to avoid interferences by other species. We installed a mobile tower at the site with a platform approximately 1 m above the top of the stand. Radiation measurements were carried out between 28 July and 16 August 2017 with a time resolution of 60 s. Reflected radiation values smaller than 2 W m−2 (global radiation of less than about 20–40 W m−2) were discarded from further analysis because of twilight conditions, which resulted in unrealistic α values. Albedo of beech was taken from literature (see Table 1).

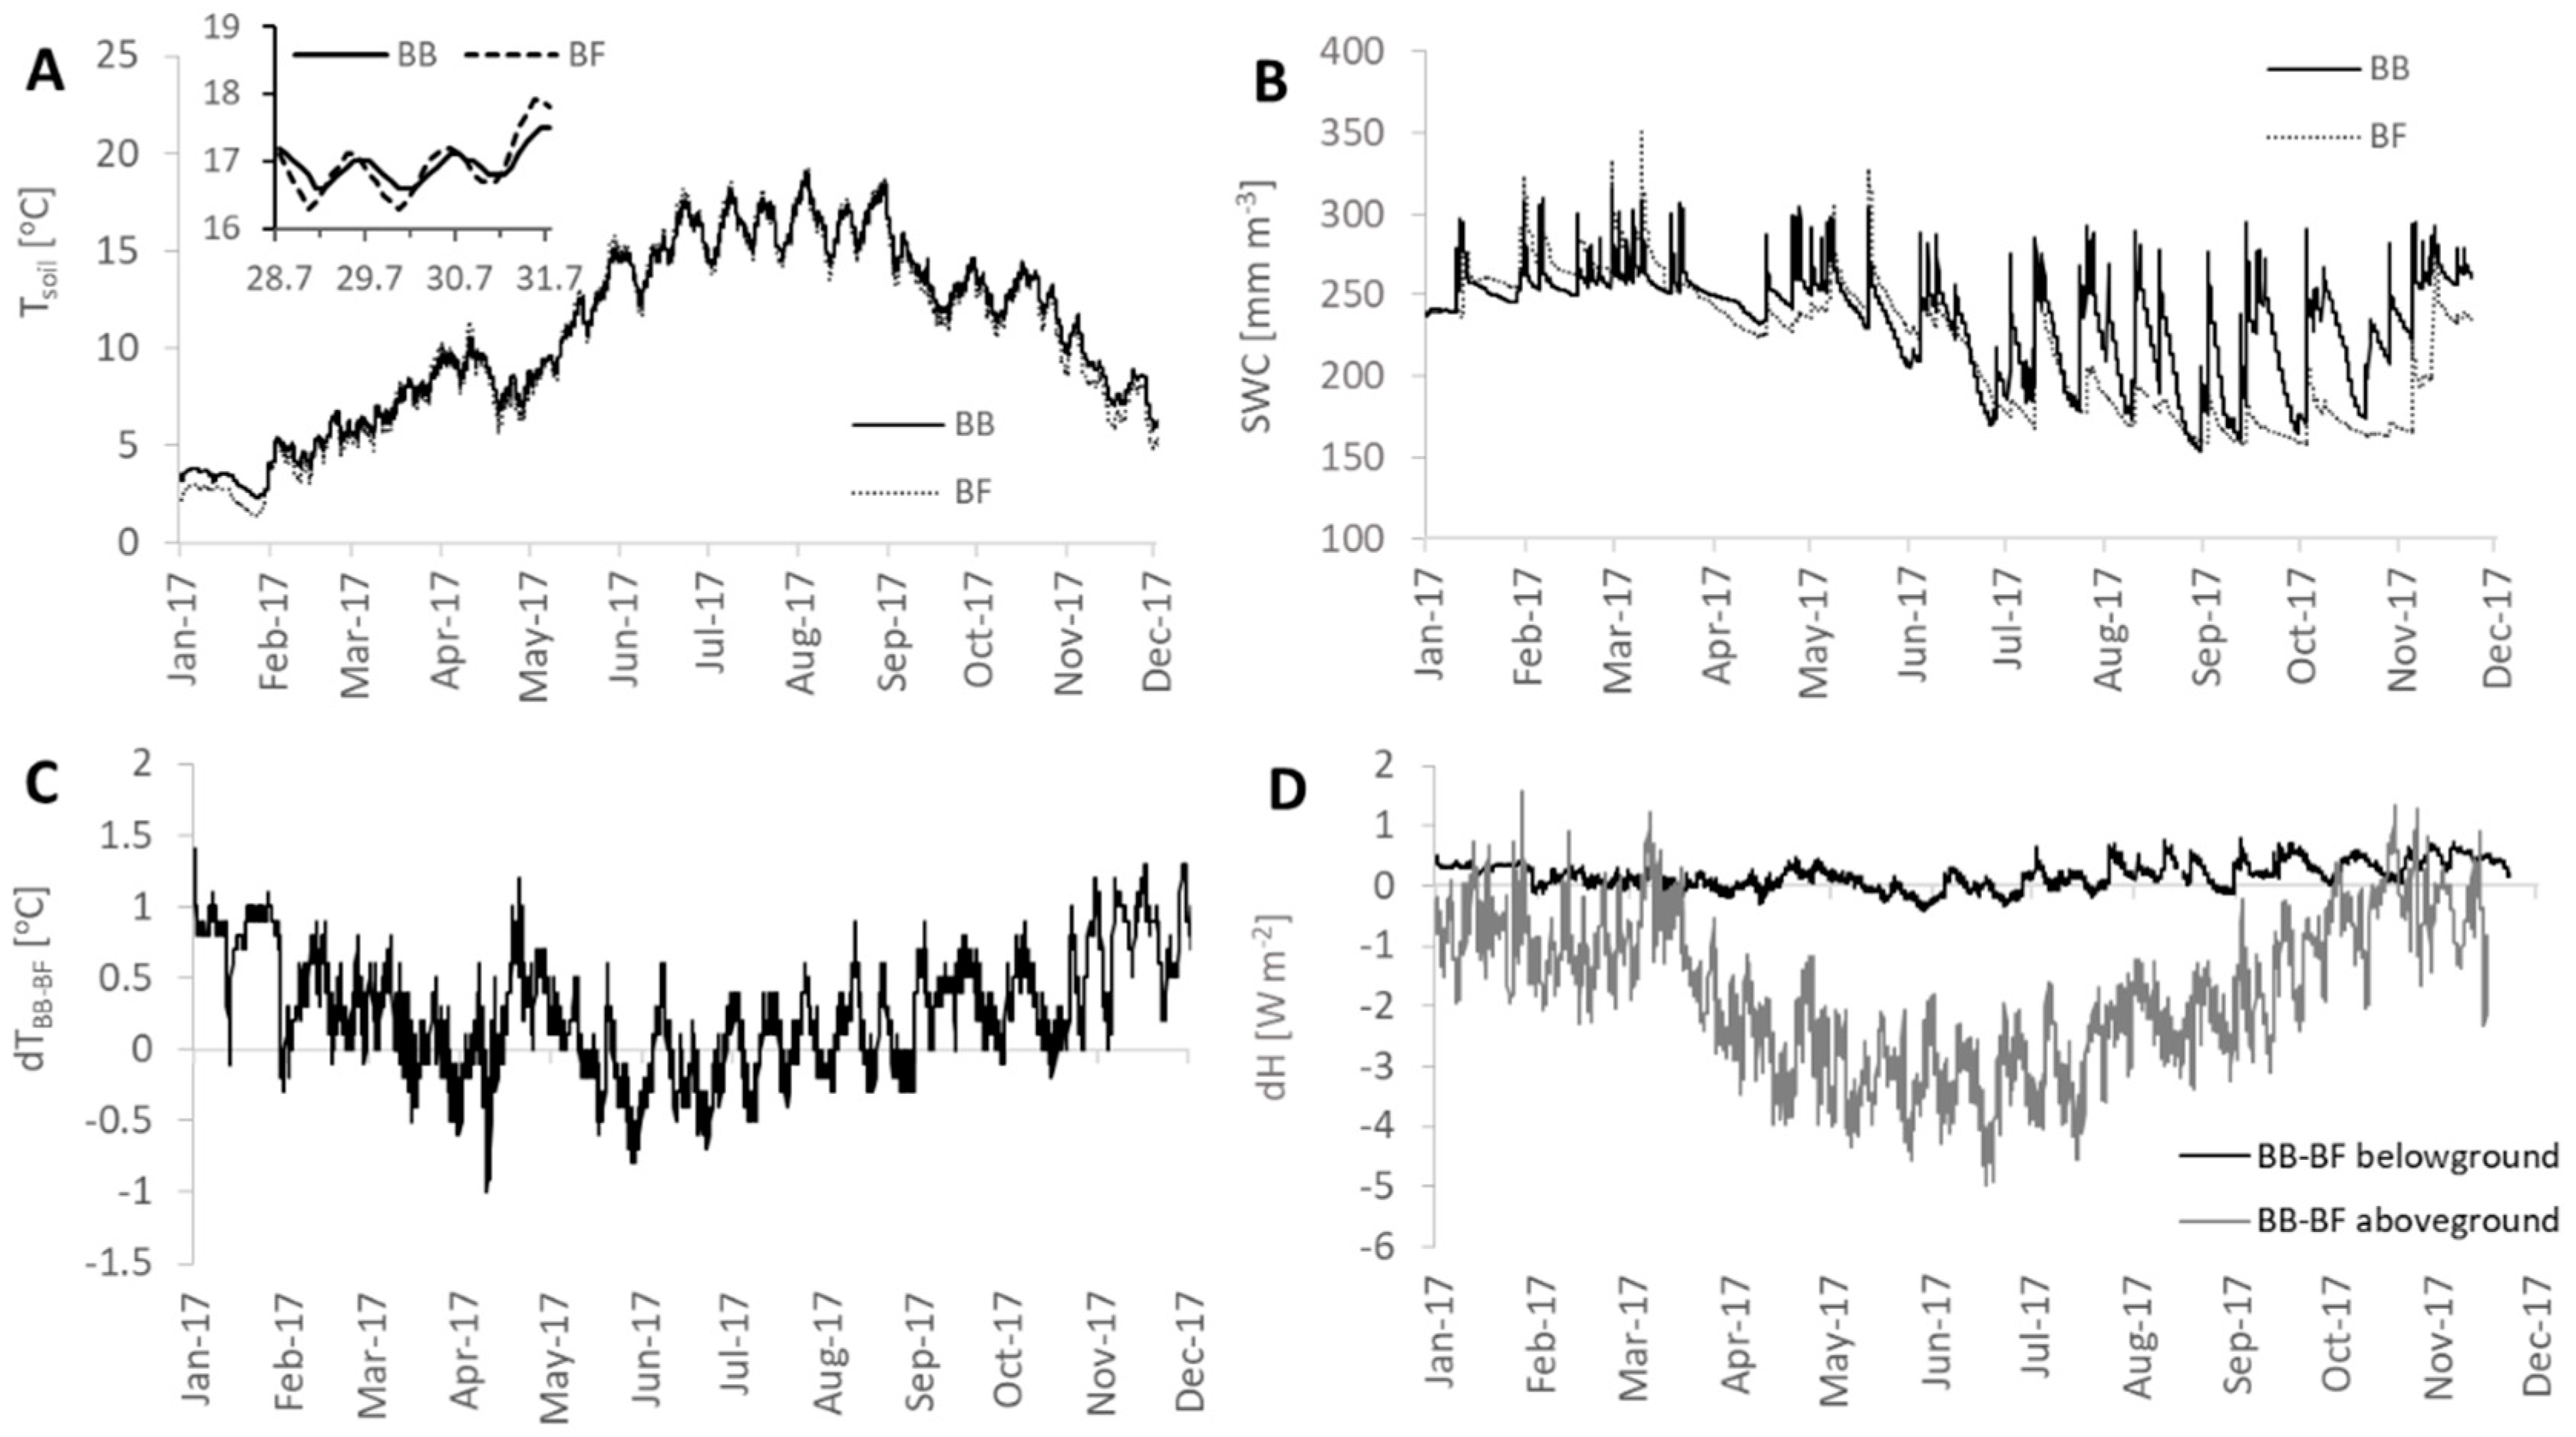
2.4. Soil Temperature and Heat Storage Terms

Measurements of soil temperature and volumetric water content were carried out in 10, 15, 25, 50, and 80 cm depth at two-hour intervals starting in March 2016 until the end of November 2017 (applying Decagon 5TM VWC sensors). We used two sets of sensors that were implemented at the pure beech (BB) plot and two that were installed in the mixed plot in equal distance to beech and fir (BF). In addition, soil texture and other properties were analyzed from nine profiles throughout 1 m depth from which an average soil density of 1300 kg m−3 and a heat storage capacity of 2040 J kg−1 K−1 at water content at field capacity was determined (with no significant differences between plots). Water content was considered as affecting heat capacity and used along with the temperature differences to calculate heat storage changes throughout the year down to 1 m depth. For further information, also see Magh et al. [18]
In order to calculate aboveground heat storage, biomass of both stand types was estimated based on tree density and dimension measured at the test sites (see Table 2). Since the share of foliage biomass is highly variable during the season but usually less than 2%, aboveground biomass was assumed to be equal to woody biomass, and specific heat capacity was assumed as 2858 J K−1 kg−1 for beech and 3546 J K−1 kg−1 for fir (derived from the specific heat of water (4186 J K−1 kg−1), dry wood for both species (2021 and 2720 J K−1 kg−1, https://www.schweizer-fn.de/stoff/wkapazitaet/wkapazitaet_baustoff_erde.php, visited at 18 August 2020), and the assumption that average moisture content of woody biomass was 63 and 129%, for beech and fir, respectively [38]. Finally, the heat storage change was calculated considering local air temperature measurements after Thom [39].

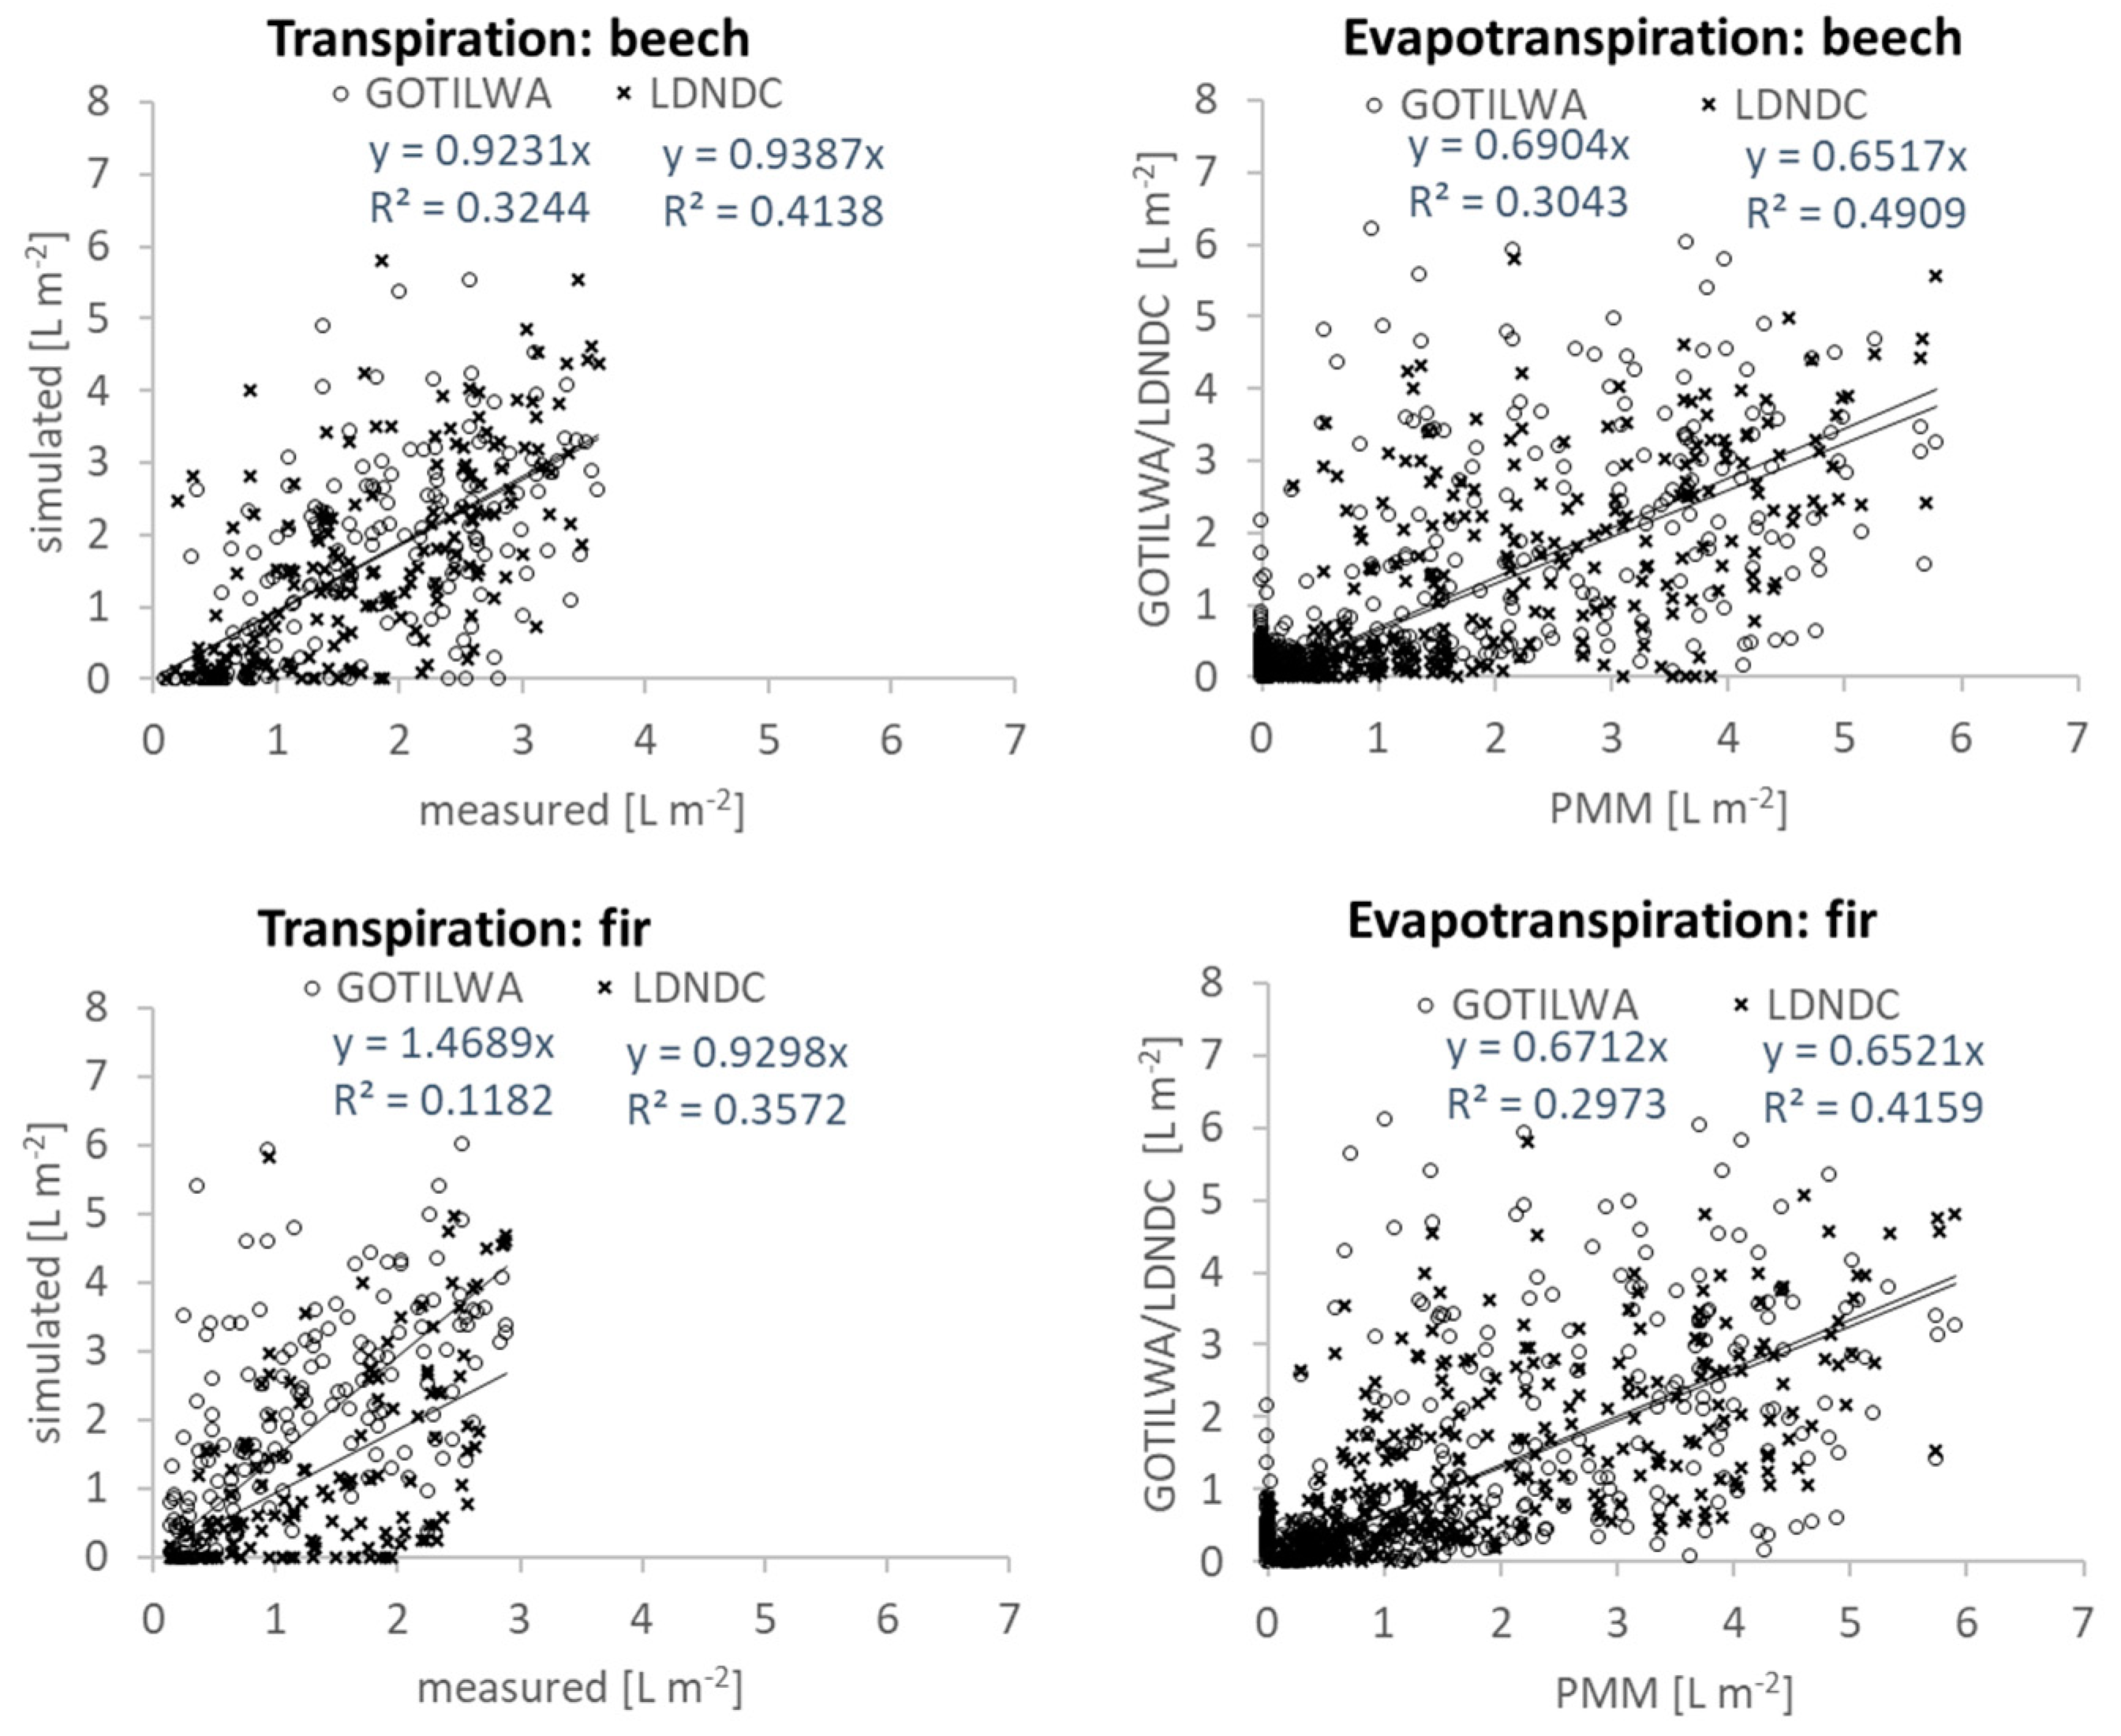
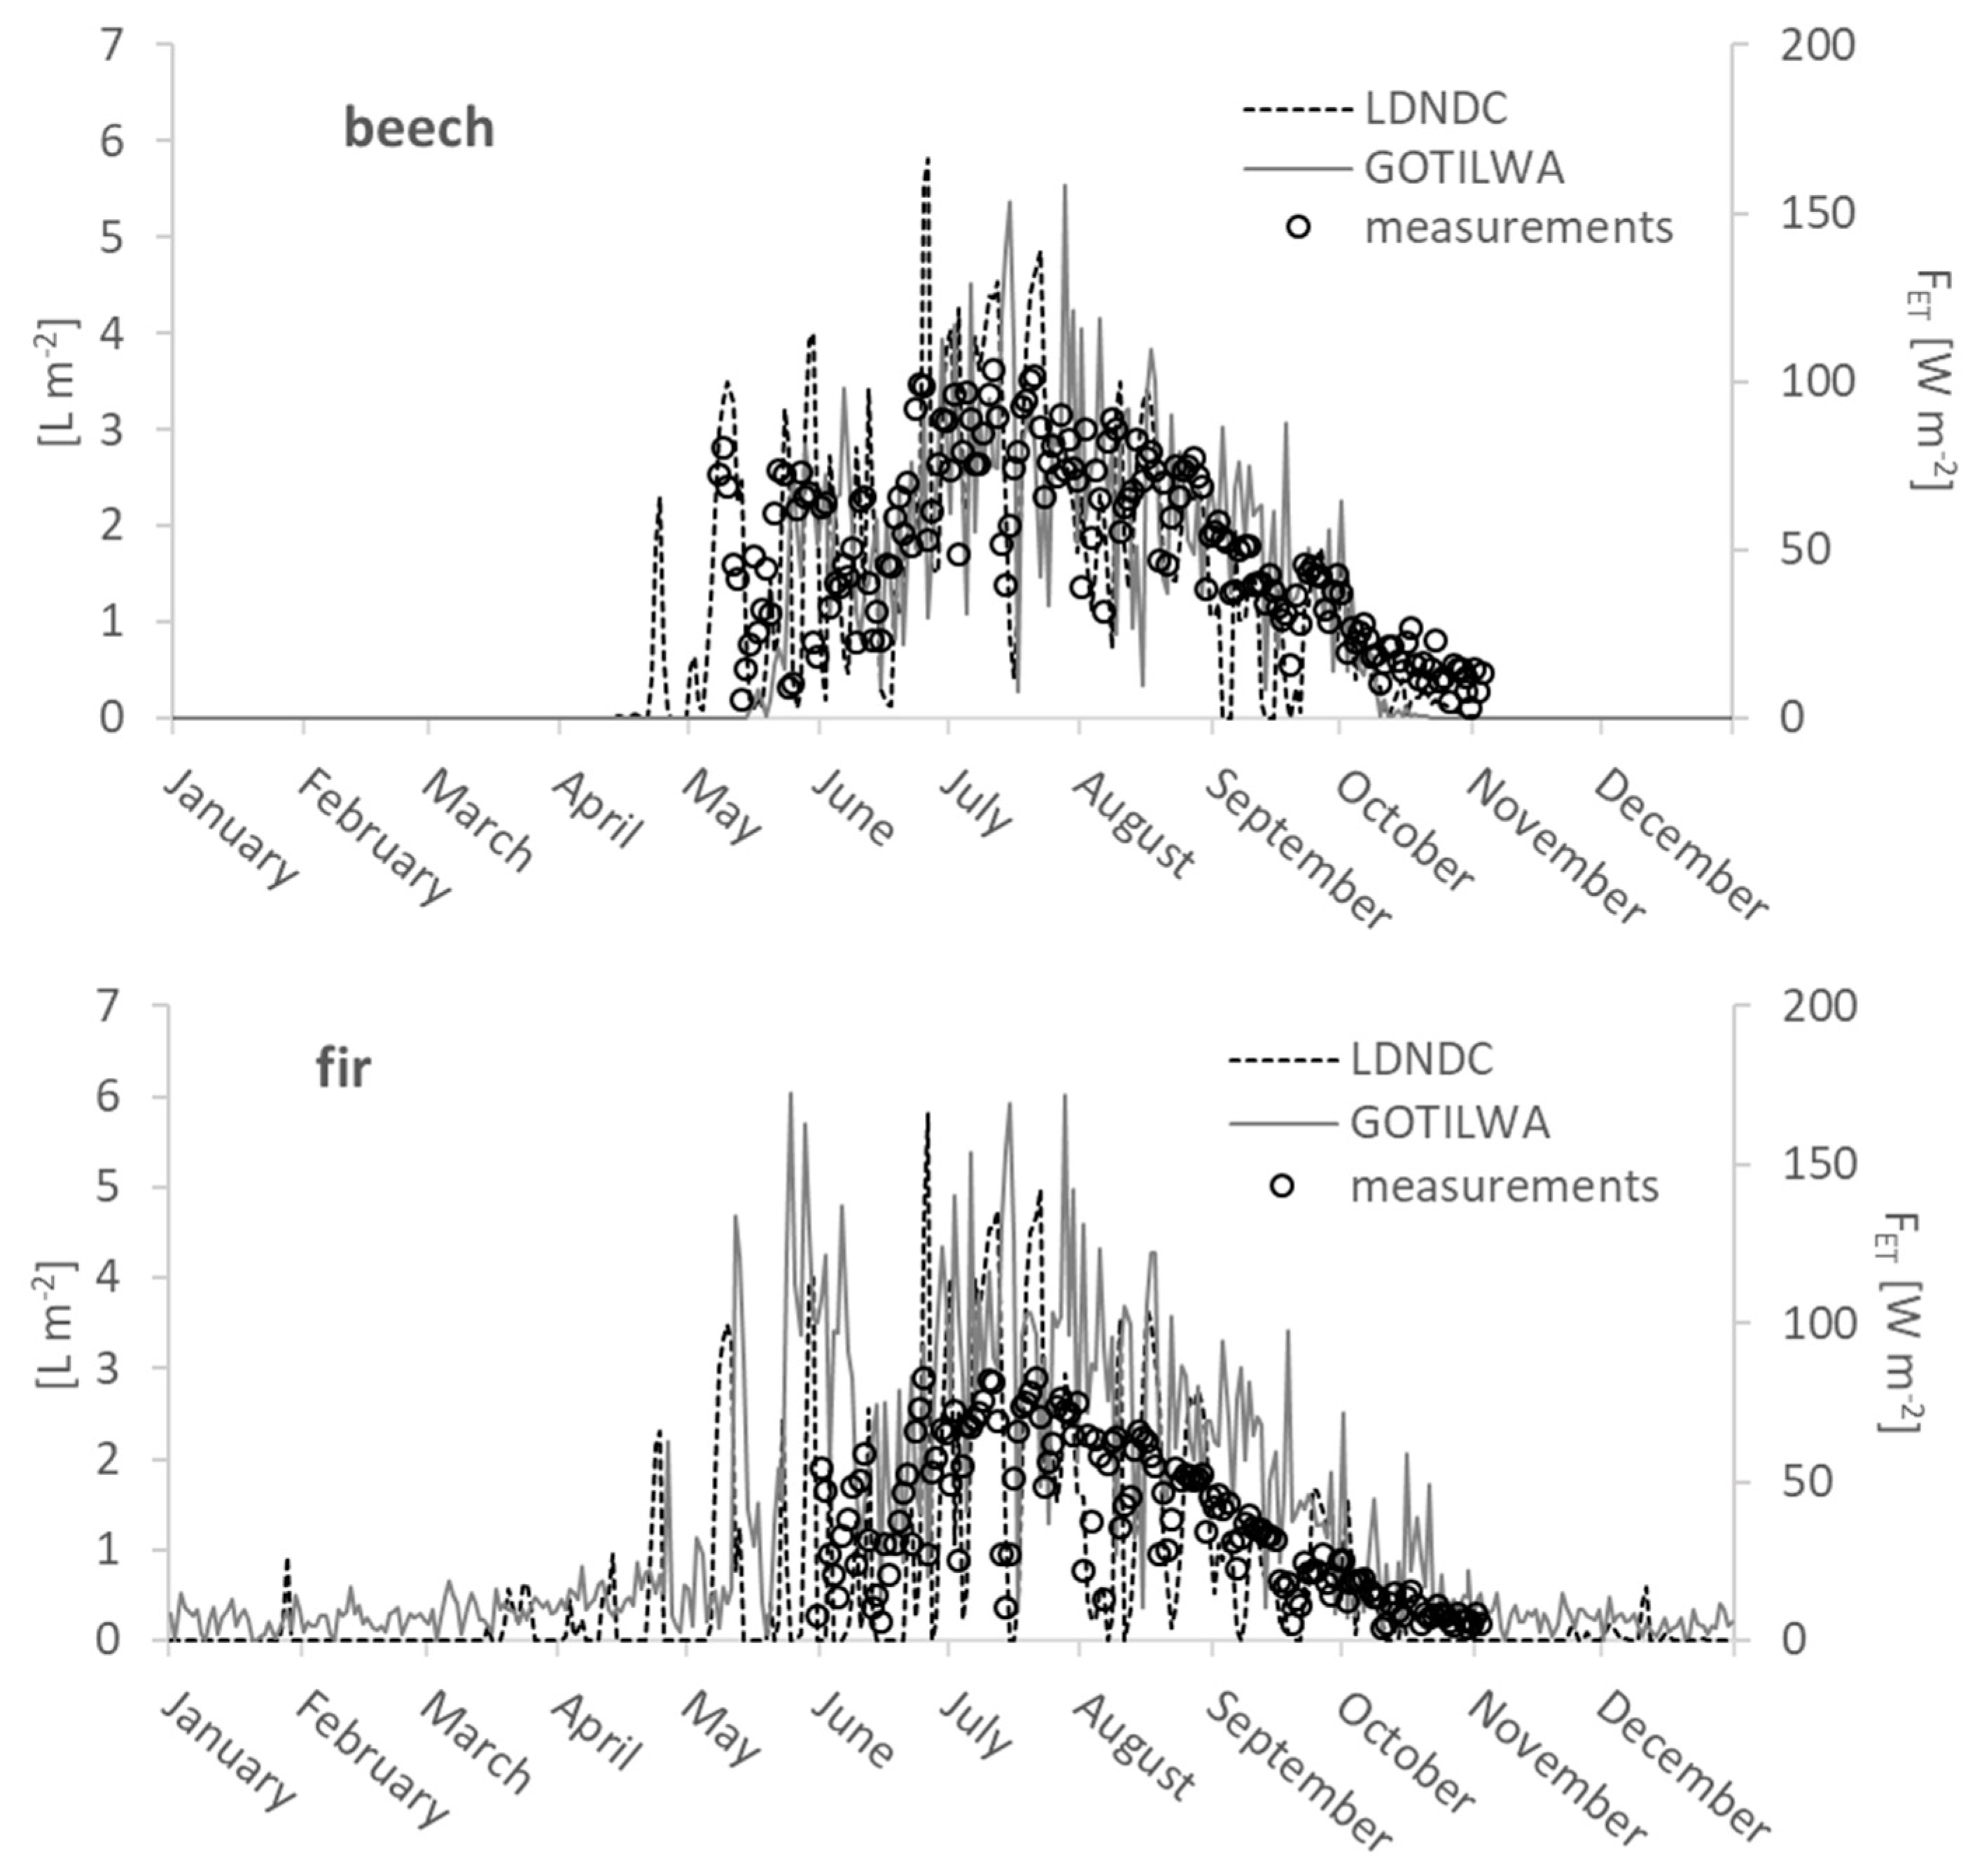
2.5. Evapotranspiration and Latent Heat Flux

Latent heat (FET) was calculated from evapotranspiration by multiplication with the specific evaporation heat L at the trees’ surface that was determined separately for beech and fir. The results were averaged for the BF site. Overall, three model approaches were applied which were (1) the Penman–Monteith method (PMM) directly [40,41,42], (2) the model ‘Growth Of Trees Is Limited by Water’ (GOTILWA+) [43], which uses the Penman–Monteith formula for determining potential evapotranspiration but accounts for phenology as well as limitations in water supply, and (3) the Landscape-DeNitrification and DeComposition model (LDNDC) [44], which calculates potential evapotranspiration using a modified Thornthwaite approach [45,46,47]. As part of the water balance, GOTILWA+ and LDNDC also calculate transpiration, which are compared with measurements of sap flow carried out at the Freiamt site with the heat ratio method [48] for selected trees (three beech and two fir trees measured during July 2016). For more information about the methodology, see Magh et al. [18]. For better comparability to other terms, the evaluation of transpiration fluxes was used to check for the reliability of water budgets in order to use the PMM approach for the determination of FET in 2017.

2.6. Secondary Radiative Effects

2.6.1. Emission of Biogenic Volatile Organic Compounds

The emission of BVOCs from fir and beech were measured campaign-wise for 10 days in 2016 and 2017 during summer (June–July) and autumn (September–October) at the Freiamt site. Leaf and needle emissions were determined for sunlit branches at the upper canopy height (approx. 20 m) using a cherry picker and a GFS-3000 system (Walz, Germany), as described in Kreuzwieser et al. [49]. Cartridge samples were collected using air from sunlit branches enclosed in Nalophan foil for 60 min and of air samples nearby as references. BVOC concentrations were analyzed by GC-MS (see Yáñez-Serrano et al. [50] for details). Gas exchange was defined as the difference in concentration between enclosed branch air and reference samples obtained over enclosure time and per dry weight of green biomass. Results were used to define standard emission rates ER per dry weight (DW) and response coefficients β (K−1) (according to Guenther et al. [51]) in order to calculate BVOC emission as a function of surface temperature T and photosynthetic active radiation I (ISO) or only T (MT, SQT).
E I S O = E R I S O × C L T
E M T = E R M T S × e x p ( β ( T T S ) ) + E R M T × C L T
C L T = e x p ( c T 1 ( T T S ) R T S T ) 1 + e x p ( c T 2 ( T T M ) R T S T ) × α c L 1 I ( 1 + α 2 I 2 ) 0.5 × γ S M
with empirical constants cT1 = 95,000, cT2 = 230,000, α = 0.0027, and cL1 = 1.066, and TM = 314 (K), as well as the standard temperature defined as TS = 303 K. R is the universal gas constant (8.314 J K−1 mol−1) and T and I are leaf surface temperature in K and absorbed photosynthetic active radiation in µmol m−2 s−1, respectively. Other compounds than isoprene and monoterpenes were calculated assuming no light dependence at all. The factor γSM describes the dependency on soil moisture, which is a linear decrease with decreasing relative soil moisture below a certain threshold [25,52]. For the regional emission estimates, standard emission rates for other species in the area were taken from literature and scaled with area fraction and the dry mass density of leaves (Table 1).

2.6.2. Ozone and Secondary Organic Aerosol (SOA) Production

With BVOC emission parametrized using the measured data from the campaigns, the amount of O3 production and the abundant O3 volume mixing ratio were calculated with the box model ‘Chemistry As A Boxmodel Application’ combined with the ‘Module Efficiently Calculating the Chemistry of the Atmosphere’ CAABA/MECCA [53], which was extended by a BVOC emission and SOA scheme [54]. The applied BVOC emission scheme accounted for emissions of ISO, MT (assumed as a mixture of α-pinene, β-pinene, and limonene), and SQT (with the properties of β-caryophyllene). The basic equation for the formation of secondary organic compounds (JORG) is based on the description of 3-nm-sized particles in Bonn et al. [26]:
J O R G = [ S O Z ] × m i n ( c J 1 [ R O 2 ] ,   c J 2 [ s C I ] ) × c J 1 [ R O 2 ] + c J 2 [ s C I ] k H O 2 [ H O 2 ] + k N O [ N O ] + k N O 3 [ N O 3 ] + k R O 2 [ R O 2 ]
S O Z = t s × k O S [ O 3 ] [ S Q T ] Y + k H 2 O [ H 2 O ] k O H [ O H ] + C S
with SOZ describing the concentration of secondary ozonoids (particle-forming compounds) and RO2, sCI, HO2, NO, as well as NO3, are organic peroxy radicals, stabilized Criegee intermediates, hydroperoxyl radicals, nitrogen monoxide, and the nitrate radical, respectively, all derived from measurements and/or VOC emission simulations and used as concentrations in molecules cm−3. Reaction constants with units cm3 molecule−1 s−1 are all indicated as ki,j and are taken from the Master Chemical Mechanism [55], as referenced in Bonn et al. [54]. Y denotes the stabilizing rate and CS the condensation sink of SOZ. The empirical constants are cJ1 = 2.5 × 10⁻¹³ cm3 molec−1 s−1, cJ2 = 2 × 10⁻¹² cm3 molec−1 s−1, and ts = 80 s−1.
It was assumed that these emissions instantaneously mix within the meteorological boundary layer. Other components that were considered for chemical reactions are NO, NO2, CO, benzene, and toluene concentrations (station Schwarzwald-Süd) as well as total particle mass and volatile fraction (assumed as predominantly organic) (station Schauinsland), provided in hourly time resolution. Background concentrations of further VOCs were obtained from additional proton-transfer-reaction mass spectrometry (PTR-MS) measurements (station Schauinsland, data from 25 July to 9 September 2017). Meteorological data of Freiamt station were used as input parameters (see Section 2.1). Simulations targeting tropospheric O3 concentration, particle formation rates up to 3 nm in diameter, and SOA mass were carried out for the years 2016 and 2017, assuming (1) the current tree species’ mixture of the Black Forest according to Table 1, (2) medium increase of fir abundance, replacing one-third of the area currently occupied with beech, and (3) high increase of fir by replacing half of the current areas currently occupied by beech.

2.6.3. Cloud Condensation Nuclei and Cloud Properties

Subsequently, we estimated the impact of tropospheric ozone and SOA concentration on cloud properties. The effect of cloud properties was calculated according to Spracklen et al. [56]:
Δ F c = F s o l a r · A c · T R 2 · Δ R c
ΔFc describes the change of all radiation fluxes from clouds that is induced by the change in cloud condensation nuclei CCN. Ac represents the fractional cloud cover, the median of which is 0.75 0.13 0.88 (Mt. Feldberg, German Weather Service, station no. 1443). TR abbreviates the fractional atmospheric transmission of shortwave radiation above the cloud layer, assumed as 0.76 [56], and ΔRc is the change in cloud albedo, calculated as
Δ R c   = 1 3 R c · ( 1 R c ) · Δ CCN C C N
The cloud albedo Rc was assumed as 0.20 ± 0.05 [57]. CCN is determined using an empirical relationship with the emission of monoterpenes (ERMT) that was suggested previously based on measurements in a very similar structured area [58]:
CCN (s = 0.3%) = 675 ± 31 cm−3 + 0.45 ± 0.10 g(DW) h µg−1 cm−3 ERMT
(This equation is limited in applicability for CCN concentrations less than ca. 800 cm−3, which is, however, well above 97% of all measurements at the investigated site (station Schauinsland)).

3. Results and Discussion

3.1. Land Surface Albedo

The measurement period covered a wide range of different meteorological conditions with 31,600 data points in total. Plotting surface albedo vs. incoming global radiation provided an equilibrium value of 0.076 ± 0.001 at sufficiently high radiation (Figure 3). This value is substantially lower than the literature-based albedo value of beech of 0.13 ± 0.01 [59,60]. In addition, leaf area of beech is negligible between early November and late April (with a peak leaf area index of 6 and transition phases of about four weeks in spring and autumn), while the evergreen fir provides continuous foliage cover (leaf area index of 3.8 in winter and up to 9.8 in summer). These phenological results are comparable with data available for Central European conditions [61,62,63]. Overall, a pure canopy of fir thus yields a surplus of 7.3 W m−2 as an annual mean and 54.4 W m−2 at maximum compared with a pure beech canopy. Mixtures are to be found in between. In other words, fir increases the heat flow into the ecosystem, although not necessarily the temperature of the canopy (see next section).

3.2. Heat Storage Dynamics

Although soil temperature dynamics are usually less expressed than air temperature changes, the comparison between the BF and BB site shows that fir contribution results in a faster heating and cooling during the day. This is probably due to a faster energy transport enabled by the crown shape of firs (see inserted figure within Figure 4, top left). On a seasonal scale, soil at fir-admixed plots is cooler in winter, which leads to slightly less heat storage compared to pure beech forests of about 0.3 K in annual average (Figure 4, bottom left). The effect is accelerated by the finding that the soil under beech trees is generally wetter (see next section), leading to more heat storage in the ground of the BB site than under the BF site throughout most of the year (Figure 4, bottom right). The aboveground biomass, however, is counteracting this development, since the heat capacity of fir wood is larger. Although the overall biomass at the BF site is slightly smaller, which is due to the relatively many but small beech trees, this effect is still sufficient to result in up to 4 W m−2 smaller heat storage in mid-summer at the BB site (Figure 4, bottom right). These findings show (1) that the increased heat flow into forests with fir admixture is quickly transported throughout the canopy to heat up the ground and not the foliage surface and (2) that not the ground but the trunks are the major sink of energy that results from a smaller albedo.

3.3. Latent Heat Exchange

Simulated transpiration for beech is characterized by the restriction to the growing season in both GOTILWA+ and LDNDC and by a general dependency on temperature (Figure 5). Evaluation of simulations by sap-flow measurements indicates that both models seem to be able to capture the response for beech, while GOTILWA+ overestimates transpiration for fir (Figure 6, left). Evapotranspiration, as represented by the PMM approach, is generally a bit larger for beech but smaller for fir than the fluxes derived by the two ecosystem models (Figure 6, right).
Similar results can be derived from the annual water flux budget. Evapotranspiration for the years 2016/2017 was calculated to be 574/627 (PMM), 407/504 (LDNDC), and 483/444 mm (GOTILWA+) for beech stands and 624/686 (PMM), 465/572 (LDNDC), and 479/441 mm (GOTILWA+) for fir. This corresponds to 59/65 (PMM), 45/51 (LDNDC), and 46/46 % (GOTILWA+) of the annual precipitation for beech and fir, respectively. For a watershed within the Black Forest, overall evapotranspiration rates have been determined to be 55% of precipitation, estimating the value to be 63% for densely covered forest patches [64]. Compared to these investigations, GOTILWA+ and LDNDC seem to slightly underestimate evapotranspiration while the PMM provides values in a reasonable range. Therefore, we used PMM, which can also easily be used for smaller time steps, for energy, and air chemistry calculations. However, we considered the results from both ecosystem models for determining the range of uncertainty.
Assuming that mixtures of beech and fir can be represented by patches of pure stands that are proportional to the basal-area contribution of the respective species within the mixed forest, evapotranspiration fluxes can be estimated for mixed stands. Thus, the 50% mixture of the BF site increases evapotranspiration by 59 mm per year, although it can even be reduced during the summertime. This corresponds to an annual median FET of −66 W m−2. In other words, annual ET would rise and FET would decline by about 7.6% per 10% increase in fir intermixture. This has numerous implications. On the one hand, it partly counteracts the increased heat inflow due to the darker canopy, decreasing the effect on regional energy balance. On the other hand, however, increased water flow back into the air directly feeds back on incoming radiation directly and indirectly by affecting cloud formation.

3.4. Secondary Radiation Effects

3.4.1. Biogenic Volatile Organic Compounds

Measurements indicated that neither beech nor fir emitted significant amounts of isoprene, thereby confirming studies on beech [20,22] and fir in the French Vosges forest [21], which are in close vicinity to the Black Forest. However, our data contradict the rather high emissions reported for fir from Belgium [23]. For the whole area, ISO inputs into the box model calculations thus mainly originate from small contributions of high emitting oak and poplar trees at lower altitudes (Table 1). In contrast, emission patterns of MT and SQT were found to be considerably different between beech and fir, resulting in substantial variations in total emissions and reactivity: Emission rates for SQT under standard conditions (ERSQT) were 0.2 µg g(DW) h−1 for beech and 0.7 µg g(DW) h−1 for fir. Temperature response coefficient β [51] of fir were, however, smaller (βSQTfir = 0.04 K−1) than those for beech (βSQTbeech = 0.11 K−1), resulting in particularly large differences at low temperatures and convergence of SQT emissions when TS approaches ≈ 45 °C. Together with the higher leaf area of fir, the overall response was an increasing emission of MT and SQTs with increasing fraction of firs throughout the year. For our sites, the actual SQT emission was calculated to be about 75% and the MT emissions 55% higher for intermixtures with 50% fir than for pure beech sites. On a regional scale, these differences led to a considerable increase of BVOC emissions with impacts on ozone and aerosol formation, as discussed in the next sections.

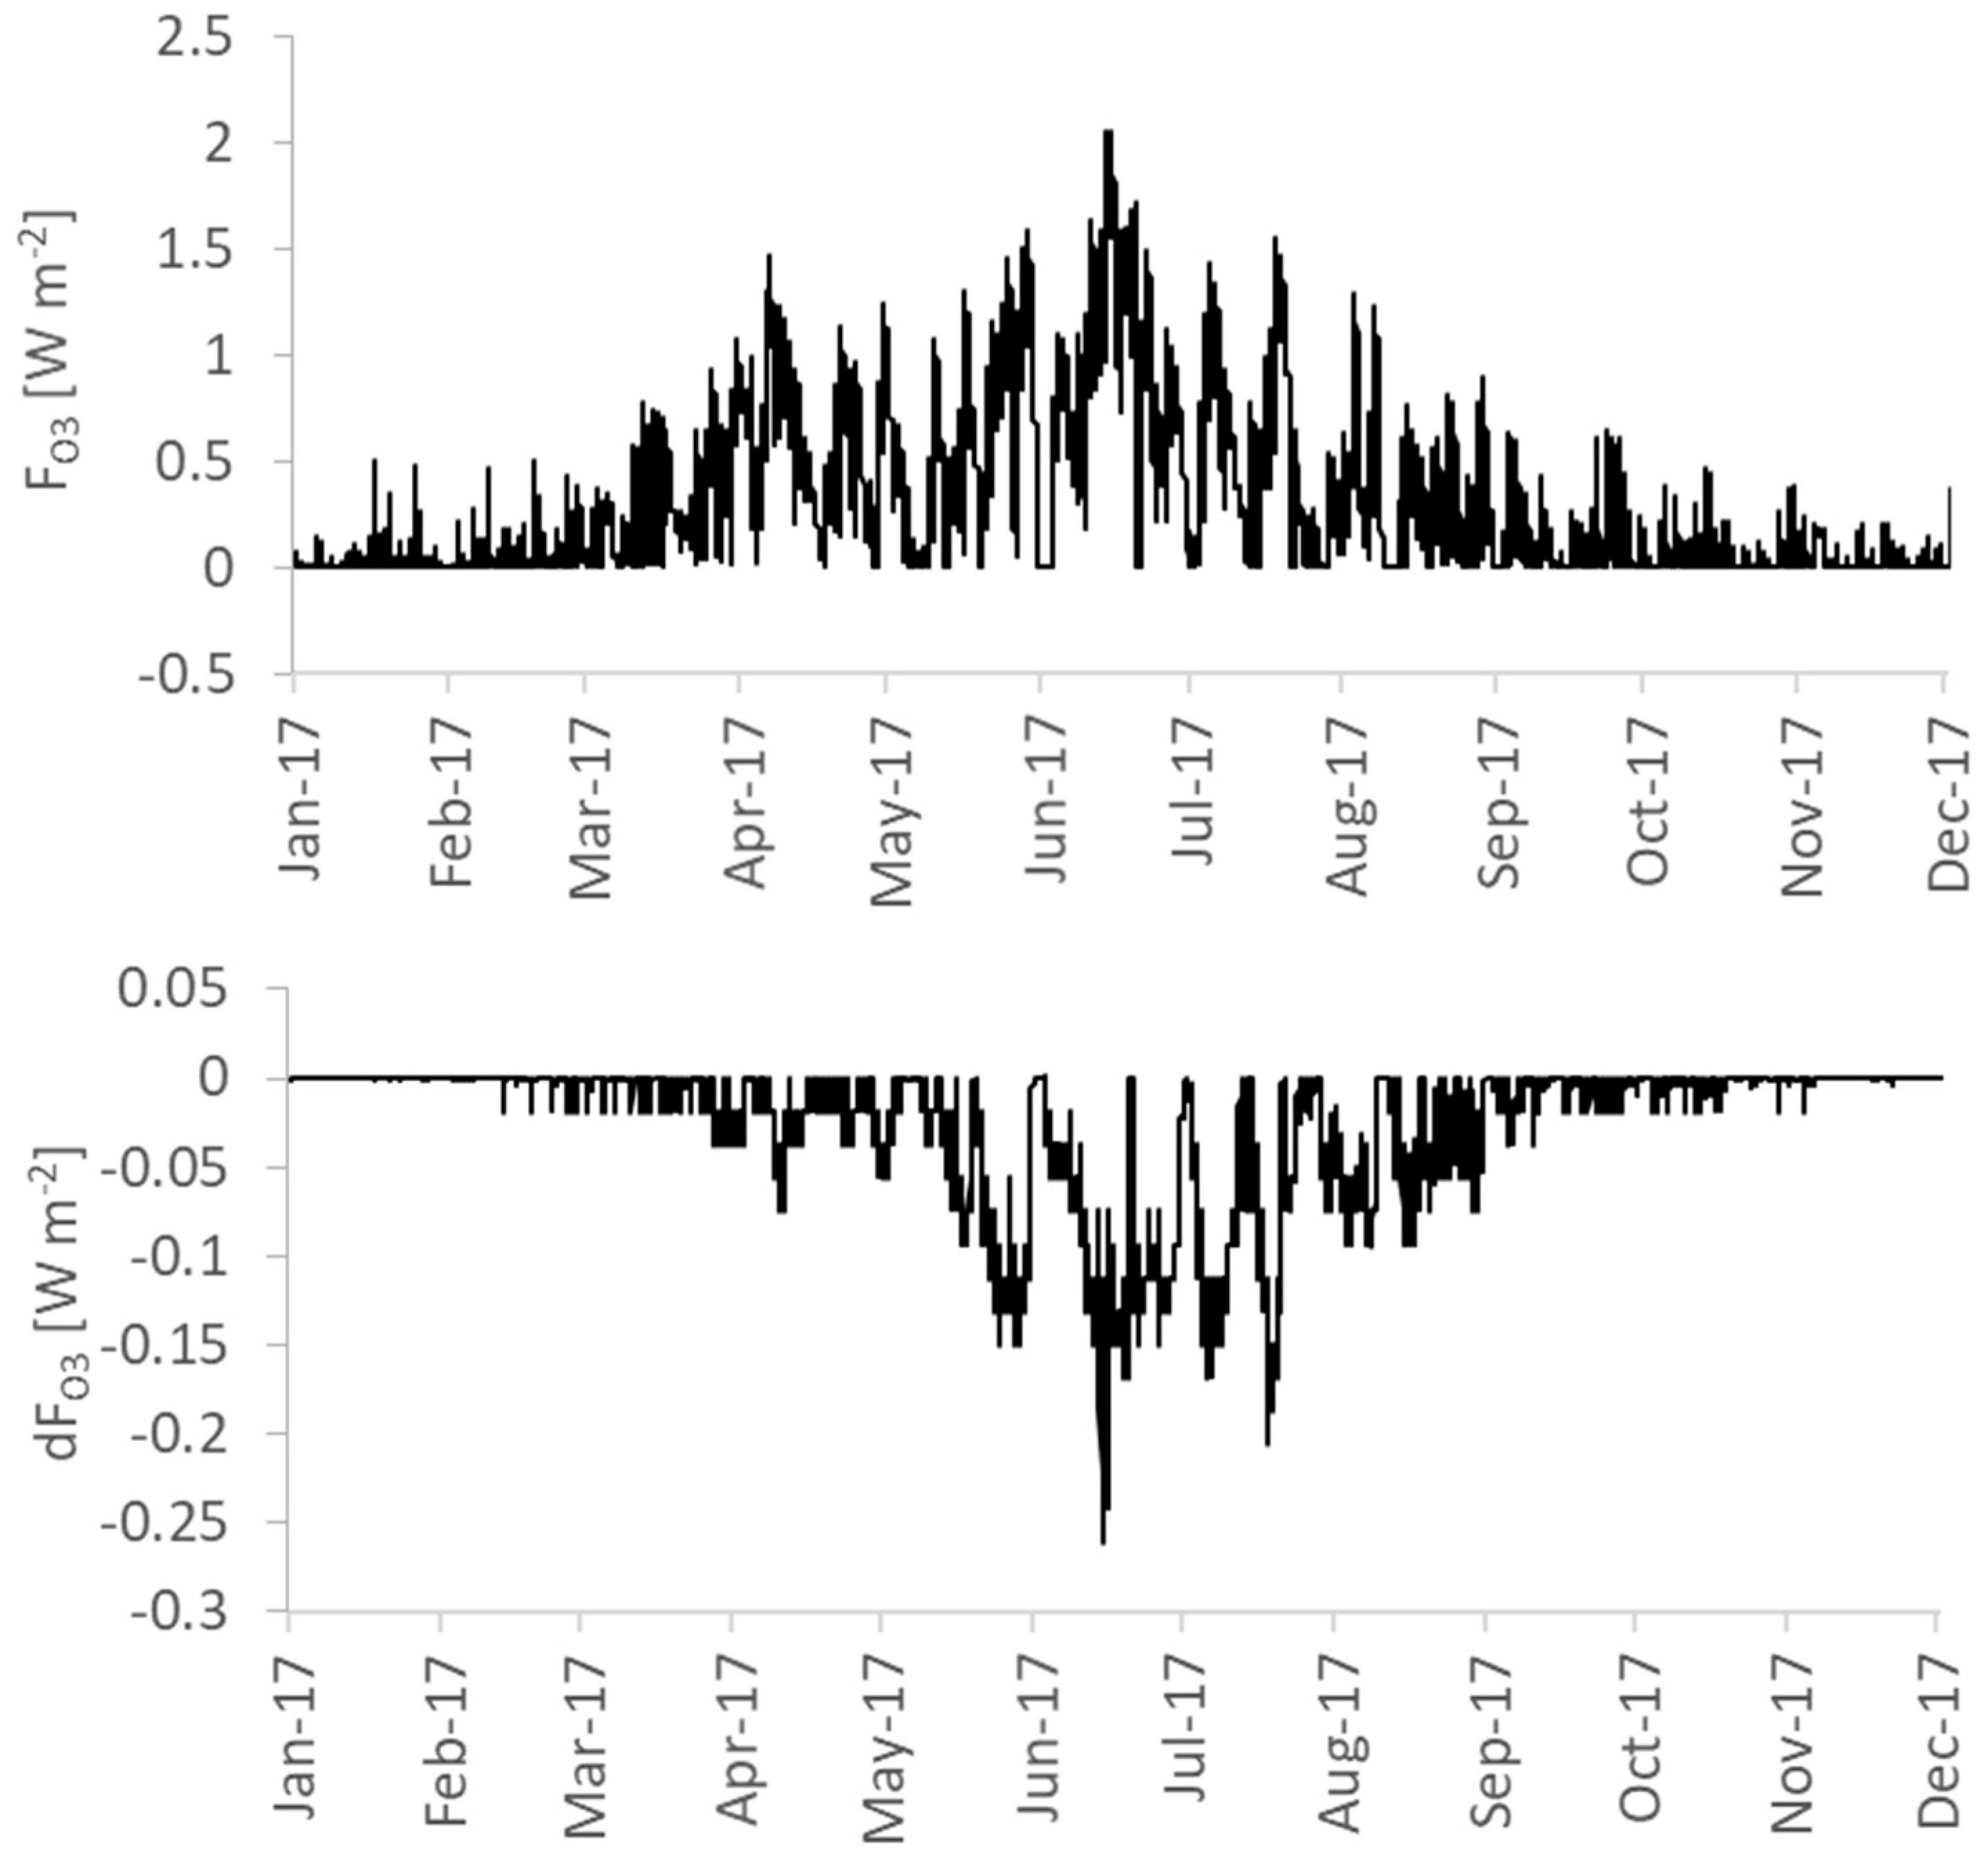
3.4.2. Ozone Formation

Tropospheric O3 concentration [O3] was calculated based on BVOC emissions and background measurements of NOx and meteorology [65]. It was found that [O3] in the western part of the Black Forest depends to a similar degree on NO (NOx) and HO2 (BVOC). As tropospheric O3 is changed on a regional scale, we used either the current beech/fir mixture (current) or a scenario with a higher share of fir (admixing scenario) at all sites where beech forests are currently observed in the Black Forest, while the contribution of species other than beech or fir remained the same. Simulations based on current conditions resulted in O3 mixing ratios that agreed fairly well with measurements (r2 = 0.83) [54]. The overall radiation effect of mean tropospheric O3 (FO3) calculated for 2017 varied between 0 and 2 W m−2 (Figure 7). The increase of tropospheric O3 with increasing contribution of fir (BF scenario) resulted in a radiative change of up to +0.25 W m−2 on an hourly basis. The mean annual increase of FO3 was estimated to be moderate with 0.023 W m−2.
An increase of fir abundance according to the scenario was thus simulated to cause an increase of mean tropospheric O3 concentrations by +11.1%. Since the difference in emission depends on temperature (see previous section), the increase in [O3] is smaller under cool conditions and larger when the weather is hot.

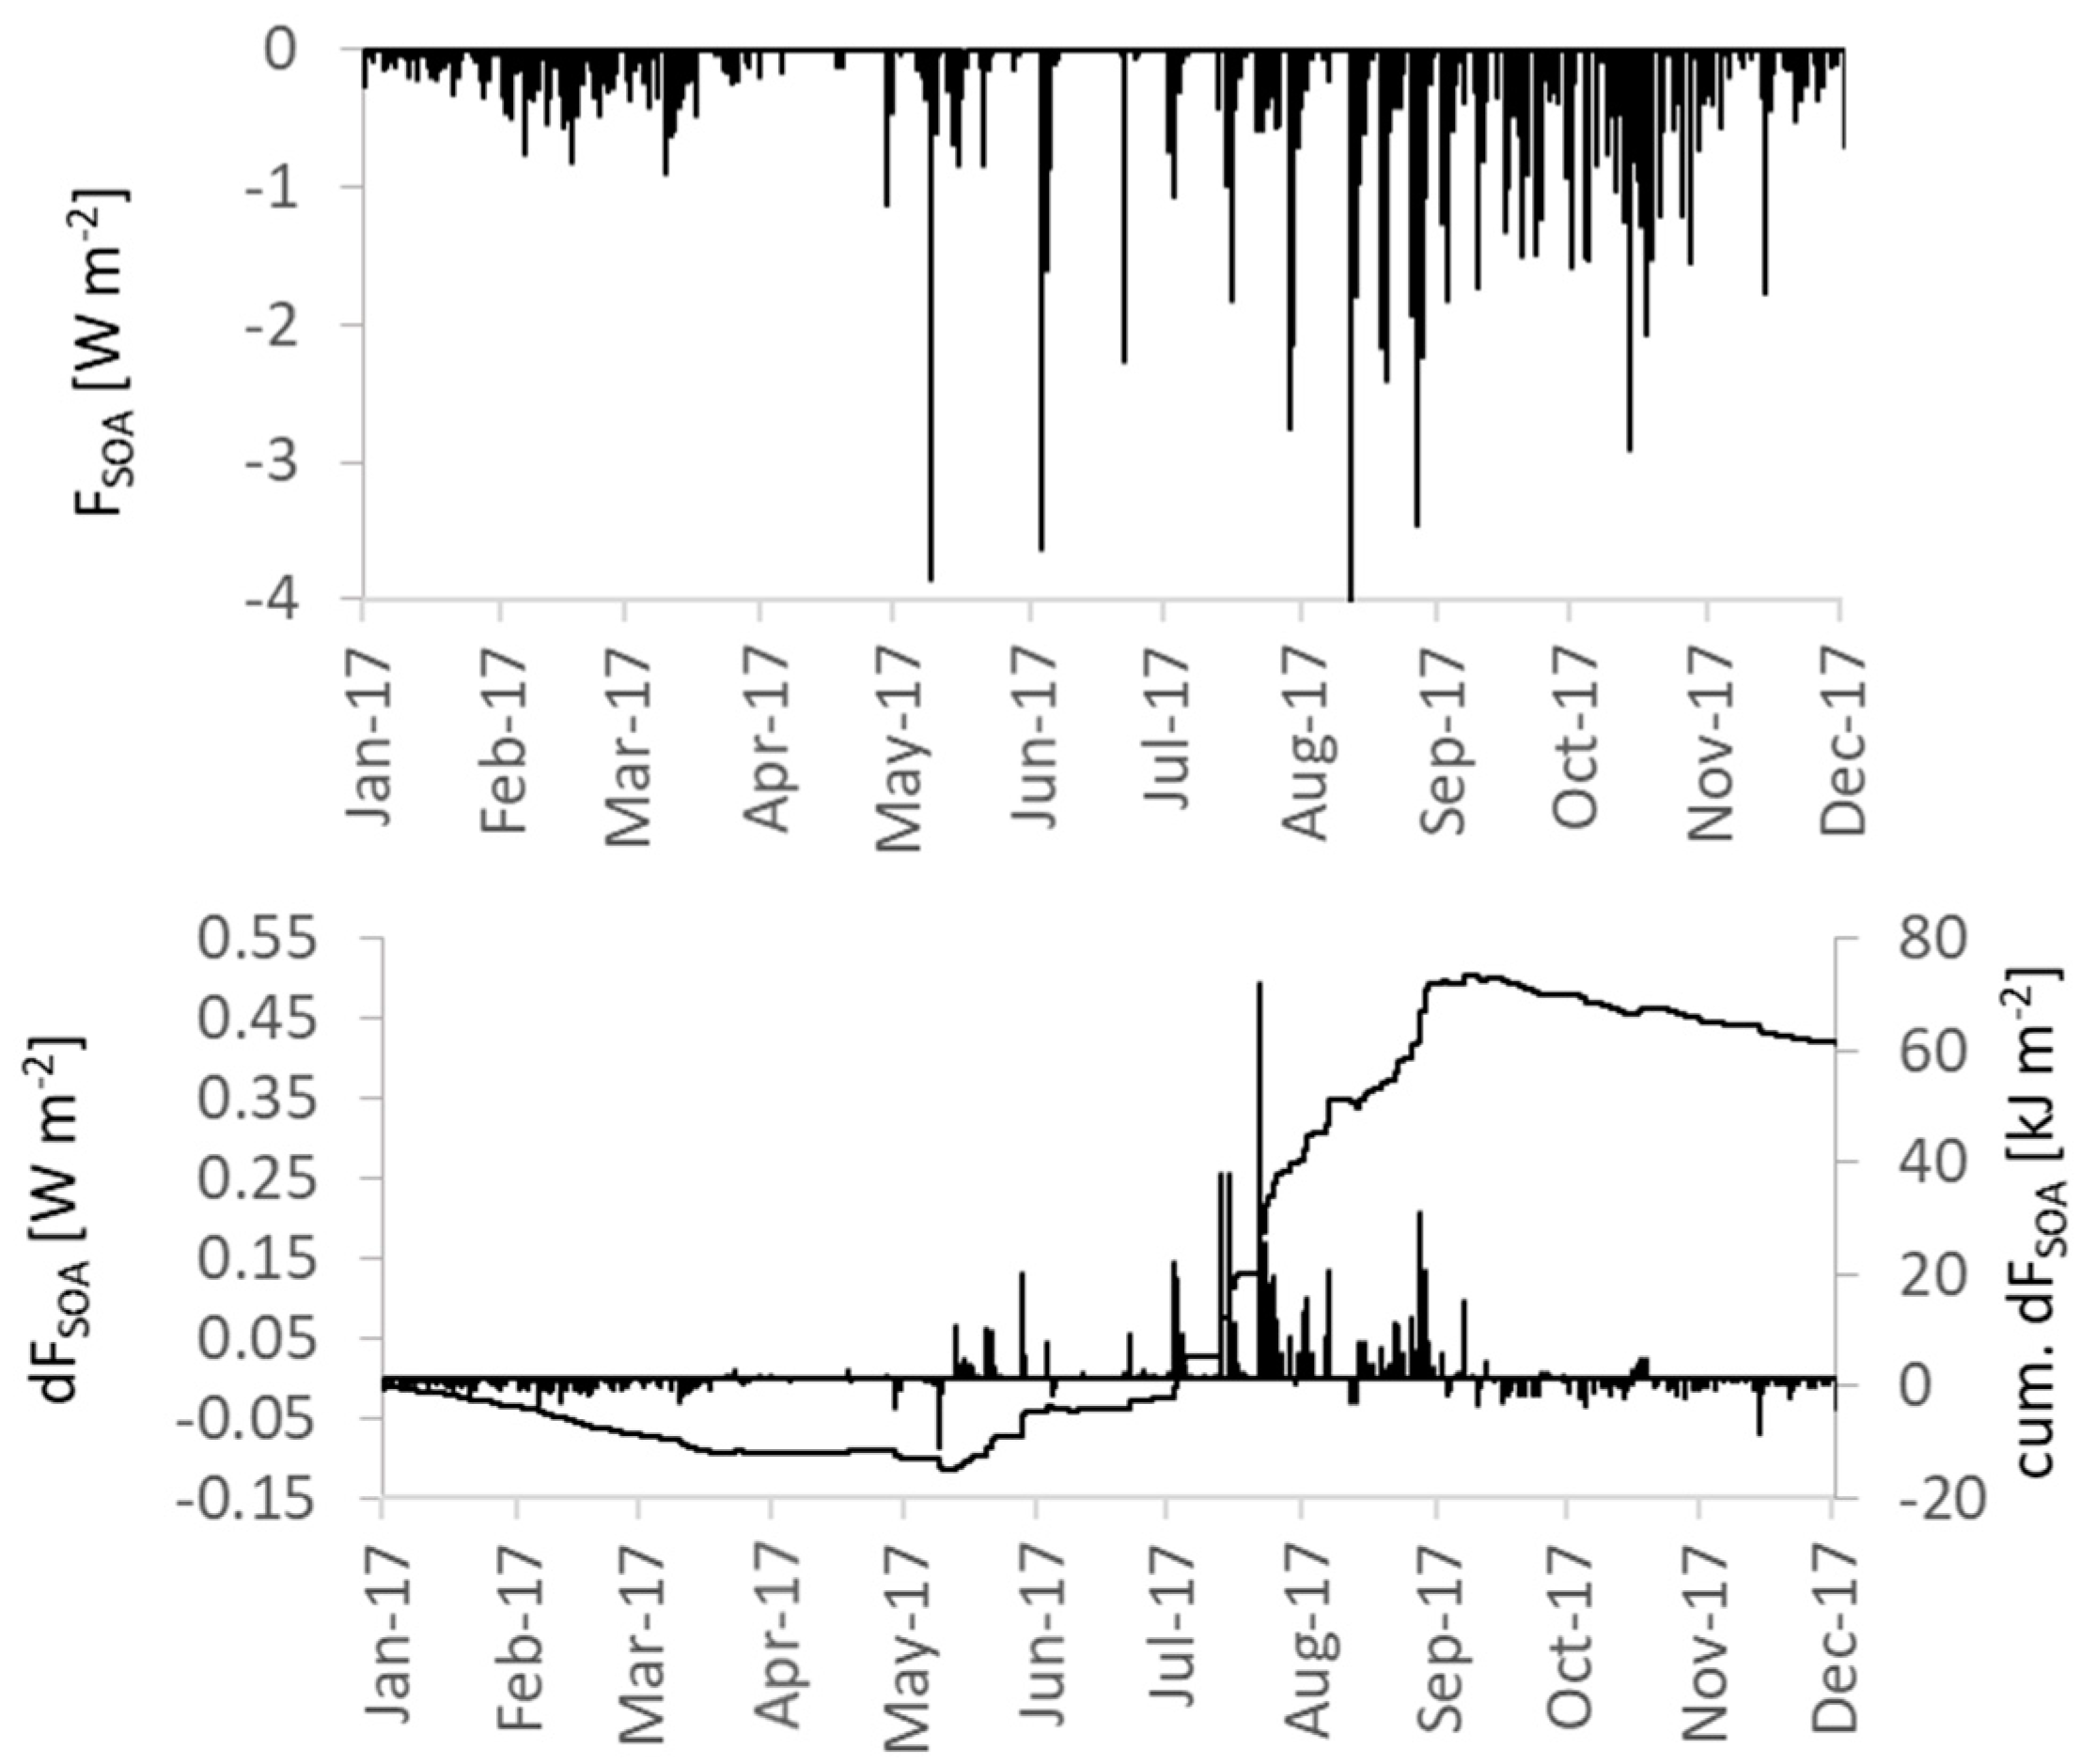
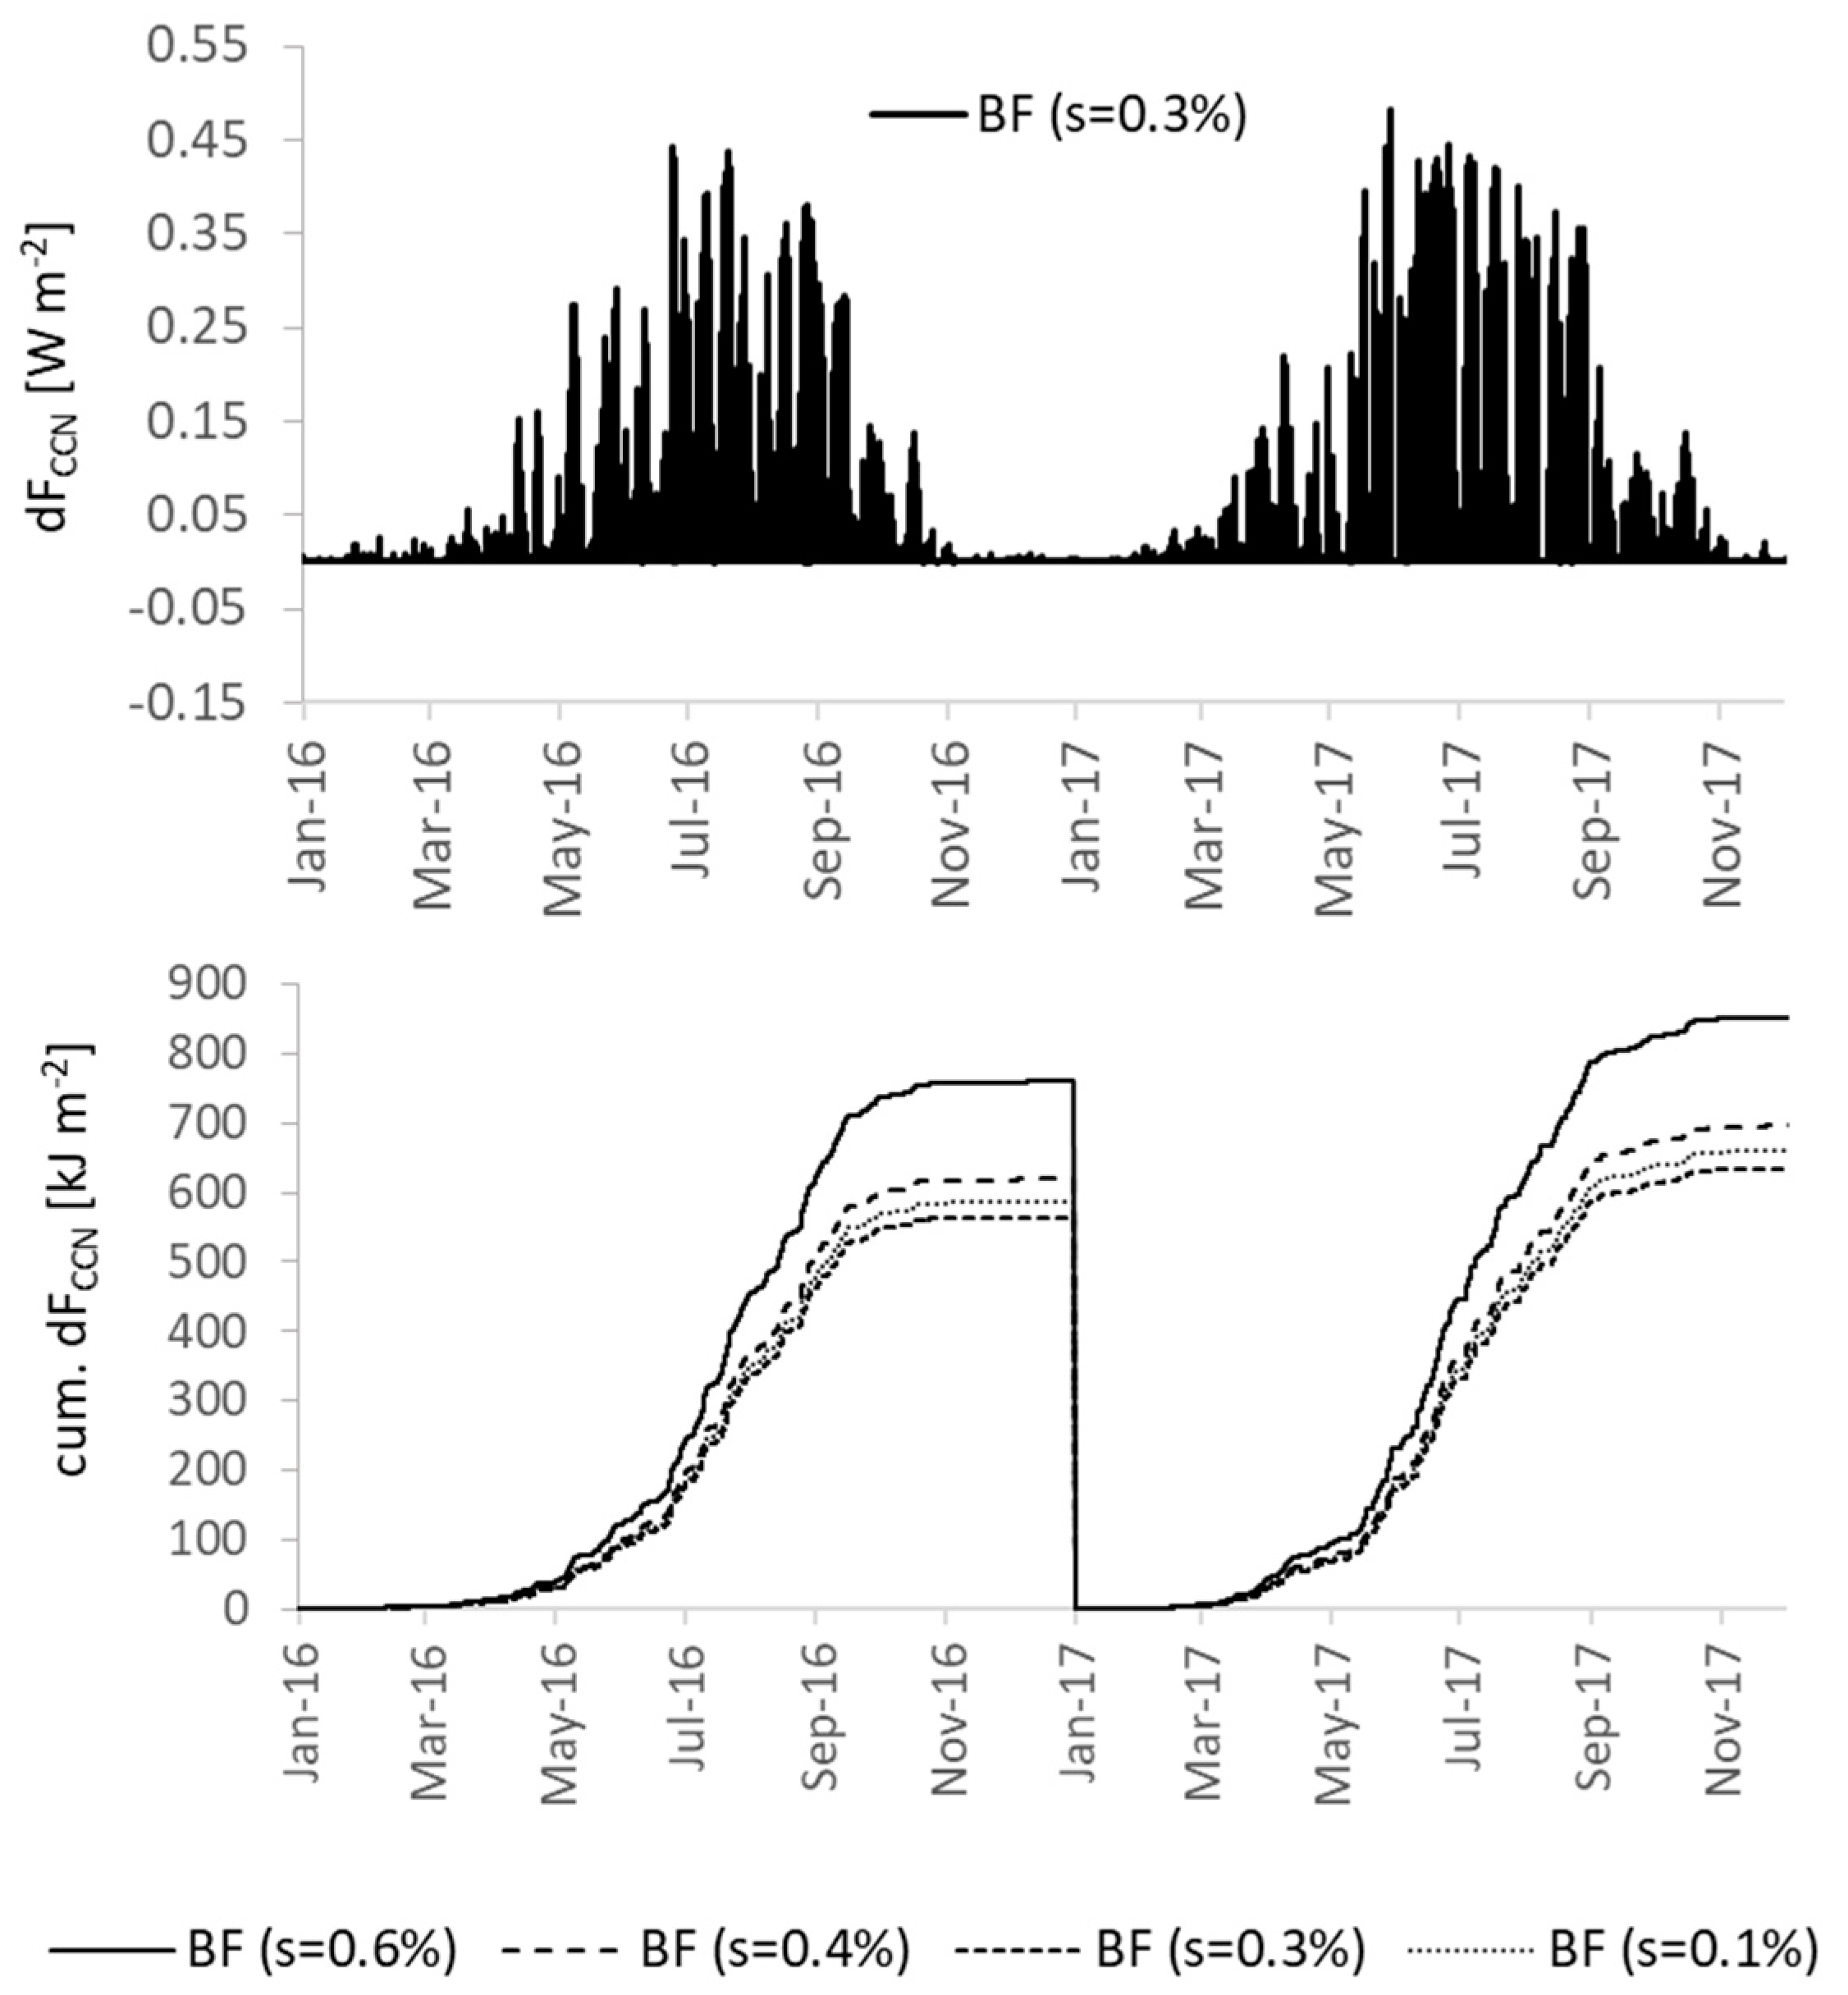
3.4.3. Secondary Organic Aerosols and Cloud Properties

The annual median of the direct radiation effect of SOA (FSOA) for current conditions was calculated to be −0.089 W m−2. This value was slightly less negative (−0.087 W m−2) for the tested scenario with increased fir abundance (Figure 8). While this effect is small and the degree of mixture is negligible, at highly polluted episodes with very warm days it can increase to almost −4 W m−2. During these times the increased mixture scenario differs by more than 1 W m−2, modifying the SOA-related radiation effect by 50%.
Further changes were approximated for formation rates of particles (up to 3 nm in diameter) with subsequent changes in concentrations of cloud condensation nuclei (CCN). This effect modifies the radiation balance of clouds, i.e., the brighter the clouds, the less radiation reaches the Earth’s surface. The reduction is a function of water vapor supersaturation necessary for CCN activation and also depends on monoterpene concentrations [58]. The radiation effects of CCN activation on the energy balance when modifying the forest composition are displayed in Figure 9 (also demonstrating the effect of water supersaturation). It shows that the effect was much larger than could be derived from SOA formation and that annual means are not very indicative. Since CCN formation underlies a pronounced seasonal cycle, the impact of fir admixture on cloud formation is especially expressed in summer.

3.5. Total Radiation Budget

The changes in radiation fluxes described in Section 3.1, Section 3.2, Section 3.3 and Section 3.4 were combined to estimate the average annual impact of a change in species’ composition on the energy budget at the upper forest canopy. An overview of mean values of individual effects and strengths is listed in Table 3. The values obtained are similar in magnitude to Holst and Mayer [66] for a nearby beech site and to Schmid et al. [67] for a North American deciduous forest. While net shortwave radiation input at the canopy top tentatively increased with increased intermixture of fir trees from 106 to 112 W m−2, FET tended to decrease from −48 to −66 W m−2. However, a high uncertainty of more than 100% in FET resulted from the large variability of estimated evapotranspiration. The overall heat stored in the ecosystem increased with increasing fir admixture, although the uppermost canopy was simulated to even cool down. While the differences in radiation budget between the current conditions and the scenario were relatively small on an annual scale, species’ mixture effects can be more expressed at shorter timescales, i.e., days. This means that our research supports the assumption that species’ mixture may become particularly important during extreme heat periods, leading to intensified short-term stresses that are often more damaging than cumulative ones [68].
Large uncertainties derive from daily climate variations, for instance incoming global radiation that triggers specific components of the radiation balance differently [69,70]. As demonstrated here for summer periods, also Oliphant et al. [70] measured substantial radiative contributions of dHveg for a deciduous forest at daily and sub-daily scale with up to 10 W m−2, resulting in crown surface temperate increases of up to 4 K at noon. Similarly, upper canopy surface temperatures of beech trees were found to be 4–5 K higher than air temperature, while canopy and air temperatures of conifers were approximately the same [71]. Other results confirm that conifer forests considerably increase their heat storage during summer [35]. It should be noted that these differences may represent a feedback response to BVOC emission, modifying the emission conditions differently in different parts of the canopy, which was, however, not considered here.

3.6. Uncertainties and Deficiencies of the Investigations

First, we want to emphasize that the investigation did not consider any disturbances such as damages by herbivory and browsing, which might penalize Silver fir compared to competing tree species. For example, it has been shown that firs were preferentially browsed in comparison to Norway spruce [72], although this also depends on the forest mixture and the abundance of other species within the understory [72,73]. Second, processes that were considered as, for example, describing the water balance, may include aspects that could not be considered here, such as deep water redistribution [74]. This may compensate for the higher evaporation losses from interception that results from the higher potential leaf area of firs. Even if considered, as in the case of the drought impact on BVOC emission, part of the response such as an increase of emission under mild drought is still lacking a consistent mathematical description [75]. Third, many of our investigations were based on local measurements that we assumed to be representative for the applied region in order to present a consistent scaling investigation. However, only few investigation sites of limited size were employed, which, together with not differentiating between biomass in wood and foliage, resulted in a relatively high uncertainty, in particular, regarding the biomass at the sites. It would, thus, be favorable if more fir sites could be incorporated into a future scaling exercise. Finally, it should be noted that model results were still far from perfectly evaluated. We tried to compensate for this problem by using several approaches that, however, still might need improvements, e.g., regarding soil and forest structural considerations [76,77].

4. Conclusions

According to our results, a scenario assuming a 50% admixture of fir into all existing beech forests would lead to higher shortwave radiation input because of the darker foliage. The surplus energy is stored dominantly in the trunks of the conifers while the uppermost canopy layers may even cool due to the increased turbulence of the canopy space of firs. On a diurnal basis, this effect also leads to a relative cooling at daytime but warming during the night. The other important effect is the loss of energy and water by increased evapotranspiration, predominantly driven by a higher interception. This interacts with energy terms since less water decreases the heat storage capacity of the soil.
On the regional scale, MT and SQT emissions were simulated to increase by around 10%, resulting from 55–75% higher emissions at the local scale. This was simulated to increase O3 as well as SOA production with implications for CCN concentration. Together with increased water evaporation, CCN leads to qualitative and quantitative changes of clouds, i.e., cloud brightness. Both air chemistry impacts and cloud formation effects have, in turn, impacts on the regional radiation regime and rainfall pattern and, thus, represent a climate feedback process, which, however, was not further evaluated in this study.
Despite the relatively minor change that was assumed regarding the scenario species’ composition, we overall estimated primary as well as secondary impacts of a species’ change on regional radiation balance and air chemistry to be substantial. In this particular case, increased energy absorption and evapotranspiration may increase the drought stress and need to be weighed against a possible higher resistance that fir may have compared to beech [14,15]. On the regional scale, an increase in [O3] may be generally negative but tolerable or not depending on the specific conditions, while an increase in cloudiness, brightness of clouds, or even precipitation could be regarded as a positive climatic feedback or as an effect that decreases radiation availability for vegetation productivity. This, however, can only be judged in long-term, coupled-model investigations that consider these feedbacks.

Author Contributions

Conceptualization, B.B. and H.R.; Formal analysis, B.B. and R.G.; Funding acquisition, H.R.; Investigation, R.-K.M., D.S. (Dirk Schindler), D.S. (Dominik Sperlich), and R.T.; Methodology, B.B.; Supervision, J.K. and R.Y.; Writing—Original draft, B.B. and R.G.; Writing—Review and editing, B.B., J.K., R.-K.M., H.R., D.S. (Dirk Schindler), D.S. (Dominik Sperlich), R.T., R.Y., and R.G. All authors have read and agreed to the published version of the manuscript.

Funding

This research was funded by Bundesanstalt für Landwirtschaft und Ernährung (BLE), Germany, by the Bundesministerium für Ernährung und Landwirtschaft (BMEL) and the Bundesministerium für Umwelt, Naturschutz, Bau und Reaktorsicherheit (BMUB) based on the decision of the German Federal Parliament within the framework of the project „Buchen-Tannen-Mischwälder zur Anpassung von Wirtschaftswäldern an Extremereignisse des Klimawandels“ (BuTaKli) project, grant number 28W-C-1-069-01.

Acknowledgments

We would like to thank particularly Tim Burzlaff from the project office, who facilitated many contacts and set up any kind of necessary field work and experiments. The Umweltbundesamt is kindly acknowledged for providing measurements and data from the station Schauinsland. Special thanks also to all persons involved in the measurements and simulations without whom the study would not have been possible. The research was kindly supported by Netze BW GmbH, the German Weather Service (DWD, Offenbach, Germany), the regional office for Environment in Baden-Württemberg (LUBW, Stuttgart, Germany), the Federal Environmental Agency (UBA, Dessau, Germany), and the German Ultrafine Aerosol Network (GUAN). In addition, we are grateful to Bernhard Wittenberg and Jonas Schäfer, who provided measurement data that greatly assisted the research, and Michael Dannenmann, who supported the review process. We also acknowledge support by the KIT-Publication Fund of the Karlsruhe Institute of Technology.

Conflicts of Interest

The authors declare no conflict of interest.

References

  1. Brandl, S.; Paul, C.; Knoke, T.; Falk, W. The influence of climate and management on survival probability for Germany’s most important tree species. Forest Ecol. Manag. 2020, 458, 117652. [Google Scholar] [CrossRef]
  2. Conte, E.; Lombardi, F.; Battipaglia, G.; Palombo, C.; Altieri, S.; La Porta, N.; Marchetti, M.; Tognetti, R. Growth dynamics, climate sensitivity and water use efficiency in pure vs. mixed pine and beech stands in Trentino (Italy). Forest Ecol. Manag. 2018, 409, 707–718. [Google Scholar] [CrossRef]
  3. Pretzsch, H.; Schütze, G.; Uhl, E. Resistance of European tree species to drought stress in mixed versus pure forests: Evidence of stress release by inter-specific facilitation. Plant. Biol. 2013, 15, 483–495. [Google Scholar] [CrossRef]
  4. Bolte, A.; Ammer, C.; Löf, M.; Madsen, P.; Nabuurs, G.J.; Schall, P.; Spathelf, P.; Rock, J. Adaptive forest management in central Europe: Climate change impacts, strategies and integrative concept. Scand. J. For. Res. 2009, 24, 473–482. [Google Scholar] [CrossRef]
  5. Yousefpour, R.; Hanewinkel, M. Climate change and decision-making under uncertainty. Curr. For. Rep. 2016, 2, 143–149. [Google Scholar] [CrossRef] [Green Version]
  6. Hilmers, T.; Biber, P.; Knoke, T.; Pretzsch, H. Assessing transformation scenarios from pure Norway spruce to mixed uneven-aged forests in mountain areas. Eur. J. For. Res. 2020, 139, 567–584. [Google Scholar] [CrossRef] [Green Version]
  7. Morin, X.; Fahse, L.; Jactel, H.; Scherer-Lorenzen, M.; García-Valdés, R.; Bugmann, H. Long-term response of forest productivity to climate change is mostly driven by change in tree species composition. Sci. Rep. 2018, 8, 5627. [Google Scholar] [CrossRef] [PubMed] [Green Version]
  8. Bohn, F.J.; May, F.; Huth, A. Species composition and forest structure explain the temperature sensitivity patterns of productivity in temperate forests. Biogeosciences 2018, 15, 1795–1813. [Google Scholar] [CrossRef] [Green Version]
  9. Teuling, A.J.; Taylor, C.M.; Meirink, J.F.; Melsen, L.A.; Miralles, D.G.; van Heerwaarden, C.C.; Vautard, R.; Stegehuis, A.I.; Nabuurs, G.-J.; de Arellano, J.V.-G. Observational evidence for cloud cover enhancement over western European forests. Nat. Commun. 2017, 8, 14065. [Google Scholar] [CrossRef] [Green Version]
  10. Monson, R.K.; Holland, E.A. Biospheric trace gas fluxes and their control over tropospheric chemistry. Annu. Rev. Ecol. Syst. 2001, 32, 547–576. [Google Scholar] [CrossRef]
  11. Sporre, M.K.; Blichner, S.M.; Karset, I.; Makkonen, R.; Berntsen, T. BVOC-aerosol-climate feedbacks investigated using NorESM. Atmos. Chem. Phys. 2019, 19, 4763–4782. [Google Scholar] [CrossRef] [Green Version]
  12. Zhao, D.F.; Buchholz, A.; Tillmann, R.; Kleist, E.; Wu, C.; Rubach, F.; Kiendler-Scharr, A.; Rudich, Y.; Wildt, J.; Mentel, T.F. Environmental conditions regulate the impact of plants on cloud formation. Nat. Commun. 2017, 8, 14067. [Google Scholar] [CrossRef] [PubMed] [Green Version]
  13. Arneth, A.; Makkonen, R.; Olin, S.; Paasonen, P.; Holst, T.; Kajos, M.K.; Kulmala, M.; Maximov, T.; Miller, P.A.; Schurgers, G. Future vegetation–climate interactions in Eastern Siberia: An assessment of the competing effects of CO2 and secondary organic aerosols. Atmos. Chem. Phys. 2016, 16, 5243–5262. [Google Scholar] [CrossRef] [Green Version]
  14. Schwarz, J.A.; Bauhus, J. Benefits of Mixtures on Growth Performance of Silver Fir (Abies alba) and European Beech (Fagus sylvatica) Increase with Tree Size Without Reducing Drought Tolerance. Front. For. Glob. Chang. 2019, 2. [Google Scholar] [CrossRef]
  15. Vitasse, Y.; Bottero, A.; Cailleret, M.; Bigler, C.; Fonti, P.; Gessler, A.; Lévesque, M.; Rohner, B.; Weber, P.; Rigling, A.; et al. Contrasting resistance and resilience to extreme drought and late spring frost in five major European tree species. Glob. Chang. Biol. 2019, 25, 3781–3792. [Google Scholar] [CrossRef]
  16. Vitasse, Y.; Bottero, A.; Rebetez, M.; Conedera, M.; Augustin, S.; Brang, P.; Tinner, W. What is the potential of silver fir to thrive under warmer and drier climate? Eur. J. For. Res. 2019, 138, 547–560. [Google Scholar] [CrossRef]
  17. Rehschuh, S.; Fuchs, M.; Tejedor, J.; Schäfler-Schmid, A.; Magh, R.-K.; Burzlaff, T.; Rennenberg, H.; Dannenmann, M. Admixing fir to European beech forests improves the soil greenhouse gas balance. Forests 2019, 10, 213. [Google Scholar] [CrossRef] [Green Version]
  18. Magh, R.-K.; Bonn, B.; Grote, R.; Burzlaff, T.; Pfausch, S.; Rennenberg, H. Drought superimposes the positive effect of silver-fir on water relations of European beech in mature forest stands. Forests 2019, 10, 897. [Google Scholar] [CrossRef] [Green Version]
  19. Magh, R.-K.; Grün, M.; Knothe, V.E.; Stubenazy, T.; Tejedor, J.; Dannenmann, M.; Rennenberg, H. Silver-fir (Abies alba MILL.) neighbors improve water relations of European beech (Fagus sylvatica L.), but do not affect N nutrition. Trees Struct. Funct. 2018, 32, 337–348. [Google Scholar] [CrossRef]
  20. Moukhtar, S.; Bessagnet, B.; Rouil, L.; Simon, V. Monoterpene emissions from Beech (Fagus sylvatica) in a French forest and impact on secondary pollutants formation at regional scale. Atmos. Environ. 2005, 39, 3535–3547. [Google Scholar] [CrossRef]
  21. Moukhtar, S.; Couret, C.; Rouil, L.; Simon, V. Biogenic Volatile Organic Compounds (BVOCs) emissions from Abies alba in a French forest. Sci. Total Environ. 2006, 354, 232–345. [Google Scholar] [CrossRef] [PubMed]
  22. Dindorf, T.; Kuhn, U.; Ganzeveld, L.; Schebeske, G.; Ciccioli, P.; Holzke, C.; Köble, R.; Seufert, G.; Kesselmeier, J. Significant light and temperature dependent monoterpene emissions from European beech (Fagus sylvatica L.) and their potential impact on the European volatile organic compound budget. J. Geophys. Res. 2006, 111. [Google Scholar] [CrossRef] [Green Version]
  23. Pokorska, O.; Dewulf, J.; Amelynck, C.; Schoon, N.; Simpraga, M.; Steppe, K.; Van Langenhove, H. Isoprene and terpenoid emissions from Abies alba: Identification and emission rates under ambient conditions. Atmos. Environ. 2012, 59, 501–508. [Google Scholar] [CrossRef]
  24. Bonn, B.; Magh, R.-K.; Rombach, J.; Kreuzwieser, J. Biogenic isoprenoid emissions under drought stress: Different responses for isoprene and terpenes. Biogeosciences 2019, 16, 4627–4645. [Google Scholar] [CrossRef] [Green Version]
  25. Wu, C.; Pullinen, I.; Andres, S.; Carriero, G.; Fares, S.; Goldbach, H.; Hacker, L.; Kasal, T.; Kiendler-Scharr, A.; Kleist, E.; et al. Impacts of soil moisture on de-novo monoterpene emissions from European beech, Holm oak, Scots pine, and Norway spruce. Biogeosciences 2015, 12, 177–191. [Google Scholar] [CrossRef] [Green Version]
  26. Bonn, B.; Bourtsoukidis, E.; Sun, T.S.; Bingemer, H.; Rondo, L.; Javed, U.; Li, J.; Axinte, R.; Li, X.; Brauers, T.; et al. The link between atmospheric radicals and newly formed particles at a spruce forest site in Germany. Atmos. Chem. Phys. 2014, 14, 10823–10843. [Google Scholar] [CrossRef] [Green Version]
  27. McFiggans, G.; Mentel, T.F.; Wildt, J.; Pullinen, I.; Kang, S.; Kleist, E.; Schmitt, S.; Springer, M.; Tillmann, R.; Wu, C.; et al. Secondary organic aerosol reduced by mixture of atmospheric vapours. Nature 2019, 565, 587–593. [Google Scholar] [CrossRef]
  28. Niinemets, Ü. What are plant-released biogenic volatiles and how they participate in landscape- to global-level processes? In Ecosystem Services from Forest Landscapes: Broadscale Considerations; Perera, A.H., Peterson, U., Pastur, G.M., Iverson, L.R., Eds.; Springer International Publishing: Cham, Switzerland, 2018; pp. 29–56. [Google Scholar] [CrossRef]
  29. Hilmers, T.; Avdagić, A.; Bartkowicz, L.; Bielak, K.; Binder, F.; Bončina, A.; Dobor, L.; Forrester, D.I.; Hobi, M.L.; Ibrahimspahić, A.; et al. The productivity of mixed mountain forests comprised of Fagus sylvatica, Picea abies, and Abies alba across Europe. Forestry 2019, 92, 512–522. [Google Scholar] [CrossRef] [Green Version]
  30. Mina, M.; Rio, M.; Huber, M.O.; Thürig, E.; Rohner, B. The symmetry of competitive interactions in mixed Norway spruce, silver fir and European beech forests. J. Veg. Sci. 2018, 29, 775–787. [Google Scholar] [CrossRef]
  31. IUSS Working Group WRB. World Reference Base for Soil Resources 2014—Update 2015; World Soil Resources Reports 106; Food and Agriculture Organization of the United Nations: Rome, Italy, 2015; p. 203. [Google Scholar]
  32. Birmili, W.; Weinhold, K.; Rasch, F.; Sonntag, A.; Sun, J.; Merkel, M.; Wiedensohler, A.; Bastian, S.; Schladitz, A.; Löschau, G.; et al. Long-term observations of tropospheric particle number size distributions and equivalent black carbon mass concentrations in the German Ultrafine Aerosol Network (GUAN). Earth Syst. Sci. Data 2016, 8, 355–382. [Google Scholar] [CrossRef] [Green Version]
  33. Kändler, G.; Cullmann, D. Der Wald in Baden-Württemberg—Ausgewählte Ergebnisse der dritten Bundeswaldinventur; Forstliche Versuchsanstalt Baden-Württemberg: Freiburg, Germany, 2016; p. 64. [Google Scholar]
  34. Gasparini, P.; Nocetti, M.; Tabacchi, G.; Tosi, V. Biomass Equations and Data for Forest Stands and Shrublands of the Eastern Alps (Trentino, Italy); PNW-GTR-688; General Technical Report: 11/01; USDA Forest Service: Washington, SC, USA, 2006; p. 14.
  35. Lindroth, A.; Mölder, M.; Lagergren, F. Heat storage in forest biomass improves energy balance closure. Biogeosciences 2010, 7, 301–313. [Google Scholar] [CrossRef] [Green Version]
  36. Prata, A.J. A new long-wave formula for estimating downward clear-sky radiation at the surface. Q. J. R. Meteorol. Soc. 1996, 122, 1127–1151. [Google Scholar] [CrossRef]
  37. Wilber, A.C.; Kratz, D.P.; Gupta, S.K. Surface Emissivity Maps for Use in Retrievals of Satellite Longwave Radiation; NASA/TP-1999-209362; National Aeronautics and Space Administration: Langley Research Center Hampton: Hampton, VA, USA, 1999; p. 35.
  38. Glass, S.; Zelinka, S. Moisture relations and physical properties of wood. In Wood Handbook—Wood as An Engineering Material, Ross, R.J., Ed.; United States Department of Agriculture—Forest Service—Forest Products Laboratory: Washington, DC, USA, 2010. [Google Scholar]
  39. Thom, A.S. Momentum, mass and heat exchange of plant communities. In Vegetation and the Atmosphere; Monteith, J.L., Ed.; Academic Press: London, UK; New York, NY, USA, 1975; Volume 1, pp. 57–109. [Google Scholar]
  40. Monteith, J.L. Evaporation and surface temperature. Q. J. R. Meteorol. Soc. 1981, 107, 1–27. [Google Scholar] [CrossRef]
  41. Penman, H.L. Natural evaporation from open water, bare soil and grass. Proc. R. Soc. Lond. Ser. A Math. Phys. Sci. 1948, 193, 120–145. [Google Scholar] [CrossRef] [Green Version]
  42. Penman, H.L.; Long, I.F. Weather in wheat: An essay in mirometeorology. Q. J. R. Meteorol. Soc. 1960, 86, 1650. [Google Scholar] [CrossRef]
  43. Gracia, C.A.; Tello, E.; Sabaté, S.; Bellot, J. GOTILWA: An integrated model of water dynamics and forest growth. In Ecology of Mediterranean Evergreen Oak Forests, 137th ed.; Rodà, F., Retana, J., Gracia, C.A., Bellot, J., Eds.; Springer-Verlag: Berlin, Germany, 1999; pp. 163–179. [Google Scholar]
  44. Haas, E.; Klatt, S.; Fröhlich, A.; Werner, C.; Kiese, R.; Grote, R.; Butterbach-Bahl, K. LandscapeDNDC: A process model for simulation of biosphere-atmosphere-hydrosphere exchange processes at site and regional scale. Landsc. Ecol. 2013, 28, 615–636. [Google Scholar] [CrossRef]
  45. Pereira, A.R.; Pruitt, W.O. Adaptation of the Thornthwaite scheme for estimating daily reference evapotranspiration. Agric. Water Manag. 2004, 66, 251–257. [Google Scholar] [CrossRef]
  46. Thornthwaite, C.W. An approach toward a rational classification of climate. Geogr. Rev. 1948, 38, 55. [Google Scholar] [CrossRef]
  47. Willmott, C.J.; Rowe, C.M.; Mintz, Y. Climatology of the terrestrial seasonal water cycle. Int. J. Climatol. 1985, 5, 589–606. [Google Scholar] [CrossRef]
  48. Burgess, S.S.O.; Adams, M.A.; Turner, N.C.; Beverly, C.R.; Ong, C.K.; Khan, A.A.H.; Bleby, T.M. An improved heat pulse method to measure low and reverse rates of sap flow in woody plants. Tree Physiol. 2001, 21, 589–598. [Google Scholar] [CrossRef]
  49. Kreuzwieser, J.; Scheerer, U.; Rennenberg, H. Metabolic origin of acetaldehyde emitted by poplar (Populus tremula × P. alba) trees. J. Exp. Bot. 1999, 50, 757–765. [Google Scholar] [CrossRef] [Green Version]
  50. Yáñez-Serrano, A.M.; Fasbender, L.; Kreuzwieser, J.; Dubbert, D.; Haberstroh, S.; Lobo-do-Vale, R.; Caldeira, M.C.; Werner, C. Volatile diterpene emission by two Mediterranean Cistaceae shrubs. Sci. Rep. 2018, 8, 6855. [Google Scholar] [CrossRef] [PubMed]
  51. Guenther, A.; Hewitt, C.N.; Erickson, D.; Fall, R.; Geron, C.; Graedel, T.; Harley, P.; Klinger, L.; Lerdau, M.; McKay, W.A.; et al. A global model of natural volatile organic compound emissions. J. Geophys. Res. 1995, 100, 8873–8892. [Google Scholar] [CrossRef]
  52. Guenther, A.; Karl, T.; Harley, P.; Wiedinmyer, C.; Palmer, P.I.; Geron, C. Estimates of global terrestrial isoprene emissions using MEGAN (Model of Emissions of Gases and Aerosols from Nature). Atmos. Chem. Phys. 2006, 6, 3181–3210. [Google Scholar] [CrossRef] [Green Version]
  53. Butler, T.M.; Lawrence, M.G.; Taraborrelli, D.; Lelieveld, J. Multi-day ozone production potential of volatile organic compounds calculated with a tagging approach. Atmos. Environ. 2011, 45, 4082–4090. [Google Scholar] [CrossRef]
  54. Bonn, B.; Kreuzwieser, J.; Sander, F.; Yousefpour, R.; Baggio, T.; Adewale, O. The uncertain role of biogenic VOC for boundary-layer ozone concentration: Example Investigation of Emissions from Two Forest Types with a Box Model. Climate 2017, 5, 78. [Google Scholar] [CrossRef]
  55. Jenkin, M.E.; Young, J.C.; Rickard, A.R. The MCM v3.3.1 degradation scheme for isoprene. Atmos. Chem. Phys. 2015, 15, 11433–11459. [Google Scholar] [CrossRef] [Green Version]
  56. Spracklen, D.V.; Bonn, B.; Carslaw, K.S. Boreal forests, aerosols and the impacts on clouds and climate. Phil. Trans. R. Soc. A Math. Phys. Eng. Sci. 2008, 366, 4613–4626. [Google Scholar] [CrossRef]
  57. Mueller, R.; Trentmann, J.; Träger-Chatterjee, C.; Posselt, R.; Stöckli, R. The Role of the Effective Cloud Albedo for Climate Monitoring and Analysis. Remote Sens. 2011, 3, 2305–2320. [Google Scholar] [CrossRef] [Green Version]
  58. Bonn, B. Biogene Terpenemissionen und Sekundäre Organische Aerosolpartikelbildung: Ein Weg von Nadelwäldern Klimarückkopplungsprozesse zu Steuern. Prof. Thesis, J.W. Goethe Universität Frankfurt, Frankfurt, Germany, 2013. [Google Scholar]
  59. Weligepolage, K.; Gieske, A.S.M.; Su, Z. Effect of spatial resolution on estimating surface albedo: A case study in Speulderbos forest in The Netherlands. Int. J. Appl. Earth Obs. Geoinf. 2013, 23, 18–28. [Google Scholar] [CrossRef]
  60. Otto, J.; Berveiller, D.; Bréon, F.M.; Delpierre, N.; Geppert, G.; Granier, A.; Jans, W.; Knohl, A.; Kuusk, A.; Longdoz, B.; et al. Forest summer albedo is sensitive to species and thinning: How should we account for this in Earth system models? Biogeosciences 2014, 11, 2411–2427. [Google Scholar] [CrossRef] [Green Version]
  61. Holst, T.; Hauser, S.; Kirchgäßner, A.; Matzarakis, A.; Mayer, H.; Schindler, D. Measuring and modelling plant area index in beech stands. Int. J. Biometeorol. 2004, 48, 192–201. [Google Scholar] [CrossRef] [PubMed]
  62. Kutsch, W.L.; Liu, C.; Hörmann, G.; Herbst, M. Spatial heterogeneity of ecosystem carbon fluxes in a broadleaved forest in Northern Germany. Glob. Chang. Biol. 2005, 11, 70–88. [Google Scholar] [CrossRef]
  63. Davi, H.; Gillmann, M.; Ibanez, T.; Cailleret, M.; Bontemps, A.; Fady, B.; Lefebre, F. Diversity of leaf unfolding dynamics among tree species: New insights from a study along an altitudinal gradient. Agric. For. Meteorol. 2011, 151, 1504–1513. [Google Scholar] [CrossRef]
  64. Zirlewagen, D.; von Wilpert, K. Modeling water and ion fluxes in a highly structured, mixed-species stand. For. Ecol. Manag. 2001, 143, 27–37. [Google Scholar] [CrossRef]
  65. Seinfeld, J.H.; Pandis, S.N. Atmospheric Chemistry and Physics—From Air Pollution to Climate Change, 3rd ed.; Wiley: New York, NY, USA, 2016. [Google Scholar]
  66. Holst, T.; Mayer, H. Radiation components of beech stands in Southwest Germany. Meteorol. Zeitschrift 2005, 14, 107–115. [Google Scholar] [CrossRef]
  67. Schmid, H.P.; Grimmond, C.S.; Cropley, F.; Offerle, B.; Su, H.B. Measurements of CO2 and energy fluxes over a mixed hardwood forest in the mid-western United States. Agric. For. Meteorol. 2000, 103, 357–374. [Google Scholar] [CrossRef]
  68. Tiwari, S.; Grote, R.; Churkina, G.; Butler, T. Ozone damage, detoxification and the role of isoprenoids—New impetus for integrated models. Funct. Plant Biol. 2016, 43, 324–326. [Google Scholar] [CrossRef] [Green Version]
  69. Vogt, R.; Bernhofer, C.; Gay, L.W.; Jaeger, L.; Parlow, E. The available energy over a Scots Pine plantation: What’s up for partitioning? Theor. Appl. Climatol. 1996, 53, 23–31. [Google Scholar] [CrossRef]
  70. Oliphant, A.J.; Grimmond, C.S.B.; Zutter, H.N.; Schmid, H.P.; Su, H.-B.; Scott, S.L.; Offerle, B.; Randolph, J.C.; Ehman, J. Heat storage and energy balance fluxes for a temperate deciduous forest. Agric. For. Meteorol. 2004, 126, 185–201. [Google Scholar] [CrossRef]
  71. Leuzinger, S.; Körner, C. Tree species diversity affects canopy leaf temperatures in a mature temperate forest. Agric. For. Meteorol. 2007, 146, 29–37. [Google Scholar] [CrossRef]
  72. Bernard, M.; Boulanger, V.; Dupouey, J.-L.; Laurent, L.; Montpied, P.; Morin, X.; Picard, J.-F.; Saïd, S. Deer browsing promotes Norway spruce at the expense of silver fir in the forest regeneration phase. For. Ecol. Manag. 2017, 400, 269–277. [Google Scholar] [CrossRef]
  73. Kupferschmid, A.D. Selective browsing behaviour of ungulates influences the growth of Abies alba differently depending on forest type. For. Ecol. Manag. 2018, 429, 317–326. [Google Scholar] [CrossRef]
  74. Töchterle, P.; Yang, F.; Rehschuh, S.; Rehschuh, R.; Ruehr, N.K.; Rennenberg, H.; Dannenmann, M. Hydraulic Water Redistribution by Silver Fir (Abies alba Mill.) Occurring under Severe Soil Drought. Forests 2020, 11, 162. [Google Scholar] [CrossRef] [Green Version]
  75. Dani, K.G.S.; Jamie, I.M.; Prentice, I.C.; Atwell, B.J. Species-specific photorespiratory rate, drought tolerance and isoprene emission rate in plants. Plant Signal. Behav. 2015, 10, e990830. [Google Scholar] [CrossRef] [PubMed] [Green Version]
  76. Cáceres, M.D.; Martínez-Vilalta, J.; Coll, L.; Llorens, P.; Casals, P.; Poyatos, R.; Pausas, J.G.; Brotons, L. Coupling a water balance model with forest inventory data to predict drought stress: The role of forest structural changes vs. climate changes. Agric. For. Meteorol. 2015, 213, 77–90. [Google Scholar] [CrossRef] [Green Version]
  77. Vereecken, H.; Weihermüller, L.; Assouline, S.; Šimůnek, J.; Verhoef, A.; Herbst, M.; Archer, N.; Mohanty, B.; Montzka, C.; Vanderborght, J.; et al. Infiltration from the Pedon to Global Grid Scales: An Overview and Outlook for Land Surface Modeling. Vadose Zone J. 2019, 18. [Google Scholar] [CrossRef]
Figure 1. Impacts of beech forests (left) in comparison to mixed beech/fir forests (right) on heat-, water-, and biogenic volatile organic compound (BVOC) exchange (green ellipses) as well as on energy, clouds, and air chemistry (blue ellipses). Arrow thickness indicates if fluxes are higher or lower in comparison between the two investigated states but are not representing a specific quantity. Feedbacks of air chemistry and climate on ecosystems are neglected for clarity reasons. See text for more explanations and references.
Climate 08 00105 g001
Figure 2. The location of the Black Forest within Germany (right) and the area of investigation with locations of the experimental forest sites (Freiamt), as well as observation stations for meteorology (stars), air pollution (Schauinsland, Schwarzwald-Süd), and albedo (Wittnau) (sources: Landesamt für Geoinformation und Landentwicklung Baden Württemberg, www.lgl-bw.de (left) and wikimedia commons (right), with added longitude and latitude).
Climate 08 00105 g002
Figure 3. Albedo of fir (Abies alba) at Wittnau forest during summer 2017 in relation to global radiation (with equilibrium value shown as gray line).
Climate 08 00105 g003
Figure 4. (A) Measured soil temperatures (top, left) with development at BB and BF sites over three days in July 2017 depicted in the inserted graph and (C) differences between sites (bottom, left). (B) Measured soil water content (top, right) and (D) energy storage differences between BB and BF sites (bottom, right).
Climate 08 00105 g004
Figure 5. Mean daily transpiration fluxes of beech (top) and fir (bottom) calculated with the GOTILWA+ and LDNDC for the year 2016 together with averaged measurements from beech and fir trees (in liter per m2 or mm, respectively (left), and simulated latent heat (FET) values (right).
Climate 08 00105 g005
Figure 6. Simulations of transpiration compared with averaged sap-flux measurements from single trees (left) and comparison of simulated evapotranspiration results with estimates based on the Penman-Montheith method (right), separately calculated for beech (top) and fir (bottom) stands.
Climate 08 00105 g006
Figure 7. Calculated radiation effect of tropospheric ozone with an annual mean of 0.28 W m−2 for Black Forest conditions. Upper panel: Pattern of the radiation effect of O3 (FO3) during 2017; bottom panel: Difference between current composition and a 50% beech/fir mixture in W m−2.
Climate 08 00105 g007
Figure 8. Approximated direct radiation effect of secondary organic aerosols (FSOA) for remote Black Forest conditions during 2017. Upper panel: Pattern of FSOA during 2017; bottom panel: Difference between pure beech and a 50% beech/fir mixture in W m−2 (left axis) and the cumulative change for 50% fir admixture (broken line).
Climate 08 00105 g008
Figure 9. Reducing radiation effects of intermixed fir emissions on cloud condensation nuclei (CCN) at remote Black Forest conditions for different supersaturations. Upper panel: Difference between pure beech and a 50% beech/fir mixture in W m−2 for 2016 and 2017 based on a supersaturation value of 0.3 assumed to constitute a limit value under normal conditions; bottom panel: Cumulative change for four different supersaturations.
Climate 08 00105 g009
Table 1. Tree species’ information for the Black Forest used for model estimates on the regional scale. Species and regionally averaged foliage biomass originate from Kändler and Cullmann [33] and the Forest Research Agency, Freiburg (pers. com.). Albedo and emission parameters (standard emission rate ER per dry weight (DW) for isoprene, monoterpenes, and sesquiterpenes, as well as temperature response β) were taken from Bonn et al. [24] (except bold numbers that were determined in this study).
Tree SpeciesArea Fraction [%]Foliage Dry Weight [g/m2]AlbedoERISO [µgC gDW−1 h−1]/β ISO [K−1]ERMT [µgC gDW−1 h−1]/β MT [K−1]ERSQT [µgC gDW−1 h−1]/β SQT [K−1]
Picea abies42.8177 ± 310.090.050.886/0.110.35/0.11
Abies alba18.5174 ± 540.0760.0422.24/0.140.13/0.04
Fagus sylvatica15.3180 ± 140.13049.1/0.310.1/0.11
Pseudotsuga menziesii5.1141 ± 450.090.0080.064/0.260/-
Pinus sylvestris5.077 ± 390.1010.11.4/0.090.28/0.188
Quercus robur/petraea3.1179 ± 830.1862.813.1/0.1210.6/0.11
Betula spp.1.9105 ± 310.16700.7/0.090.31/0.18
Alnus spp.1.2109 ± 920.160.0180.13/0.090.0044/0.145
Carpinus betulus1.2132 ± 1100.170.10.0093/0.090.011/0.145
Tilia spp.1.2110 ± 920.170.0770.51/0.090.0067/0.145
Acer spp.1.2132 ± 490.170.11.8/0.090/ -
Populus spp.1.285 ± 310.1867.33.45/0.090/ -
Table 2. Properties of the pure beech stand (BB) and the mixed beech-fir stand BF sites as measured in 2017 (Da: Arithmetically averaged tree diameter at breast height [cm]. Dg: Tree basal area based on average diameter at breast height [cm]. Ha: Arithmetically averaged tree height [m]. Hg: Tree height of Dg [m]. N: Number of trees. BA: Tree basal area in 1.3 m height [m2]. VOL: Total stem volume [m3. Wtot: Total woody aboveground biomass (tons)). The data were obtained on plots of 300 m2. Hg was calculated with logarithmic best-fit functions based on available height and diameter measurements; VOL and Wtot were estimated from Hg and Dg following Gasparini et al. [34].
Pure Stand (BB)Mixed Stand (BF)
BeechBeechFirTotal
Da24.3 22.9
Dg25.418.632.1
Ha21.2 18.1
Hg22.921.421.4
N ha−1567400200600
BA ha−128.610.819.930.7
VOL ha−126177170247
Wtot ha−11594891139
Table 3. Mean annual radiation contributions based on the year 2017 at Black Forest for the current tree distribution and an increased fir contribution.
Radiation EffectScale *BB Site (L) or Present Mixture (R) [W m−2]Intermixture of 50% Fir into All Current Beech Stands (BF, Scenario) [W m−2]Difference between Present Mixture and Scenario [W m−2]
Fglobal_d·(1α)L105.6112.26.6
FETL−48.0−66.1−18.1
FatmosR299.8299.80.000
FO3 **R0.2840.3080.023
FSOA **R−0.089−0.0870.002
FCCN **R0.7690.749−0.021
ΣFi = −FH ***L357.4345.8−11.6
Tmean (°C) ****L10.47.0−3.4
* L—local, R—regional. ** Radiation fluxes, which are part of the energy that originates from longwave downward radiation (Fatmos) for total budgeting. *** Sum of all energy fluxes. **** Canopy temperature.

