

Conceptual Model of Predictive Safety Management Methodology in Aviation


Faculty of Transport and Traffic Sciences, University of Zagreb, Vukelićeva 4, 10000 Zagreb, Croatia
*
Author to whom correspondence should be addressed.
Aerospace 2023, 10(3), 268; https://doi.org/10.3390/aerospace10030268
Submission received: 6 February 2023
/
Revised: 6 March 2023
/
Accepted: 8 March 2023
/
Published: 10 March 2023
(This article belongs to the Collection Air Transportation—Operations and Management)
Abstract
:Due to the continuous growth of air traffic and the development of aviation systems, the current safety management methodologies should be improved and upgraded. Safety management systems help aviation organizations to manage, maintain and increase safety efficiently. The focus of the research is on the development of the predictive safety management methodology to upgrade current reactive and proactive safety management methodologies and to improve the overall safety level in aviation organizations. Predictive methods are used in various aviation sectors (air navigation services, airport operations, airline operations) for planning purposes but not in the segment of safety management. Available examples of predictive methods were tested and analyzed. Time series decomposition methods were selected as most suited for implementation in aviation safety management. The paper explicitly emphasizes correlations between safety management methodologies in the sample aviation organization. The paper also shows how causal links among organizational and safety performance indicators can be detected, by developing causal models of mutual influences using causal modeling methods, on the sample organization. This research defined steps and tools of the conceptual model of predictive safety management methodology, which enables an organization to identify and mitigate future adverse events.
1. Introduction
The Safety Management System (SMS) is developed to manage aviation safety. As a regulatory requirement, SMS is implemented in every aviation organization. It uses various active tools to manage safety, such as clear safety policies and objectives, hazard identification, risk management, risk mitigation, safety reporting, safety audits, safety investigations, corrective or mitigative safety actions, safety culture, safety education, safety communication, etc. [1,2,3,4,5].
Safety Management Systems has significantly contributed to aviation safety since their first introduction in the field. The International Civil Aviation Organization (ICAO) and aviation organizations worldwide are continuously making efforts to ensure improvements and advances in aviation safety management [6].
ICAO’s global plans define the tools and goals by which ICAO, states and aviation organizations can efficiently manage, maintain and increase safety [6,7,8]. Defined policies and procedures aim to allow the aviation industry to achieve set objectives through prescribed ICAO Standards and Recommended Practices (SARPs). The main documents regulating such policies and procedures are outlined in ICAO Global Aviation Safety Plan (GASP) [6] and Annex 19 to the Convention on International Civil Aviation—Safety Management [9].
Considering the continuous growth of air traffic and the development of the aviation system, the existing safety management methodologies need to be improved and upgraded. Even though the COVID-19 pandemic negatively impacted the aviation industry, the continuous growth of air traffic and the development of aviation systems is still anticipated in the near future. According to the International Air Transport Association (IATA) [10], the recovery in air travel continued in 2022, with an increase of 64.4% in total traffic in 2022 (measured in revenue passenger kilometers or RPKs) compared to 2021. Globally, 2022 air traffic was at 68.5% of pre-pandemic (2019) levels, which shows a speedy recovery and increasing trend from 2020 onwards. Therefore, a full recovery of air traffic is expected in 2024 or 2025. Also, it is important to mention that according to Aviation Safety Network, which released the latest air crash statistics [11], the data on air crash fatalities increased in 2020, in comparison to previous years, despite the Covid-19 pandemic’s negative impact on the aviation industry and enormous decrease in the number of transported passengers during this period. Due to these observations, the existing safety management methodologies should be upgraded.
In most aviation organizations, reactive safety management methodology is used, while some organizations use proactive safety management methodology.
Various examples of the application of predictive methods in aviation can be found in individual segments of the aviation system to conduct safe operations, but none in a segment of safety management. The predictive methodology in the safety management segment is not yet established or clearly defined.
Theoretically, predictive safety management methodology should be based on the notion that safety is best accomplished by identifying a problem before it occurs. Hence, predictive safety management is assumed to relentlessly seek information from various sources that could indicate emerging hazards.
The main objective of this research is a development of a conceptual model of predictive safety management methodology to improve the level of safety in aviation organizations.
The research strives to identify sources of hazard identification, identify correlations between safety management methodologies, identify the link between causation and prediction, identify causal links among organizational and safety performance indicators, an, develop a conceptual model of predictive safety management methodology.
For this research, actual safety data from sample aviation organizations were used to make analyses and draw conclusions.
By developing a conceptual model of predictive safety management methodology, hazards that may arise in the future can be identified. This ensures early response and early definition of mitigation measures.
2. Overview of the Aviation Safety Management
This chapter gives an overview of aviation safety management, including background on aviation safety management systems, essential elements and role of safety performance management, an overview of all safety management methodologies in aviation, and a comprehensive overview of the entire safety management system in aviation.
2.1. Aviation Safety Management System
The SMS is the system used to manage and improve aviation safety [9]. ICAO defines SMS as a tool to manage aviation safety, including organizational structures, accountabilities, policies, and procedures [9]. Effective SMS must have four main components in place to work properly and efficiently. The four main components of SMS are safety policy and objectives, risk management, safety assurance, and safety promotion [1]. According to [1,5,12,13,14], the framework of organizational SMS should include the previously mentioned four components and accompanying twelve elements: management commitment, safety accountability and responsibilities, the appointment of key safety personnel, coordination of emergency response planning, SMS documentation, hazard identification, safety risk assessment and mitigation, safety performance monitoring and measurement, management of change, continuous improvement of the SMS, training and education, and safety communication. The SMS framework is presented in Figure 1.
The second and most relevant component of the SMS is Safety Risk Management (SRM), and it includes hazard (occurrence) identification, risk assessment and risk mitigation [15,16,17,18,19]. The third component of the SMS is called Safety Assurance (SA), and it includes safety performance monitoring and measurement, management of change and continuous improvement of SMS [1]. These components are emphasized specifically because the improvement of aviation safety management systems, as observed through the research, lies within them. The next part explains the role of Safety Performance Management (SPM) more closely.
2.2. Role of Safety Performance Management
Safety performance management monitors an organization’s safety performance and determines whether its activities and processes are working properly to achieve its safety objectives [20,21,22,23,24]. The key to successful safety performance management lies in defining Safety Performance Indicators (SPIs), which monitor and measure an organization’s safety performance [25,26]. Information obtained through SPIs ensures the organization is aware of the current situation and facilitates decision-making to ensure the achievement of organization’s safety objectives. SPIs can be qualitative or quantitative. Quantitative indicators are measured by quantity, and qualitative indicators are descriptive and measured by quality [1]. Therefore, the definition of SPIs should be realistic, relevant, and linked to safety objectives [27,28]. Along with SPIs, Safety Performance Targets (SPTs) are defined to set the target value of the SPIs, representing the desired level of safety performance.
Safety performance management helps the organization define safety objectives, determine top safety risks, monitor progress made toward defined safety objectives, and gather safety data and safety information needed to make informed decisions regarding safety management [29].
Initial SPIs are frequently developed using limited resources of safety data. However, over time, more safety data is going to be available and the organization’s safety performance capabilities would become stronger [1]. Organizations can consider refining the scope of SPIs and SPTs to better align with the desired safety objectives, as their system matures [30,31,32]. Examples of SPIs can include events regarding structural damage to equipment, circumstances in which an accident nearly occurred, operational personnel who became incapacitated or unable to perform their duties safely, operational personnel or members of the aviation community who were fatally or seriously injured, rate of mandatory/voluntary occurrence reports, etc. [1].
2.3. Safety Management Methodologies in Aviation
Up until 2018, the aviation safety management defined three methodologies: reactive, proactive, and predictive [34,35,36]. As per [34], predictive methodology assumed data gathering to identify possible negative future outcomes or events, analyzing system processes and the environment to identify potential future hazards, and initiating mitigative actions. In 2018, ICAO issued the new (fourth) Safety Management Manual (SMM) edition. It defined only two safety management methodologies: reactive and proactive [1], due to a lack of implementing previously defined “predictive methodology” in the segment of safety management. It also redefined what used to be called “predictive methodology” into “predictive analysis”, describing the possibilities of extracting information from historical and current data and using it to predict trends and behavior patterns of the data, but not of “future events”. It is important to emphasize that “predictive methodology” does exist in certain forms, such as real-time flight monitoring systems (e.g., Flight Data Analysis—FDA [37,38]) that gather an enormous amount of flight data and analyze them to detect possible infractions. However, true “predictive methodology” is not yet well established, as it assumes discovering potential and possible hazards (events) based on predictive analyses (forecasts) [5,39,40,41,42]. On the other hand, predictive (forecasting) methods are used in the aviation industry, mostly for planning purposes of future capacity or traffic demand [43], but not in the segment of aviation safety management.
As per [5], the predictive methodology of the SMS can use historical and current safety data, specifically SPIs and SPTs of the organization [44], as the input information to conduct predictive analysis, i.e., forecasts using predictive (forecasting) methods. The obtained results show predicted trends and future behavior patterns of established SPIs in the organization, which gives an improved picture of future safety performance in the organization and detection of future hazards. Furthermore, as per [44], it has been shown how predictive methods (such as trend projection or moving average [45]) can be used to analyze organization’s safety data.
Figure 3 shows processes of reactive, proactive, and predictive safety management methodology in the current form. All three methodologies are closely linked to every element of the ICAO framework, but their most important role is within the element of hazard identification, where they act as a tool to acquire necessary data to identify hazards [5]. Reactive methodology (Figure 3a) gathers data from previous accidents and incidents and learns from their outcomes by establishing causes of the accident or incident (RCA—Root Cause Analysis). Proactive methodology (Figure 3b) uses safety reporting systems and safety performance indicators/targets to gather safety information continuously, to detect and mitigate the potential threats that may consequently trigger the occurrence of accident or incident. Proactive methodology extended safety data input sources and introduced so-called “defenses”, (D1, D2, D3 in the figure) representing regulations, technology, and training, respectively. As already mentioned, predictive methodology (Figure 3c) is not yet well established, as it assumes the detection of future hazards based on predictive analyses (forecasts). Current predictive methodology implies the use of real-time monitoring and analysis systems (e.g., FDA), which extends previous proactive methodology, and introduces another defense layer to the system (D4 in the figure).
2.4. Comprehensive Overview of Aviation Safety Management System
Based on existing regulatory and organizational set-up, Figure 4 shows a comprehensive overview of the current aviation safety management system with all its elements and processes. Safety management system comprises three main areas: safety data collection, safety risk management, and safety documentation. The safety data collection stage includes methodologies and safety database. This part presents the front of every safety management system, where information about hazards is captured and forwarded to the next step of the process. Safety risk management comprises five elements: hazard identification, risk definition, risk assessment, risk mitigation, and the implementation of mitigation measures. Safety documentation implies documenting all activities related to identified hazard, storing them back to the safety database, and updating the safety database which participates in the initial hazard capturing process. It can be observed that safety management system works like a closed loop, where every new hazard, after being processed by the system, returns to the initial phase (safety database) and helps in capturing the next hazard that needs to be processed.
3. Materials and Methods
Considering the continuous growth of air traffic and aviation system development, the current safety management methodologies need to be upgraded. In most aviation organizations, reactive safety management methodology is used, while some organizations use proactive safety management methodology.
As already mentioned, various examples of the application of predictive methods in aviation can be found in individual segments of the aviation system. The purpose is to conduct safe operations, but none in a segment of safety management. The predictive methodology in the safety management segment is not yet established nor it is clearly defined. The objective was to develop a predictive safety management methodology and based on that, develop a new conceptual model of predictive safety management methodology, which would be an upgrade of the existing reactive and proactive safety management. It would ensure a more efficient collection and analysis of safety data, as well as an improved hazard identification process [15].
In addition to conceptualizing predictive safety management methodology, the research aimed to prove the possibility of upgrading the existing methodologies with predictive one and the application of a combination of all methodologies, instead of introducing and applying each one individually. The research is focused on detecting correlations between safety management methodologies and correlations among organizational and safety performance indicators on the sample aviation organizations. It is possible to improve safety management processes in aviation organizations by identifying these correlations, detecting causal factors, and using predictive methods.
The IBM SPSS Statistics is a statistical and predictive analytics software used for the research conducted in this paper [46]. By using this software, all data in the observed datasets were analyzed, optimal forecasting models and forecasts were obtained, and causal model were made presenting causal links among all variables in the observed datasets.
After collecting and analyzing available examples of predicting methods used in various aviation sectors (air navigation services, airport operations, airline operations), the following nine methods were selected to be tested as appropriate for aviation safety management, they are: Holt’s linear trend, Brown’s linear trend, damped trend, simple exponential smoothing, simple seasonal exponential smoothing, Winter’s additive method, Winter’s multiplicative method, moving average method, and ARIMA modeling. Statistical data on the number of flights at a sample airport, in the period from December 2017 to February 2022 (as per Appendix A) served as dataset for all examples of forecasting, using various predictive (forecasting) methods. Software for statistics and predictive analytics, IBM SPSS Statistics, was used to analyze and compare the results of each selected method. A detailed overview of most suitable predictive methods that can be applied in the segment of aviation safety management is presented in Appendix A. The best fits have proven to be simple seasonal exponential smoothing, Winter’s additive method, and moving average method.
4. Results
A conceptual model of predictive safety management methodology in aviation was developed, based on conducted research and obtained results presented in this chapter.
4.1. Using Predictive Methods to Forecast Safety Performance Indicators
Organizations usually measure safety performance indicators such as the number of accidents or incidents, the number of changes, the number of findings related to safety, etc., in relation to time frame (monthly or yearly basis) or to conducted operations (aircraft operations made or flight hours flown).
As per [15,44], the focus of the research was to show how predictive methods (forecasting methods) can be used in safety management to improve current SMS. For this research, actual safety data of an aviation organization were used to show example of the application of predictive methods to forecast safety performance indicators. The sample organization in question is an aviation training organization. Hence, it is certified as the Approved Training Organization (ATO). It owns its own fleet of aircraft. Hence, it is certified as aircraft maintenance and continuing airworthiness organization. It also provides the synthetic flight training. Hence, it is certified as flight simulation training operator. The sample organization applies reactive and proactive safety management methodologies to gather safety information and data, via established safety reporting systems. As a part of the safety assurance component of their SMS, the sample organization has several Safety Performance Indicators (SPIs) established. SPIs are monitored yearly to show the safety performance of the organization (Table 1). Targets for some of the SPIs are set, and for some are not. Table 1 shows examples of those SPIs which have set accompanying targets, i.e., SPI1—Total number of reported occurrences/hazards, SPI2—Number of hazards reported via mandatory occurrence reporting system, SPI11—Number of conducted risk assessments and mitigations, SPI14—Number of held safety review boards, and SPI15—Number of reported occurrences vs. the number of flight hours. The complete dataset and detailed explanation can be found in Appendix B.
Table 2 and Figure 5 show one example of forecasting safety performance indicator behavior (SPI1—Total number of reported occurrences/hazards) in the terms of incline/decline of its values in the future period 2020–2024 based on historical safety data of the organization in the period 2014–2019. The deviation from target area is also shown in the figure (marked green). The predictive method used for this example is called Simple Moving Average (SMA). All other examples of forecasting safety performance indicators can be found in Appendix C.
4.2. Correlation between Safety Management Methodologies
As presented in [15,44], the objective was to show correlations between reactive, proactive, and predictive methodology of safety management to obtain more efficient SMS.
Based on what had been learned so far, safety performance indicators were recognized as very important ingredient of safety management, and were observed in each safety management system separately, i.e., reactive, proactive, and predictive, to present them as a bridge between safety management methodologies (Figure 6) [15].
Figure 6a shows how arbitrary safety performance indicator (SPI—Number of accidents or serious incidents) behaves in reactive safety management system. It can be observed that SPI (not defined as SPI, but as historical data) is monitored and recorded over time. However, the reaction to each occurrence happens after occurrence has already happened. Decision on mitigative and preventive measures are made after conducting investigation and determining causes of event. Figure 6b shows how arbitrary safety performance indicator (SPI—Number of accidents or serious incidents) behaves in proactive safety management system. It can be observed that SPI (defined and established) is monitored and recorded over time with its set safety performance target (SPT) and reaction to each occurrence happens in the moment occurrence happens. Decision on mitigative and preventive measures are made right upon obtaining information on breaching the target area. Figure 6c shows how arbitrary safety performance indicator (SPI—Number of accidents or serious incidents) could behave in predictive safety management system. It can be observed that SPI would be monitored and recorded over time with set safety performance target (SPT). With the use of predictive methods, its behavior could be forecasted for future periods. Reaction to each breach in the future (predicted at time points where occurrence is likely to happen) could be made before breach (occurrence) happens. Decision on mitigative and preventive measures in this case, could be made before breaching the target area.
Example of predictive methodology using predictive methods to predict safety performance indicators’ behavior was presented in Section 4.1. The historical and current safety data, SPIs and SPTs of the sample organization were used as the input information to conduct predictive analysis using the predictive method (simple moving average). Results show SPIs’ future trends and behavior in the organization and provide insight into future safety performance.
While studying all three safety management methodologies, as per Section 2.3, it was observed that there are some differences, but more importantly, some similarities between them. All three methodologies form specific approaches to managing safety issues, i.e., there can be reactive, proactive, or predictive safety management systems depending on the approach to safety management in a specific organization. However, each approach has the same key steps in dealing with safety issues: hazard identification, risk assessment and risk mitigation (Figure 7).
It can be observed (Figure 7) that each methodology of safety management is different in the step of identifying hazards. Every defined safety management methodology needs and uses safety (input) data collected from various sources. The reactive methodology uses safety data from mandatory occurrence reporting (accident/incident reports). Proactive methodology collects data from mandatory and voluntary occurrence reports, and safety audits and safety performance measurement (establishment of SPIs and SPTs). Predictive methodology gathers and uses data from mandatory/voluntary occurrence reports, safety performance measurements (SPIs and SPTs) and data obtained from real-time monitoring systems (e.g., FDA) that extract information from historical and current safety data to predict trends and behavior patterns of upcoming hazards. Hence, safety data obtained from various sources represent the correlation between the three methodologies of safety management. It is also observed that proactive methodology acts as an upgrade for reactive methodology, while predictive methodology acts as an upgrade for proactive methodology.
It can be concluded that input (safety data) from various sources is the common denominator in reactive, proactive, and predictive methodology. It represents the correlation between safety management methodologies.
The research showed how predictive methodology can be expanded with inclusion of predictive methods, as it is shown in the example in Section 4.1, where predictive methods use historical data of previously obtained SPIs and SPTs (which are defined as a part of proactive methodology) and predict the future behavior pattern of the same SPIs (Figure 8).
4.3. Link between Causation and Prediction
Every organization has a set of conditions or resources (personnel, equipment, procedures, etc.) necessary for it to achieve its goal of conducting business in the first place. The goal is to provide services or products to users. Those conditions, i.e., organizational indicators are the first front in successfully completing the service or product for users. Any task to be completed needs to fulfil certain set of conditions, otherwise, it cannot be completed. Every occurrence (adverse event) is mostly related to those initially established values of organizational indicators. Any breach of that value (either if it is too low or too high, or there is a lack of it) will impact the outcome of the desired task. The number of external causes also affects the desired outcome (goal of the organization). However, every organization sets procedures regarding changes or emergencies in the organization (in manuals such as Organization’s Management Manual, Operations Manual, Standard Operating Procedures, Maintenance Manual, etc.) to ensure the successful completion of tasks and ultimately successfully achieved goals. Those procedures are tested and proven to be successful. Otherwise, the organization would not be certified to perform its services; hence, if we assume that keeping organizational indicators and procedures (which include management of change and emergency preparedness) in designated values known to produce successful outcomes, the outcomes (goals) would be achieved. We can detect which area event is bound to occur, based on past (historical) data of an organization, by using predictive analysis to predict safety performance indicators, i.e., future adverse events. By using causal modeling, it is possible to determine the causes of past events. Those same causes can help mitigate the future predicted events, hence, giving the possibility to react in advance and mitigate the areas of concern (Figure 9). The link between causation and prediction is that they both refer to an event caused by a set of factors but at different time points (past and future).
4.4. Predicting Using Predictive Methods and Causal Links among Organizational and Safety Performance Indicators
As per [15,47], by using the software for predictive analytics and causal modeling, predictions and causal links among organizational and safety performance indicators are made and presented in this part.
The dataset of actual organizational and safety performance indicators of a sample organization (see Appendix D) was used to create forecasts and causal models. The sample organization in question is an aviation training organization. Hence, it is certified as the Approved Training Organization (ATO). The sample organization applies reactive and proactive safety management methodologies to gather safety information and data via established safety reporting systems.
Using causal models, specifically detected relations (impacts), it can be learned which indicators (variables) should be modified to obtain the desired safety performance target level in each indicator.
In this part, forecasts for each safety performance indicator are made using the IBM SPSS Statistics software. Forecasting is performed using IBM SPSS options “Forecasting” and “Expert Modeler”. This includes a variety of applicable predictive methods such as nonseasonal exponential smoothing (simple, Holt’s linear trend, Brown’s linear trend, damped trend), seasonal exponential smoothing (simple, Winter’s additive, Winter’s multiplicative), ARIMA modeling, etc. The Expert Modeler finds the optimal method to conduct the forecast according to all given values in the dataset and isolates (or includes) the outliers. Microsoft Excel was also used to emphasize safety performance targets (SPTs) of each safety performance indicator (SPI). Figure 10 shows an example of predicted values of the safety performance indicator (SPI1). Red curve presents observed values of SPI1–Total number of recorded occurrences, named “Number”, purple dotted curves present upper confidence limit (UCL) and lower confidence limit (LCL) of predicted values, and blue curve presents predicted values (forecast) of SPI1. All examples of forecasting safety performance indicators can be found in Appendix E.
As per [15,47], after forecasting, the aim was to establish causal model of defined safety performance indicators (SPIs) to present causal links among organizational and safety performance indicators in the sample organization. Detecting causal links among indicators, provides a possibility to enhance future planning and improve the safety performance of an organization. Figure 11 shows causal model of organizational indicators (OIs) and safety performance indicators (SPIs).
Figure 12a shows an example of impact diagram of causes of safety performance indicator (SPI1), as per [13,45]. There are eleven OIs and SPIs that directly (first lag in the figure) impact (cause) the SPI1 values. Figure 12b shows an example of an impact diagram of the effects of the safety performance indicator (SPI1). There are four SPIs on which SPI1 has a direct (first lag in the figure) impact (effect). All impact diagrams can be found in Appendix E.
As per [15,47], by learning causal links, it is possible to simulate, i.e., make case scenarios of the increase or decrease of certain OIs and SPIs and see how it would affect the initially predicted values of SPIs.
The next part shows how forecasted (predicted) values of SPI1 can be affected due to change (increase/decrease) in values of top causal factors for SPI1, e.g., OI3 and OI9. Figure 13 shows an example of impact diagram of organizational indicator OI3 on safety performance indicator SPI1. Figure 14 shows example of impact diagram of organizational indicator OI9 on safety performance indicator SPI1.
Using causal model, specifically their causal links, it can be learned which indicators (variables) should be modified to obtain the desired level of safety performance target (SPT) in each safety performance indicator (SPI).
Two case scenarios were created by using an IBM SPSS Statistics function, “Apply Temporal Causal Model”, function “Run Scenarios” and top causal factors for SPI1 (e.g., OI3 and OI9), which revealed how OI3 and OI9 affect SPI1 (Figure 15) [15,47].
Figure 15a shows two series of organizational indicator OI3. The blue one is showing observed (initial) values from April 2019 until March 2020. The pink one shows scenario-adjusted values (initial ones increased by 30%) in the same period. Figure 15b shows two series of safety performance indicators SPI1. The blue one is showing observed (initial) values from April 2019 until March 2020. The pink one shows scenario-adjusted values due to the application of causal model links and the increase of OI3. It also shows scenario-forecasted values. It can be observed how scenario SPI1 had changed behavior due to increase of OI3, and, in comparison with initial forecast (green curve) of SPI1 (Figure 10). Figure 15c shows two series of organizational indicator OI9. The blue one shows observed (initial) values from April 2019 until March 2020. The pink one shows scenario-adjusted values (initial ones decreased by 30%) in the same period. Figure 15d shows two series of safety performance indicators SPI1. The blue one shows observed (initial) values from April 2019 until March 2020. The pink one shows scenario-adjusted values due to the application of causal model links and the decrease of OI9. It also shows scenario-forecasted values. It can be observed how scenario SPI1 had changed behavior as well, due to decrease of OI9, and, in comparison with initial forecast (green curve) of SPI1 (Figure 10) [15,47].
It has been shown how detecting causal links among variables, in this case organizational and safety performance indicators, can help determine impacts among them and detect vulnerabilities in the entire system. The examples show how increasing/decreasing values of OIs can improve values of SPIs of the organization, i.e., it can improve safety performance of the organization.
4.5. Conceptual Model of Predictive Safety Management Methodology in Aviation
The objective was to develop a new conceptual model of predictive safety management methodology [15] which would be an upgrade to previous reactive and proactive safety management methodologies.
The research conducted in previous chapters helped establish steps and tools for predictive safety management methodology. This includes obtaining information on the organization’s safety performance for the future period, and through that, detecting future adverse occurrences using predictive and causal modeling methods.
Figure 16 shows an improved aviation safety management system with graphical presentation of safety management methodologies, their correlation, inputs, and tools, i.e., it presents conceptual model of predictive safety management methodology in aviation.
5. Discussion/Conclusions
For over a decade, there have been attempts to improve aviation safety management. Suffice to state that it has improved a great deal since then. As aviation industry progresses, with its ups and downs, general growth trends are recorded. It constantly pushes aviation organizations to improve their safety management, and to keep acceptable levels of safety. Safety performance measurement has been in the focus of the research regarding safety management for a long time. For example, in 2011, O’Conner and others performed examination of safety climate within commercial and military aviation. They recognized that the accident rate in commercial aviation is too low to provide a sufficient measure of safety performance. They suggested the correlation of safety climate with other metrics of safety performance. Luxhoj presented in 2013, a probabilistic model that can quantitatively draw the causal factors of an accident. In 2015, Di Gravio and others developed a statistical model of safety events to predict safety performance by combining a Monte Carlo simulation and an analytical models of historic data interpretation. In 2017, Wang and others created a new safety management approach called evidence-based safety management, by introducing evidence-based practice into safety management. Ioannou and others identified the factors that impact the implementation of a safety management system and the safety performance of the organization, by interviewing different service providers. In 2018, Sun and others proposed a safety performance evaluation model that can quantitatively reflect the state of safety of the civil aviation maintenance department. In 2021, Chen and others presented a systematic establishment process of safety performance indicator system, based on four types of safety performance indicators identified by system and job analysis, event tree analysis, fault tree analysis, bowtie, etc., to assess the operation risk of different departments.
Based on thorough literature review of previous research and analysis of basic methodologies (reactive, proactive, predictive) established in aviation safety management, it has been concluded that most organizations use reactive or proactive safety management methodology. Predictive safety management methodology is not yet well established nor used. Predictive methodology in its current form uses real-time analytics software to analyze large amounts of flight data to detect emerging hazards. However, it does not include predictive (forecasting) methods in the process. On the other hand, predictive (forecasting) methods are used in aviation industry mostly for planning purposes of future capacity or traffic demand, but not in the segment of aviation safety management. Due to the general increase in air transport activities and traffic, including the introduction of new technologies and equipment in the aviation sector, it is necessary, and almost inevitable, to keep track of all changes future aviation brings, including all the future hazards that come along with those changes. This dictates the necessity for an improved safety management that can cope with new and larger scope of future hazards. Hence, developing an improved aviation safety management with predictive upgrade is an imperative to keeping acceptable safety performance levels at every aviation organization.
New insights and possibilities were revealed by thoroughly analyzing safety management methodologies and safety management systems in aviation. The necessary inputs (safety data) and tools used were detected and described by looking closely at each of these safety management methodologies. Reactive methodology is used after event has already happened, and it uses historical data on similar previous events (mandatory occurrence reports) to determine the cause, and to prevent the reoccurrence of the same or similar events. Proactive methodology differs from reactive one, as it tries to detect potential (latent) threats that could lead to serious incidents or accidents. Proactive methodology uses an expanded set of safety information (in comparison to reactive one), i.e., it uses information from mandatory and voluntary safety reporting systems, safety audits and its findings, results from safety surveys, and from information regarding safety performance of the organization, i.e., using tools of safety performance monitoring and measurement (safety performance indicators and targets). In the general description of safety management methodologies, there is strict division of these inputs and tools regarding each methodology, but as it can be observed, these two have an obvious overlap in mandatory occurrence reports, as it represents the input for both methodologies. It has been observed that the proactive safety management methodology acts as an upgrade to the reactive one. By taking the next step in the research, i.e., analysis of existing “predictive” safety management methodology, it has been established, that the existing so-called “predictive” safety management methodology refers to flight data monitoring and analysis systems in real-time. It does not actually implement the use of predictive methods of any kind, but it is “predictive” because by gathering real-time data and analyzing them, it gives the organization insights into future emerging hazards. Hence, by using these methods, the organizations can anticipate, i.e., “predict” upcoming future hazards. It is also observed that existing “predictive” methods, besides using tools of real-time flight data monitoring and analysis, also use information from mandatory and voluntary safety reporting systems, safety audits and gets its findings, results from safety surveys, and from information regarding safety performance of the organization, to make “predictive” analysis. Hence, it can also be observed that the predictive safety management methodology acts as an upgrade to the proactive one.
After establishing correlations between all existing safety management methodologies, the aim was to expand existing “predictive” safety management methodology with introducing usage of predictive and causal modeling methods. The question was in which segment could these methods be of most use, and the answer is in safety performance management. By predicting safety performance indicators with the use of predictive methods, which are proactively monitored in an organization, future hazards can be detected and anticipated. Using causal modeling method as another useful tool, causal relations between safety performance indicators (occurrences) can be detected. It can provide the organization with the tool to mitigate anticipated future events (occurrences).
The research conducted in this paper helped establish steps and tools of predictive safety management methodology, i.e., the safety management that use predictive (forecasting) and causal modeling methods to identify potential and possible hazards in the future, as well as their causal factors which can help define timely and efficient mitigation measures to prevent or restrain emerging hazards turning into adverse events.
Due to conducted research regarding safety management methodologies, new conceptual model of predictive safety management methodology was developed, representing an upgrade to previous reactive and proactive safety management methodologies. It introduces the use of predictive methods and causal modeling methods in the area of safety performance management.
Author Contributions
Conceptualization, D.B.; methodology, D.B.; software, D.B. and S.S.; validation, D.B. and S.S.; formal analysis, D.B.; investigation, D.B.; resources, D.B. and S.S.; data curation, D.B.; writing—original draft preparation, D.B.; writing—review and editing, D.B. and S.S.; visualization, D.B.; supervision, S.S. All authors have read and agreed to the published version of the manuscript.
Funding
This research received no external funding.
Data Availability Statement
Data supporting reported results can be found in this paper, in the Appendix A, Appendix B, Appendix C, Appendix D and Appendix E.
Acknowledgments
Special thanks goes to my mentor during the doctoral study programme, Sanja Steiner, who provided support, knowledge, and supervision during the development of conceptual model of predictive safety management methodology in aviation.
Conflicts of Interest
The authors declare no conflict of interest.
Appendix A
Statistical data on the number of flights were used as dataset for all examples of predictive analysis, using various predictive methods. Table A1 shows statistical data on indicator named “Number of flights” at sample airport, for period from December 2017 to February 2022.

Table A1.
Statistical data on number of flights at a sample airport [15].
Table A1.
Statistical data on number of flights at a sample airport [15].
| Month/Year | Number of Flights | Month/Year | Number of Flights | Month/Year | Number of Flights |
|---|---|---|---|---|---|
| Dec-17 | 2912 | Jun-19 | 4088 | Dec-20 | 1392 |
| Jan-18 | 3039 | Jul-19 | 4356 | Jan-21 | 1403 |
| Feb-18 | 2692 | Aug-19 | 4401 | Feb-21 | 1249 |
| Mar-18 | 3143 | Sep-19 | 4190 | Mar-21 | 1648 |
| Apr-18 | 3384 | Oct-19 | 4045 | Apr-21 | 1840 |
| May-18 | 4023 | Nov-19 | 3344 | May-21 | 2092 |
| Jun-18 | 4124 | Dec-19 | 3351 | Jun-21 | 2426 |
| Jul-18 | 4461 | Jan-20 | 3133 | Jul-21 | 2931 |
| Aug-18 | 4393 | Feb-20 | 2994 | Aug-21 | 3086 |
| Sep-18 | 4176 | Mar-20 | 2310 | Sep-21 | 3401 |
| Oct-18 | 3970 | Apr-20 | 365 | Oct-21 | 3394 |
| Nov-18 | 3223 | May-20 | 572 | Nov-21 | 2917 |
| Dec-18 | 3060 | Jun-20 | 1138 | Dec-21 | 3218 |
| Jan-19 | 3045 | Jul-20 | 2037 | Jan-22 | 2776 |
| Feb-19 | 2826 | Aug-20 | 2246 | Feb-22 | 2637 |
| Mar-19 | 3356 | Sep-20 | 1995 | ||
| Apr-19 | 3776 | Oct-20 | 1772 | ||
| May-19 | 4283 | Nov-20 | 1556 |
An overview of selected predictive methods applicable in aviation safety management are presented in Table A2. As per statistical criterion RMSE (Root Mean Squared Error), the best fit is shown to be simple seasonal exponential smoothing, Winter’s additive method, and moving average method.
Table A2.
Selected predictive methods applicable in aviation safety management [15].
Table A2.
Selected predictive methods applicable in aviation safety management [15].
| Timeline | Holt’s Linear Trend | Brown’s Linear Trend | Damped Trend | Simple Exponential Smoothing | Simple Seasonal Exponential Smoothing | Winter’s Additive Method | Winter’s Multiplicative Method | Moving Average Method | ARIMA Modeling ARIMA (0,1,1) (1,1,0) | |||||||||||||||||||||||||||
|---|---|---|---|---|---|---|---|---|---|---|---|---|---|---|---|---|---|---|---|---|---|---|---|---|---|---|---|---|---|---|---|---|---|---|---|---|
| RMSE = 454.187 | RMSE = 489.109 | RMSE = 437.490 | RMSE = 448.684 | RMSE = 358.459 | RMSE = 373.104 | RMSE = 454.465 | RMSE = 403.010 | RMSE = 430.170 | ||||||||||||||||||||||||||||
| Values | Forecast | LCL | UCL | Values | Forecast | LCL | UCL | Values | Forecast | LCL | UCL | Values | Forecast | LCL | UCL | Values | Forecast | LCL | UCL | Values | Forecast | LCL | UCL | Values | Forecast | LCL | UCL | Values | Forecast | LCL | UCL | Values | Forecast | LCL | UCL | |
| Dec-17 | 2912 | 2912 | 2912 | 2912 | 2912 | 2912 | 2912 | 2912 | 2912 | |||||||||||||||||||||||||||
| Jan-18 | 3039 | 3039 | 3039 | 3039 | 3039 | 3039 | 3039 | 3039 | 3039 | |||||||||||||||||||||||||||
| Feb-18 | 2692 | 2692 | 2692 | 2692 | 2692 | 2692 | 2692 | 2692 | 2692 | |||||||||||||||||||||||||||
| Mar-18 | 3143 | 3143 | 3143 | 3143 | 3143 | 3143 | 3143 | 3143 | 3143 | |||||||||||||||||||||||||||
| Apr-18 | 3384 | 3384 | 3384 | 3384 | 3384 | 3384 | 3384 | 3384 | 3384 | |||||||||||||||||||||||||||
| May-18 | 4023 | 4023 | 4023 | 4023 | 4023 | 4023 | 4023 | 4023 | 4023 | |||||||||||||||||||||||||||
| Jun-18 | 4124 | 4124 | 4124 | 4124 | 4124 | 4124 | 4124 | 4124 | 4124 | |||||||||||||||||||||||||||
| Jul-18 | 4461 | 4461 | 4461 | 4461 | 4461 | 4461 | 4461 | 4461 | 4461 | |||||||||||||||||||||||||||
| Aug-18 | 4393 | 4393 | 4393 | 4393 | 4393 | 4393 | 4393 | 4393 | 4393 | |||||||||||||||||||||||||||
| Sep-18 | 4176 | 4176 | 4176 | 4176 | 4176 | 4176 | 4176 | 4176 | 4176 | |||||||||||||||||||||||||||
| Oct-18 | 3970 | 3970 | 3970 | 3970 | 3970 | 3970 | 3970 | 3970 | 3970 | |||||||||||||||||||||||||||
| Nov-18 | 3223 | 3223 | 3223 | 3223 | 3223 | 3223 | 3223 | 3223 | 3223 | |||||||||||||||||||||||||||
| Dec-18 | 3060 | 3060 | 3060 | 3060 | 3060 | 3060 | 3060 | 3060 | 3060 | |||||||||||||||||||||||||||
| Jan-19 | 3045 | 3045 | 3045 | 3045 | 3045 | 3045 | 3045 | 3045 | 3045 | |||||||||||||||||||||||||||
| Feb-19 | 2826 | 2826 | 2826 | 2826 | 2826 | 2826 | 2826 | 2826 | 2826 | |||||||||||||||||||||||||||
| Mar-19 | 3356 | 3356 | 3356 | 3356 | 3356 | 3356 | 3356 | 3356 | 3356 | |||||||||||||||||||||||||||
| Apr-19 | 3776 | 3776 | 3776 | 3776 | 3776 | 3776 | 3776 | 3776 | 3776 | |||||||||||||||||||||||||||
| May-19 | 4283 | 4283 | 4283 | 4283 | 4283 | 4283 | 4283 | 4283 | 4283 | |||||||||||||||||||||||||||
| Jun-19 | 4088 | 4088 | 4088 | 4088 | 4088 | 4088 | 4088 | 4088 | 4088 | |||||||||||||||||||||||||||
| Jul-19 | 4356 | 4356 | 4356 | 4356 | 4356 | 4356 | 4356 | 4356 | 4356 | |||||||||||||||||||||||||||
| Aug-19 | 4401 | 4401 | 4401 | 4401 | 4401 | 4401 | 4401 | 4401 | 4401 | |||||||||||||||||||||||||||
| Sep-19 | 4190 | 4190 | 4190 | 4190 | 4190 | 4190 | 4190 | 4190 | 4190 | |||||||||||||||||||||||||||
| Oct-19 | 4045 | 4045 | 4045 | 4045 | 4045 | 4045 | 4045 | 4045 | 4045 | |||||||||||||||||||||||||||
| Nov-19 | 3344 | 3344 | 3344 | 3344 | 3344 | 3344 | 3344 | 3344 | 3344 | |||||||||||||||||||||||||||
| Dec-19 | 3351 | 3351 | 3351 | 3351 | 3351 | 3351 | 3351 | 3351 | 3351 | |||||||||||||||||||||||||||
| Jan-20 | 3133 | 3133 | 3133 | 3133 | 3133 | 3133 | 3133 | 3133 | 3133 | |||||||||||||||||||||||||||
| Feb-20 | 2994 | 2994 | 2994 | 2994 | 2994 | 2994 | 2994 | 2994 | 2994 | |||||||||||||||||||||||||||
| Mar-20 | 2310 | 2310 | 2310 | 2310 | 2310 | 2310 | 2310 | 2310 | 2310 | |||||||||||||||||||||||||||
| Apr-20 | 365 | 365 | 365 | 365 | 365 | 365 | 365 | 365 | 365 | |||||||||||||||||||||||||||
| May-20 | 572 | 572 | 572 | 572 | 572 | 572 | 572 | 572 | 572 | |||||||||||||||||||||||||||
| Jun-20 | 1138 | 1138 | 1138 | 1138 | 1138 | 1138 | 1138 | 1138 | 1138 | |||||||||||||||||||||||||||
| Jul-20 | 2037 | 2037 | 2037 | 2037 | 2037 | 2037 | 2037 | 2037 | 2037 | |||||||||||||||||||||||||||
| Aug-20 | 2246 | 2246 | 2246 | 2246 | 2246 | 2246 | 2246 | 2246 | 2246 | |||||||||||||||||||||||||||
| Sep-20 | 1995 | 1995 | 1995 | 1995 | 1995 | 1995 | 1995 | 1995 | 1995 | |||||||||||||||||||||||||||
| Oct-20 | 1772 | 1772 | 1772 | 1772 | 1772 | 1772 | 1772 | 1772 | 1772 | |||||||||||||||||||||||||||
| Nov-20 | 1556 | 1556 | 1556 | 1556 | 1556 | 1556 | 1556 | 1556 | 1556 | |||||||||||||||||||||||||||
| Dec-20 | 1392 | 1392 | 1392 | 1392 | 1392 | 1392 | 1392 | 1392 | 1392 | |||||||||||||||||||||||||||
| Jan-21 | 1403 | 1403 | 1403 | 1403 | 1403 | 1403 | 1403 | 1403 | 1403 | |||||||||||||||||||||||||||
| Feb-21 | 1249 | 1249 | 1249 | 1249 | 1249 | 1249 | 1249 | 1249 | 1249 | |||||||||||||||||||||||||||
| Mar-21 | 1648 | 1648 | 1648 | 1648 | 1648 | 1648 | 1648 | 1648 | 1648 | |||||||||||||||||||||||||||
| Apr-21 | 1840 | 1840 | 1840 | 1840 | 1840 | 1840 | 1840 | 1840 | 1840 | |||||||||||||||||||||||||||
| May-21 | 2092 | 2092 | 2092 | 2092 | 2092 | 2092 | 2092 | 2092 | 2092 | |||||||||||||||||||||||||||
| Jun-21 | 2426 | 2426 | 2426 | 2426 | 2426 | 2426 | 2426 | 2426 | 2426 | |||||||||||||||||||||||||||
| Jul-21 | 2931 | 2931 | 2931 | 2931 | 2931 | 2931 | 2931 | 2931 | 2931 | |||||||||||||||||||||||||||
| Aug-21 | 3086 | 3086 | 3086 | 3086 | 3086 | 3086 | 3086 | 3086 | 3086 | |||||||||||||||||||||||||||
| Sep-21 | 3401 | 3401 | 3401 | 3401 | 3401 | 3401 | 3401 | 3401 | 3401 | |||||||||||||||||||||||||||
| Oct-21 | 3394 | 3394 | 3394 | 3394 | 3394 | 3394 | 3394 | 3394 | 3394 | |||||||||||||||||||||||||||
| Nov-21 | 2917 | 2917 | 2917 | 2917 | 2917 | 2917 | 2917 | 2917 | 2917 | |||||||||||||||||||||||||||
| Dec-21 | 3218 | 3218 | 3218 | 3218 | 3218 | 3218 | 3218 | 3218 | 3218 | |||||||||||||||||||||||||||
| Jan-22 | 2776 | 2776 | 2776 | 2776 | 2776 | 2776 | 2776 | 2776 | 2776 | |||||||||||||||||||||||||||
| Feb-22 | 2637 | 2637 | 2637 | 2637 | 2637 | 2637 | 2637 | 2637 | 2637 | 2637 | 2637 | 2637 | 2637 | 2637 | 2637 | 2637 | 2637 | 2637 | 2637 | 2637 | 2637 | 2637 | 2637 | 2637 | 2637 | 2637 | 2637 | 2637 | 2637 | 2637 | 2637 | 2637 | 2637 | 2637 | 2637 | 2637 |
| Mar-22 | 2606 | 1693 | 3519 | 2448 | 1465 | 3430 | 2588 | 1709 | 3468 | 2637 | 1736 | 3538 | 2772 | 2051 | 3492 | 2558 | 1807 | 3308 | 3278 | 2364 | 4191 | 2708 | 1689 | 3728 | 2524 | 1664 | 3385 | |||||||||
| Apr-22 | 2575 | 1284 | 3867 | 2261 | 485 | 4037 | 2573 | 1143 | 4002 | 2637 | 1363 | 3911 | 2499 | 1480 | 3517 | 2288 | 1226 | 3349 | 3417 | 2090 | 4744 | 2124 | 898 | 3350 | 1286 | −382 | 2954 | |||||||||
| May-22 | 2544 | 962 | 4127 | 2075 | −628 | 4777 | 2568 | 692 | 4443 | 2637 | 1076 | 4198 | 2900 | 1653 | 4147 | 2692 | 1391 | 3993 | 4072 | 2231 | 5914 | 2345 | 942 | 3748 | 1508 | −689 | 3705 | |||||||||
| Jun-22 | 2513 | 685 | 4341 | 1888 | −1858 | 5634 | 2566 | 316 | 4816 | 2637 | 835 | 4439 | 3101 | 1662 | 4541 | 2897 | 1394 | 4399 | 4020 | 1966 | 6073 | 2468 | 908 | 4028 | 1997 | −624 | 4618 | |||||||||
| Jul-22 | 2482 | 438 | 4527 | 1702 | −3193 | 6597 | 2565 | −9 | 5140 | 2637 | 622 | 4652 | 3604 | 1994 | 5213 | 3402 | 1721 | 5083 | 4265 | 1879 | 6652 | 2894 | 1190 | 4598 | 2766 | −219 | 5751 | |||||||||
| Aug-22 | 2451 | 210 | 4692 | 1515 | −4626 | 7656 | 2565 | −299 | 5429 | 2637 | 430 | 4844 | 3689 | 1926 | 5452 | 3490 | 1648 | 5332 | 4178 | 1642 | 6714 | 3135 | 1299 | 4971 | 2957 | −353 | 6267 | |||||||||
| Sep-22 | 2420 | −1 | 4842 | 1329 | −6148 | 8806 | 2565 | −562 | 5692 | 2637 | 253 | 5021 | 3598 | 1694 | 5502 | 3402 | 1411 | 5393 | 3796 | 1291 | 6301 | 3209 | 1249 | 5169 | 2893 | −712 | 6498 | |||||||||
| Oct-22 | 2390 | −201 | 4980 | 1142 | −7755 | 10,040 | 2565 | −805 | 5935 | 2637 | 88 | 5186 | 3453 | 1417 | 5488 | 3260 | 1131 | 5389 | 3554 | 1010 | 6098 | 3162 | 1085 | 5239 | 2742 | −1137 | 6620 | |||||||||
| Nov-22 | 2359 | −390 | 5107 | 956 | −9441 | 11,353 | 2565 | −1031 | 6161 | 2637 | −66 | 5340 | 2917 | 758 | 5076 | 2728 | 468 | 4987 | 2832 | 585 | 5080 | 2632 | 444 | 4820 | 2439 | −1694 | 6573 | |||||||||
| Dec-22 | 2328 | −571 | 5226 | 769 | −11,204 | 12,743 | 2565 | −1244 | 6374 | 2637 | −213 | 5487 | 2944 | 668 | 5220 | 2540 | 157 | 4923 | 2460 | 283 | 4637 | 2554 | 260 | 4848 | 2429 | −1944 | 6802 | |||||||||
| Jan-23 | 2297 | −745 | 5338 | 583 | −13,038 | 14,204 | 2565 | −1446 | 6576 | 2637 | −352 | 5626 | 2837 | 450 | 5224 | 2436 | −65 | 4937 | 2531 | 85 | 4976 | 2333 | −63 | 4728 | 2290 | −2311 | 6891 | |||||||||
| Feb-23 | 2266 | −913 | 5444 | 397 | −14,941 | 15,734 | 2565 | −1638 | 6768 | 2637 | −485 | 5759 | 2637 | 144 | 5130 | 2239 | −374 | 4852 | 2274 | −133 | 4681 | 2201 | −292 | 4694 | 2141 | −2677 | 6959 | |||||||||
| Mar-23 | 2235 | −1075 | 5545 | 210 | −16,911 | 17,331 | 2565 | −1821 | 6952 | 2637 | −612 | 5886 | 2772 | 177 | 5366 | 2160 | −561 | 4881 | 2822 | −339 | 5983 | 2273 | −366 | 4911 | 2371 | −2743 | 7485 | |||||||||
| Apr-23 | 2204 | −1232 | 5640 | 24 | −18,945 | 18,992 | 2565 | −1998 | 7128 | 2637 | −735 | 6009 | 2499 | −194 | 5191 | 1890 | −935 | 4715 | 2936 | −521 | 6393 | 1688 | −1039 | 4416 | 2090 | −3366 | 7546 | |||||||||
| May-23 | 2173 | −1386 | 5732 | −163 | −21,041 | 20,715 | 2565 | −2167 | 7298 | 2637 | −853 | 6127 | 2900 | 113 | 5687 | 2294 | −632 | 5220 | 3492 | −774 | 7759 | 1909 | −905 | 4724 | 2332 | −3446 | 8110 | |||||||||
| Jun-23 | 2142 | −1535 | 5819 | −349 | −23,197 | 22,498 | 2565 | −2331 | 7461 | 2637 | −968 | 6242 | 3101 | 223 | 5980 | 2499 | −524 | 5522 | 3440 | −918 | 7799 | 2032 | −867 | 4931 | 2718 | −3365 | 8800 | |||||||||
| Jul-23 | 2111 | −1681 | 5903 | −536 | −25,411 | 24,339 | 2565 | −2490 | 7620 | 2637 | −1079 | 6353 | 3604 | 636 | 6571 | 3004 | −114 | 6122 | 3643 | −1126 | 8412 | 2458 | −524 | 5439 | 3310 | −3063 | 9683 | |||||||||
| Aug-23 | 2080 | −1824 | 5984 | −722 | −27,682 | 26,237 | 2565 | −2643 | 7774 | 2637 | −1186 | 6460 | 3689 | 636 | 6742 | 3093 | −117 | 6303 | 3561 | −1255 | 8378 | 2699 | −363 | 5761 | 3477 | −3174 | 10,128 | |||||||||
| Sep-23 | 2049 | −1964 | 6062 | −909 | −30,008 | 28,190 | 2565 | −2792 | 7923 | 2637 | −1291 | 6565 | 3598 | 461 | 6735 | 3005 | −295 | 6304 | 3228 | −1295 | 7752 | 2773 | −367 | 5914 | 3666 | −3251 | 10,584 | |||||||||
| Oct-23 | 2018 | −2101 | 6138 | −1095 | −32,387 | 30,197 | 2565 | −2938 | 8068 | 2637 | −1393 | 6667 | 3453 | 234 | 6671 | 2862 | −525 | 6249 | 3016 | −1369 | 7401 | 2726 | −491 | 5944 | 3612 | −3563 | 10,786 | |||||||||
| Nov-23 | 1987 | −2236 | 6210 | −1282 | −34,819 | 32,256 | 2565 | −3079 | 8210 | 2637 | −1493 | 6767 | 2917 | −381 | 6215 | 2330 | −1142 | 5803 | 2398 | −1257 | 6053 | 2196 | −1096 | 5489 | 3192 | −4230 | 10,614 | |||||||||
| Dec-23 | 1956 | −2368 | 6281 | −1468 | −37,303 | 34,366 | 2565 | −3217 | 8348 | 2637 | −1590 | 6864 | 2944 | −432 | 6319 | 2143 | −1413 | 5699 | 2078 | −1265 | 5420 | 2118 | −1248 | 5485 | 3390 | −4271 | 11,052 | |||||||||
| Jan-24 | 1926 | −2498 | 6349 | −1655 | −39,836 | 36,527 | 2565 | −3352 | 8482 | 2637 | −1685 | 6959 | 2837 | −615 | 6288 | 2038 | −1599 | 5676 | 2132 | −1469 | 5733 | 1897 | −1543 | 5336 | 3049 | −4846 | 10,943 | |||||||||
| Feb-24 | 1895 | −2626 | 6416 | −1841 | −42,419 | 38,736 | 2565 | −3484 | 8614 | 2637 | −1778 | 7052 | 2637 | −889 | 6163 | 1842 | −1876 | 5560 | 1912 | −1492 | 5316 | 1765 | −1745 | 5275 | 2906 | −5214 | 11,027 | |||||||||
| Mar-24 | 1864 | −2753 | 6480 | −2028 | −45,049 | 40,994 | 2565 | −3613 | 8743 | 2637 | −1869 | 7143 | 2772 | −827 | 6370 | 1762 | −2034 | 5559 | 2366 | −2011 | 6742 | 1837 | −1781 | 5454 | 2907 | −5611 | 11,425 | |||||||||
| Apr-24 | 1833 | −2877 | 6543 | −2214 | −47,727 | 43,299 | 2565 | −3739 | 8869 | 2637 | −1958 | 7232 | 2499 | −1171 | 6168 | 2330 | −1142 | 5803 | 2455 | −2250 | 7160 | 1252 | −2433 | 4938 | 1985 | −7050 | 11,021 | |||||||||
| May-24 | 1802 | −3000 | 6604 | −2401 | −50,451 | 45,650 | 2565 | −3863 | 8993 | 2637 | −2045 | 7319 | 2900 | −840 | 6639 | 2143 | −1413 | 5699 | 2912 | −2834 | 8658 | 1473 | −2279 | 5226 | 2214 | −7312 | 11,739 | |||||||||
| Jun-24 | 1771 | −3122 | 6664 | −2587 | −53,221 | 48,046 | 2565 | −3985 | 9115 | 2637 | −2131 | 7405 | 3101 | −707 | 6909 | 2038 | −1599 | 5676 | 2861 | −2951 | 8673 | 1596 | −2223 | 5415 | 2669 | −7322 | 12,660 | |||||||||
| Jul-24 | 1740 | −3242 | 6722 | −2774 | −56,035 | 50,488 | 2565 | −4104 | 9234 | 2637 | −2216 | 7490 | 3604 | −272 | 7479 | 1842 | −1876 | 5560 | 3021 | −3288 | 9329 | 2022 | −1862 | 5906 | 3379 | −7057 | 13,815 | |||||||||
| Aug-24 | 1709 | −3360 | 6778 | −2960 | −58,893 | 52,973 | 2565 | −4221 | 9351 | 2637 | −2299 | 7573 | 3689 | −253 | 7631 | 1762 | −2034 | 5559 | 2944 | −3378 | 9266 | 2263 | −1685 | 6211 | 3562 | −7301 | 14,425 | |||||||||
| Sep-24 | 1678 | −3477 | 6834 | −3147 | −61,794 | 55,501 | 2565 | −4336 | 9467 | 2637 | −2380 | 7654 | 3598 | −409 | 7605 | 2607 | −1633 | 6847 | 2661 | −3226 | 8547 | 2337 | −1674 | 6349 | 3582 | −7691 | 14,856 | |||||||||
| Oct-24 | 1647 | −3593 | 6888 | −3333 | −64,738 | 58,072 | 2565 | −4450 | 9580 | 2637 | −2461 | 7735 | 3453 | −618 | 7524 | 2465 | −1845 | 6775 | 2478 | −3177 | 8133 | 2290 | −1784 | 6365 | 3463 | −8207 | 15,132 | |||||||||
| Nov-24 | 1616 | −3708 | 6941 | −3520 | −67,724 | 60,685 | 2565 | −4561 | 9691 | 2637 | −2540 | 7814 | 2917 | −1217 | 7051 | 1933 | −2446 | 6312 | 1964 | −2691 | 6619 | 1760 | −2376 | 5897 | 3122 | −8931 | 15,174 | |||||||||
| Dec-24 | 1585 | −3822 | 6992 | −3706 | −70,751 | 63,339 | 2565 | −4671 | 9801 | 2637 | −2618 | 7892 | 2944 | −1252 | 7140 | 1745 | −2702 | 6192 | 1696 | −2500 | 5891 | 1683 | −2515 | 5880 | 3180 | −9244 | 15,604 | |||||||||
| Jan-25 | 1554 | −3934 | 7043 | −3893 | −73,819 | 66,034 | 2565 | −4779 | 9909 | 2637 | −2694 | 7968 | 2837 | −1421 | 7094 | 1641 | −2874 | 6155 | 1734 | −2733 | 6201 | 1461 | −2797 | 5718 | 2974 | −9810 | 15,759 | |||||||||
| Feb-25 | 1523 | −4046 | 7093 | −4079 | −76,927 | 68,769 | 2565 | −4886 | 10,016 | 2637 | −2770 | 8044 | 2637 | −1681 | 6955 | 1444 | −3136 | 6025 | 1549 | −2620 | 5718 | 1329 | −2988 | 5646 | 2828 | −10,308 | 15,963 | |||||||||
 Holt’s linear trend |  Brown’s linear trend |  Damped trend | ||||||||||||||||||||||||||||||||||
 Simple exponential smoothing |  Simple seasonal exponential smoothing |  Winter’s additive method | ||||||||||||||||||||||||||||||||||
 Winter’s multiplicative method |  Moving average method |  ARIMA modeling ARIMA (0,1,1) (1,1,0) | ||||||||||||||||||||||||||||||||||
Appendix B
As a part of the Safety Assurance component, the sample organization has established several Safety Performance Indicators (SPIs). SPIs are monitored yearly to show the safety performance of the organization. Targets are set for some of the SPIs, while for some targets are not set. The safety data and SPIs of the sample organization SMS are presented and elaborated in the following table.
Table A3 shows the sample organization’s actual safety data and safety performance indicators (SPIs) from 2014 to 2019. There are 15 defined SPIs: The total number of reported hazards (SPI1), the number of hazards/reported via mandatory occurrence reporting system (SPI2), the number of hazards reported via voluntary occurrence reporting (SPI3), the number of hazards reported as changes (SPI4), the number of hazards reported as internal changes (SPI5), number of hazards reported as an external changes (SPI6), number of hazards reported in Department 1 of an organization (SPI7), the number of hazards reported at Department 2 of an organization (SPI8), the number of hazards reported at Department 3 of an organization (SPI9), Number of hazards reported at the Department 4 of an organization (SPI10), the number of conducted risk assessments and mitigations (SPI11), the number of registered unacceptable risk indexes (SPI12), the number of registered tolerable risk indexes (SPI13), the number of held safety review boards (SPI14), and the number of reported occurrences vs. the number of flight hours (SPI15). The last two rows show target areas (SPTs) for five SPIs: SPI1, SPI2, SPI11, SPI14 and SPI15 [15,44].
| Year | SPI1 | SPI2 | SPI3 | SPI4 | SPI5 | SPI6 | SPI7 | SPI8 | SPI19 | SPI10 | SPI11 | SPI12 | SPI13 | SPI14 | SPI15 |
|---|---|---|---|---|---|---|---|---|---|---|---|---|---|---|---|
| 2014 | 29 | 7 | 14 | 8 | 4 | 4 | 28 | 1 | 4 | 0 | 25 | 8 | 16 | 4 | 0.012 |
| 2015 | 22 | 2 | 4 | 16 | 11 | 5 | 18 | 2 | 5 | 2 | 14 | 4 | 7 | 4 | 0.017 |
| 2016 | 34 | 9 | 11 | 14 | 9 | 5 | 34 | 2 | 1 | 1 | 24 | 7 | 14 | 6 | 0.019 |
| 2017 | 21 | 3 | 5 | 13 | 10 | 3 | 20 | 0 | 2 | 1 | 13 | 1 | 12 | 3 | 0.012 |
| 2018 | 43 | 5 | 5 | 33 | 12 | 21 | 36 | 4 | 5 | 9 | 16 | 3 | 13 | 2 | 0.020 |
| 2019 | 70 | 4 | 3 | 64 | 16 | 48 | 57 | 7 | 19 | 18 | 45 | 3 | 42 | 2 | 0.030 |
| SPT | 10 | 2 | / | / | / | / | / | / | / | / | 10 | / | / | 5 | 0.002 |
| ⇓ | ⇓ | ⇓ | ⇓ | ⇓ | ⇓ | ⇓ | ⇓ | ⇓ | ⇓ | ⇓ | ⇓ | ⇓ | ⇑ | ⇓ |
Appendix C
Table A4 and Figure A1 show forecast of SPI2 behavior in the terms of incline/decline of its values in the future period from 2020 to 2024 based on historical safety data of the organization in the period from 2014 to 2019 [15,44].
| Year | Values (SPI2) | Forecast | Lower Limit of Reliability | Upper Limit of Reliability |
|---|---|---|---|---|
| 2014 | 7 | |||
| 2015 | 2 | |||
| 2016 | 9 | |||
| 2017 | 3 | |||
| 2018 | 5 | |||
| 2019 | 4 | 4 | 4 | 4 |
| 2020 | 7 | 4 | 10 | |
| 2021 | 2 | 0 | 5 | |
| 2022 | 7 | 4 | 10 | |
| 2023 | 2 | 0 | 5 | |
| 2024 | 7 | 4 | 10 |

Table A5 and Figure A2 show forecast of SPI11 behavior in the terms of incline/decline of its values in the future period from 2020 to 2024 based on historical safety data of the organization in the period from 2014 to 2019 [15,44].
| Year | Values (SPI11) | Forecast | Lower Limit of Reliability | Upper Limit of Reliability |
|---|---|---|---|---|
| 2014 | 25 | |||
| 2015 | 14 | |||
| 2016 | 24 | |||
| 2017 | 13 | |||
| 2018 | 16 | |||
| 2019 | 45 | 45 | 45 | 45 |
| 2020 | 38 | 13 | 63 | |
| 2021 | 42 | 14 | 69 | |
| 2022 | 45 | 15 | 76 | |
| 2023 | 49 | 16 | 82 | |
| 2024 | 53 | 17 | 88 |

Table A6 and Figure A3 show forecast of SPI14 behavior in the terms of incline/decline of its values in the future period from 2020 to 2024 based on historical safety data of the organization in the period from 2014 to 2019 [15,44].
| Year | Values (SPI14) | Forecast | Lower Limit of Reliability | Upper Limit of Reliability |
|---|---|---|---|---|
| 2014 | 4 | |||
| 2015 | 4 | |||
| 2016 | 6 | |||
| 2017 | 3 | |||
| 2018 | 2 | |||
| 2019 | 2 | 2 | 2 | 2 |
| 2020 | 1 | 0 | 4 | |
| 2021 | 0 | 0 | 3 | |
| 2022 | 0 | 0 | 3 | |
| 2023 | 0 | 0 | 3 | |
| 2024 | 0 | 0 | 3 |

Table A7 and Figure A4 show forecast of SPI15 behavior in the terms of incline/decline of its values in the future period from 2020 to 2024 based on historical safety data of the organization in the period from 2014 to 2019 [15,44].
| Year | Values (SPI15) | Forecast | Lower Limit of Reliability | Upper Limit of Reliability |
|---|---|---|---|---|
| 2014 | 0.012 | |||
| 2015 | 0.017 | |||
| 2016 | 0.019 | |||
| 2017 | 0.012 | |||
| 2018 | 0.020 | |||
| 2019 | 0.030 | 0.030 | 0.030 | 0.030 |
| 2020 | 0.027 | 0.019 | 0.035 | |
| 2021 | 0.029 | 0.021 | 0.038 | |
| 2022 | 0.032 | 0.024 | 0.040 | |
| 2023 | 0.034 | 0.026 | 0.043 | |
| 2024 | 0.037 | 0.029 | 0.045 |

Appendix D
Dataset is representing actual data on organizational and safety performance indicators of the sample organization. The safety management methodologies used in the sample organization, in terms of collecting safety data, are reactive and proactive. The sample organization has defined several safety performance indicators (SPIs) and established corresponding safety performance targets (SPTs). The SPIs are monitored on monthly basis. The list of organizational indicators (OIs), safety performance indicators (SPIs) and safety performance targets (SPTs) are presented in the following Table A8 [15,47].
Table A8.
List of organizational indicators (OIs), safety performance indicators (SPIs) and safety performance targets (SPTs) in the sample organization [15,47].
| Mark | Name of an Indicator | Targets (SPTs) |
|---|---|---|
| OI1 | Flight hours (aircraft) | / |
| OI2 | Flight hours (simulator) | / |
| OI3 | Total flight hours | / |
| OI4 | Number of used aircraft | / |
| OI5 | Number of used simulators | / |
| OI6 | Number of used aircraft/simulators | / |
| OI7 | Number of students in training on aircraft | / |
| OI8 | Number of active instructors on aircraft | / |
| OI9 | Number of students in training on simulator | / |
| OI10 | Number of active instructors on simulator | / |
| OI11 | Total number of students in training | / |
| OI12 | Total number of active instructors | / |
| SPI1 | Total number of recorded occurrences | ≤2 |
| SPI2 | Number of reported MOR occurrences | ≤1 |
| SPI3 | Number of recorded changes | ≤2 |
| SPI4 | Number of conducted risk assessments | ≤2 |
| SPI5 | Number of detected unacceptable risks | ≤1 |
| SPI6 | Number of held safety review boards | ≥1 |
| SPI7 | Number of conducted audits/inspections | ≥1 |
| SPI8 | Number of determined findings | ≤4 |
Table A9 shows the dataset of organizational indicators (OIs) and safety performance indicators (SPIs) in the sample organization, from January 2014 to March 2020 [15,47]. A dataset is composed of monthly entries for twelve Organizational Indicators (OIs) and eight Safety Performance Indicators (SPIs). The dataset contains 75 entries.
Table A9.
Dataset of organizational indicators (OIs) and safety performance indicators (SPIs) in the period from January 2014 to March 2020 [15].
Table A9.
Dataset of organizational indicators (OIs) and safety performance indicators (SPIs) in the period from January 2014 to March 2020 [15].
| Month | OI1 | OI2 | OI3 | OI4 | OI5 | OI6 | OI7 | OI8 | OI19 | OI10 | OI11 | OI12 | SPI1 | SPI2 | SPI3 | SPI4 | SPI5 | SPI6 | SPI7 | SPI8 |
|---|---|---|---|---|---|---|---|---|---|---|---|---|---|---|---|---|---|---|---|---|
| Jan-14 | 31.58 | 10.92 | 42.50 | 4 | 1 | 5 | 9 | 4 | 1 | 1 | 10 | 5 | 1 | 0 | 1 | 0 | 0 | 0 | 0 | 0 |
| Feb-14 | 12.42 | 10.50 | 22.92 | 3 | 1 | 4 | 5 | 4 | 2 | 2 | 7 | 5 | 0 | 0 | 0 | 0 | 0 | 0 | 0 | 0 |
| Mar-14 | 88.67 | 17.83 | 106.50 | 3 | 1 | 4 | 19 | 8 | 3 | 2 | 22 | 10 | 2 | 1 | 1 | 1 | 0 | 0 | 0 | 0 |
| Apr-14 | 63.67 | 0.00 | 63.67 | 5 | 0 | 5 | 20 | 7 | 0 | 0 | 20 | 7 | 1 | 0 | 1 | 0 | 0 | 0 | 0 | 0 |
| May-14 | 323.92 | 63.75 | 387.67 | 7 | 1 | 8 | 43 | 13 | 9 | 3 | 52 | 15 | 7 | 0 | 1 | 15 | 6 | 0 | 2 | 10 |
| Jun-14 | 159.17 | 4.50 | 163.67 | 7 | 1 | 8 | 29 | 11 | 3 | 1 | 32 | 12 | 0 | 0 | 0 | 0 | 0 | 0 | 1 | 0 |
| Jul-14 | 438.50 | 0.00 | 438.50 | 8 | 0 | 8 | 47 | 12 | 0 | 0 | 47 | 12 | 0 | 0 | 0 | 0 | 0 | 1 | 1 | 6 |
| Aug-14 | 612.58 | 0.00 | 612.58 | 8 | 0 | 8 | 45 | 10 | 0 | 0 | 45 | 10 | 0 | 0 | 0 | 0 | 0 | 0 | 1 | 2 |
| Sep-14 | 390.75 | 0.00 | 390.75 | 8 | 0 | 8 | 33 | 11 | 0 | 0 | 33 | 11 | 5 | 0 | 0 | 7 | 3 | 1 | 1 | 15 |
| Oct-14 | 278.33 | 0.00 | 278.33 | 7 | 0 | 7 | 35 | 10 | 0 | 0 | 35 | 10 | 1 | 0 | 0 | 3 | 0 | 1 | 1 | 0 |
| Nov-14 | 59.33 | 0.00 | 59.33 | 4 | 0 | 4 | 19 | 5 | 0 | 0 | 19 | 5 | 0 | 0 | 0 | 0 | 0 | 0 | 0 | 0 |
| Dec-14 | 24.75 | 0.00 | 24.75 | 3 | 0 | 3 | 9 | 4 | 0 | 0 | 9 | 4 | 2 | 0 | 2 | 14 | 10 | 1 | 3 | 6 |
| Jan-15 | 31.58 | 0.00 | 31.58 | 3 | 0 | 3 | 15 | 6 | 0 | 0 | 15 | 6 | 1 | 0 | 1 | 0 | 0 | 0 | 0 | 0 |
| Feb-15 | 3.83 | 0.00 | 3.83 | 2 | 0 | 2 | 3 | 2 | 0 | 0 | 3 | 2 | 0 | 0 | 0 | 0 | 0 | 0 | 0 | 0 |
| Mar-15 | 46.83 | 0.00 | 46.83 | 3 | 0 | 3 | 17 | 5 | 0 | 0 | 17 | 5 | 5 | 0 | 4 | 3 | 0 | 0 | 0 | 0 |
| Apr-15 | 50.67 | 0.00 | 50.67 | 5 | 0 | 5 | 17 | 6 | 0 | 0 | 17 | 6 | 6 | 0 | 2 | 10 | 0 | 2 | 0 | 0 |
| May-15 | 219.42 | 0.00 | 219.42 | 7 | 0 | 7 | 37 | 9 | 0 | 0 | 37 | 9 | 1 | 0 | 0 | 1 | 0 | 0 | 1 | 0 |
| Jun-15 | 18.08 | 0.00 | 18.08 | 4 | 0 | 4 | 9 | 6 | 0 | 0 | 9 | 6 | 0 | 0 | 0 | 0 | 0 | 0 | 2 | 6 |
| Jul-15 | 142.58 | 0.00 | 142.58 | 7 | 0 | 7 | 30 | 8 | 0 | 0 | 30 | 8 | 1 | 0 | 1 | 5 | 1 | 1 | 0 | 0 |
| Aug-15 | 168.25 | 181.08 | 349.33 | 6 | 1 | 7 | 22 | 7 | 13 | 3 | 35 | 8 | 0 | 0 | 0 | 0 | 0 | 0 | 1 | 4 |
| Sep-15 | 267.17 | 153.50 | 420.67 | 7 | 1 | 8 | 40 | 7 | 18 | 5 | 58 | 9 | 2 | 1 | 1 | 3 | 0 | 1 | 1 | 4 |
| Oct-15 | 132.42 | 83.67 | 216.08 | 8 | 1 | 9 | 34 | 7 | 18 | 5 | 52 | 10 | 1 | 1 | 0 | 1 | 1 | 0 | 0 | 0 |
| Nov-15 | 150.58 | 60.83 | 211.42 | 7 | 1 | 8 | 35 | 7 | 12 | 4 | 47 | 8 | 3 | 0 | 2 | 5 | 0 | 0 | 1 | 0 |
| Dec-15 | 29.00 | 16.42 | 45.42 | 4 | 1 | 5 | 12 | 6 | 4 | 4 | 16 | 8 | 2 | 0 | 2 | 0 | 0 | 0 | 1 | 9 |
| Jan-16 | 28.83 | 27.00 | 55.83 | 3 | 1 | 4 | 11 | 6 | 8 | 5 | 19 | 7 | 2 | 0 | 1 | 1 | 0 | 0 | 0 | 0 |
| Feb-16 | 19.75 | 19.00 | 38.75 | 2 | 1 | 3 | 5 | 2 | 4 | 2 | 9 | 4 | 1 | 0 | 1 | 0 | 0 | 0 | 2 | 1 |
| Mar-16 | 98.50 | 1.50 | 100.00 | 5 | 1 | 6 | 31 | 8 | 2 | 1 | 33 | 8 | 0 | 0 | 0 | 0 | 0 | 0 | 0 | 0 |
| Apr-16 | 154.92 | 18.50 | 173.42 | 5 | 1 | 6 | 31 | 11 | 7 | 3 | 38 | 11 | 6 | 3 | 3 | 5 | 2 | 1 | 3 | 7 |
| May-16 | 261.17 | 57.25 | 318.42 | 8 | 1 | 9 | 38 | 12 | 14 | 4 | 52 | 12 | 3 | 0 | 2 | 1 | 0 | 1 | 1 | 2 |
| Jun-16 | 130.53 | 48.67 | 179.20 | 8 | 1 | 9 | 33 | 11 | 11 | 5 | 44 | 13 | 4 | 2 | 1 | 3 | 0 | 0 | 2 | 4 |
| Jul-16 | 252.67 | 93.00 | 345.67 | 7 | 1 | 8 | 35 | 12 | 12 | 3 | 47 | 12 | 8 | 1 | 2 | 7 | 1 | 1 | 2 | 1 |
| Aug-16 | 282.33 | 91.83 | 374.17 | 7 | 1 | 8 | 35 | 14 | 12 | 4 | 47 | 15 | 6 | 1 | 3 | 3 | 2 | 0 | 1 | 1 |
| Sep-16 | 340.67 | 128.67 | 469.33 | 6 | 1 | 7 | 35 | 14 | 12 | 3 | 47 | 14 | 1 | 0 | 0 | 1 | 0 | 1 | 1 | 10 |
| Oct-16 | 115.00 | 21.25 | 136.25 | 6 | 1 | 7 | 23 | 11 | 9 | 3 | 32 | 12 | 3 | 2 | 1 | 3 | 1 | 0 | 2 | 4 |
| Nov-16 | 40.92 | 47.50 | 88.42 | 3 | 1 | 4 | 14 | 7 | 8 | 4 | 22 | 9 | 0 | 0 | 0 | 0 | 0 | 1 | 1 | 2 |
| Dec-16 | 29.08 | 0.00 | 29.08 | 4 | 0 | 4 | 12 | 7 | 0 | 0 | 12 | 7 | 0 | 0 | 0 | 0 | 0 | 1 | 1 | 0 |
| Jan-17 | 0.00 | 6.00 | 6.00 | 0 | 1 | 1 | 0 | 0 | 2 | 2 | 2 | 2 | 0 | 0 | 0 | 0 | 0 | 0 | 1 | 0 |
| Feb-17 | 9.08 | 5.50 | 14.58 | 2 | 1 | 3 | 4 | 2 | 5 | 3 | 9 | 4 | 0 | 0 | 0 | 0 | 0 | 0 | 3 | 9 |
| Mar-17 | 152.17 | 35.92 | 188.08 | 4 | 1 | 5 | 24 | 8 | 7 | 3 | 31 | 8 | 1 | 0 | 1 | 0 | 0 | 1 | 2 | 12 |
| Apr-17 | 80.67 | 55.83 | 136.50 | 5 | 1 | 6 | 16 | 8 | 5 | 3 | 21 | 9 | 3 | 0 | 3 | 3 | 0 | 0 | 3 | 12 |
| May-17 | 187.83 | 106.42 | 294.25 | 5 | 1 | 6 | 28 | 9 | 15 | 3 | 43 | 9 | 2 | 0 | 2 | 1 | 0 | 0 | 2 | 1 |
| Jun-17 | 87.00 | 35.67 | 122.67 | 5 | 1 | 6 | 28 | 10 | 8 | 4 | 36 | 10 | 1 | 1 | 0 | 1 | 0 | 1 | 2 | 1 |
| Jul-17 | 193.58 | 88.00 | 281.58 | 5 | 1 | 6 | 29 | 11 | 10 | 4 | 39 | 13 | 0 | 0 | 0 | 0 | 0 | 0 | 1 | 1 |
| Aug-17 | 292.58 | 35.58 | 328.17 | 5 | 1 | 6 | 32 | 9 | 5 | 3 | 37 | 9 | 5 | 1 | 2 | 3 | 0 | 0 | 1 | 1 |
| Sep-17 | 188.25 | 57.17 | 245.42 | 5 | 1 | 6 | 29 | 9 | 6 | 3 | 35 | 10 | 0 | 0 | 0 | 0 | 0 | 0 | 2 | 10 |
| Oct-17 | 332.25 | 124.33 | 456.58 | 7 | 1 | 8 | 59 | 11 | 32 | 4 | 91 | 12 | 6 | 1 | 4 | 3 | 1 | 1 | 3 | 12 |
| Nov-17 | 166.33 | 35.50 | 201.83 | 7 | 1 | 8 | 46 | 10 | 14 | 3 | 60 | 10 | 2 | 0 | 0 | 2 | 0 | 0 | 2 | 4 |
| Dec-17 | 94.92 | 48.00 | 142.92 | 7 | 1 | 8 | 26 | 7 | 12 | 5 | 38 | 8 | 1 | 0 | 1 | 0 | 0 | 0 | 0 | 0 |
| Jan-18 | 123.22 | 62.75 | 185.97 | 5 | 1 | 6 | 17 | 6 | 15 | 4 | 32 | 7 | 0 | 0 | 0 | 0 | 0 | 0 | 1 | 1 |
| Feb-18 | 66.33 | 53.17 | 119.50 | 3 | 1 | 4 | 12 | 7 | 14 | 5 | 26 | 7 | 1 | 0 | 1 | 0 | 0 | 1 | 3 | 12 |
| Mar-18 | 29.58 | 2.67 | 32.25 | 5 | 1 | 6 | 24 | 6 | 2 | 2 | 26 | 6 | 6 | 1 | 4 | 7 | 4 | 0 | 2 | 2 |
| Apr-18 | 145.58 | 22.08 | 167.67 | 5 | 1 | 6 | 31 | 8 | 6 | 5 | 37 | 10 | 6 | 1 | 3 | 5 | 0 | 0 | 2 | 5 |
| May-18 | 161.33 | 63.50 | 224.83 | 5 | 1 | 6 | 35 | 8 | 8 | 4 | 43 | 8 | 5 | 1 | 4 | 3 | 0 | 0 | 2 | 1 |
| Jun-18 | 95.92 | 29.55 | 125.47 | 5 | 1 | 6 | 23 | 6 | 6 | 2 | 29 | 6 | 3 | 0 | 1 | 9 | 4 | 1 | 2 | 1 |
| Jul-18 | 324.83 | 107.70 | 432.53 | 6 | 1 | 7 | 33 | 8 | 12 | 3 | 45 | 8 | 5 | 1 | 4 | 0 | 0 | 1 | 1 | 1 |
| Aug-18 | 467.05 | 43.67 | 510.72 | 6 | 1 | 7 | 37 | 9 | 7 | 4 | 44 | 9 | 8 | 0 | 8 | 1 | 0 | 0 | 1 | 0 |
| Sep-18 | 355.42 | 137.48 | 492.90 | 7 | 1 | 8 | 50 | 11 | 21 | 3 | 71 | 11 | 5 | 0 | 5 | 2 | 0 | 0 | 1 | 0 |
| Oct-18 | 303.67 | 157.93 | 461.60 | 6 | 1 | 7 | 44 | 8 | 21 | 3 | 65 | 8 | 1 | 1 | 0 | 1 | 1 | 0 | 2 | 2 |
| Nov-18 | 64.75 | 79.75 | 144.50 | 5 | 1 | 6 | 31 | 9 | 21 | 6 | 52 | 10 | 3 | 0 | 3 | 3 | 0 | 0 | 2 | 1 |
| Dec-18 | 50.00 | 62.50 | 112.50 | 5 | 1 | 6 | 25 | 8 | 14 | 6 | 39 | 10 | 0 | 0 | 0 | 0 | 0 | 0 | 0 | 0 |
| Jan-19 | 34.25 | 104.33 | 138.58 | 4 | 1 | 5 | 13 | 5 | 9 | 5 | 22 | 8 | 3 | 0 | 3 | 2 | 0 | 0 | 1 | 2 |
| Feb-19 | 132.08 | 58.92 | 191.00 | 5 | 1 | 6 | 35 | 10 | 14 | 7 | 49 | 13 | 16 | 1 | 12 | 8 | 0 | 0 | 3 | 15 |
| Mar-19 | 228.45 | 39.75 | 268.20 | 4 | 1 | 5 | 41 | 11 | 7 | 4 | 48 | 12 | 8 | 0 | 7 | 19 | 4 | 0 | 2 | 13 |
| Apr-19 | 206.92 | 43.92 | 250.83 | 5 | 1 | 6 | 34 | 8 | 9 | 3 | 43 | 9 | 12 | 0 | 12 | 6 | 0 | 1 | 2 | 6 |
| May-19 | 104.17 | 122.17 | 226.33 | 5 | 1 | 6 | 32 | 7 | 17 | 6 | 49 | 9 | 1 | 0 | 1 | 1 | 0 | 0 | 3 | 2 |
| Jun-19 | 246.08 | 30.42 | 276.50 | 5 | 1 | 6 | 31 | 12 | 4 | 2 | 35 | 13 | 3 | 0 | 3 | 1 | 0 | 0 | 2 | 0 |
| Jul-19 | 377.92 | 71.17 | 449.08 | 6 | 1 | 7 | 38 | 10 | 8 | 3 | 46 | 10 | 1 | 0 | 1 | 1 | 0 | 0 | 2 | 2 |
| Aug-19 | 312.82 | 62.67 | 375.48 | 6 | 1 | 7 | 31 | 13 | 12 | 4 | 43 | 14 | 7 | 2 | 4 | 12 | 2 | 0 | 0 | 0 |
| Sep-19 | 448.50 | 64.00 | 512.50 | 6 | 1 | 7 | 44 | 12 | 8 | 2 | 52 | 12 | 6 | 0 | 6 | 5 | 0 | 0 | 3 | 1 |
| Oct-19 | 227.83 | 57.25 | 285.08 | 6 | 1 | 7 | 44 | 11 | 12 | 3 | 56 | 11 | 8 | 0 | 8 | 5 | 0 | 0 | 3 | 9 |
| Nov-19 | 54.92 | 165.52 | 220.43 | 4 | 1 | 5 | 24 | 10 | 34 | 6 | 58 | 10 | 4 | 1 | 3 | 4 | 0 | 0 | 2 | 13 |
| Dec-19 | 85.92 | 93.13 | 179.05 | 4 | 1 | 5 | 30 | 8 | 18 | 5 | 48 | 11 | 3 | 0 | 2 | 5 | 3 | 1 | 0 | 0 |
| Jan-20 | 150.42 | 70.02 | 220.43 | 6 | 1 | 7 | 41 | 10 | 18 | 6 | 59 | 11 | 6 | 0 | 6 | 3 | 0 | 0 | 1 | 6 |
| Feb-20 | 92.42 | 84.70 | 177.12 | 6 | 1 | 7 | 29 | 8 | 15 | 5 | 44 | 8 | 1 | 1 | 0 | 1 | 0 | 1 | 2 | 0 |
| Mar-20 | 66.50 | 62.33 | 128.83 | 5 | 1 | 6 | 30 | 9 | 12 | 5 | 42 | 10 | 1 | 0 | 0 | 1 | 1 | 0 | 1 | 0 |
Table A10 shows the statistics of each indicator of the observed dataset, including the number of entries, missing values, mean, median, standard deviation, variance, skewness, standard error of skewness, range, minimum, and maximum.
Table A10.
Statistics of each indicator of the observed dataset [15].
Table A10.
Statistics of each indicator of the observed dataset [15].
| Indicator | N | Missing | Mean | Median | ST.DEV | Variance | Skewness | ST.ERR of Skewness | Range | Minimum | Maximum |
|---|---|---|---|---|---|---|---|---|---|---|---|
| OI1 | 75.00 | 0.00 | 163.20 | 132.42 | 131.88 | 17,393.38 | 1.03 | 0.28 | 612.58 | 0.00 | 612.58 |
| OI2 | 75.00 | 0.00 | 49.92 | 43.92 | 46.31 | 2145.06 | 0.89 | 0.28 | 181.08 | 0.00 | 181.08 |
| OI3 | 75.00 | 0.00 | 213.12 | 185.97 | 150.62 | 22,686.56 | 0.60 | 0.28 | 608.75 | 3.83 | 612.58 |
| OI4 | 75.00 | 0.00 | 5.21 | 5.00 | 1.68 | 2.82 | −0.40 | 0.28 | 8.00 | 0.00 | 8.00 |
| OI5 | 75.00 | 0.00 | 0.80 | 1.00 | 0.40 | 0.16 | −1.53 | 0.28 | 1.00 | 0.00 | 1.00 |
| OI6 | 75.00 | 0.00 | 6.01 | 6.00 | 1.73 | 2.99 | −0.55 | 0.28 | 8.00 | 1.00 | 9.00 |
| OI7 | 75.00 | 0.00 | 27.56 | 30.00 | 12.46 | 155.22 | −0.20 | 0.28 | 59.00 | 0.00 | 59.00 |
| OI8 | 75.00 | 0.00 | 8.29 | 8.00 | 2.88 | 8.29 | −0.41 | 0.28 | 14.00 | 0.00 | 14.00 |
| OI19 | 75.00 | 0.00 | 8.63 | 8.00 | 7.37 | 54.29 | 0.99 | 0.28 | 34.00 | 0.00 | 34.00 |
| OI10 | 75.00 | 0.00 | 2.93 | 3.00 | 1.92 | 3.69 | −0.16 | 0.28 | 7.00 | 0.00 | 7.00 |
| OI11 | 75.00 | 0.00 | 36.19 | 37.00 | 17.10 | 292.32 | 0.13 | 0.28 | 89.00 | 2.00 | 91.00 |
| OI12 | 75.00 | 0.00 | 9.07 | 9.00 | 2.87 | 8.23 | −0.24 | 0.28 | 13.00 | 2.00 | 15.00 |
| SPI1 | 75.00 | 0.00 | 2.92 | 2.00 | 3.10 | 9.62 | 1.57 | 0.28 | 16.00 | 0.00 | 16.00 |
| SPI2 | 75.00 | 0.00 | 0.33 | 0.00 | 0.62 | 0.39 | 2.05 | 0.28 | 3.00 | 0.00 | 3.00 |
| SPI3 | 75.00 | 0.00 | 1.96 | 1.00 | 2.59 | 6.69 | 2.08 | 0.28 | 12.00 | 0.00 | 12.00 |
| SPI4 | 75.00 | 0.00 | 2.80 | 1.00 | 3.84 | 14.76 | 2.13 | 0.28 | 19.00 | 0.00 | 19.00 |
| SPI5 | 75.00 | 0.00 | 0.63 | 0.00 | 1.61 | 2.59 | 3.72 | 0.28 | 10.00 | 0.00 | 10.00 |
| SPI6 | 75.00 | 0.00 | 0.31 | 0.00 | 0.49 | 0.24 | 1.20 | 0.28 | 2.00 | 0.00 | 2.00 |
| SPI7 | 75.00 | 0.00 | 1.35 | 1.00 | 0.98 | 0.96 | 0.13 | 0.28 | 3.00 | 0.00 | 3.00 |
| SPI8 | 75.00 | 0.00 | 3.36 | 1.00 | 4.41 | 19.45 | 1.27 | 0.28 | 15.00 | 0.00 | 15.00 |
Table A11 shows tests of normality of each indicator of the observed dataset, including the Kolmogorov-Smirnov test and the Shapiro-Wilk test.
Table A11.
Tests of normality of each indicator of the observed dataset [15].
Table A11.
Tests of normality of each indicator of the observed dataset [15].
| Tests of Normality | ||||||
|---|---|---|---|---|---|---|
| Indicator | Kolmogorov-Smirnov Test | Shapiro-Wilk Test | ||||
| Statistic | df | Sig. | Statistic | df | Sig. | |
| OI1 | 0.125 | 75 | 0.006 | 0.911 | 75 | 0.000 |
| OI2 | 0.141 | 75 | 0.001 | 0.901 | 75 | 0.000 |
| OI3 | 0.105 | 75 | 0.040 | 0.943 | 75 | 0.002 |
| OI4 | 0.156 | 75 | 0.000 | 0.949 | 75 | 0.005 |
| OI5 | 0.490 | 75 | 0.000 | 0.490 | 75 | 0.000 |
| OI6 | 0.177 | 75 | 0.000 | 0.945 | 75 | 0.003 |
| OI7 | 0.119 | 75 | 0.010 | 0.978 | 75 | 0.224 |
| OI8 | 0.087 | 75 | 0.200 * | 0.973 | 75 | 0.112 |
| OI19 | 0.121 | 75 | 0.009 | 0.910 | 75 | 0.000 |
| OI10 | 0.167 | 75 | 0.000 | 0.922 | 75 | 0.000 |
| OI11 | 0.082 | 75 | 0.200 * | 0.974 | 75 | 0.130 |
| OI12 | 0.102 | 75 | 0.053 | 0.980 | 75 | 0.289 |
| SPI1 | 0.199 | 75 | 0.000 | 0.831 | 75 | 0.000 |
| SPI2 | 0.437 | 75 | 0.000 | 0.584 | 75 | 0.000 |
| SPI3 | 0.231 | 75 | 0.000 | 0.744 | 75 | 0.000 |
| SPI4 | 0.233 | 75 | 0.000 | 0.734 | 75 | 0.000 |
| SPI5 | 0.425 | 75 | 0.000 | 0.455 | 75 | 0.000 |
| SPI6 | 0.440 | 75 | 0.000 | 0.601 | 75 | 0.000 |
| SPI7 | 0.198 | 75 | 0.000 | 0.877 | 75 | 0.000 |
| SPI8 | 0.274 | 75 | 0.000 | 0.763 | 75 | 0.000 |
* This is a lower bound of the true significance.
Figure A5 shows histograms of each organizational and safety performance indicator in the observed dataset.
Figure A5.
Histograms of organizational and safety performance indicators: (a) Flight hours (aircraft); (b) Flight hours (simulator); (c) Total flight hours; (d) Number of used aircraft; (e) Number of used simulators; (f) Number of used aircraft/simulators; (g) Number of students in training on aircraft; (h) Number of active instructors on aircraft; (i) Number of students in training on the simulator; (j) Number of active instructors on the simulator; (k) Total number of students in training; (l) Total number of active instructors; (m) Total number of recorded occurrences; (n) Number of reported MOR occurrences; (o) Number of recorded changes; (p) Number of conducted risk assessments; (q) Number of detected unacceptable risks; (r) Number of held safety review boards; (s) Number of conducted audits/inspections; (t) Number of determined non-compliances (findings) [15].


Appendix E
The forecasts for each safety performance indicator were made using the IBM SPSS Statistics software. Table A12 shows forecast model details for each indicator, obtained using the function “Forecasting” and IBM SPSS “Expert Modeler”. Model quality (model fit) for all the built models is evaluated using the R-squared criterion. R-squared is the coefficient of determination. It is defined as the proportion of the variation in the dependent variable which is predictable from the independent variable or variables. Many criteria can be used to do the evaluation (RMSE—Root Mean Squared Error, RMSPE—Root Mean Squared Percent Error, AIC—Akaike Information Criterion, BIC—Bayesian Information Criterion, R-squared). In this case, R-squared is selected, which is the default criterion, and the larger the R-squared value, the better the model [15,47].
Table A12.
Forecast model description and statistics [15].
Table A12.
Forecast model description and statistics [15].
| Model Description | Model Type | Number of Outliers | Model Fit/Stationary R-Squared | SPTs |
|---|---|---|---|---|
| SPI1 Total number of recorded occurrences | ARIMA (0,0,0) (0,0,0) | 3 | 0.531 | ≤2 |
| SPI2 number of reported MOR occurrences | Simple Seasonal | 0 | 0.772 | ≤1 |
| SPI3 number of recorded changes | Simple Seasonal | 0 | 0.696 | ≤2 |
| SPI4 number of conducted risk assessments | ARIMA (0,0,0) (0,0,0) | 6 | 0.714 | ≤2 |
| SPI5 number of detected unacceptable risks | ARIMA (0,0,0) (0,0,0) | 16 | 1.000 | ≤1 |
| SPI6 number of held safety review boards | Simple Seasonal | 0 | 0.792 | ≥1 |
| SPI7 number of conducted audits/inspections | ARIMA (0,0,0) (1,0,0) | 1 | 0.383 | ≥1 |
| SPI8 number of determined non-compliances | Simple Seasonal | 0 | 0.618 | ≤4 |
Table A13 shows the forecasted values of each safety performance indicator in the observed dataset from April 2020 to March 2022.
Table A13.
Forecast of safety performance indicators [15].
Table A13.
Forecast of safety performance indicators [15].
| Month | SPI1 | SPI2 | SPI3 | SPI4 | SPI5 | SPI6 | SPI7 | SPI8 |
|---|---|---|---|---|---|---|---|---|
| Apr-20 | 10 | 1 | 5 | 6 | 2 | 1 | 2 | 5 |
| May-20 | 2 | 0 | 3 | 2 | 0 | 0 | 2 | 3 |
| Jun-20 | 2 | 1 | 2 | 2 | 0 | 0 | 2 | 2 |
| Jul-20 | 2 | 0 | 2 | 2 | 0 | 1 | 2 | 2 |
| Aug-20 | 2 | 1 | 4 | 2 | 0 | 0 | 1 | 1 |
| Sep-20 | 2 | 0 | 3 | 2 | 0 | 0 | 2 | 7 |
| Oct-20 | 2 | 1 | 3 | 2 | 0 | 0 | 2 | 5 |
| Nov-20 | 2 | 0 | 2 | 2 | 0 | 0 | 2 | 3 |
| Dec-20 | 2 | 0 | 2 | 2 | 0 | 0 | 1 | 3 |
| Jan-21 | 2 | 0 | 3 | 2 | 0 | 0 | 1 | 1 |
| Feb-21 | 2 | 0 | 3 | 2 | 0 | 0 | 2 | 5 |
| Mar-21 | 2 | 0 | 3 | 2 | 0 | 0 | 1 | 4 |
| Apr-21 | 10 | 1 | 5 | 6 | 2 | 1 | 2 | 5 |
| May-21 | 2 | 0 | 3 | 2 | 0 | 0 | 2 | 3 |
| Jun-21 | 2 | 1 | 2 | 2 | 0 | 0 | 2 | 2 |
| Jul-21 | 2 | 0 | 2 | 2 | 0 | 1 | 2 | 2 |
| Aug-21 | 2 | 1 | 4 | 2 | 0 | 0 | 1 | 1 |
| Sep-21 | 2 | 0 | 3 | 2 | 0 | 0 | 2 | 7 |
| Oct-21 | 2 | 1 | 3 | 2 | 0 | 0 | 2 | 5 |
| Nov-21 | 2 | 0 | 2 | 2 | 0 | 0 | 2 | 3 |
| Dec-21 | 2 | 0 | 2 | 2 | 0 | 0 | 1 | 3 |
| Jan-22 | 2 | 0 | 3 | 2 | 0 | 0 | 2 | 1 |
| Feb-22 | 2 | 0 | 3 | 2 | 0 | 0 | 2 | 5 |
| Mar-22 | 2 | 0 | 3 | 2 | 0 | 0 | 2 | 4 |
Figure A6 shows graphs of each predicted safety performance indicator in the observed dataset including target area and predicted breaches [15,47]. Red curve presents observed values of each SPI, named “Number”, purple dotted curves present upper confidence limit (UCL) and lower confidence limit (LCL) of predicted values, and blue curve presents predicted values (forecast) of each SPI.
Figure A6.
Forecasts of safety performance indicators in a sample organization with outlined targets and predicted breaches: (a) The total number of recorded occurrences (SPI1); (b) The total number of recorded occurrences (SPI1) with its SPT; (c) The number of reported MOR occurrences (SPI2); (d) The number of reported MOR occurrences (SPI2) with its SPT; (e) The number of recorded changes (SPI3); (f) The number of recorded changes (SPI3) with its SPT; (g) The number of conducted risk assessments (SPI4); (h) The number of conducted risk assessments (SPI4) with its SPT; (i) The number of detected unacceptable risks (SPI5); (j) The number of detected unacceptable risks (SPI5) with its SPT; (k) The number of held safety review boards (SPI6); (l) The number of held safety review boards (SPI6) with its SPT; (m) The number of conducted audits/inspections (SPI7); (n) The number of conducted audits/inspections (SPI7) with its SPT; (o) The number of determined non-compliances (findings) (SPI8); (p) The number of determined non-compliances (findings) (SPI8) with its SPT [15,47].


Table A14 shows fit statistics for all causal models of each safety performance indicator in the observed dataset [15,47].
| Target Model of SPIs | Model Quality | ||||
|---|---|---|---|---|---|
| RMSE | RMSPE | AIC | BIC | R-Squared | |
| SPI1 | 0.28 | 0.05 | −202.24 | −65.09 | 0.98 |
| SPI2 | 0.58 | 0.14 | −99.05 | 38.11 | 0.95 |
| SPI3 | 2.24 | 0.30 | 91.08 | 228.24 | 0.95 |
| SPI4 | 0.99 | 0.15 | −22.63 | 114.53 | 0.94 |
| SPI5 | 2.31 | 0.39 | 95.51 | 232.67 | 0.93 |
| SPI6 | 1.96 | 0.32 | 72.63 | 209.79 | 0.93 |
| SPI7 | 3.27 | 0.57 | 144.38 | 281.53 | 0.93 |
| SPI8 | 0.39 | 0.09 | −151.72 | −14.56 | 0.92 |
Figure A7 shows impact diagram of all causes of each indicator in the observed dataset, and Figure A8 shows impact diagram of all effects of each indicator in the observed dataset.
Figure A7.
Impact diagrams—causes of each safety performance indicator: (a) The total number of recorded occurrences; (b) The number of reported MOR occurrences; (c) The number of recorded changes; (d) The number of conducted risk assessments; (e) The number of detected unacceptable risks; (f) The number of held safety review boards; (g) The number of conducted audits/inspections; (h) The number of determined non-compliances (findings) [15].


Figure A8.
Impact diagrams—effects of each safety performance indicator: (a) The total number of recorded occurrences; (b) The number of reported MOR occurrences; (c) The number of recorded changes; (d) The number of conducted risk assessments; (e) The number of detected unacceptable risks; (f) The number of held safety review boards; (g) The number of conducted audits/inspections; (h) The number of determined non-compliances (findings) [15].


References
- International Civil Aviation Organization (ICAO). Safety Management Manual (SMM) [Doc 9859 AN/474], 4th ed.; International Civil Aviation Organization: Montreal, QC, Canada, 2018. [Google Scholar]
- Wang, B.; Wu, C.; Shi, B.; Huang, L. Evidence-Based Safety (EBS) management: A new approach to teaching the practice of Safety Management (SM). J. Saf. Res. 2017, 63, 21–28. [Google Scholar] [CrossRef]
- Hollnagel, E. Safety-I and Safety-II: The Past and Future of Safety Management; Ashgate: Farnham, UK, 2014. [Google Scholar]
- Canders, M.F. Peer reviewed Safety Management System (SMS): Collaboration for continuous improvement (literature review). Int. J. Aviat. Aeronaut. Aerosp. 2016, 3, 1–14. [Google Scholar] [CrossRef] [Green Version]
- Bartulović, D. Predictive safety management system development. Trans. Marit. Sci. 2021, 10, 135–146. [Google Scholar] [CrossRef]
- International Civil Aviation Organization (ICAO). Global Aviation Safety Plan [Doc 10004], 2020–2022nd ed.; International Civil Aviation Organization: Montreal, QC, Canada, 2019. [Google Scholar]
- Yeun, R.; Bates, P.; Murray, P. Aviation safety management systems. World Rev. Intermodal Transp. Res. 2014, 5, 168–196. [Google Scholar] [CrossRef] [Green Version]
- Ellis, K.K.; Krois, P.; Koelling, J.; Prinzel, L.J.; Davies, M.; Mah, R. A Concept of Operations (ConOps) of an In-time Aviation Safety Management System (IASMS) for Advanced Air Mobility (AAM). In Proceedings of the AIAA Scitech 2021 Forum, Virtual Conference, Virtual Event, 11–15 & 19–21 January 2021; pp. 1–14. [Google Scholar] [CrossRef]
- International Civil Aviation Organization (ICAO). Annex 19 to the Convention on International Civil Aviation: Safety Management, 2nd ed.; International Civil Aviation Organization: Montreal, QC, Canada, 2016. [Google Scholar]
- Passenger Demand Recovery Continued in December 2022 & for the Full Year. Available online: https://www.iata.org/en/pressroom/2023-releases/2023-02-06-02/ (accessed on 5 March 2023).
- Air Crash Deaths Increased in 2020 Despite COVID-19. Available online: https://www.statista.com/chart/12393/2017-was-the-safest-year-in-the-history-of-air-travel/ (accessed on 5 March 2023).
- Cusick, S.K.; Cortes, A.I.; Rodrigues, C.C. Commercial Aviation Safety, 6th ed.; McGraw-Hill: New York, NY, USA, 2017. [Google Scholar]
- Ferguson, M.D.; Nelson, S. Aviation Safety: A Balanced Industry Approach, 1st ed.; Delmar: New York, NY, USA, 2014. [Google Scholar]
- Velazquez, J.; Bier, N. SMS and CRM: Parallels and opposites in their evolution. J. Aviat./Aerosp. Educ. Res. 2015, 24, 55–78. [Google Scholar] [CrossRef] [Green Version]
- Bartulović, D. Development of Predictive Safety Management Methodology in Aviation. Ph.D. Dissertation, University of Zagreb, Faculty of Transport and Traffic Sciences, Zagreb, Croatia, 9 December 2022. [Google Scholar]
- Čokorilo, O.; Dell’Acqua, G. Aviation Hazards Identification Using Safety Management System (SMS) Techniques. In Proceedings of the 16th International Conference on Transport Science (ICTS 2013), Portorož, Slovenia, 27 May 2013. [Google Scholar]
- Čokorilo, O.; Mirosavljević, P.; Gvozdenović, S. An approach to Safety Management System (SMS) implementation in aircraft operations. Afr. J. Bus. Manag. 2011, 5, 1942–1950. [Google Scholar] [CrossRef]
- Jakovljević, I.; Čokorilo, O.; Dell-Acqua, G.; Mirosavljević, P. Aircraft departure control systems-hidden safety risks. Int. J. Traffic Transp. Eng. (IJTTE) 2017, 7, 298–311. [Google Scholar] [CrossRef] [Green Version]
- Bartulović, D. Risk Assessment Methodology in Air Traffic Safety Management System. Master Thesis, University of Zagreb, Faculty of Transport and Traffic Sciences, Zagreb, Croatia, 10 July 2012. [Google Scholar]
- Chen, W.; Li, J. Safety performance monitoring and measurement of civil aviation unit. J. Air Transp. Manag. 2016, 57, 228–233. [Google Scholar] [CrossRef]
- Patriarca, R.; Di Gravio, G.; Cioponea, R.; Licu, A. Safety intelligence: Incremental proactive risk management for holistic aviation safety performance. Saf. Sci. 2019, 118, 551–567. [Google Scholar] [CrossRef]
- Di Gravio, G.; Mancini, M.; Patriarca, R.; Costantino, F. Overall safety performance of air traffic management system: Forecasting and monitoring. Saf. Sci. 2015, 72, 351–362. [Google Scholar] [CrossRef]
- O’Conner, P.; O’Dea, A.; Kennedy, Q.; Buttrey, S.E. Measuring safety climate in aviation: A review and recommendations for the future. Saf. Sci. 2011, 49, 128–138. [Google Scholar] [CrossRef] [Green Version]
- Elvik, R.; Elvebakk, B. Safety inspectorates and safety performance: A tentative analysis for aviation and rail in Norway. Safety 2016, 2, 13. [Google Scholar] [CrossRef] [Green Version]
- Kaspers, S.; Karanikas, N.; Roelen, A.; Piric, S.; De Boer, R.J. How does the aviation industry measure safety performance? Current practice and limitations. Int. J. Aviat. Manag. 2019, 4, 224–245. [Google Scholar] [CrossRef] [Green Version]
- Sun, Y.; Zhang, Y.; Zhao, R.; Chen, Y. Safety Performance Evaluation for Civil Aviation Maintenance Department. In Proceedings of the 9th International Conference on Digital Human Modeling and Applications in Health, Safety, Ergonomics and Risk Management (DHM 2018), Las Vegas, NV, USA, 15–20 July 2018; pp. 635–646. [Google Scholar] [CrossRef]
- Ioannou, C.; Harris, D.; Dahlstrom, N. Safety management practices hindering the development of safety performance indicators in aviation service providers. Aviat. Psychol. Appl. Hum. Factors 2017, 7, 95–106. [Google Scholar] [CrossRef]
- Chen, M.; Chen, Y.; Ma, S. Identifying Safety Performance Indicators for Risk Assessment in Civil Aviation. In Proceedings of the 10th International Conference on Quality, Reliability, Risk, Maintenance, and Safety Engineering (QR2MSE 2020), Shaanxi, China, 8–11 October 2020; pp. 1–7. [Google Scholar] [CrossRef]
- Onyegiri, I.E.; Oke, S.A. A grey relational analytical approach to safety performance assessment in an aviation industry of a developing country. Eng. Appl. Sci. Res. 2017, 44, 1–15. [Google Scholar] [CrossRef]
- Chen, M.; Luo, M.; Zhang, Y.; Chen, Y. A Framework to Quantitatively Assess Safety Performance for Civil Aviation Organization. In Proceedings of the 10th International Conference on Digital Human Modeling and Applications in Health, Safety, Ergonomics and Risk Management (DHM 2019) as Part of International Conference on Human-Computer Interaction (HCII 2019), Orlando, FL, USA, 26–31 July 2019; pp. 369–381. [Google Scholar]
- Kaspers, S.; Karanikas, N.; Piric, S.; van Aalst, R.; De Boer, R.J.; Roelen, A. Measuring Safety in Aviation: Empirical Results about the Relation between Safety Outcomes and Safety Management System Processes, Operational Activities and Demographic Data. In Proceedings of the 7th International Conference on Performance, Safety and Robustness in Complex Systems and Applications (PESARO 2017), Venice, Italy, 23–27 April 2017. [Google Scholar]
- Sun, H.; Wang, C.; Li, Q.; Zhang, B. Research on ICAO Safety Performance Monitoring Algorithm. In Proceedings of the IEEE 3rd International Conference on Civil Aviation Safety and Information Technology (ICCASIT), Changsha, China, 20–22 October 2021; pp. 190–193. [Google Scholar] [CrossRef]
- Kaspers, S.; Karanikas, N.; Roelen, A.; Piric, S.; van Aalst, R.; De Boer, R.J. Exploring the diversity in safety measurement practices: Empirical results from aviation. J. Saf. Stud. 2016, 2, 18–29. [Google Scholar] [CrossRef] [Green Version]
- International Civil Aviation Organization (ICAO). Safety Management Manual (SMM) [Doc 9859 AN/474], 3rd ed.; International Civil Aviation Organization: Montreal, QC, Canada, 2013. [Google Scholar]
- Oster, C.V., Jr.; Strong, J.S.; Zorn, K. Analyzing aviation safety: Problems, challenges, opportunities. Res. Transp. Econ. 2013, 43, 148–164. [Google Scholar] [CrossRef]
- Everdij, M.H.C.; Blom, H.A.P.; Kirwan, B. Development of A Structured Database of Safety Methods. In Proceedings of the 8th International Conference on Probabilistic Safety Assessment & Management (PSAM8), New Orleans, LA, USA, 14–18 May 2006. [Google Scholar]
- Flight Data Analysis (FDA), a Predictive Tool for Safety Management System (SMS). Available online: https://safetyfirst.airbus.com/app/themes/mh_newsdesk/pdf.php?p=25663 (accessed on 30 January 2023).
- Flight Data Analysis. Available online: https://www.navblue.aero/product/flight-data-analysis-suite/ (accessed on 30 January 2023).
- Ancel, E.; Shih, A.T.; Jones, S.M.; Reveley, M.S.; Luxhøj, J. Predictive safety analytics: Inferring aviation accident shaping factors and causation. J. Risk Res. 2015, 18, 428–451. [Google Scholar] [CrossRef]
- Čokorilo, O.; Ivković, I.; Kaplanović, S. Prediction of exhaust emission costs in air and road transportation. Sustainability 2019, 11, 4688. [Google Scholar] [CrossRef] [Green Version]
- Luxhøj, J.T. Predictive safety analytics for complex aerospace systems. Procedia Comput. Sci. 2013, 20, 331–336. [Google Scholar] [CrossRef] [Green Version]
- Stanton, N.; Salmon, P.; Harris, D.; Marshall, A.; Demagalski, J.; Young, M.; Waldmann, T.; Dekker, S. Predicting pilot error: Testing a new methodology and a multi-methods and analysts’ approach. Appl. Ergon. 2008, 40, 464–471. [Google Scholar] [CrossRef] [PubMed]
- EUROCONTROL Forecast Update 2021–2027. Available online: https://www.eurocontrol.int/publication/eurocontrol-forecast-update-2021-2027 (accessed on 3 February 2023).
- Bartulović, D.; Steiner, S. Liaison between Proactive and Predictive Methodology of Aviation Safety Management System. In Proceedings of the 19th International Conference on Transport Science (ICTS 2020), Portorož, Slovenia, 17–18 September 2020. [Google Scholar]
- Brockwell, P.J.; Davis, R.A. Introduction to Time Series and Forecasting, 3rd ed.; Springer International Publishing: New York, NY, USA, 2016. [Google Scholar]
- IBM SPSS Statistics. Available online: https://www.ibm.com/support/pages/ibm-spss-statistics-2701-documentation (accessed on 9 November 2022).
- Bartulović, D.; Steiner, S. Cause-Effect Relations between Organizational and Safety Performance Indicators. In Proceedings of the 20th International Conference on Transport Science (ICTS 2022), Portorož, Slovenia, 23–24 May 2022. [Google Scholar]


Figure 3.
Safety management methodologies: (a) reactive safety management methodology; (b) proactive safety management methodology; (c) current form of predictive safety management methodology [5,15].


Figure 4.
Comprehensive overview of the aviation safety management system [15].
Figure 4.
Comprehensive overview of the aviation safety management system [15].

Figure 5.
Example of forecasting safety performance indicator (SPI1).

Figure 6.
Safety performance indicator (SPI) behavior in different safety management environments: (a) safety performance indicator (SPI) in reactive safety management; (b) safety performance indicator (SPI) in proactive safety management; (c) safety performance indicator (SPI) in predictive safety management [15].


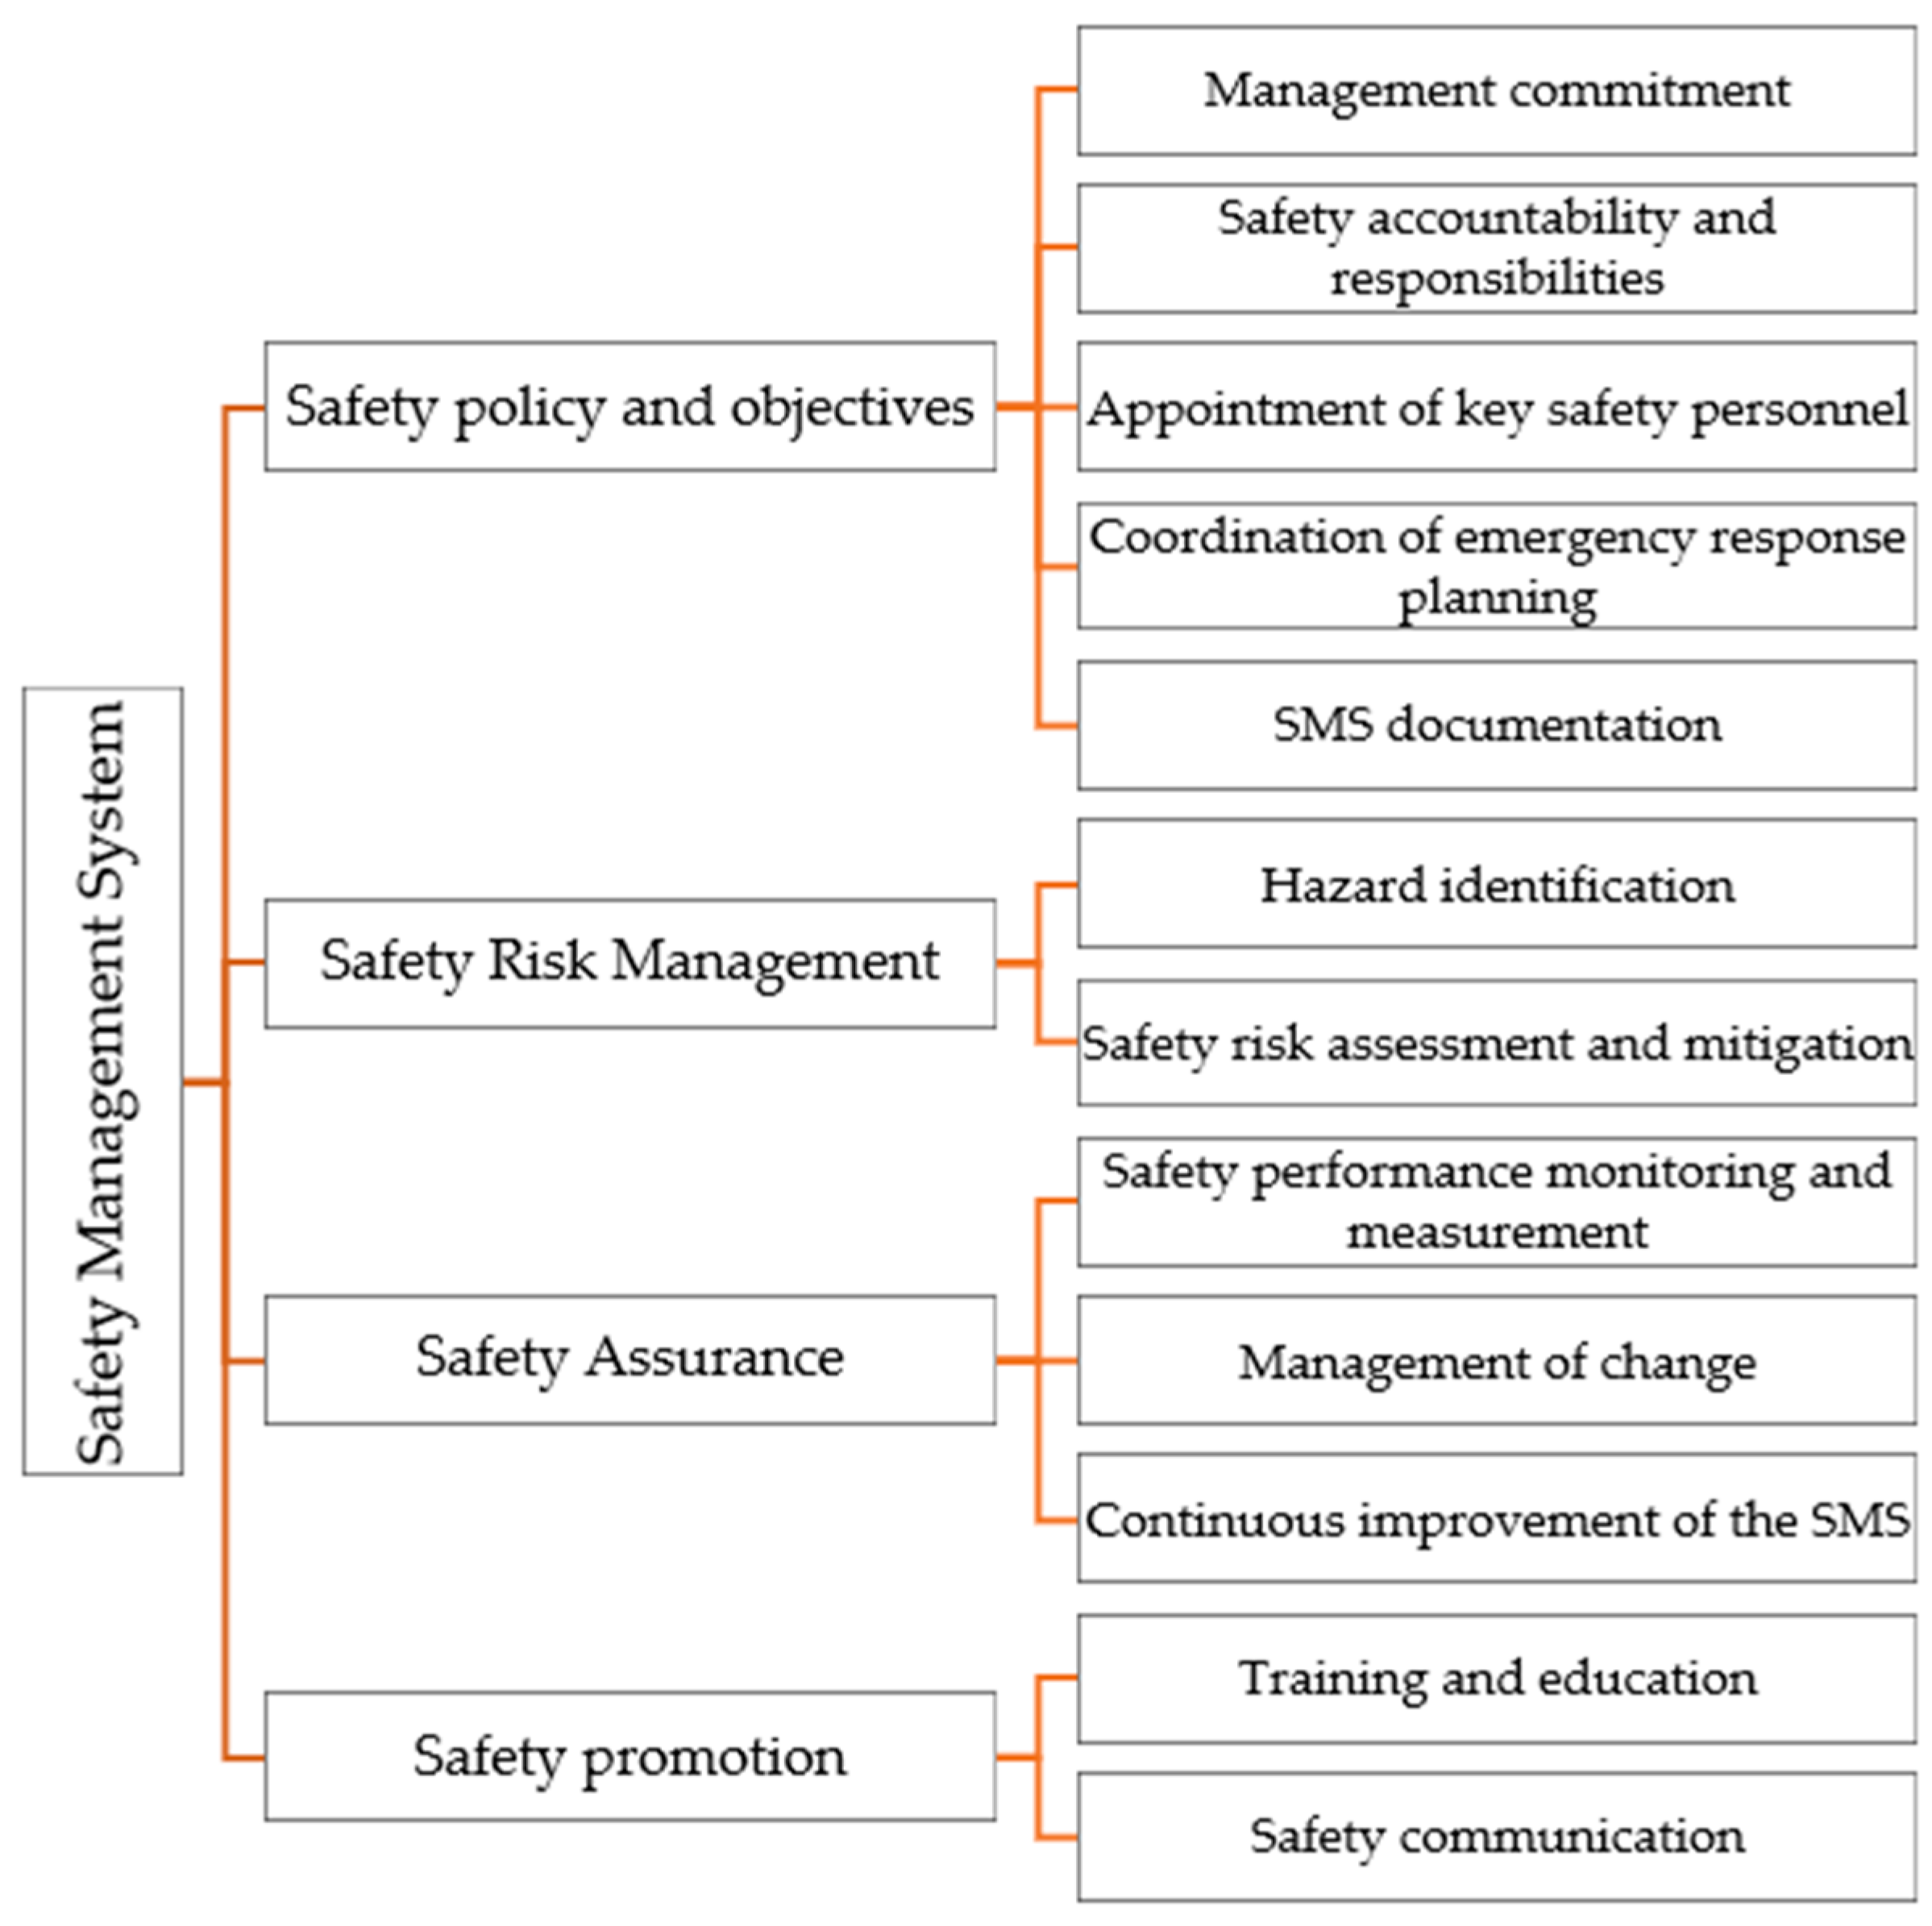
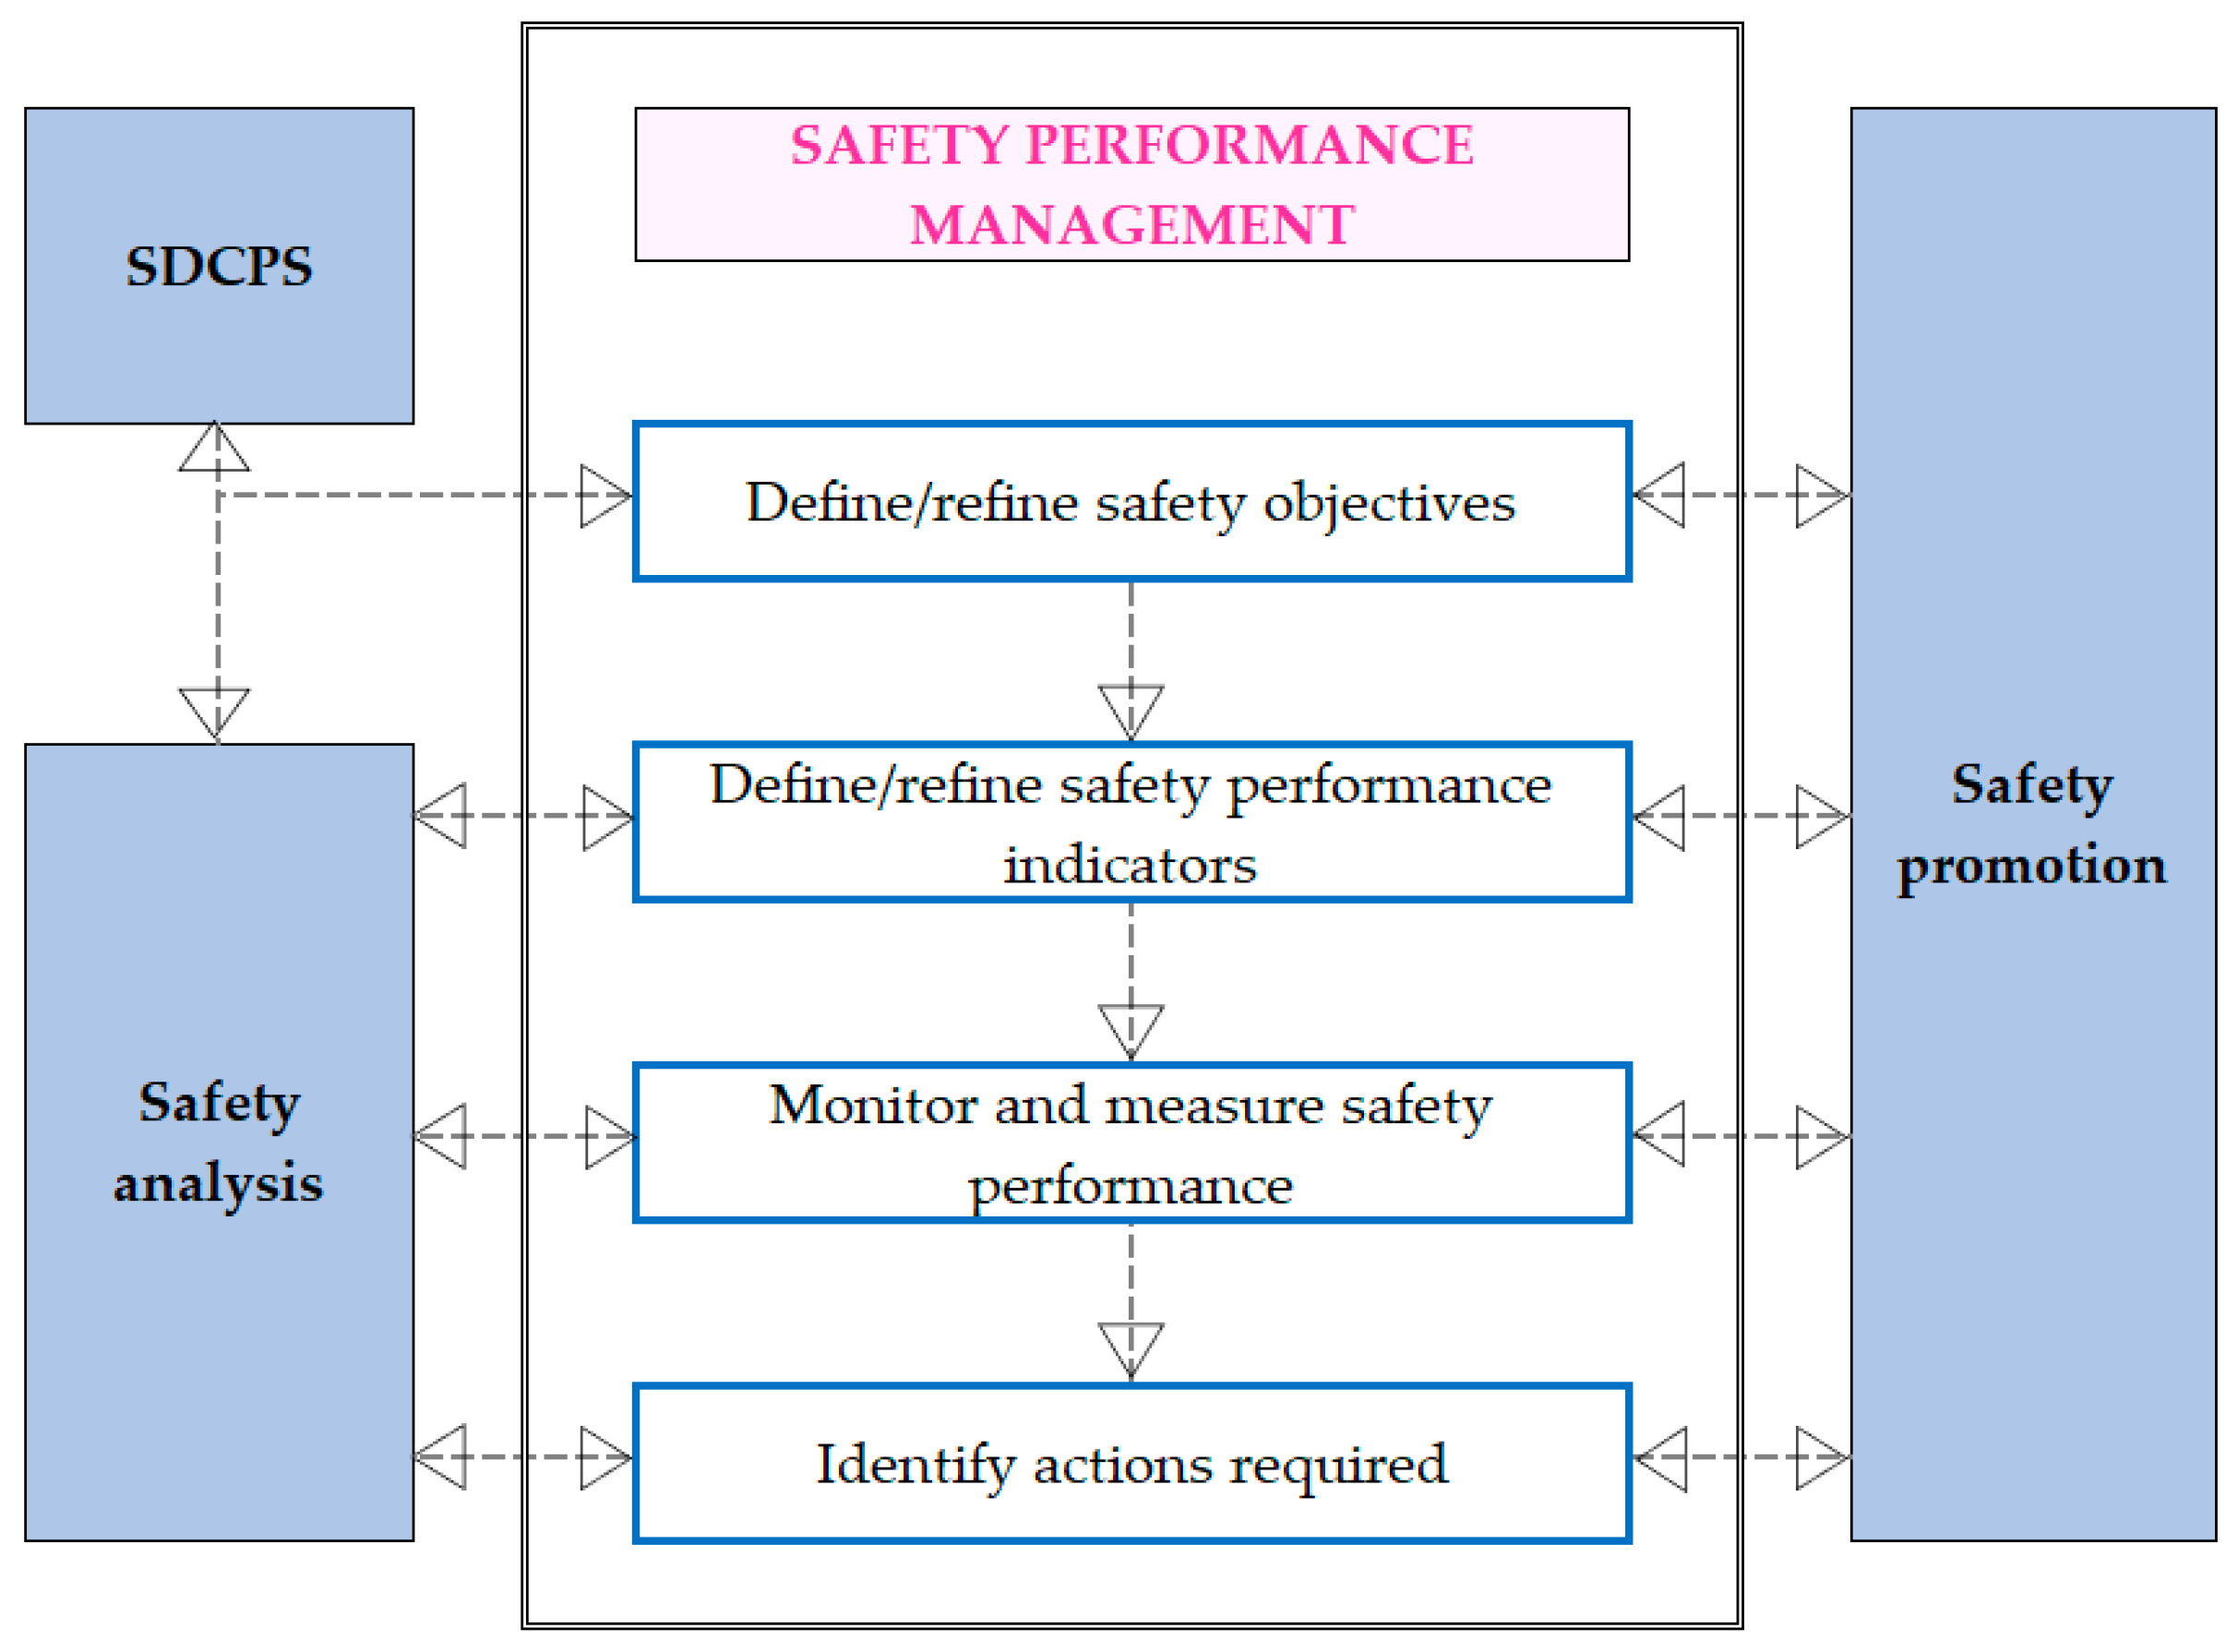
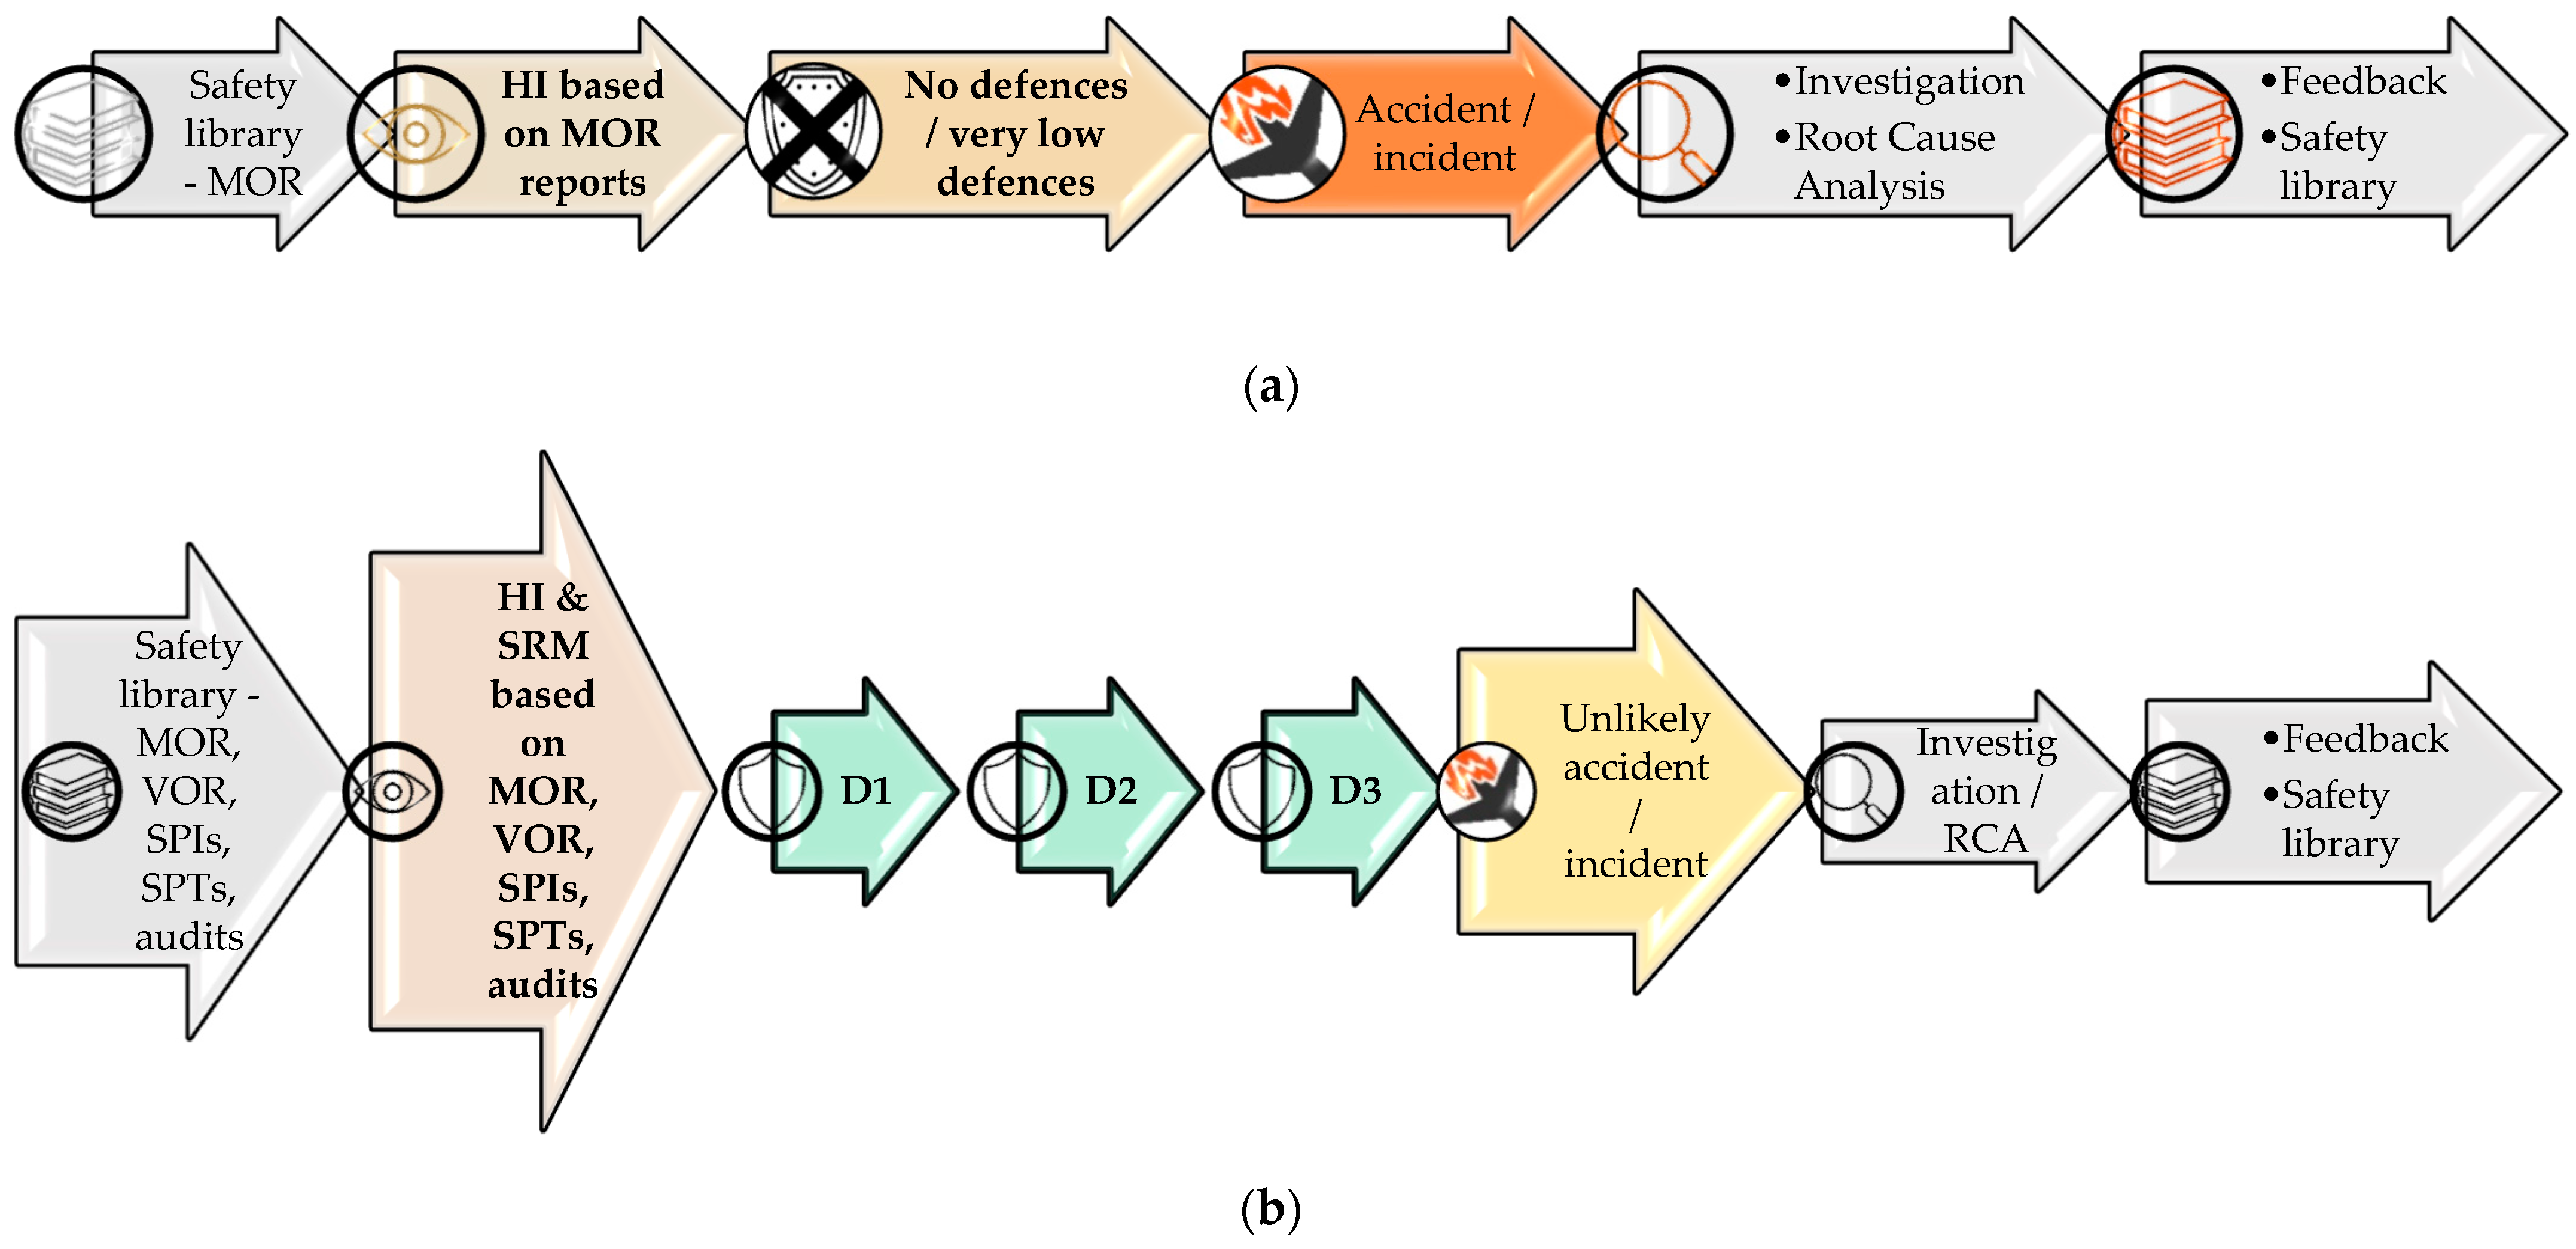
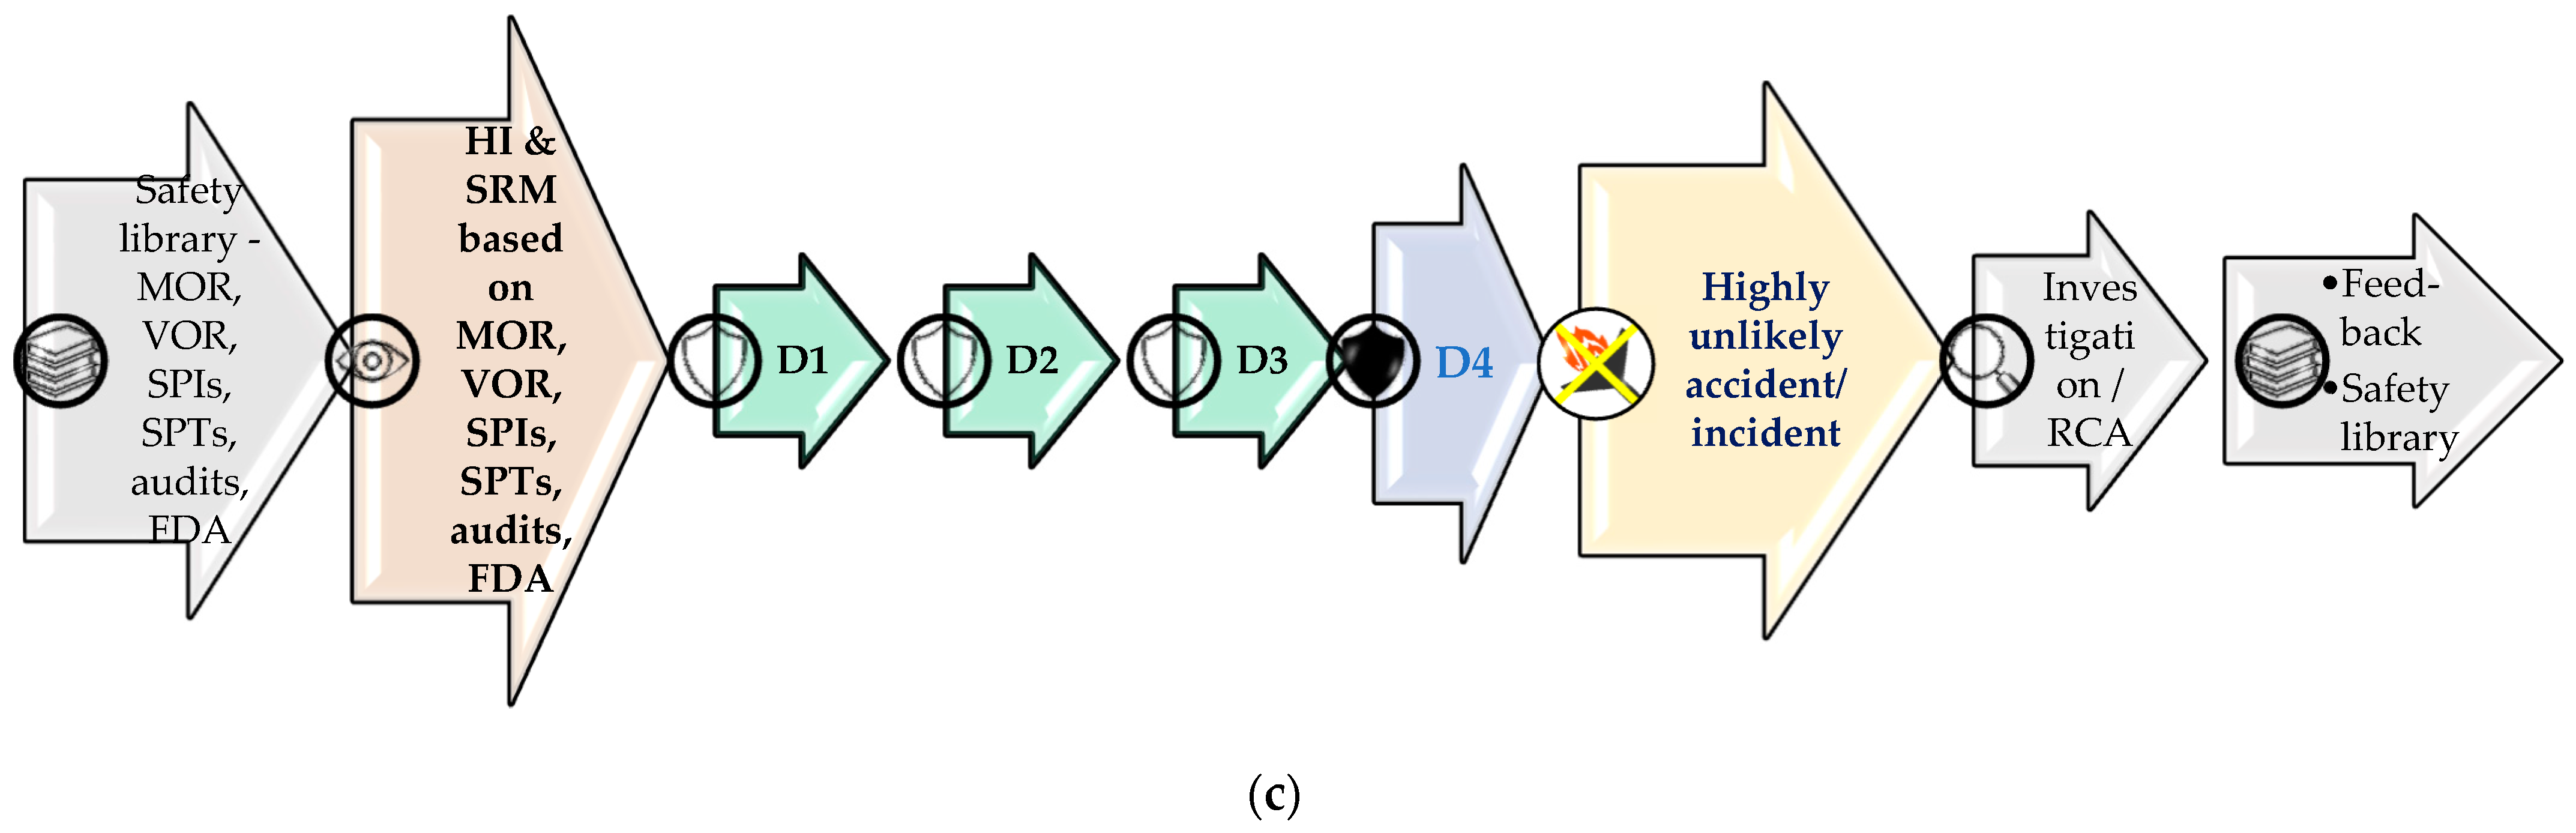
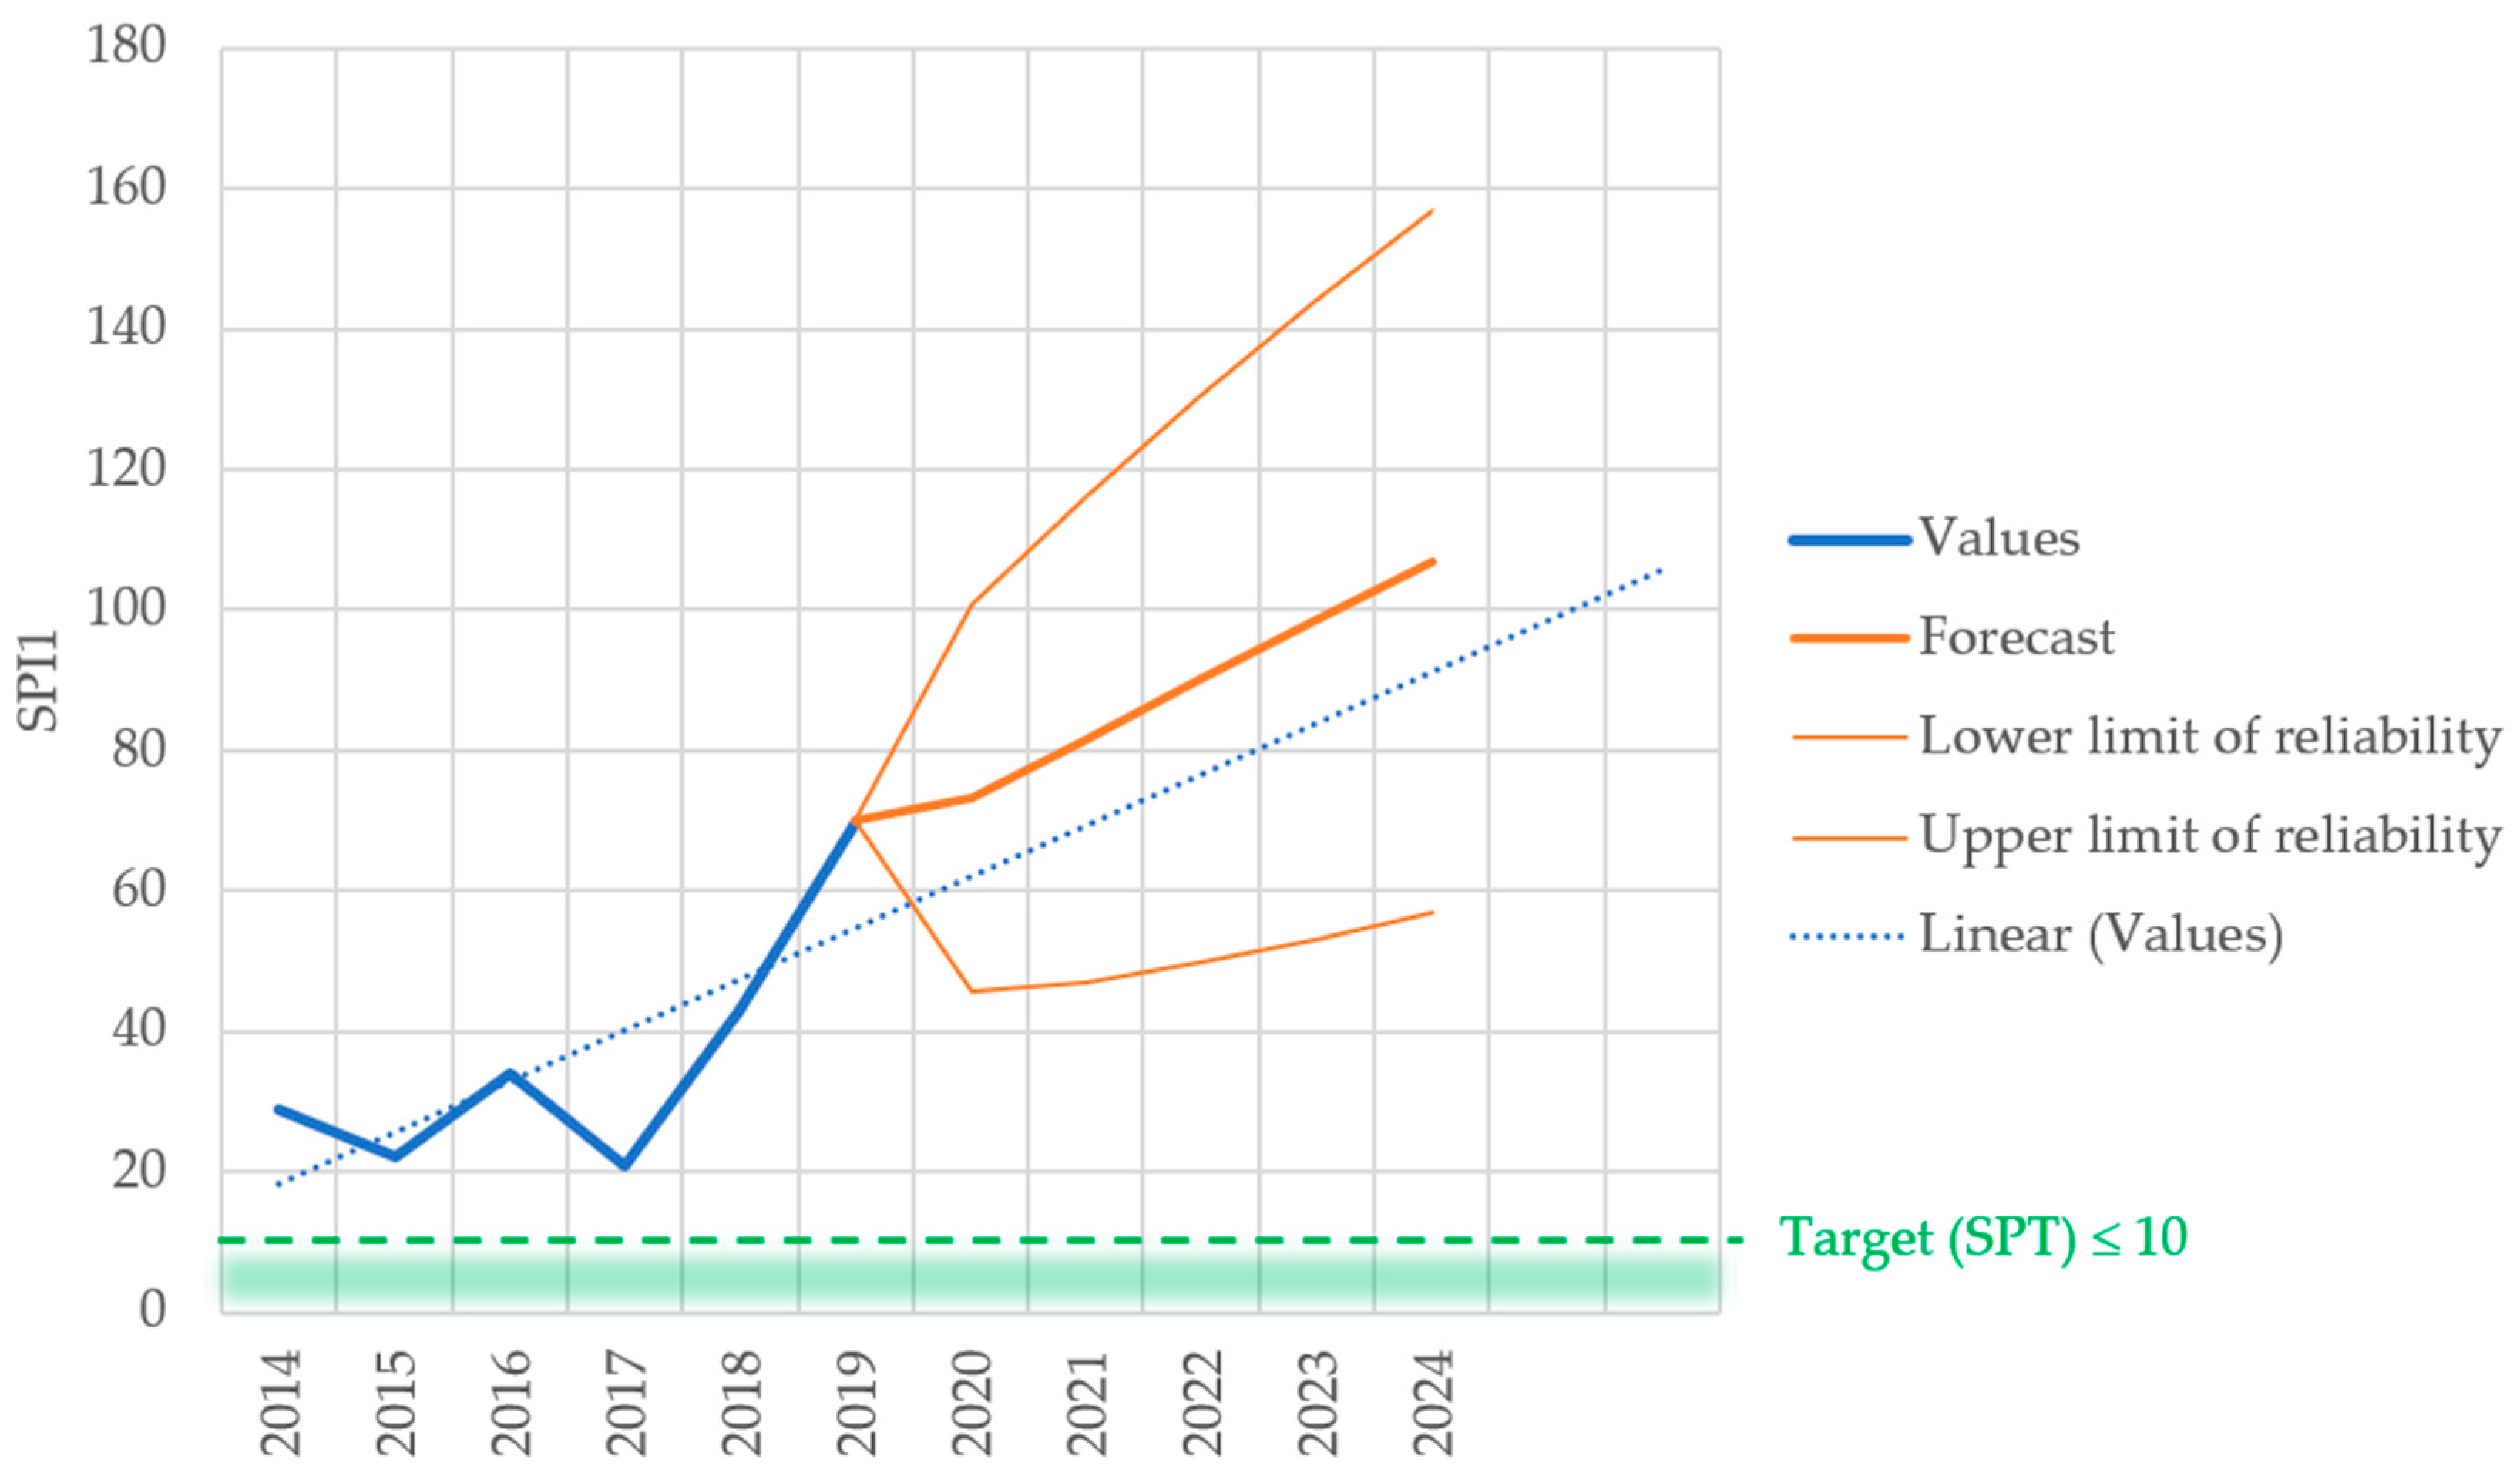
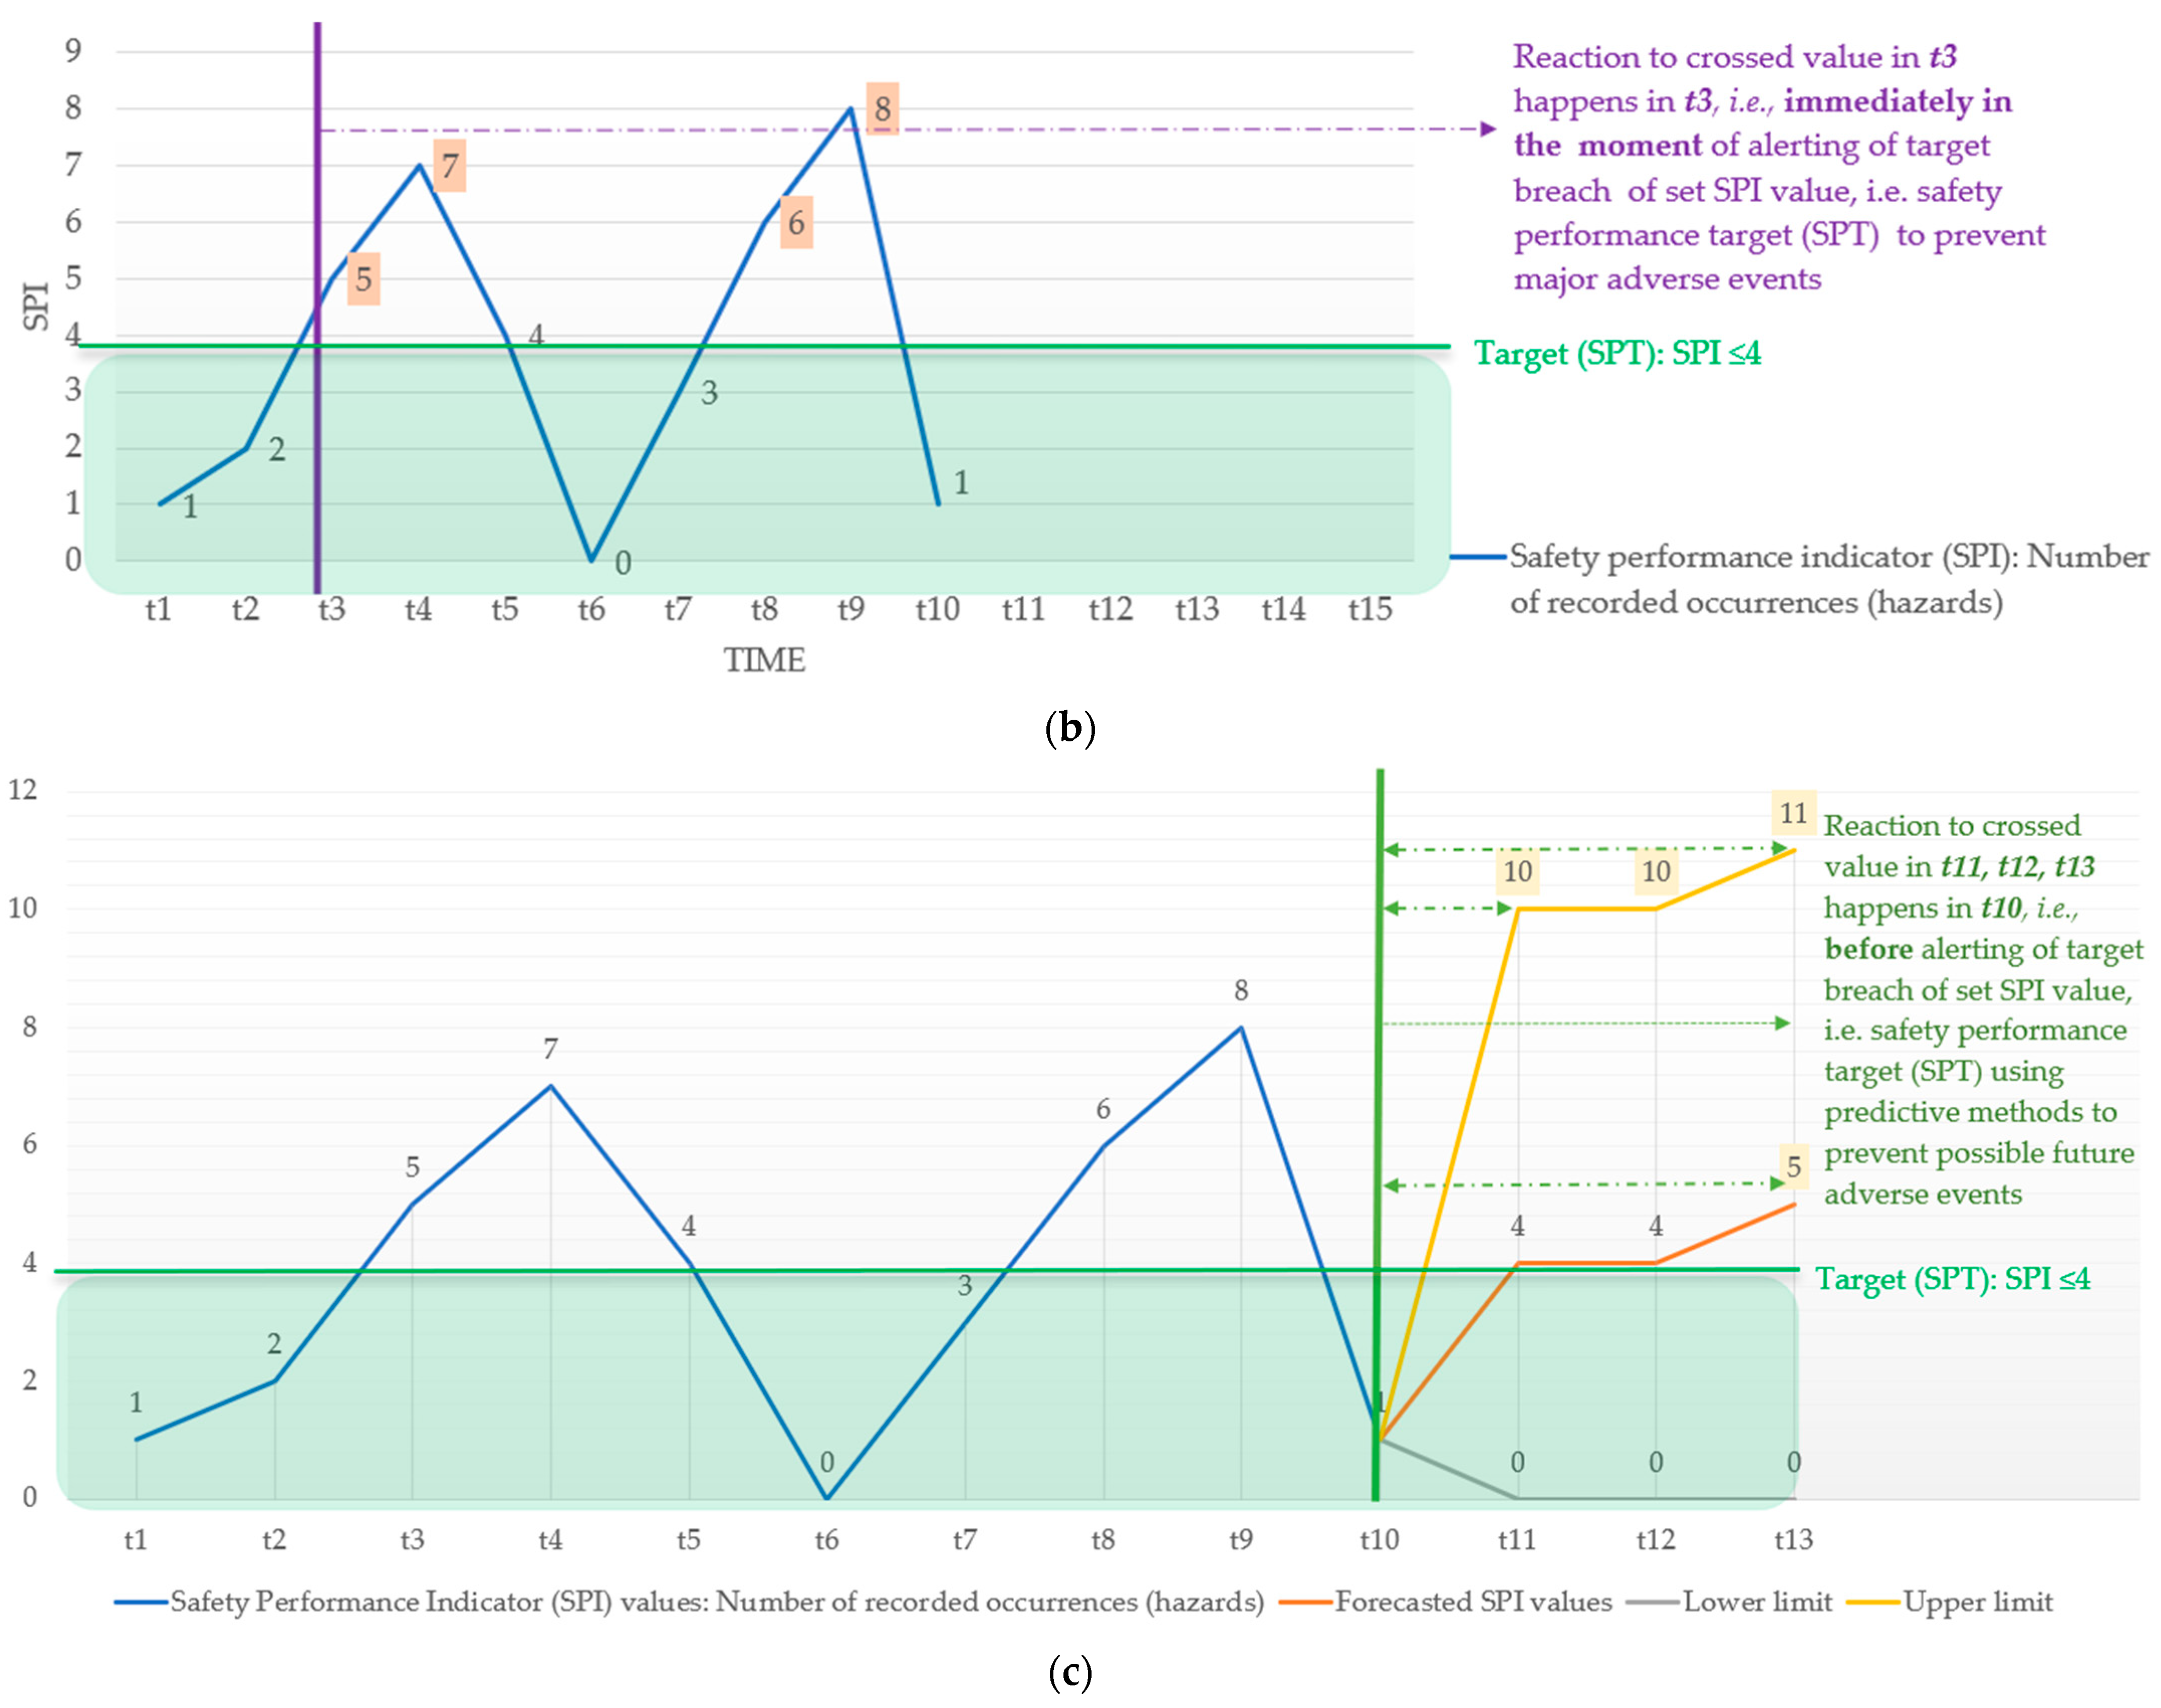
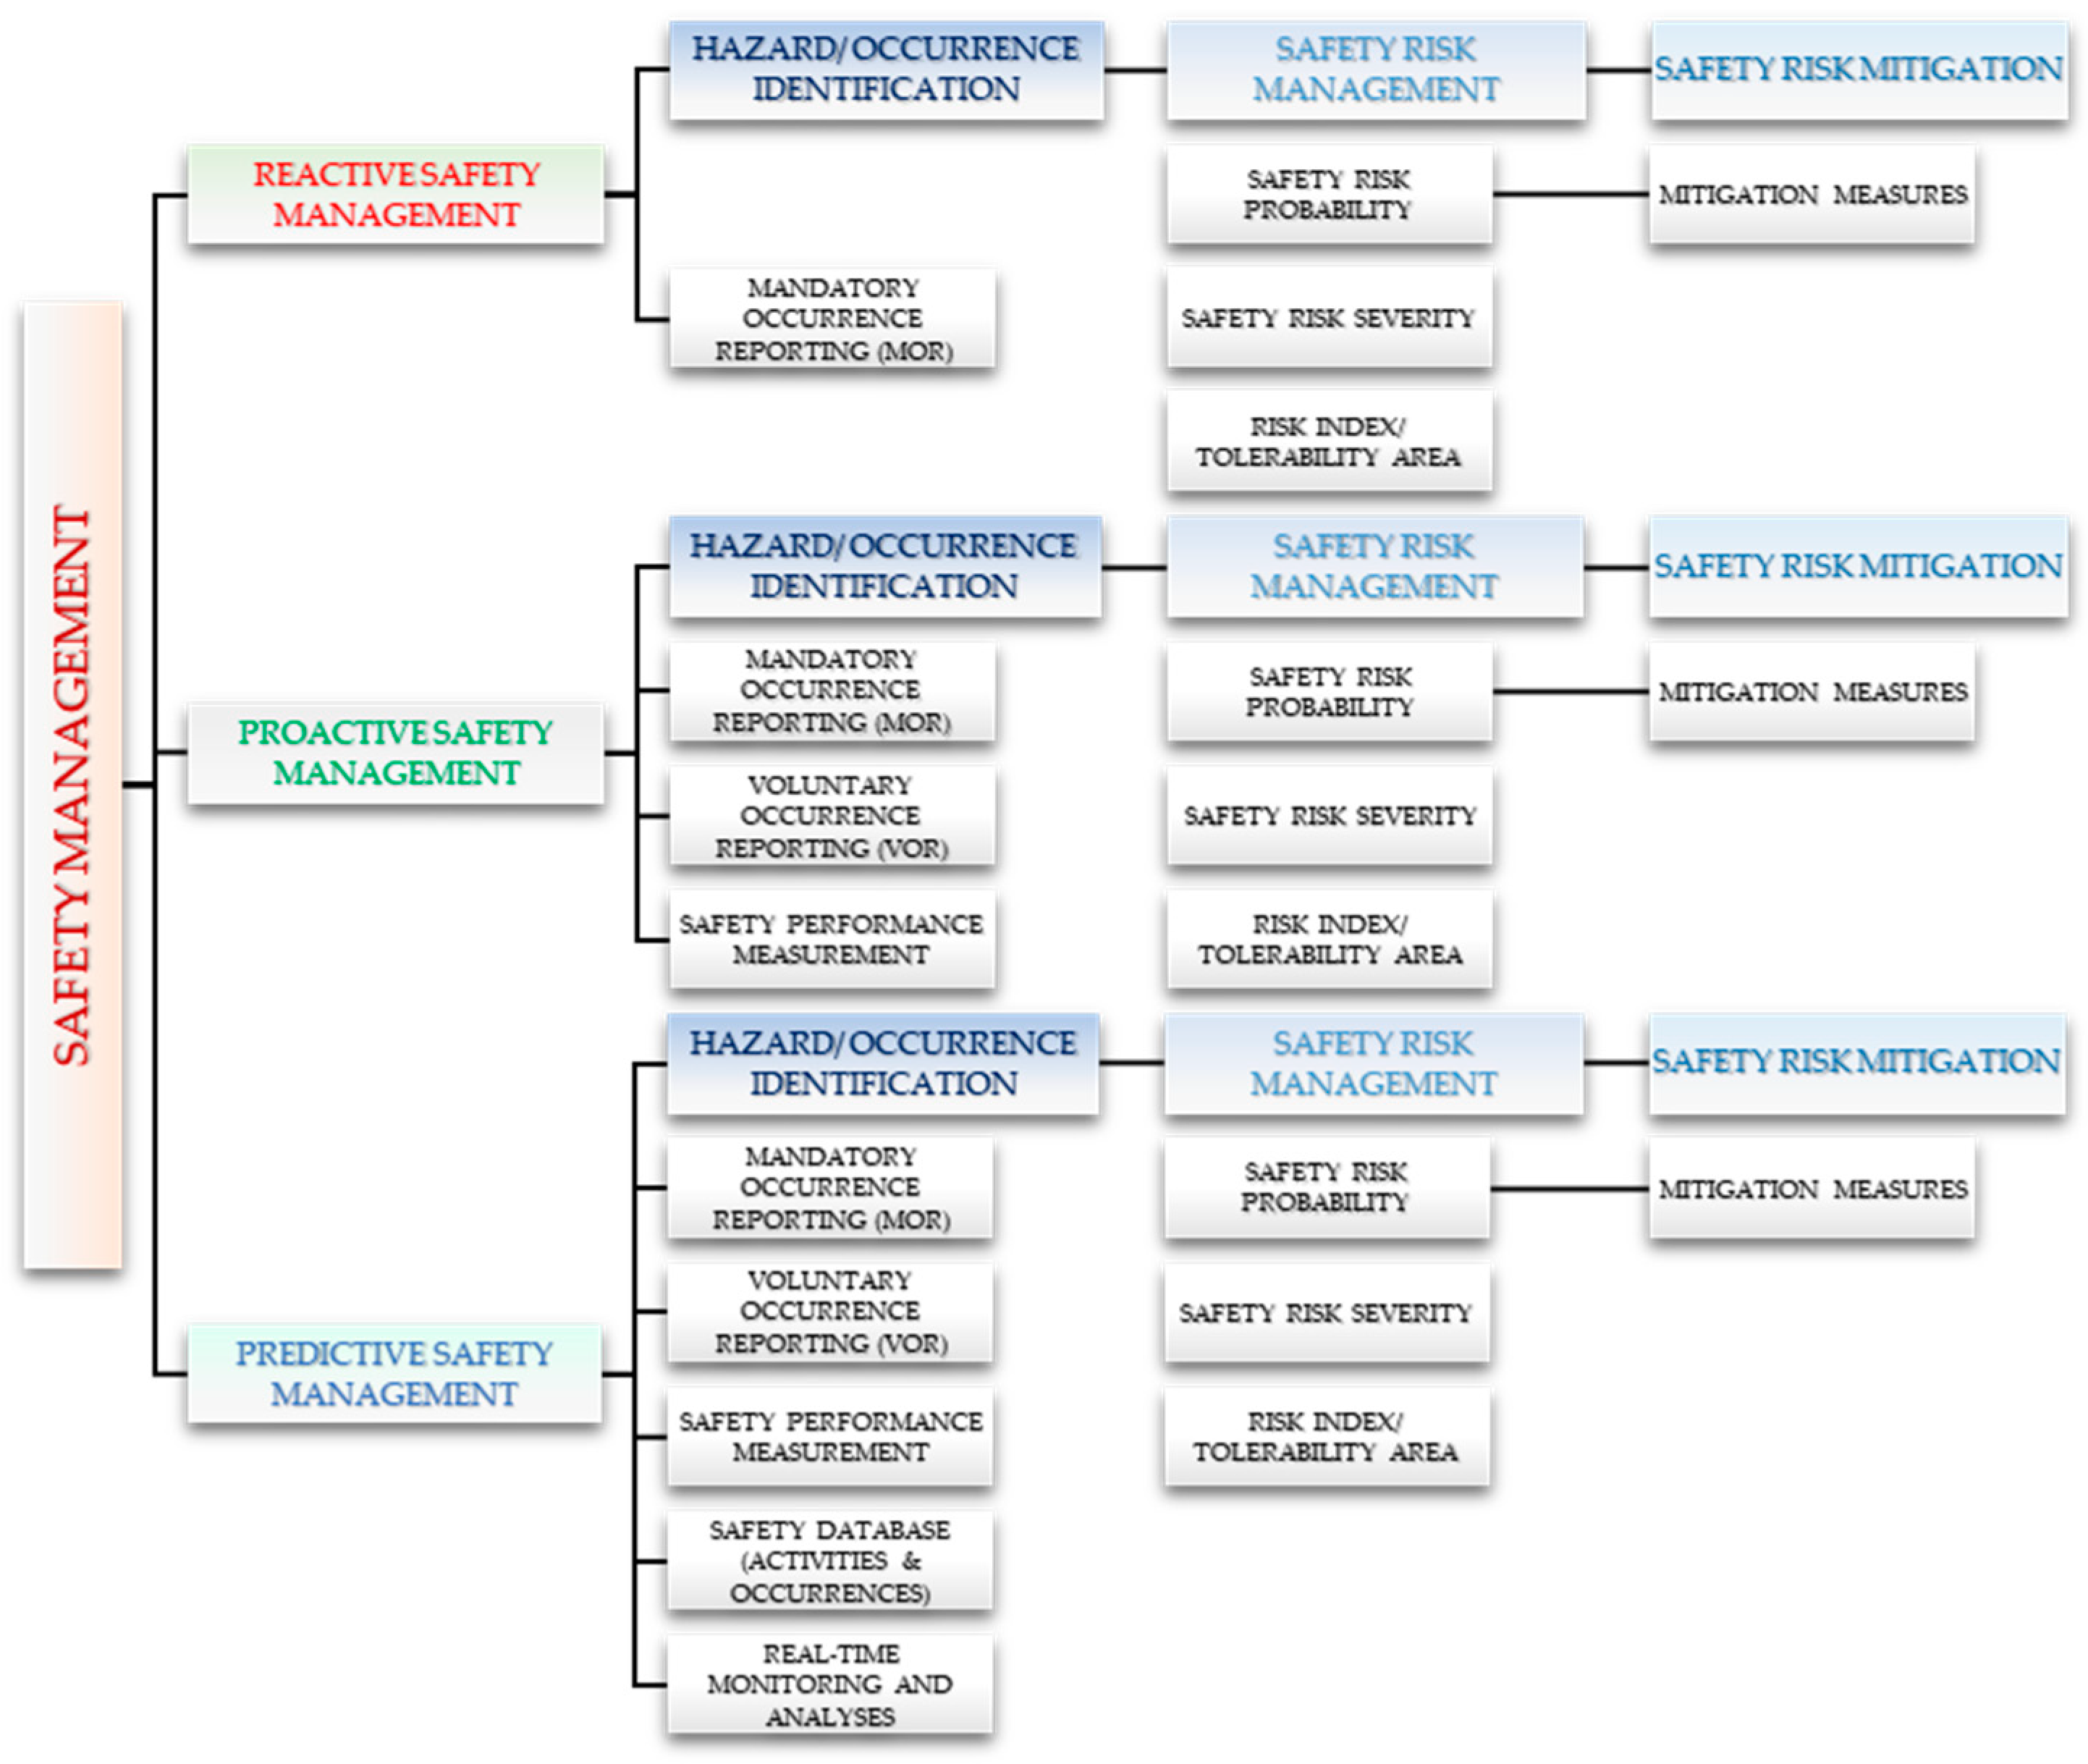
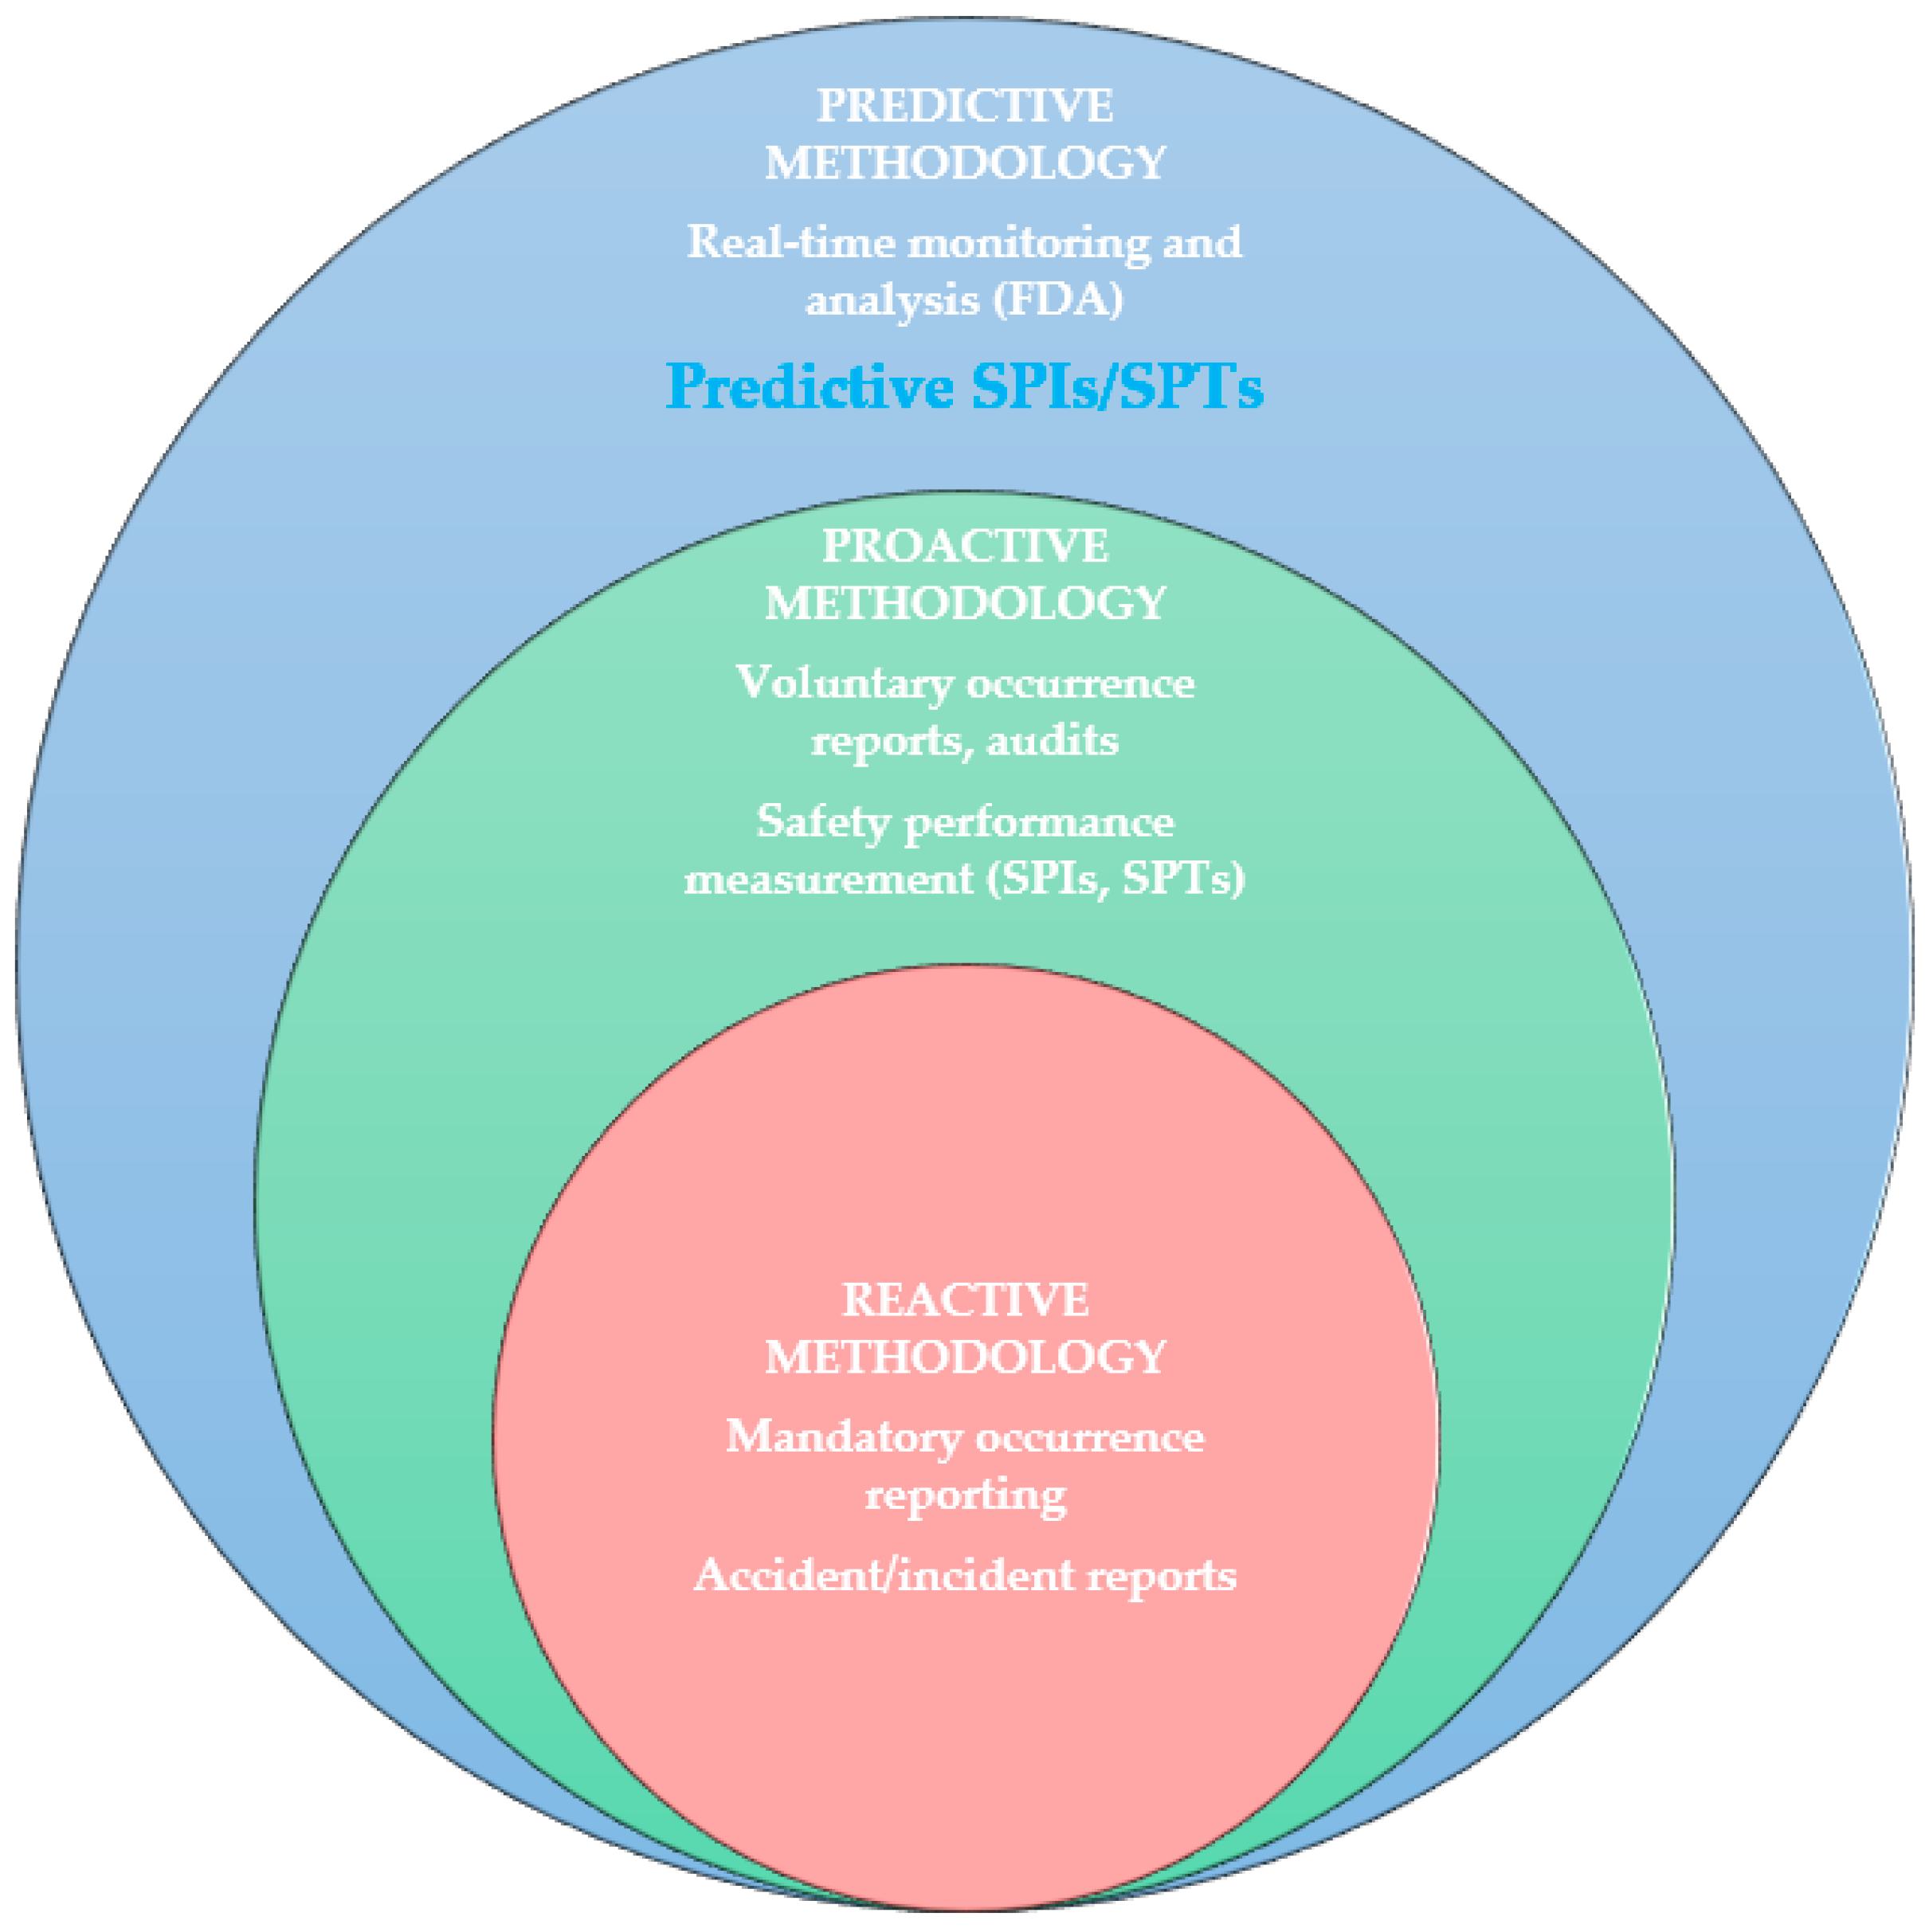
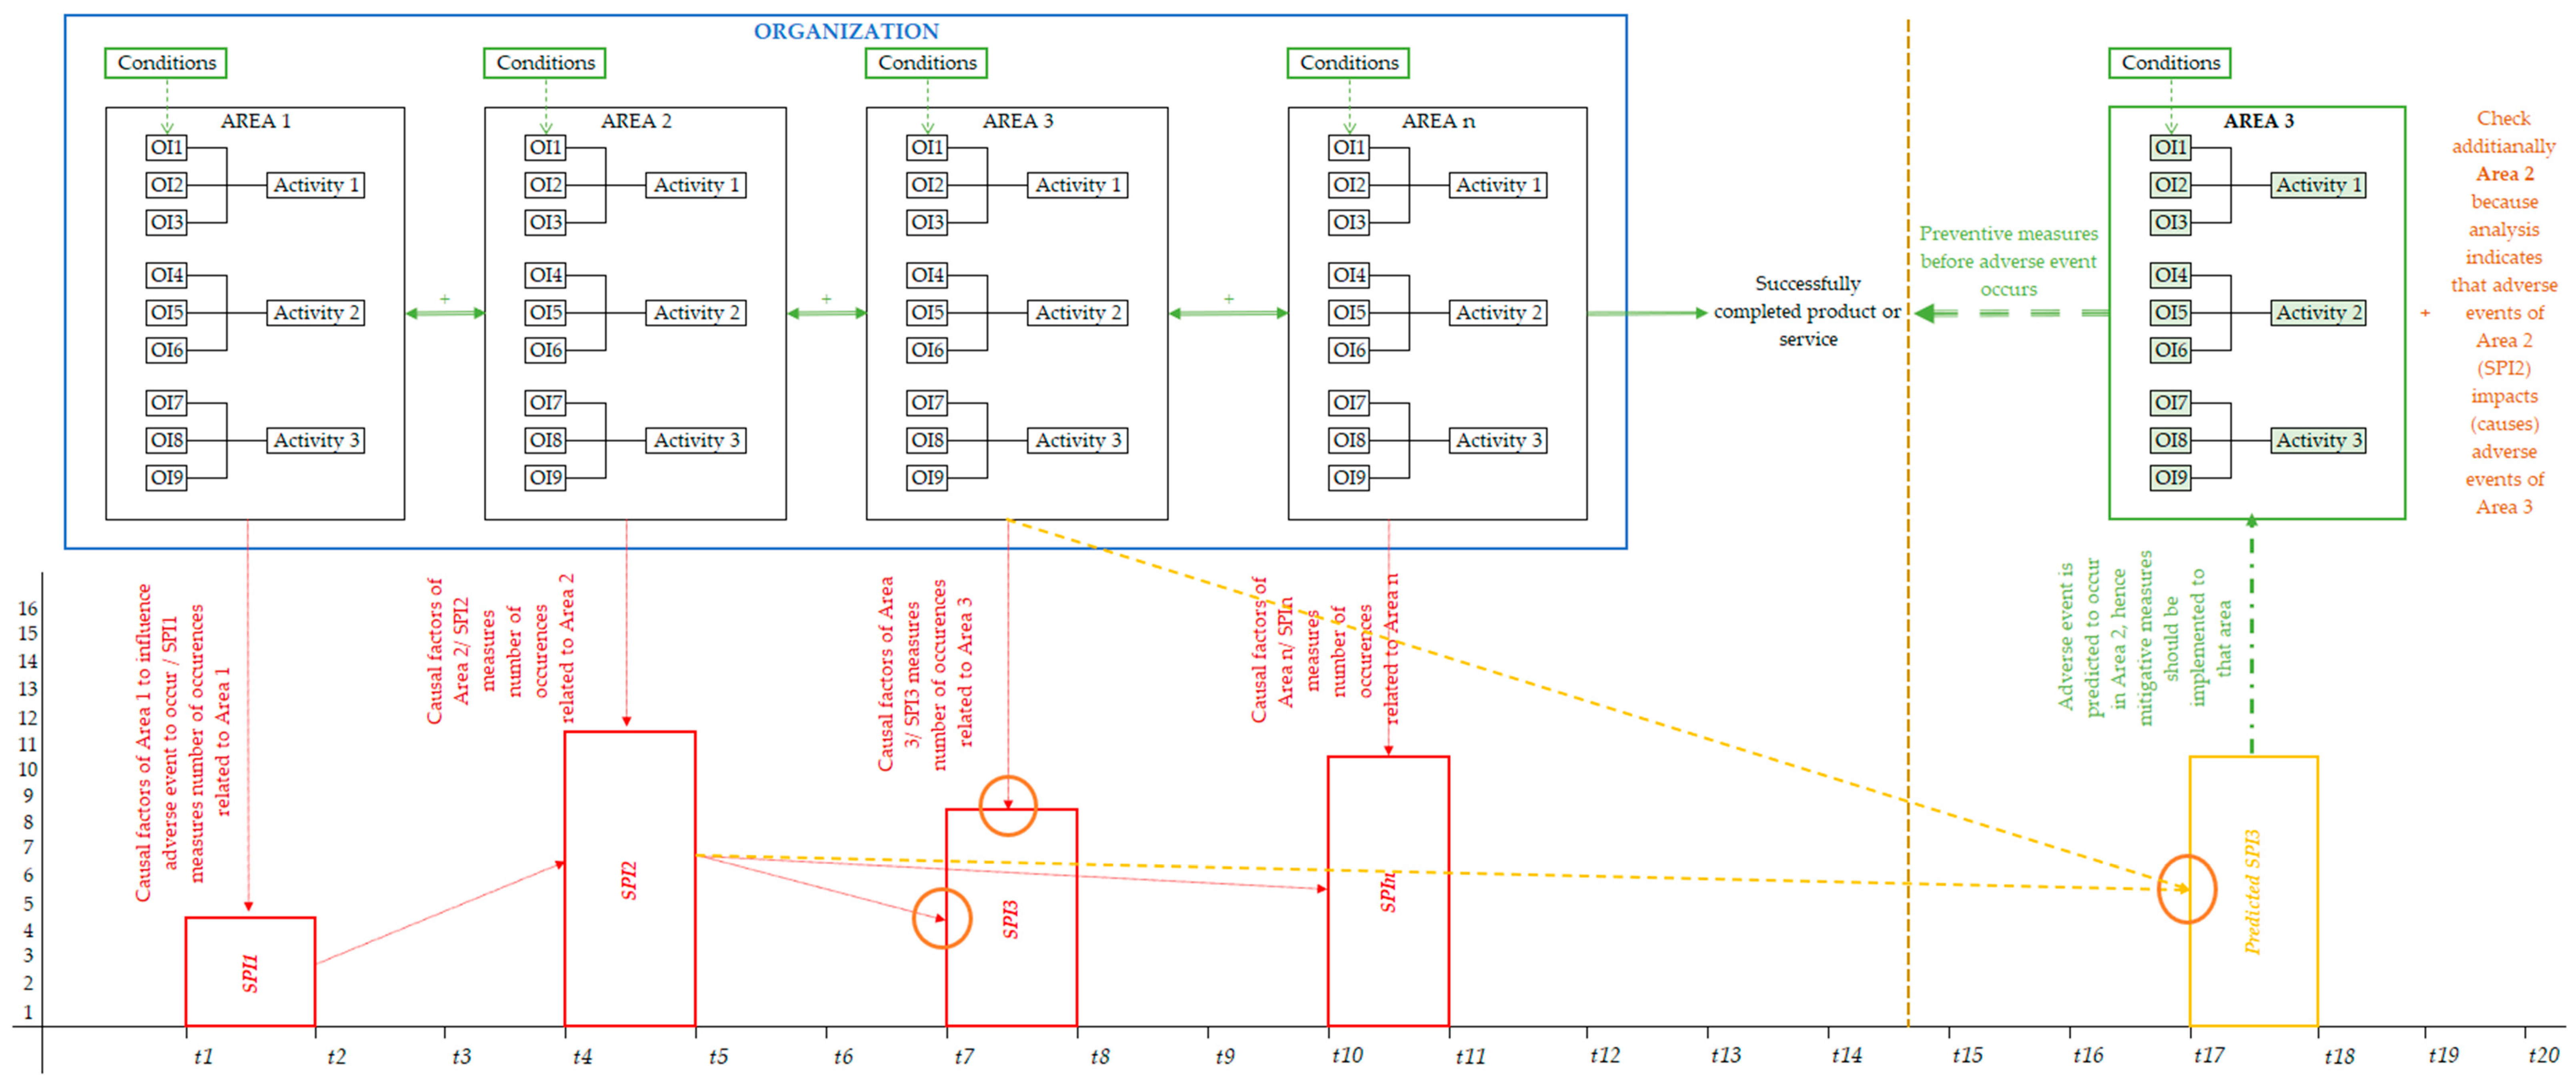
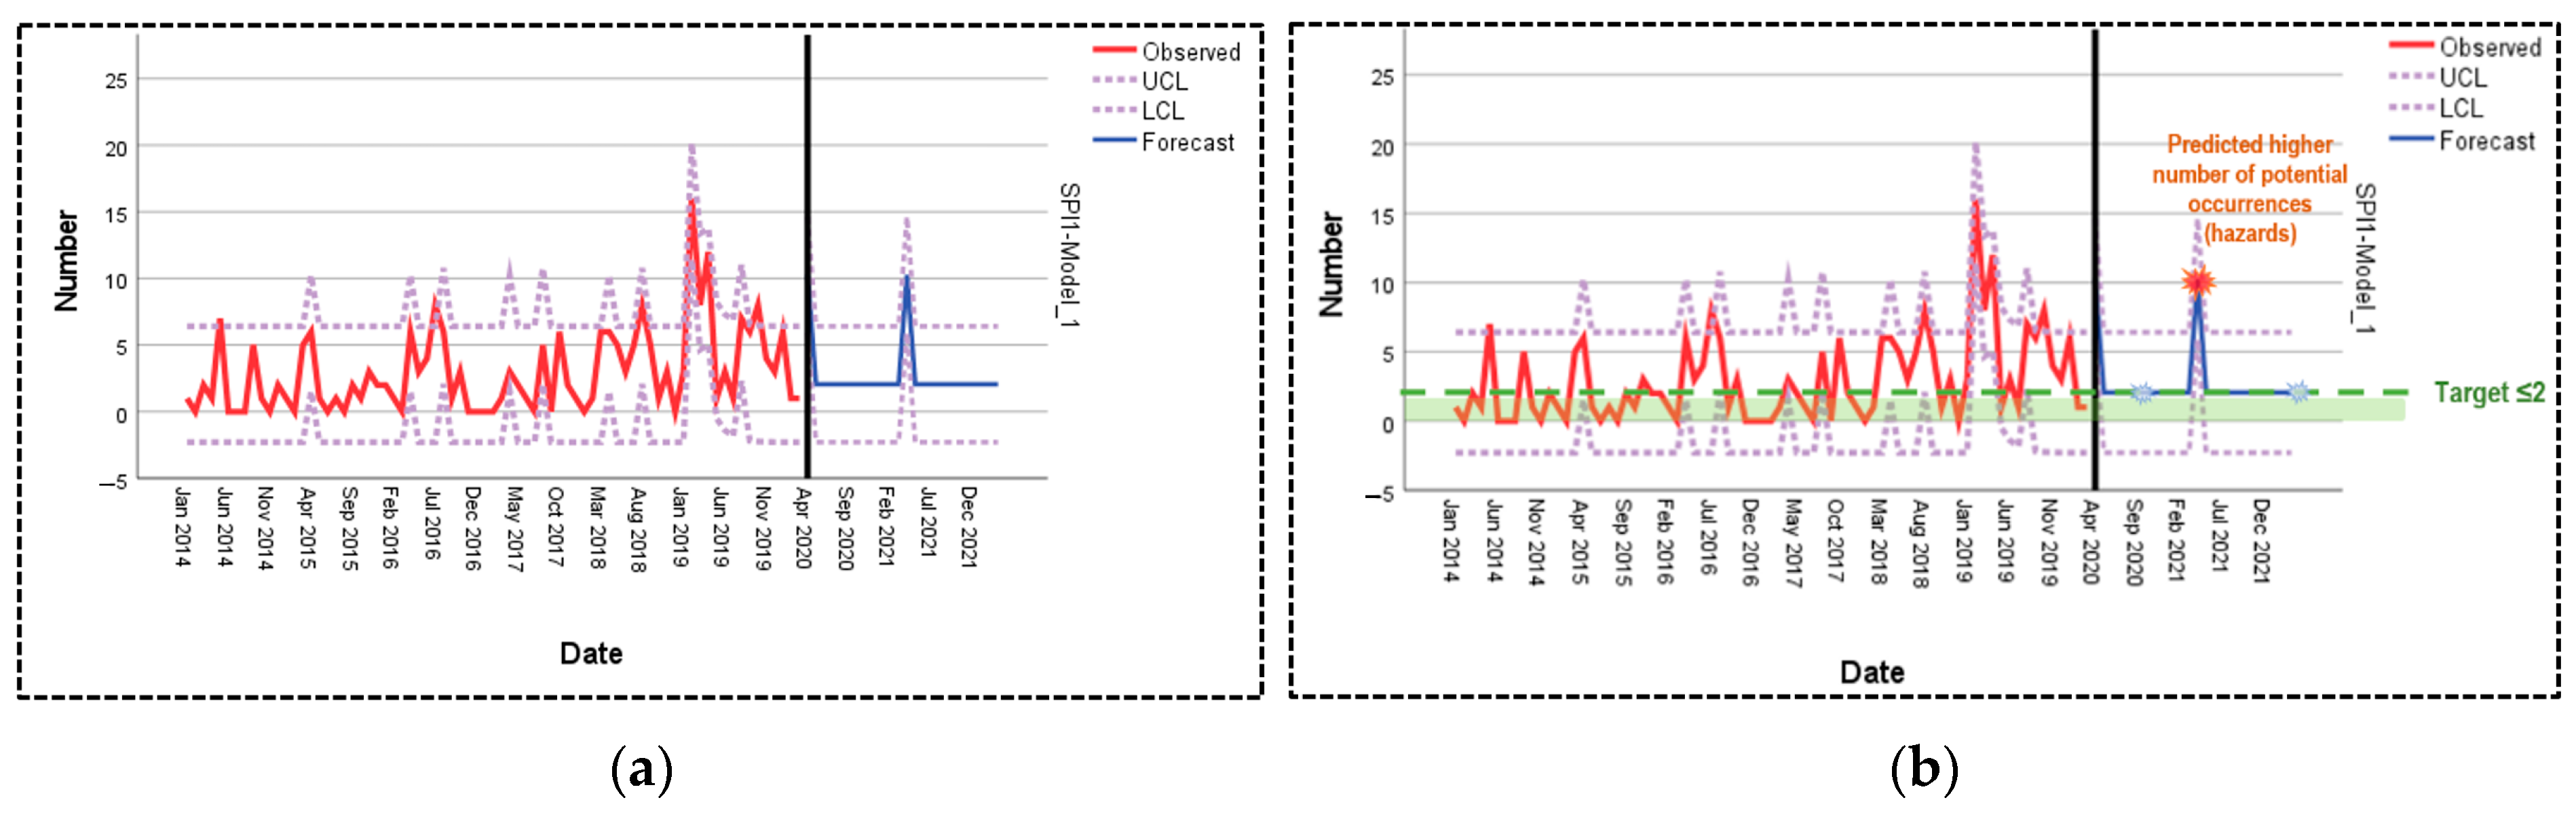
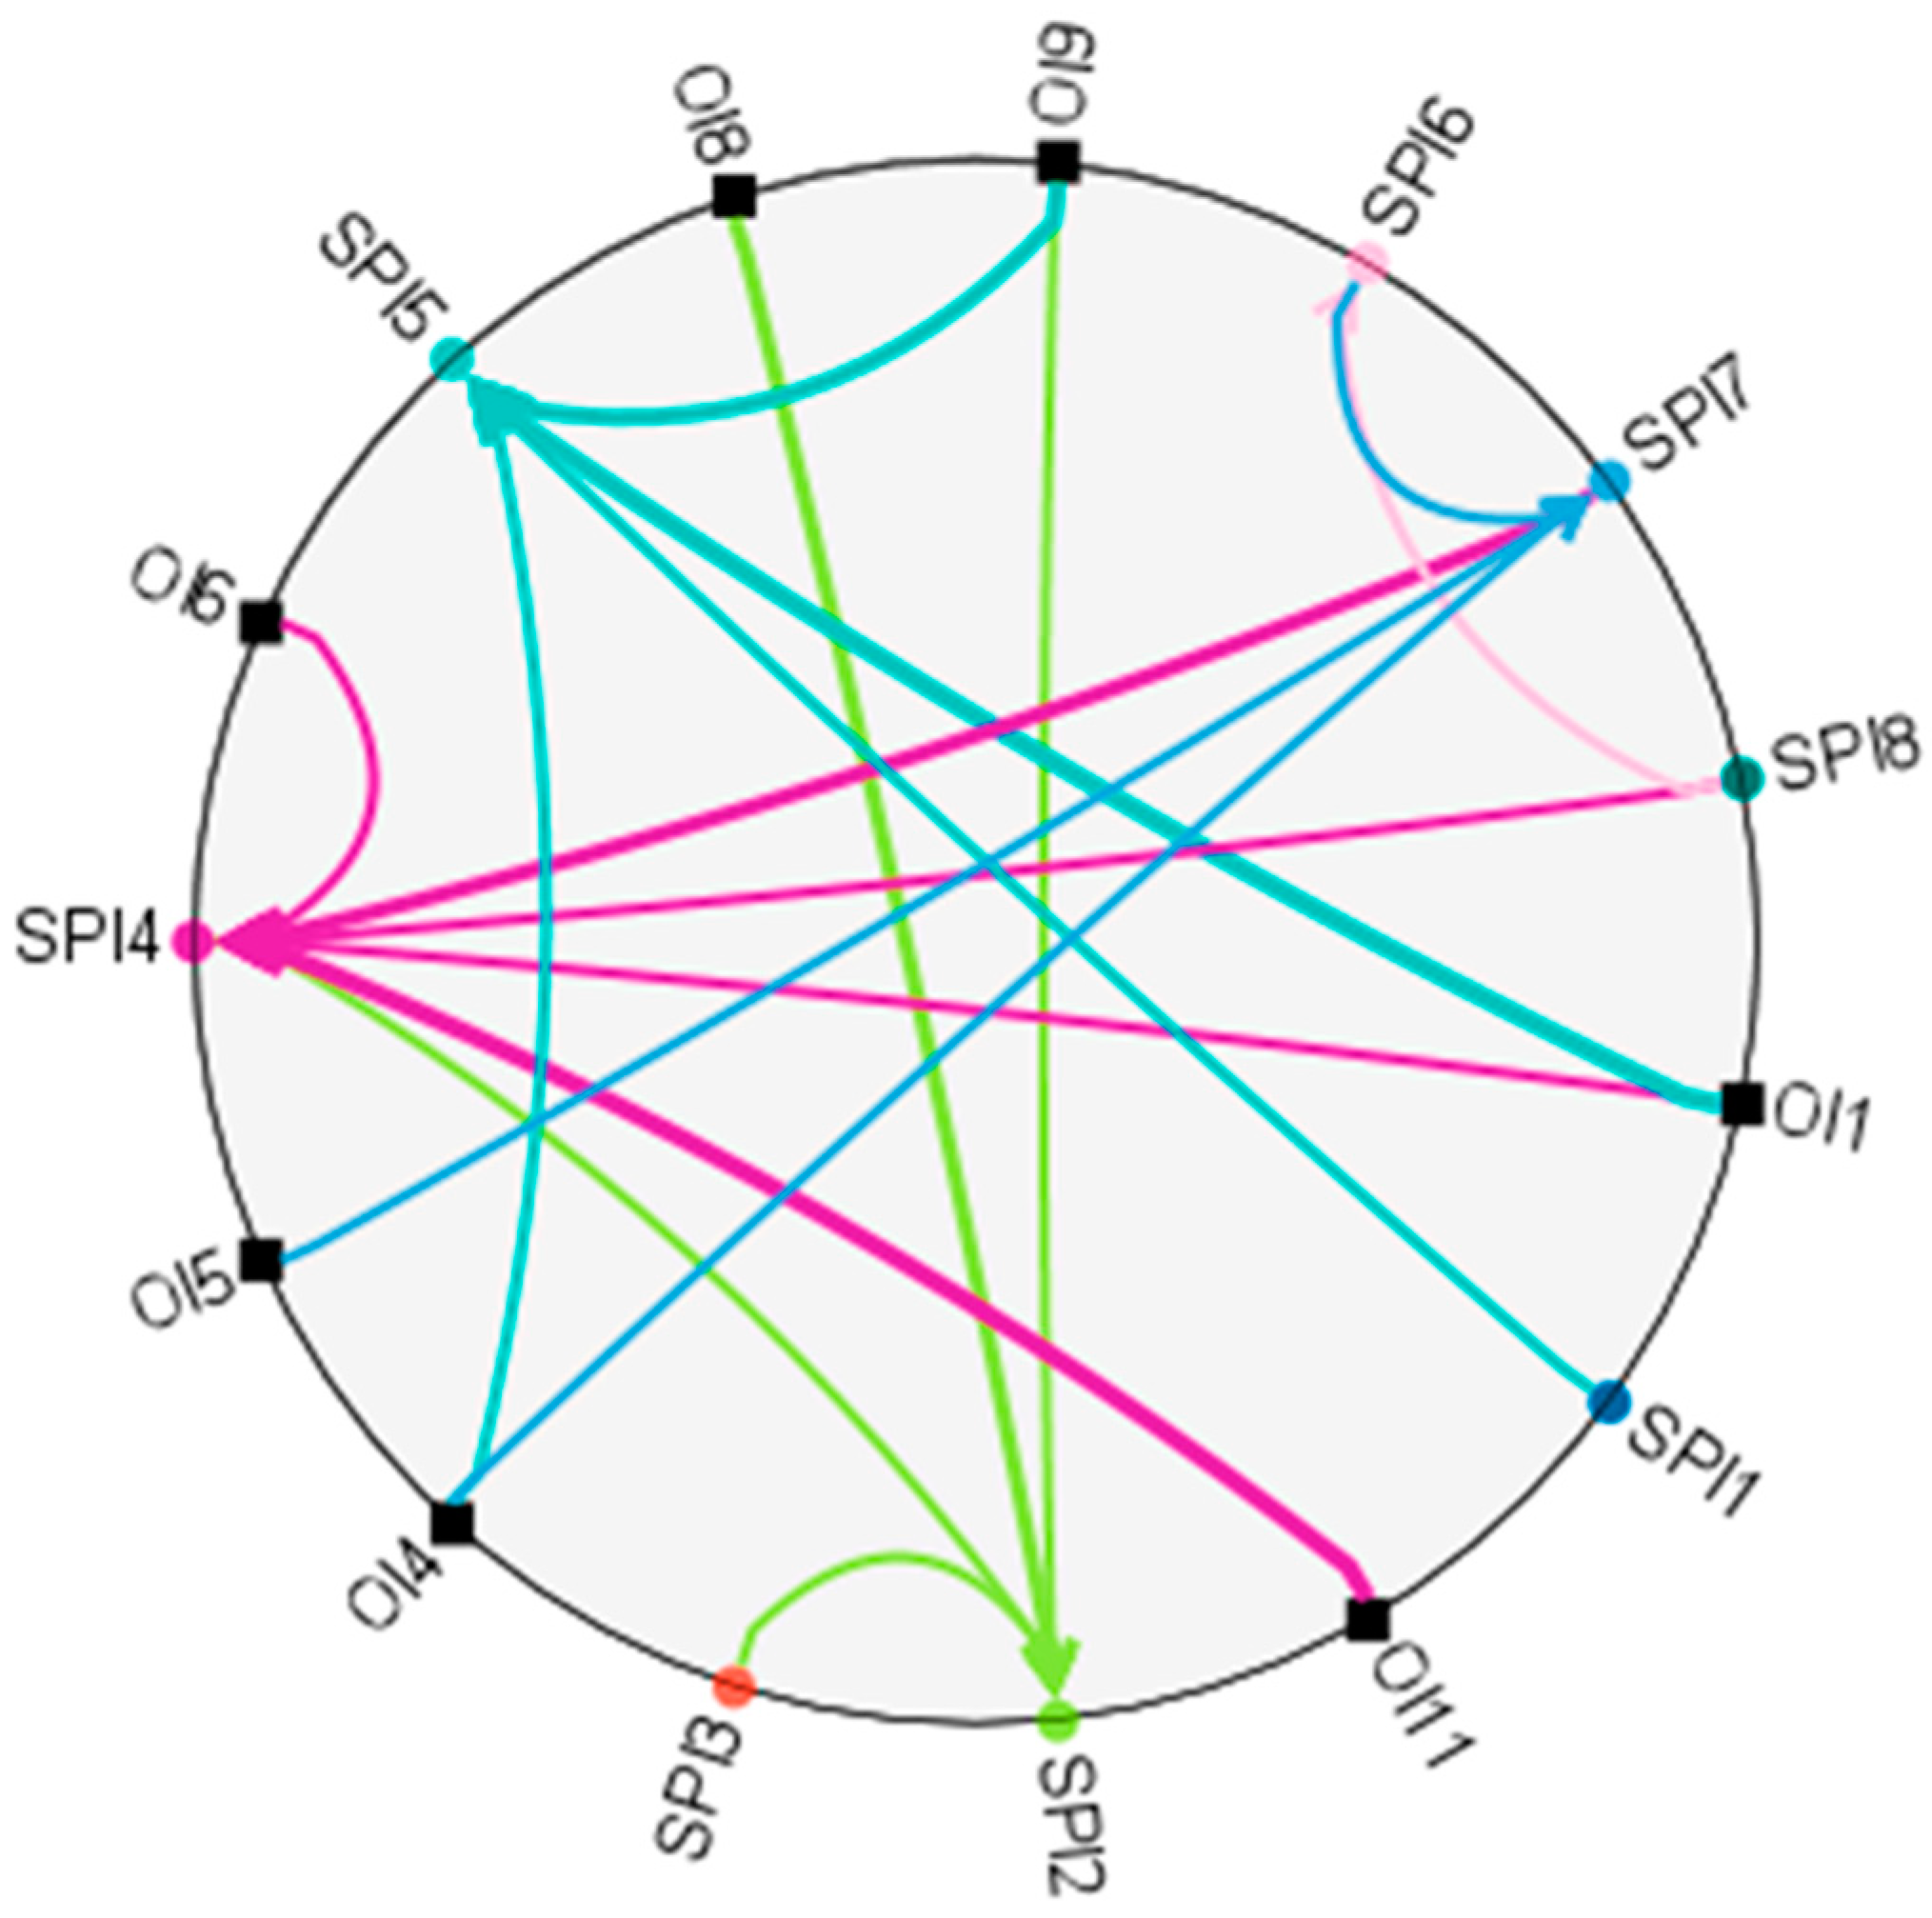
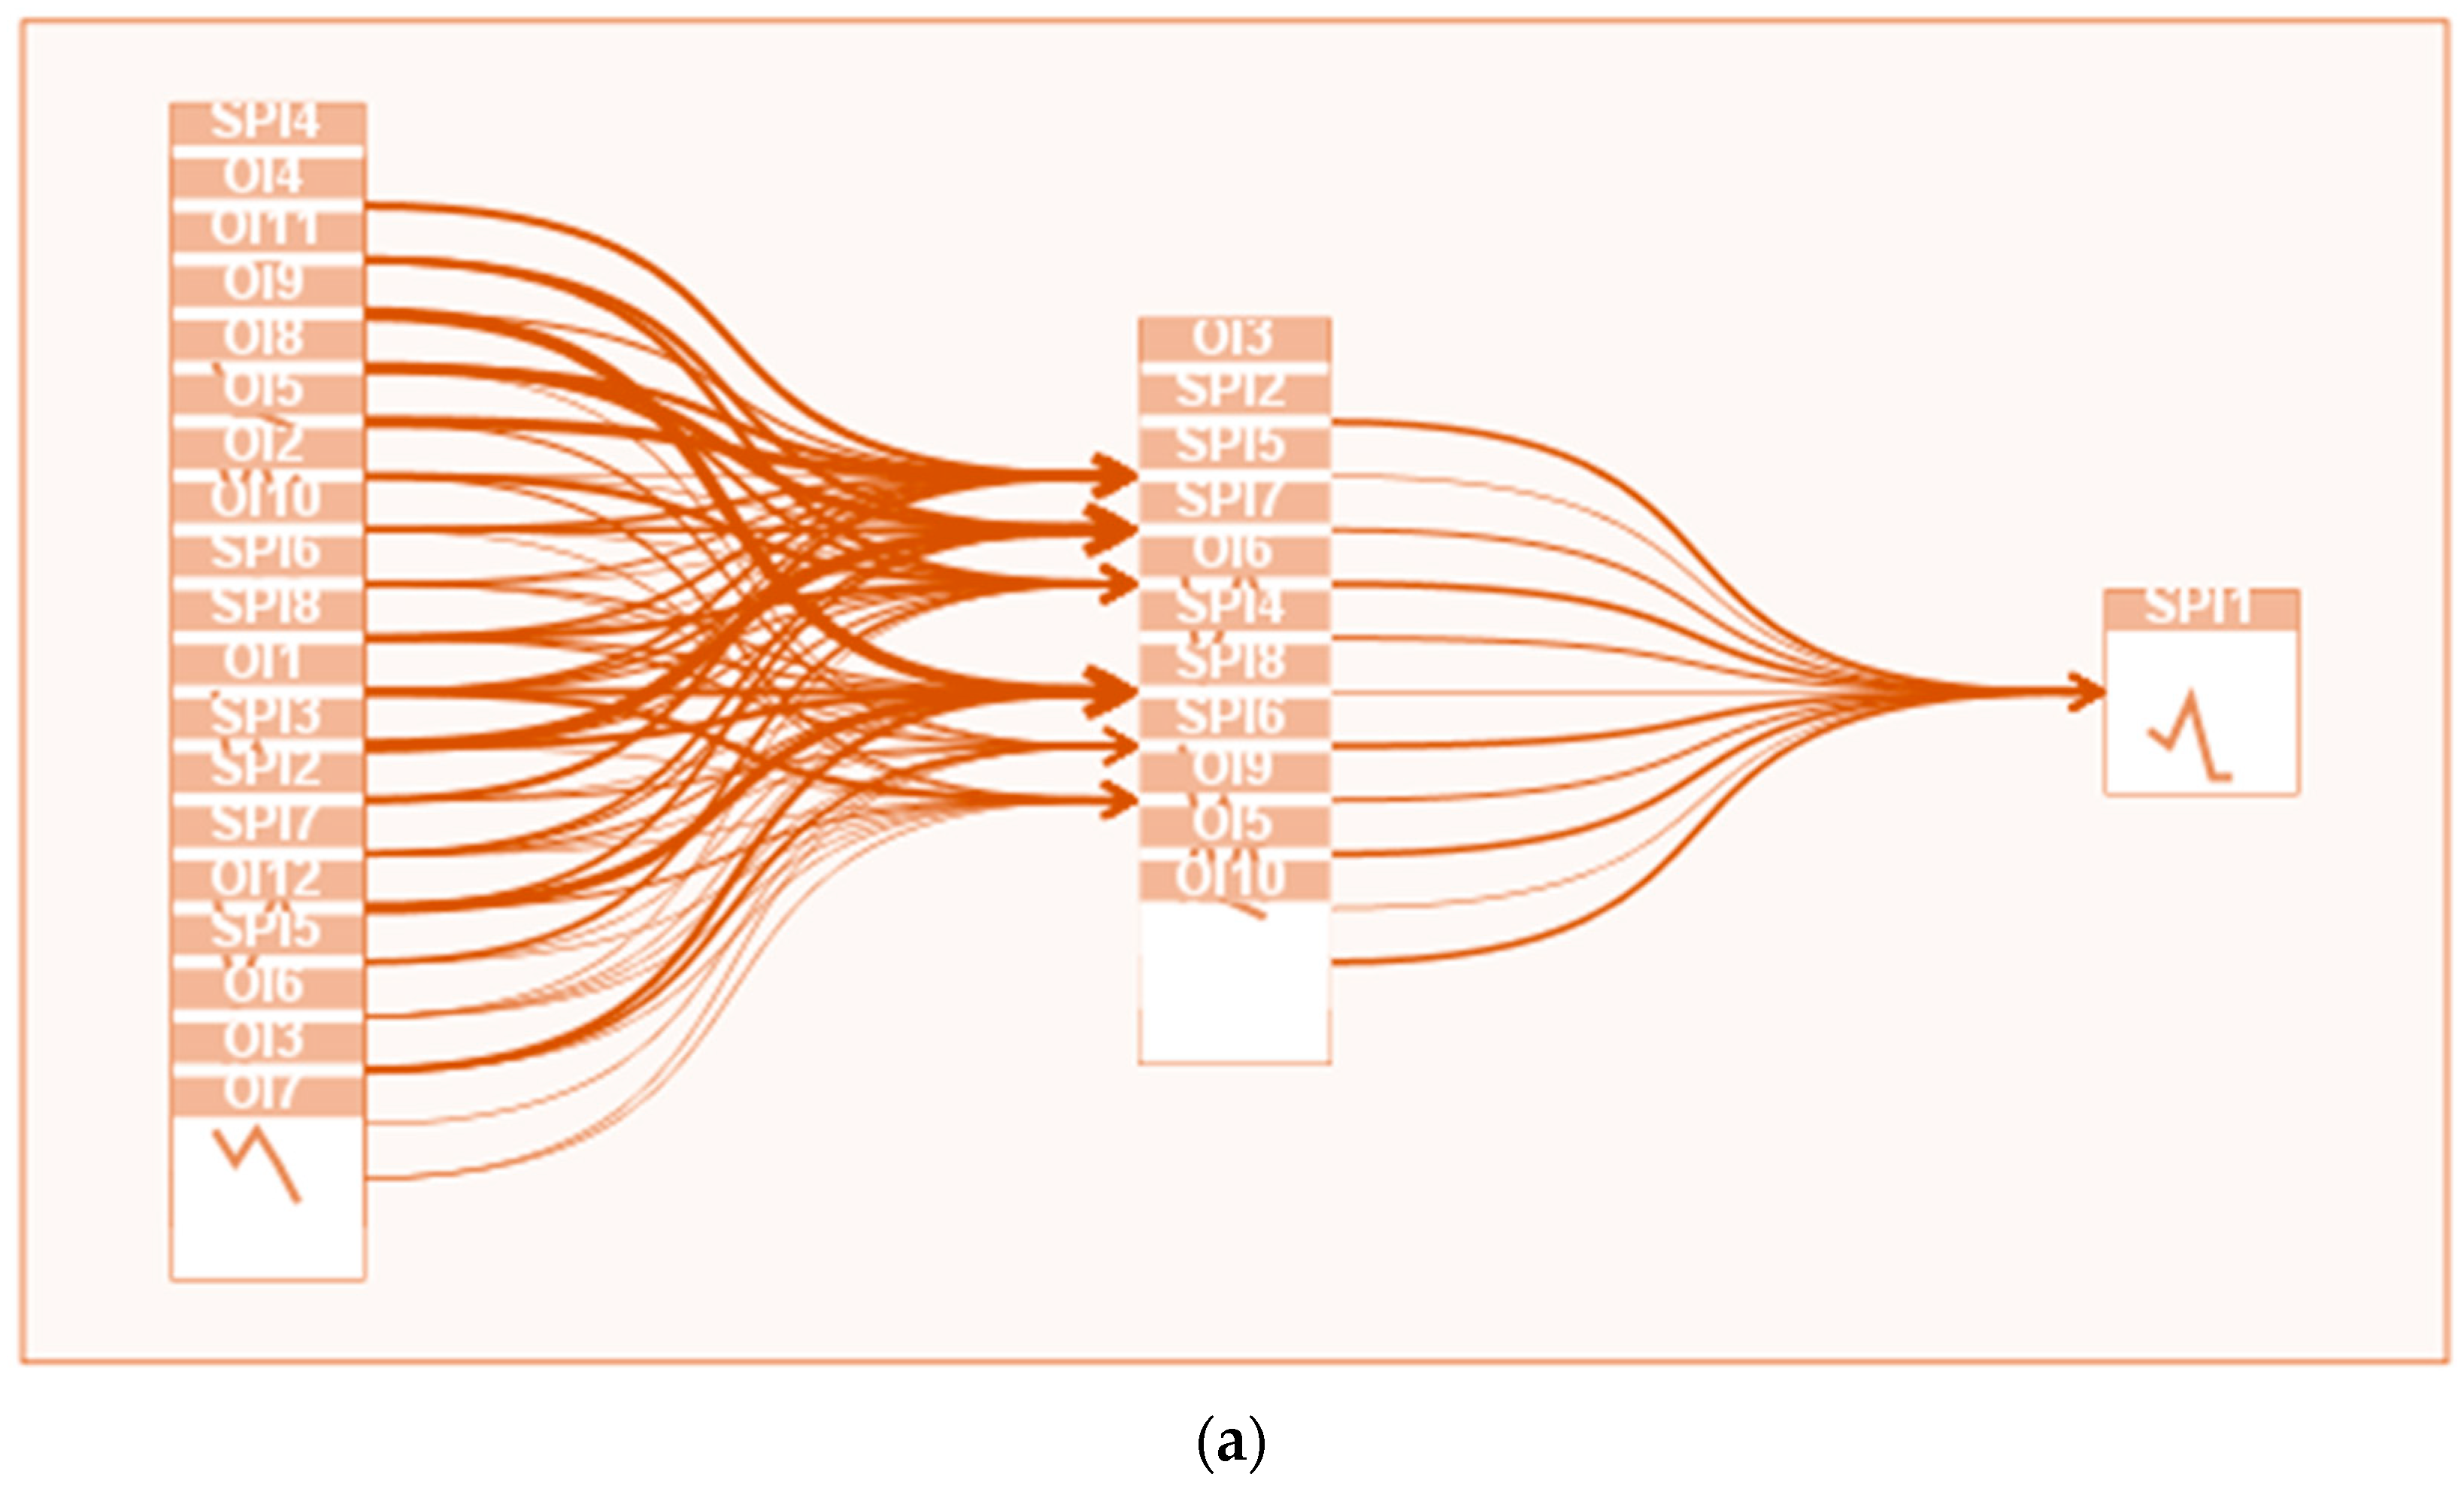
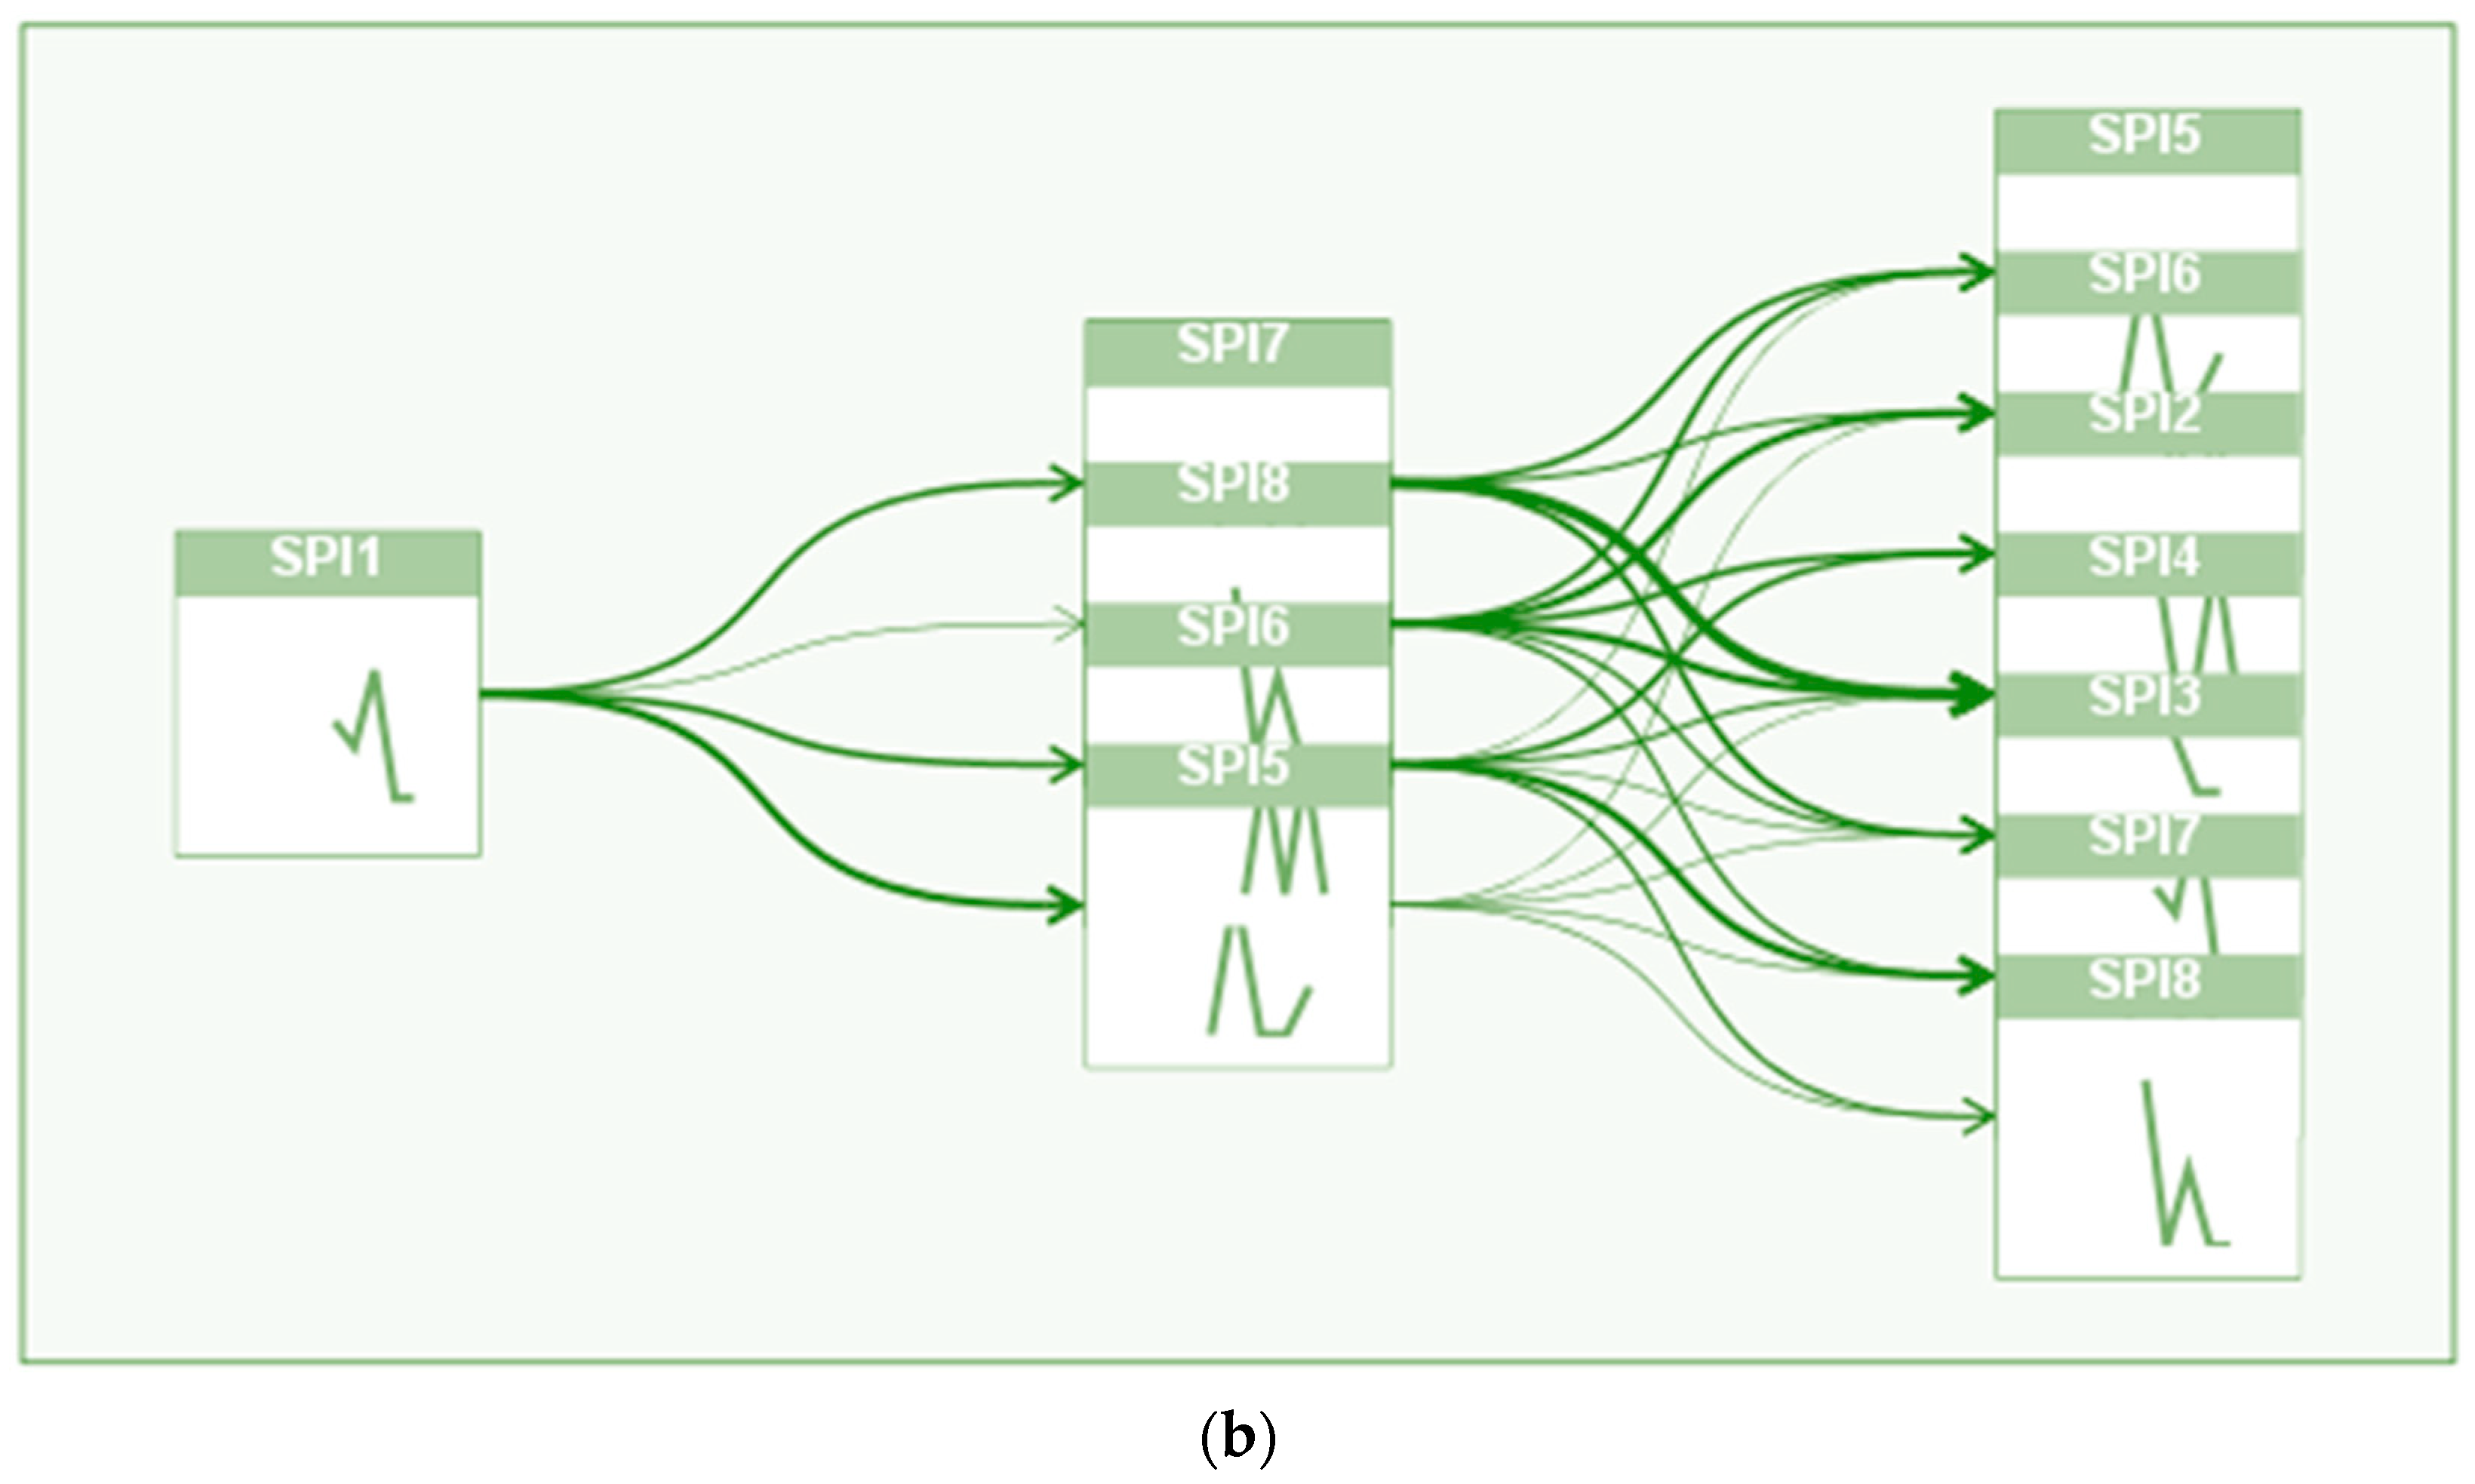
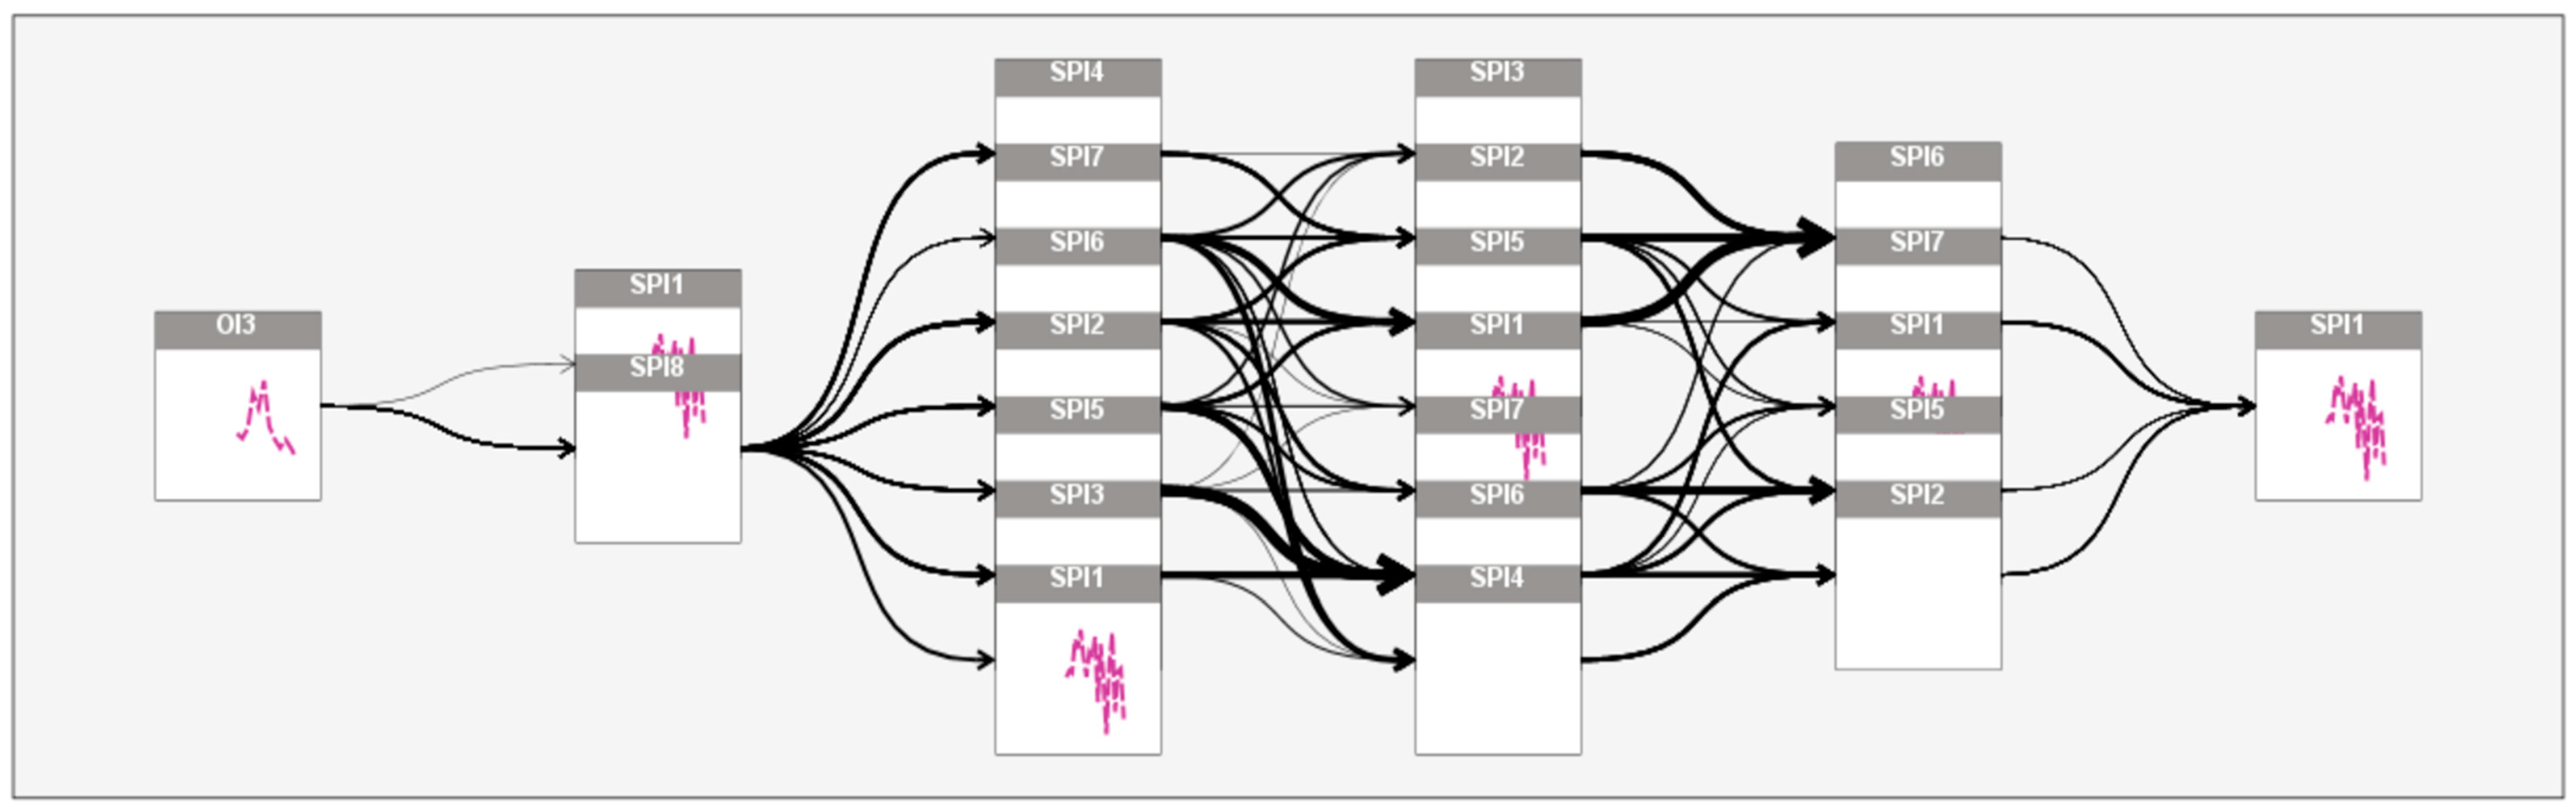
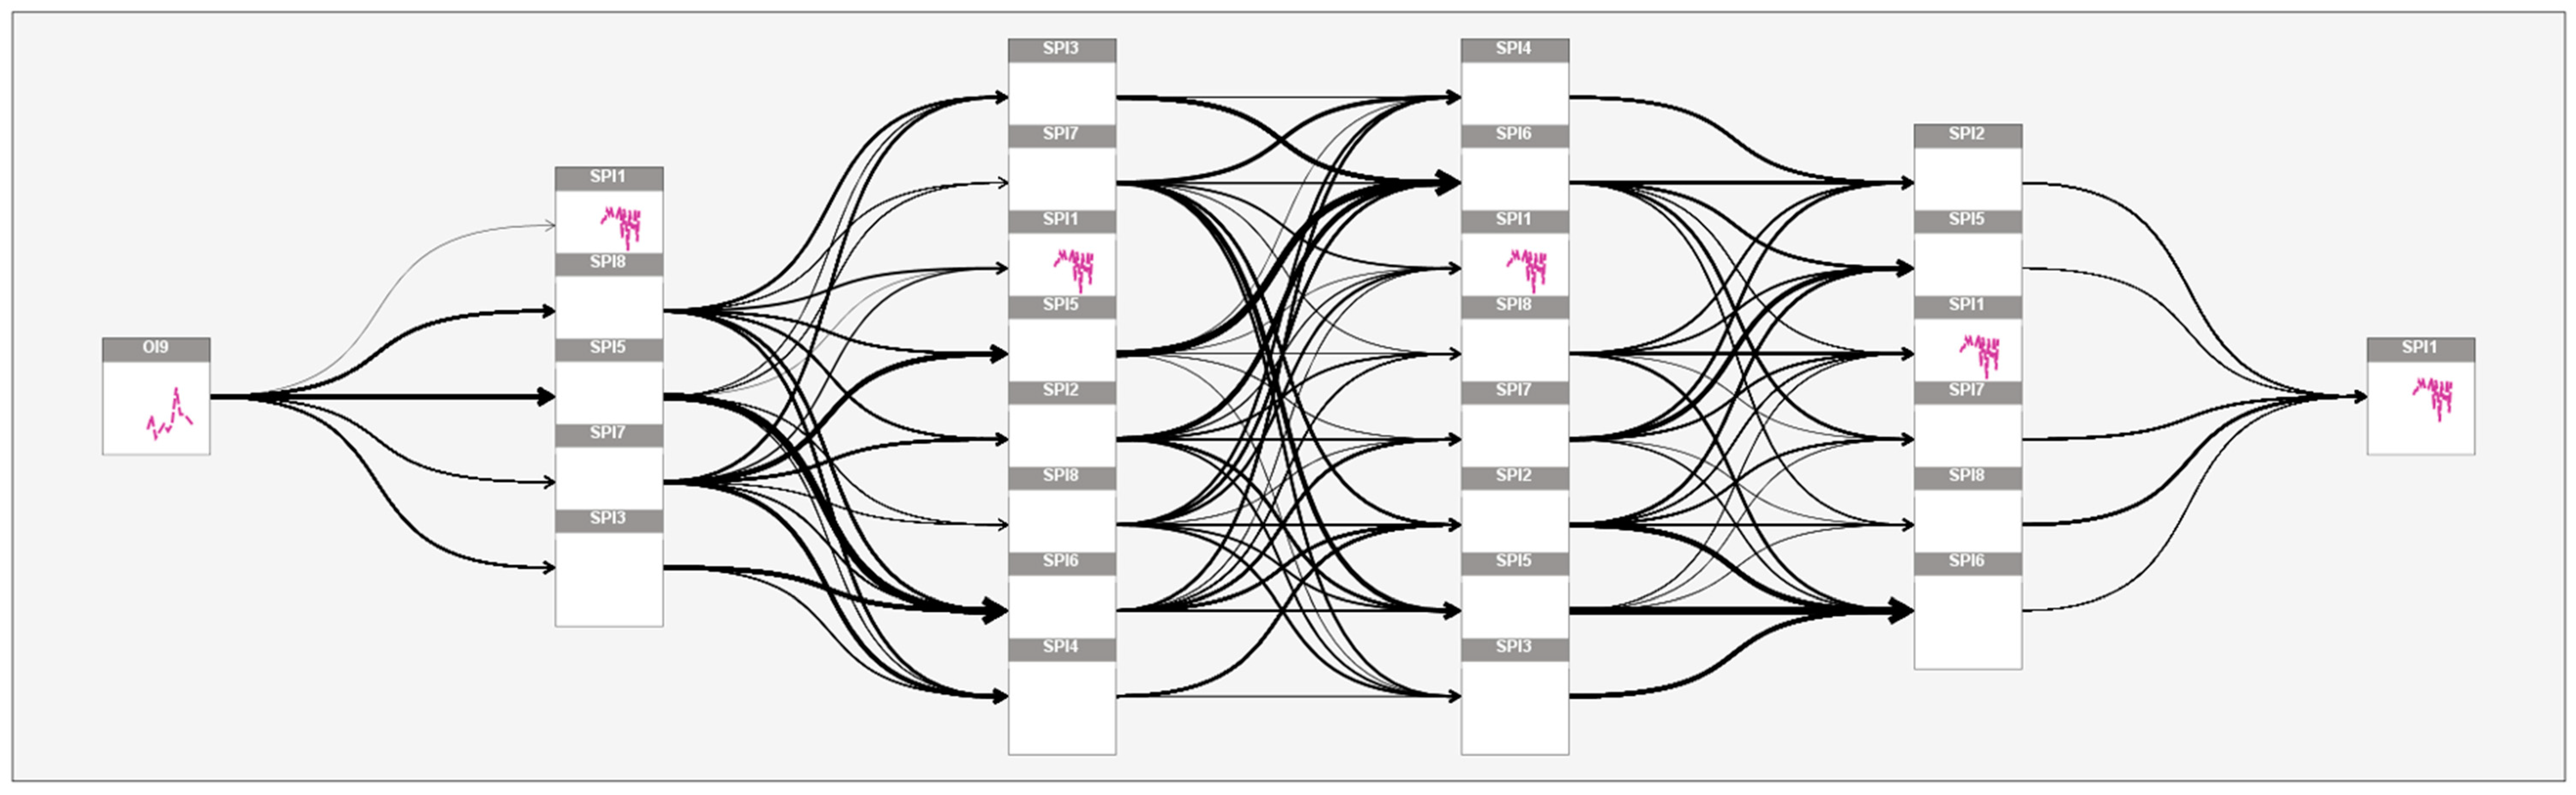
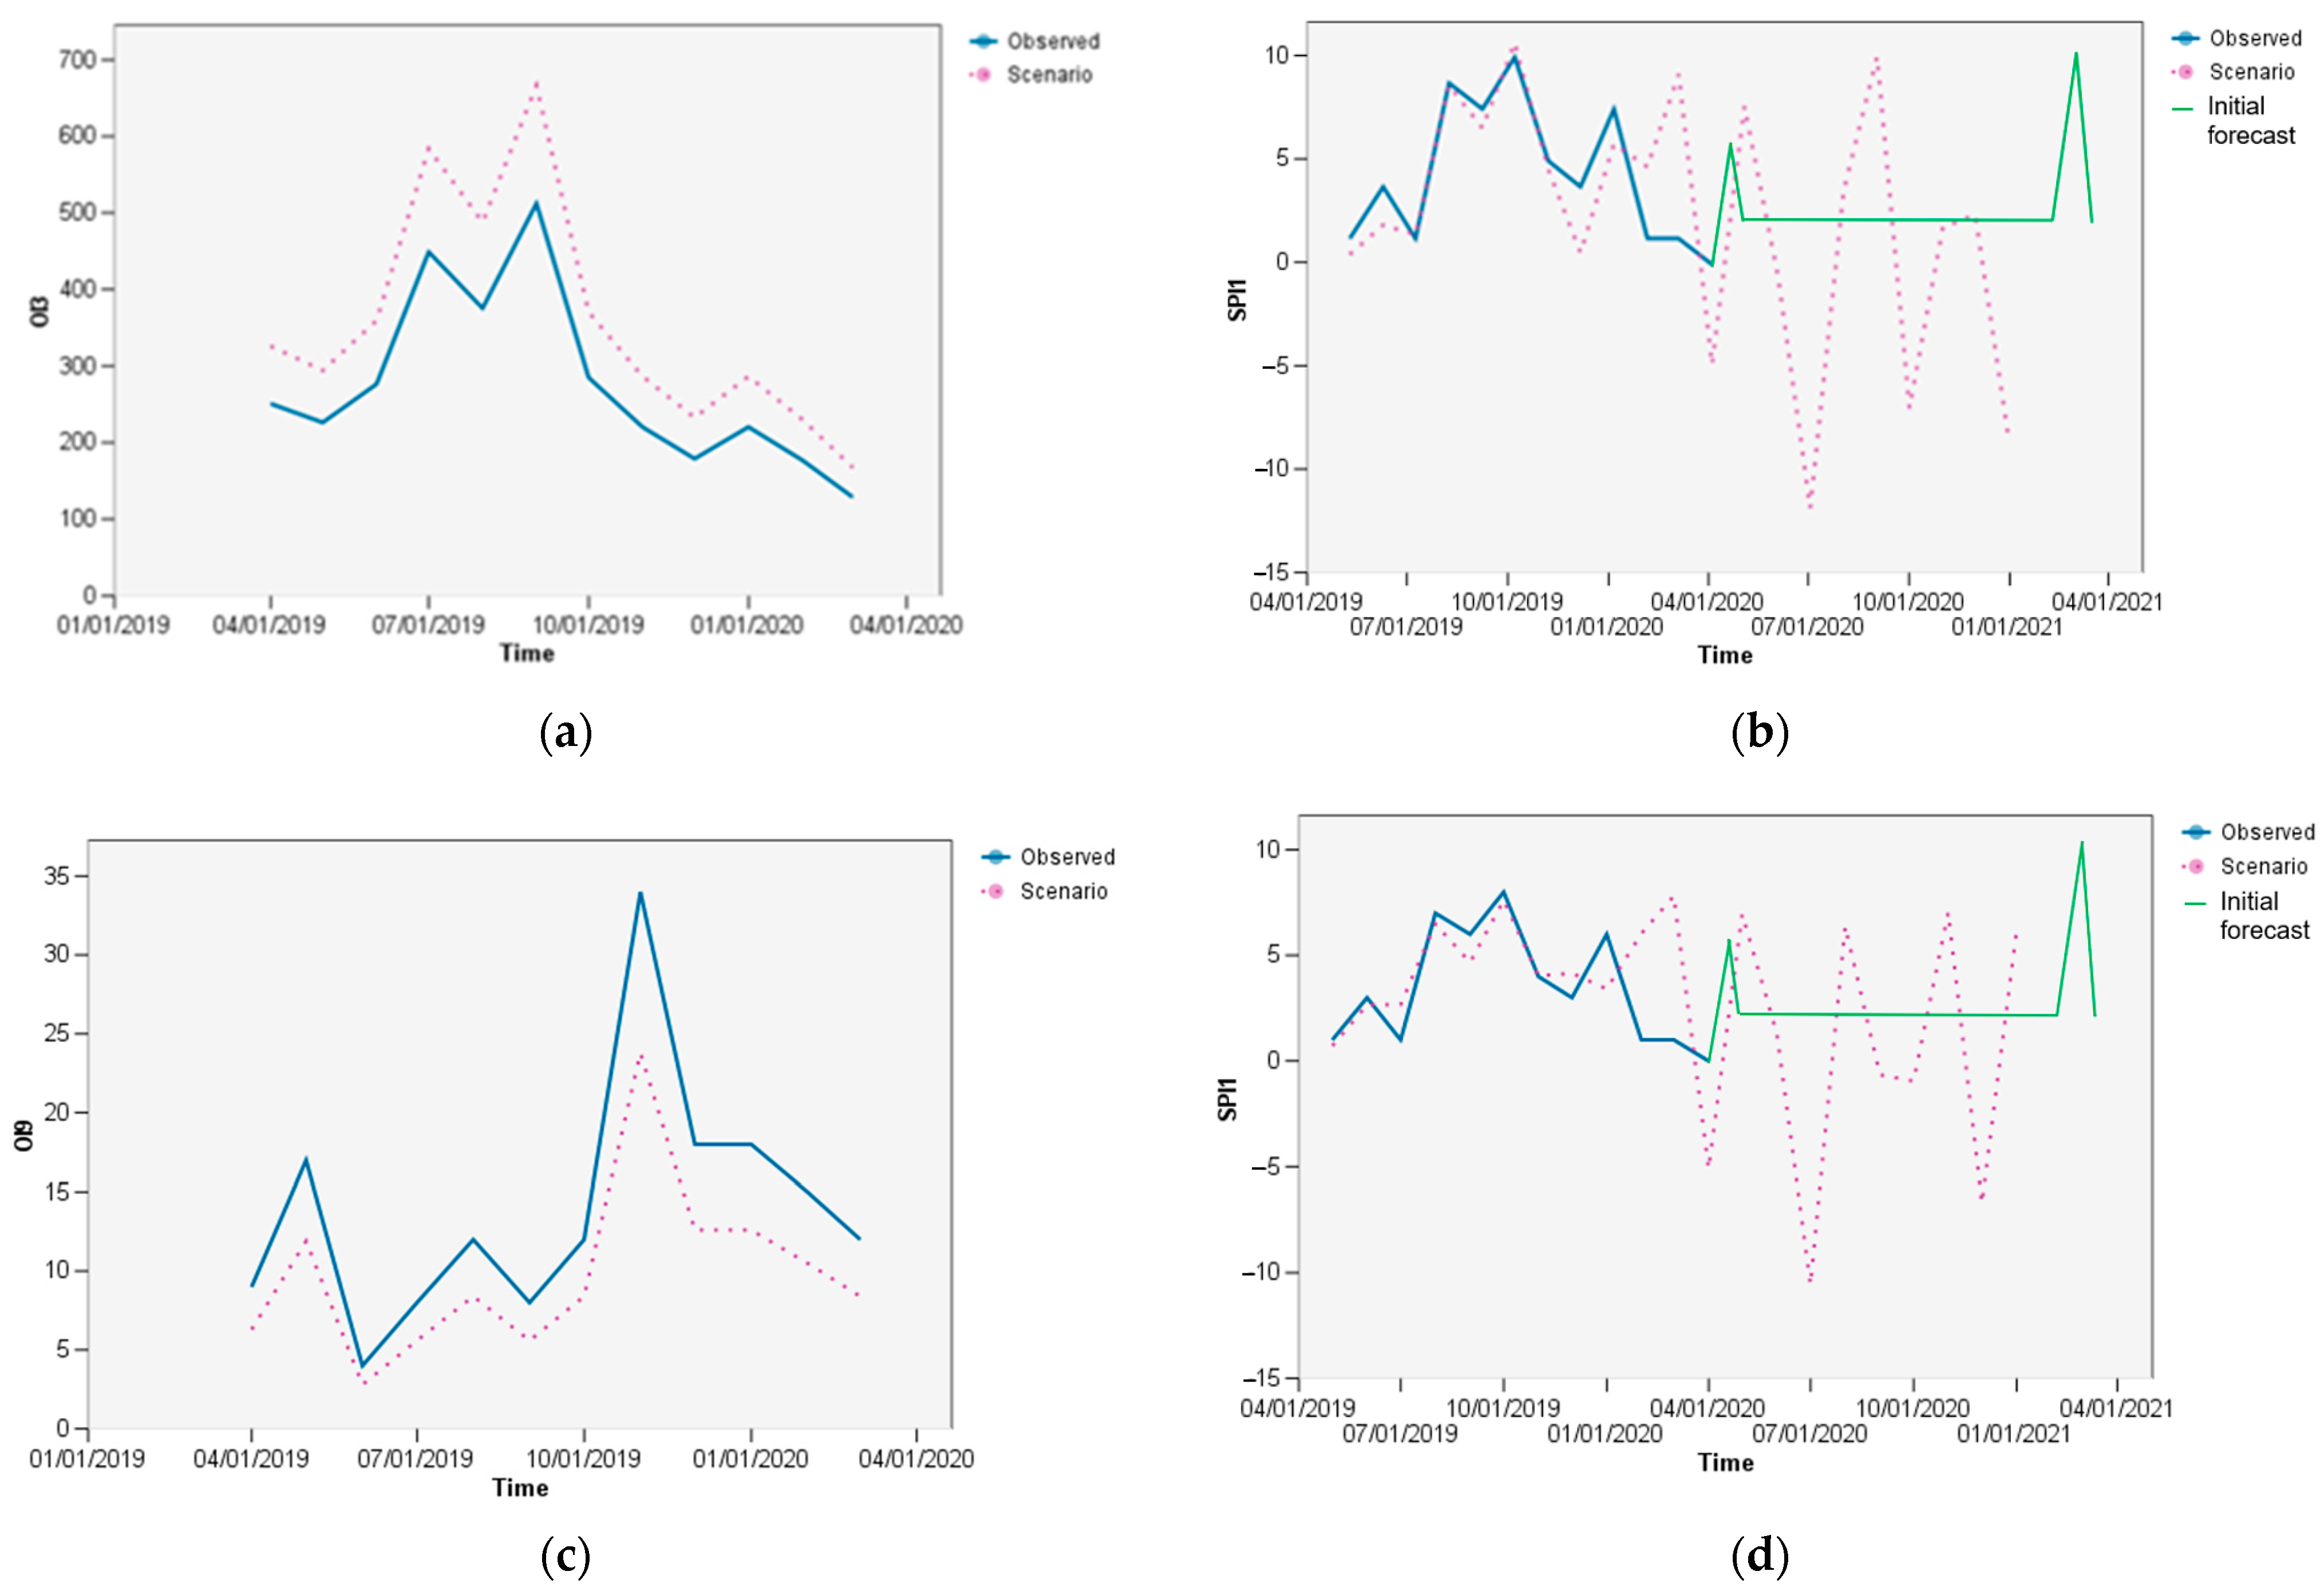
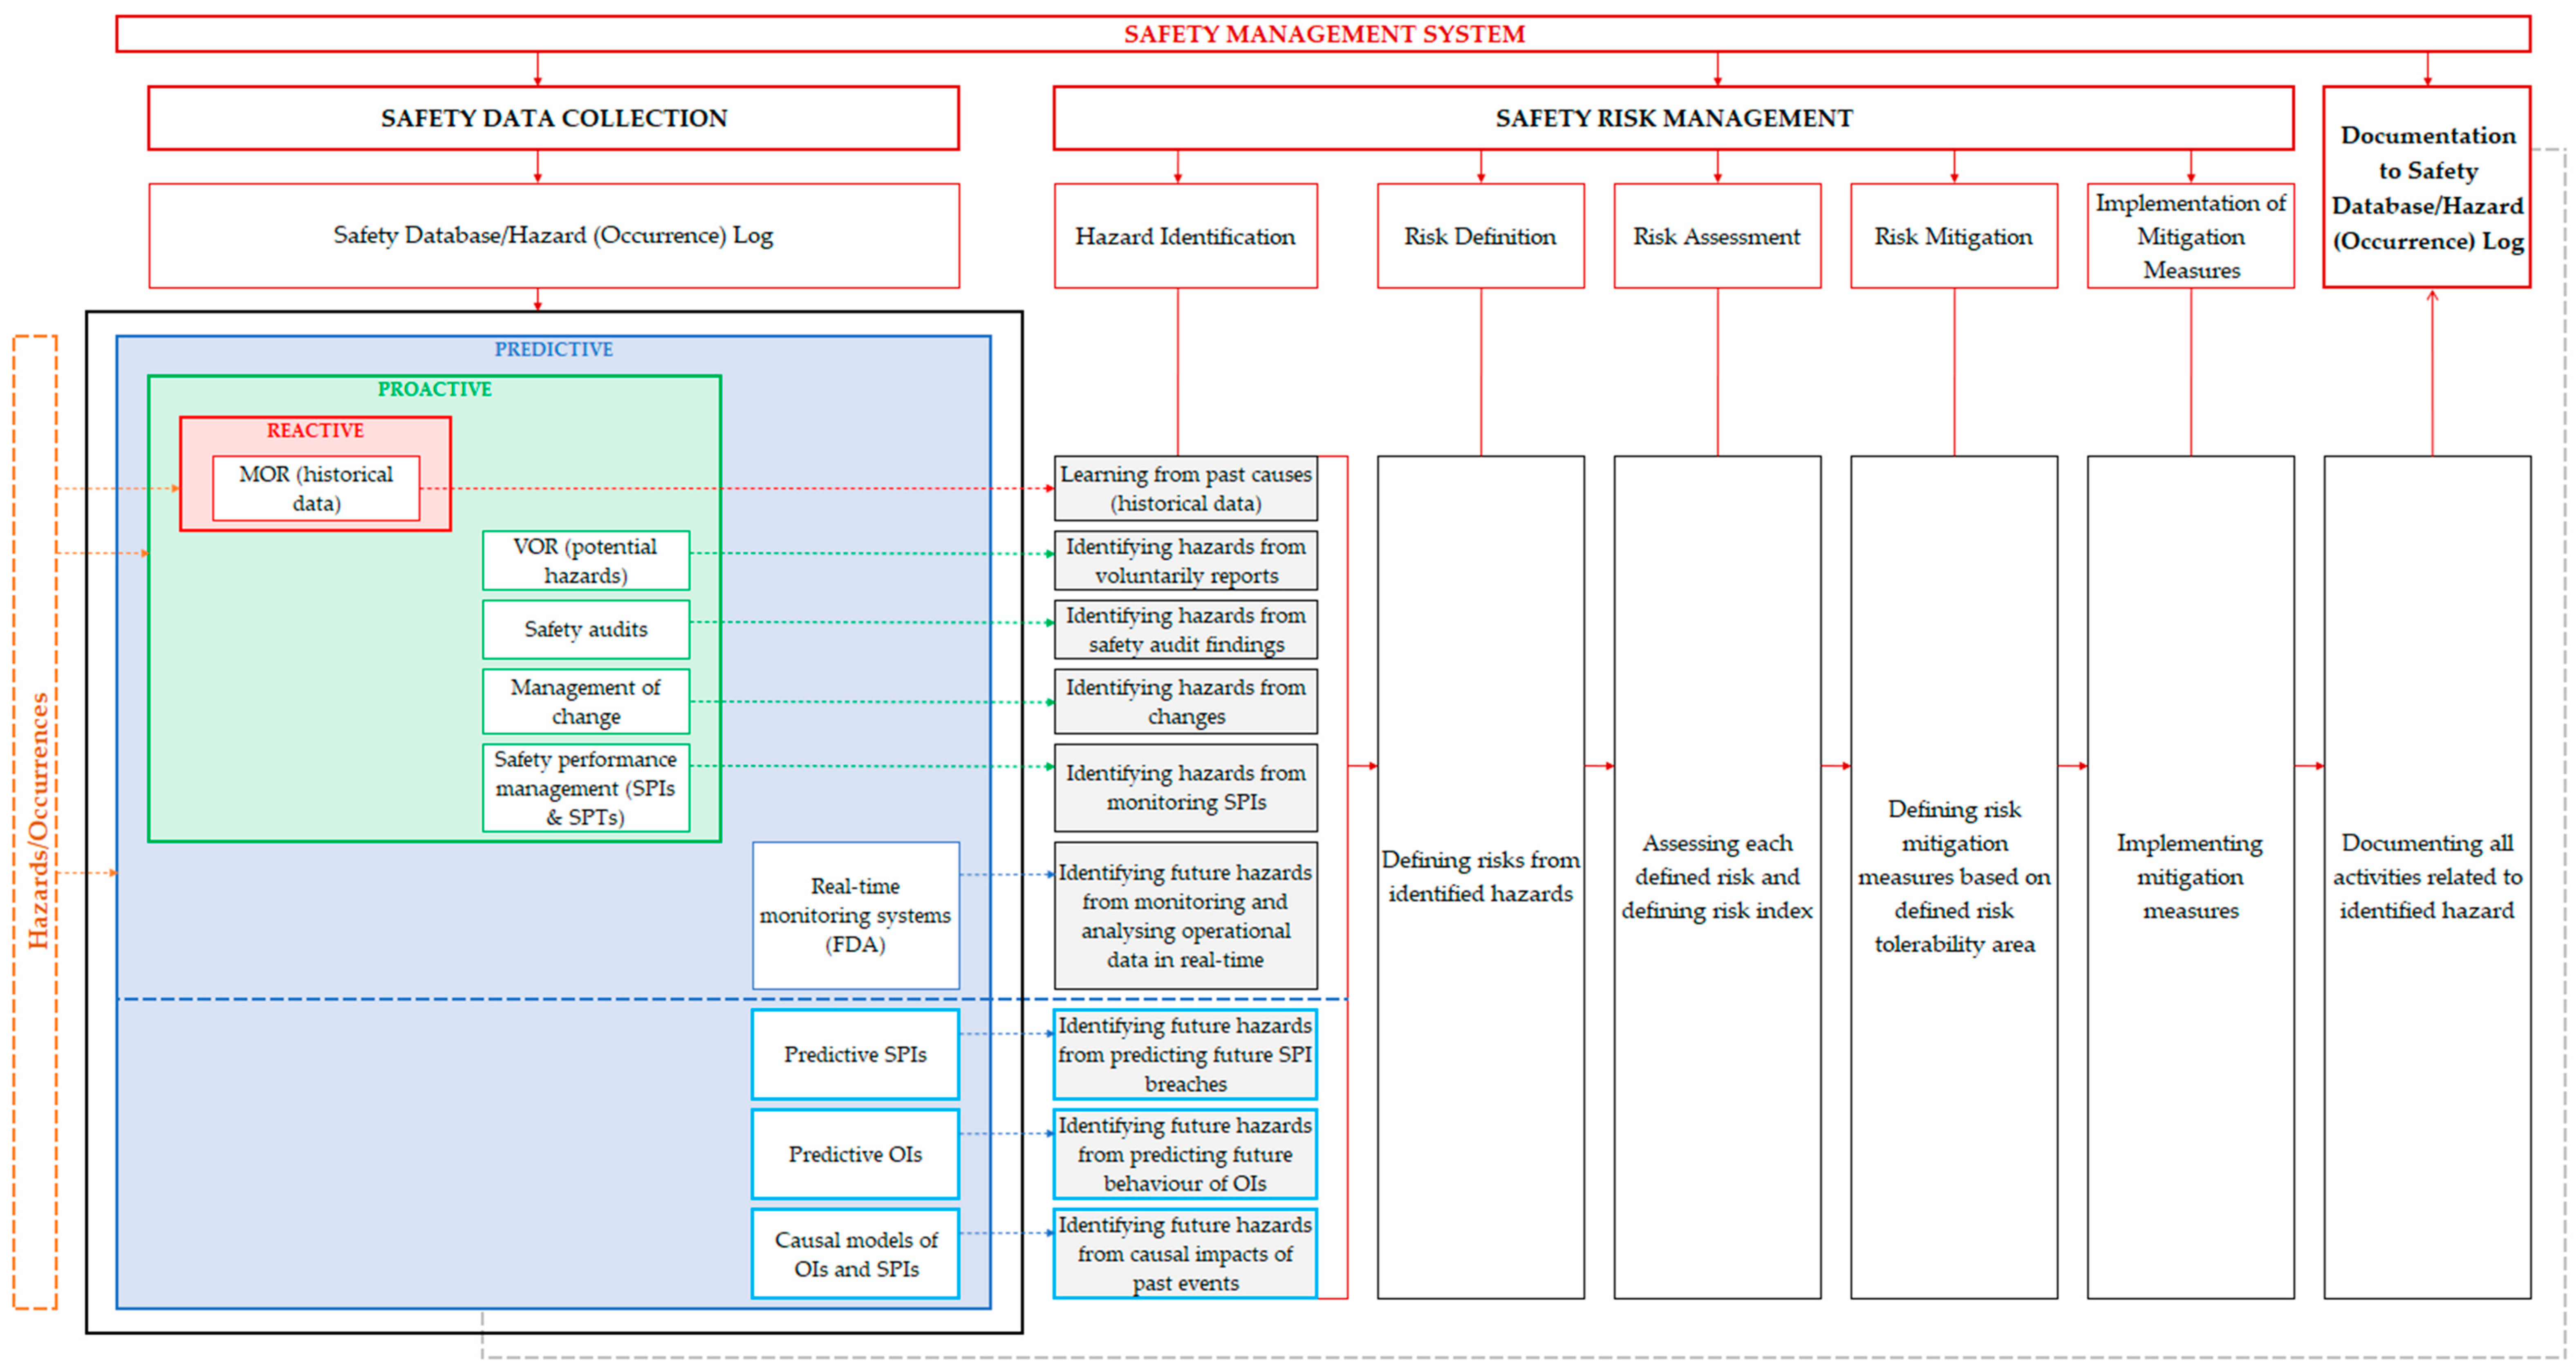
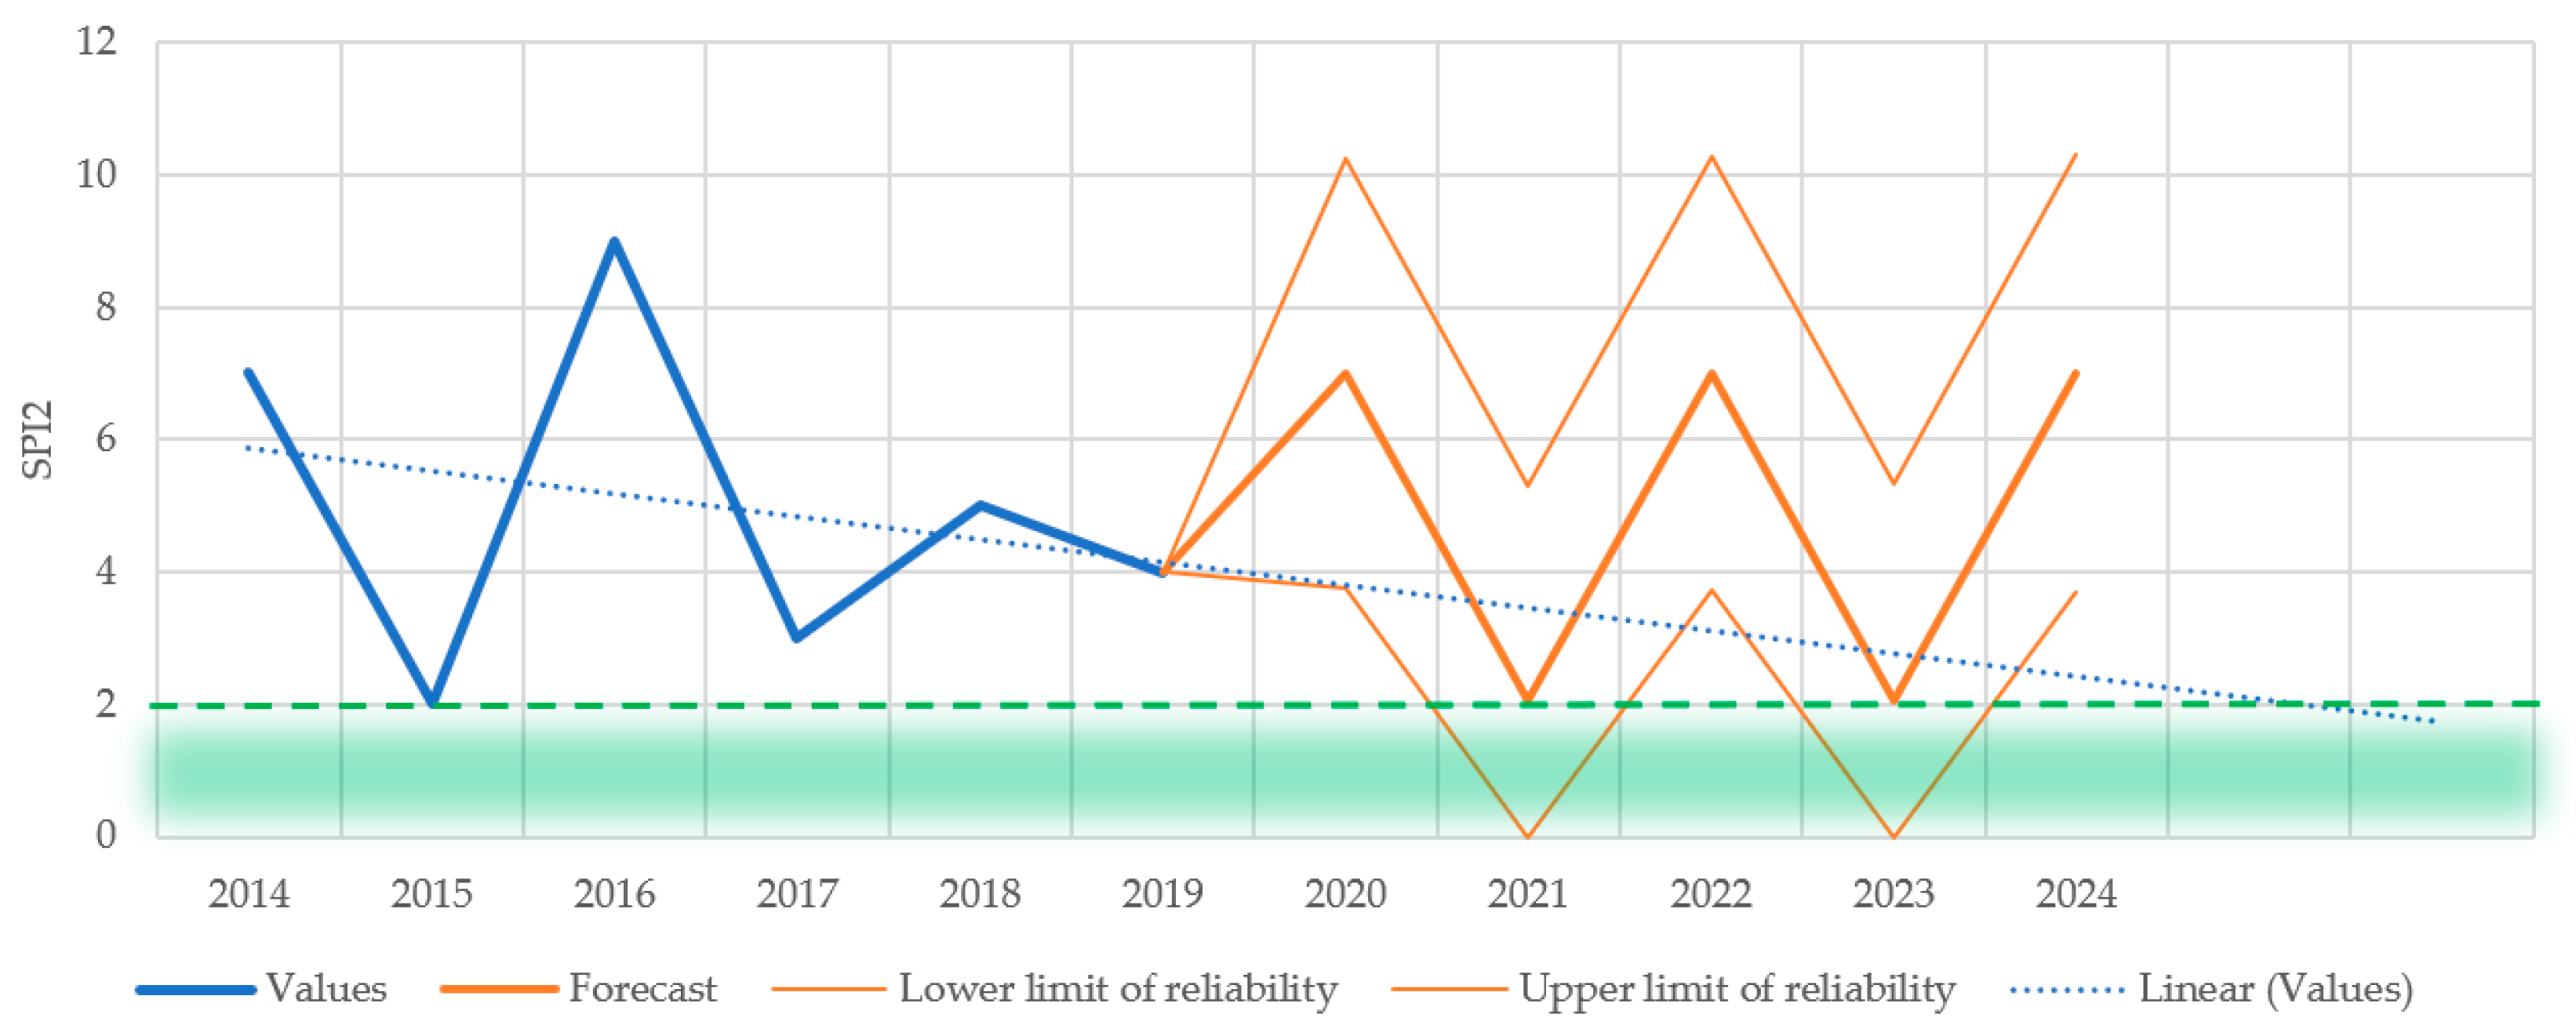
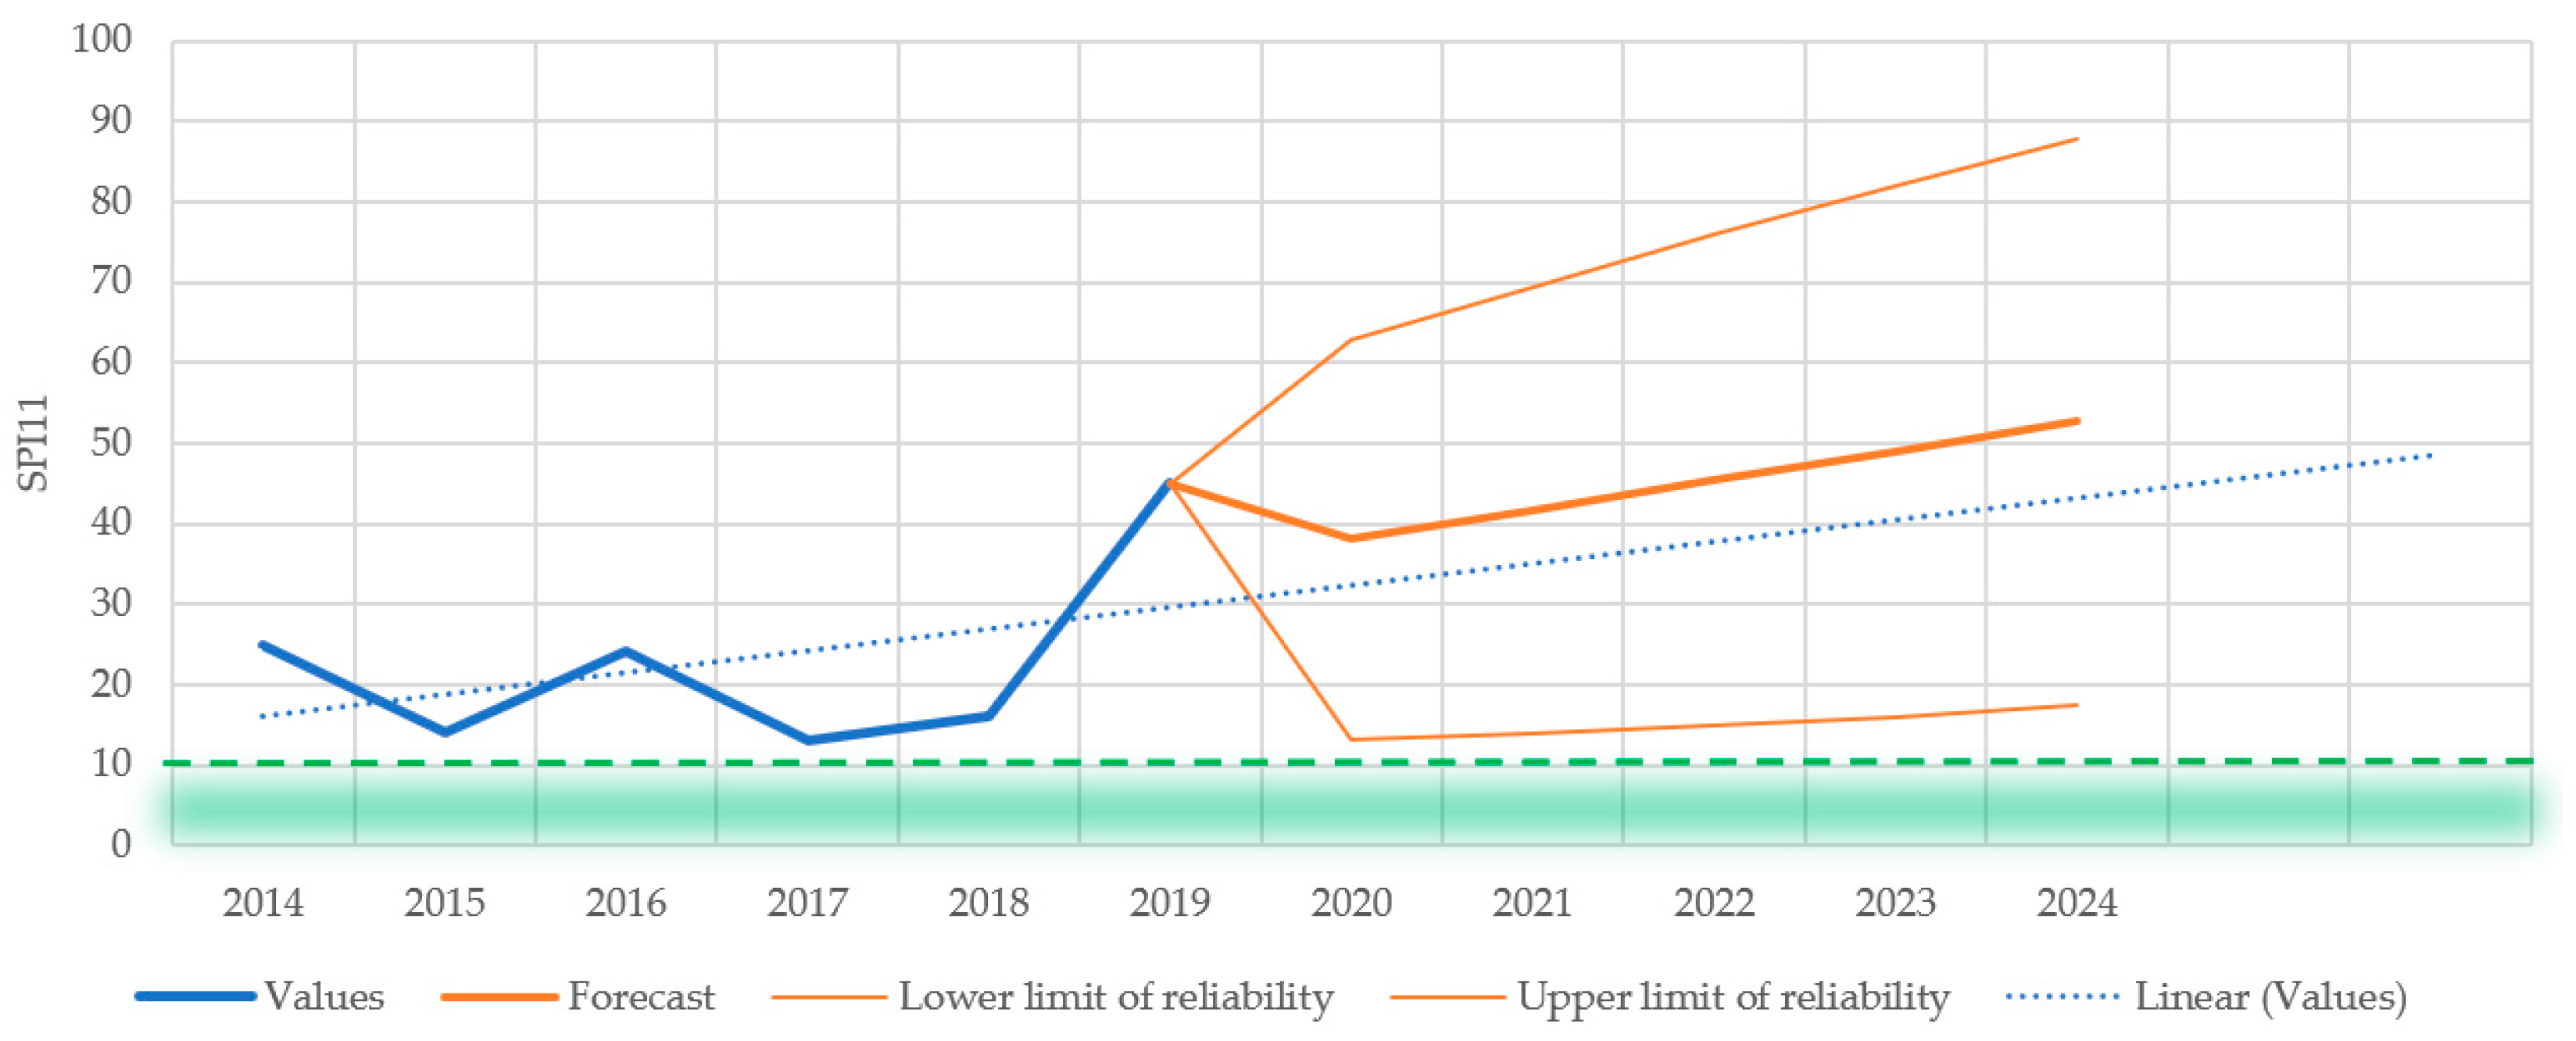
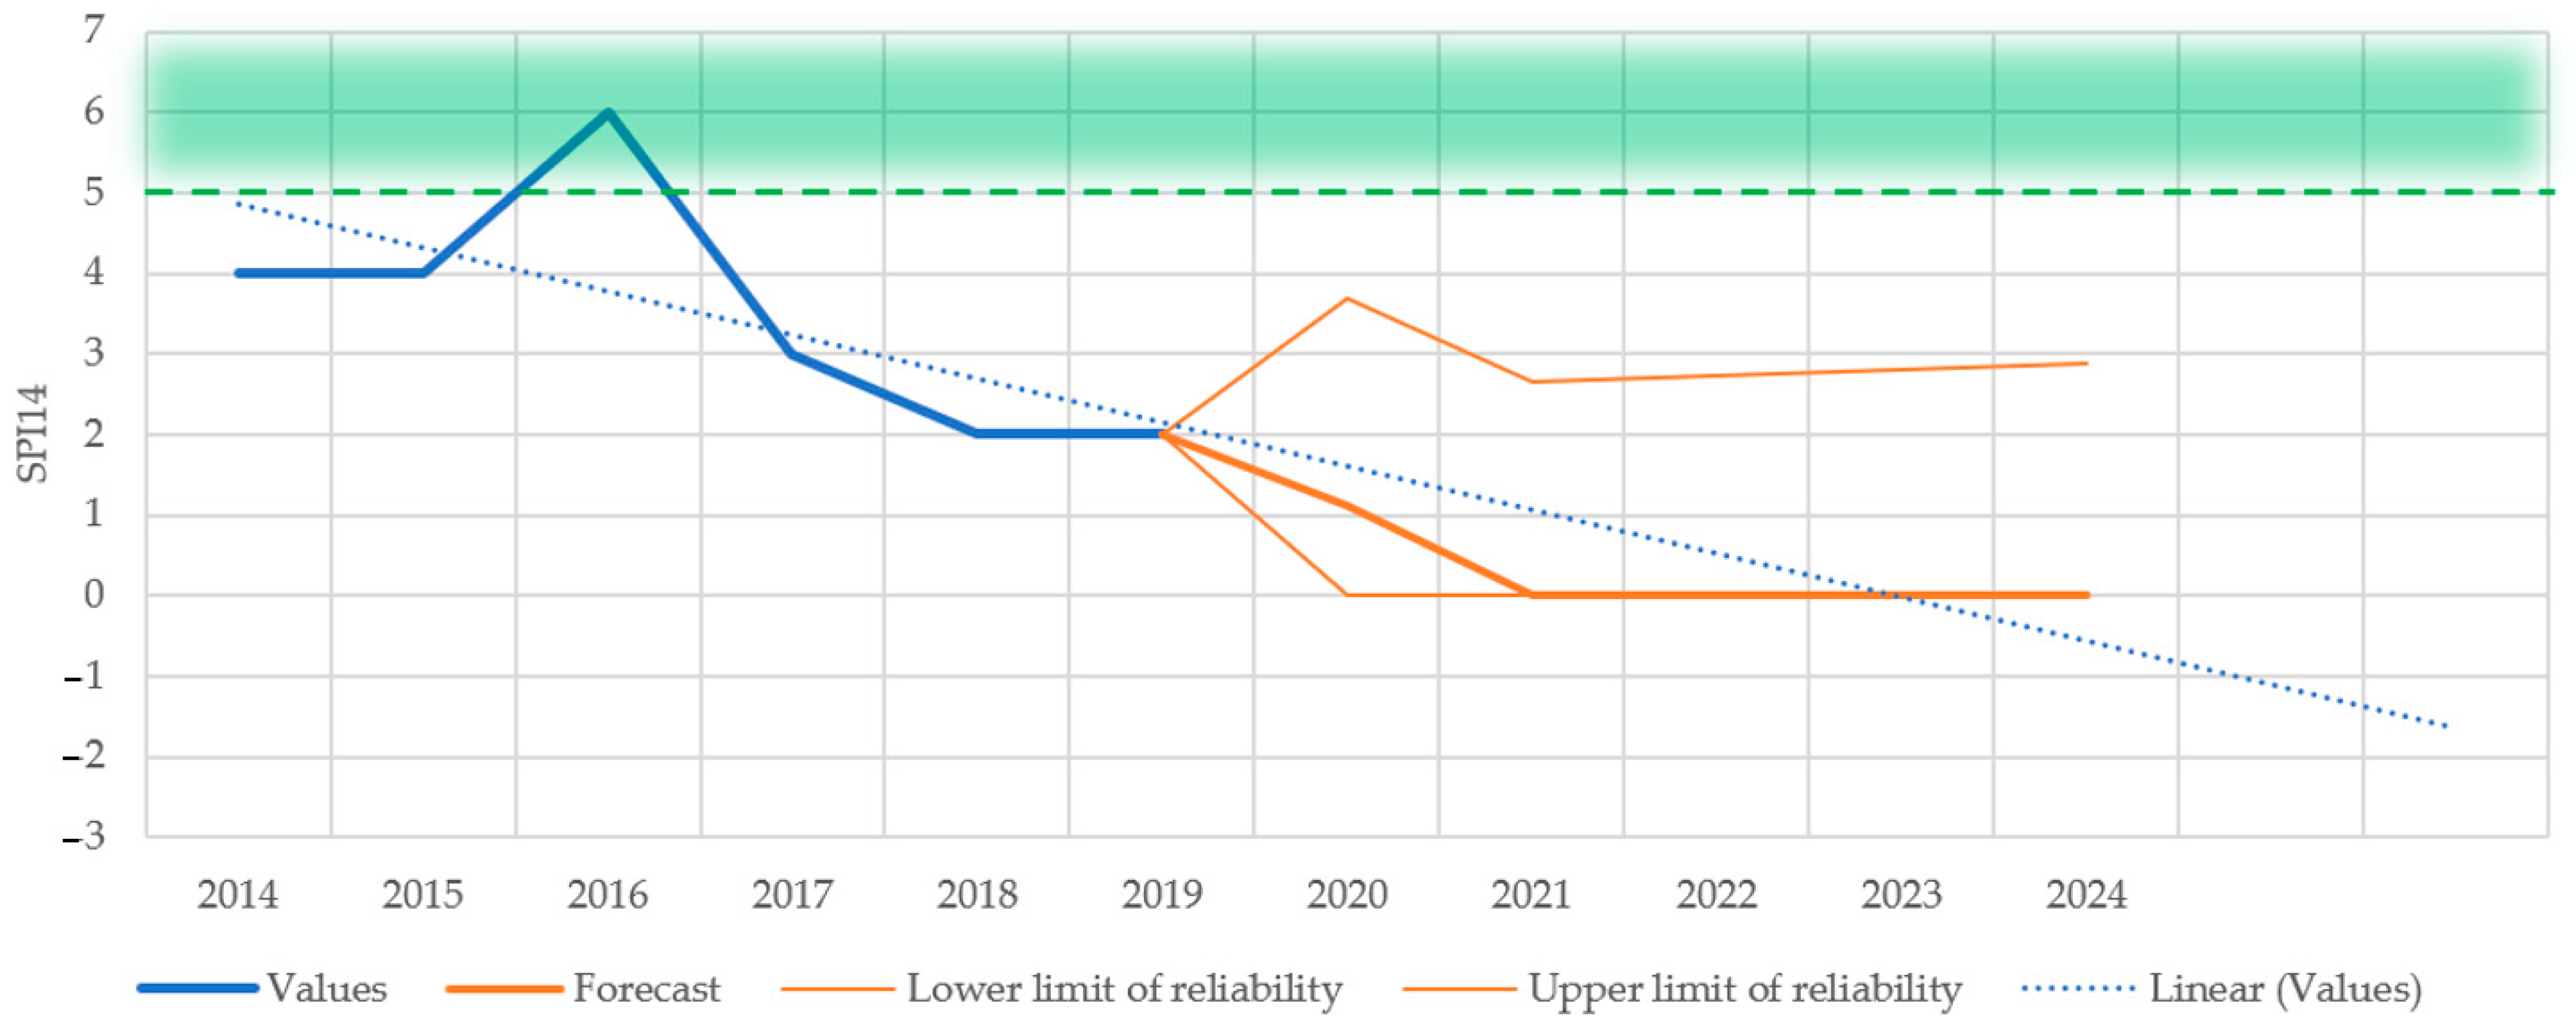
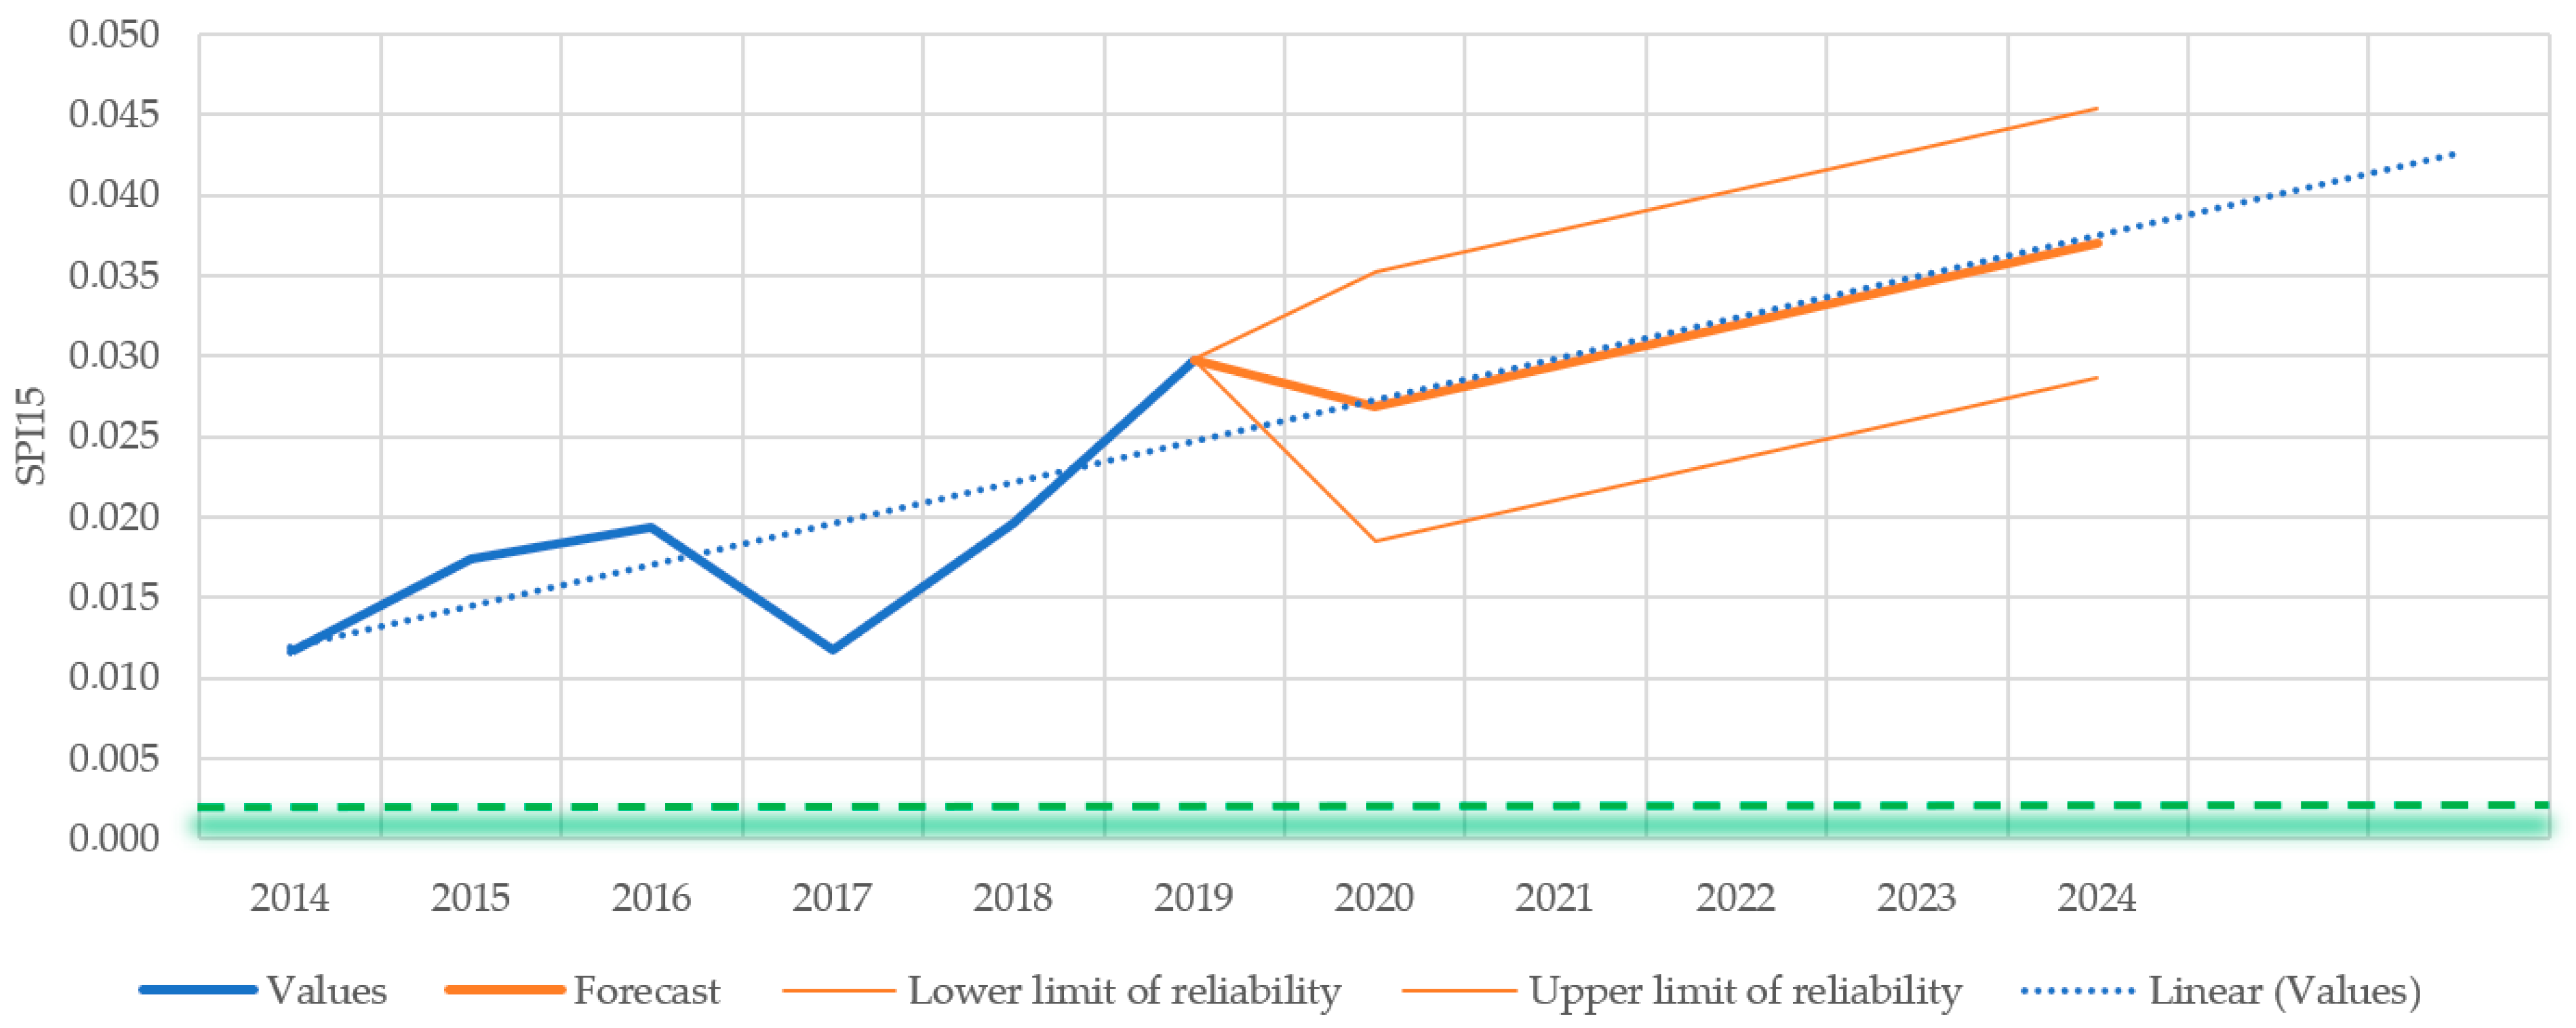
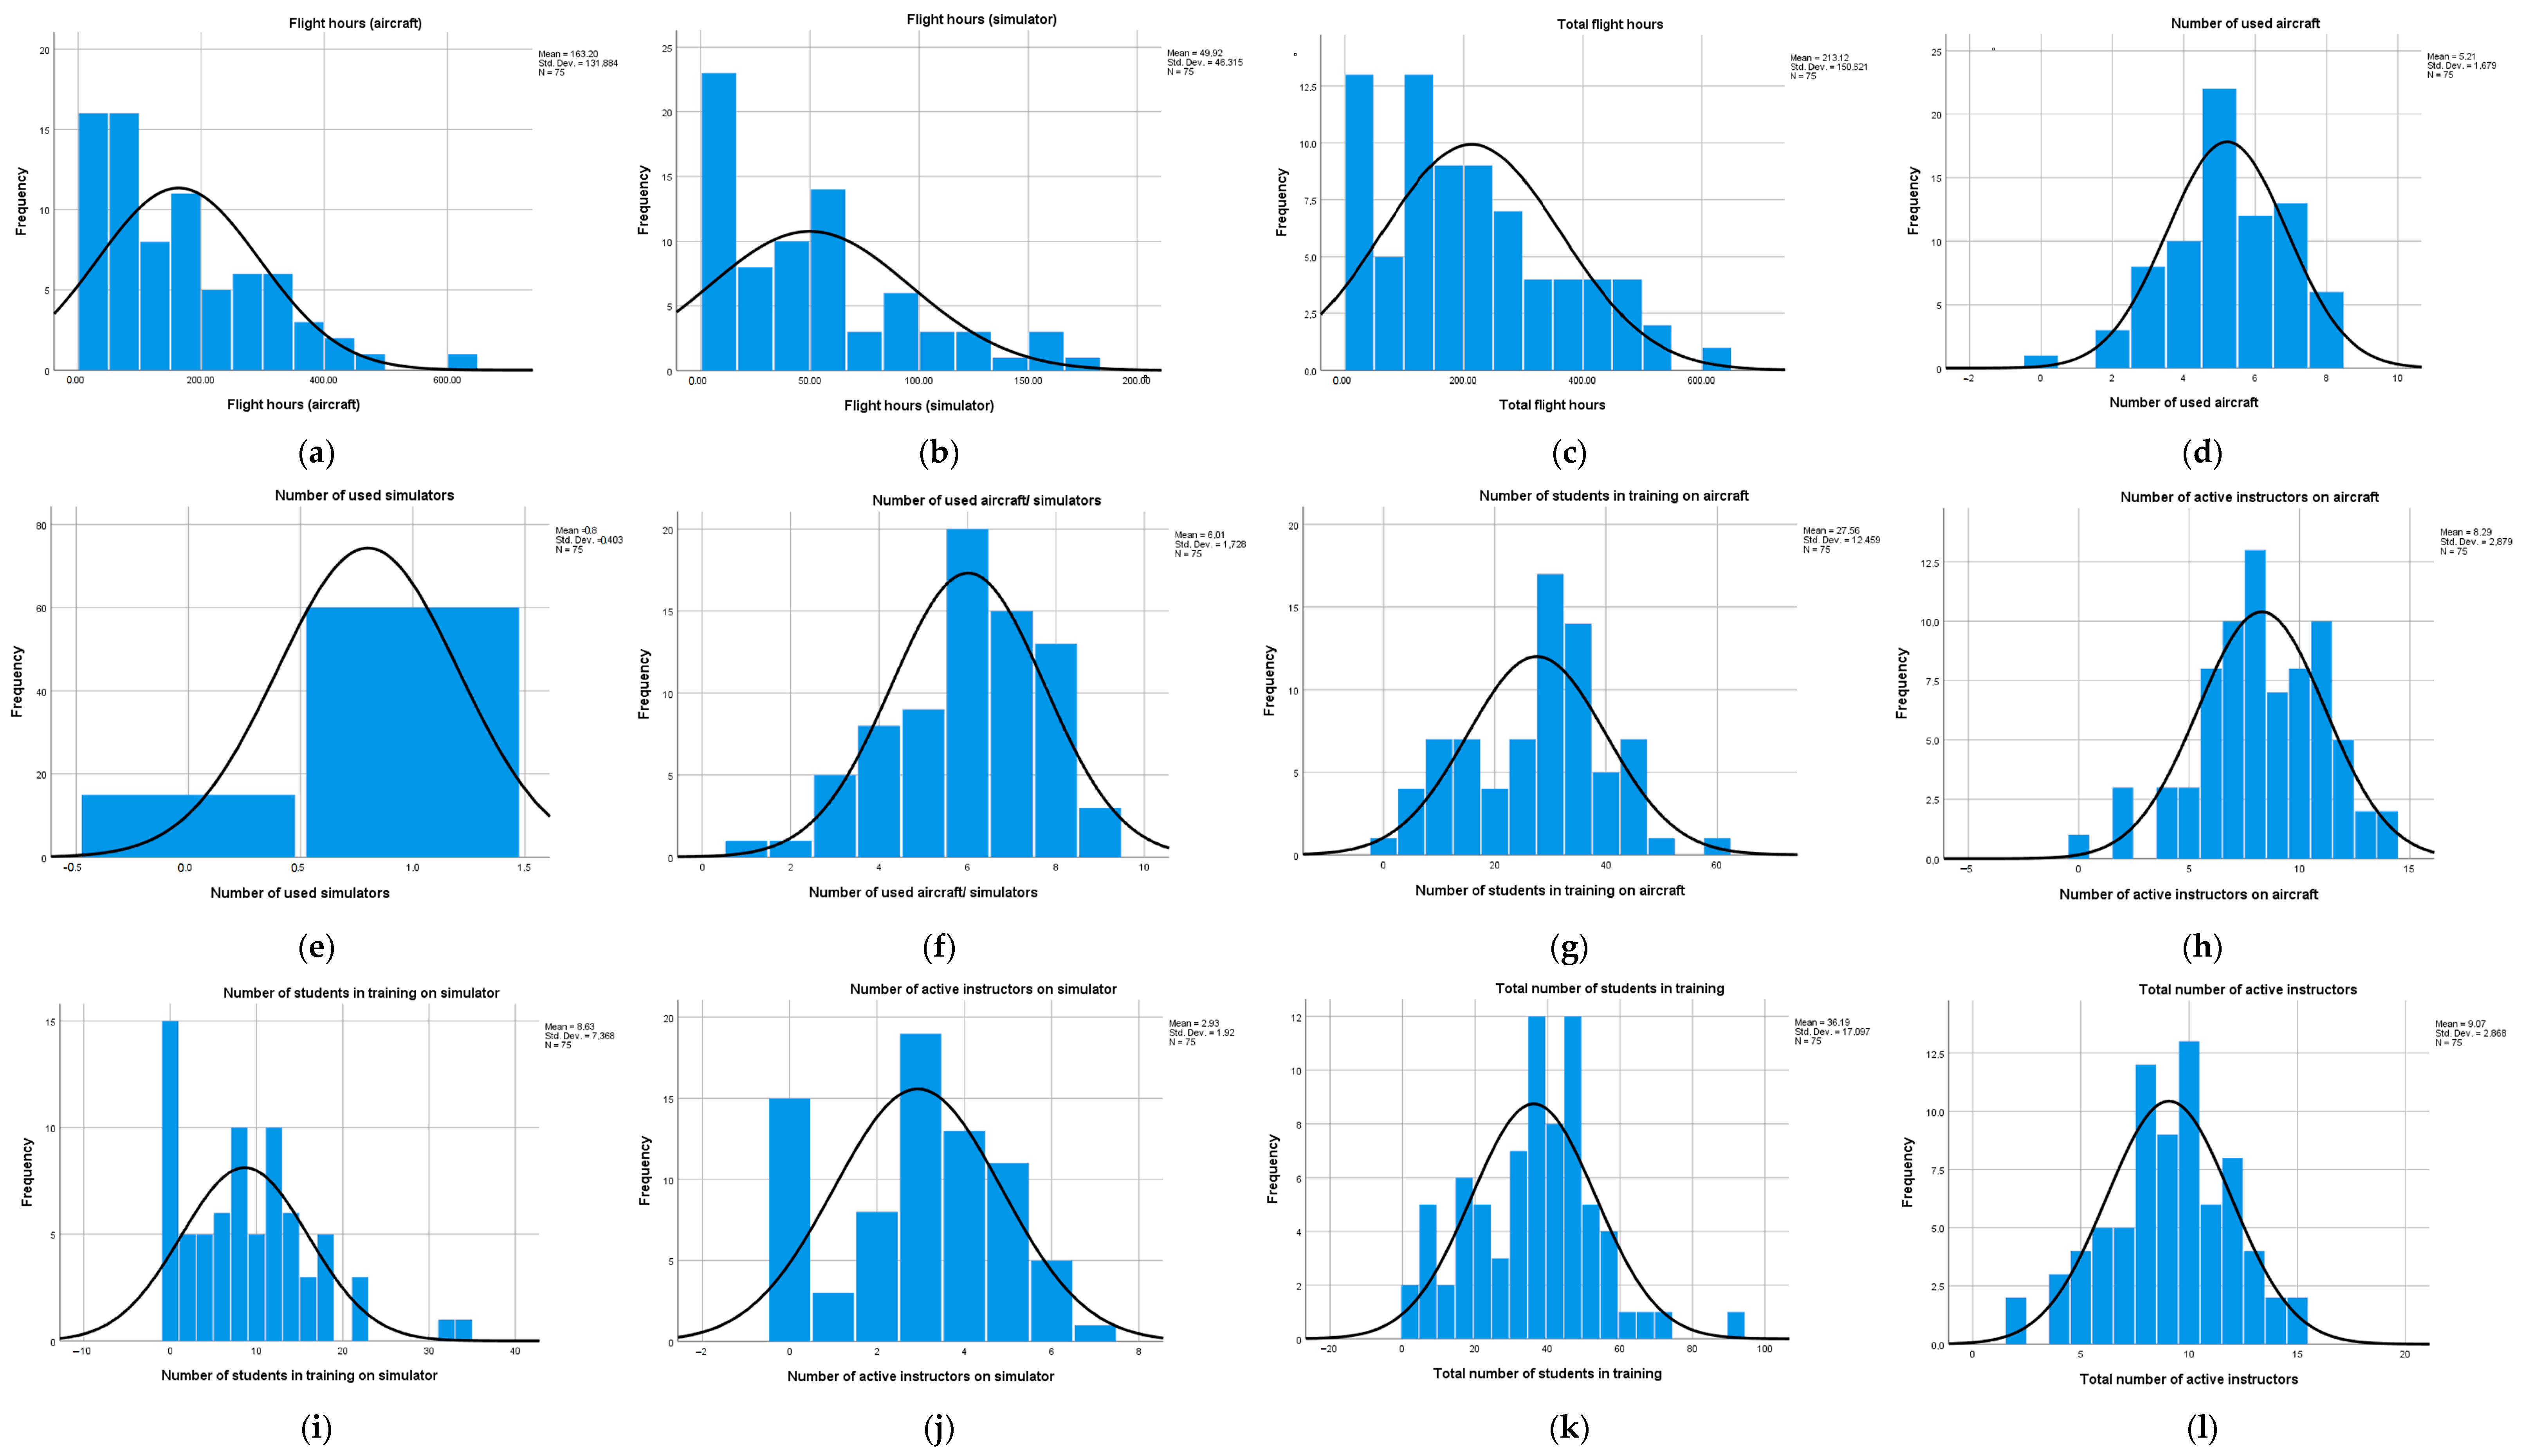
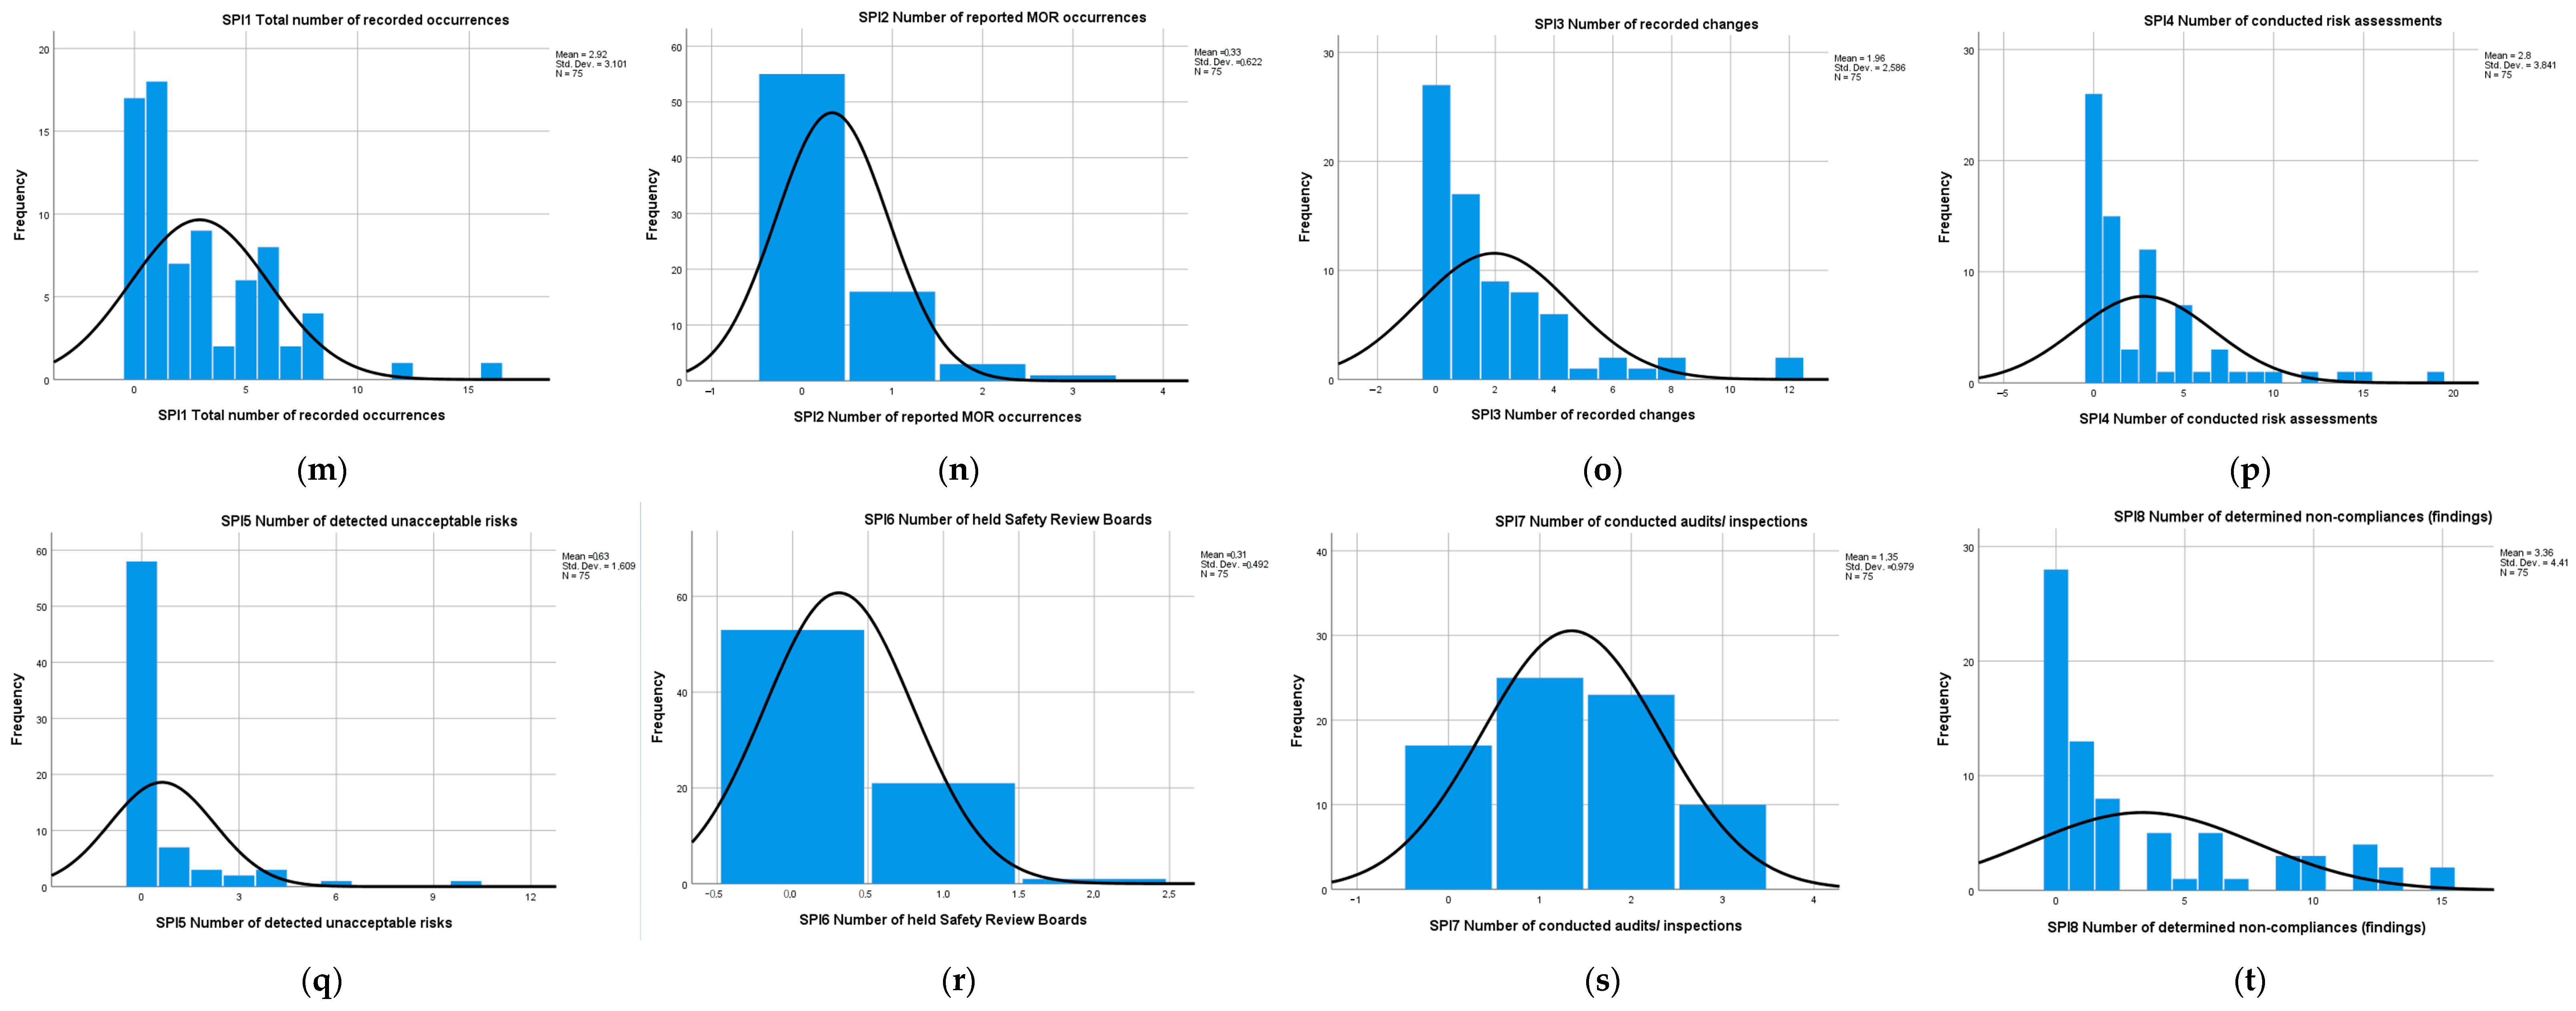
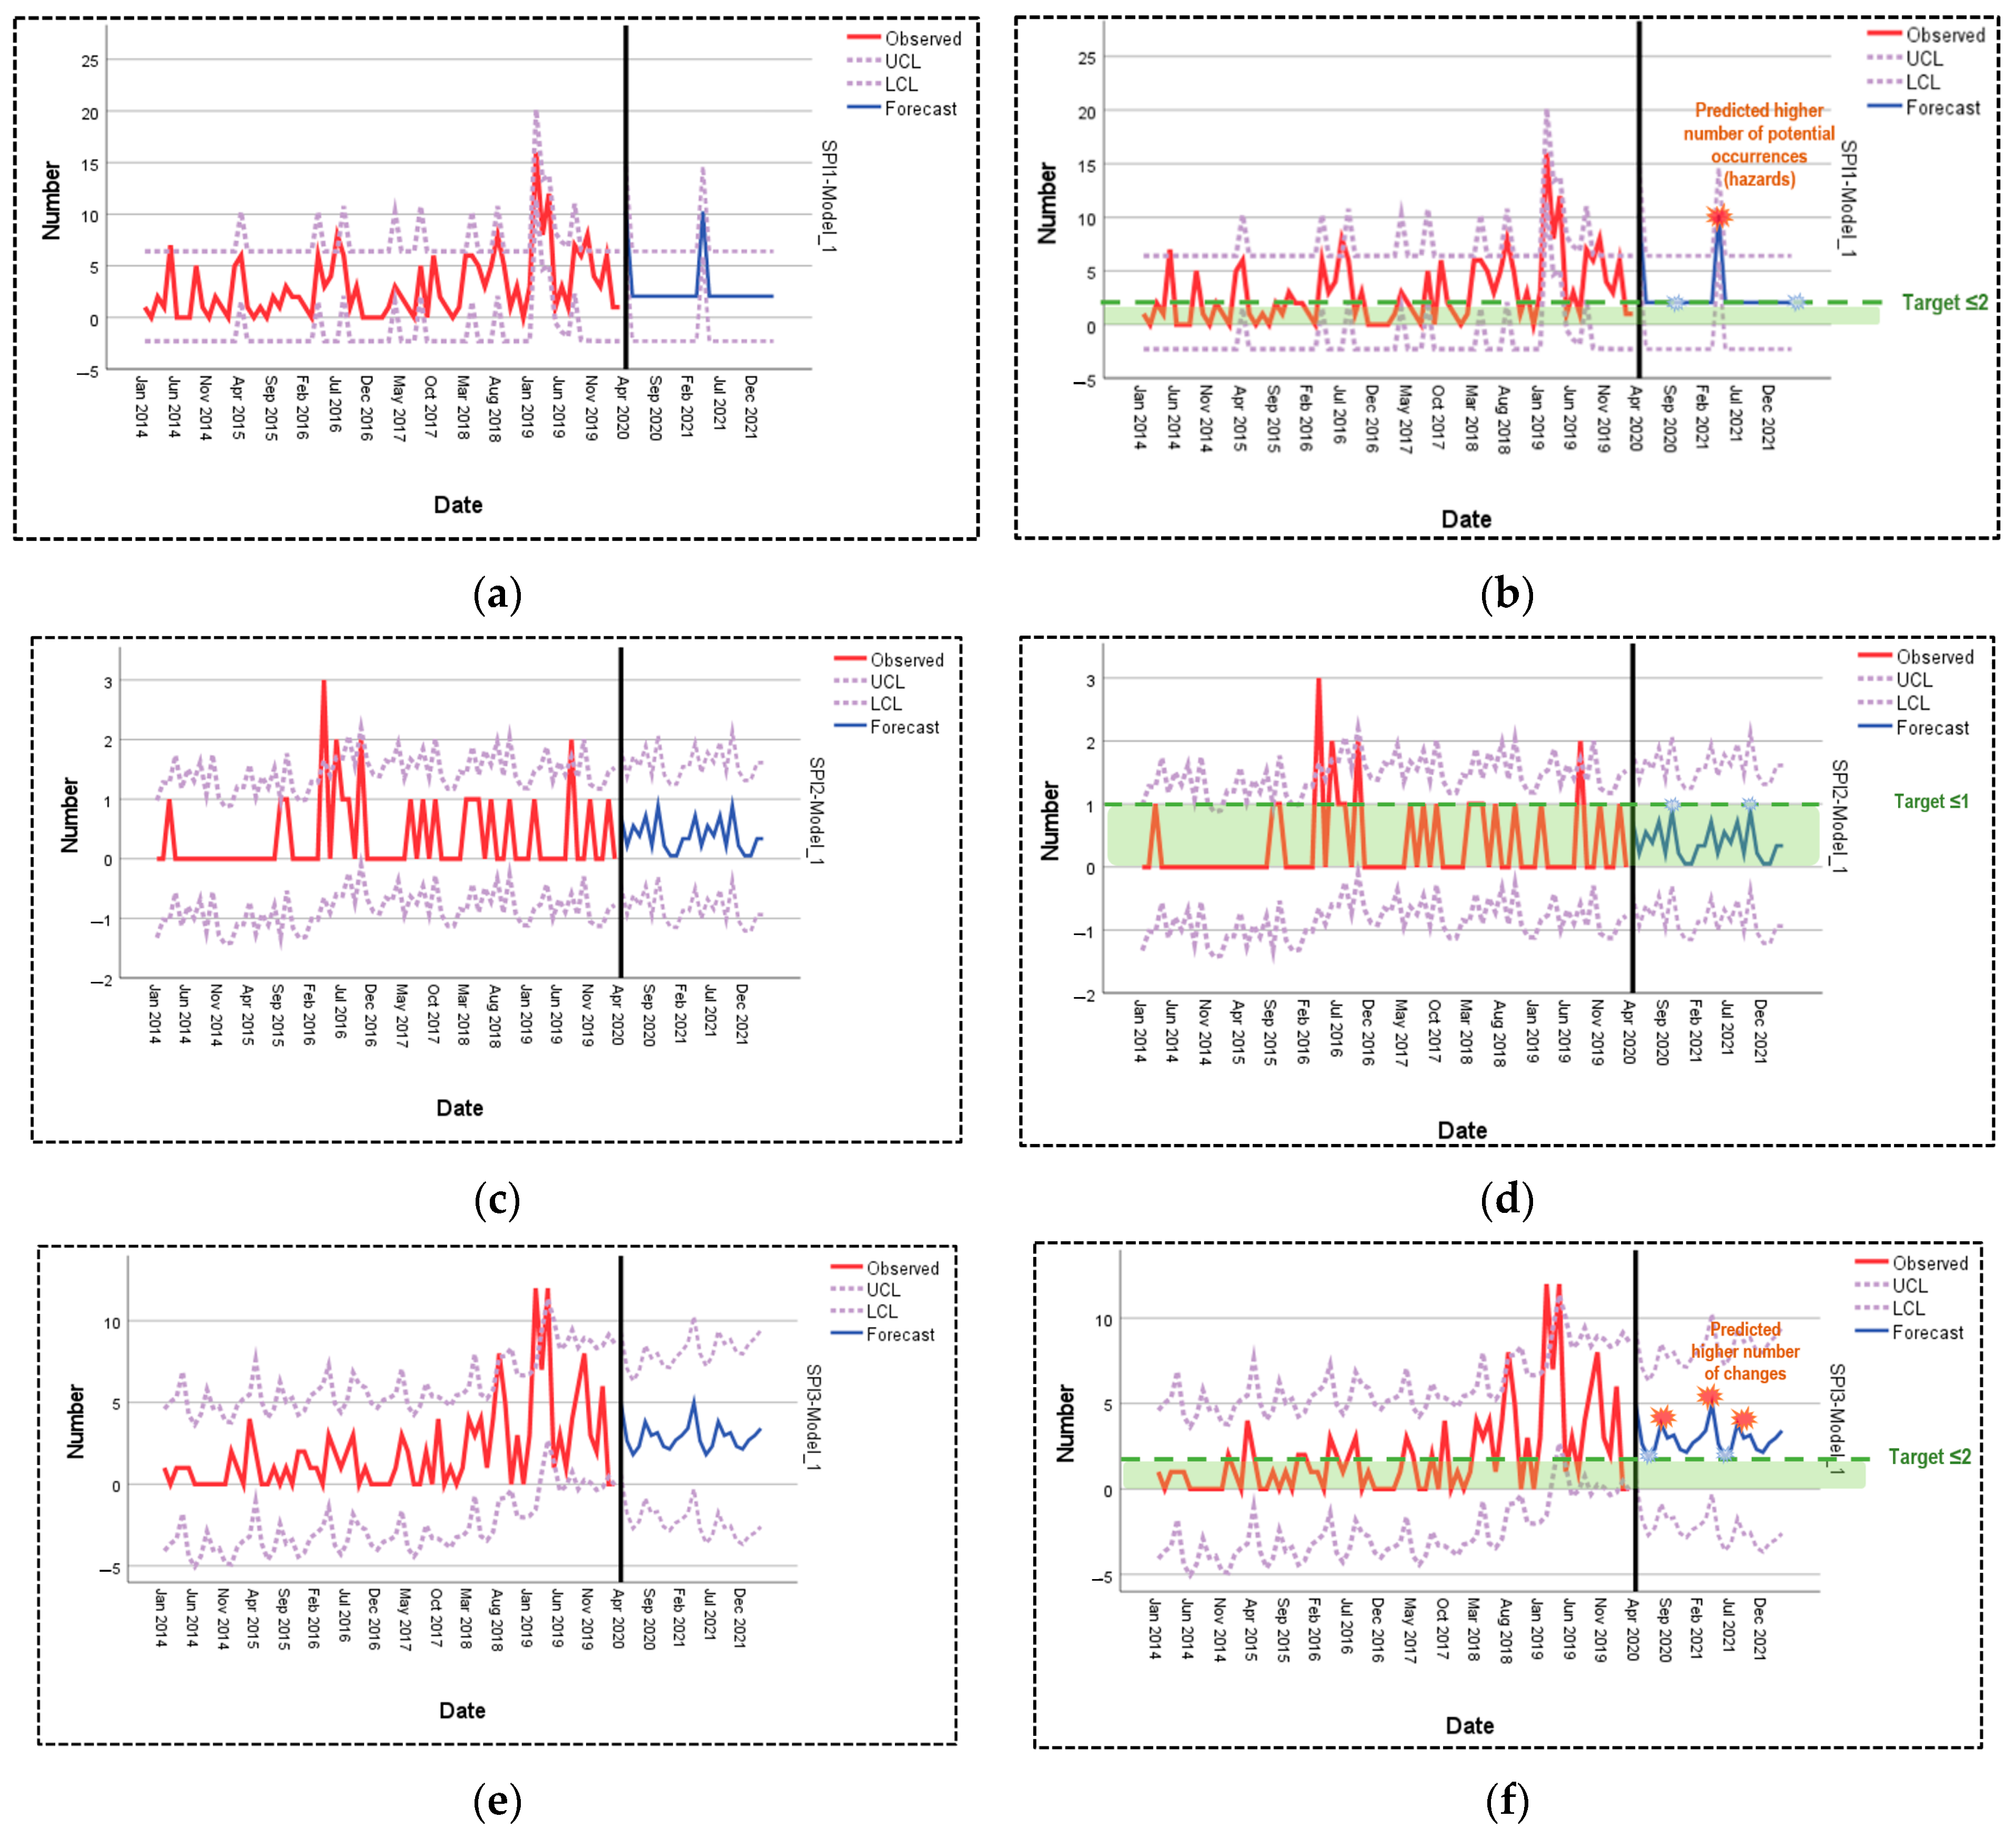
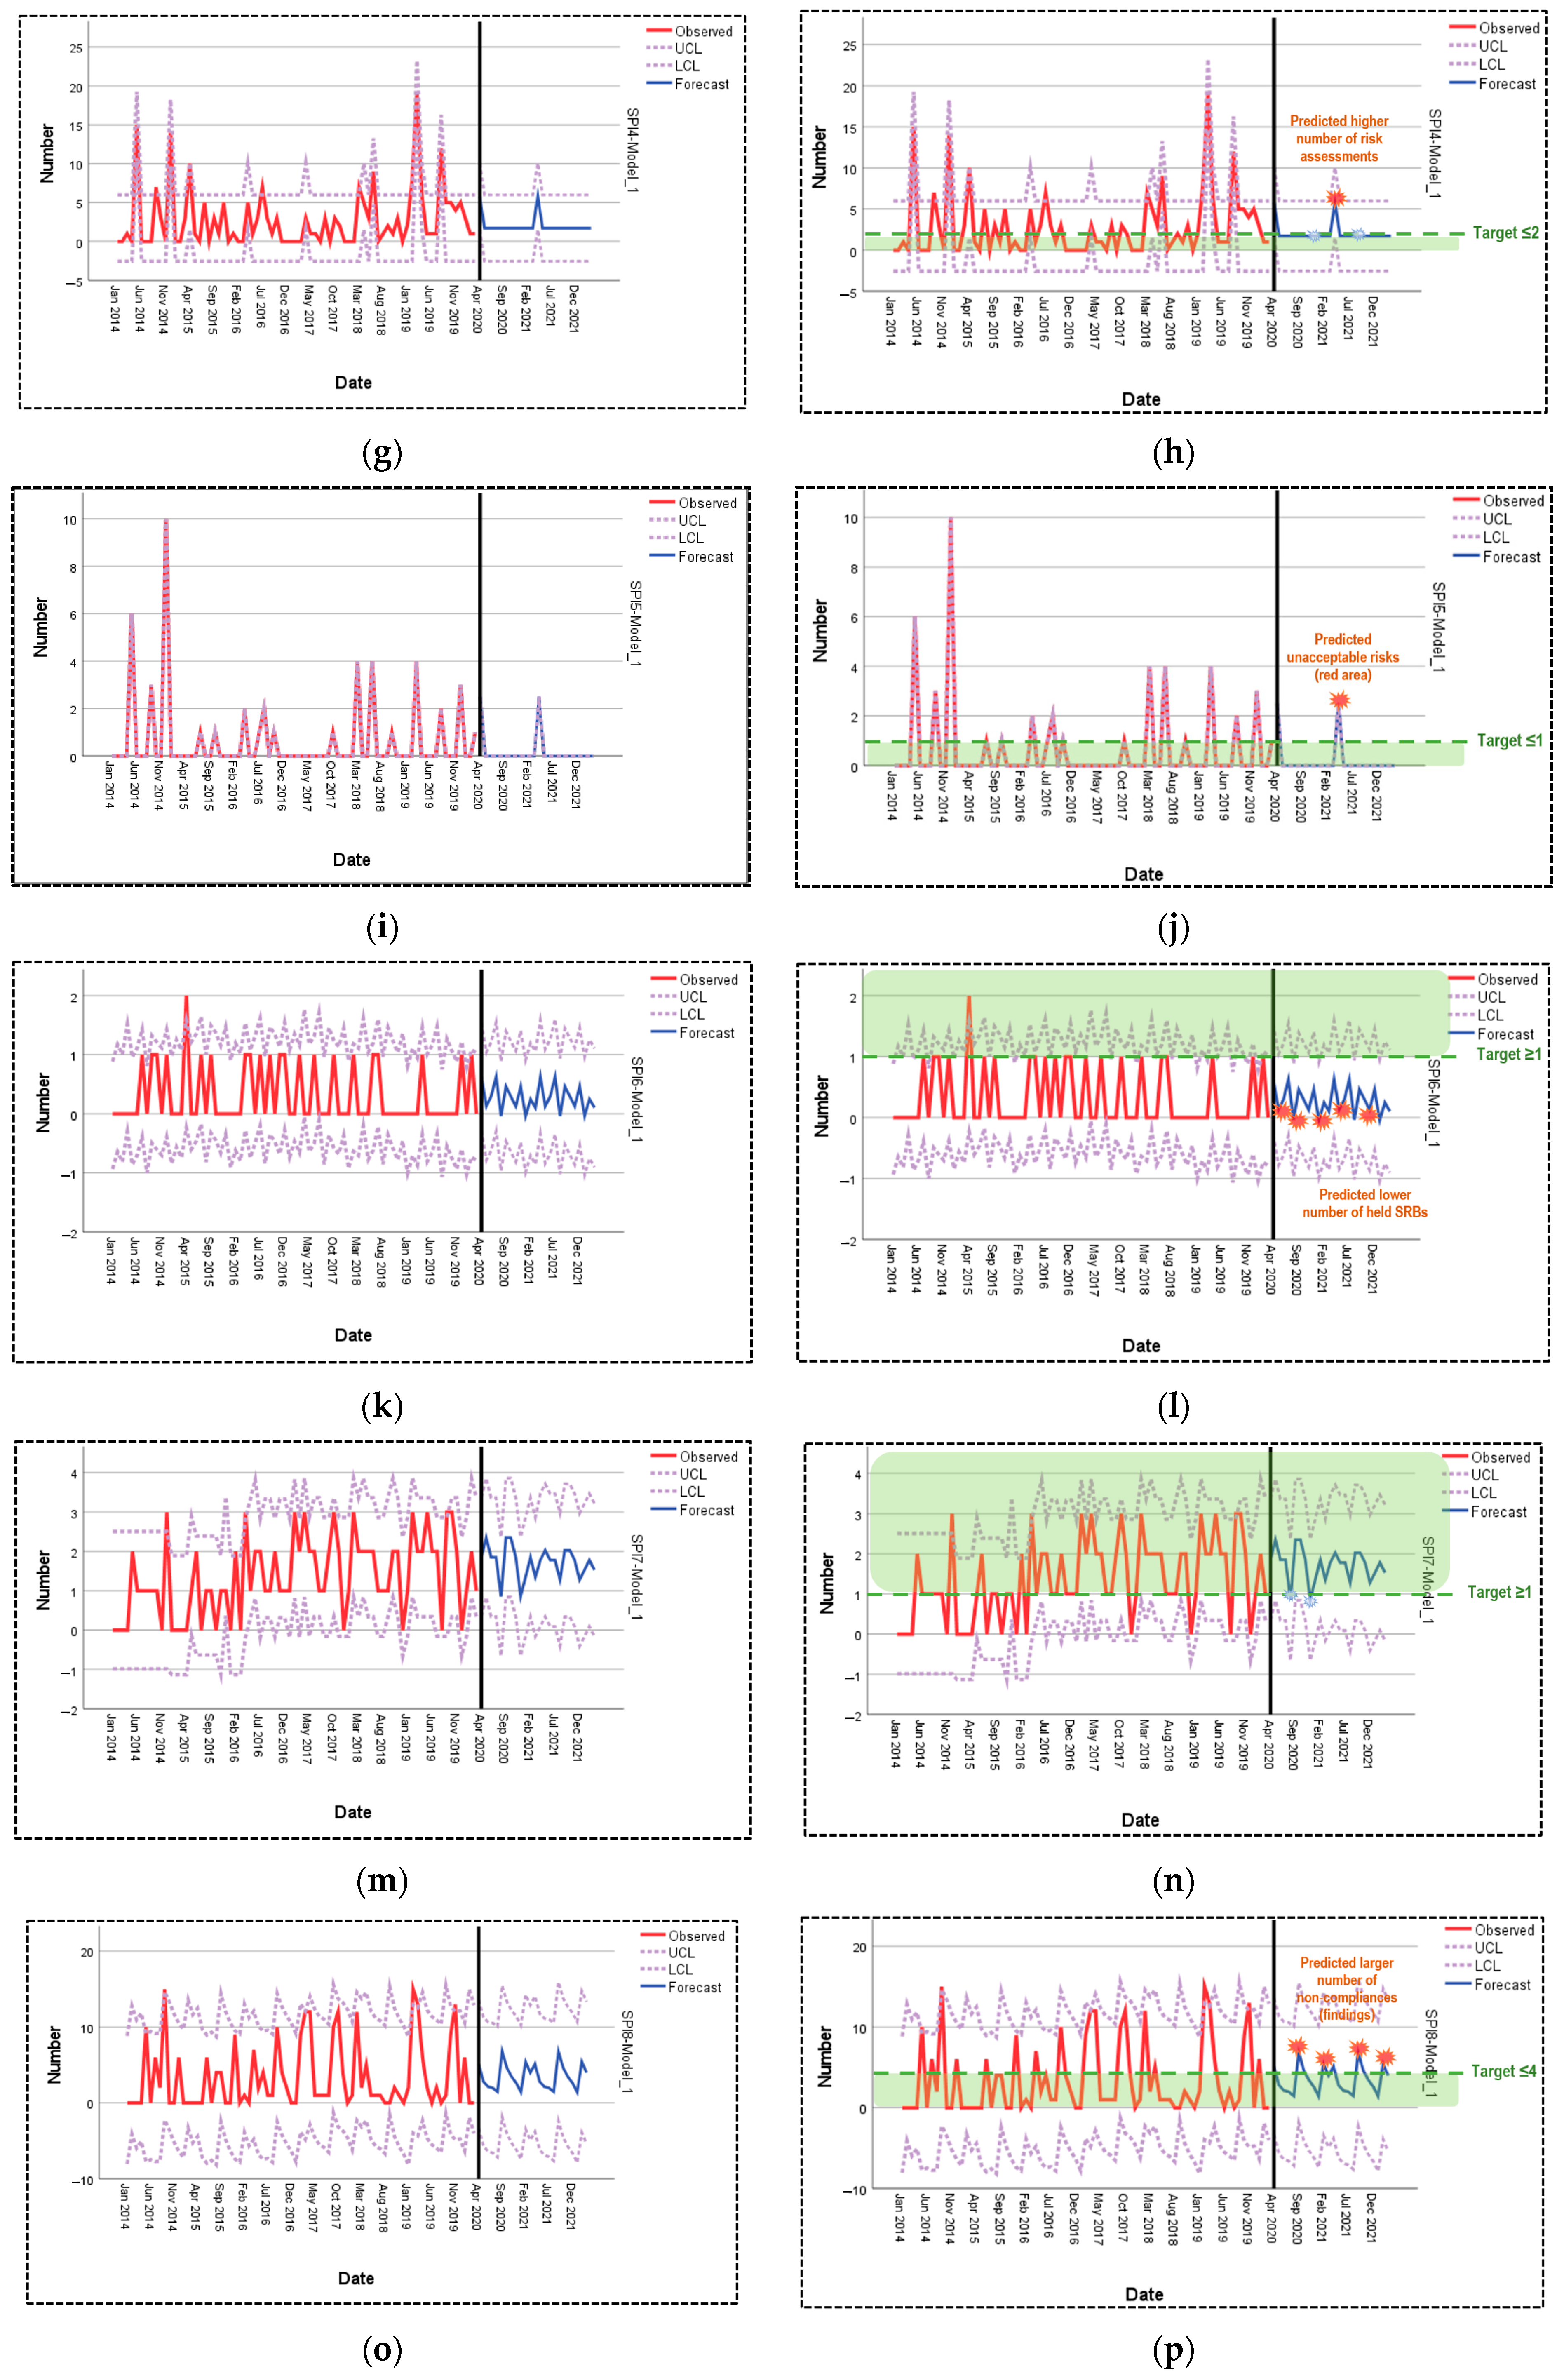
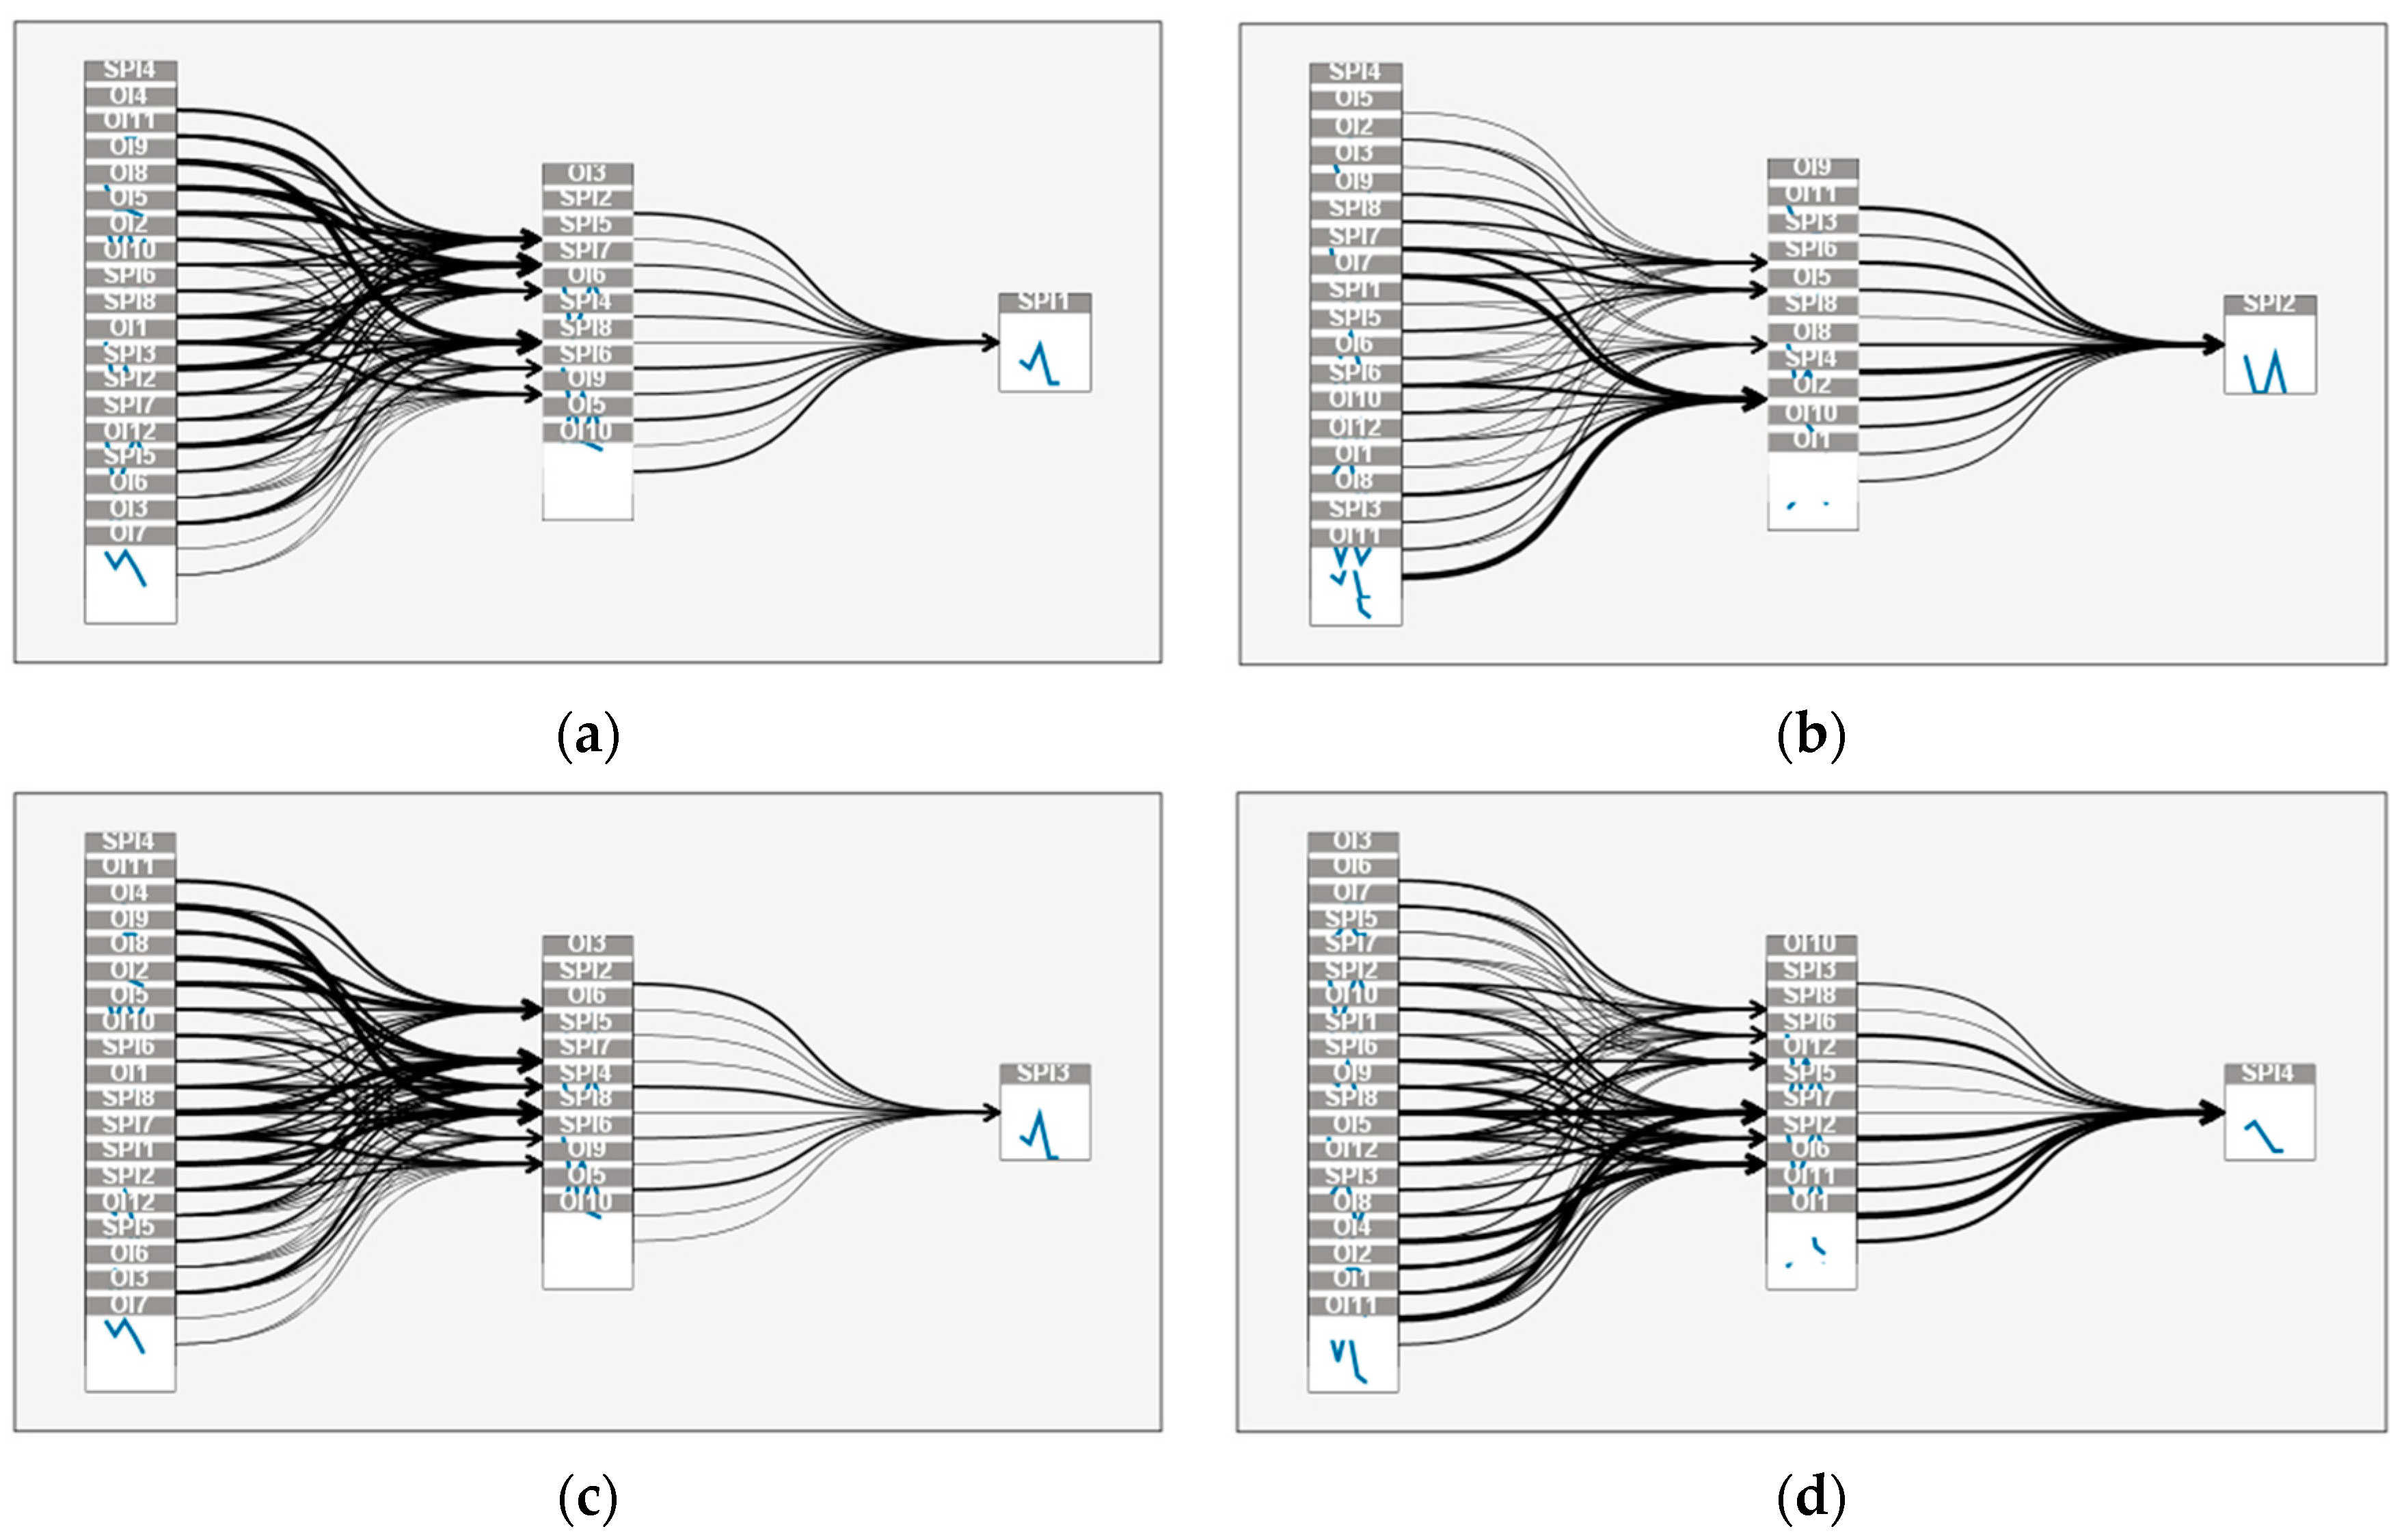
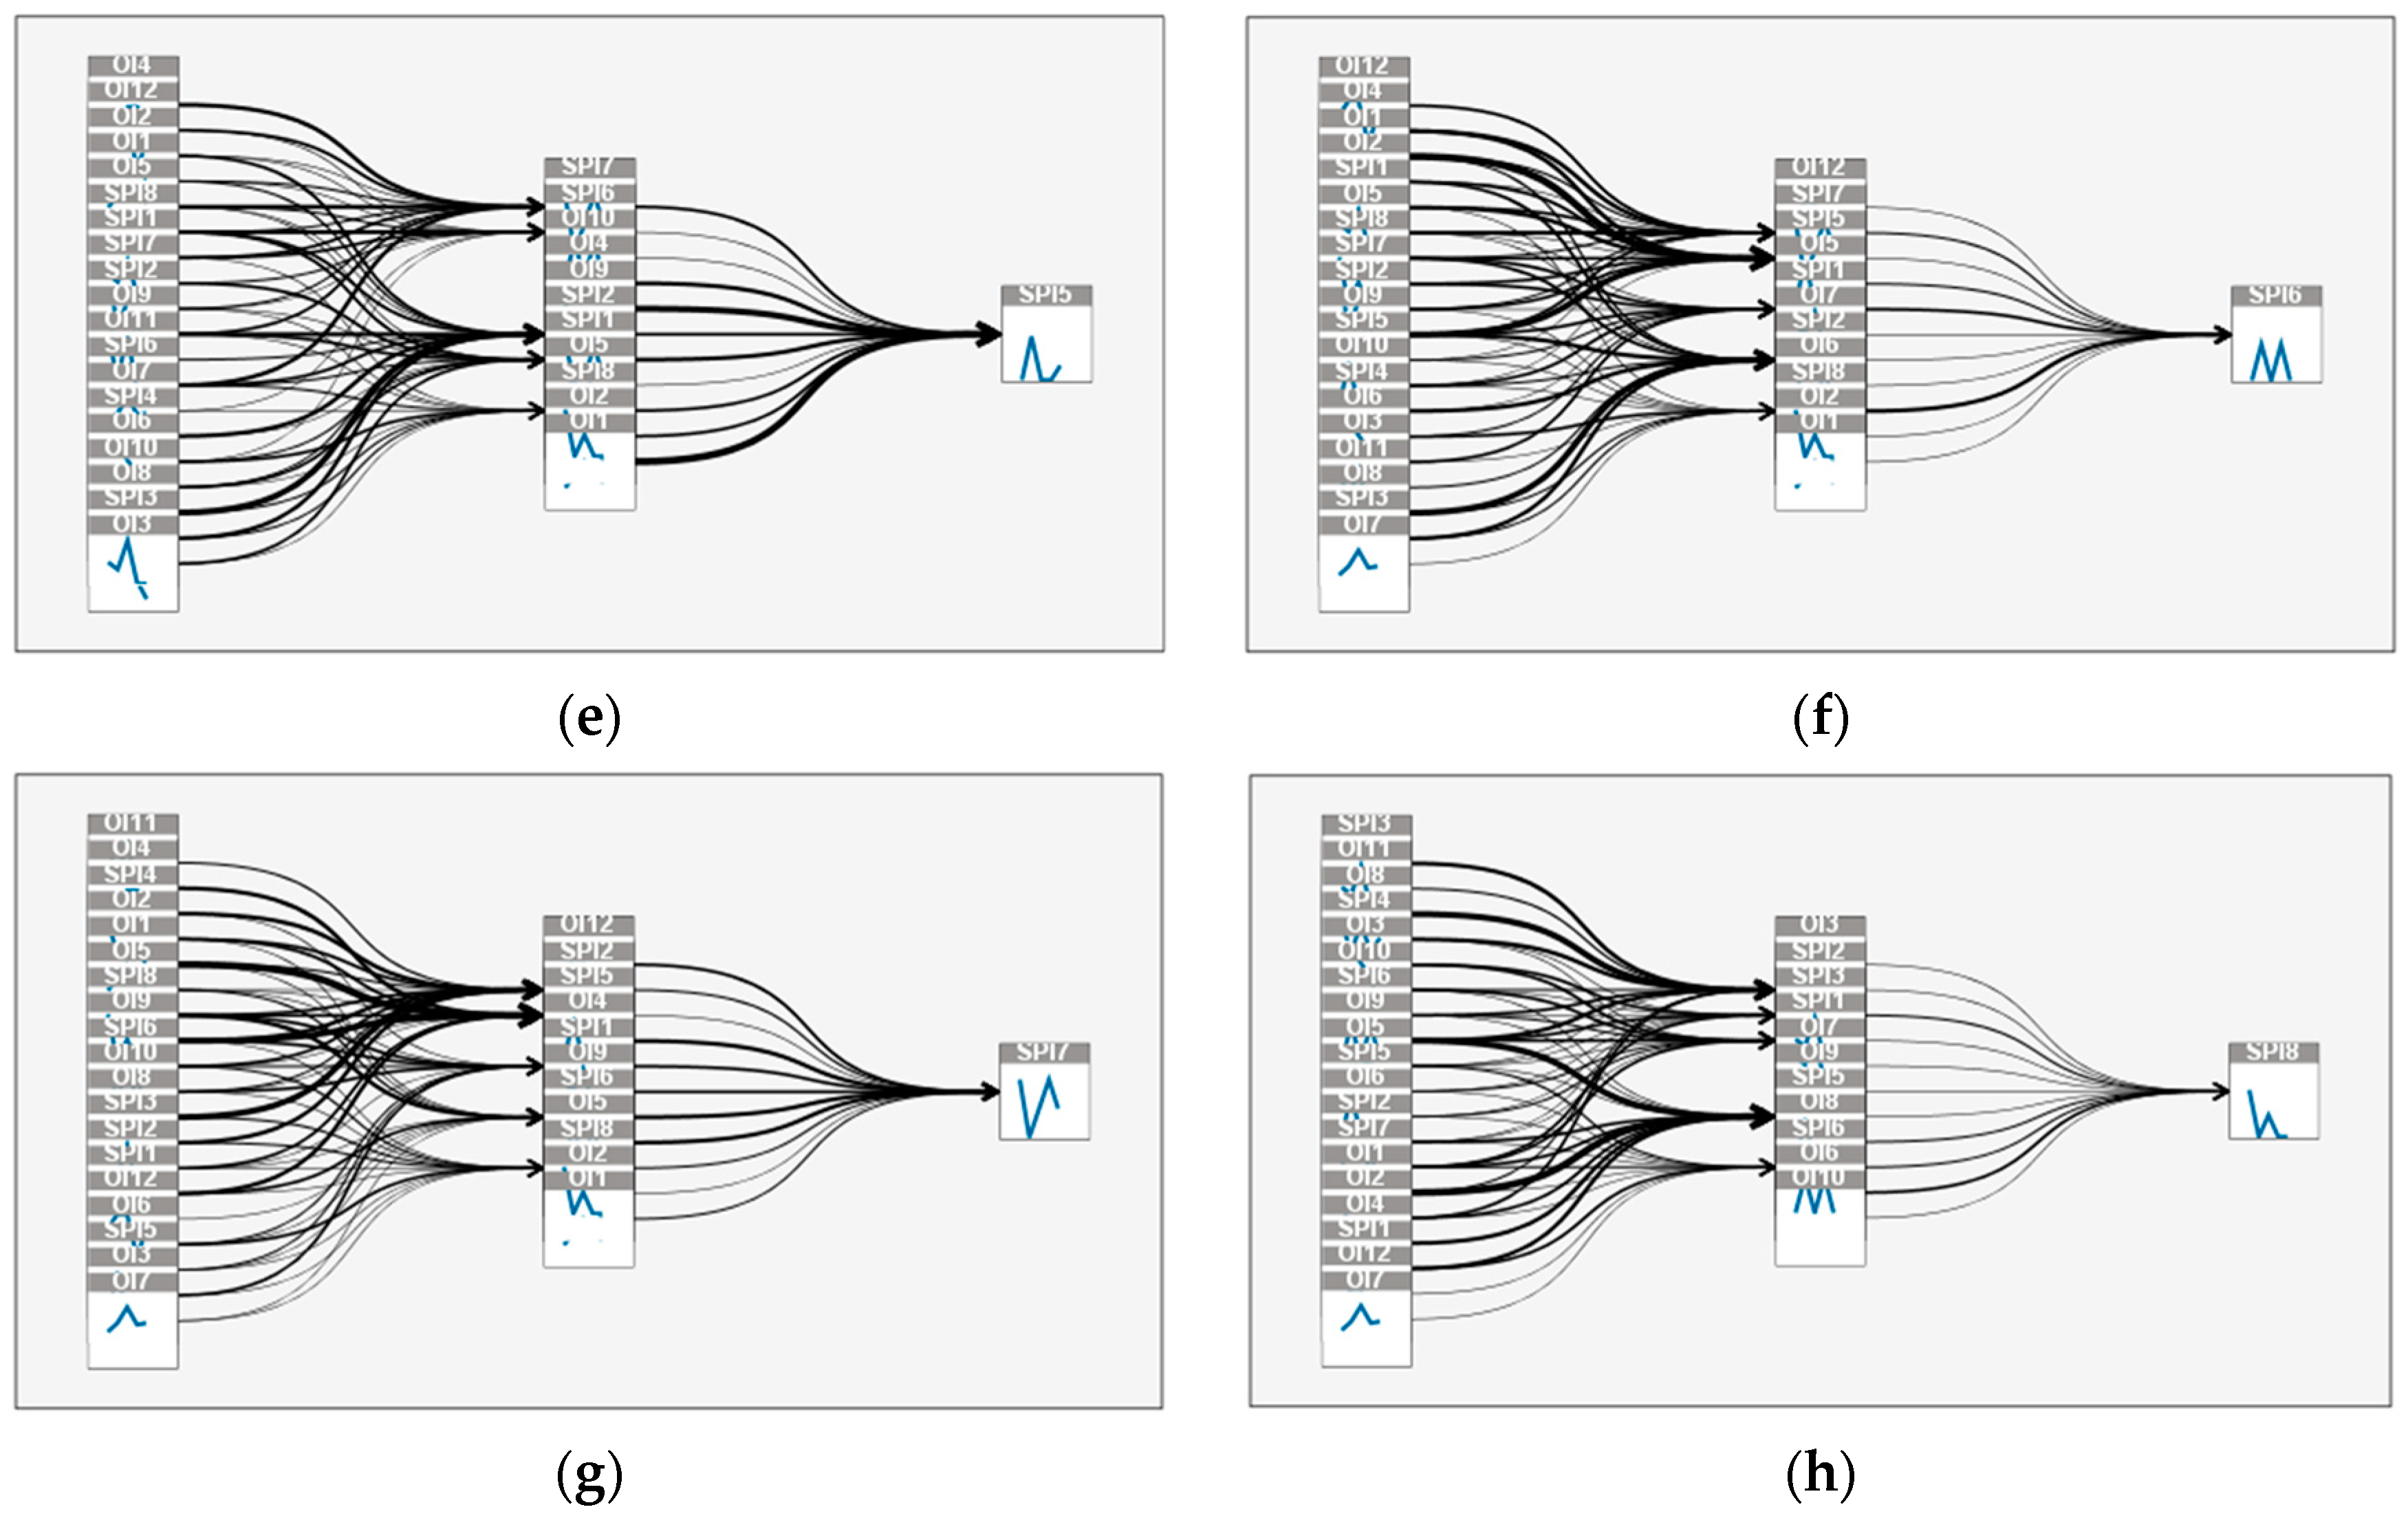
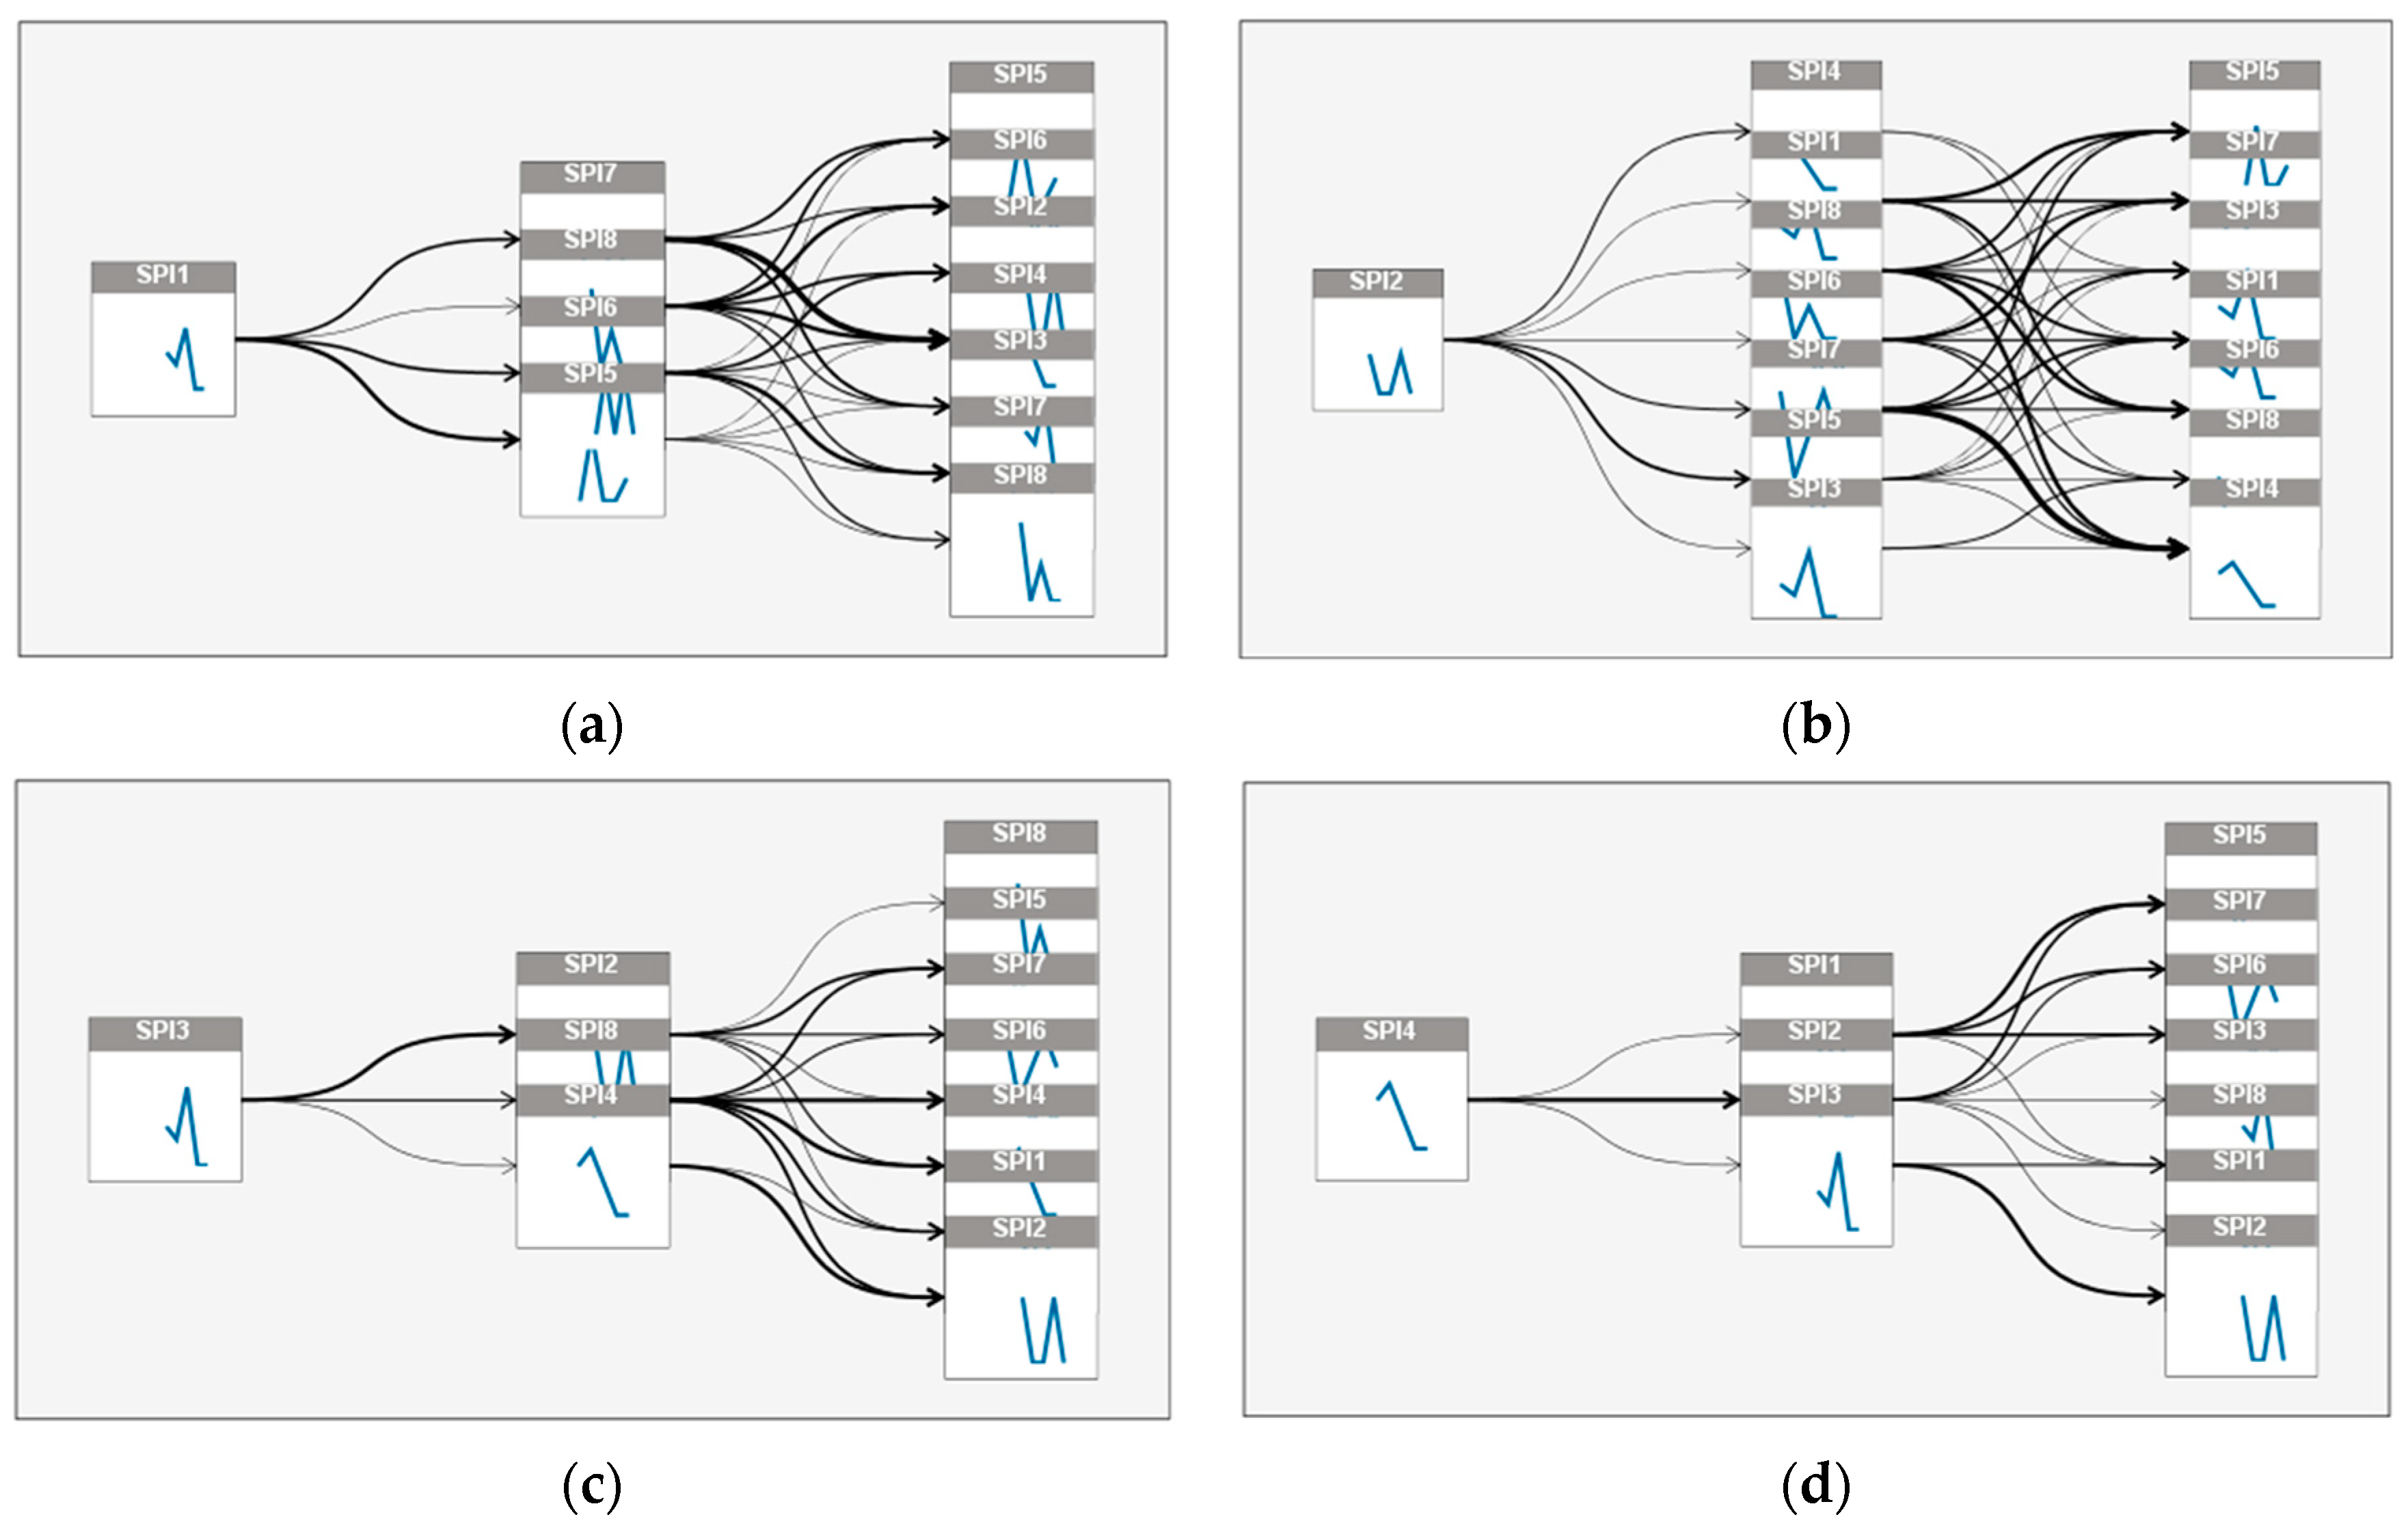
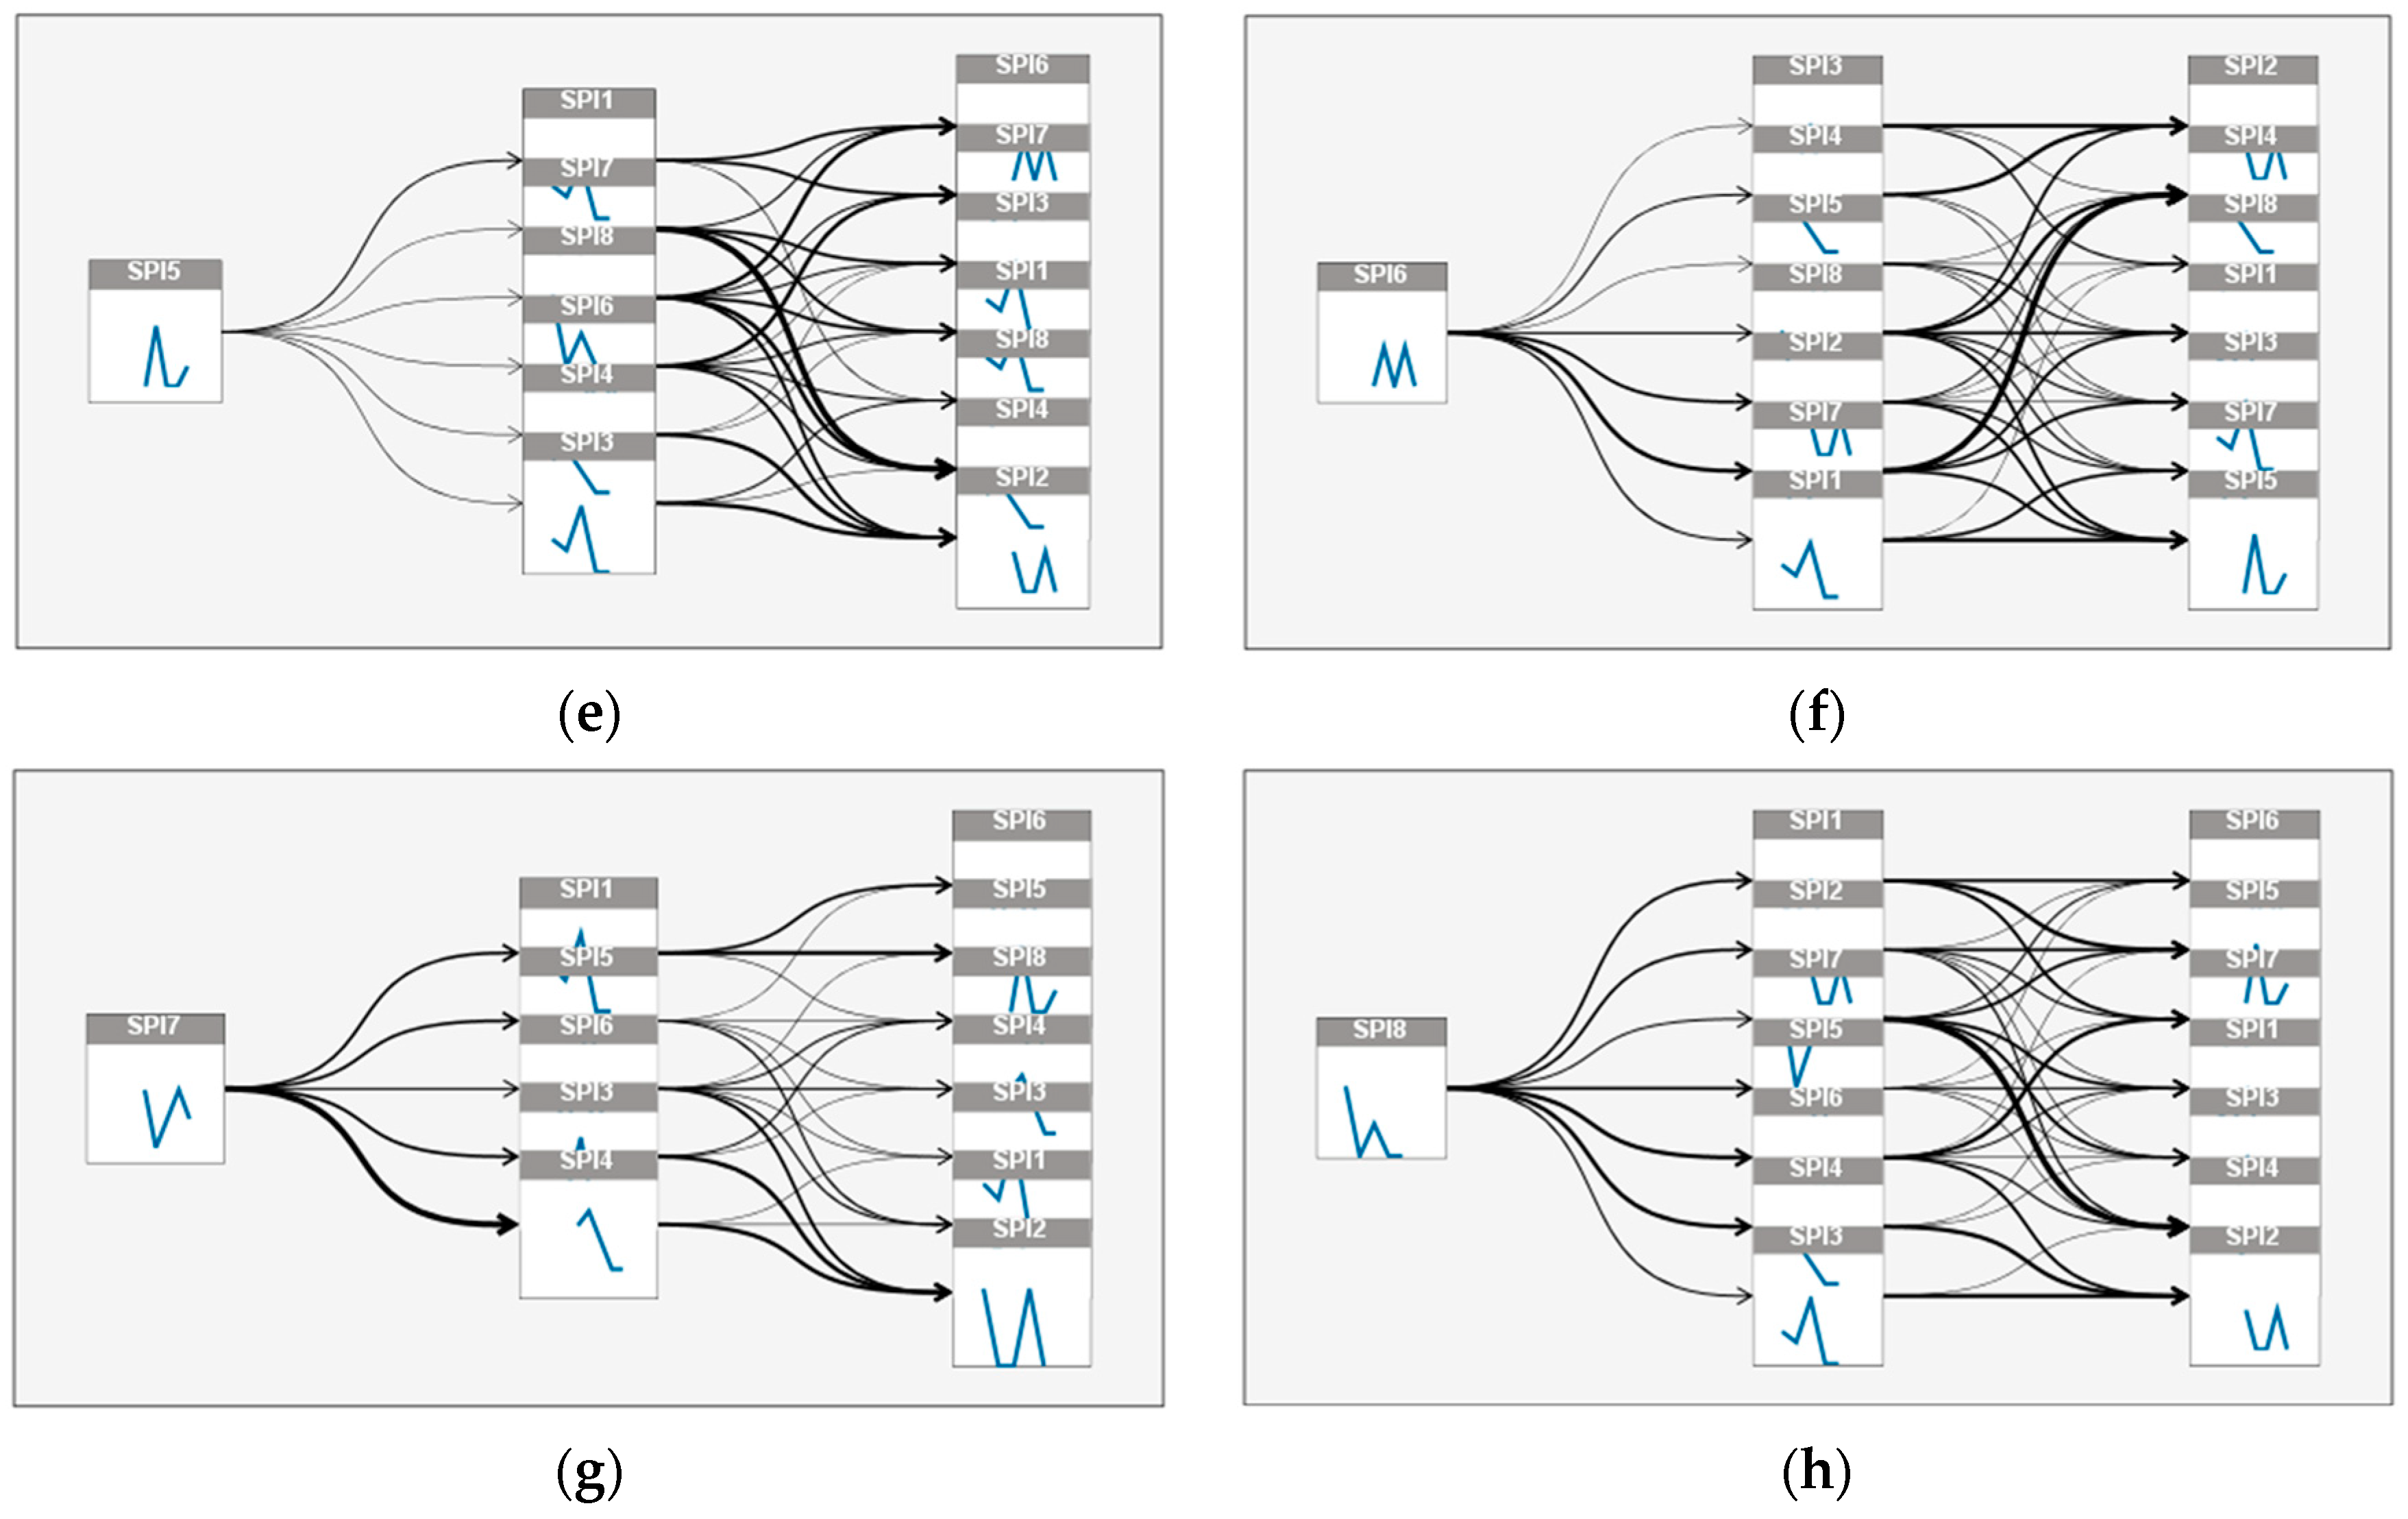
Figure 8.
Correlation between aviation safety management methodologies and inclusion of predictive methods to expand current version of predictive safety management methodology [5,15].

Figure 9.
The link between causation and prediction [15].
Figure 9.
The link between causation and prediction [15].

Figure 10.
The initial forecast of safety performance indicators SPI1—Total number of recorded occurrences for the period April 2020—March 2022: (a) Initial forecast of safety performance indicators SPI1; (b) Initial forecast of safety performance indicators SPI1 with set safety performance target (SPT) and its breaches [15,47].

Figure 11.
Example of causal model of organizational and safety performance indicators in a sample organization [15,47].

Figure 12.
Example of impact diagrams of causes and effects of safety performance indicator (SPI1): (a) Impact diagram of causes of safety performance indicator; (b) Impact diagram of effects of safety performance indicator [15,47].


Figure 13.
Impact diagram of organizational indicator OI3 on safety performance indicator SPI1 [15].
Figure 13.
Impact diagram of organizational indicator OI3 on safety performance indicator SPI1 [15].

Figure 14.
Impact diagram of organizational indicator OI9 on safety performance indicator SPI1 [15].
Figure 14.
Impact diagram of organizational indicator OI9 on safety performance indicator SPI1 [15].

Figure 15.
Scenario example of safety performance indicator behavior due to change in organizational indicator: (a) Increase of organizational indicator OI3; (b) Behavior of safety performance indicator SPI1 due to increase of OI3; (c) Decrease of organizational indicator OI9; (d) Behavior of safety performance indicator SPI1 due to decrease of OI9 [15,47].

Figure 16.
Conceptual model of predictive safety management methodology in aviation [15].
Figure 16.
Conceptual model of predictive safety management methodology in aviation [15].

Table 1.
Safety performance indicators (SPIs) dataset in the period 2014–2019.
| Year | SPI1 | SPI2 | … | SPI11 | … | SPI14 | SPI15 |
|---|---|---|---|---|---|---|---|
| 2014 | 29 | 7 | … | 25 | … | 4 | 0.012 |
| 2015 | 22 | 2 | … | 14 | … | 4 | 0.017 |
| 2016 | 34 | 9 | … | 24 | … | 6 | 0.019 |
| 2017 | 21 | 3 | … | 13 | … | 3 | 0.012 |
| 2018 | 43 | 5 | … | 16 | … | 2 | 0.020 |
| 2019 | 70 | 4 | … | 45 | … | 2 | 0.030 |
| SPT | 10 | 2 | … | 10 | … | 5 | 0.002 |
| ⇓ | ⇓ | … | ⇓ | … | ⇑ | ⇓ |
Table 2.
Example of forecasting safety performance indicator (SPI1) in a sample organization.
| Year | Values (SPI1) | Forecast | Lower Limit of Reliability | Upper Limit of Reliability |
|---|---|---|---|---|
| 2014 | 29 | |||
| 2015 | 22 | |||
| 2016 | 34 | |||
| 2017 | 21 | |||
| 2018 | 43 | |||
| 2019 | 70 | 70 | 70 | 70 |
| 2020 | 73 | 46 | 101 | |
| 2021 | 82 | 47 | 116 | |
| 2022 | 90 | 50 | 130 | |
| 2023 | 99 | 53 | 144 | |
| 2024 | 107 | 57 | 157 |
Disclaimer/Publisher’s Note: The statements, opinions and data contained in all publications are solely those of the individual author(s) and contributor(s) and not of MDPI and/or the editor(s). MDPI and/or the editor(s) disclaim responsibility for any injury to people or property resulting from any ideas, methods, instructions or products referred to in the content. |
© 2023 by the authors. Licensee MDPI, Basel, Switzerland. This article is an open access article distributed under the terms and conditions of the Creative Commons Attribution (CC BY) license (https://creativecommons.org/licenses/by/4.0/).
Share and Cite
MDPI and ACS Style
Bartulović, D.; Steiner, S. Conceptual Model of Predictive Safety Management Methodology in Aviation. Aerospace 2023, 10, 268. https://doi.org/10.3390/aerospace10030268
AMA Style
Bartulović D, Steiner S. Conceptual Model of Predictive Safety Management Methodology in Aviation. Aerospace. 2023; 10(3):268. https://doi.org/10.3390/aerospace10030268
Chicago/Turabian StyleBartulović, Dajana, and Sanja Steiner. 2023. "Conceptual Model of Predictive Safety Management Methodology in Aviation" Aerospace 10, no. 3: 268. https://doi.org/10.3390/aerospace10030268
Note that from the first issue of 2016, this journal uses article numbers instead of page numbers. See further details here.