

Low-Dimensional Models for Aerofoil Icing Predictions
by
 , ,
, ,
David Massegur
1 ,
,
Declan Clifford
1,
Andrea Da Ronch
1,*,
Riccardo Lombardi
2 and
Marco Panzeri
2 1
Department of Aeronautical and Astronautical Engineering, School of Engineering, Faculty of Engineering and Physical Sciences, Boldrewood Campus, University of Southampton, Southampton SO16 7QF, UK
2
Noesis Solutions, Gaston Geenslaan 11 B4, 3001 Leuven, Belgium
*
Author to whom correspondence should be addressed.
Aerospace 2023, 10(5), 444; https://doi.org/10.3390/aerospace10050444
Submission received: 5 April 2023
/
Revised: 30 April 2023
/
Accepted: 2 May 2023
/
Published: 11 May 2023
(This article belongs to the Special Issue The 10th Anniversary of Aerospace: Advances in Aerospace Sciences and Technology)
Abstract
:Determining the aero-icing characteristics is key for safety assurance in aviation, but it may be a computationally expensive task. This work presents a framework for the development of low-dimensional models for application to aerofoil icing. The framework builds on: an adaptive sampling strategy to identify the local, nonlinear features across the icing envelope for continuous intermittent icing; a classic technique based on Proper Orthogonal Decomposition, and a modern Neural Network architecture. The extreme diversity in simulated ice shapes, from smooth and streamlined to rugged and irregular shapes, motivated the use of an unsupervised classification of the ice shapes. This allowed deploying the Proper Orthogonal Decomposition locally within each sub-region, sensibly improving the prediction accuracy over the global model. On the other hand, the Neural Network architecture and the convolutional auto-encoder were found insensitive to the complexity in ice shapes. A strong correlation was found to exist between the ice shape, resulting ice mass and aerodynamic performance of the iced aerofoil, both in terms of the average and variance. On average, rime ice causes a loss of maximum lift coefficient of 21.5% compared to a clean aerofoil, and the average ice thickness is 0.9% of the aerofoil chord. For glaze ice, the average loss of maximum lift coefficient is 46.5% and the average ice thickness is 2.1%. Glaze ice was also found to have three times more surface coverage than rime ice.
1. Introduction
Inflight icing is a potential hazard at any flight level. The formation and accretion of ice alters the smooth flow of air, increasing drag and reducing the ability to generate lift, and degrading control authority. Power is needed to compensate for the additional drag and the airplane nose is lifted to maintain the altitude. These actions tend to increase the angle of attack, inadvertently exposing the underside of the wings and the fuselage to accumulate additional ice. This accelerates ice accumulation on every exposed frontal surface of the airplane, not just the wings and the fuselage, leading to a positive feedback loop. The airplane will stall at higher speeds and lower angles of attack than normally. Roll and pitch controls may be compromised, and stall recovery may be impossible [1]. Generally, severe icing problems may be encountered in: (a) heavy stratified clouds, or in rain, with icing possible up to 8000 ft higher than the above-mentioned meteorological conditions; and (b) in cumulus clouds, where large water droplets may be carried at high altitudes with strong updrafts. The number of icing-related accidents and incidents remain at high levels, with about 250 combined occurrences during the period 2006–2010 [2].
A large body of work exists on aircraft icing as reviewed, for example, in Ref. [3]. Several approaches are available to support aircraft icing design, analysis and certification. These approaches range from LEWICE3D developed at NASA Glenn Research Center which represents the state-of-the-art for certification, to computational fluid dynamics (CFD) [4], icing tunnel testing [5], and flight testing with artificial ice shapes or behind an icing tanker [6].
Reference [7] investigated the aerodynamic performance degradation of the two-dimensional (2D) RG-15 aerofoil, a common aerofoil used in unmanned air vehicles. The continuous maximum atmospheric icing conditions from Appendix C of the Title 14 Code of Federal Regulation (CFR), Part 25 [8] were sampled at 16 points to generate a surrogate model. Aerodynamic coefficients were found to have a dependence on liquid water content (LWC) and mean volume drop diameter (MVD), and in all cases tested a performance deterioration (lift coefficient reduction and drag coefficient increment) was observed. Ice accretion was simulated at a zero degree angle of attack, .
A systematic investigation on the sensitivity of ice accretion and aerodynamic performance degradation to four physical and one modeling parameters was reported in Ref. [4]. Their study expands beyond the dependence on LWC and MVD to include the dependence on surface roughness, ice density, droplet distribution (mono-disperse and poly-disperse Langmuir-D droplet distribution), evaporation, and single-shot and multi-shot approaches. The effects of critical physical and modeling parameters on eight ice-shape attributes, which were used to parametrize the ice profile, were ranked by sensitivity analysis. The test case was for the NACA 0012 aerofoil at pre-defined meteorological and icing conditions. Icing simulations were carried out at an angle of attack of four degrees. It is worth noting that the study puts forward the best recommendations for accurate icing simulations from the large number of cases investigated.
Today, the situation is governed by two contrasting elements. On one hand, three-dimensional (3D) CFD-based icing simulations can handle increasingly complex icing physics and aircraft geometries. However, only a small number of these simulations are manageable because of the high computational cost. On the other hand, there are countless areas amenable to greatly benefit from icing analysis. To just name two such areas, one can consider the design of deicing and anti-icing devices and systems [9], and pilot’s flight simulator training [10]. To make progress in addressing these two contrasting elements, the application of reduced-order models (ROMs), or low-dimensional models, to rapidly predict aerodynamics and ice shapes for 2D and 3D geometries have emerged.
The proper orthogonal decomposition (POD) extracts a set of eigenfunctions that describes the dominant features of the flow. In Ref. [11], the CFD model was projected onto the space spanned by the POD modes to obtain a ROM for the aerodynamic and aero-icing problems. Two test cases were presented. The first one is for the NACA 0012 aerofoil under a one-variable problem (freestream temperature). The effect of the number of POD modes, number of snapshots, and the choice of snapshots on the predicted ice shapes were investigated. The second test case is for the wing-body DLR-F6 configuration. Two variables, the freestream angle of attack and the temperature, were varied to generate a total of 25 snapshots. It is not unexpected that the ROM achieved a speed-up of two to three orders of magnitude compared to the high-fidelity CFD analysis. However, this figure shall be taken with caution as the cost for the generation of the snapshots, for example, was not included in the budgetary analysis. Reference [12] also shows the application of POD to two icing problems. One dataset consists of 95 iced cross-sections for the Common Research Model (CRM) configuration, and the other dataset of 54 ice shapes for a business jet aircraft. Both datasets were computed elsewhere in the open literature. Once POD modes were calculated, the work explores the effect of uncertainty in the POD modes on the reconstructed ice profile. Five parameters (2 POD coefficients and 3 scaling parameters) were assumed uniformly distributed within some bounds.
The current trend in the open literature sees the application of neural networks to icing. In Ref. [13], three neural network architectures were trained to learn Fourier series coefficients from a database of ice profiles. Data for the NACA 0012 aerofoil were dependent on atmospheric and flight conditions. It was found that the freestream temperature has a negligible effect for the rime ice cases, which means that the temperature becomes irrelevant to the accretion process once it is below a critical value. On the other hand, the results showed that all of the input parameters had some level of importance in glaze ice cases. Another example is the work presented in [14], whereby a more convoluted neural network machinery is demonstrated. In a characteristic way, machine learning has also shown some initial success for aero-icing problems, as reported in [9]. Reference [15] investigated the correlations between ice geometry parameters and aerofoil aerodynamic coefficients using a dense neural-network approach.
This work is built around the following objectives:
- Investigate the sensitivity of aerodynamic performance degradation and ice profile on icing conditions, as defined in Appendix C of the Title 14 CFR, Part 25.
- Generate a machine learning methodology using the pre-computed data from Objective 1, with application on the unsupervised classification of ice profile types and rapid prediction of scalar and vector fields for any combination of untried icing conditions. With the combined use of the knowledge and the tools developed in Objectives 1 and 2, one can:
- Rapidly perform the search for the critical icing conditions within the icing envelope for continuous maximum icing that lead to the worst aerodynamic performance degradation.
- Reconstruct the ice profile and its extension on the aerofoil surface for any other icing condition not included in the training set.
Contributions beyond State-Of-The-Art
This work goes beyond past and present activities on several fronts. For example, there is a similarity with Ref. [7] about Objectives 1 and 3 where their critical icing conditions were identified from 16 pre-defined samples. We employ an adaptive sampling strategy to locate the critical icing conditions within engineering accuracy, avoiding the peril of under-sampling the parameter space. Objective 2 relates to the deployment of a machine learning methodology. In this respect, we improve upon the work presented in Ref. [13] restricted by Fourier series decomposition of the ice profile. Our methodology is not limited to a single-valued ice shape, as when non-smooth and horn ice is present. Objective 4 concerns the data-driven reconstruction of the ice profile. Reference [12] dealt with a similar problem, but their reconstruction from a background static grid composed of about 0.7 million points hints at an excessive computational cost. We address this problematic by transforming the ice profiles into a curvilinear coordinate, effectively reducing the size of the problem. We target the predictions of the ice thickness normal to the aerofoil surface instead, and we scale it back to recover the physical meaning as a post-processing step.
In this work, we present three distinct reduced-order methods aimed at the fast reconstruction of the ice accretion around a NACA 0012 aerofoil and its aerodynamic impact throughout the icing envelope. On one side, we developed a global and a local POD method. We leveraged on the performance benefit that different ROMs each tailored to specific regions of the envelope can provide against a single ROM designed to compromise across the whole map. The generation of the local approach requires the identification of the different regions across such an envelope. While Ref. [16] presented a k-means clustering combined with a logistic-regression method based on the aerodynamic polars, in the present work we based the clustering on the smoothness of the ice profiles in order to classify them between glaze and rime.
Further to the state-of-the-art on classical POD, we also propose a novel machine-learning (ML) based method consisting of a neural network (NN) embedded in a convolutional auto-encoder. This is baptised by the acronym NN+Conv-AE. We use NN architectures to solve the problem of the highly nonlinear behavior across the icing envelope. NNs are designed to infer nonlinear mappings from data; convolutional neural network (CNN) layers are tailored to structured-grid domains; and auto-encoders provide nonlinear projections to a reduced space, as opposed to linear projections in the case of the POD. Thus, we leverage on this proposed NN architecture to achieve better reconstruction of the envelope of ice shapes. As a result, we assess the capabilities and predictive accuracy of the state-of-the-art, linear dimensionality reduction techniques with respect to POD and those of more modern approaches with respect to deep learning.
The paper continues in Section 2 with a comprehensive analysis of the icing problem. The methodology deployed to search the icing envelope is given in Section 3. Details about the development and implementation of the various low-dimensional models are provided in Section 4. The results for the ice profile prediction and resulting aerodynamic performance degradation are discussed in Section 5. Finally, conclusions are given in Section 6.
2. Problem of Ice Accretion
This section concerns the simulation of ice accretion using high-fidelity CFD. It provides a background study for the validation of the original data we want to approximate with rapid, low-dimensional models.
2.1. Ice Accretion Simulation
The aero-icing simulations were done using FENSAP-ICE 21.2 [11], a finite element Navier–Stokes code, coupled with an Eulerian-based algorithm to compute droplet impingement and an ice-accretion algorithm based on heat transfer between the exposed surface and the thin film of water resulting from droplets impingement. The ice accretion is treated with a quasi-steady, iterative approach, illustrated in Figure 1. For given mesh, flight and icing conditions, the solver first computes a flow analysis. Then, the droplet impingement on the surface is calculated, and the ice profile is extruded without remeshing to a chosen partial exposure time. In a multi-shot approach, this process is repeated iteratively to simulate ice accretion over time. Finally, the process ends with a flow analysis around the ice shape that has been last computed.
The aero-icing simulation is computationally more expensive than an aerodynamic CFD simulation. The increase in cost is due to the multi-physics involved in the icing problem, which includes the water impingement calculation and the ice accretion calculation. Further, the simulation cost increases linearly with the number of shots. Given the large number of conditions to be tested for certification, a purely CFD-based approach is unfeasible. Approaches based on a low-dimensional representation of the underlying problem are a promising and powerful strategy to compute a large number of conditions while providing similar prediction accuracy.
2.1.1. Validation Test Cases
First, we performed a background study to validate the ice shapes formed around a NACA 0012 aerofoil. Table 1 summarizes the flight and icing conditions. The aerofoil with a chord mm was tested at Mach number , angle of attack deg, for 7 min of ice accretion time. Two test cases are considered: one at K (−22.85 C) representative of rime ice, and the other at K (−9.45 C) for glaze ice. For comparison, we used experimental data from the NASA Icing Research Tunnel (IRT) [17,18] and numerical data from [4].
Figure 2 illustrates a C-type structured, viscous mesh of about 114,000 grid points. A concentration of points is placed around the aerofoil leading edge to capture the boundary layer and the ice accretion. Throughout, is verified. Based on a preliminary study for grid resolution, the mesh growth rate normal to the wall is and the chordwise resolution around the leading edge is about of the chord. Simulations are computed using the Spalart–Allmaras (SA) turbulence model, assuming a fully turbulent flow. The surface sand grain roughness is set to mm, while the solver computes the sand grain roughness distribution on the ice for the subsequent flow solution. Figure 3 compares the ice profiles with four multi-shot FENSAP-ICE simulations to those available in the open literature. The black curve represents the aerofoil boundary and the various ice results are overlapped. For the case of rime ice, the left panel of Figure 3, the simulation reproduces well the measured ice thickness. However, there is a slight disagreement with the position of maximum ice thickness around the aerofoil. For the glaze ice case, the right panel of Figure 3, the simulations are in good agreement with the experimental data in terms of ice horn height. For the upper horn ice, the position is also well-defined. However, there is a mismatch for the lower horn ice in terms of the position and subsequent trough.
We then investigated the effect that the number of multi-shots has on the simulated ice profile. This was done for the glaze ice case ( K) because it has an irregular and rough shape, as opposed to the rime ice. The number of multi-shots was increased from one to fourteen, while maintaining the total ice accretion time to 7 min. The single-shot simulation, represented by the red dotted line in Figure 4, provides a rime-like ice type. Neither horns are visible. All simulations with more than one shot indicate the formation of two ice horns. Their position and height are only slightly affected by the increase in the number of shots, which otherwise have a visible impact on degrading the mesh quality to conform to the ice profile. Based on this background study, all results herein presented are generated with four multi-shots.
2.1.2. Aerodynamics of Iced Aerofoil
Finally, we assessed the impact that a particular ice shape formed at an angle of attack has on the resulting aerodynamic loads. For the rime and glaze ice shapes previously calculated at deg (refer to Table 1), a sweep of the angle of attack was carried out. Figure 5 shows the dependence of the lift and drag coefficients with the angle of attack. Three curves are reported. The curve denoted “clean” refers to the clean (no-ice) aerofoil, which is used to indicate the nominal aerodynamics for the NACA 0012 aerofoil. The other two curves are for the iced aerofoil, one with rime ice and the other with glaze ice. The ice shape is accreted at a freestream angle of attack of 4 deg. The angle of attack of the iced aerofoil was then swept for the aerodynamic analysis, without recomputing the ice shape. This procedure for the calculation of the aerodynamic polars is justified in lieu of prior work [19].
When compared to the clean aerofoil, the iced aerofoil stalls at a lower angle of attack and generates a lower maximum lift coefficient at stall. In the post-stall region, the iced aerofoil recovers a lift coefficient, which tends to that of the clean aerofoil. This is not unexpected because the separation point has moved upstream to reach the leading edge of the aerofoil, and the flow results fully separated in all cases. Note that deep stall results are omitted from the figure due to the deficiencies introduced by a turbulence model. The drag rise of the iced aerofoil moves to a lower angle of attack, at which the lift coefficient dependence with the angle of attack departs from the linearity. From our results, glaze ice has the largest impact on aerodynamics degradation.
Aerodynamic data are conveniently represented by three quantities of interest: the stall angle of attack, , the maximum lift coefficient at stall, , and the lift curve slope, measured at deg. Table 2 summarizes these quantities of interest for the cases in Figure 5. The interval associated with is due to our one-degree step size in the angle of attack in computing the aerodynamic data. The iced aerofoils generate between 25% and 48% less lift at stall than the clean aerofoil, and stall occurs three to six degrees earlier than clean stall. It appears the glaze ice is the worst condition to encounter in flight, although the lift curve slope has a minimal change.
3. Icing Envelope Exploration
We proceed with exploring the continuous maximum icing envelope. The data we gather from the high-fidelity simulations form the information we want to approximate, devising a rapid prediction machinery that operates in a low-dimensional space.
3.1. Continuous Maximum Envelope
There are two envelopes used to describe the icing conditions for aircraft certification [8]: one is for continuous maximum icing and one for intermittent maximum icing. Both envelopes are defined by the variables LWC, MVD, and the ambient air temperature, . Figure 6 illustrates the dependence of these three variables for the continuous maximum icing envelope. Isotherm curves in the source material [8] are reported in Fahrenheit and were converted herein into Kelvin. The difference between the two envelopes reflects the type of addressed clouds: stratiform clouds for the continuous maximum icing, and cumuliform clouds for intermittent maximum icing. In this work, we focus on the continuous maximum envelope.
3.2. Adaptive Design of Experiments
The exploration of the icing envelope was supported by Noesis Optimus software. A strategic sampling of the design space was obtained with an adaptive design of experiments (ADOE) technique [20]. At each iteration, new samples are placed in regions of the design space where nonlinear features in the surface response are discovered. Compared with standard deterministic sampling techniques (i.e., Latin Hypercube), the attractiveness of the ADOE is for an efficient and thoughtful exploitation of the available computational budget while avoiding the peril of under/over-sampling. To this goal, two techniques are used: the Space Filling (SF), used to create a starting population, and the ADOE, to maximize the information extracted from a limited number of sampling points.
The SF is a “Maximin” optimal design [21] modified to deal with the characteristic shape of the icing envelope. Traditionally, the bounds of a design space are constant, and independent from each other. The resulting n-dimensional domain is a hyper-rectangle, which is conveniently mapped into a hypercube by normalizing each variable with the corresponding maximum and minimum values. The icing envelope, refer to Figure 6, has a tapered shape, and the bounds are interrelated. To deal with this particular situation, it is common practice to introduce rejection rules. The task of rejection rules is to filter the candidate experiments, generated according to the hypercube assumption, which lie outside of the effective domain, before they are forwarded for the investigation. We preferred an alternative approach. “Maximin” design embeds an optimization whose task is to determine the distribution of sample points that maximizes the minimum Euclidean distance among them. After an initial mapping of the tapered domain into a square one, the Euclidean distance metric was made a function of the local coordinate—therefore, the effective local extension of the domain. The exploitation of the local metric allows for the generation of points that satisfy the “Maximin” design approach once mapped back to the real design space, as shown in Figure 7. A total of 64 points were positioned. The first four, indicated by dark gray circles, were set a priori on the edges of the design space, commonly referred to as Bounding Box (BB) DOE. Three iterations, containing 20 points each, were carried. At subsequent iterations, sample points are placed to fill the gaps between the previous set of points. The non-homogeneous distribution in the normalized space, shown on the left Panel of Figure 7, is then regularized by the mapping in the physical design space, on the right panel.
The SF algorithm is non–adaptive, and only exploits knowledge related to the design variables. To maximize the knowledge contained in the icing simulations, the 64 samples were supplemented with two batches of ten samples, each determined from an ADOE methodology. This algorithm exploits the results of the analyses to internally build response surface models. Through their evaluation, it determines the regions of the domain where either a significant error by leave-one-out cross validation (LOOCV) is expected or one of the approximated outputs shows a non-linear behavior. The algorithm also features a space-filling logic targeted at the exploration of under-sampled regions. The balance between the exploratory (investigate space) and exploitative (focus on non-linearity) behavior of the algorithm is either decided by the user, or automatically adjusted over the sequential iterations [20]. As the initial sampling with the SF provided a reasonable spatial resolution, the ADOE was set to “exploitative mode”. The algorithm was adjusted to better perform in the problem domain; the local curvature and gradient of the outputs surrogate models, used to determine the non-linearity of the responses, were determined through the finite differences with intervals function of the problem coordinates. The objective was to correctly evaluate those quantities in response to the models being built on a stretched (normalized) representation of the domain.
Figure 8 documents the improvement, in terms of LOOCV error in maximum lift coefficient, obtained with the successive addition of sample points. In Panel (a), the SF batch contains a total of 64 samples (four at the edges plus three iterations with twenty samples each). In Panel (b), the ADOE prescribed 10 additional samples. Further, Panel (c) shows a batch of 10 further experiments placed along the 273 K isotherm. The temperature, greater than the water melting temperature, ensured no ice formation, therefore the experiments were associated with a clean airfoil condition. This improved the predictive capability of the model in the region between 260 K and 270 K where the average LOOCV error (therefore the relative influence of every experiment) is the highest. The selected batch of experiments is just above a region characterized by a steep gradient in all the evaluated outputs. By placing experiments at the edge of the no-ice formation area, we can improve the model quality by providing (without additional computational cost) reference experiments where the outputs are still zero. Panel (d) collects all the 94 sample points. The final representation of the sample points is shown in Figure 9. It is worth noting the different distribution of points from the SF and the ADOE, in line with the above-mentioned discussion. Our approach differentiates from other studies that preferred a significantly larger number of simulations (140) [16] to capture the most relevant aspects of the problem.
3.3. Icing and Aerodynamic Simulations for Continuous Maximum Envelope
Icing simulations were executed at the 94 sample points. These data represent the high-fidelity data we want to approximate with a low-order representation. Icing simulations were obtained using four multi-shots, and were run at the combination of MVD, LWC and as defined by the sampling procedure. Other relevant parameters are reported in Table 1.
3.3.1. Icing Simulations
Figure 10 collects all the ice profiles at the 94 sample points computed using FENSAP-ICE. Panel (a) conveys the ice shapes around the aerofoil for all conditions. It appears that the most common shape has the largest thickness just below the leading edge of the aerofoil, and that it runs back smoothly both on the upper and lower surfaces. Exceptions to this common trend are visible, with shapes presenting horns and unbalanced ice thickness on either sides of the aerofoil. This is further analyzed in Panel (b) of the same figure, which reports the ice mass distribution. A region with no ice was found, represented by white circles, at an ambient temperature higher than about K. Slightly below this region of no ice, a narrowly confined region of glaze ice exists. Some of the characteristic ice shapes extracted from this region are illustrated in the inserts. Common features are an irregular and rough ice profile. As the ambient temperature decreases, below about K, the ice layer gradually becomes smoother, smaller in area and with a symmetrical distribution around the stagnation point. This is typical of rime ice accretion, whose shapes are very similar among the different cases of the envelope, except for the thickness.
The challenge in developing and deploying a low-dimensional representation of the ice shape across the icing envelope is evident from the variety of shapes extracted in Figure 10.
3.3.2. Aerodynamic Simulations
Next, we calculated the aerodynamic performance of the iced aerofoils. We started from the ice accretion simulations already available at the 94 sample points. The icing simulation was carried out at a freestream angle of attack of 4 degrees, and that ice shape provides the external shape of the iced aerofoil. At each of the 94 samples, aerodynamic simulations were computed from 0 degrees up to a post-stall angle of attack, with a step increment of one degree. From the aerodynamic database obtained, the three quantities of interest were extracted: for the stall angle of attack, we have a resolution of . The results are show in Figure 11. The seriousness of the impact of ice on the lift and drag coefficients is apparent. Two observations can be drawn. The first is about the aerodynamic loads at the angle of attack at which ice grows, in our case . While still significant for an in-flight condition, the loss of lift coefficient of about 17% from the clean aerofoil is marginal when compared with the three-fold rise in drag coefficient from the clean value. The second observation is for the apparently organized pattern that connects the stall points. An underlying interdependence between the maximum lift coefficient and stall angle seems to exist regardless of the ice type. What is even more interesting is that the stall point moves along a direction with a similar slope to the lift curve slope of the clean aerofoil. Panels (c) and (d) of Figure 11 reveal the largest loss of lift coefficient is found on a narrow region along an isothermal curve. This region coincides with the region of glaze ice formation, as discussed in relation to Figure 10. Early flow separation leading to aerofoil stall is caused by the irregular and rough glaze ice shape. From this matching observation, one can identify the worst-case icing condition that caused a loss of of about 64% compared to a clean aerofoil and an increase of cruise drag of 106% compared to a clean aerofoil.
3.3.3. Computing Costs
We briefly summarize the computational cost incurred in the exploration of the icing envelope and in the generation of the aerodynamic data for the angle of attack sweep. The cost of each run is based on the time needed for the FENSAP-ICE analysis to converge. On average:
- The cost of one multi-shot icing simulation is about six node CPU hours;
- The cost to complete an angle of attack sweep, for an ice shape already formed, is about 41 node CPU hours.
We carried out the icing and aerodynamic analyses at 84 sample points, discarding 10 samples with no ice. This totals to about 3900 node CPU hours to obtain all the data presented up to this point of the paper.
4. Low-Dimensional Model Representations
This section provides the background foundations for the low-dimensional models and their application to the icing problem. Three models are introduced, and an unsupervised classification to categorize the type of ice profiles is discussed as a means to facilitate the deployment of local models.
4.1. Global and Local Approaches
A global model, deployed for the whole icing envelope, is the most desirable approach to reduce the complexity in the model generation [15]. It comes at the cost of compromising the model accuracy in cases with high variability in the quantities to be approximated. To overcome this problem, a local model, valid on a subset of the original envelope, may be the best choice. This artifact to improve the accuracy on predetermined sub-regions of the envelope increases the complexity in the model generation. A necessary pre-requisite is the knowledge on how to partition the original envelope in a physically consistent manner. This leads to the problem of classification, where the outputs to be approximated are grouped together into the same category.
We explored several global and local approaches. First, a global POD model interpolating across the entire icing envelope is developed and discussed in Section 4.3. A revised version of the POD model, valid within specified subsets of the envelope, is also presented. We then turned our attention to modern deep learning techniques. A convolutional auto-encoder (Conv-AE) is used for the prediction of the ice shapes, discussed in Section 4.4, for its capability to execute nonlinear compressions of structured image-like data. To our knowledge, this is the first time a Conv-AE approach is applied to ice-shape reconstruction. The prediction of the aerodynamic performance is obtained using a dense neural-network architecture, as explained in Section 4.5.
4.2. Definition of Input and Target Variables
We are interested in predicting the ice shape and the aerodynamic performance degradation across the icing envelope using a low-dimensional model representation. In Section 3.3, the output variables were found to exhibit a stronger correlation with and , rather than and . This justifies our choice here to develop low-dimensional models based on and pairs of data. For consistency with the Appendix-C definition, the prediction results will be plotted on the - space.
The ice profiles were transformed into a curvilinear coordinate to reduce the dimensionality from a 2D to a one-dimensional (1D) curve. Such transformation is done using the mesh information of node position and element normal on the aerofoil surface. The transformation is illustrated in Figure 12. The resulting 1D curve was then recast into a uniform vector of constant size using an ordered mesh index along the aerofoil boundary. The spatial extension of the 1D curve was determined by the envelope of all ice shapes. Cases with a narrow region of ice accretion were padded by zeros. This is a convenient choice as it allows working with vectors of the same size.
At this stage, a remark on the standardization process of the training data is needed. A common data pre-processing technique is to remove the average ice profile from the whole DOE shapes followed by normalization by the standard deviation. The inverse operation is required to convert back the predicted outputs by the model to physical coordinates.
4.3. Non-Intrusive Proper Orthogonal Decomposition
Data are arranged into a snapshot matrix, where each column of the matrix denotes a solution for a specific set of conditions, known as a snapshot. In this work, each snapshot may represent an ice shape or aerodynamic data at different icing conditions. This matrix is defined as
where each column of represents a snapshot. Using the singular value decomposition, this matrix can be decomposed according to
where is the matrix of left singular vectors, denotes a diagonal matrix of singular values, and is the matrix of right singular vectors. Here, each column of represents a POD mode. A snapshot of can be formulated as a linear sum of the POD modes multiplied by their corresponding singular value and right singular vector coefficient. Note that in our formulation, singular values of magnitude zero and their corresponding left and right singular vectors are omitted.
With the matrix decomposition determined, the singular values are used to find a truncation point in the SVD matrices. This decides the number of modes that will be used to represent a new data point. Herein, the cumulative sum of the singular values is used to find the number of modes recovering of the data variance. This index is denoted as k, such that . Thus, the matrix decomposition can be reformulated to approximate via truncation as
The approximation of an unseen snapshot at some query point, q, is obtained from the following expression:
where the elements are the right singular vector coefficients at the query point. Each of these coefficients are approximated at the query point via an interpolation of the right singular vectors over the DOE. This means there will need to be k response surface models, one for each singular vector coefficient, to approximate a snapshot over the DOE.
Multiple choices exist for the interpolation of the right singular vectors. We selected the standard approach based on Kriging interpolation with cubic splines. Cubic splines yielded results of similar quality to more complex interpolation mechanisms (based on minimizing the average LOOCV error) without their associated cost.
4.3.1. Global Model
Two global POD models were generated. One model, consisting of 17 modes, predicts the ice profile. The other model, for the prediction of the aero-icing characteristics, was built with five modes. For each model, the number of POD modes was chosen to capture of the respective input data variance. Figure 13 illustrates the workflow for the POD-based model, specifically taking the ice profiles as input data.
4.3.2. Local Model
Formulating a local POD model first requires the definition of distinct regions within the dataset. This is performed via clustering, which is the assignment of a label to a data point according to some metric of the data. k-means clustering is an unsupervised clustering technique that will attempt to divide a data set into k clusters. We found that k-means clustering, based on the lift coefficient polars [16], was unable to create distinct, separable clusters. Points within the no-ice region and points within parts of the rime ice region were clustered together, as reported in the left Panel of Figure 14. This was attributed to the similarity of the polars for points in these regions.
We introduced a metric to quantify the inherent characteristics of smoothness (or irregularity, on the contrary) typical of the ice shapes. The metric records the number of times the gradient of the ice thickness profile changes sign. As some ice shapes may be very rough on the surface without apparent horns, we filtered all wavelengths below a certain threshold before inferring the classification. The results of our classification are shown on the right Panel of Figure 14. With the points in the data set labeled according to a specific metric, a local model can be formed that is valid for the points within each of these clusters, following the workflow illustrated in Figure 13. This defines local interpolation zones, outside of which a local POD model is not valid. To avoid extrapolation using a local model, a linear interpolation of two local models is performed based on the euclidean distance between a query point and the zone boundary of the two models. This means that the results between these zones are a linear interpolation of the results of the two adjacent local ROMs. The identified zones are seen in the right panel of Figure 14 and are defined by the convex hull of each cluster. The region of overlapping zones is likewise resolved via local-interpolation.
Other approaches to deal with the boundary of local models exist, such in Ref. [16]. Decision boundaries are determined between each cluster and populated with new data points. The population of the decision boundaries with the new point serves to both verify the decision boundary through successive iterations of new points with reformulation of the decision boundary, and to fully enclose the local model for a part of the envelope. This, however, requires a substantial number of new points, which does not meet our initial problem specification.
4.4. Convolutional Auto-Encoder
Using a deep-learning architecture, the ice profile is predicted using an auto-encoder (AE) architecture based on convolutional layers, Conv-AE. An auto-encoder is well-suited for our problem, where the ice profile is described by about 200 grid points that wrap around the leading-edge. A dimensional reduction of the ice thickness vector is therefore sought to limit the size of the model. The AE is a type of neural network that reconstructs the same input by learning a representation in a compressed space [22].
With the ice shape conceived as a 1D image-like vector, convolution layers (CNN) were preferred over dense layers (DNN), as CNN are specifically designed to extract spatial features from the inputs. A schematic of the convolutional-auto-encoder model for the prediction of the ice profile is shown in Figure 15. The model involves two modules trained sequentially. The first module is for the Conv-AE, Panel (a). This module consists of: an encoder, the branch of the net that reduces the dimension of the input into a desired latent space; and a decoder, the branch that decompresses the information back to the original dimension. The AE acts in a similar manner to a POD model, but with the advantage of being able to infer reductions into a nonlinear space [23].
The encoder branch is formed by three blocks of layers. Each block consists of three layers: a convolution operation followed by the nonlinear activation and a pooling operation. The decoder branch involves three blocks of one transposed convolution followed by a nonlinear activation each. An explanation of these operations is provided in the following section.
The Conv-AE module is convenient to encode the ice-shape information. Thus, a second module is required to generate new predictions at untried locations of the icing envelope. To this goal, the module maps from the variables of the Appendix-C ( and ) to the reduced latent space of the Conv-AE, as it helps contain the network size. We shall refer the second module as DNN-Dec, shown in Panel (b) of Figure 15. The DNN-Dec module involves a DNN of four layers then connected to the decoder part of the Conv-AE, trained in the first module. The reader is referred to Section 4.5 for a description of the DNN. As a result, the second module performs predictions on the latent state and the decoder, then transforms it to a representative ice shape. This resembles the prediction of the capped mode coefficients on the classic POD approach.
The resulting NN+Conv-AE becomes the global model used to perform new predictions at untried samples on the icing envelope. This neural network was implemented using PyTorch 1.9 library.
Convolutional Auto-Encoder Operations
We describe here the operations involved in the distinct blocks of the Conv-AE module. Such operations are illustrated in Figure 16. Panel (a) concerns the 1D convolution operation and the 1D average pooling operation [24] adopted in each block of the encoder. These are labeled as Conv1D and AvgPool1D in Figure 15, respectively.
In vector form, the discrete convolution operation in CNNs is defined as [25]:
where , is the value of the inputs at the position , and denotes the kernel function or filter of weights of the chosen size p, i.e., the learnable parameters. Each CNN layer is formed from a designated number of convolution operations with different kernels. Following the convolution operation, the hyperbolic tangent (Tanh) was adopted as nonlinear activation. Lastly, the average pooling operation is adequate to reduce the dimension of the domain [26]. Panel (b) illustrates the 1D transposed convolution operation [27] involved in the decoder blocks, denoted as TransConv1D in Figure 15. The transposed convolution is aimed at gradually increasing the dimension of the domain. The tanh activation was also adopted as nonlinear activation in the decoder, except for the output layer.
Last, a low-pass FFT filtering is applied to remove high-frequency noise at the output of the decoder, obtaining a smoother ice profile. The frequency cut-off was established to 7.5 times the grid resolution, as it was found to remove the noise without dampening the magnitude signal excessively.
4.5. Deep Neural Network
A Conv-AE model can be deployed to predict the aerodynamic polar. However, we are interested more specifically to the stall characteristics, and , justifying the use of a compact NN model. A DNN consists of a stack of layers, where each layer takes the inputs from the previous layer and computes a combined operator consisting of a weighed linear expansion followed by a nonlinear activation [25]:
where is the input vector. The parameters to optimize are the weight matrix and the constant vector . Therefore, the size of is determined by the length of the input and output vectors. Each DNN layer is formed by a designated number of dense operations with different weights. The dense layers are labeled as Dense in the model architectures of Figure 15 and Figure 17. The nonlinear activation adopted in this work is the hyperbolic tangent . This function was preferred over other activation alternatives, such as the rectified linear unit [28] due to being differentiable throughout.
For the small size of the inputs and outputs, we can afford a compact NN architecture. In the present work, a 2-layer DNN architecture was developed. The schematic of the network for the prediction of the aerodynamic degradation is illustrated in Figure 17. The inputs of the proposed DNN are the two independent variables, and , and the outputs are the variation of the aerodynamic quantities at the stall point with respect to the clean case, i.e., , and . Note that the nonlinear activation is not applied at the last layer, as this would limit the outputs to take values between [−1, 1].
Computing Costs
We provide a comparison of the computational cost involved with the convolutional auto-encoder against the high-fidelity model, reported in Section 3.3.3. The comparison, however, is not direct as the neural networks are run in a general-purpose PC GPU, as opposed to a HPC in the case of the CFD:
- GPU hours, the cost of one simulation;
- 84, the total number of DOE runs computed.
This totals about GPU hours to complete the predictions of the same DOE as opposed to 3900 CPU hours spent in CFD. As a result, to compute new predictions, a computational saving of over 99% is possible. With respect to the POD techniques, a similar computational efficiency was achieved.
4.6. Leave-One-Out Cross Validation
We ran a validation campaign to cross-check the performance of the proposed low-order models approximating the high-fidelity data. The requirement to access a small DOE dataset of less than 100 samples in total rules out the classical cross-validation technique of randomly splitting the dataset for training and validation. A plausible alternative is the k-fold cross-validation [29]. This consists of randomly partitioning the dataset into subsamples of size k. ROMs are generated for as many partitions, each using a different subsample for validation and the rest of the partitions for training. However, careful consideration must be taken on the choice of the subsample size k because if it is too large in proportion to the whole dataset, the remaining samples for training may result as insufficient for a qualitative model. We preferred using the special case of the k-fold method, obtained when k equals the total number of samples. This technique corresponds to the leave-one-out cross validation (LOOCV) [16]. In LOOCV, we generate as many ROMs as DOE samples. One sample is left out each time and the corresponding model is generated using the rest of the dataset. The validation is carried out only on the excluded sample. The process is repeated for each sample. While this technique is convenient for small datasets—like ours—we should not forget that errors reported on a whole DOE are based on the outcome from a different model at each sample. In addition, to compute new predictions throughout the whole icing envelope, we opted for generating a single model trained with all the DOE samples.
To quantify the error in the ice profile predicted by the model from the ground truth obtained from the icing simulations, the metric measures the area difference between the two respective curves, in absolute value. Referring to Figure 18, the area difference corresponds to the gray area. For the calculation of the area, the similaritymeasures package in Python was used.
We also used the ice mass per unit span, assuming ice density of valid for the temperature range we are dealing with. Note that the ice-shape metrics are not normalized to avoid division by zero for regions of no-ice or with very low ice accretion.
5. Results
This section provides a comprehensive comparison among the various models hereby proposed for the prediction of the ice accretion and the resulting aerodynamic degradation performance. The multi-shot icing simulations are the reference to discuss the prediction capability of the models.
5.1. Ice Profile
We first assess the accuracy of the low-dimensional models to predict the ice profile across the entire icing envelope. The models are built on successive iterations of the design space exploration, starting from 64 samples up to 94. This allows evaluating the sensitivity of the models on the subset of samples, which indicates their reliability for a relatively small number of samples. The information gathered in this manner is used to quickly identify the regions of the icing envelope characterized by rime ice and glaze ice, with a potential correlation with the aerodynamic performance degradation presented in Section 5.2.
Figure 19 summarizes predictions from the low-order models generated using the entire dataset of samples. Intermediate results are reported in the Supplementary Material. The left panels are for the LOOCV error of the area enclosed by the ice profile, and the right panels are for the ice mass. Errors are low everywhere except for a region extending along an isotherm, where the most complex ice shapes are found. The LOOCV error of the ROMs was not used to inform the adaptive DOE of regions of interest. Instead, the adaptive DOE was used to introduce points based on aerodynamic performance degradation. The LOOCV plots demonstrate that the adaptive DOE populated a region that tends to align with more complex shape types, which also have a high mass.
The local POD model, in the mid row, demonstrates a reasonable improvement over the global POD model, the top row of panels. While the peak LOOCV error is higher, the average of the set is lower. Part of the improvement is due to the approximation of shapes in the smooth cluster due to the local model of this region needing fewer modes to accurately describe such shapes. By contrast, in the region corresponding to rougher shape types, the LOOCV errors are similar between the local and the global POD methods. The last row of panels correspond to the Conv-AE embedded with a DNN. We observe that the LOOCV errors with this model provide a significant improvement over the POD models. As with the other models, the discrepancy is larger in the complex shape region. The reader shall refer to the Supplementary Material for: (1) a brief explanation on the differences in the necessary POD modes resulting from the ice shape clustering; and (2) details of the final architecture adopted within the NN+Conv-AE model.
The right panels of Figure 19 illustrate the ice mass per unit span across the Appendix-C. The surface response was obtained by the low-dimensional models generated on the final distribution of DOE samples. The largest ice mass is identified by a symbol for each DOE iteration: ⋄ from iteration 1, ∘ after iteration 2 and ⋆ from the complete DOE. The dependence of the largest ice mass predicted by the global POD model, Panel (b), reflects the sensitivity of the model on the population size and is indicative of the difficulty of one single canonical model to do well across a large parameter space. On the opposite, the remaining two models (local POD and NN+Conv-AE) reach a quick convergence in the identification of the largest ice mass as the population size is increased. In all cases, the history of convergence is limited to an elongated region aligned with the isotherm (), where glaze ice shapes are found. For increasing temperatures, the large gradient of ice mass connects the glaze ice region to a region where ice accretion becomes irrelevant. The well-spaced contour lines of ice mass, at lower temperatures, represent gradual changes as rime ice becomes more frequently encountered.
A quantitative comparison of the largest ice mass predicted by the low-dimensional models is summarized in Table 3. All models agree well with the temperature at which the largest ice mass is found. To uniquely identify this icing condition within the 2D envelope, a second coordinate is needed. The larger discrepancy in the coordinate to identify this point is not unexpected. Due to the significantly larger range of values compared to values, a unit change along an isotherm will lead to a larger change of than .
Remarks
The ice mass was obtained from an ice shape that wraps around the leading-edge. A relationship exists between the response surface of the ice mass and a particular ice profile. To uncover this relationship, we extracted four ice profiles from the envelope, as indicated in Figure 20. Points “a” and “b” are from the elongated region of the larger ice mass, point “c” is at the right end corner of this region, and point “d” is taken from the low gradient region leading towards rime shapes. Predictions of the ice profile from the low-dimensional models are compared to the reference shape calculated with FENSAP-ICE. The ice shapes in Panels (a) and (b), typical of glaze ice, are relatively heavier than the rime ice shapes in Panels (c) and (d). This appears clearly in the figure, with glaze ice wrapping around a larger portion of the leading-edge surface and protruding more out of the surface. The presence of horns will have a detrimental effect on the flow development, as discussed in the next section. In terms of predictions, the previous finding is corroborated. The global POD model provides a basic qualitative insight on the ice shape with certain shortcomings, such as an erroneous indication of ice runback extension in Panel (a).
Figure 20.
DOE samples selected for the ice shape comparisons. The letters indicate the corresponding Panel in Figure 21.
Figure 20.
DOE samples selected for the ice shape comparisons. The letters indicate the corresponding Panel in Figure 21.
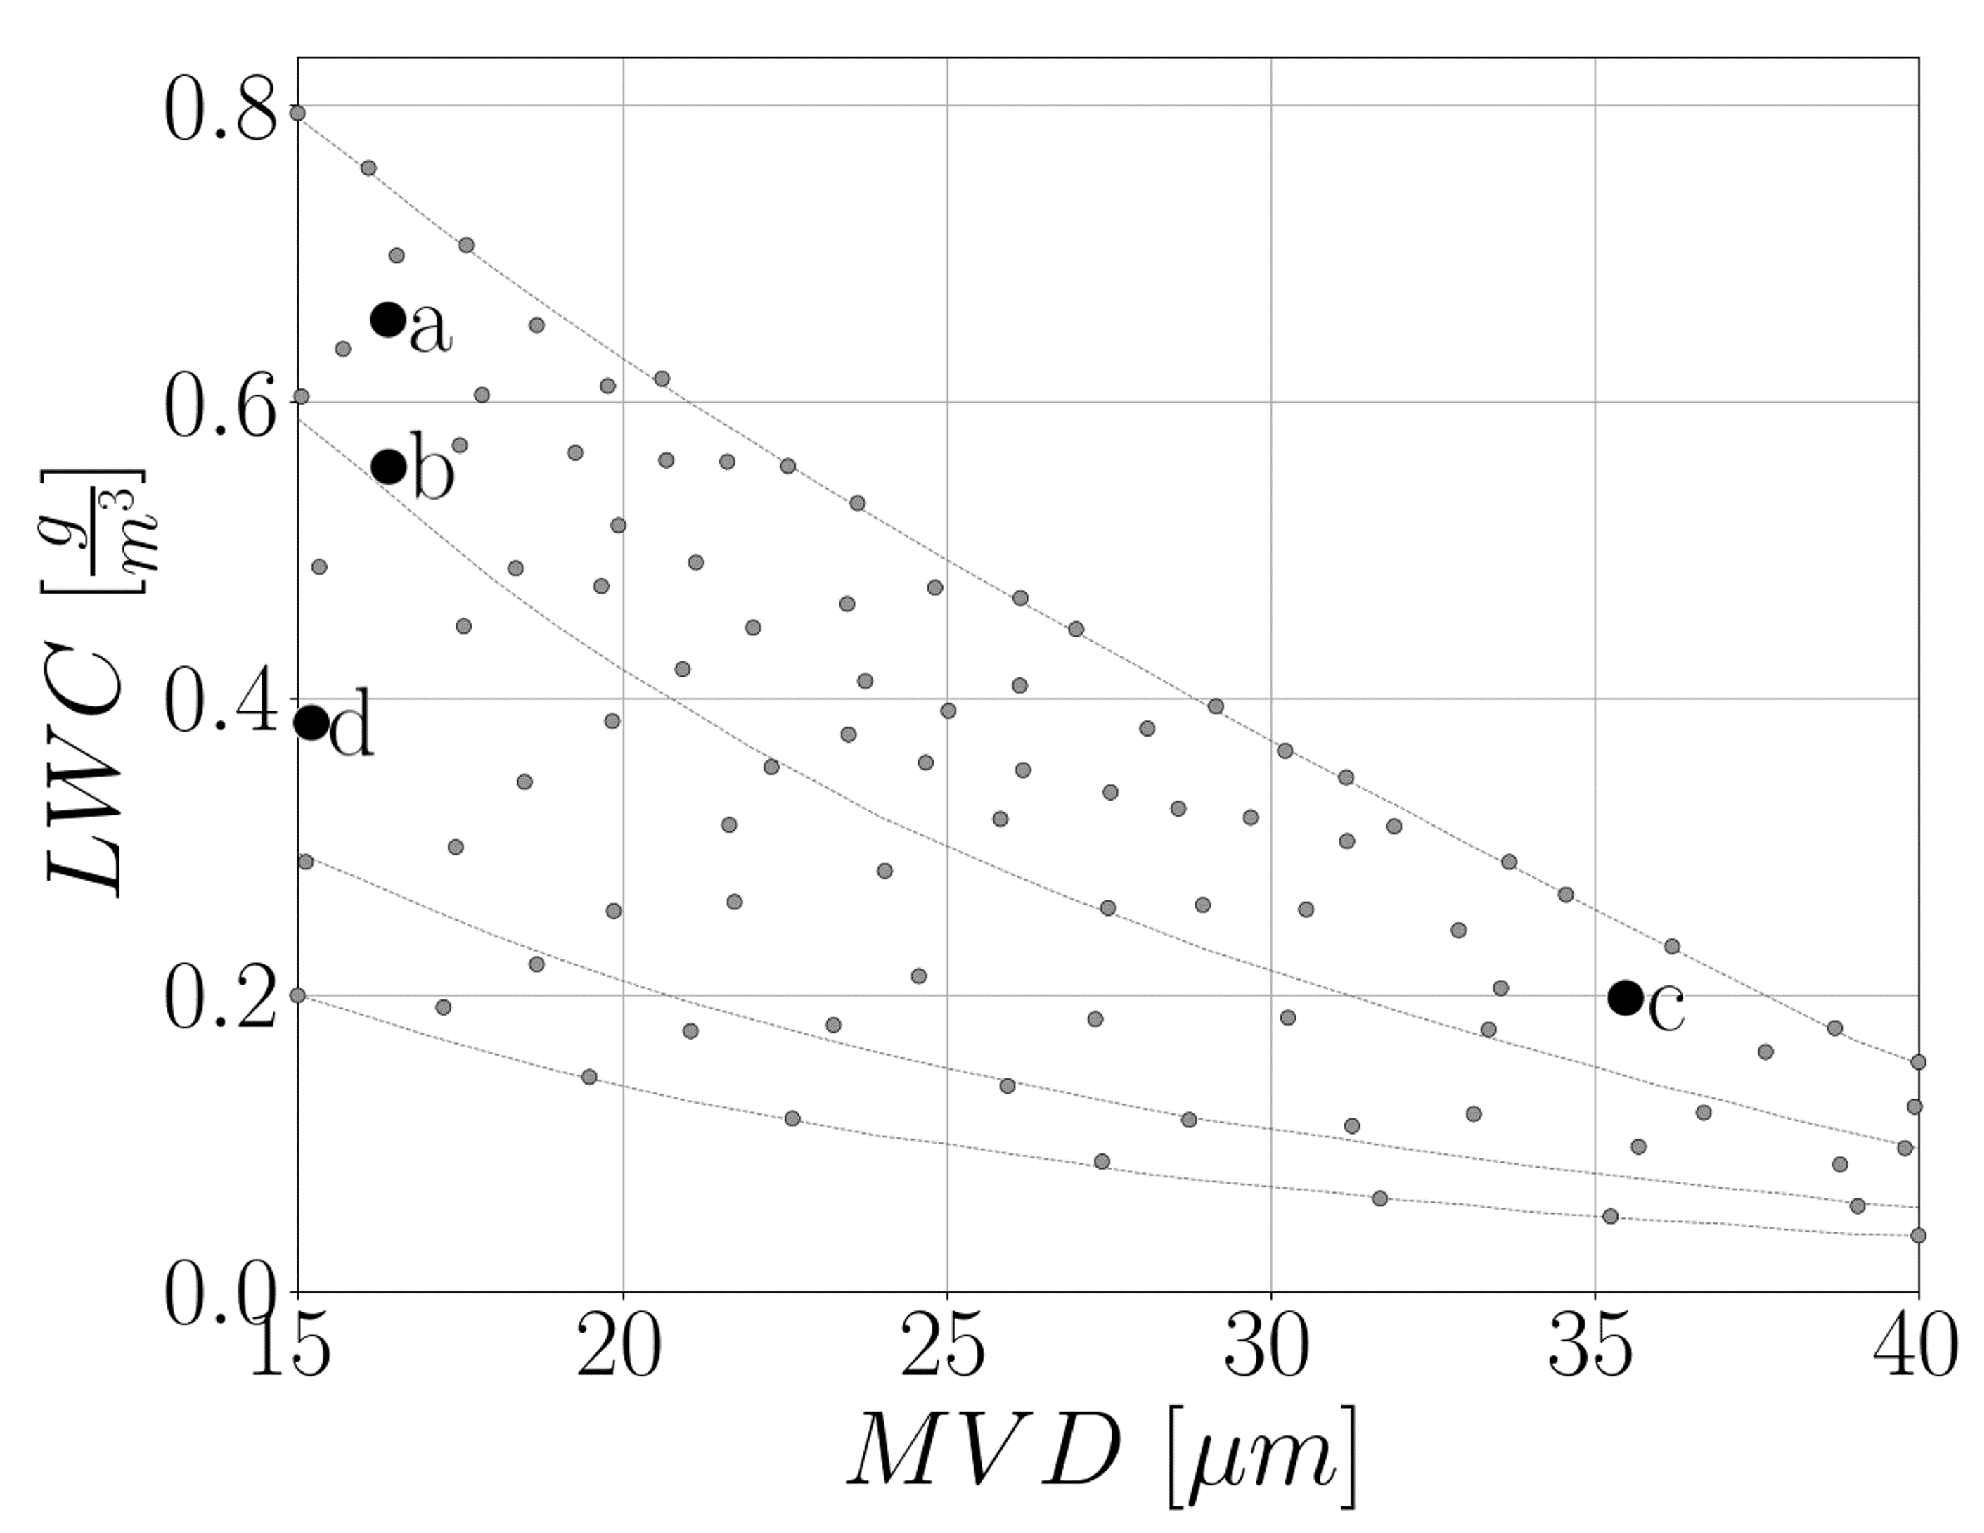
Figure 21.
Representative ice shapes extracted from Figure 20. (a) , , . (b) , , . (c) , , . (d) , , .
Figure 21.
Representative ice shapes extracted from Figure 20. (a) , , . (b) , , . (c) , , . (d) , , .

5.2. Aero-Icing Characteristics
We now move on to analyze the prediction of the aerodynamic performance degradation using the low-dimensional models as the source of the data. The presentation and discussion of the results are centered around the maximum lift coefficient and angle of attack at stall. In terms of the DNN model, details of the final architecture are summarized in the Supplementary Material.
Figure 22 shows the maximum lift coefficient, , predicted across the envelope. Predictions are accompanied by the LOOCV error on the left panels. High values of , at a level comparable to the maximum lift coefficient of the clean geometry, are found at warm temperatures, where marginal ice accretion occurs, and at very cold temperatures where rime ice is dominant. The progressive accretion of glaze ice for decreasing temperature leads to a rapid loss of the maximum lift coefficient identified by the proximity of isotherms. The value of drops by about 65% from the maximum lift coefficient of a clean aerofoil, indicated with ★ in the envelopes for each model. Corresponding icing conditions are for a region delimited by temperature in the range 265 to 269 K, and in the range 20 to 25 . Beyond this region, the gradual gradient between isotherms is attributed to accretion of rime-like ice, which presents a smoother and more streamlined shape than glaze ice. Predictions obtained using the three models (global POD, local POD, DNN) are in overall good agreement. The marginal under-performance of the global POD model, quantified by the LOOCV, is not expected following from previous discussions.
The impact of ice on the stall angle of attack is qualitatively similar to the impact that ice has on the maximum lift coefficient, discussed in Figure 22. Predictions of and associated LOOCV are presented in Figure 23. At the worst icing condition, which corresponds to the largest drop in the maximum lift coefficient by about 65%, the stall angle of attack is as low as 7 deg, again indicated with ⋆. Quantitatively, all models agree well on predicting the impact of ice on the aerodynamic characteristics. Differences in the response surface between POD models and the DNN model are explained by the approach used in each model. The POD models were generated using the aerodynamic polar calculated at a constant step increment of 2 deg, limiting the resolution in the angle of attack. On the contrary, the DNN model was built using the values at the stall angle of attack, resulting in a continuous distribution.
Remarks
The ability to perform classification of ice shapes and the predictive capability to reconstruct an entire aerodynamic polar, e.g., versus , for any ice shape offer unique insights in discovering a relationship between ice shapes and aero-icing characteristics. The first step was to leverage on the local POD methodology to populate aerodynamic data for 500 ice shapes. Each shape was classified into rime and glaze ice, using the approach in Section 4.3.2. Then, aerodynamic polars were also classified, pertaining to a certain type of ice. The entire set of aerodynamic data is presented in Figure 24. Distinct types of ice lead to distinct aerodynamic performances. This observation holds also for the maximum lift coefficient, the stall angle of attack, and the lift curve slope of each curve. A quantification in terms of and is revealed in Figure 25. Important observations can be drawn. First, rime ice causes on average a moderate loss of the maximum lift coefficient compared to glaze ice, accompanied by a relatively similar impact on the stall angle. Second, glaze ice was found to introduce a larger variability in key aerodynamic metrics than rime ice. The reason is easily attributed to the sensitivity of the flow field to glaze ice shapes that disrupt the smooth flow of air causing premature flow separation at the leading-edge. Note that the spread and variability of the box-and-whisker plot is statistically representative being obtained for a population of 500 ice shapes. Compared with a clean aerofoil generating about 1.4 maximum lift coefficient, the loss for an aerofoil covered with rime ice is between about 14.3 and 28.6%, and for one with glaze ice between about 28.6 and 64.4%.
5.3. Identification of Worst-Case Icing Conditions
The reader will find a brief history of convergence for the average LOOCV error in the Supplementary Material. Building upon predictions that have reached convergence with the number of sample points, this section targets the identification of the worst-case icing conditions. These conditions are summarized in Table 3 for the heaviest ice mass, and in Table 4 for the lowest values of the maximum lift coefficient and stall angle of attack.
Table 3 indicates the heaviest ice mass of about 250 g is found along the 268 K isotherm. This temperature combined with a lower LWC also corresponds to the largest penalty in aerodynamics, found further to the right of the envelope than the point of the heaviest ice mass. The identified sub-region of the icing envelope is dominated by glaze ice shapes. When compared to a clean aerofoil stalling at a 14 deg angle of attack and 1.4 maximum lift coefficient, the worst ice encounters may lead to a reduction of about 50% in the stall angle of attack and a loss of about 65% in the lift coefficient. Although the worst-case icing conditions are defined with respect to two distinct quantities of interest, which may be initially thought independent from each other (ice mass and stall), it appears they all occur in close proximity. Implicitly, this creates a dependence between heavier ice shapes and icing conditions having the largest impact on aerodynamics.
6. Conclusions
A comprehensive understanding of the aerodynamic characteristics across the envelope for continuous maximum icing conditions is challenging computationally. Notable reasons are that icing simulations are more complex and expensive to solve than a flow simulation; and that discovering nonlinear and local features in the response surface appears an endless journey destined to terminate by the utilization of allocated computational resources rather than by achieving a thorough knowledge of the phenomenon. In this work, the test case is for a NACA 0012 aerofoil, often used in the relevant open literature. We have used it to understand if our work could be scaled up to deal with more complex situations. The work followed various strands. The first is for a careful selection of sample points across the icing envelope. With a limited and stringent computational budget, set to emulate a realistic setting, an adaptive design of experiments placed successive points, with minimal user intervention, within a confined region of strong gradients. The second strand related to the development of low-dimensional models to predict the ice shape that wraps around the aerofoil and the resulting impact these shapes have on the aerodynamic performance of the iced aerofoil. Retrieving the ice thickness distribution around the surface for predictions, which is a vector field, resulted as more challenging than dealing with a scalar quantity, e.g., aero-icing characteristics. In terms of low-dimensional models, the decision was to choose models from the extremes of the spectrum: a classic and widely used technique based on Proper Orthogonal Decomposition and a modern and less-popular architecture based on Neural Networks. A certain ice type, named rime ice, presents a smooth, regular and streamlined shape that is in strong contrast with the rugged and irregular shape of glaze ice, often featuring horns extending off the surface that lead to flow separation. A mix of the two types naturally exists. The extreme diversity in ice shapes across the envelope motivated us to pursue a classification to gather together all the icing conditions that generate one particular type of ice shape. The classification then led us to attempt improving the prediction of the Proper Orthogonal Decomposition, which was largely degraded due to the dissimilar nature of ice shapes. The local Proper Orthogonal Decomposition model, generated and valid on a subdomain of the entire icing envelope, performed better than the original global Proper Orthogonal Decomposition model. On the contrary, the Neural Network architecture was found able to deal with the large variations of design outputs across the icing envelope. We found that:
- The occurrence of glaze ice is most probable within a thin, elongated area along an isotherm just below freezing temperature, covering most of the Median Volume Diameter range. Rime ice occurs at lower temperatures. The classification of ice shapes into glaze and rime ice is possible in certain cases, although a mix of ice shapes occurs naturally at the intersection of these two, well-defined regions.
- There exists a strong correlation between ice shape, resulting ice mass, and aerodynamic performance of the iced aerofoil. Specifically, glaze ice is associated with a heavier mass and with a larger penalty in aerodynamic performance. Rime ice is generally more benign both in terms of added mass and degradation of the aerodynamic performance.
- For a quantification of the aerodynamic performance in terms of stalling characteristics, the average and the variance are key indices for consideration. The formation of glaze ice causes an average loss of maximum lift coefficient of about 46.5%, with variations in the range 28.6 to 64.4%. For rime ice, the average loss is about 21.5%, with variations in the range 14.3 to 28.6%. A similar relationship exists for the reduction of the stall angle of attack.
We acknowledge that results and findings of this work may depend on a number of assumptions. To list a few relevant instances: (1) the number of multi-shots was set after a validation exercise, but no guarantee exists for the independence of the results obtained when exploring the icing envelope; (2) the Median Volume Diameter and the Liquid Water Content were set to their maximum values specified by the icing envelope; however, icing will occur at any other values below the maximum values and this should be investigated if relevant to icing; (3) stalling characteristics were analyzed within the assumptions of a turbulence model; this calls for higher fidelity, which is rarely used in aerodynamic simulations and even less in icing simulations.
Supplementary Materials
The following supporting information can be downloaded at: https://www.mdpi.com/article/10.3390/aerospace10050444/s1, Table S1: NN+Conv-AE layer sizes used for the prediction of the ice profiles; Table S2: DNN layer sizes used for the global prediction of the aero–icing characteristics; Figure S1: Convergence of global POD model for predicting ice mass. On the left, LOOCV of total ice area and on the right, ice mass; Figure S2: Convergence of local POD model for predicting ice mass. On the left, LOOCV of total ice area and on the right, ice mass; Figure S3: Convergence of global convolutional autoencoder for predicting ice mass. On the left, LOOCV of total ice area and on the right, ice mass; Figure S4: Convergence of global POD model for predicting maximum lift coefficient, C. On the left, LOOCV of C and on the right, C; Figure S5: Convergence of local POD model for predicting maximum lift coefficient, C. On the left, LOOCV of C and on the right, C; Figure S6: Convergence of global DNN for predicting maximum lift coefficient, C. On the left, LOOCV of C and on the right, C; Figure S7: History of LOOCV average errors for all low–order models through the DOE iterative sampling.
Author Contributions
Conceptualization, A.D.R.; methodology, D.M. and D.C.; software, R.L., M.P., D.M. and D.C.;
investigation, D.M., D.C., R.L. and M.P.;
formal analysis, D.M., D.C. and A.D.R.;
data curation, D.M., D.C. and R.L.;
writing—original draft preparation, A.D.R., D.M., D.C., R.L. and M.P. All authors have read and agreed to the published version of the manuscript.
Funding
This research received no external funding.
Data Availability Statement
The data presented in this study are openly available at the University of Southampton repository.
Acknowledgments
The authors acknowledge the use of the IRIDIS High-Performance Computing Facility, and associated support services at the University of Southampton, in the completion of this work. Anawil Yuktanand is also acknowledged for providing the high-fidelity icing and aerodynamic data.
Conflicts of Interest
The authors declare no conflict of interest.
Abbreviations
The following abbreviations are used in this manuscript:
| AvgPool1D | 1D average pooling layer |
| ADOE | Adaptive Design of Experiments |
| AE | Auto-Encoder |
| CFD | Computational Fluid Dynamics |
| CNN | Convolutional Neural Network |
| Conv1D | 1D convolution layer |
| Conv-AE | Convolutional Auto-Encoder |
| DNN | Dense (or fully-connected) Neural Network |
| DOE | Design of Experiments |
| LHS | Latin Hypercube Sampling |
| LOOCV | Leave One Out Cross Validation |
| LWC | Liquid Water Content |
| ML | Machine Learning |
| MVD | Mean Volumetric Diameter |
| POD | Proper Orthogonal Decomposition |
| RANS | Reynolds-Averaged Navier Stokes |
| RSM | Response Surface Model |
| SF | Space Filling |
| TransConv1D | 1D transposed convolution layer |
References
- Heinrich, A.; Ross, R.; Zumwalt, G.; Provorse, J.; Padmanabhan, V.; Thompson, J.; Riley, J. Aircraft Icing Handbook; Report No. DOT/FAA/CT-88/8-1; Gates Learjet Corporation: Wichita, KS, USA, 1991; Volume 1 of 3. [Google Scholar]
- Appiah-Kubi, P.U.S. Inflight Icing Accidents and Incidents, 2006 to 2010. Master’s Thesis, University of Tennessee, Knoxville, TN, USA, 2011. [Google Scholar]
- Cao, Y.; Tan, W.; Wu, Z. Aircraft icing: An ongoing threat to aviation safety. Aerosp. Sci. Technol. 2018, 75, 353–385. [Google Scholar] [CrossRef]
- Prince Raj, L.; Yee, K.; Myong, R.S. Sensitivity of ice accretion and aerodynamic performance degradation to critical physical and modeling parameters affecting airfoil icing. Aerosp. Sci. Technol. 2020, 98, 105659. [Google Scholar] [CrossRef]
- Vecchione, L.; De Matteis, P. An Overview of the CIRA Icing Wind Tunnel. In Proceedings of the 41st Aerospace Sciences Meeting and Exhibit, AIAA, Reno, NV, USA, 6–9 January 2003. [Google Scholar] [CrossRef]
- Ratvasky, T.P.; Foss Van Zante, J.; Sim, A. NASA/FAA Tailplane Icing Program: Flight Test Report; NASA/TP-2000-209909; NASA: Hanover, MD, USA, 2000. [Google Scholar]
- Fajt, N.; Hann, R.; Lutz, T. The influence of meteorological conditions on the icing performance penalties on a UAV airfoil. In Proceedings of the 8th European Conference for Aeronautics and Space Sciences, EUCASS, Madrid, Spain, 1–4 July 2019. [Google Scholar] [CrossRef]
- Jeck, R.K. Icing Design Envelopes (14 CFR Parts 25 and 29, Appendix C) Converted to a Distance-Based Format; Federal Aviation Administration Report DOT/FAA/AR-00/30; US Department of Transportation: Washington, DC, USA, 2002. [Google Scholar]
- Sakaue, H. Special issue: Deicing and anti–icing of aircrafts. Aerospace 2021, 8, 72. [Google Scholar] [CrossRef]
- Deters, R.W.; Dimock, G.A.; Selig, M.S. Icing encounter flight simulator. J. Aircr. 2006, 43, 1528–1537. [Google Scholar] [CrossRef]
- Nakakita, K.; Nadarajah, S.; Habashi, W. Toward real-time aero-icing simulation of complete aircraft via FENSAP-ICE. J. Aircr. 2010, 47, 96–109. [Google Scholar] [CrossRef]
- DeGennaro, A.; Rowley, C.W.; Martinelli, L. Data-driven low-dimensional modeling and uncertainty quantification for airfoil icing. In Proceedings of the 33rd AIAA Applied Aerodynamics Conference, AIAA, Dallas, TX, USA, 22–26 June 2015; pp. 1–16. [Google Scholar]
- Ogretim, E.; Huebsch, W.; Shinn, A. Aircraft ice accretion prediction based on neural networks. J. Aircr. 2006, 43, 233–240. [Google Scholar] [CrossRef]
- Chang, S.; Leng, M.; Wu, H.; Wu, M.; Thompson, J.M. Aircraft ice accretion prediction using neural network and wavelet packet decomposition. Aircr. Eng. Aerosp. Technol. 2016, 88, 128–136. [Google Scholar] [CrossRef]
- Cao, Y.; Yuan, K.; Li, G. Effects of ice geometry on airfoil performance using neural networks prediction. Aircr. Eng. Aerosp. Technol. 2011, 83, 266–274. [Google Scholar] [CrossRef]
- Zhan, Z.; Habashi, W.G.; Fossati, M. Local reduced-order modeling and iterative sampling for parametric analyses of aero-icing problems. AIAA J. 2015, 53, 2174–2185. [Google Scholar] [CrossRef]
- Wright, W.B. Validation Results for LEWICE 3.0; Technical Report; NASA: Hanover, MD, USA, 2005. [Google Scholar]
- Shin, J.; Bond, T.H. Experimental and Computational Ice Shapes and Resulting Drag Increase for a NACA 0012 Airfoil; NASA TM 105743; NASA Technical Memorandum: Long Beach, CA, USA, 1992. [Google Scholar]
- Gray, V.H.; von Glahn, U.H. Effect of Ice and Frost Formation on Drag of NACA 651-212 Airfoil for the Various Modes of Thermal Ice Protection; NACA Report 2962; NACA: Washington, DC, USA, 1953. [Google Scholar]
- Da Ronch, A.; Panzeri, M.; Abd Bari, M.A.; D’Ippolito, R.; Franciolini, M. Adaptive design of experiments for efficient and accurate estimation of aerodynamic loads. Aircr. Eng. Aerosp. Technol. 2017, 89, 558–569. [Google Scholar] [CrossRef]
- Pronzato, L. Minimax and maximin space-filling designs: Some properties and methods for construction. J. Soc. Franç. Stat. 2017, 158, 7–36. [Google Scholar]
- Kramer, M.A. Nonlinear principal component analysis using autoassociative neural networks. AIChE J. 1991, 37, 233–243. [Google Scholar] [CrossRef]
- Brunton, S.L.; Noack, B.R.; Koumoutsakos, P. Machine Learning for Fluid Mechanics. Annu. Rev. Fluid Mech. 2020, 52, 477–508. [Google Scholar] [CrossRef]
- Chollet, F. Deep Learning with Python; Manning: Shelter Island, NY, USA, 2017. [Google Scholar]
- Goodfellow, I.; Bengio, Y.; Courville, A. Deep Learning; MIT Press: Cambridge, MA, USA, 2016. [Google Scholar]
- Morimoto, M.; Fukami, K.; Zhang, K.; Nair, A.G.; Fukagata, K. Convolutional neural networks for fluid flow analysis: Toward effective metamodeling and low-dimensionalization. Theor. Comput. Fluid Dyn. 2021, 35, 633–658. [Google Scholar] [CrossRef]
- Zeiler, M.D.; Krishnan, D.; Taylor, G.W.; Fergus, R. Deconvolutional networks. In Proceedings of the IEEE Computer Society Conference on Computer Vision and Pattern Recognition, San Francisco, CA, USA, 13–18 June 2010; pp. 2528–2535. [Google Scholar] [CrossRef]
- Raissi, M.; Perdikaris, P.; Karniadakis, G.E. Physics-informed neural networks: A deep learning framework for solving forward and inverse problems involving nonlinear partial differential equations. J. Comput. Phys. 2019, 378, 686–707. [Google Scholar] [CrossRef]
- Bishop, C.M. Pattern Recognition and Machine Learning; Springer: New York, NY, USA, 2006. [Google Scholar]
Figure 1.
Workflow for ice accretion simulation using FENSAP-ICE.
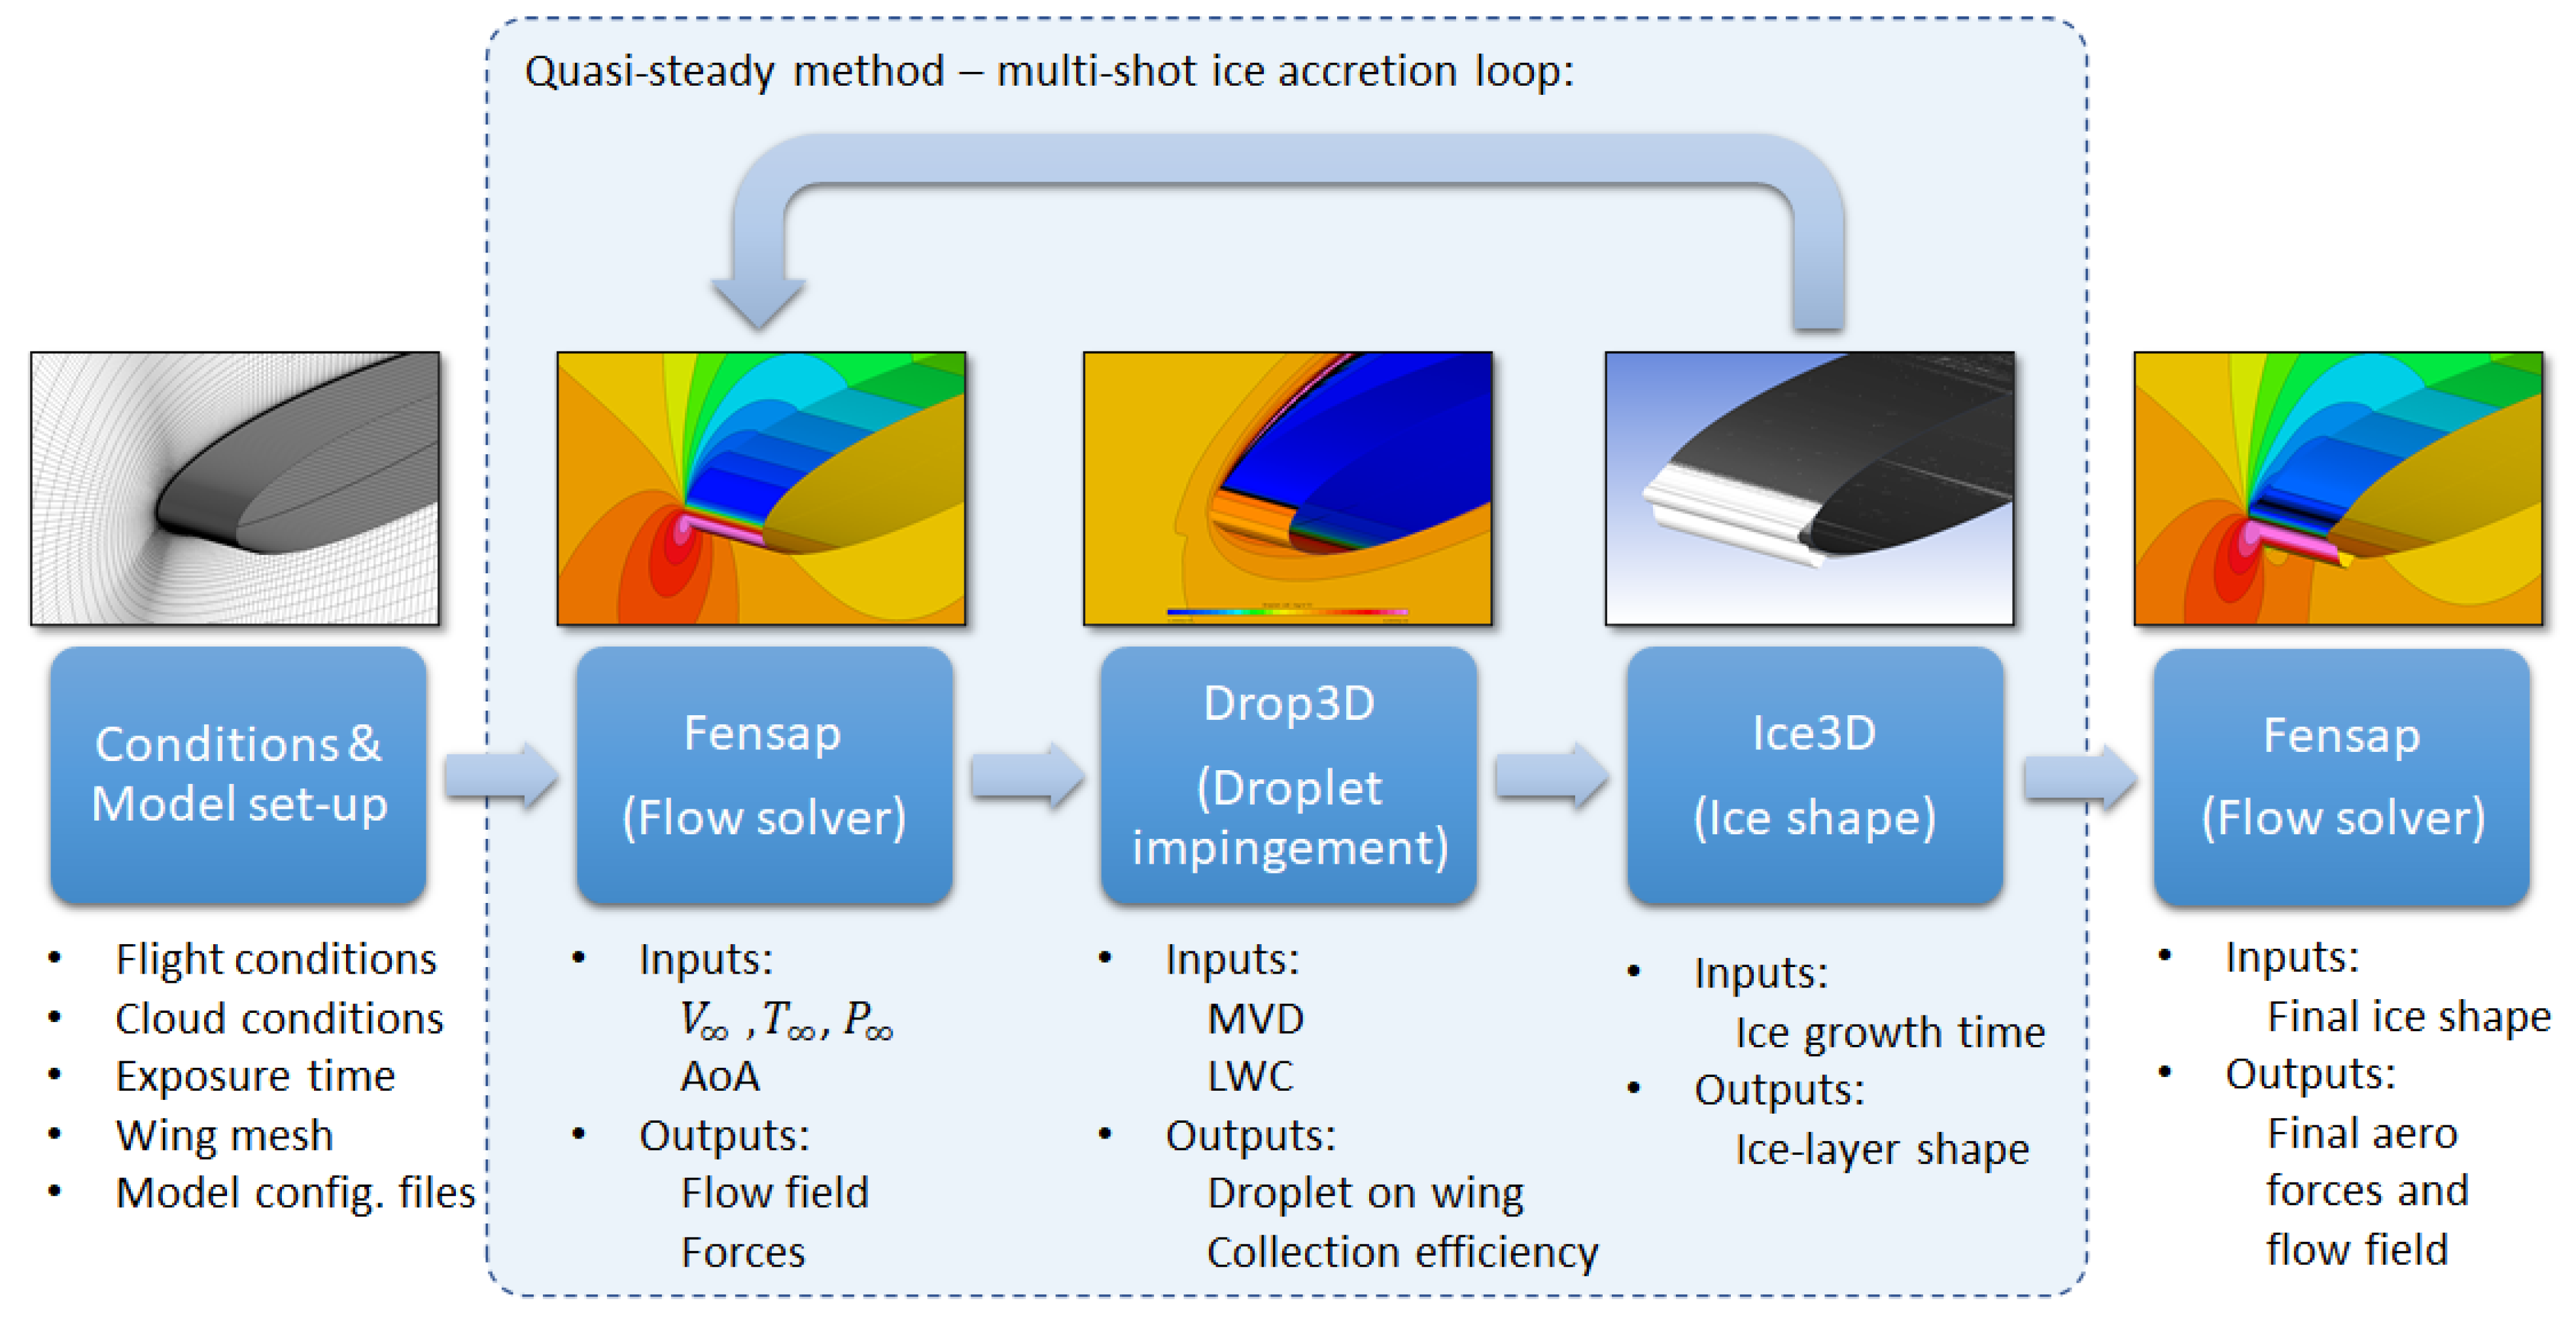
Figure 2.
C-type structured mesh for validation of ice accretion simulations around NACA 0012 aerofoil. (a) Mesh around the aerofoil. (b) Close-up view at the leading edge.
Figure 2.
C-type structured mesh for validation of ice accretion simulations around NACA 0012 aerofoil. (a) Mesh around the aerofoil. (b) Close-up view at the leading edge.
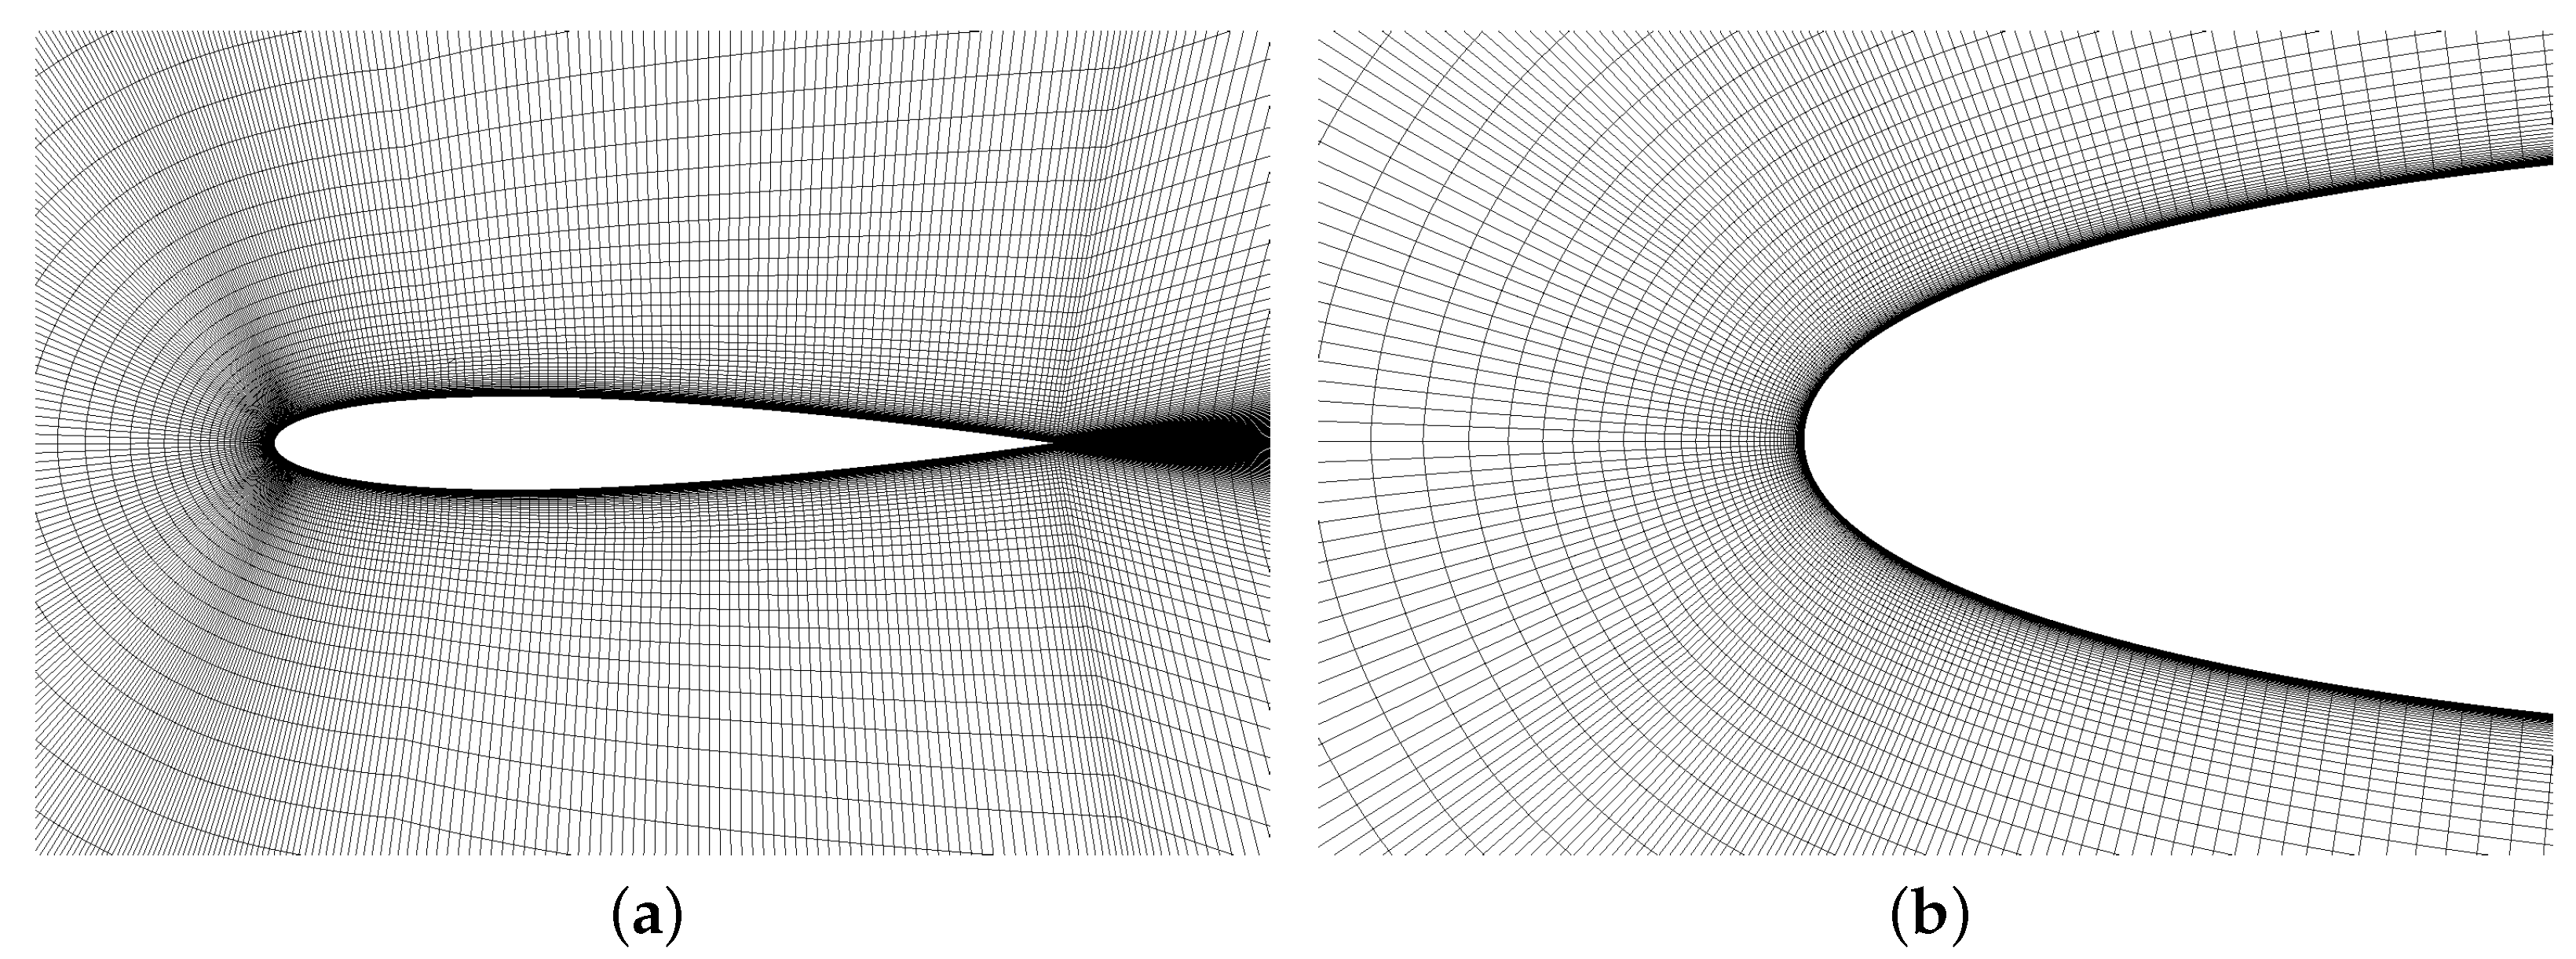
Figure 3.
Validation of ice-shape profiles for conditions reported in Table 1; in the legend, ‘Exp Data’ refers to experimental data [17], ‘Num Data’ to numerical data [4], and ‘Present’ indicates results obtained herein. (a) Rime ice, . (b) Glaze ice, .
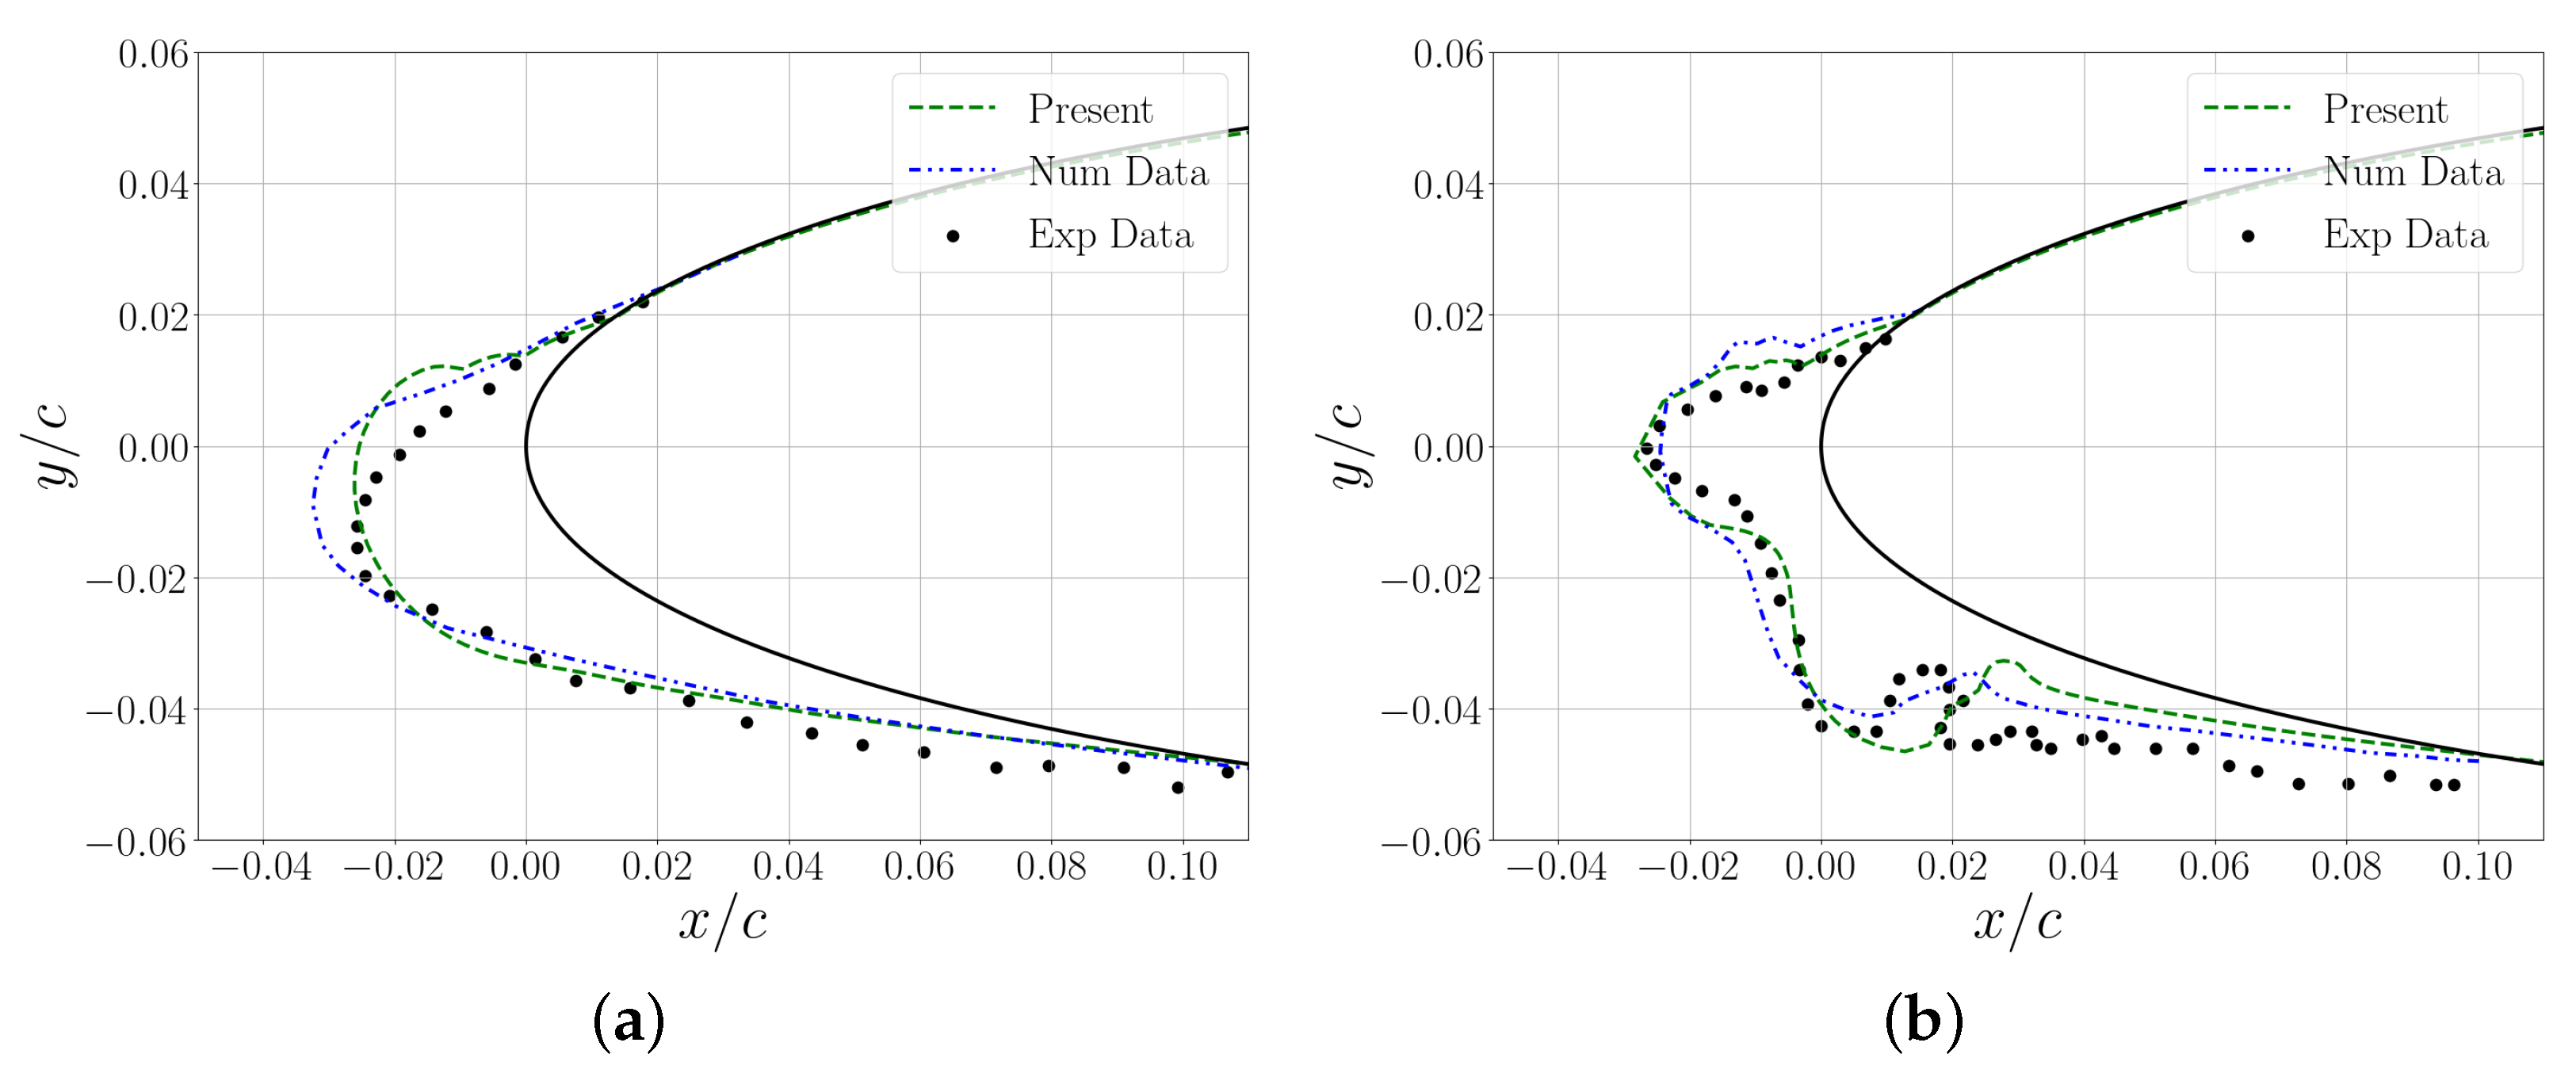
Figure 4.
Influence of the number of multi-shots on the simulated ice profile for glaze ice case (); total simulation time of .
Figure 4.
Influence of the number of multi-shots on the simulated ice profile for glaze ice case (); total simulation time of .
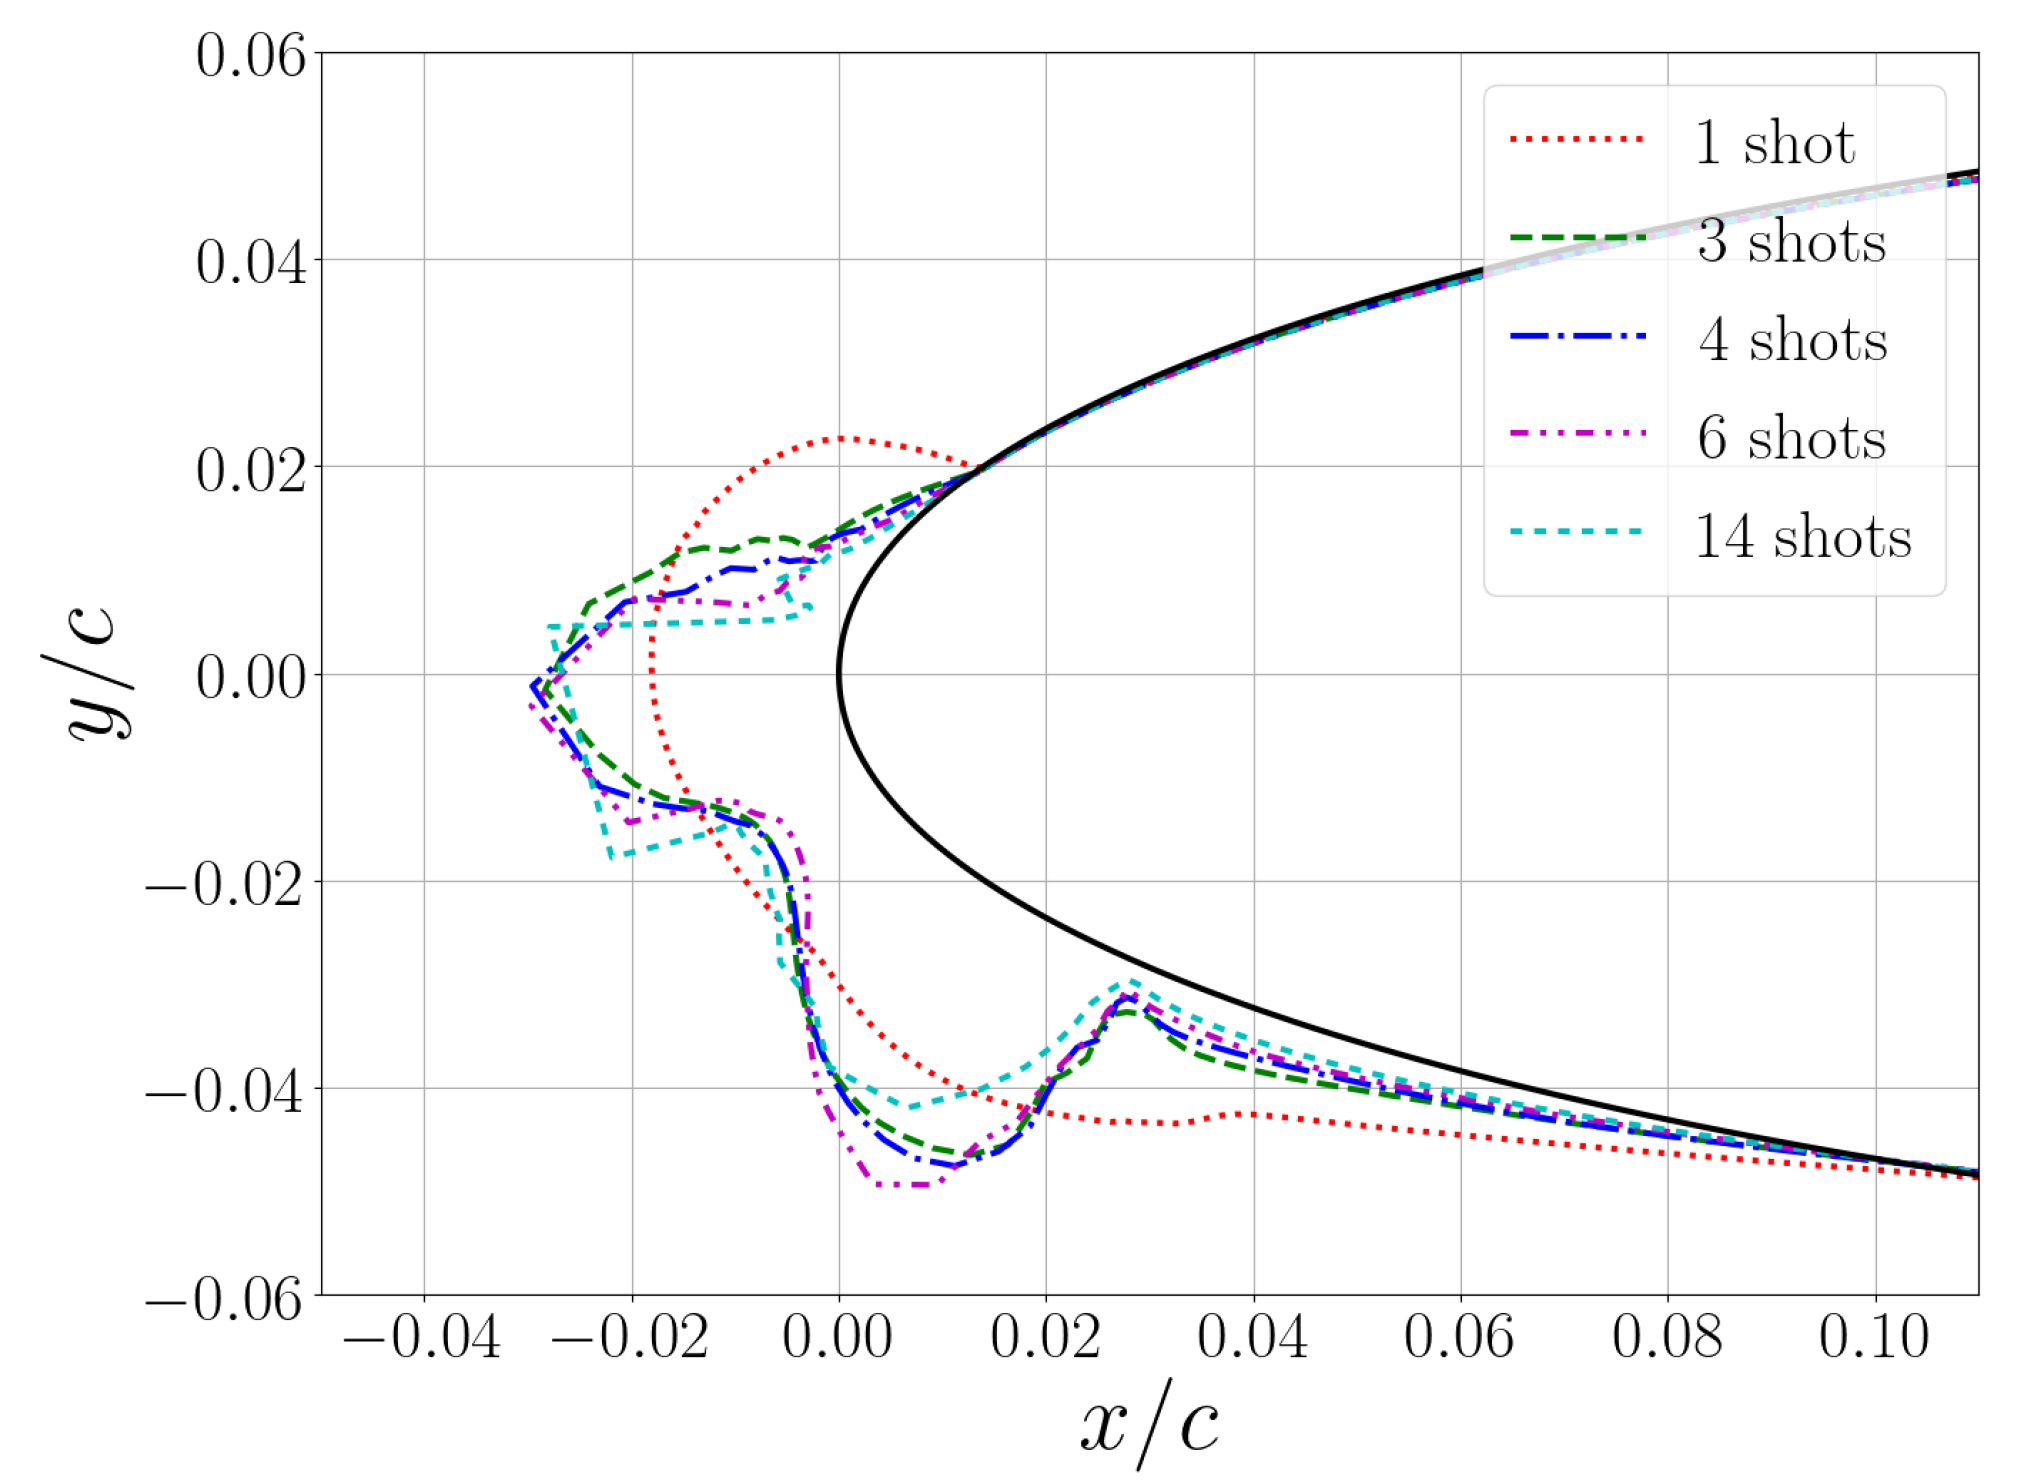
Figure 5.
Dependence of lift and drag coefficients on angle of attack; ice shapes corresponding to . (a) Lift coefficient. (b) Drag coefficient.
Figure 5.
Dependence of lift and drag coefficients on angle of attack; ice shapes corresponding to . (a) Lift coefficient. (b) Drag coefficient.
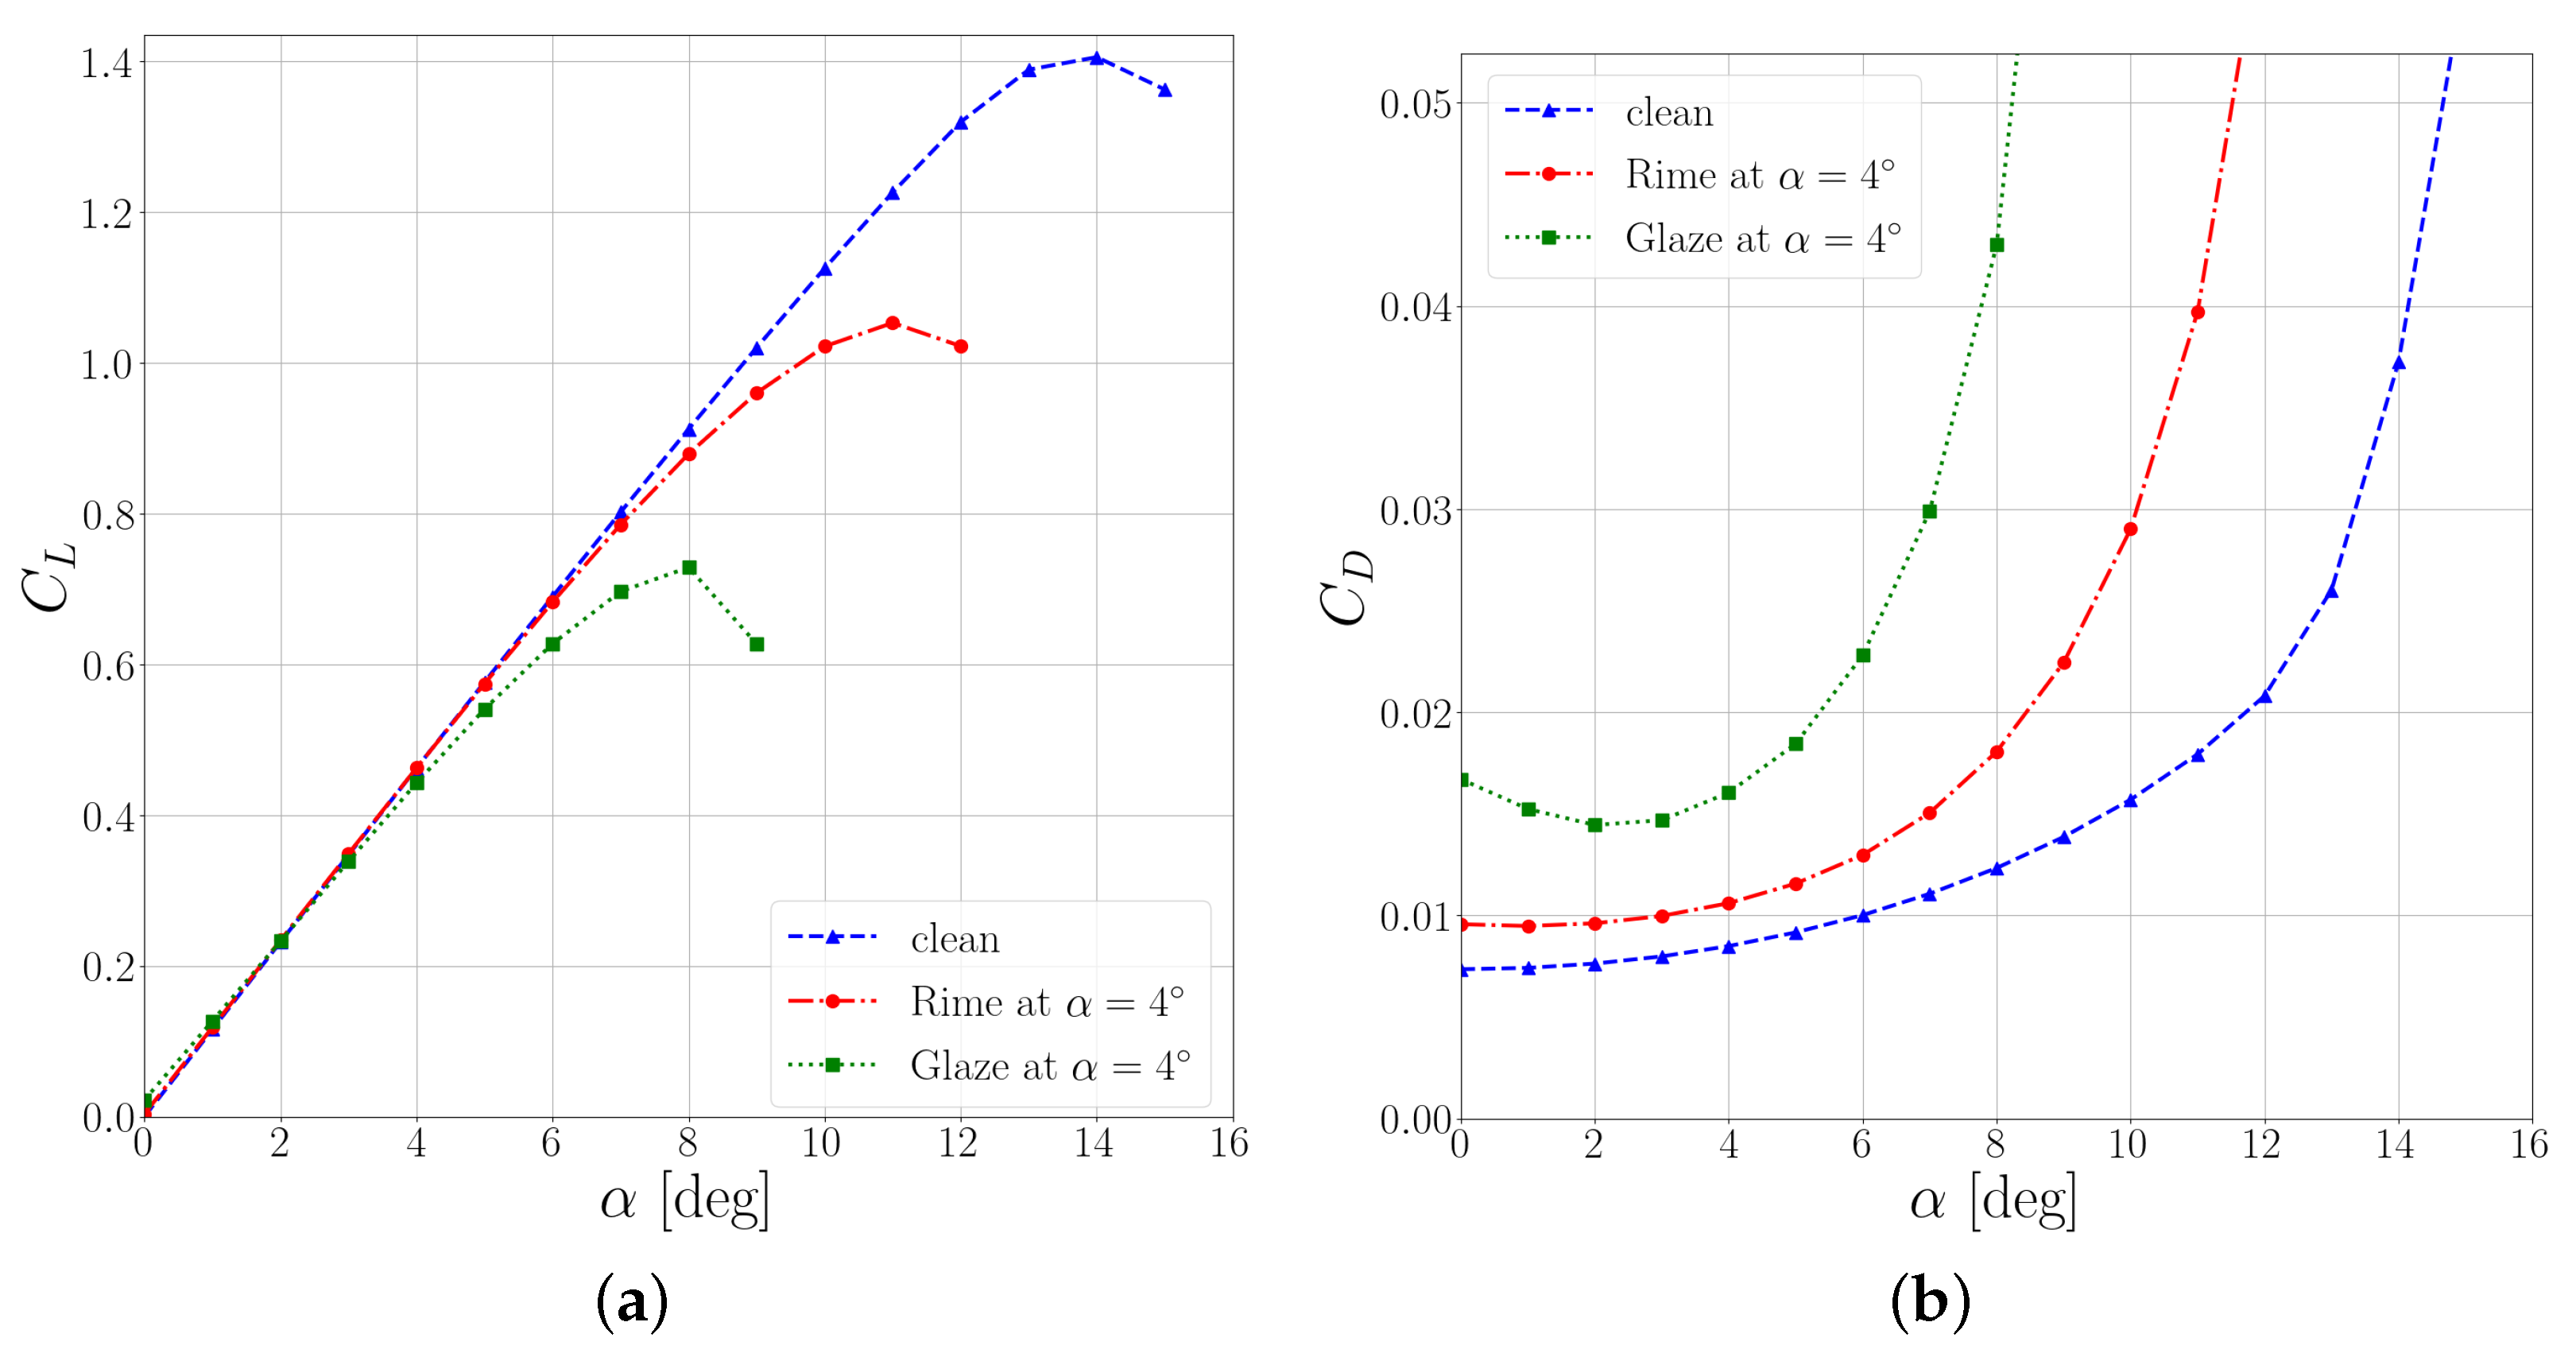
Figure 6.
Continuous maximum icing envelope, adapted from [8].
Figure 6.
Continuous maximum icing envelope, adapted from [8].

Figure 7.
Comparison of the experiments generated using the adapted SF methodology. (a) Normalized design space. (b) Original design space.
Figure 7.
Comparison of the experiments generated using the adapted SF methodology. (a) Normalized design space. (b) Original design space.

Figure 8.
LOOCV error for the lift coefficient at stall over multiple DOE iterations. (a) Space filling. (b) ADOE, iteration 1. (c) ADOE, iteration 1 + no Ice isotherm. (d) ADOE, iteration 2.
Figure 8.
LOOCV error for the lift coefficient at stall over multiple DOE iterations. (a) Space filling. (b) ADOE, iteration 1. (c) ADOE, iteration 1 + no Ice isotherm. (d) ADOE, iteration 2.
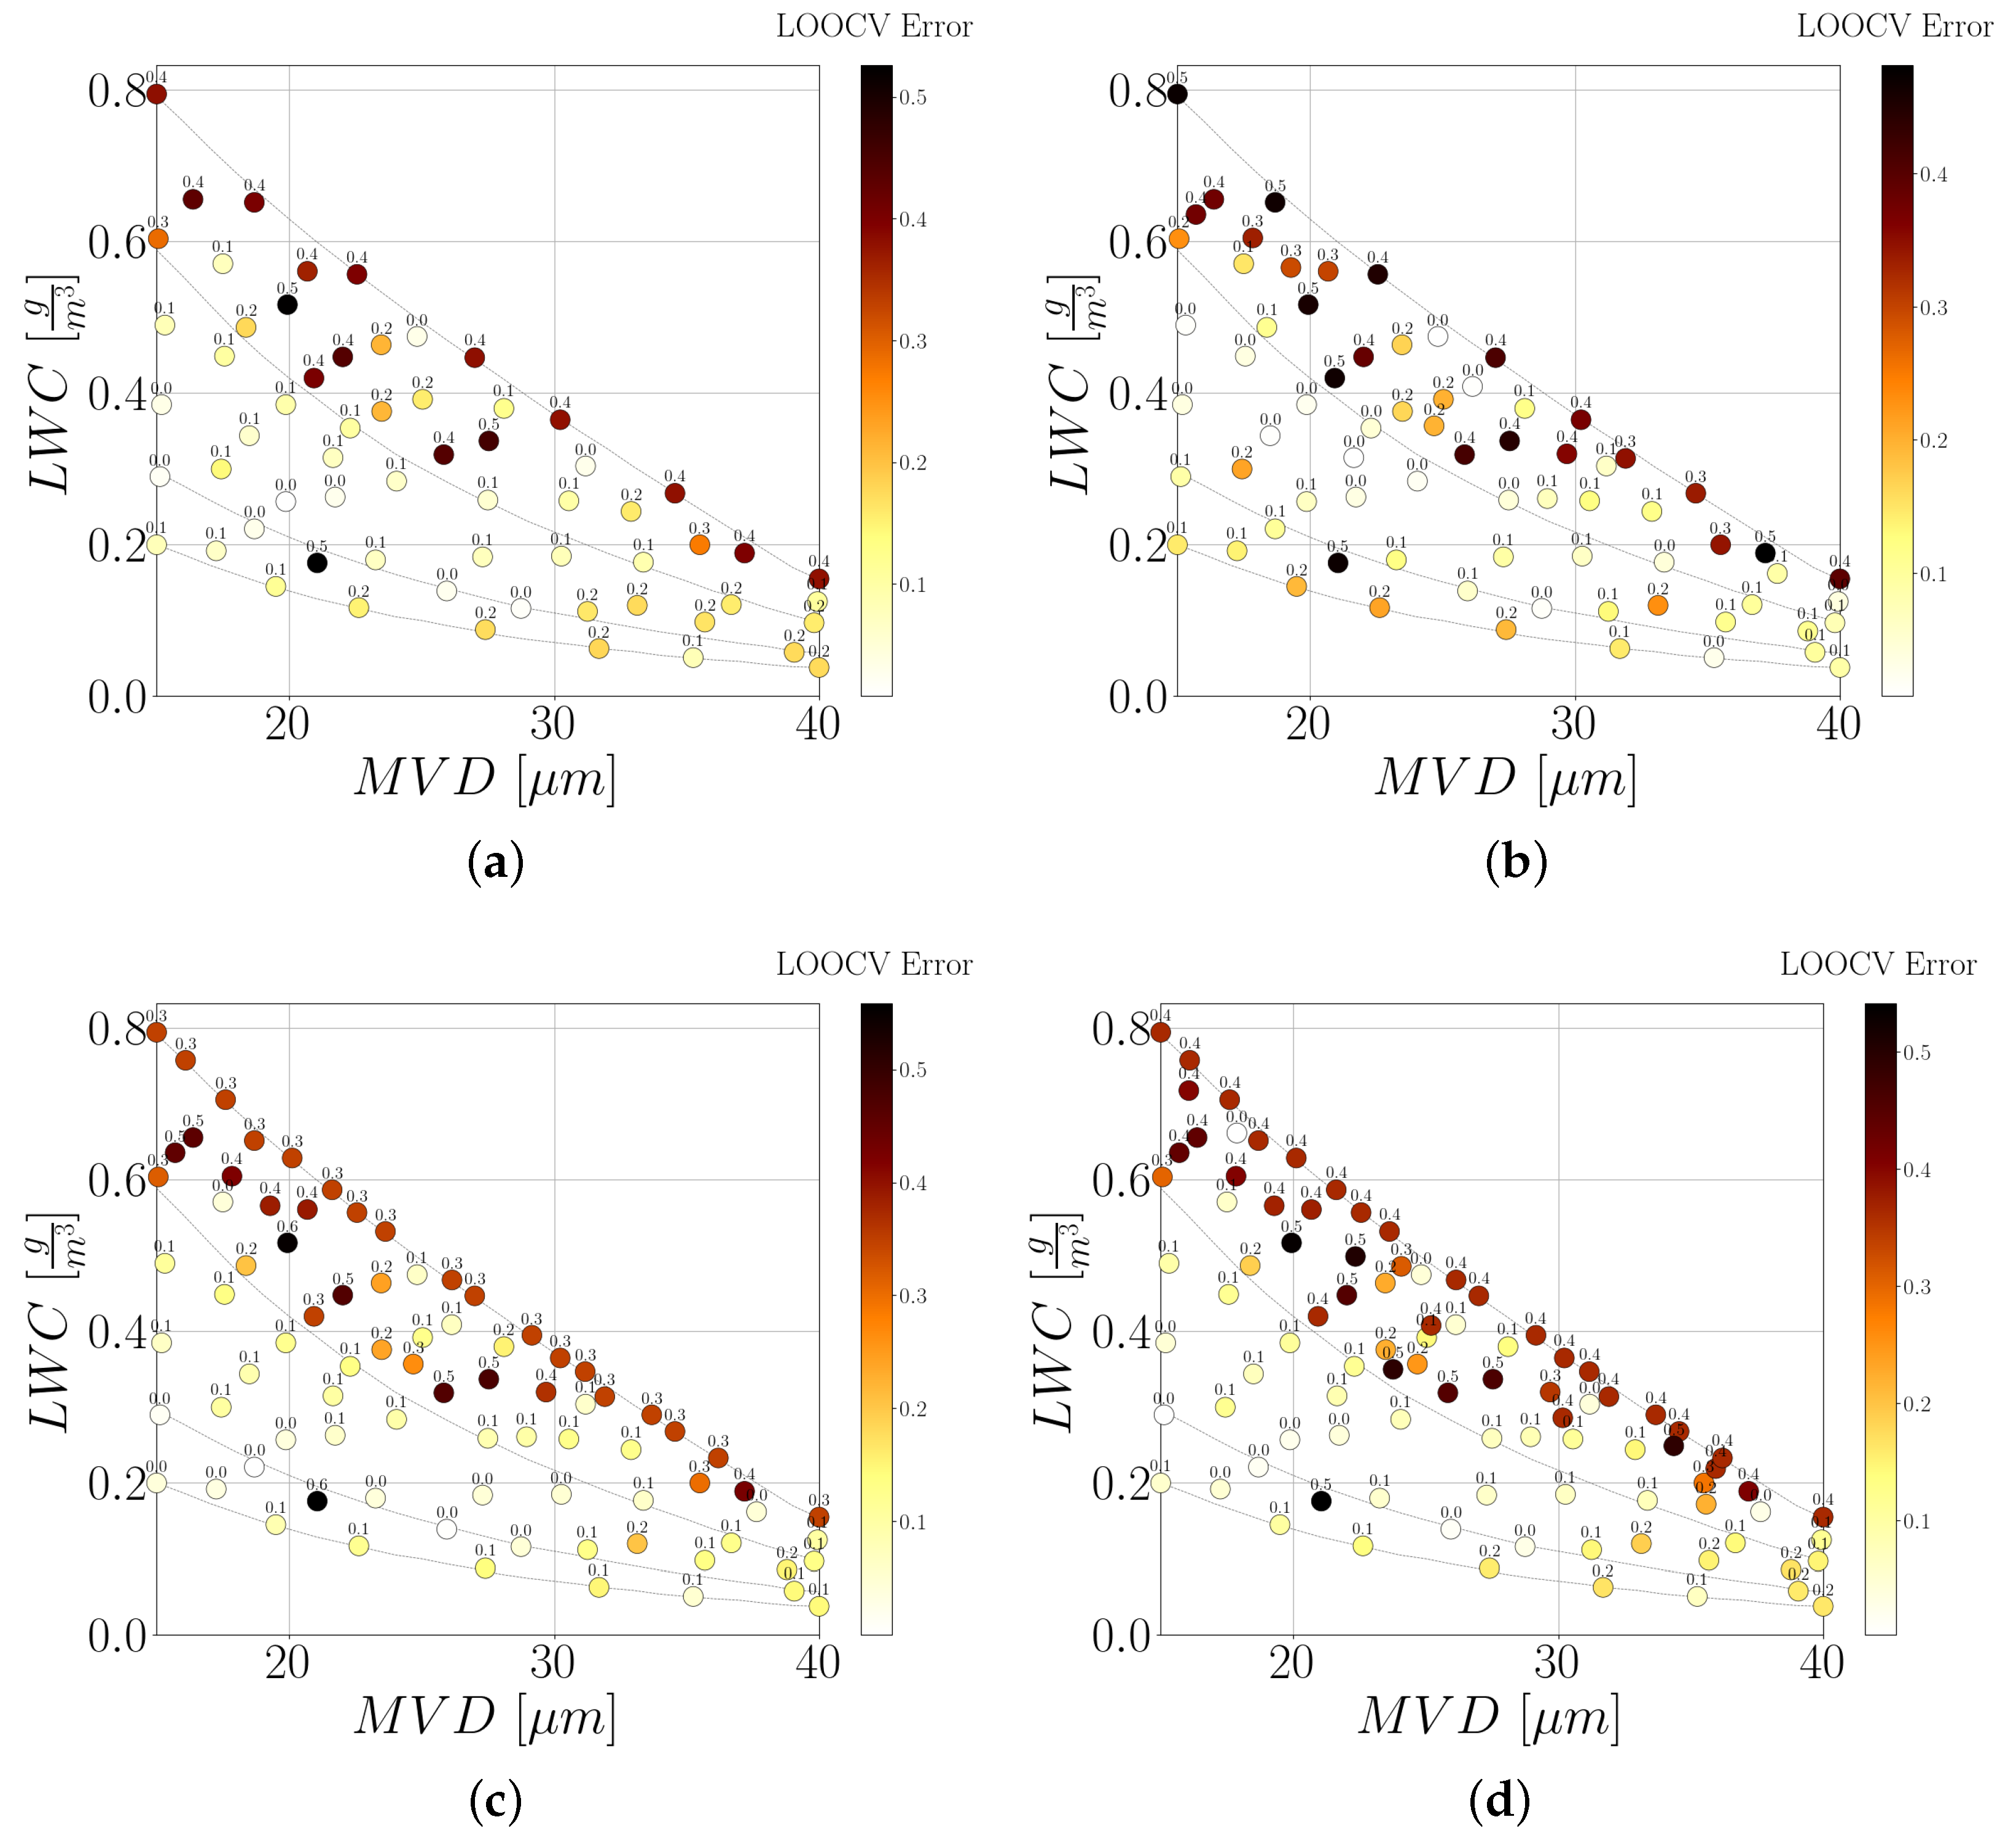
Figure 9.
Exploration of the Appendix-C continuous maximum envelope with different DOEs; total of 94 sample points.
Figure 9.
Exploration of the Appendix-C continuous maximum envelope with different DOEs; total of 94 sample points.
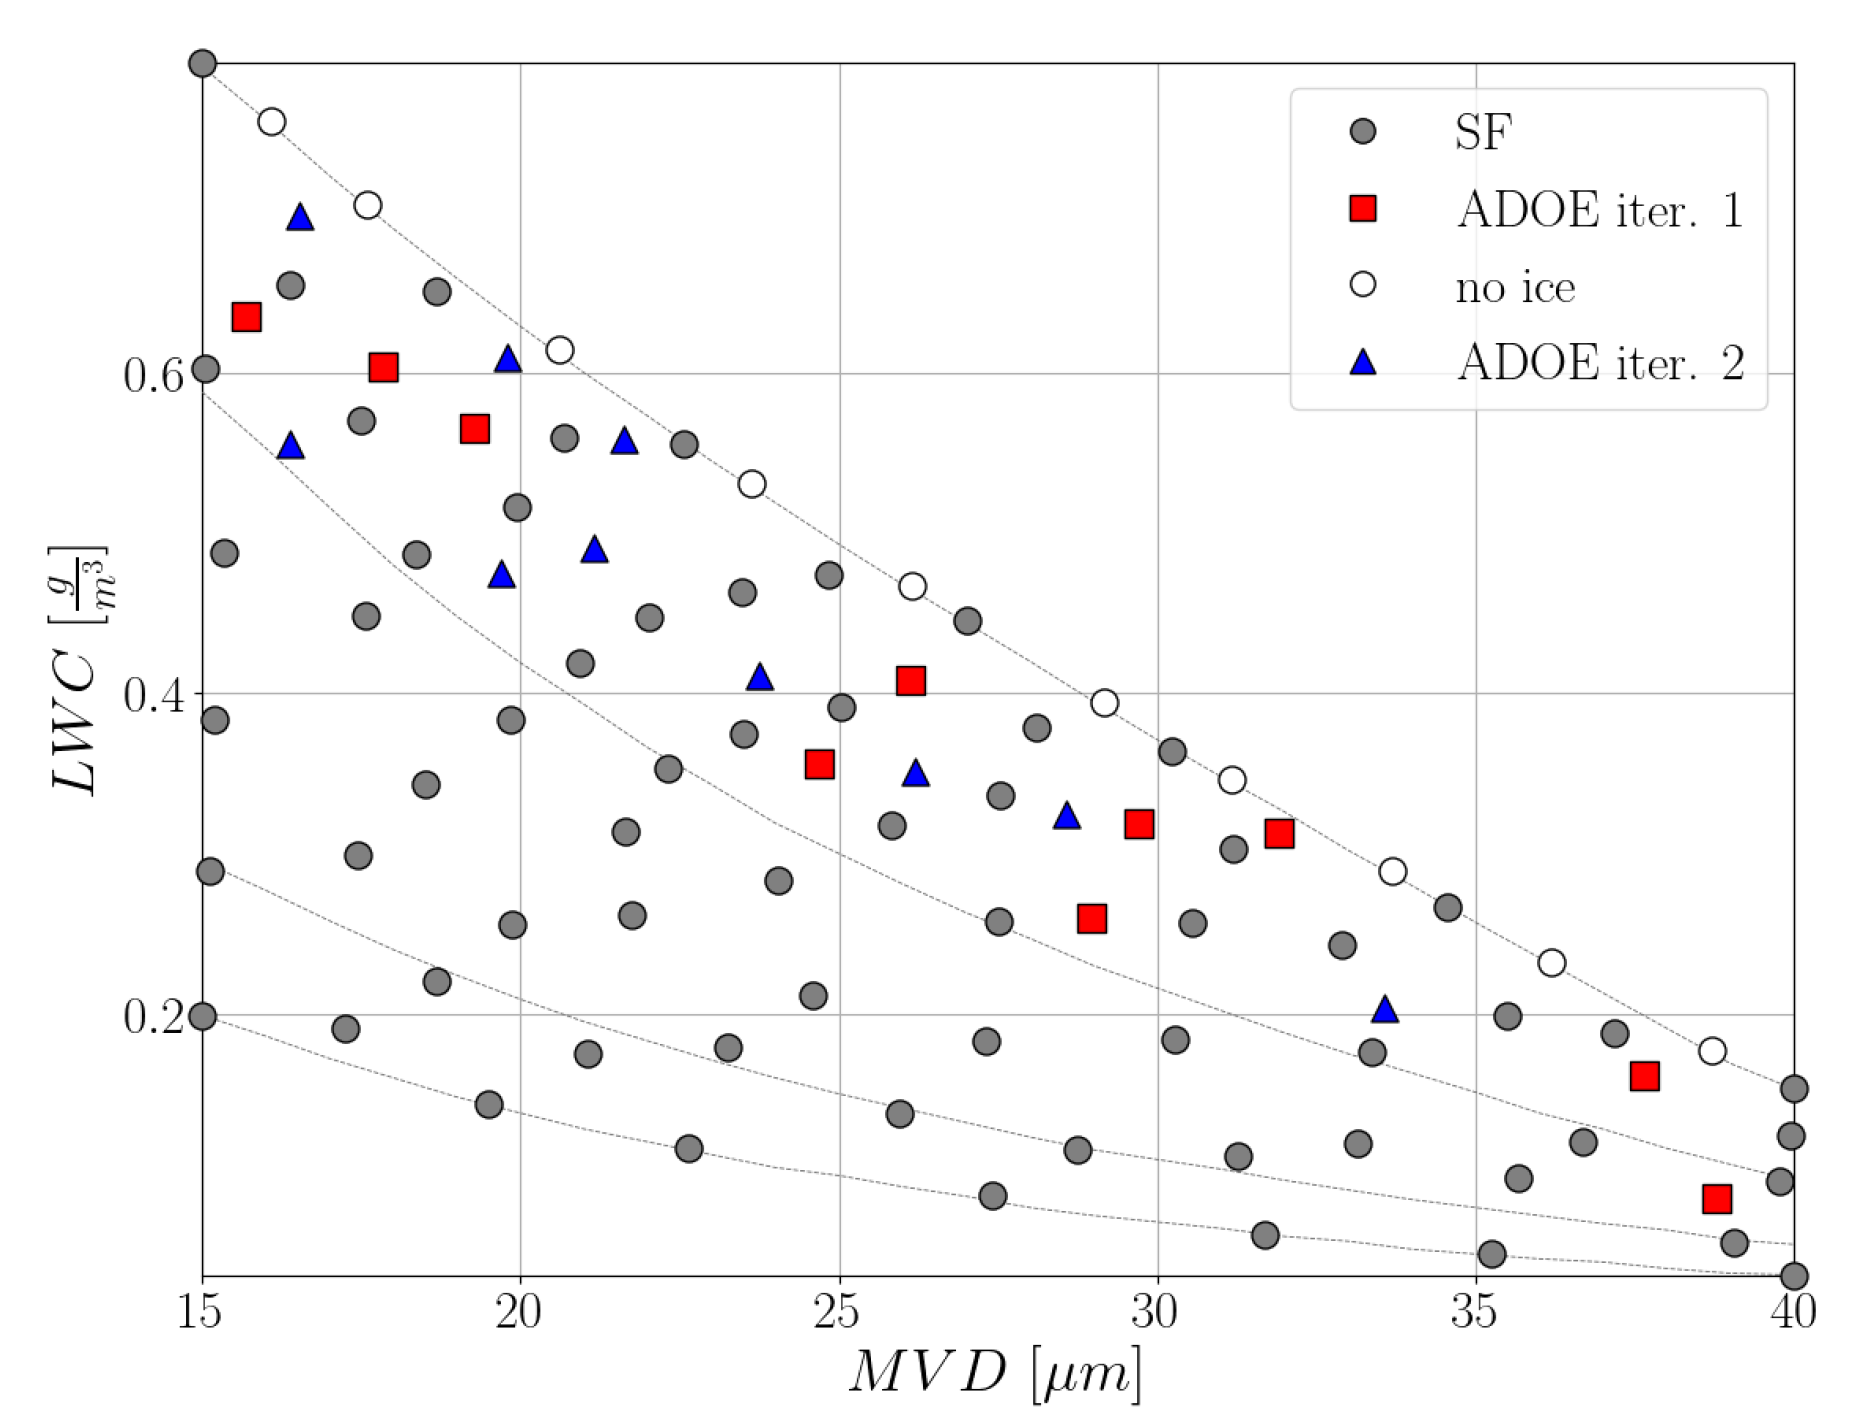
Figure 10.
Ice profiles obtained throughout the entire icing envelope sampled at 94 locations. (a) Combined ice shapes at . (b) Left: ice mass per unit span; right: representative ice profiles extracted from the icing envelope.
Figure 10.
Ice profiles obtained throughout the entire icing envelope sampled at 94 locations. (a) Combined ice shapes at . (b) Left: ice mass per unit span; right: representative ice profiles extracted from the icing envelope.
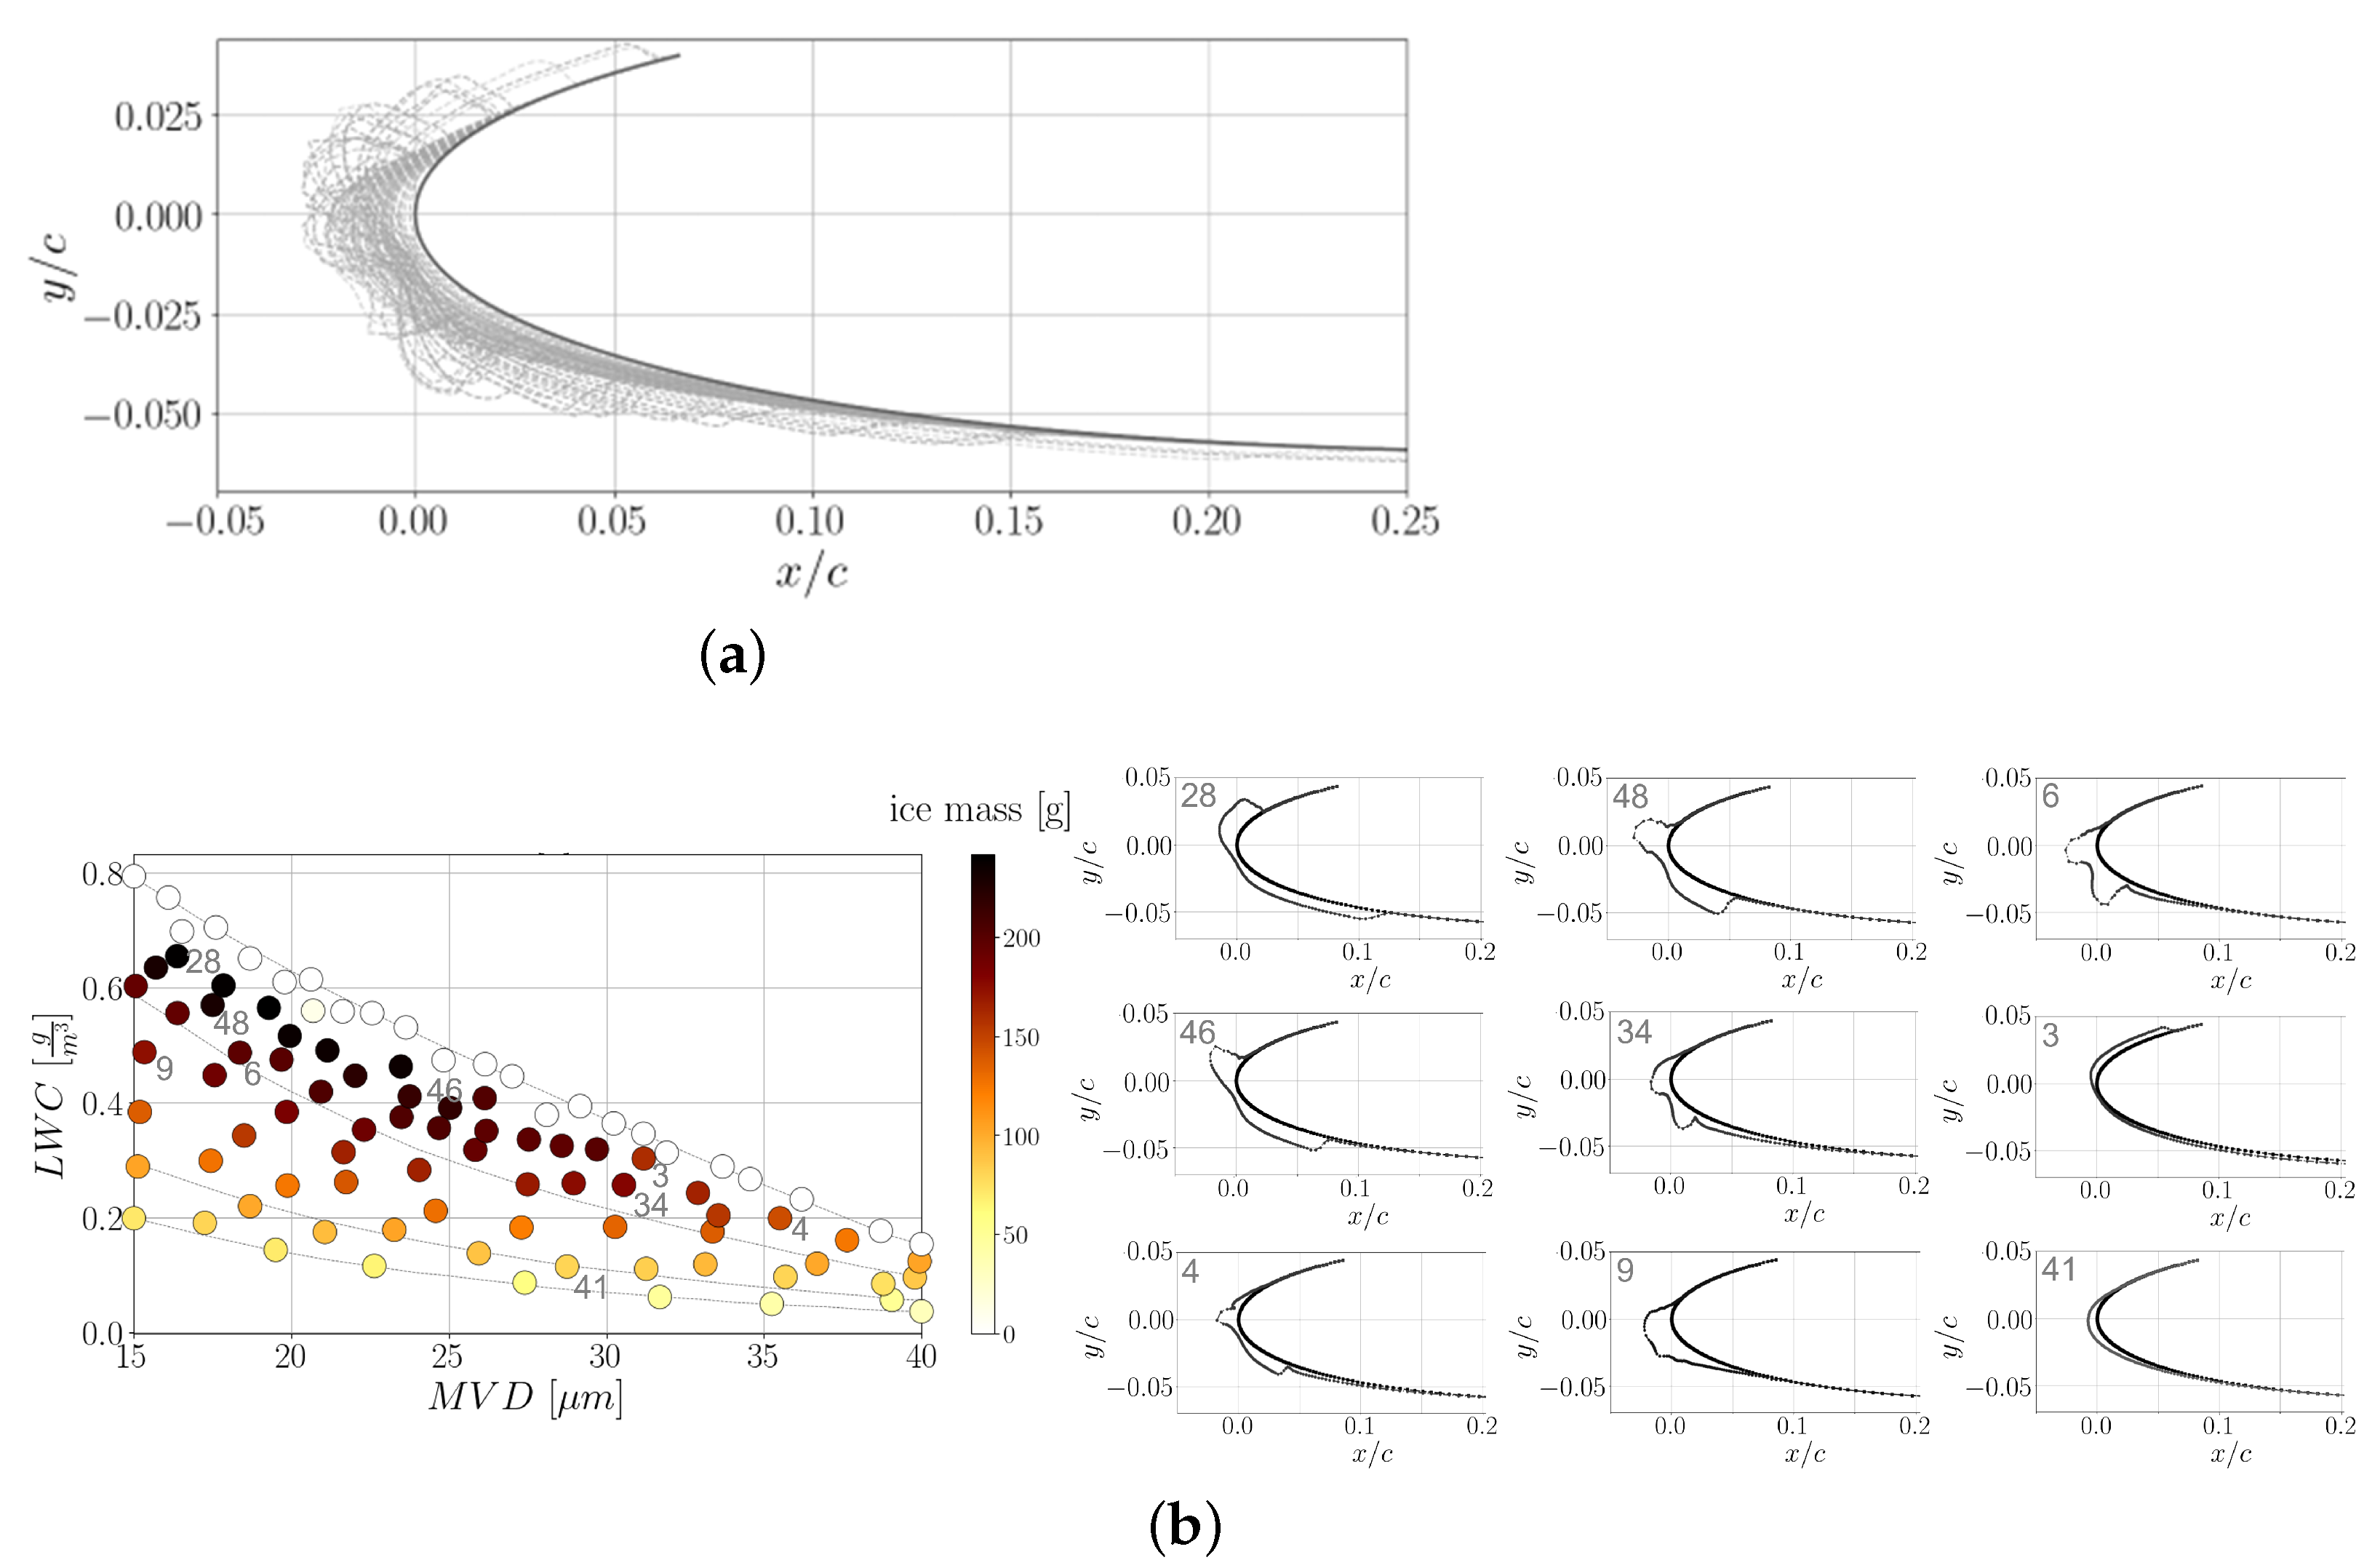
Figure 11.
Aerodynamic data obtained throughout the entire icing envelope sampled at 94 locations. (a) Lift coefficient dependence on angle of attack. Each dot indicates the stall point. (b) Drag coefficient. (c) Lift coefficient at the angle of attack of icing accretion (). (d) Lift coefficient at stall angle of attack.
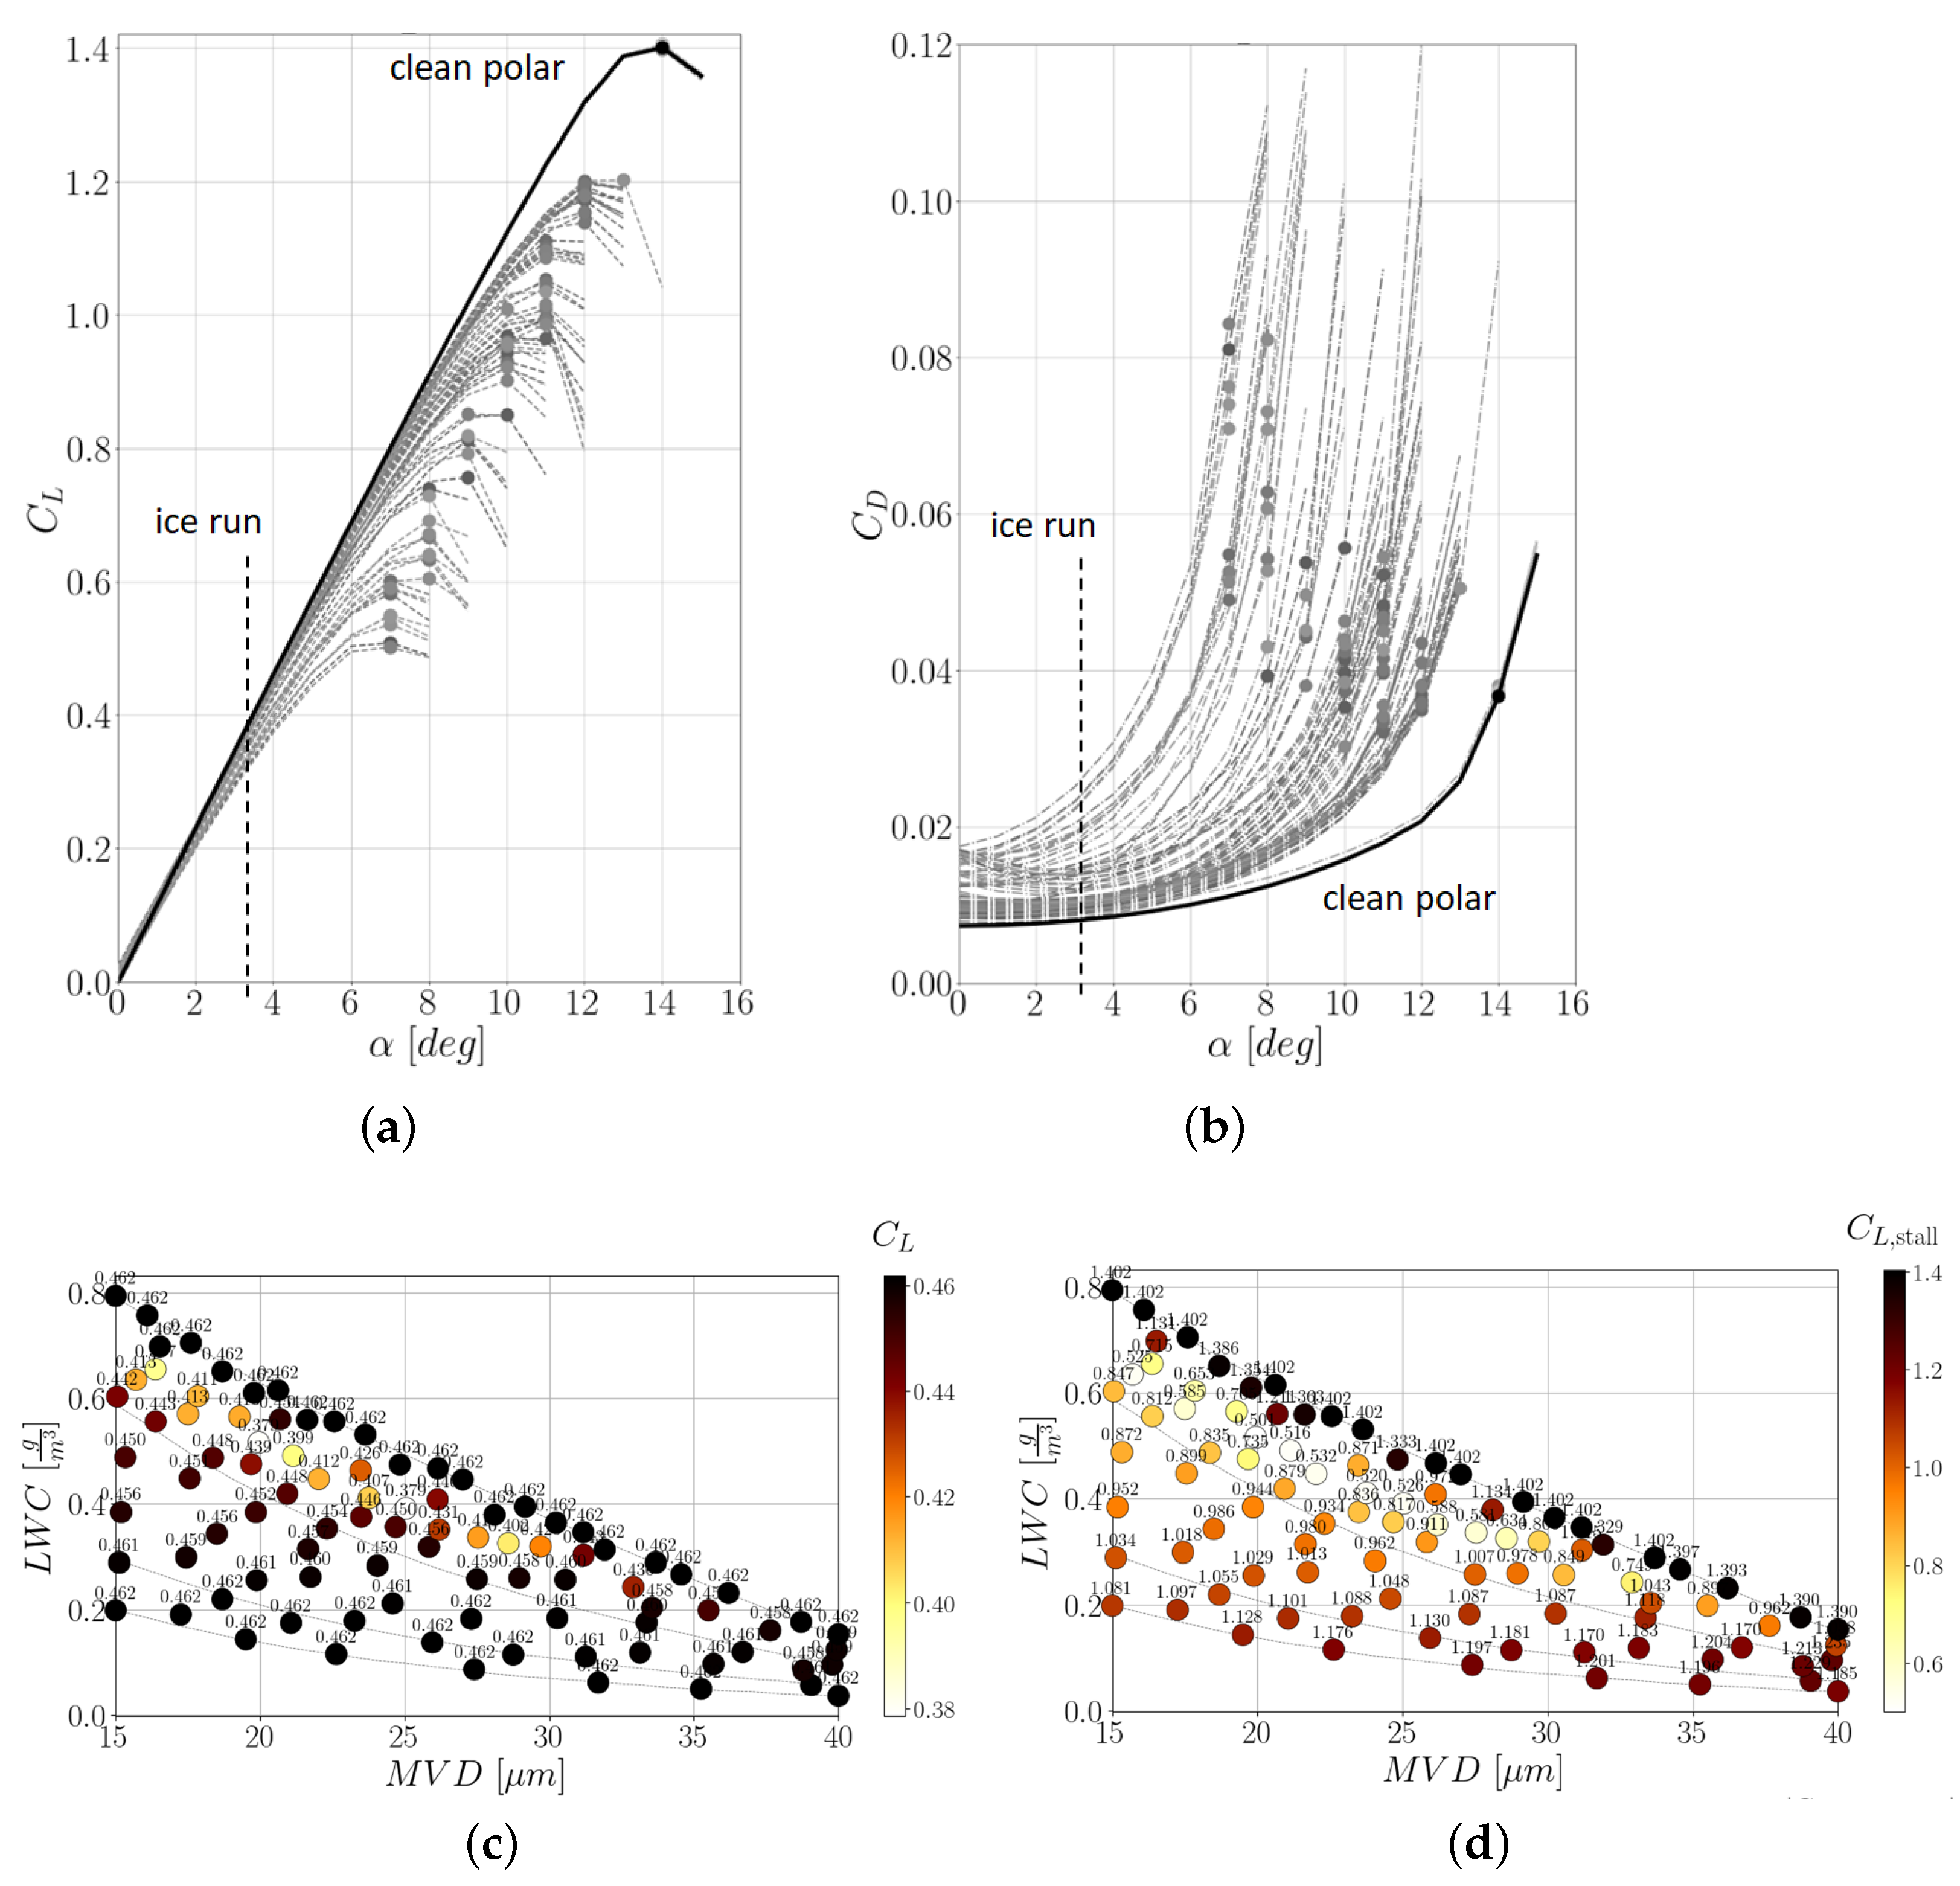
Figure 12.
Transformation of the ice thickness distribution around the aerofoil.
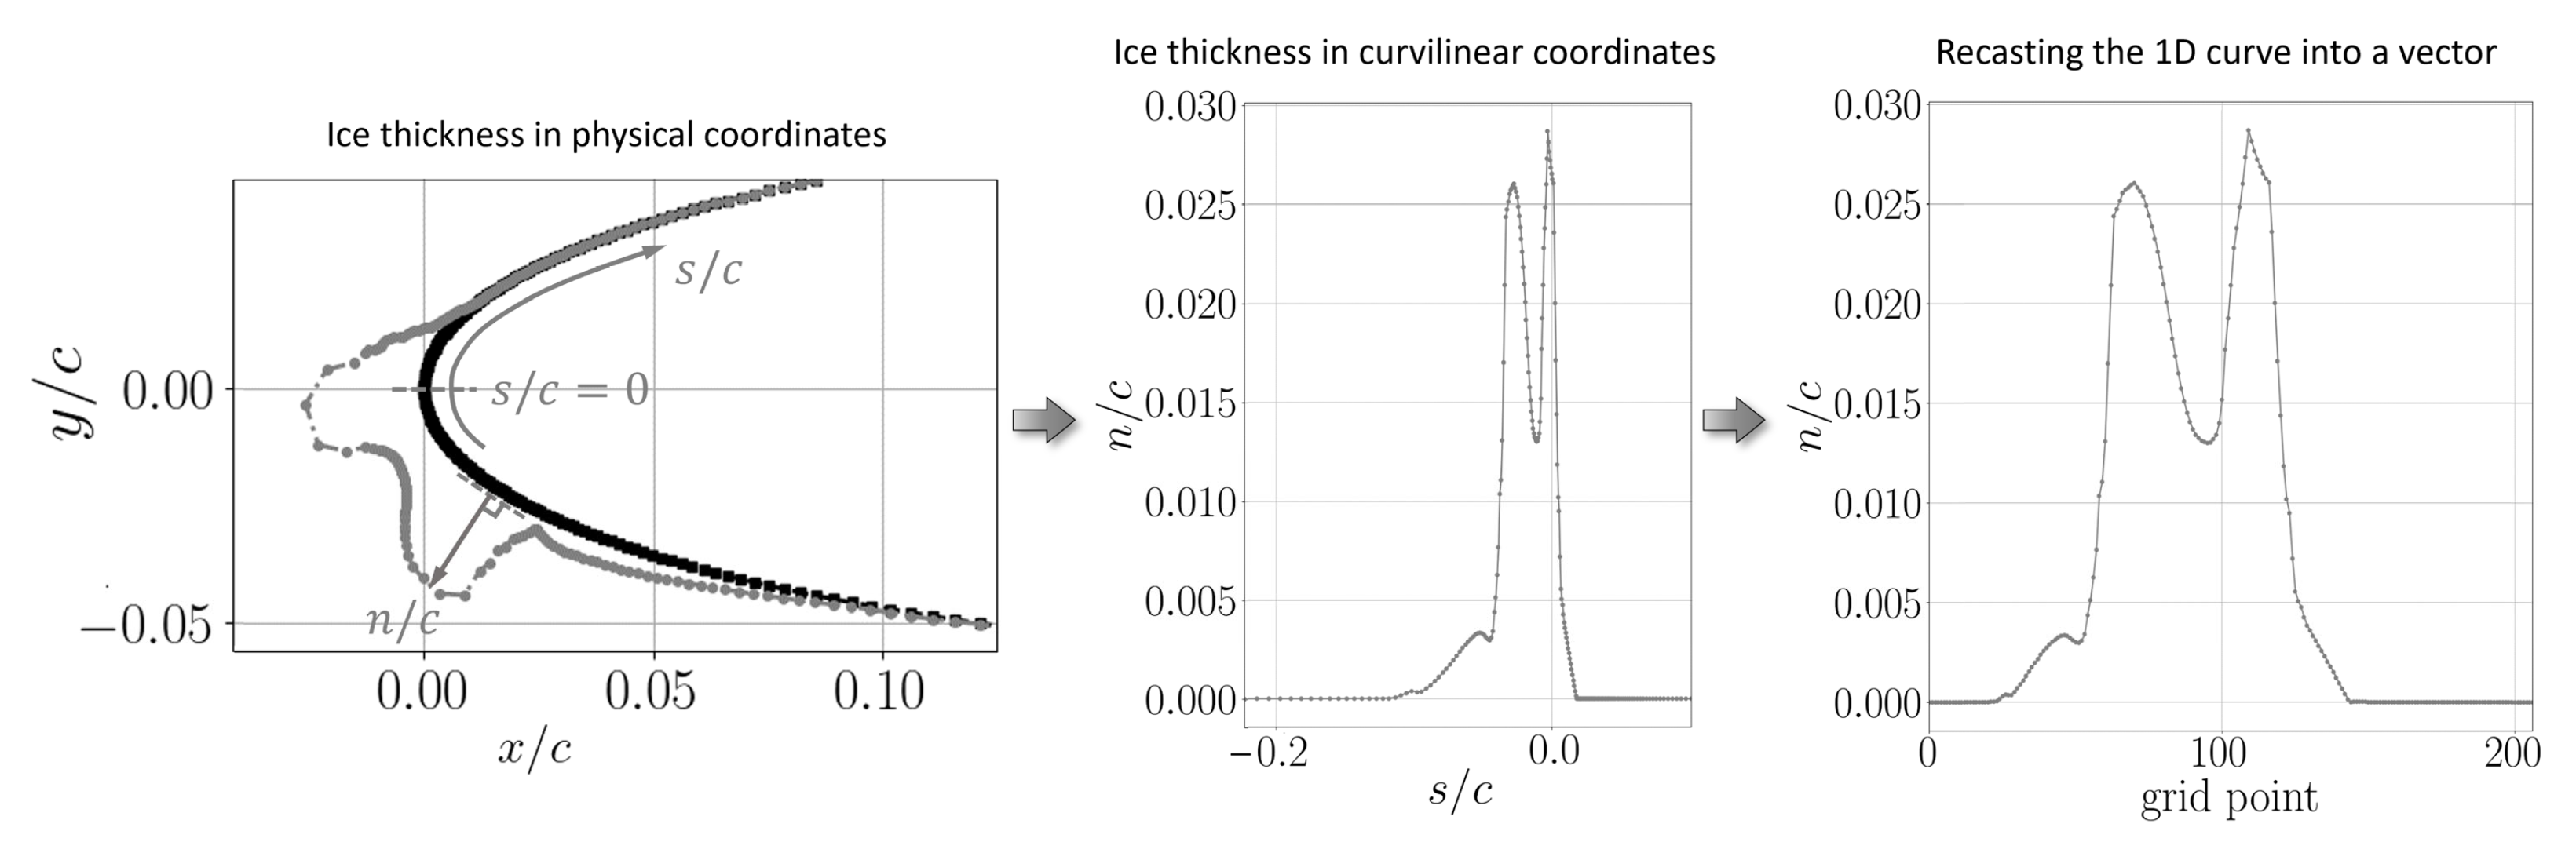
Figure 13.
Workflow for global POD-based model generation and prediction.

Figure 14.
Strategies used for clustering; in (a), k-means clustering did not provide any useful classification; in (b), the classification used in this work.
Figure 14.
Strategies used for clustering; in (a), k-means clustering did not provide any useful classification; in (b), the classification used in this work.
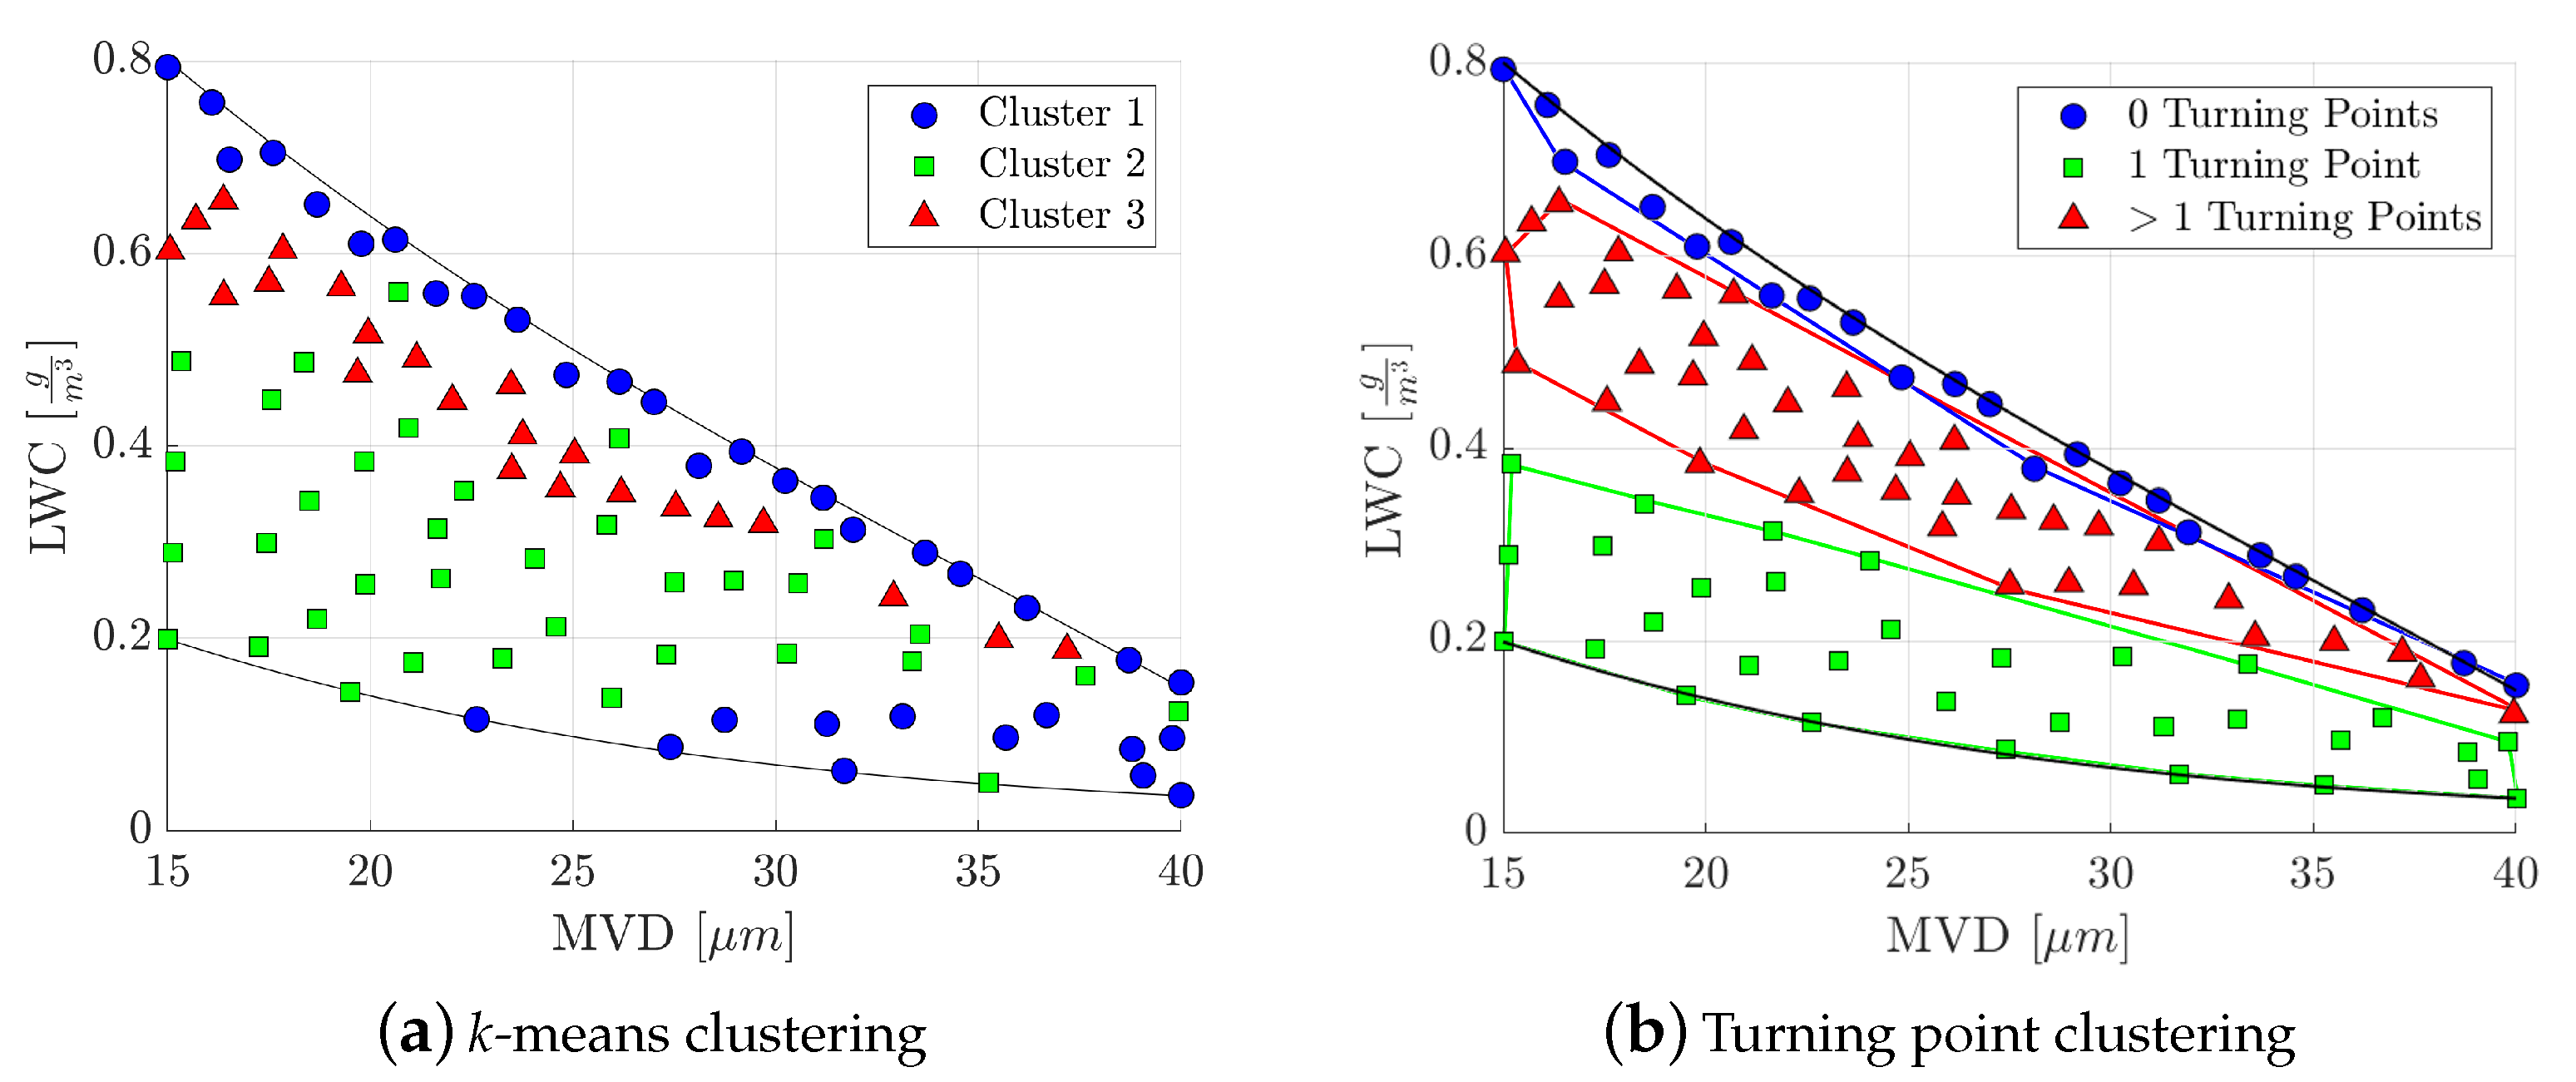
Figure 15.
Schematic of the convolutional-auto-encoder (NN+Conv-AE) model for ice shape prediction based on a two-step procedure; for the final layer sizes, refer to Supplementary Material. (a) Module 1: Conv-AE; reconstruction network of the ice shapes through a reduced latent space; the description of the layer operations is illustrated in Figure 16. (b) Module 2: DNN-Dec; for new predictions, the DNN takes as inputs the ambient conditions and is connected to the decoder trained in Module 1.

Figure 16.
Schematic of the essential operations used in the convolutional auto-encoder, represented as Conv1D, AvgPool1D and TransConv1D in Figure 15. (a) 1D convolution followed by a 1D average pooling. Layer used in the Conv-AE encoder. (b) 1D transposed convolution operation. Layer used in the Conv-AE decoder.
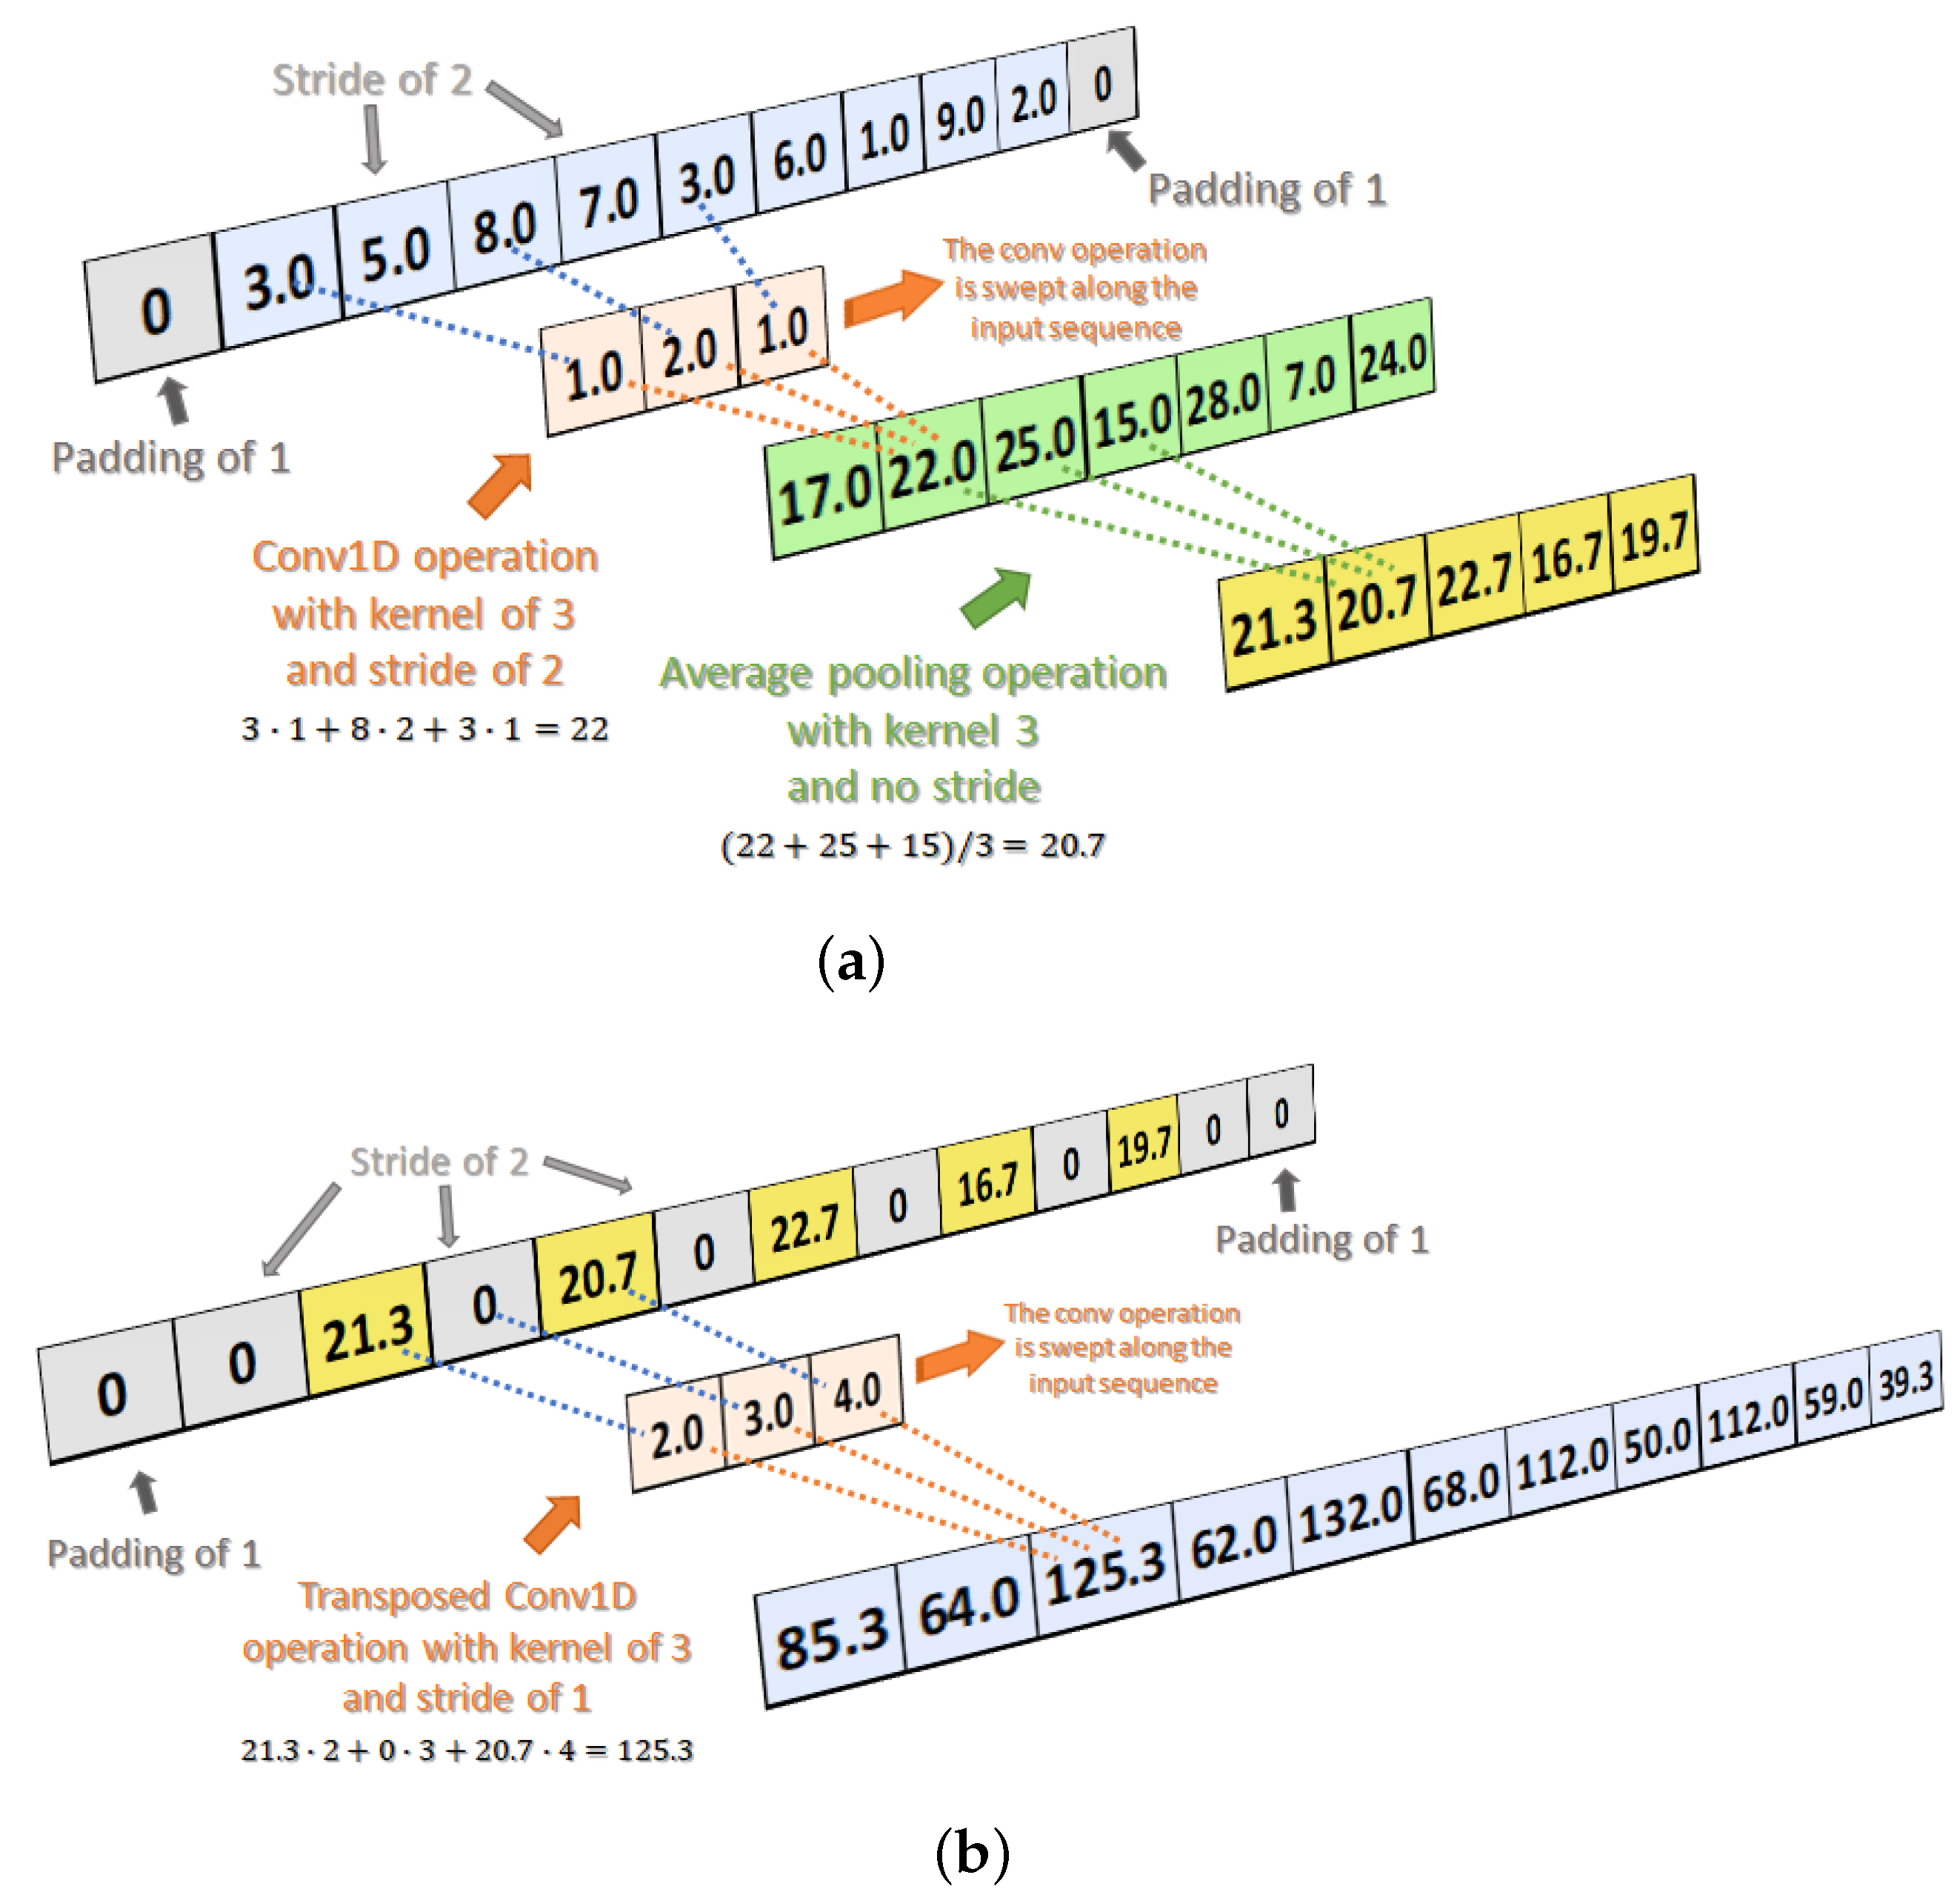
Figure 17.
Schematic of the dense neural network (DNN) adopted for the prediction of the aerodynamic performance degradation given as inputs to the ambient conditions from the Appendix C. For the final layer sizes, refer to the Supplementary Material.
Figure 17.
Schematic of the dense neural network (DNN) adopted for the prediction of the aerodynamic performance degradation given as inputs to the ambient conditions from the Appendix C. For the final layer sizes, refer to the Supplementary Material.
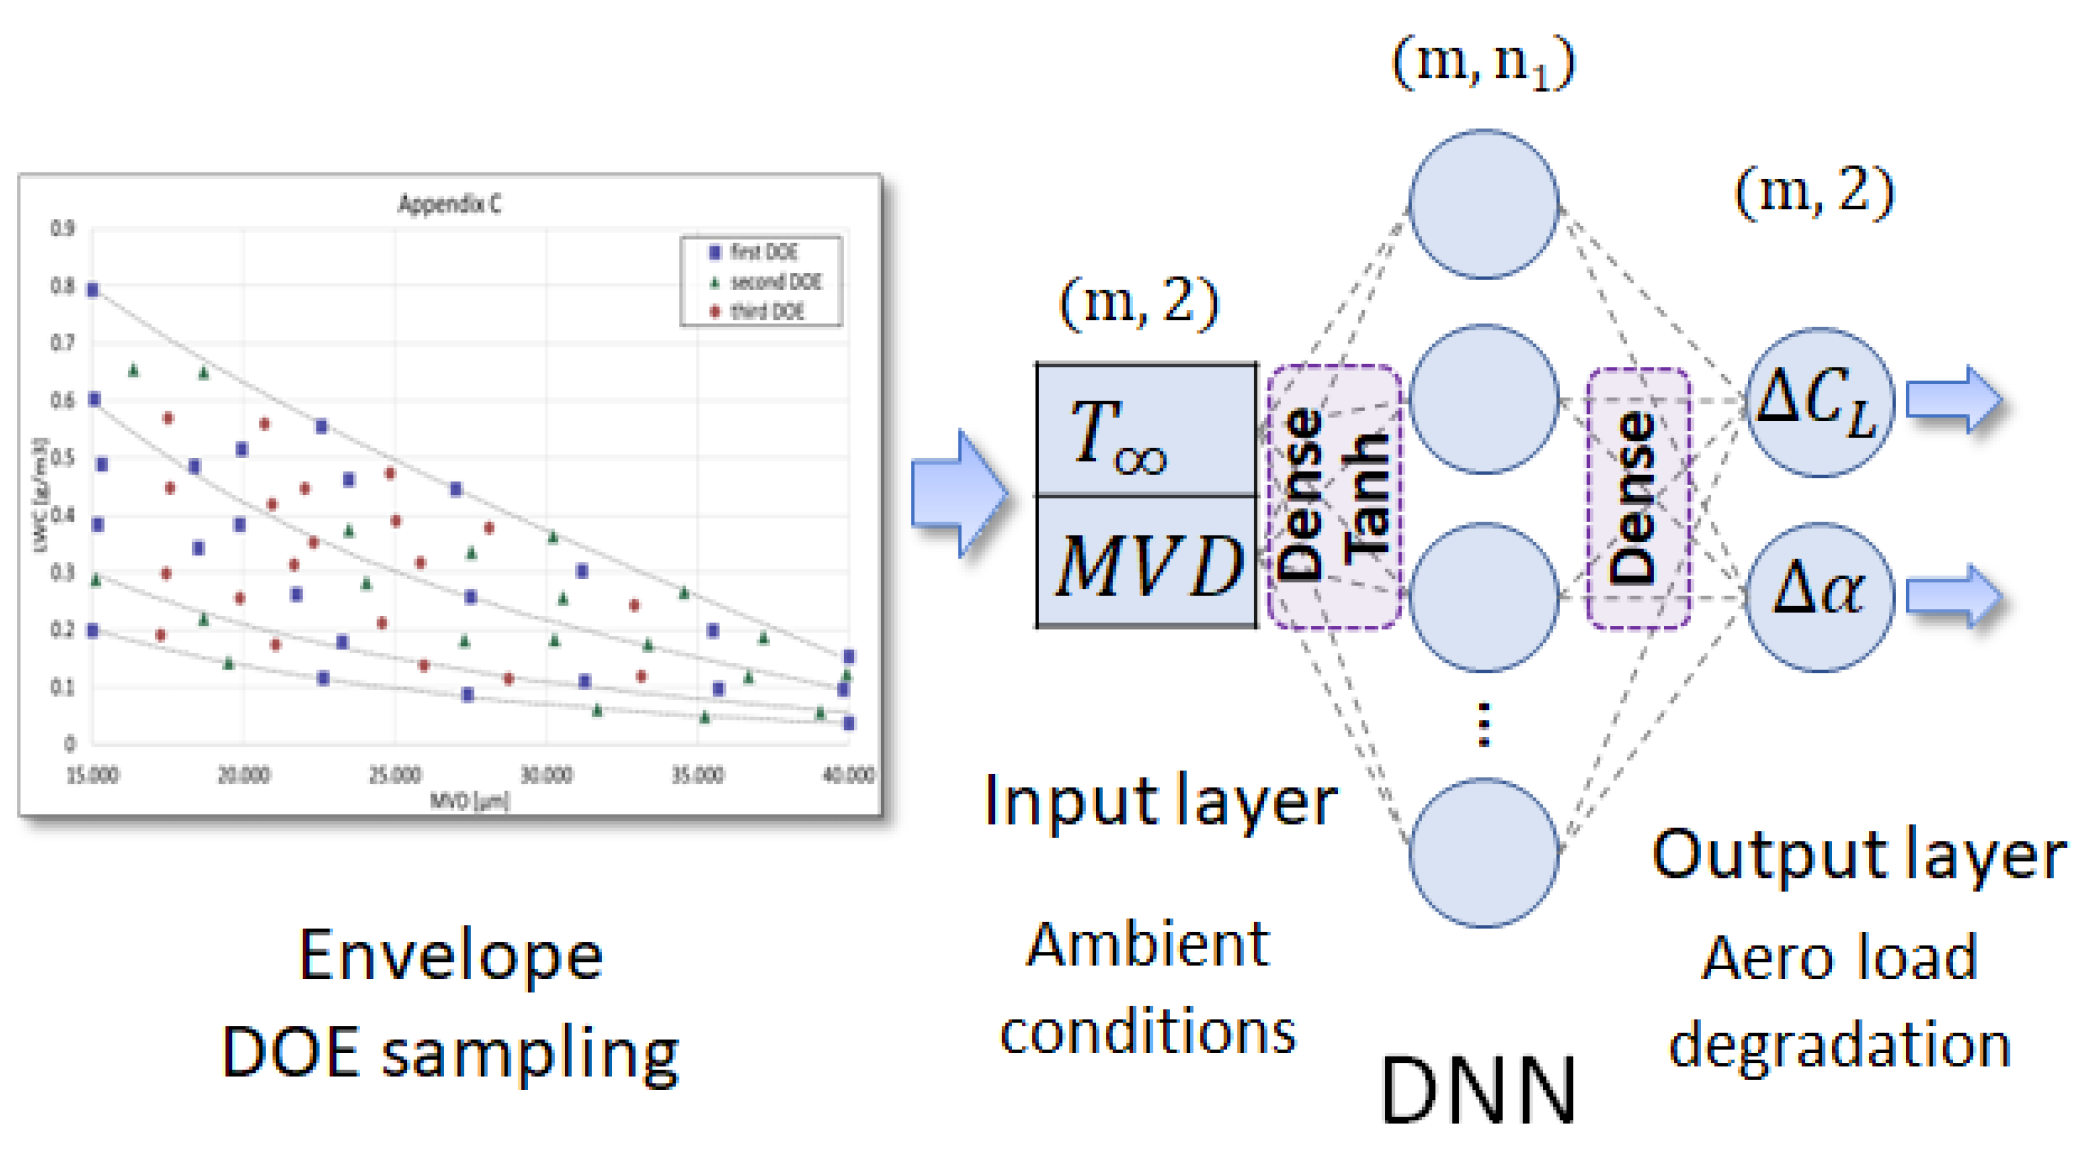
Figure 18.
Metric based on enclosed area to calculate the error in ice profile between high-fidelity simulation and prediction models.
Figure 18.
Metric based on enclosed area to calculate the error in ice profile between high-fidelity simulation and prediction models.
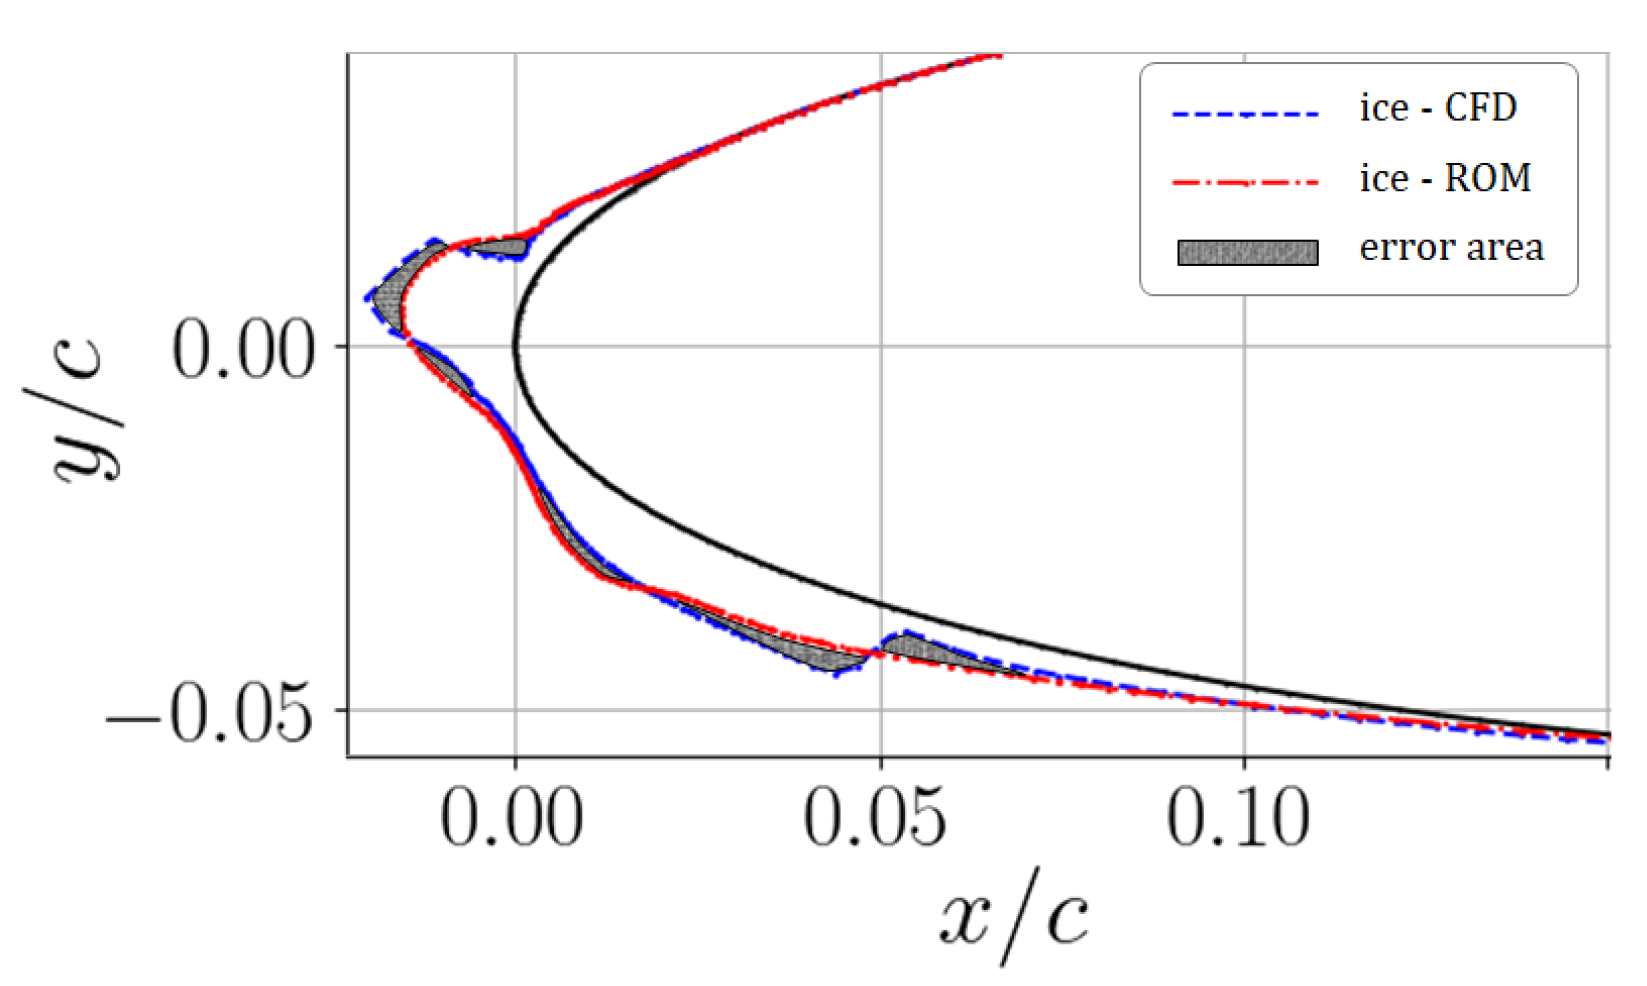
Figure 19.
Ice shape prediction for the various ROMs after the final DOE iteration. Symbols on the right panels show the evolution of the maximum mass with the three DOE iterations. (a) LOOCV error, global POD. (b) Response surface, global POD. (c) LOOCV error, local POD. (d) Response surface, local POD. (e) LOOCV error, NN+Conv-AE. (f) Response surface, NN+Conv-AE.
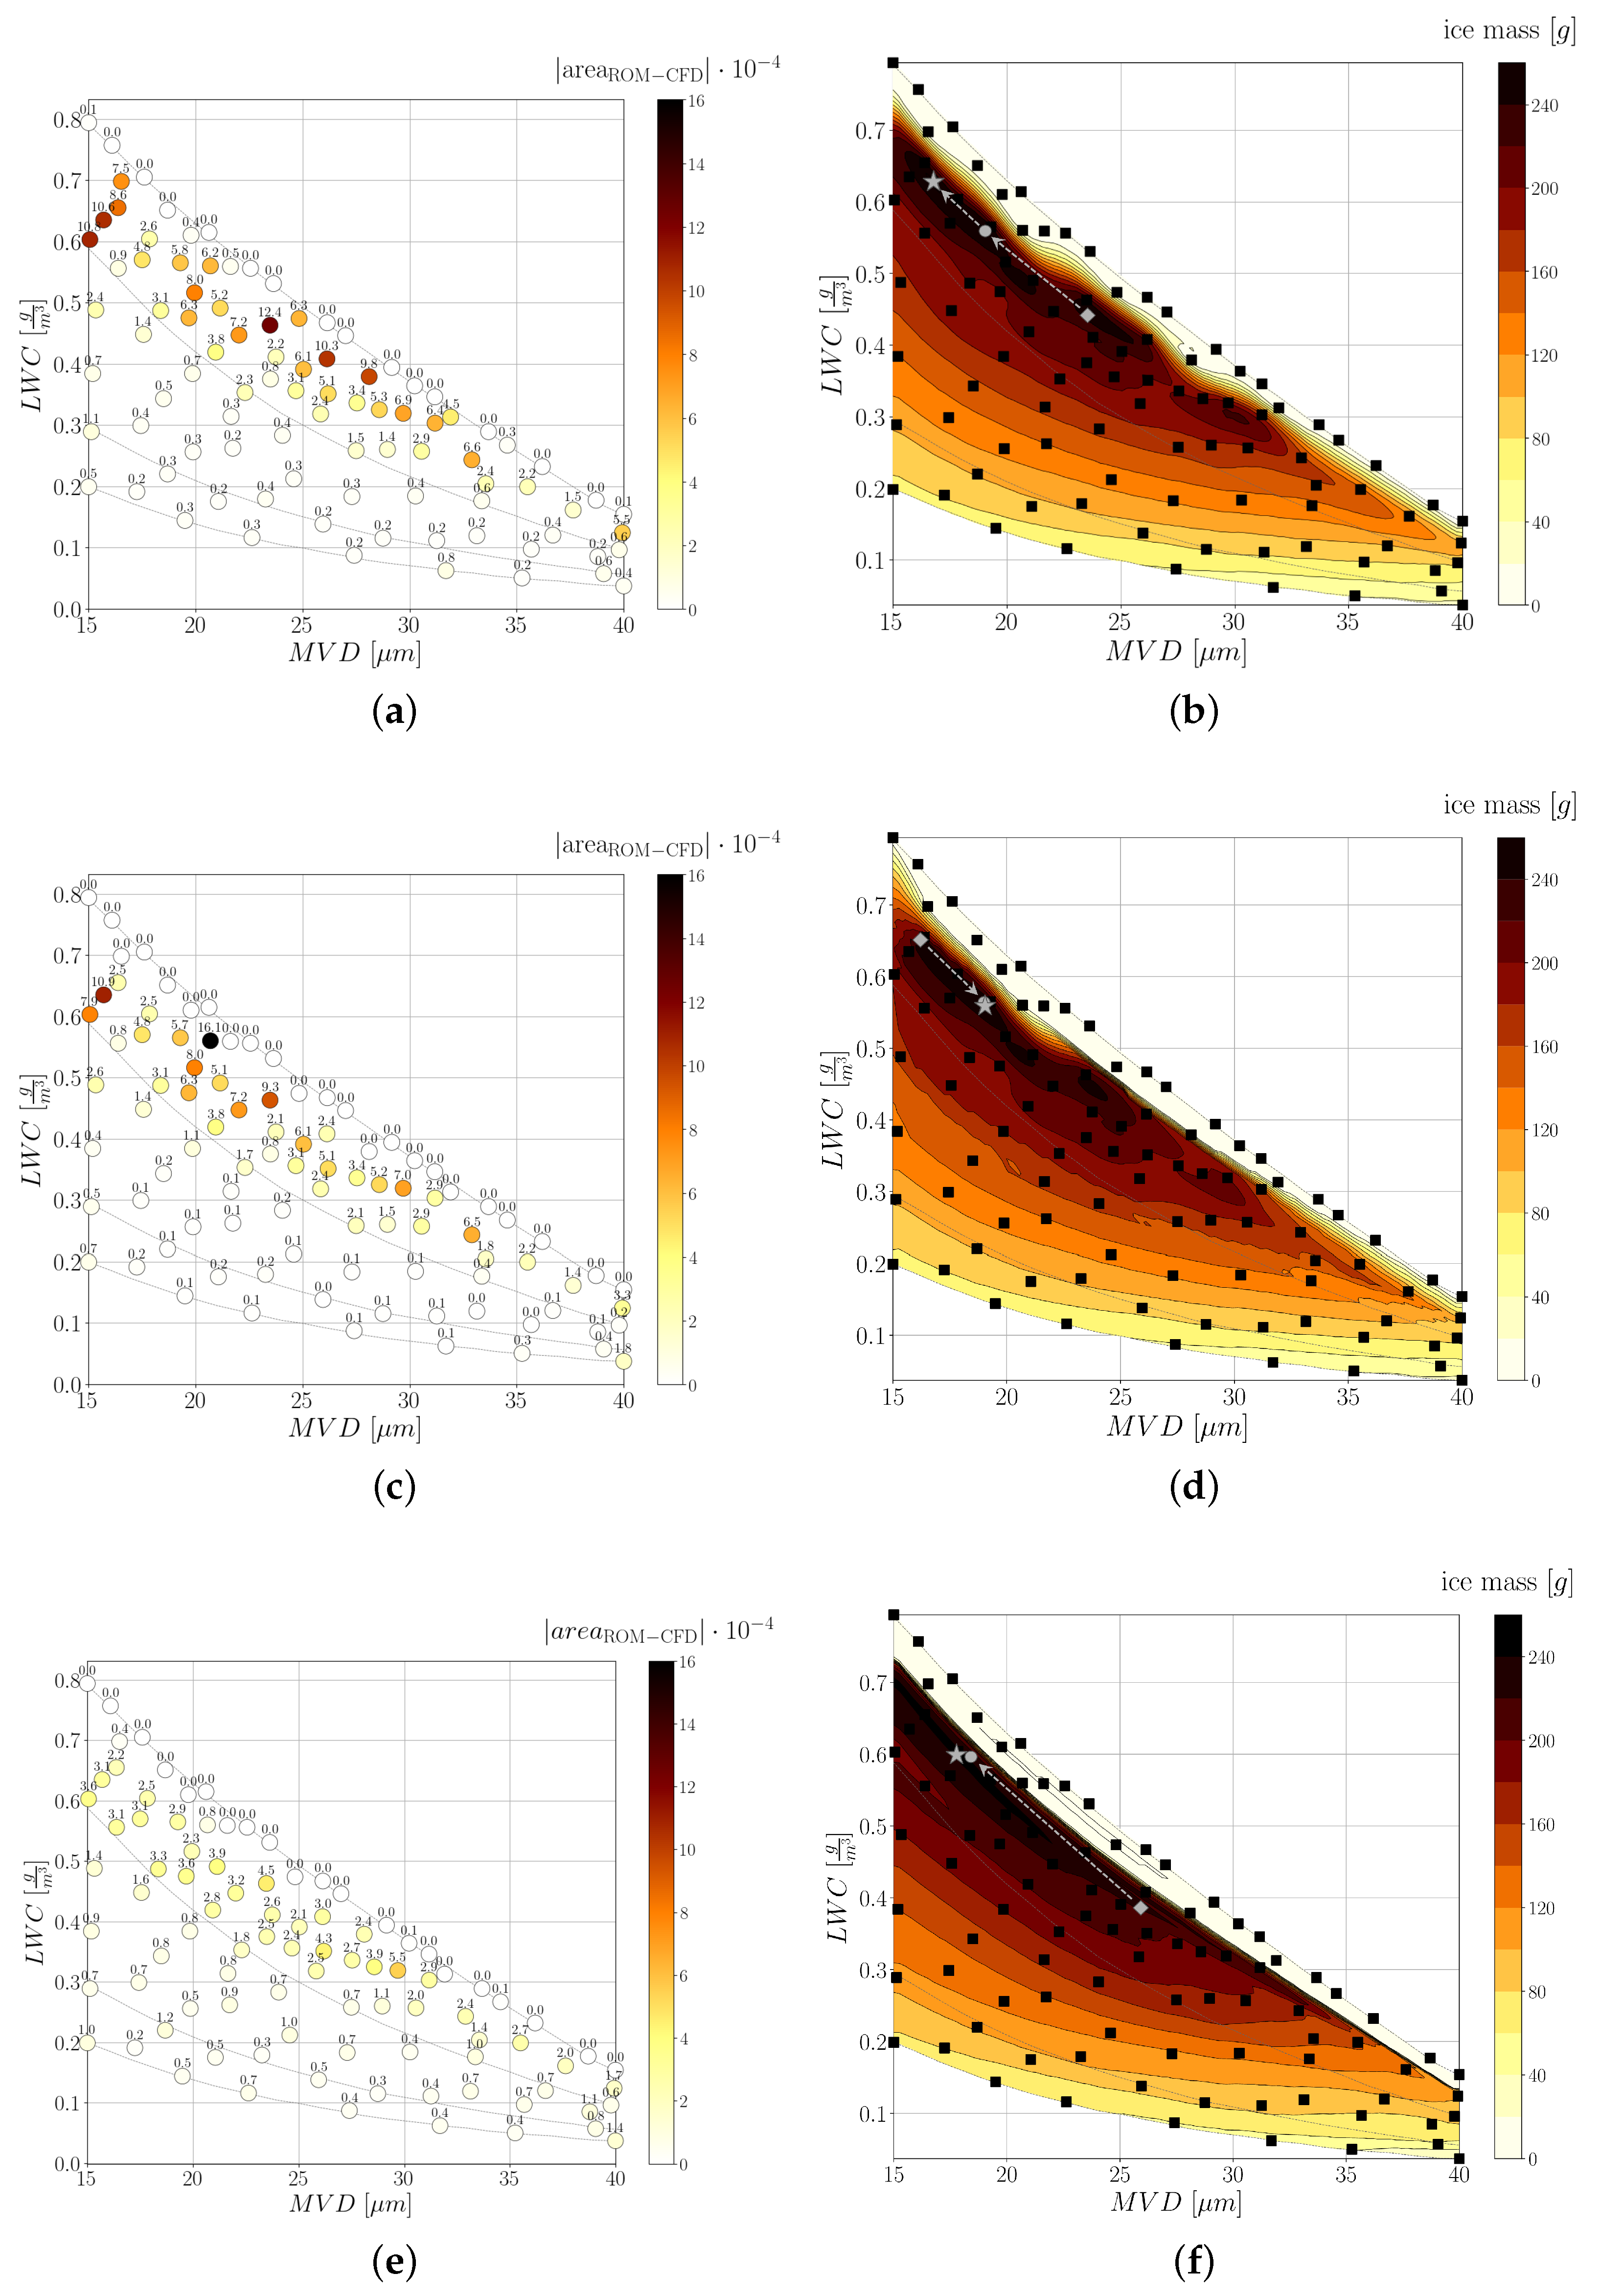
Figure 22.
Maximum lift coefficient, , from low-dimensional models. (a) LOOCV error, global POD. (b) Response surface, global POD. (c) LOOCV error, local POD. (d) Response surface, local POD. (e) LOOCV error, DNN. (f) Response surface, DNN.
Figure 22.
Maximum lift coefficient, , from low-dimensional models. (a) LOOCV error, global POD. (b) Response surface, global POD. (c) LOOCV error, local POD. (d) Response surface, local POD. (e) LOOCV error, DNN. (f) Response surface, DNN.
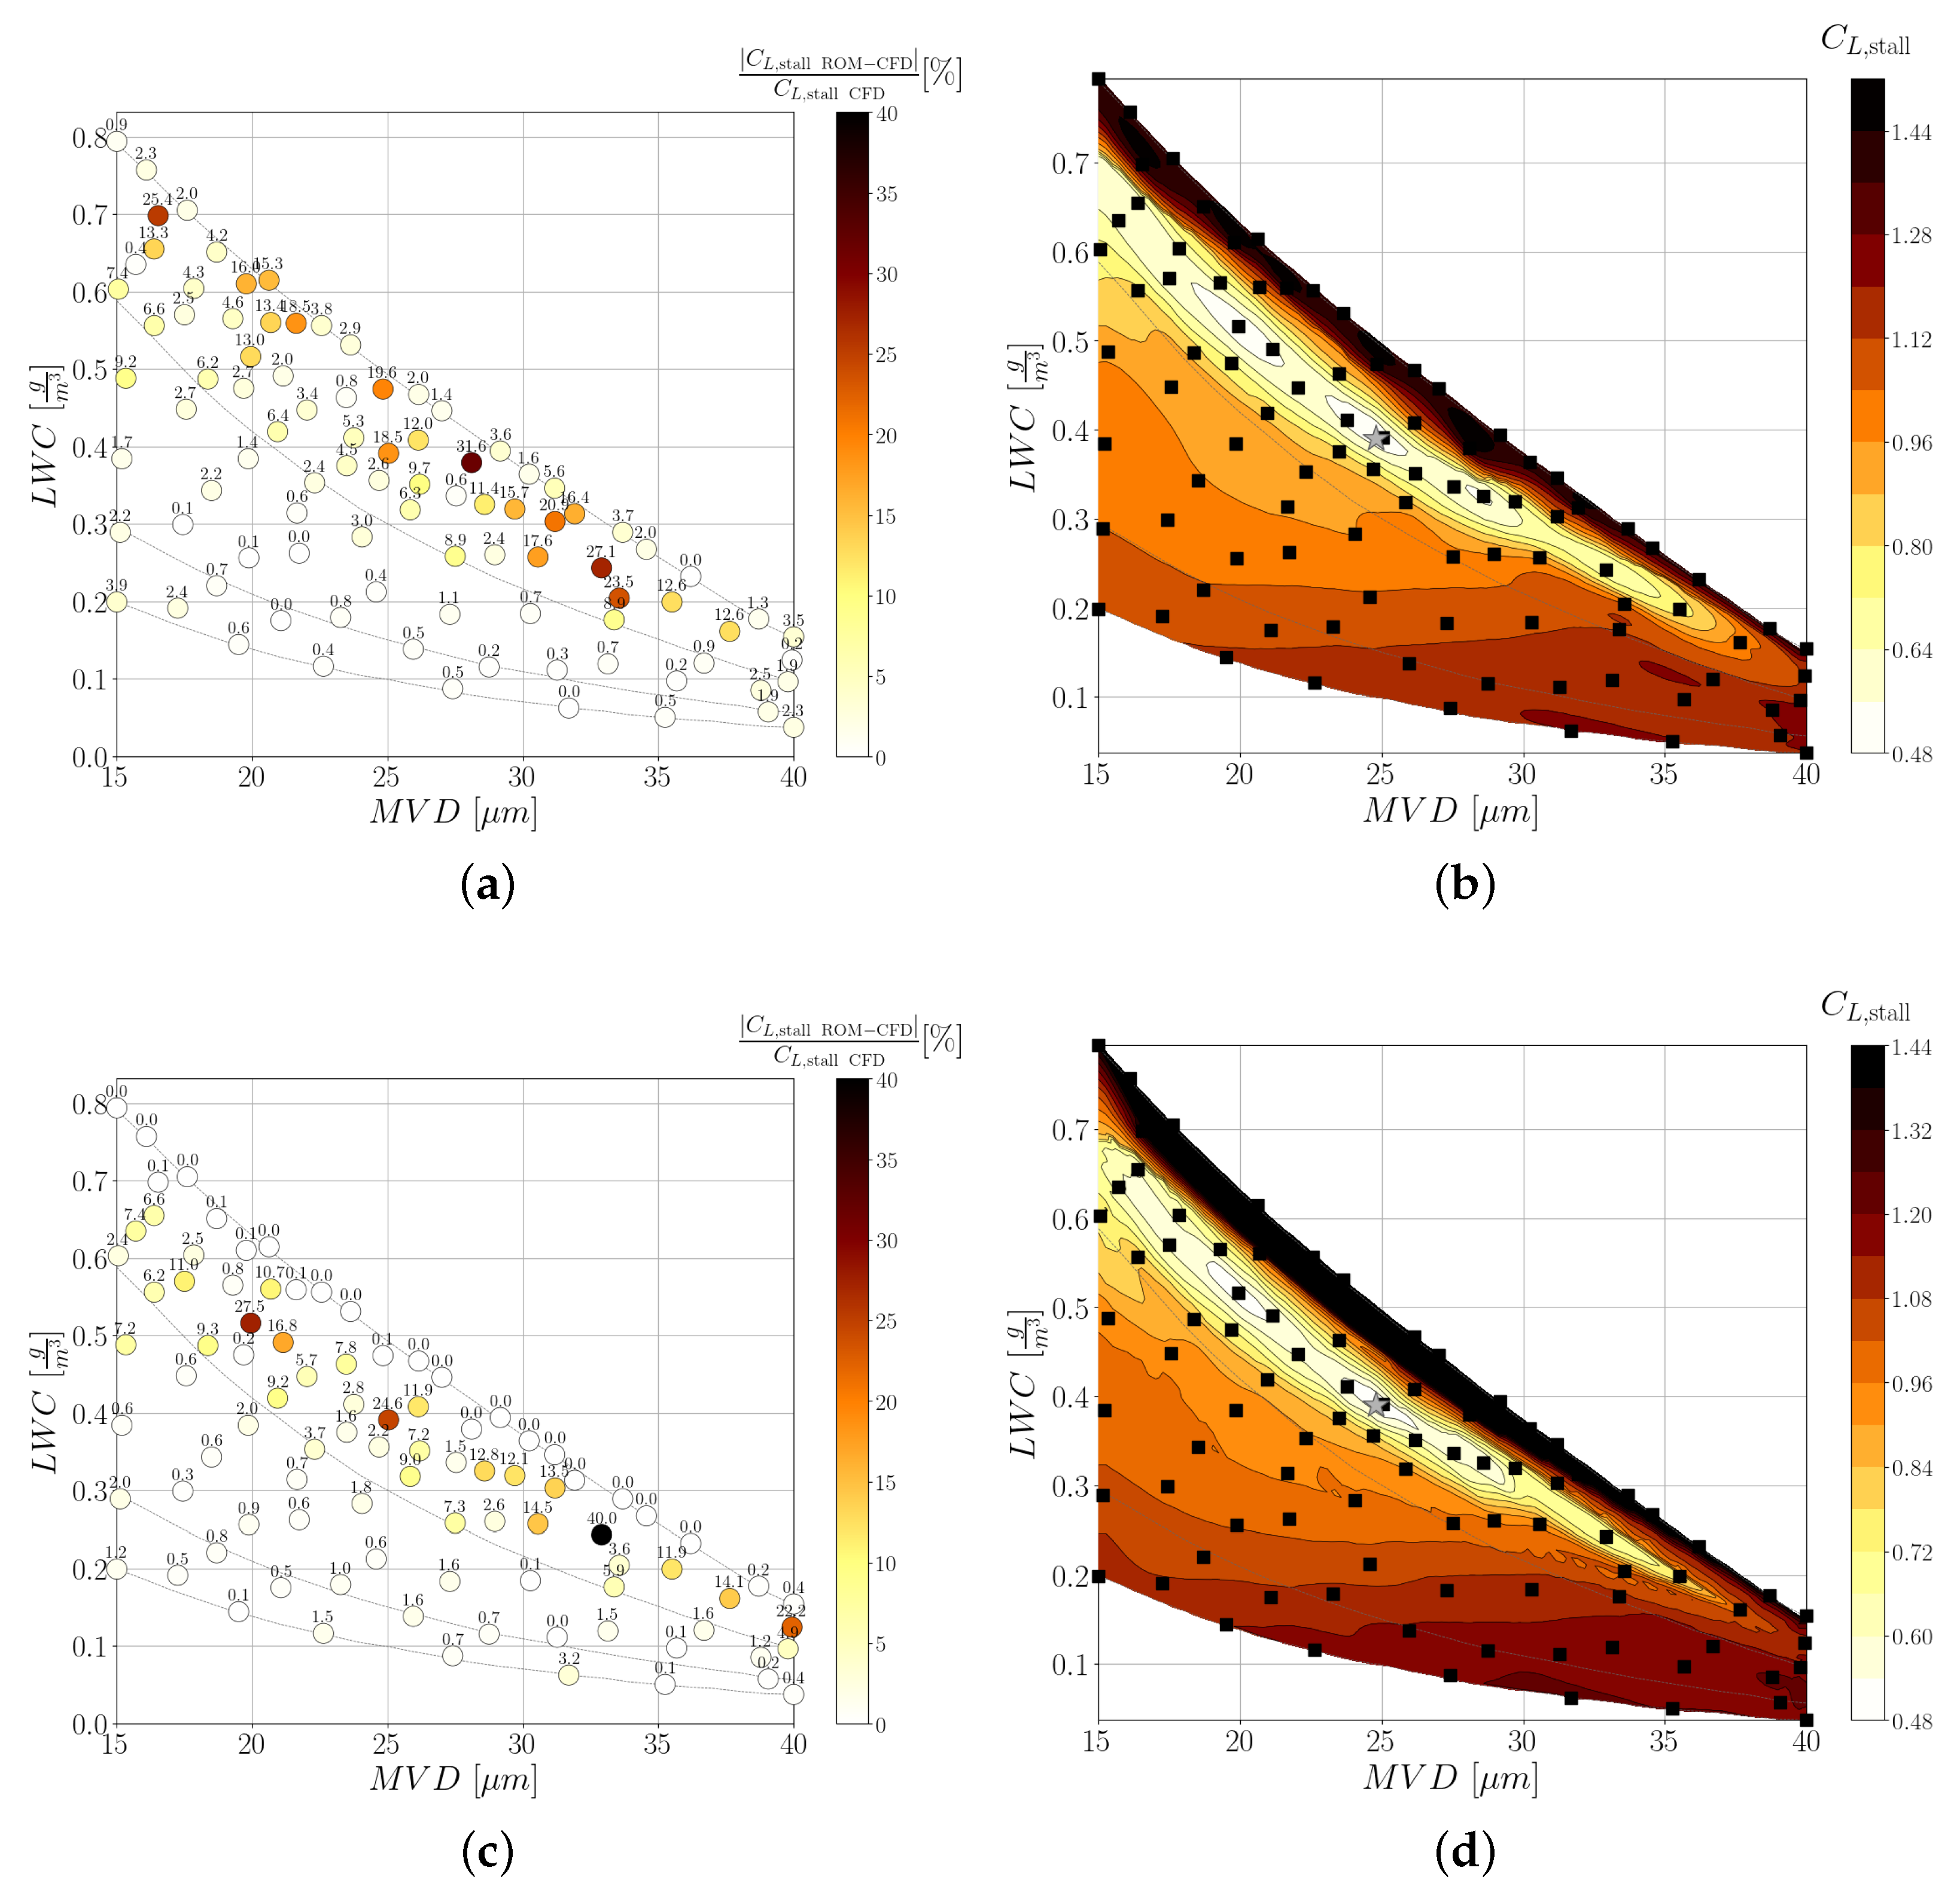

Figure 23.
Stall angle of attack, , from low-dimensional models. (a) LOOCV error, global POD. (b) Response surface, global POD. (c) LOOCV error, local POD. (d) Response surface, local POD. (e) LOOCV error, DNN. (f) Response surface, DNN.
Figure 23.
Stall angle of attack, , from low-dimensional models. (a) LOOCV error, global POD. (b) Response surface, global POD. (c) LOOCV error, local POD. (d) Response surface, local POD. (e) LOOCV error, DNN. (f) Response surface, DNN.
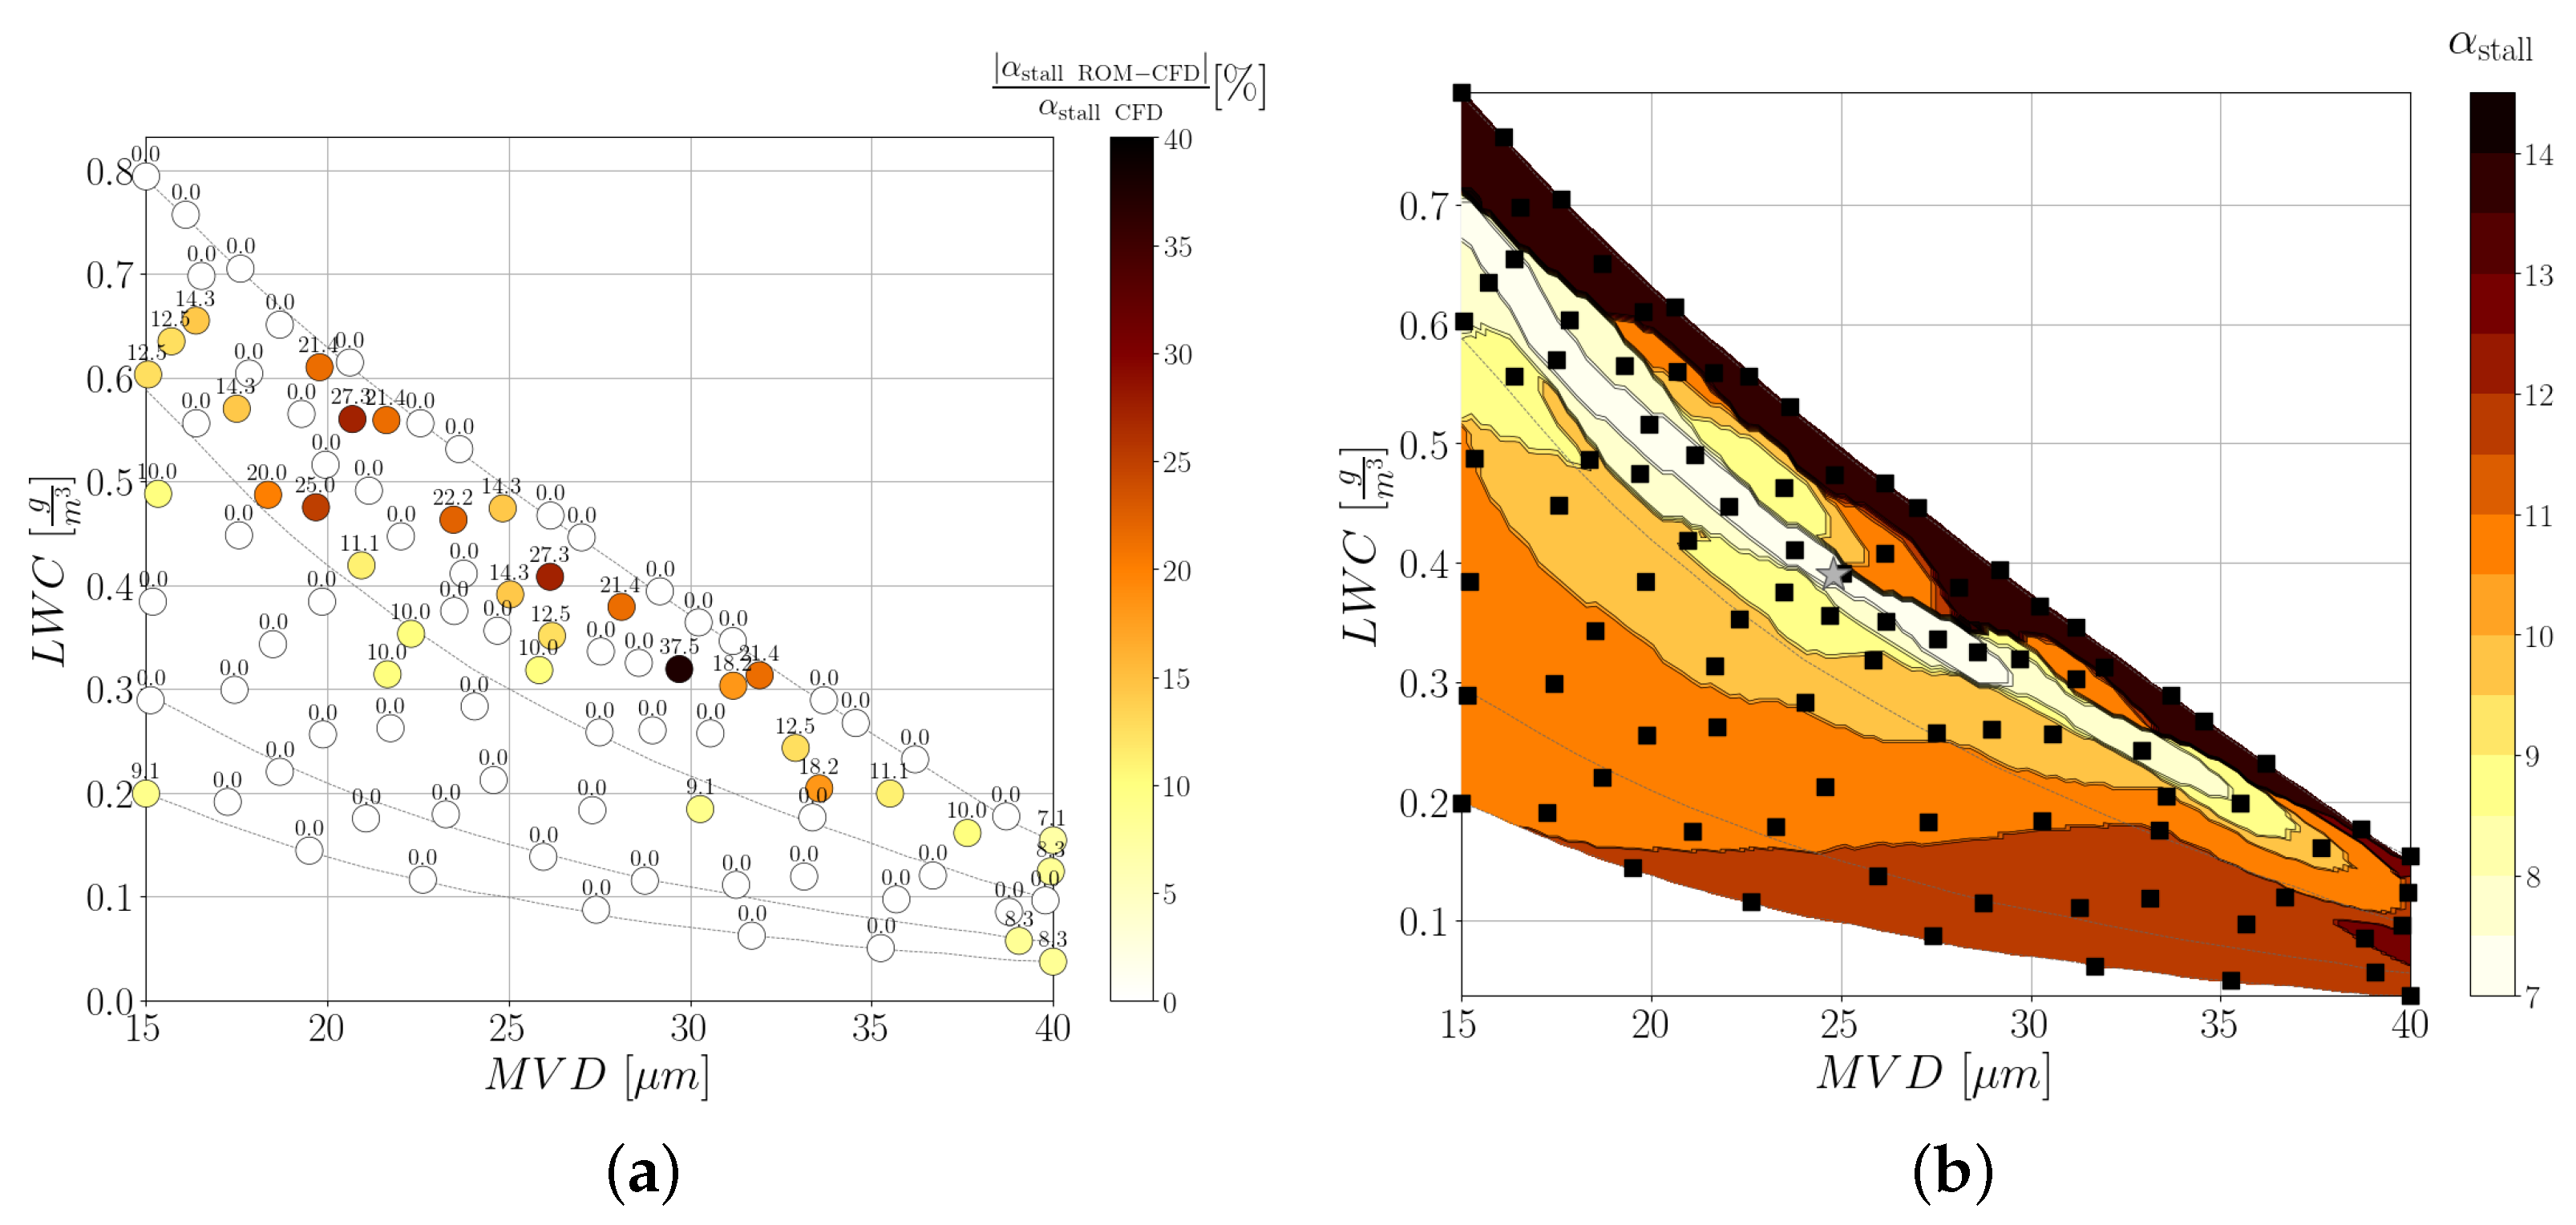

Figure 24.
Combined envelope of aerodynamic data generated by local POD model on 500 ice shapes. Black solid line denotes data for clean aerofoil; dashed black line indicates average polar with rime ice, and black dashed-dotted line average polar for glaze ice.
Figure 24.
Combined envelope of aerodynamic data generated by local POD model on 500 ice shapes. Black solid line denotes data for clean aerofoil; dashed black line indicates average polar with rime ice, and black dashed-dotted line average polar for glaze ice.

Figure 25.
Box-and-whisker plot of maximum lift coefficient, , and stall angle, , using the local POD and DNN models on 500 ice shapes. (a) . (b) .
Figure 25.
Box-and-whisker plot of maximum lift coefficient, , and stall angle, , using the local POD and DNN models on 500 ice shapes. (a) . (b) .
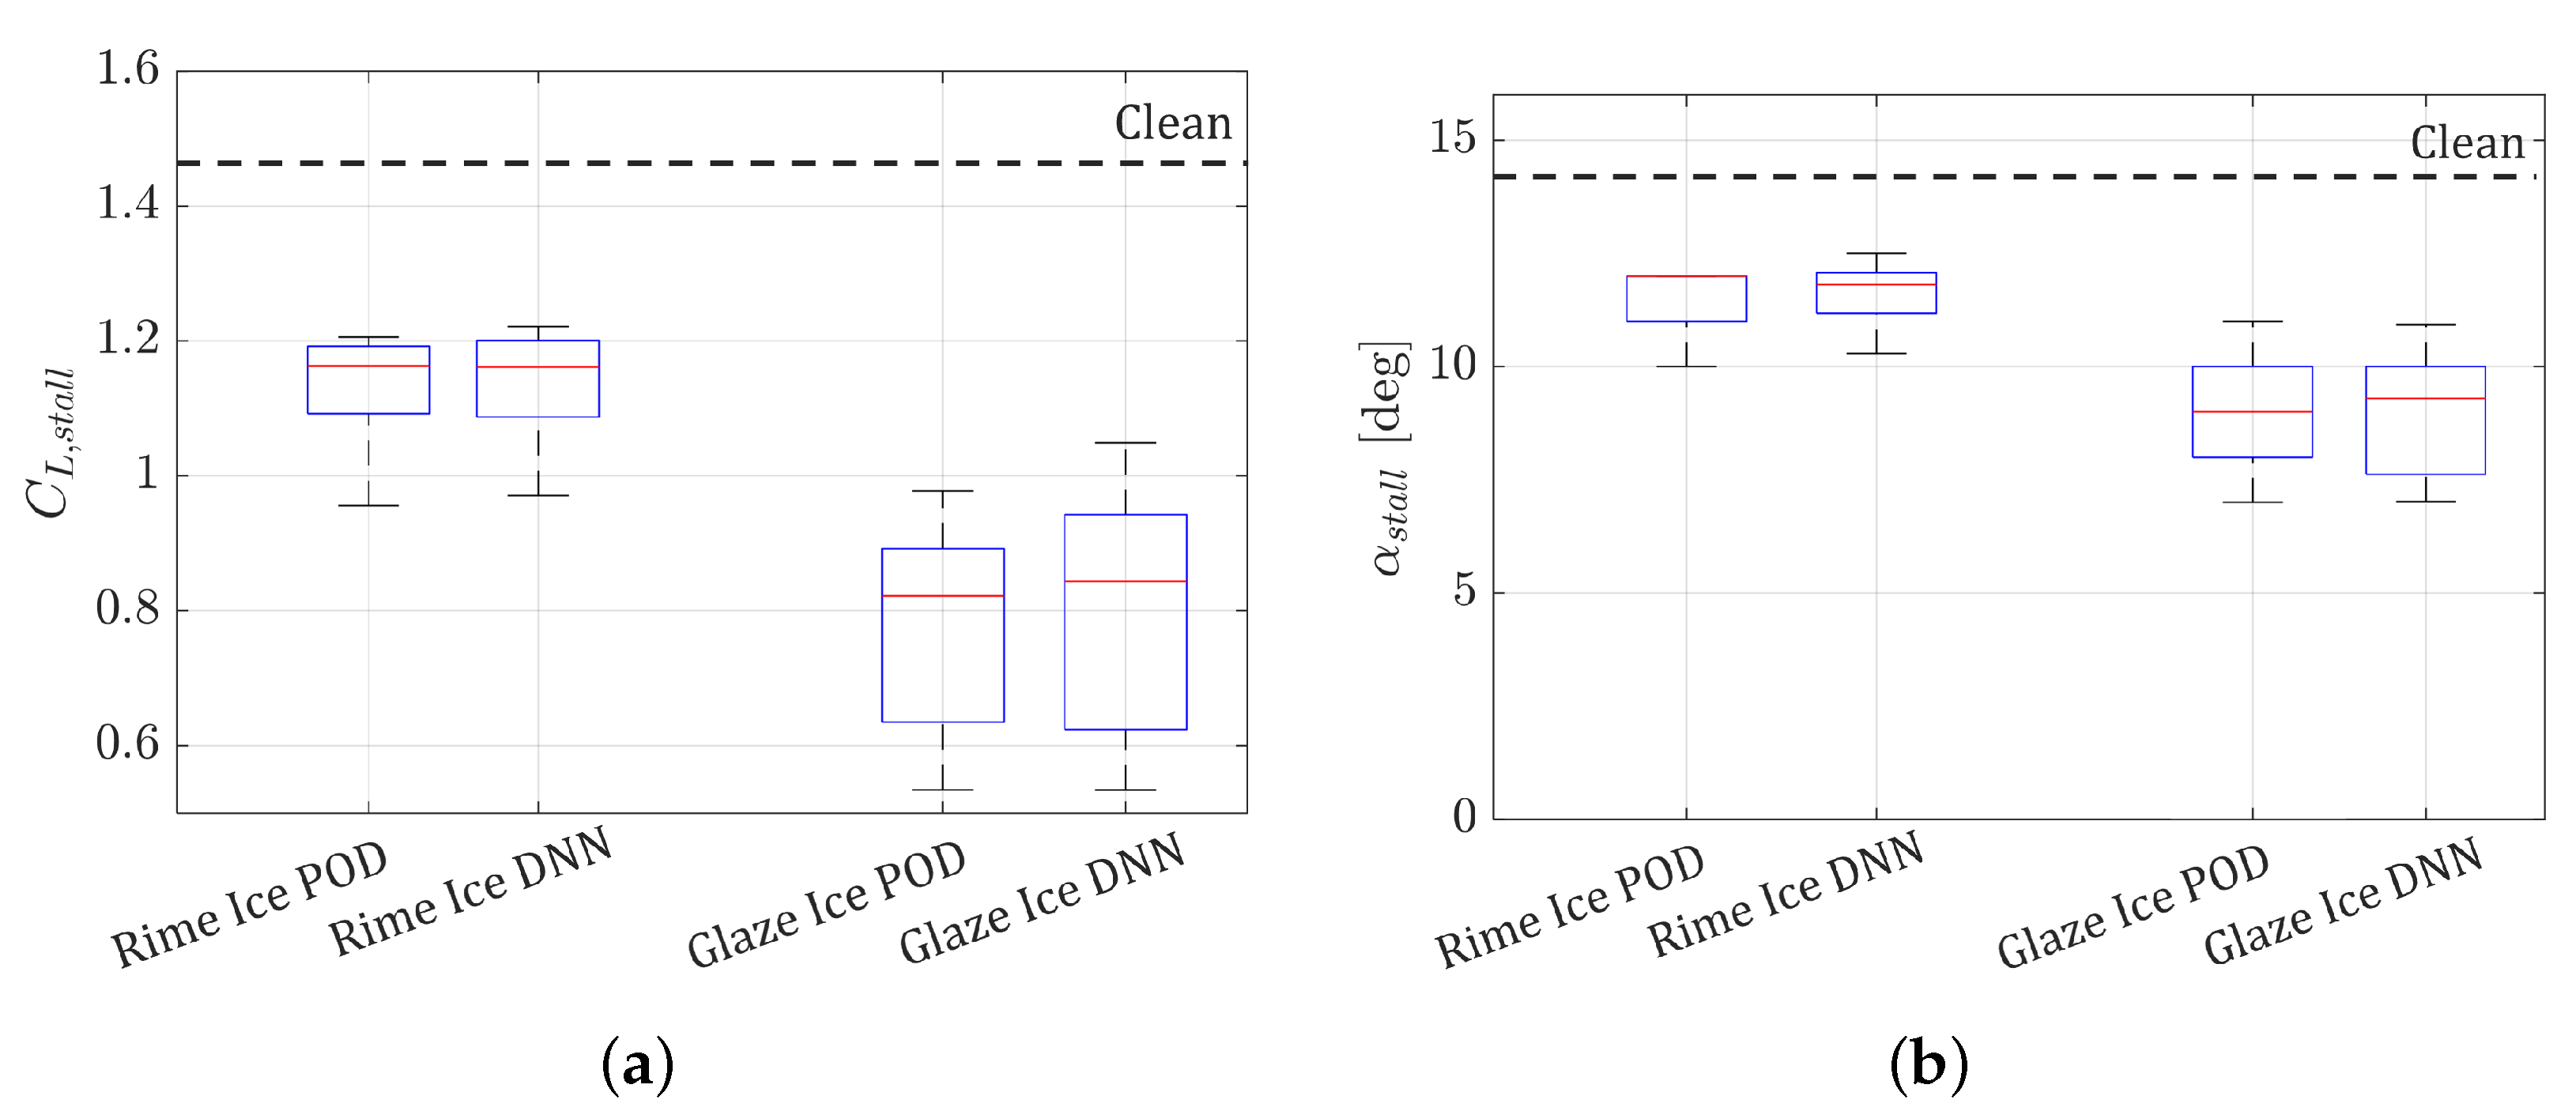

Table 1.
Flight and icing conditions for the validation of ice accretion simulation, NACA 0012 aerofoil.
Table 1.
Flight and icing conditions for the validation of ice accretion simulation, NACA 0012 aerofoil.
| Parameter | Value |
|---|---|
| [m/s] | 102.8 |
| [Pa] | |
| [deg] | 4.0 |
| c [m] | 0.5334 |
| [mm] | 0.5 |
| MVD [m] | 20 |
| LWC [g/m] | 0.55 |
| Total time [s] | 420 |
| No. of multi-shots | 4 |
Table 2.
Quantities of interest for aerodynamic performance degradation.
| Parameter | Clean | Rime | Glaze |
|---|---|---|---|
| 1.405 | 1.053 | 0.731 | |
| [deg] | 14.0 | 11.0 | 8.0 |
| [rad] | 6.64 | 6.59 | 6.01 |
Table 3.
Heaviest ice mass per unit span and related icing conditions predicted by low-dimensional models.
Table 3.
Heaviest ice mass per unit span and related icing conditions predicted by low-dimensional models.
| Model | Mass [g] | [g/m] | ||
|---|---|---|---|---|
| Global POD | 261.4 | 16.8 | 0.63 | 268.0 |
| Local POD | 255.3 | 19.0 | 0.56 | 268.3 |
| NN+Conv-AE | 246.1 | 17.8 | 0.60 | 268.3 |
Table 4.
Worst-case stall conditions predicted by low-dimensional models. “ %” indicates a percentage change from clean airfoil with and .
Table 4.
Worst-case stall conditions predicted by low-dimensional models. “ %” indicates a percentage change from clean airfoil with and .
| Model | ( %) | ( %) | |||
|---|---|---|---|---|---|
| Global POD | 0.501 (−64.5%) | (−) | 24.8 | 0.39 | 267.7 |
| Local POD | 0.500 (−64.5%) | (−) | 24.8 | 0.39 | 267.7 |
| DNN | 0.488 (−65.4%) | 6.6 (−52.6%) | 21.5 | 0.47 | 267.7 |
Disclaimer/Publisher’s Note: The statements, opinions and data contained in all publications are solely those of the individual author(s) and contributor(s) and not of MDPI and/or the editor(s). MDPI and/or the editor(s) disclaim responsibility for any injury to people or property resulting from any ideas, methods, instructions or products referred to in the content. |
© 2023 by the authors. Licensee MDPI, Basel, Switzerland. This article is an open access article distributed under the terms and conditions of the Creative Commons Attribution (CC BY) license (https://creativecommons.org/licenses/by/4.0/).
Share and Cite
MDPI and ACS Style
Massegur, D.; Clifford, D.; Da Ronch, A.; Lombardi, R.; Panzeri, M. Low-Dimensional Models for Aerofoil Icing Predictions. Aerospace 2023, 10, 444. https://doi.org/10.3390/aerospace10050444
AMA Style
Massegur D, Clifford D, Da Ronch A, Lombardi R, Panzeri M. Low-Dimensional Models for Aerofoil Icing Predictions. Aerospace. 2023; 10(5):444. https://doi.org/10.3390/aerospace10050444
Chicago/Turabian StyleMassegur, David, Declan Clifford, Andrea Da Ronch, Riccardo Lombardi, and Marco Panzeri. 2023. "Low-Dimensional Models for Aerofoil Icing Predictions" Aerospace 10, no. 5: 444. https://doi.org/10.3390/aerospace10050444
Note that from the first issue of 2016, this journal uses article numbers instead of page numbers. See further details here.