

Fatigue Reliability Analysis of Composite Material Considering the Growth of Effective Stress and Critical Stiffness

School of Mechanical Engineering, Xinjiang University, Urumqi 830046, China
*
Author to whom correspondence should be addressed.
Aerospace 2023, 10(9), 785; https://doi.org/10.3390/aerospace10090785
Submission received: 14 August 2023
/
Revised: 2 September 2023
/
Accepted: 5 September 2023
/
Published: 6 September 2023
(This article belongs to the Special Issue Computing Methods for Aerospace Reliability Engineering)
Abstract
:Fatigue damage accumulation will not only cause the degradation of material performance but also lead to the growth of effective stress and critical stiffness. However, the existing fatigue reliability models usually ignore the effective stress growth and its influence on the critical stiffness of a composite material. This study considers the combined effects of performance degradation and effective stress growth, and a pair of fatigue reliability models for a composite material are presented. Firstly, the fatigue damage in a composite material is quantified by its performance degradation, and the fitting accuracy of several typical fatigue damage models is compared. Subsequently, the uncertainties of initial strength and initial stiffness are considered, and a pair of probabilistic models of residual strength and residual stiffness are proposed. The performance degradation data of Gr/PEEK [0/45/90/−45]2S laminates are utilized to verify the proposed probabilistic models. Finally, the effective stress growth mechanism and its influence on the failure threshold are elaborated, and a pair of fatigue reliability models for composite materials are developed. Moreover, the differences between the strength-based and stiffness-based reliability analysis results of composite materials are compared and discussed.
1. Introduction
Composite materials have been widely used in the aerospace and aviation industry due to their excellent comprehensive performance [1]. For example, the Boeing 787 comprises 80% composite material by volume: the material composition is 50% composite, 20% aluminum, 15% titanium, 10% steel and 5% other by weight [2]. Aerospace structures are often in service under cyclic loading, and fatigue failure becomes the major failure mode of composite materials [3]. Generally, the fatigue failure process of a composite material is dominated by the development of fatigue damage. Therefore, it is important to explore the fatigue damage behaviors in advance so that an optimal maintenance plan can be scheduled before the occurrence of a catastrophic accident [4,5].
For some practical reasons, the fatigue damage accumulation rule of a composite material is usually investigated from a performance degradation point of view. To ensure the safety of composite structures during their service time, fatigue reliability analysis methods based on performance degradation have been extensively studied over the past decades [6,7]. In general, the existing fatigue reliability analysis approaches can be classified into two categories: strength-based approaches [8,9,10] and stiffness-based approaches [11,12,13].
In terms of the strength-based fatigue reliability approach, Zaharia et al. [14] investigated the fatigue reliability and lifetime of composite materials from the perspective of probability and statistics, but the strength degradation rule was not involved. Zhang et al. [15] used the stochastic gamma process to characterize the fatigue damage accumulation of composite structures, and an optimal maintenance strategy was developed. However, the fatigue damage parameter adopted in Zhang et al. [15] lacks clear physical meaning. Talreja [16] proposed a probabilistic model of residual strength based on Weibull distribution, and the fatigue reliability of composite laminates was calculated. Cheng and Hwu [17] analyzed the time-dependent reliability of composite laminates based on a residual strength model and Weibull distribution. Chen et al. [18] explored the characteristics of the reliability-dependent failure rate based on the strength degradation model and Monte Carlo simulation approach. Gao et al. [19] proposed a pair of performance degradation models for composite laminates, and the corresponding fatigue lives were predicted. To account for the effects of stress level on fatigue failure, Ma et al. [20] developed a generalized performance degradation model for composite materials. It should be noted that fatigue damage accumulation will not only cause the performance degradation of composite material, but also lead to an increase in effective stress. However, the effective stress growth caused by accumulated fatigue damage in a composite material is ignored in Refs. [16,17,18,19,20].
In terms of the stiffness-based fatigue reliability approach, Feng et al. [21] analyzed the fatigue failure behaviors and reliability of composite laminates based on stiffness degradation. Unfortunately, the stiffness degradation model adopted in Ref. [21] is a deterministic model, and the randomness of material performance was not considered. For the tension–tension and tension–compression loading conditions, Häusler et al. [22] explored the stiffness degradation rule of a composite material through a comprehensive experimental approach. However, the critical stiffness in Ref. [22] was determined by an experimental test, which lacks a rigorous theoretical basis. Wang et al. [23] calculated the fatigue reliability of a composite material based on the non-probabilistic time-dependent approach. Wu et al. [24] proposed a new residual stiffness model to quantify fatigue damage in composite structures, and the random vibration tests were applied to verify its validity. To accurately characterize the evolution of fatigue damage in composite materials, Van Paepegem and Degrieck [25] presented a coupled approach for strength and stiffness degradation. Gao and Yuan [26] considered the randomness of material performance, and a probability model of residual stiffness was developed. To characterize the whole periods of damage development, Shiri et al. [27] proposed a new residual stiffness model based on trigonometric functions. It should be noted that the critical stiffness of composite material changes with the increase in effective stress. However, the critical stiffness was treated as a constant in Refs. [23,24,25,26,27], which is inconsistent with the real case.
A great deal of research that focused on the fatigue reliability of composite materials has been conducted, and many strength-based and stiffness-based fatigue reliability approaches have been presented [28,29,30]. It should be noted that the existing fatigue reliability approaches mainly focus on the performance degradation path and its probabilistic features. The growth of effective stress and critical stiffness caused by accumulated fatigue damage is ignored in the existing studies. In essence, fatigue damage accumulation will not only cause the degradation of material performance, but also lead to an increase in effective stress and critical stiffness. In addition, the existing studies do not systematically compare and discuss the differences between strength-based and stiffness-based fatigue reliability approaches. To this end, a pair of probabilistic models of residual strength and residual stiffness are proposed in this study. The growth mechanisms of effective stress and critical stiffness are elaborated from the perspective of load-bearing capacity. The combined effects of performance degradation and effective stress growth are considered, and a pair of strength-based and stiffness-based fatigue reliability approaches are presented. Moreover, the fatigue reliability and failure rate of composite laminates under different conditions are compared and discussed.
The rest of this paper is organized as follows. In Section 2, the fatigue damage in the composite material is quantified by its performance degradation. Section 3 develops a pair of probabilistic models of residual strength and residual stiffness with consideration of the randomness of material performance. In Section 4, the growth mechanisms of effective stress and critical stiffness are elaborated. Section 5 presents a pair of strength-based and stiffness-based fatigue reliability approaches, which are capable of accounting for the combined effects of performance degradation and effective stress growth. Some conclusions are drawn in Section 6.
2. Fatigue Damage Characterized by Performance Degradation
The microscopic damage behaviors of a composite material are difficult to explore due to its inherent heterogeneity and anisotropy. Moreover, the damage evolution in a composite material contains a variety of failure behaviors, which makes the damage mechanisms much more complex [31,32,33]. From a macroscopic point of view, fatigue damage accumulation usually results in the performance degradation of a composite material. Therefore, the performance degradation of a composite material becomes an easily measurable parameter to monitor the evolution of fatigue damage. In this section, several representative strength-based and stiffness-based fatigue damage models are compared. The fatigue test data of the Gr/PEEK [0/45/90/−45]2S laminates are utilized to evaluate the fitting accuracy of different fatigue damage models.
2.1. Fatigue Damage Characterized by Strength Degradation
In practical engineering, strength degradation is a frequently used macroscopic damage parameter to quantify the fatigue damage of a composite material. Over the past decades, the strength degradation rule of a composite material under cyclic loading has been widely investigated, and many strength-based fatigue damage models have been proposed [1,17]. In this section, four representative strength-based fatigue damage models are discussed to depict the evolution process of fatigue damage, as shown in Table 1.
In Table 1, represents the cycle ratio, which is defined as , is the number of loading cycles and is the fatigue life of the composite material. Obviously, . represents the strength-based fatigue damage of the composite material; , and are the parameters of these models. The experimental data of the Gr/PEEK [0/45/90/−45]2S laminates in Ref. [38] are utilized to evaluate the fitting accuracy of the above four strength-based fatigue damage models. Note from Ref. [38] that both the static and fatigue tests of the Gr/PEEK [0/45/90/−45]2S laminates are conducted on the MTS 810 machine. Based on the strength degradation data from Ref. [38], the nonlinear least square method is applied to estimate the parameters (i.e., , and ) of the above four models. The parameter estimation results are shown in Table 2.
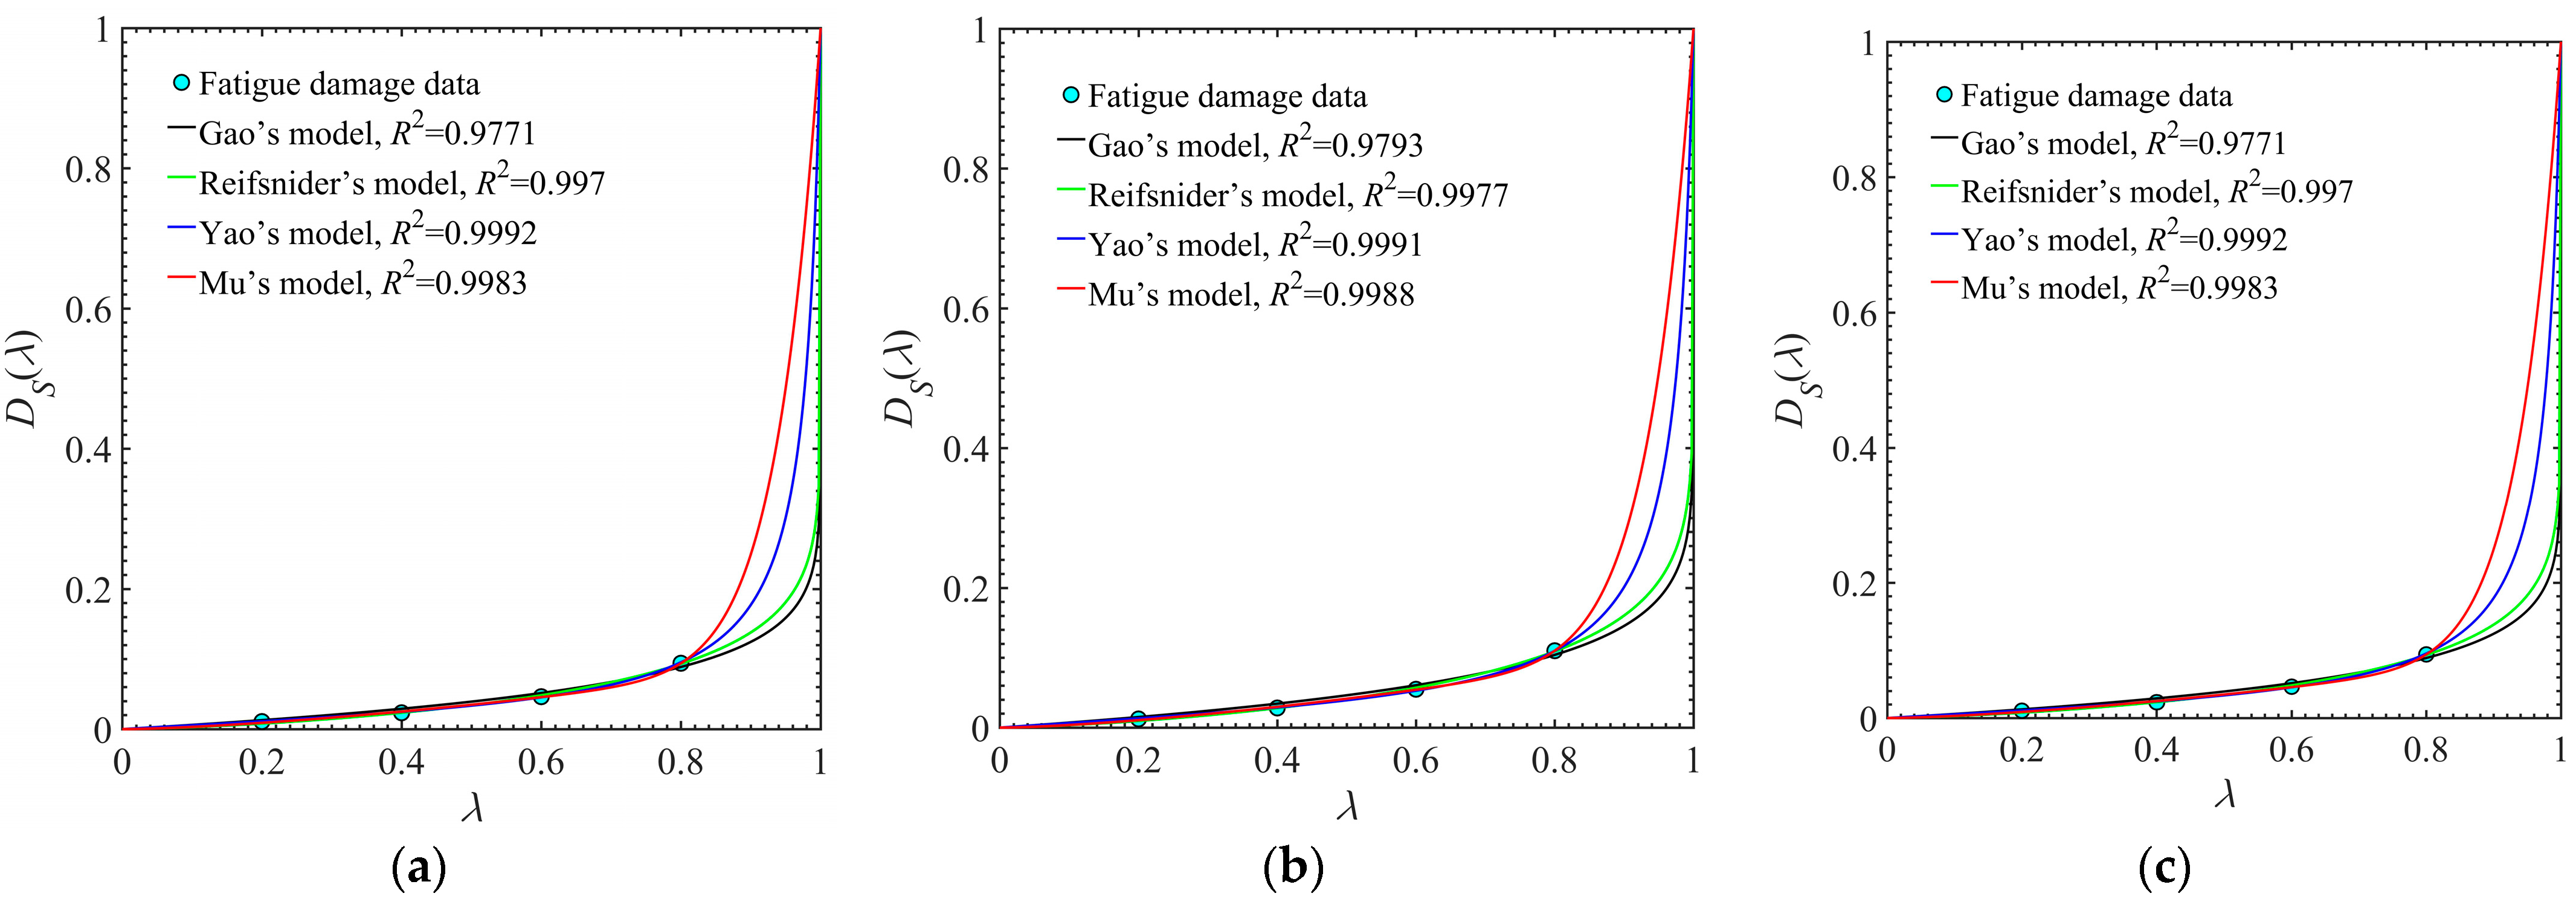
Table 2 shows that the goodness of fit of these four strength-based fatigue damage models is greater than 0.97. Therefore, the above four representative models can fit the fatigue damage data of the Gr/PEEK [0/45/90/−45]2S laminates with good agreement. By comparison, the fitting accuracy of Yao’s model is higher than that of other three models. Specifically, the goodness of fit values of Yao’s model under three different stress levels are 0.9992, 0.9991 and 0.9993, respectively. Based on the parameter estimation results listed in Table 2, the fitting curves of these four strength-based fatigue damage models are plotted, as shown in Figure 1.
Figure 1 shows that the fatigue damage curve characterized by the strength degradation of the Gr/PEEK [0/45/90/−45]2S laminates exhibits a slow–fast trend during fatigue failure. Fatigue damage accumulates slowly when the cycle ratio is , while it accumulates rapidly when the cycle ratio is . The later stage is always regarded as the ‘sudden death’ behavior of a composite material under high cyclic loading. In this study, Yao’s model is introduced to quantify the strength-based fatigue damage of the Gr/PEEK [0/45/90/−45]2S laminates because of its superior fitting accuracy. Therefore, the strength-based fatigue damage model of the composite material can be expressed as
where is the initial strength (namely ultimate strength) of the composite material; is the residual strength of the composite material when the cycle ratio equals .
2.2. Fatigue Damage Characterized by Stiffness Degradation
Stiffness degradation is another widely used macroscopic damage parameter, which is capable of measuring the accumulated damage through a non-destructive testing method. Many researchers have given special attention to the stiffness degradation rule of composite materials, and numerous stiffness-based fatigue damage models have been developed [22,25]. In this section, four representative stiffness-based fatigue damage models are chosen to quantify the accumulated fatigue damage of the composite material, as shown in Table 3.
In Table 3, represents the stiffness-based fatigue damage of the composite material; , and are the parameters of the above models. The experimental data of the Gr/PEEK [0/45/90/−45]2S laminates from Ref. [38] are utilized to examine the fitting accuracy of these four stiffness-based fatigue damage models. Based on the stiffness degradation data in Ref. [38], the nonlinear least square method is used to calculate the parameters of the above four models. The parameter calculation results are listed in Table 4.
Table 4 notes that the goodness of fit of the four representative stiffness-based fatigue damage models is greater than 0.75. Therefore, these four representative models are capable of fitting the fatigue damage data of the Gr/PEEK [0/45/90/−45]2S laminates. By comparison, Gao’s model has higher fitting accuracy than other three models. For three different stress levels, the goodness of fit values of Gao’s model are 0.9999, 0.9987 and 0.9944, respectively. Based on the parameter calculation results shown in Table 4, the fitting curves of these four stiffness-based fatigue damage models are plotted, as shown in Figure 2.
Figure 2 notes that the stiffness-based fatigue damage curve of the Gr/PEEK [0/45/90/−45]2S laminates exhibits a fast–slow–fast trend during fatigue failure. Fatigue damage grows quickly when the cycle ratio is , then it accumulates slowly when the cycle ratio is and finally increases rapidly when the cycle ratio is . This phenomenon is consistent with the existing studies, such as Refs. [19] and [22]. In this study, Gao’s model is introduced to characterize the stiffness-based fatigue damage of the Gr/PEEK [0/45/90/−45]2S laminates due to its excellent fitting accuracy. Under such circumstances, the stiffness-based fatigue damage model of a composite material can be formulated as
where is the initial stiffness (namely modulus of elasticity) of the composite material; is the residual stiffness of the composite material when the cycle ratio equals .
3. Performance Degradation of Composite Material
Performance degradation analysis plays a key role in reliability design and lifetime prediction of composite structures [40,41,42]. In engineering practice, residual strength and residual stiffness are two frequently used performance degradation parameters to quantify the accumulated fatigue damage of composite structures. In this section, the two-parameter Weibull distribution is utilized to characterize the probability distributions of initial strength and initial stiffness of the composite material. Probabilistic models of residual strength and residual stiffness are developed based on the fatigue damage and probability theories. The performance degradation data of the Gr/PEEK [0/45/90/−45]2S laminates are adopted to verify the proposed probabilistic models.
3.1. Probabilistic Model of Residual Strength
Residual strength is defined as the resistance of a composite material to fatigue fracture after a given cycle ratio, which is generally measured through a destructive testing method [17,20]. According to Equation (1), the residual strength of a composite material can be expressed as
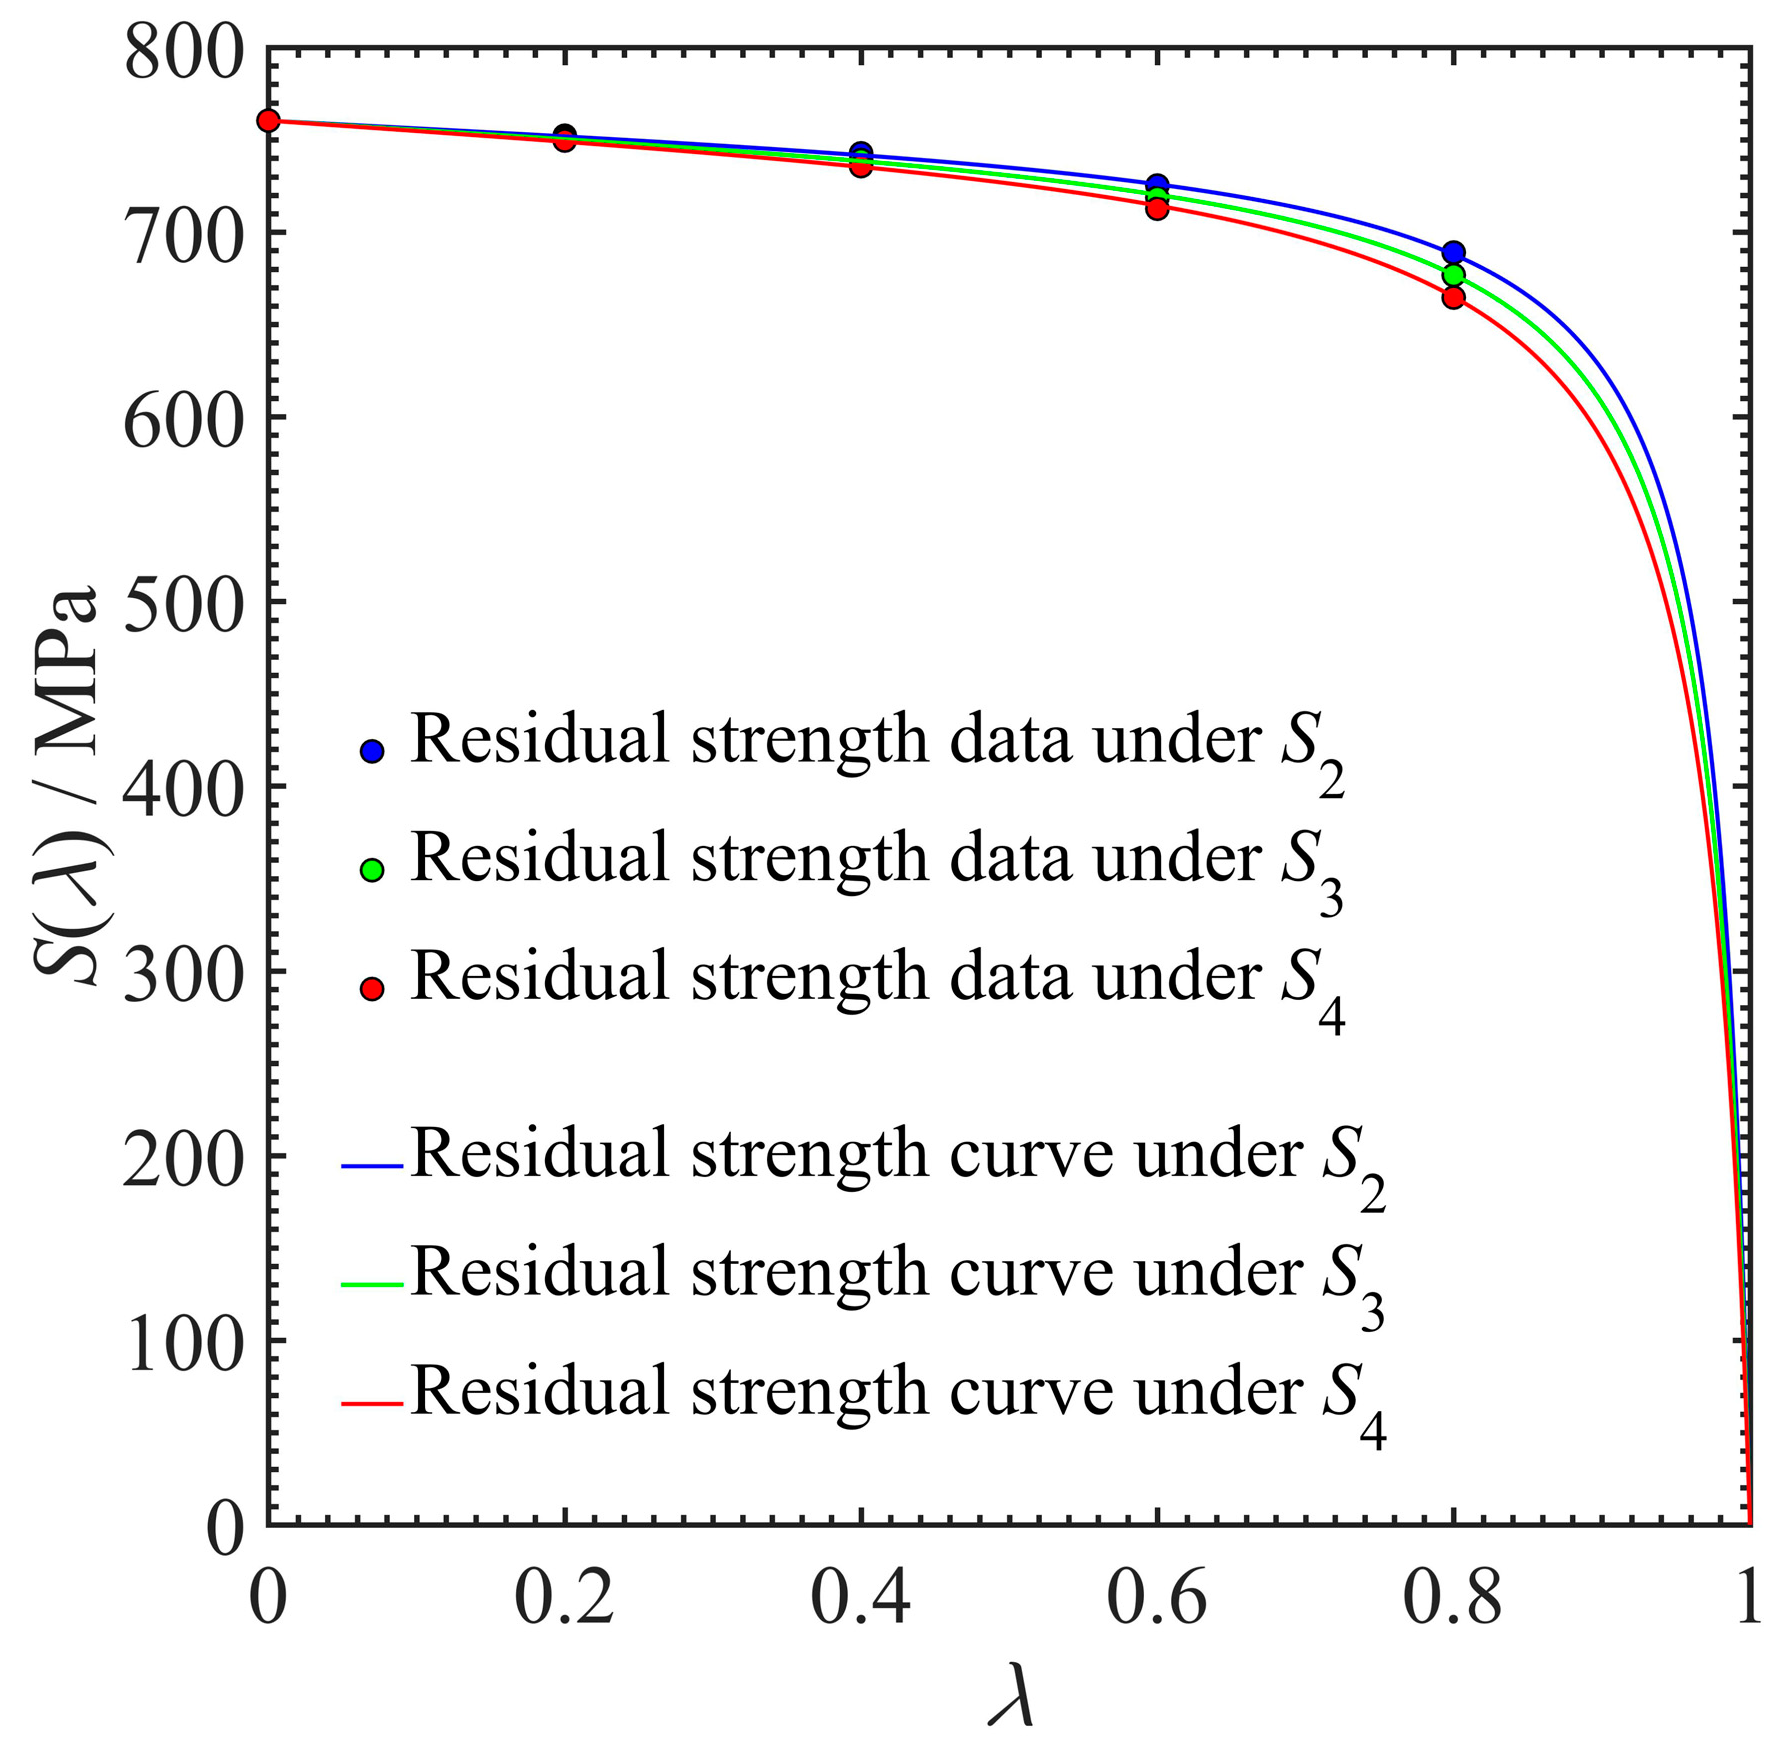
It should be noted that Equation (3) is a deterministic model, which characterizes the strength degradation path from the perspective of mean value. According to Equation (3) and the experimental data from Ref. [38], the mean value curve of residual strength of the Gr/PEEK [0/45/90/−45]2S laminates is plotted, as shown in Figure 3.
Note from Figure 3 that Equation (3) is capable of characterizing the strength degradation path of the Gr/PEEK [0/45/90/−45]2S laminates. However, due to the random distribution of original defects (such as voids, bubbles and broken fibers) in the composite material, both initial strength and residual strength exhibit significant dispersion. It is generally considered that the dispersions of initial strength and residual strength are dominated by identical original defects inside the composite material [43]. The initial strength data (i.e., ultimate strength data from Ref. [38]) of the Gr/PEEK [0/45/90/−45]2S laminates are shown in Table 5.
In this study, the two-parameter Weibull distribution is applied to depict the probabilistic characteristics of initial strength. Therefore, the cumulative distribution function (CDF) of initial strength is formulated as
where represents the CDF of initial strength; and are the shape and scale parameters of the Weibull distribution, respectively.
Based on the initial strength data listed in Table 5, the maximum likelihood estimation method is adopted to calculate the parameters in Equation (4). The parameter calculation results show that and . Accordingly, the probability density function (PDF) and CDF of the initial strength of the Gr/PEEK [0/45/90/−45]2S laminates are plotted, as shown in Figure 4.
Figure 4 shows that Weibull distribution can well quantify the probabilistic characteristics of the initial strength of the Gr/PEEK [0/45/90/−45]2S laminates. As mentioned above, the dispersions of initial strength and residual strength depend on the same original defects inside a composite material. Therefore, it is reasonable to deduce the PDF of residual strength from the PDF of initial strength. Based on the probability theory, the CDF of residual strength is formulated as
where represents the CDF of residual strength; represents the probability of an event.
The correlation between the CDF of residual strength and the CDF of initial strength is derived by substituting Equation (3) into Equation (5).
Moreover, the correlation between the PDF of residual strength and the PDF of initial strength is obtained by the derivation of Equation (6).
where represents the PDF of residual strength; represents the PDF of initial strength, which can be expressed as
Based on Equation (7) and Table 2, the evolution rule of the PDF of residual strength can be obtained, as shown in Figure 5.
In Figure 5, when the cycle ratios are equal to 0.2, 0.4, 0.6 and 0.8, the corresponding PDF curves of residual strength are shown in the red, green, blue and magenta dotted curves, respectively. Similarly, the red, green, blue and magenta square points represent the corresponding residual strength data under different cycle ratios. Note from Figure 5 that the PDF curve changes with the cycle ratio, and the proposed probabilistic model of residual strength (i.e., Equation (7)) can fit the residual strength data with good agreement. For a given cycle ratio, the residual strength of the Gr/PEEK [0/45/90/−45]2S laminates is a random variable.
3.2. Probabilistic Model of Residual Stiffness
Residual stiffness is defined as the ability of composite material to resist elastic deformation after a given cycle ratio. In engineering practice, residual stiffness is usually measured through a non-destructive testing method, which makes it possible to continuously observe the fatigue damage state of a composite material [19]. According to Equation (2), the residual stiffness of a composite material can be formulated as
Obviously, Equation (9) is a deterministic model, which characterizes the stiffness degradation path from the perspective of mean value. Based on Equation (9) and the test data from Ref. [38], the mean value curve of the residual stiffness of the Gr/PEEK [0/45/90/−45]2S laminates is obtained, as shown in Figure 6.
Figure 6 shows that Equation (9) fits the stiffness degradation data of the Gr/PEEK [0/45/90/−45]2S laminates with good agreement. As a result of the influence of uncertain factors, various original defects will be produced in a composite material. The randomness of original defects has a significant influence on initial stiffness and residual stiffness . Therefore, it is necessary to explore the stiffness degradation rule of a composite material from the probability point of view. The initial stiffness data (i.e., elastic modulus data from Ref. [38]) of the Gr/PEEK [0/45/90/−45]2S laminates are listed in Table 6.
Similarly, the two-parameter Weibull distribution is utilized to quantify the probabilistic characteristics of initial stiffness. Accordingly, the CDF of initial stiffness can be expressed as
where represents the CDF of initial stiffness; and are the shape and scale parameters, respectively.
Based on the initial stiffness data shown in Table 6, the parameters in Equation (10) are determined by using the maximum likelihood estimation method. The parameter estimation results are listed in Table 7.
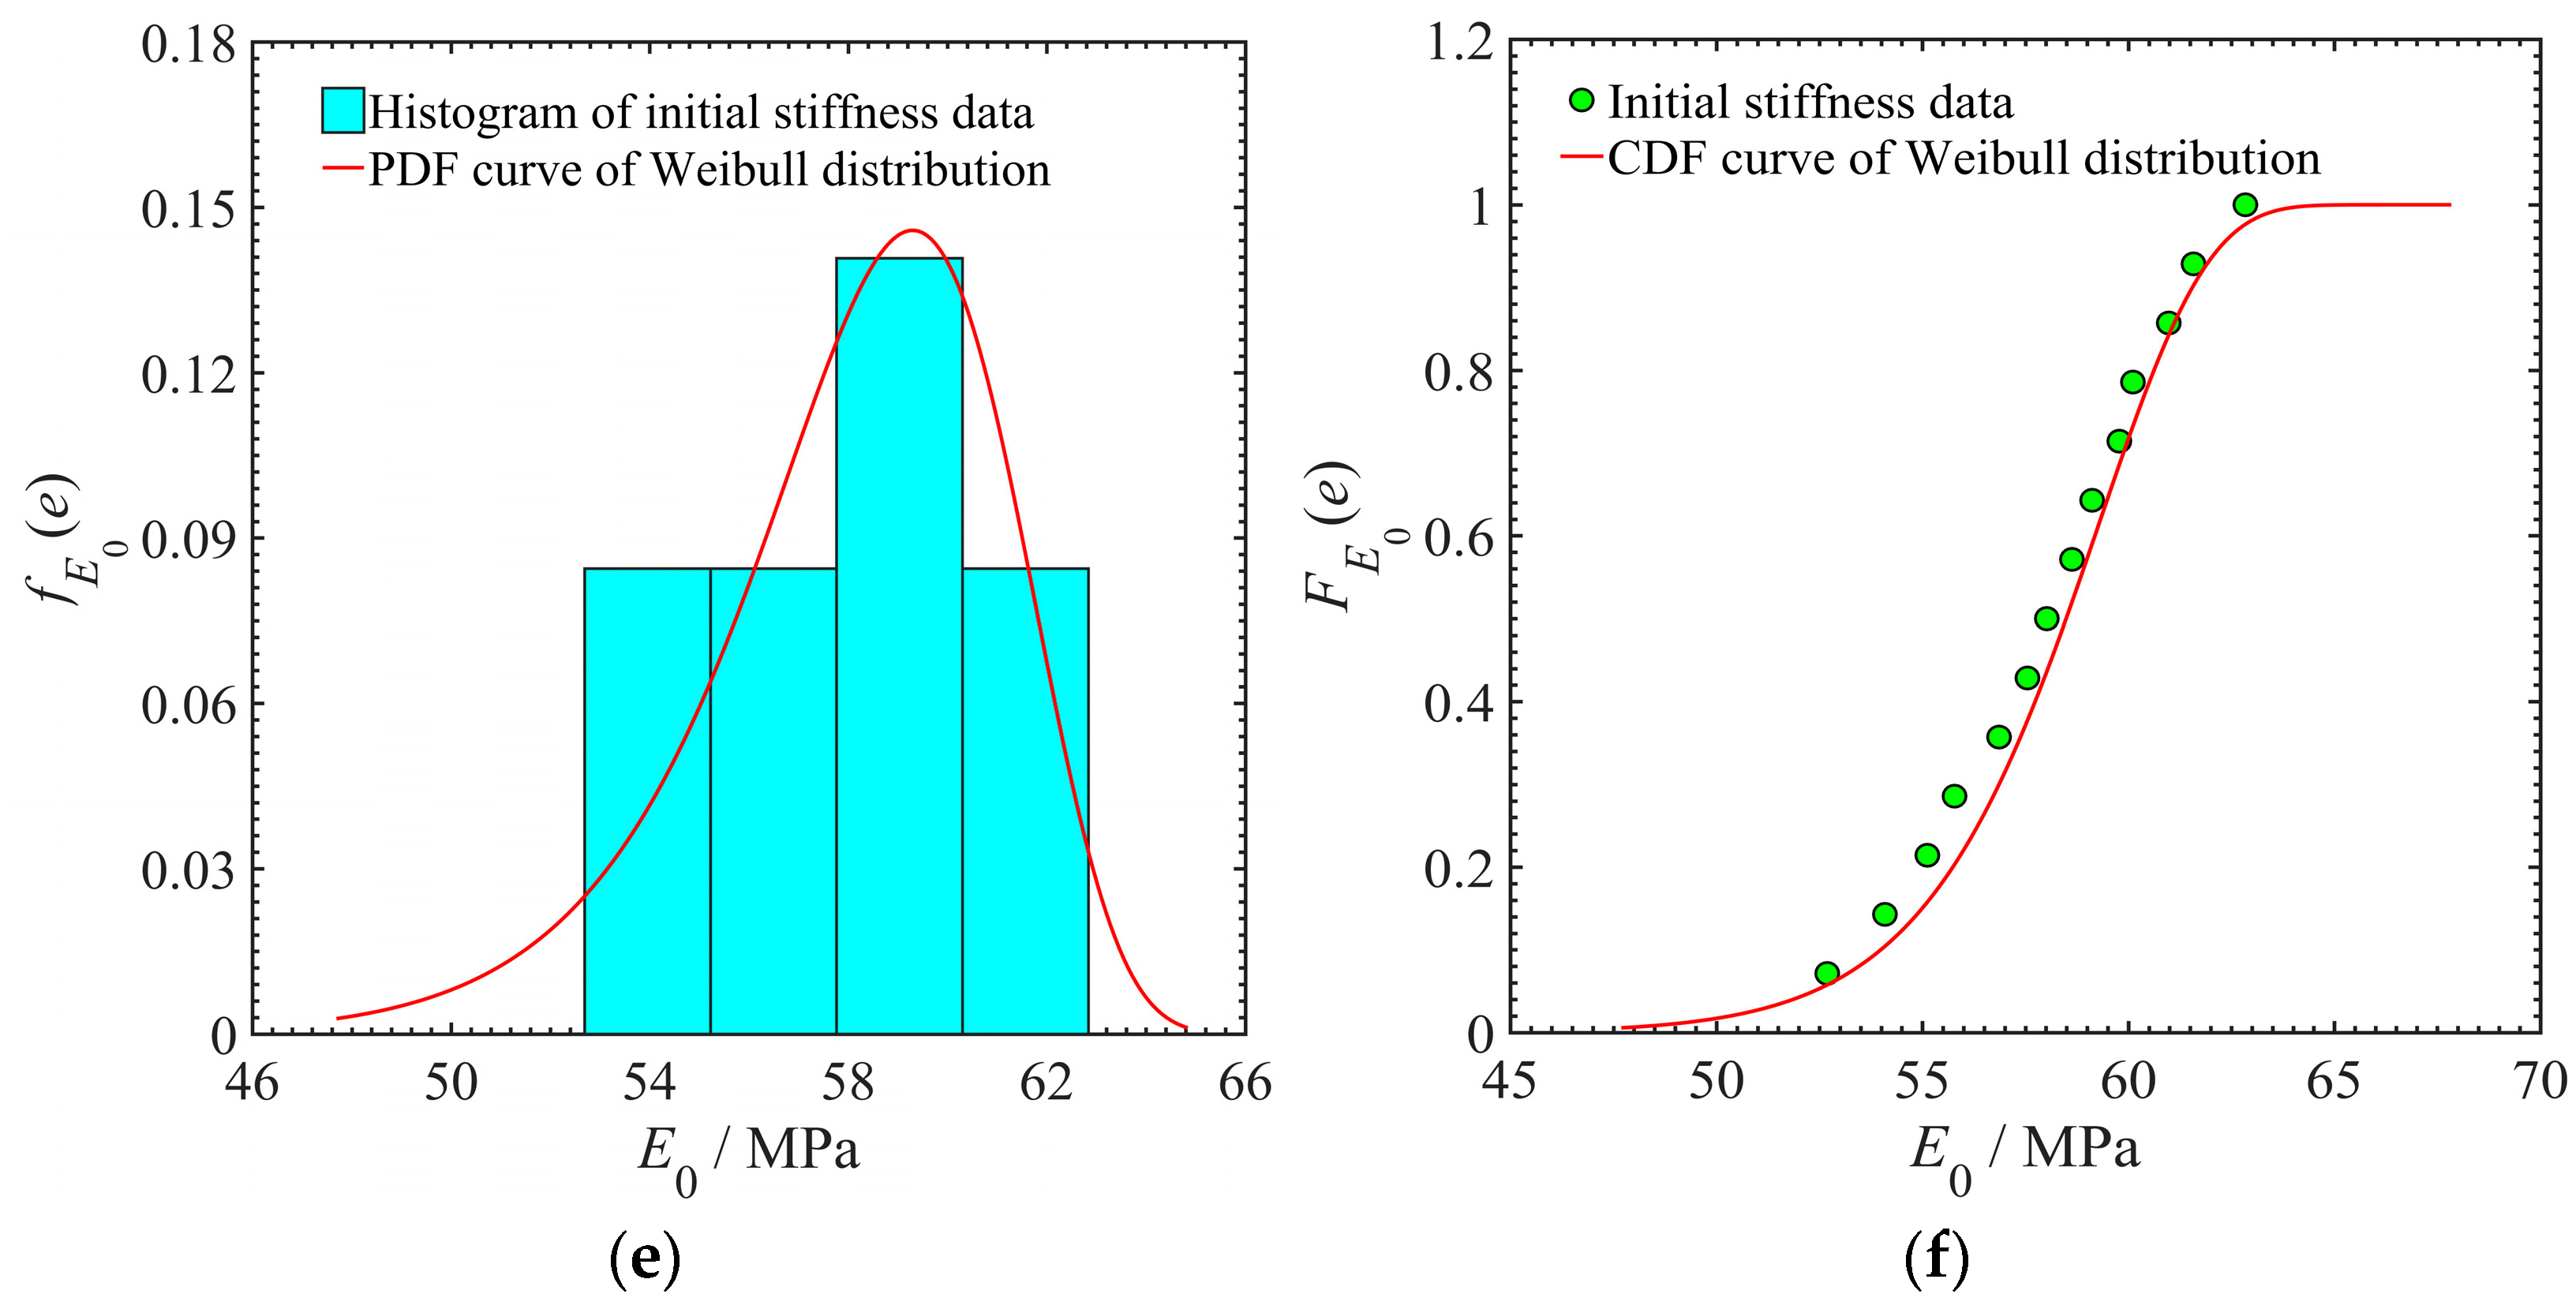
Accordingly, the PDF and CDF curves of initial stiffness are plotted based on the above parameters, as shown in Figure 7.
Note from Figure 7 that the Weibull distribution is flexible enough to characterize the probability distribution of the initial stiffness of the Gr/PEEK [0/45/90/−45]2S laminates. It is generally considered that the dispersions of initial stiffness and residual stiffness are dominated by the same original defects. Therefore, the PDF of residual stiffness can be derived from the PDF of initial stiffness. According to the probability theory, the CDF of residual stiffness is expressed as
where represents the CDF of residual stiffness.
By substituting Equation (9) into Equation (11), the correlation between the CDF of residual stiffness and the CDF of initial stiffness is obtained.
Moreover, the PDF of residual stiffness is obtained by a derivation of Equation (12).
where represents the PDF of residual stiffness; represents the PDF of initial stiffness, which can be formulated as
According to Equation (13) and Table 4 and Table 7, the evolution rule of the PDF of residual stiffness is determined, as shown in Figure 8.
In Figure 8, when the cycle ratios are equal to 0.2, 0.4, 0.6 and 0.8, the corresponding PDF curves of residual stiffness are shown in the red, green, blue and magenta curves, respectively. Similarly, the red, green, blue and magenta circle points represent the corresponding residual stiffness data under different cycle ratios. Note from Figure 8 that the PDF curve changes with the cycle ratio, and the proposed probabilistic model of residual stiffness (i.e., Equation (13)) can well fit the residual stiffness data of the Gr/PEEK [0/45/90/−45]2S laminates. In addition, the residual stiffness is a random variable under a given cycle ratio.
4. Effective Stress Growth and Critical Stiffness Increase
Fatigue damage accumulation will not only cause the degradation of material performance but also lead to an increase in effective stress and critical stiffness. In this section, the effective stress growth mechanism and its influence on critical stiffness are elaborated.
4.1. Effective Stress Growth Caused by Fatigue Damage
As mentioned above, accumulated fatigue damage not only causes the degradation of material performance but also leads to the growth of effective stress [25,44]. However, the increase in effective stress caused by fatigue damage accumulation is usually ignored in the existing studies. In this section, the effective stress growth mechanism is elaborated from the perspective of the effective bearing area, as shown in Figure 9.
In Figure 9, the cylinder represents a specimen subjected to the axial tension–tension loading. The area of the blue circle represents the initial bearing area of the specimen, denoted as . The red crescent-shaped area indicates the development of fatigue damage, and it grows with the cycle ratio; is the effective bearing area of the specimen when the cycle ratio equals . Similarly, and are the corresponding effective stress and accumulated fatigue damage, respectively. Note from Figure 9 that fatigue damage of the specimen accumulates with the increase in the cycle ratio. The effective bearing area of the specimen gradually decreases with the development of fatigue damage. Under such circumstances, the effective stress grows with the decrease in the effective bearing area. The following will explain the effective stress growth mechanism from the perspective of theoretical derivation.
The effective bearing area of a composite material gradually decreases with the accumulation of fatigue damage, which results in a decreased ability to resist fatigue failure. Therefore, the fatigue damage of a composite material can also be formulated as
where represents the fatigue damage when the cycle ratio equals , is the corresponding effective bearing area and is the initial bearing area of a composite material.
According to the principle of material mechanics, the nominal stress experienced by a material before fatigue damage occurs can be expressed as
where is the nominal stress; is the axial tensile load.
The effective stress refers to the stress calculated over the effective bearing area of a material. Figure 9 shows that the effective bearing area gradually decreases with the development of fatigue damage. Under such circumstance, the effective stress experienced by a material can be formulated as
where is the effective stress when the cycle ratio equals .
Based on Equations (15)–(17), the effective stress can be rewritten as
Equation (18) illustrates the correlation between effective stress and fatigue damage . Note from Equation (18) that the effective stress grows with the increase in fatigue damage, which is consistent with the conclusion in Figure 9.
4.2. Critical Stiffness Increase Caused by Fatigue Damage
Fatigue damage accumulation not only causes the growth of effective stress but also results in an increase in critical stiffness. However, the existing studies usually take the critical stiffness as a constant, and its increase caused by accumulated fatigue damage is ignored [19,26]. In this section, the increase mechanism of critical stiffness is elaborated from the perspective of effective stress.
According to Ref. [38], the relationship between the static strength and ultimate strain of a composite material can be approximately expressed as
where is the static strength (namely initial strength), is the modulus of elasticity (namely initial stiffness) and is the ultimate strain.
The stiffness of a composite material degrades with the accumulation of fatigue damage, and fatigue failure occurs when residual stiffness falls to its critical value (namely critical stiffness). According to the principle of strain equivalence introduced by Lemaitre [45], the relationship between effective stress and critical stiffness can be formulated as
where is the critical stiffness (namely failure threshold) of a composite material, which changes with the cycle ratio .
Based on Equations (19) and (20), the critical stiffness of a composite material can be rewritten in the following form.
Note from Equation (21) that the critical stiffness of a composite material varies with the effective stress. By substituting Equation (18) into Equation (21), the correlation between critical stiffness and fatigue damage is derived, as shown in Equation (22).
In Equation (22), the nominal stress , the initial strength and initial stiffness are all constants. Therefore, the critical stiffness of a composite material increases with the accumulation of fatigue damage .
5. Fatigue Reliability Analysis Considering Effective Stress Growth
In engineering practice, the fatigue reliability of a composite material can be evaluated from two different perspectives [46,47,48,49]. One is the strength-based reliability approach and the other is the stiffness-based reliability approach. In this section, the disadvantages of traditional fatigue reliability models are elaborated, and two improved models for a composite material are proposed. The fatigue reliability and failure rate of the Gr/PEEK [0/45/90/−45]2S laminates are analyzed based on the proposed models. Moreover, the differences between the strength-based and stiffness-based reliability approaches are compared and discussed.
5.1. Improved Strength-Based Fatigue Reliability Model
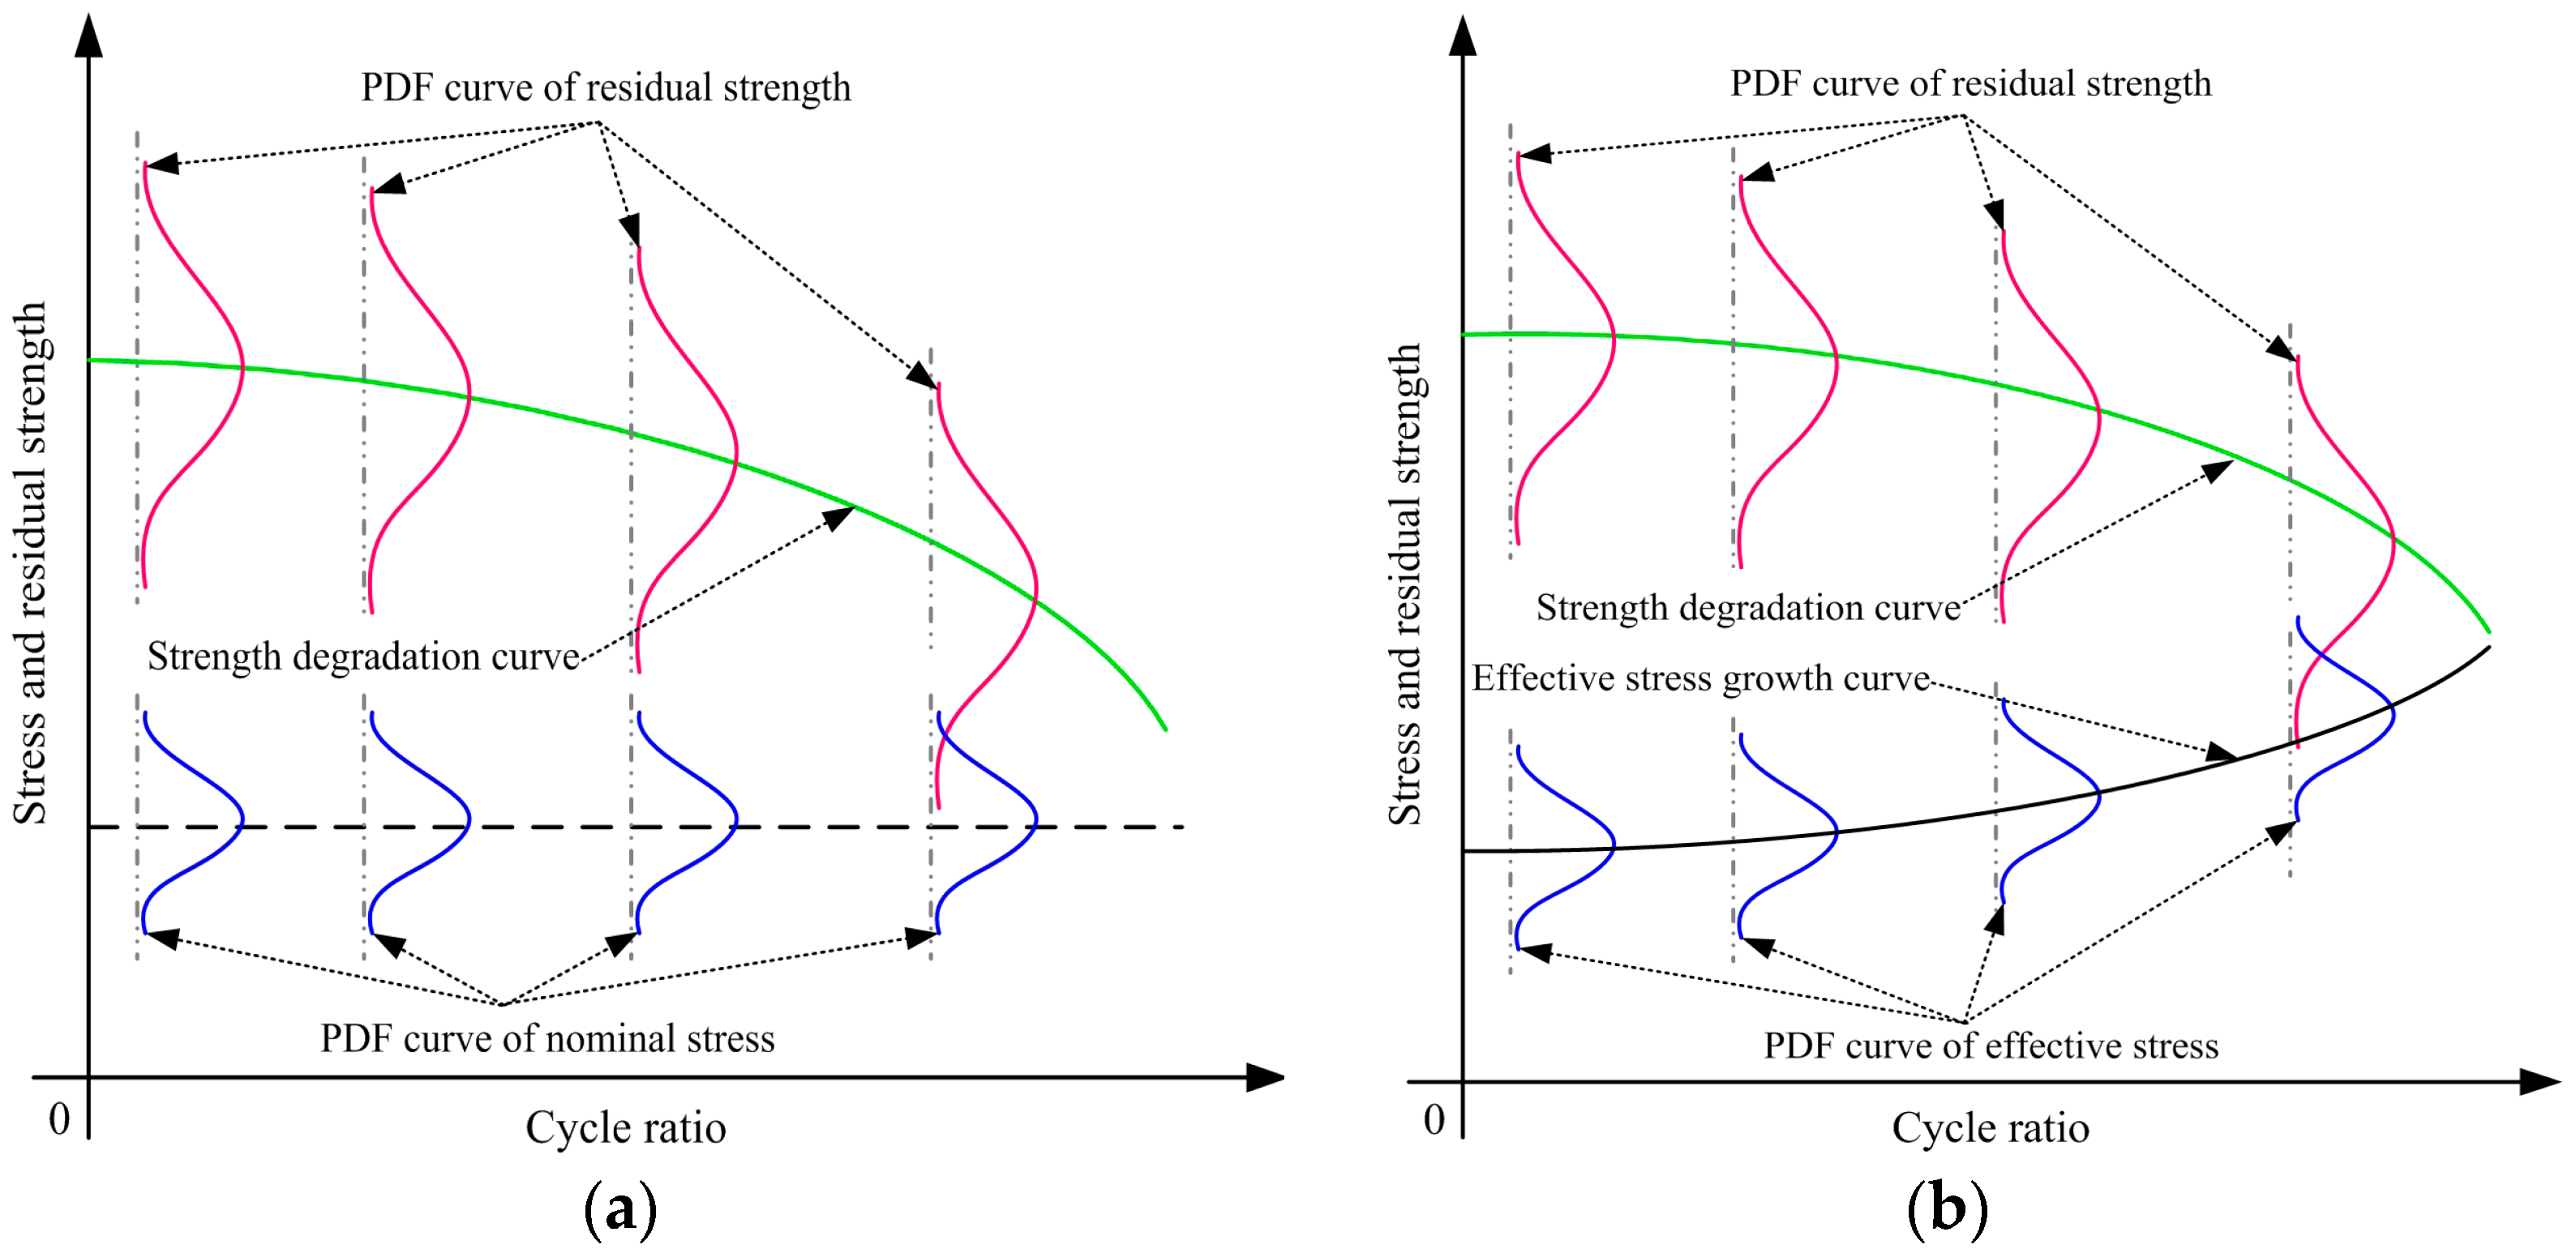
The strength-based fatigue reliability model specifically refers to the cyclic stress–residual strength interference model. Accordingly, the fatigue reliability of a composite material can be defined as the probability of residual strength being larger than the cyclic stress, as shown in Figure 10.
In Figure 10, the red curve represents the PDF of residual strength, which changes with the cycle ratio. The green curve exhibits the strength degradation rule of the composite material from the perspective of mean value. The blue curve represents the PDF of cyclic stress. The black curve in Figure 10b represents the growth path of effective stress. In the traditional model, it is generally considered that the PDF of cyclic stress (i.e., nominal stress) remains unchanged during the fatigue process, as shown in Figure 10a. As stated in Section 4.1, the effective stress grows with the accumulation of fatigue damage. Moreover, we know that fatigue damage gradually accumulates with the increase in the cycle ratio. Therefore, the PDF of cyclic stress (i.e., effective stress) varies with the cycle ratio, as shown in Figure 10b. In other words, the growth of effective stress caused by accumulated fatigue damage is ignored in the traditional model, which will lead to inaccurate results of the fatigue reliability analysis.
In the improved strength-based fatigue reliability model, the growth of effective stress caused by accumulated fatigue damage is considered. By substituting Yao’s model (i.e., Equation (1)) into Equation (18), the effective stress can be formulated as
Based on Equation (23) and the parameters listed in Table 2, the effective stress growth curve of the Gr/PEEK [0/45/90/−45]2S laminates is obtained, as shown in Figure 11.
Figure 11 shows that the effective stresses are 600.68 MPa, 623.50 MPa and 646.31 MPa, respectively, when the cycle ratio equals zero. As fatigue damage gradually accumulates in the Gr/PEEK [0/45/90/−45]2S laminates, the effective stress grows nonlinearly with the increase in the cycle ratio. In other words, the nominal stress and the effective stress are equal when there is no fatigue damage in the composite material. When fatigue damage occurs and accumulates, the effective stress is larger than the nominal stress.
In the traditional strength-based reliability model, both cyclic stress and residual strength are treated as random variables [50,51]. The difference is that the former does not change with the cycle ratio, while the latter does. According to the principle of the traditional model, the fatigue reliability of a composite material under constant amplitude cyclic stress can be expressed as
where represents the strength-based fatigue reliability model of a composite material.
In the improved strength-based reliability model, both cyclic stress and residual strength are treated as random variables that change with the cycle ratio. Under such circumstance, the fatigue reliability of a composite material under constant amplitude cyclic stress should be formulated as
According to Equations (24) and (25), the strength-based fatigue reliability curve of the Gr/PEEK [0/45/90/−45]2S laminates is plotted, as shown in Figure 12.
Note from Figure 12 that the reliability curve of the Gr/PEEK [0/45/90/−45]2S laminates presents two distinct stages. At the first stage, the reliability remains at a high level without significant changes. At the second stage, the reliability decreases rapidly, which is consistent with the ‘sudden death’ behavior of a composite material. By comparison, the calculation results of the traditional strength-based reliability model are conservative. Based on Equations (24) and (25), the strength-based failure rate model of a composite material can be expressed as Equation (26). Therefore, the corresponding failure rate curve of the Gr/PEEK [0/45/90/−45]2S laminates is obtained, as shown in Figure 13.
where is the strength-based failure rate, is the PDF of strength-based lifetime and is the CDF of strength-based lifetime.
Figure 13 shows that the strength-based failure rate curve of the Gr/PEEK [0/45/90/−45]2S laminates exhibits two distinctly different periods. For a given cycle ratio, the failure rate calculated by the improved model is higher than that calculated by the traditional model. This is because the improved model considers both effective stress growth and strength degradation, while the traditional model only considers the latter.
5.2. Improved Stiffness-Based Fatigue Reliability Model
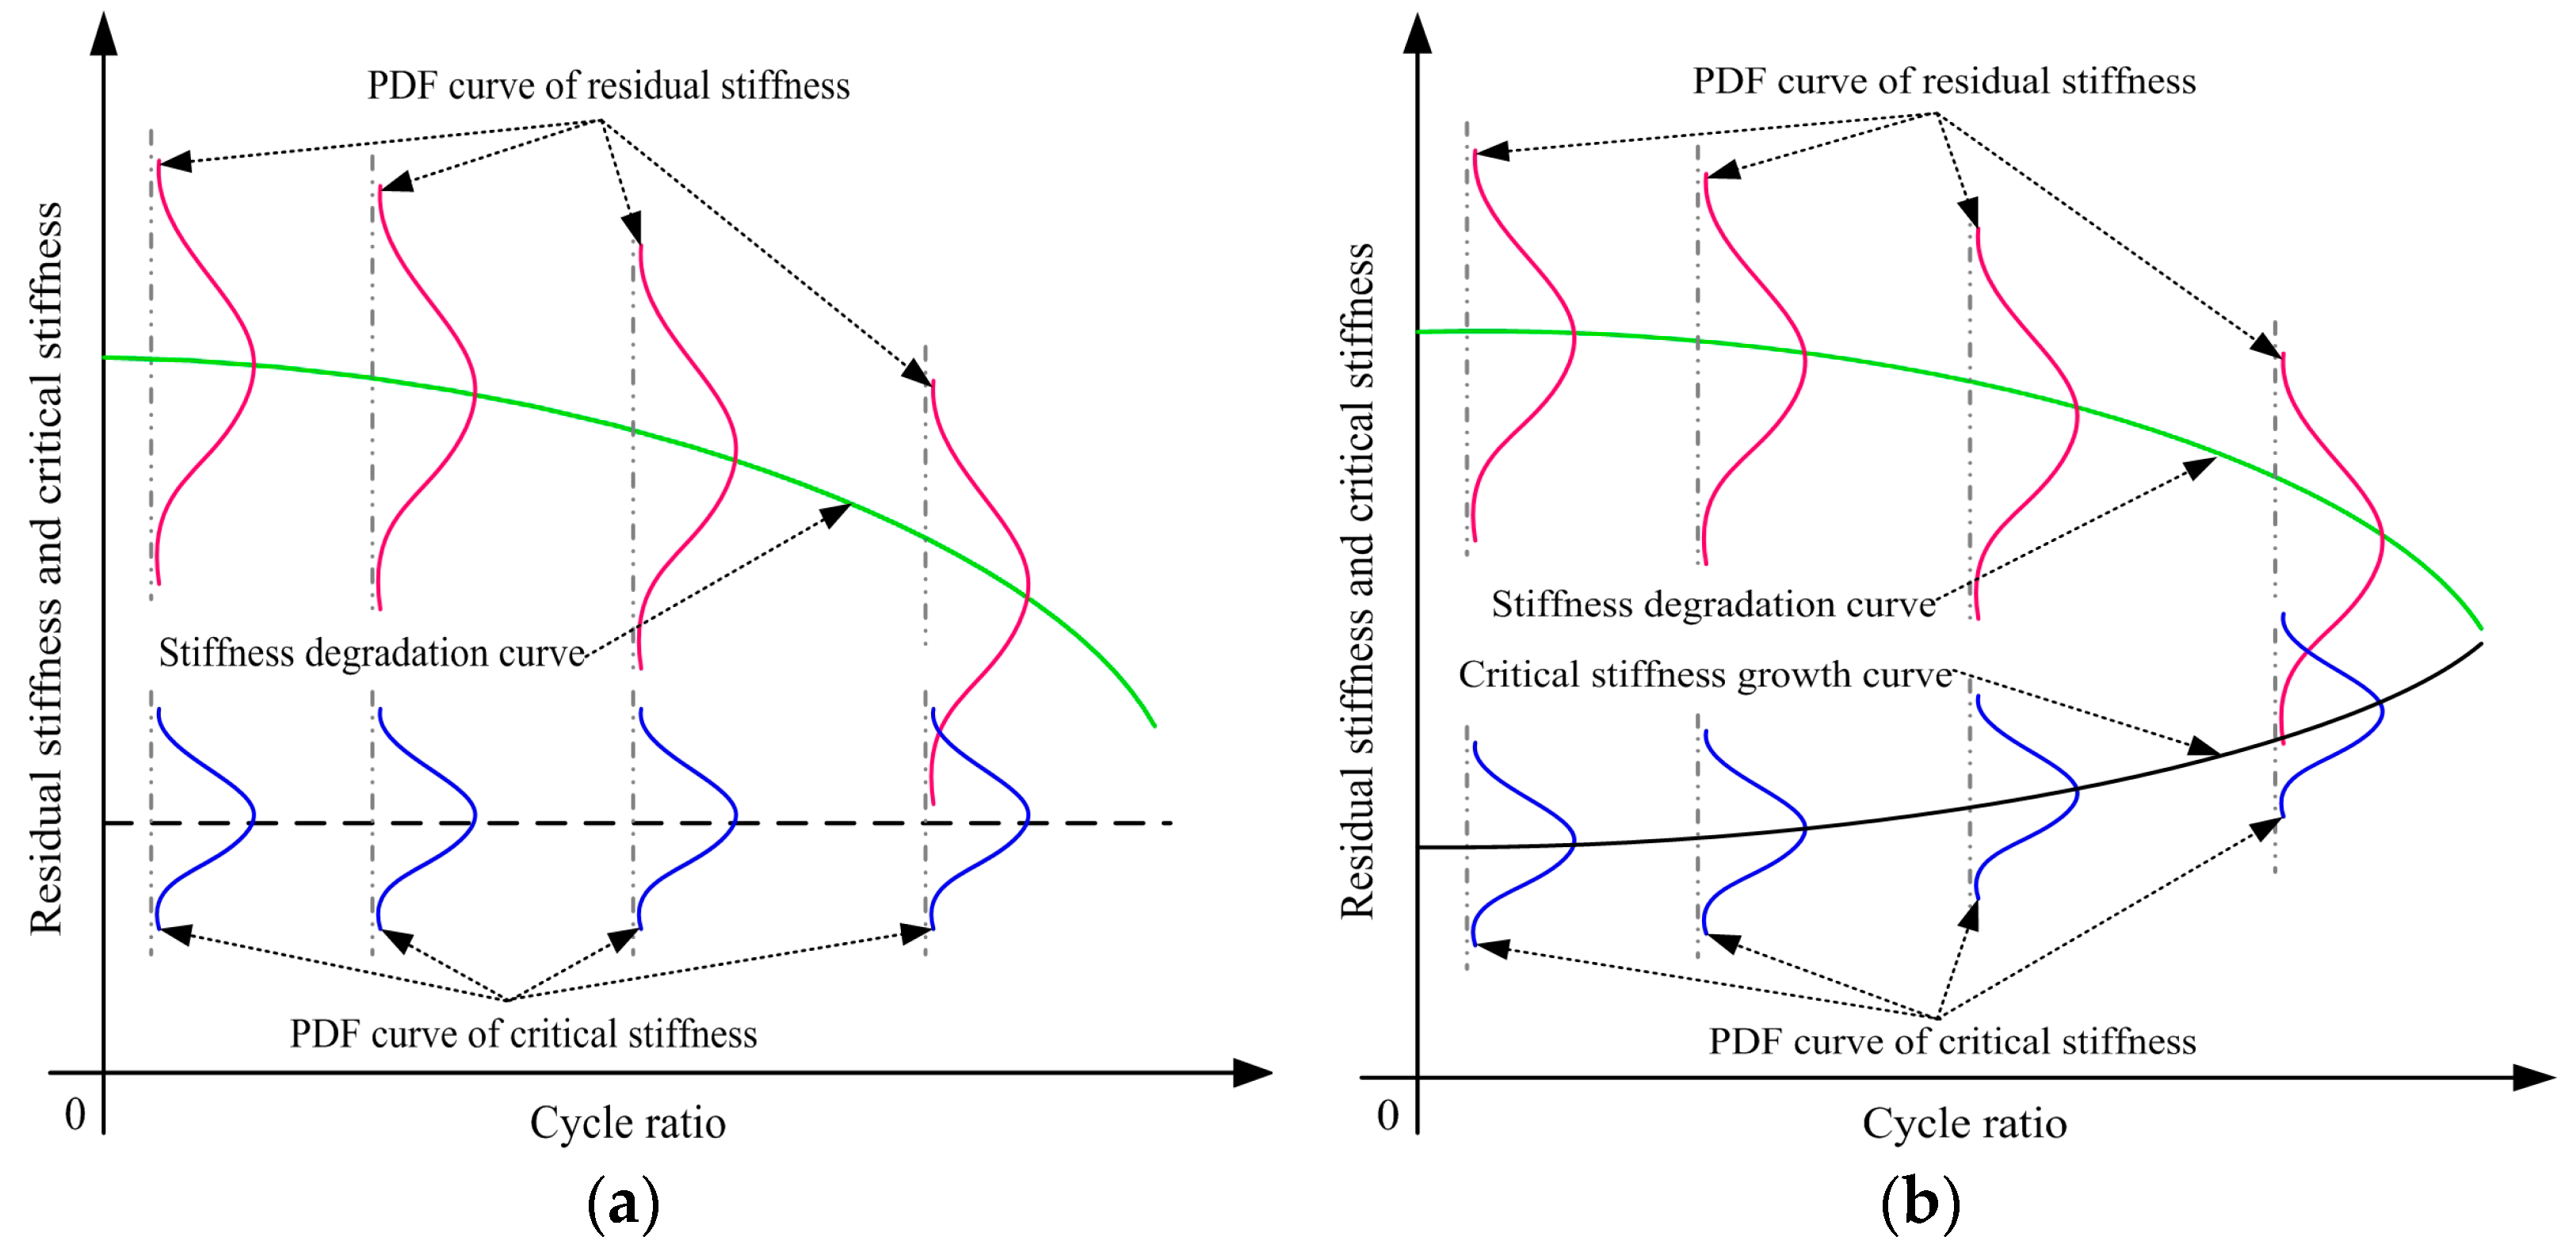
The stiffness-based fatigue reliability model specifically refers to the critical stiffness–residual stiffness interference model. Therefore, the fatigue reliability of a composite material can also be defined as the probability of residual stiffness being less than critical stiffness, as shown in Figure 14.
In Figure 14, the red curves represent the PDFs of residual stiffness under different cycle ratios. The green curve presents the stiffness degradation path of the composite material from the perspective of mean value. The blue curves represent the PDFs of critical stiffness under different cycle ratios. The black curve in Figure 14b represents the growth path of critical stiffness. For the traditional model, it is generally considered that the PDF of critical stiffness is unchanged during the fatigue process, as shown in Figure 14a. As mentioned in Section 4.2, the critical stiffness increases with the accumulation of fatigue damage. Moreover, fatigue damage is usually treated as a function of the cycle ratio. Accordingly, we can conclude that the PDF of critical stiffness changes with the cycle ratio, as shown in Figure 14b. However, the increase in critical stiffness caused by accumulated fatigue damage is always ignored in the traditional model, which will result in a large deviation of the reliability analysis results.
To overcome the disadvantages of the traditional model, the increase in critical stiffness caused by accumulated fatigue damage is considered in the improved model. By substituting Gao’s model (i.e., Equation (2)) into Equation (22), the critical stiffness of a composite material can be expressed as
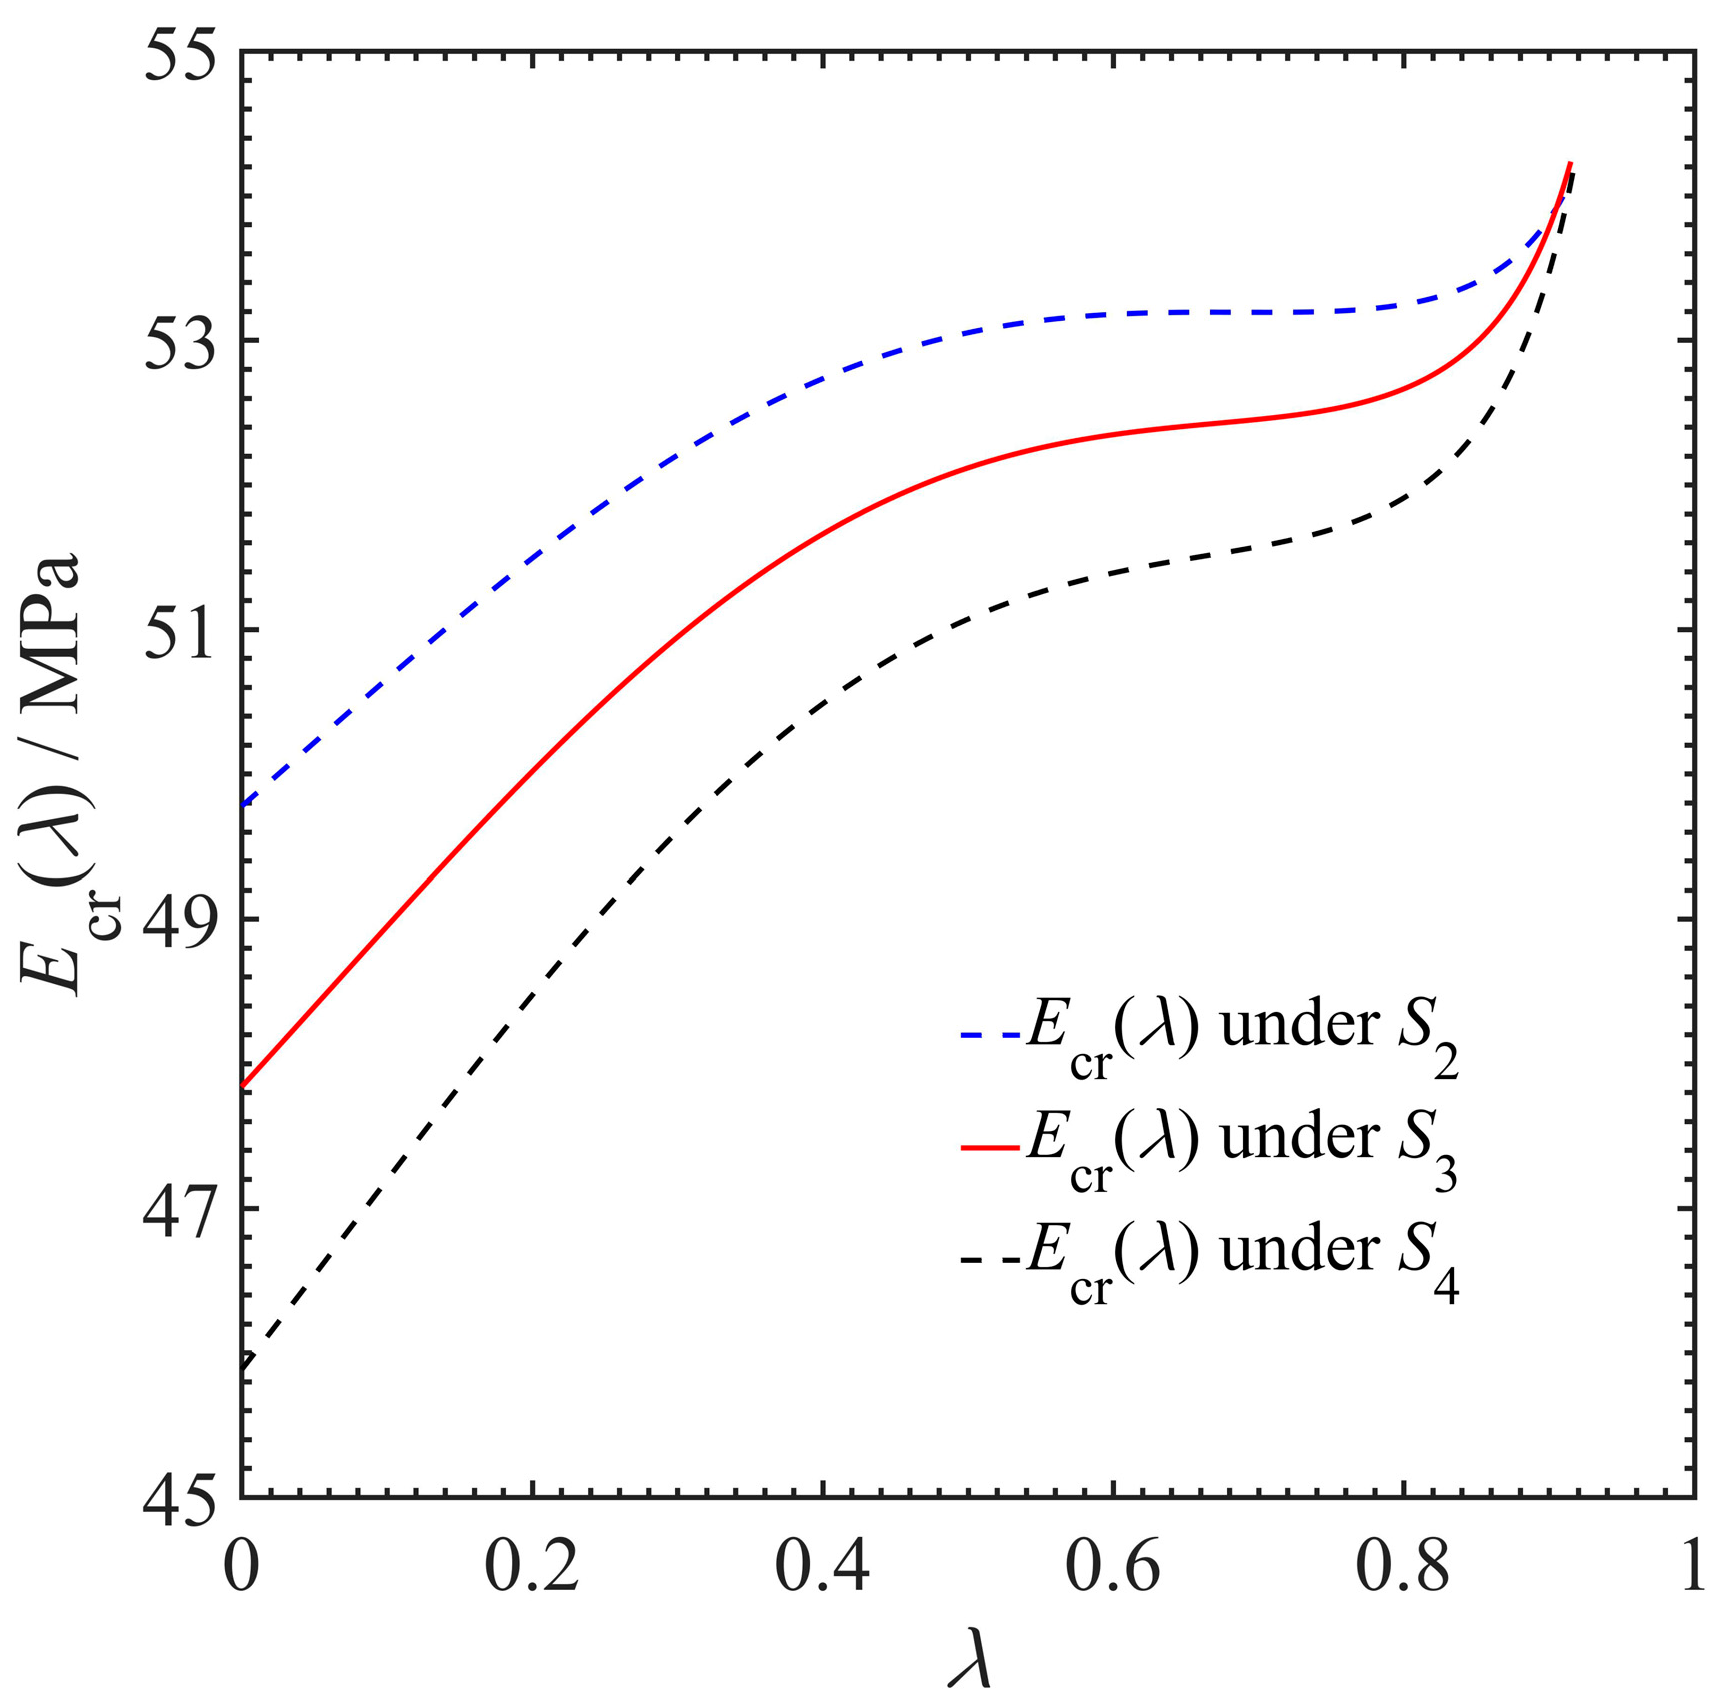
According to Equation (27) and the parameters shown in Table 4, the critical stiffness growth curve of the Gr/PEEK [0/45/90/−45]2S laminates is plotted, as shown in Figure 15.
Note from Figure 15 that the critical stiffness values are 45.88 MPa, 47.84 MPa and 49.78 MPa, respectively, when the cycle ratio is equal to zero. With the continuous increase in fatigue damage in the Gr/PEEK [0/45/90/−45]2S laminates, the critical stiffness grows nonlinearly with the cycle ratio. Therefore, the traditional method holds that the critical stiffness remains unchanged, which is inconsistent with the actual situation.
In the traditional stiffness-based reliability model, both critical stiffness and residual stiffness are regarded as random variables. The difference is that the former does not change with the cycle ratio, while the latter does. Based on the principle of the traditional model, the fatigue reliability of a composite material under constant amplitude cyclic stress can be formulated as
where represents the stiffness-based fatigue reliability model of a composite material.
In the improved stiffness-based reliability model, both critical stiffness and residual stiffness are considered as random variables that change with the cycle ratio. Under such circumstance, the fatigue reliability of a composite material under constant amplitude cyclic stress should be expressed as
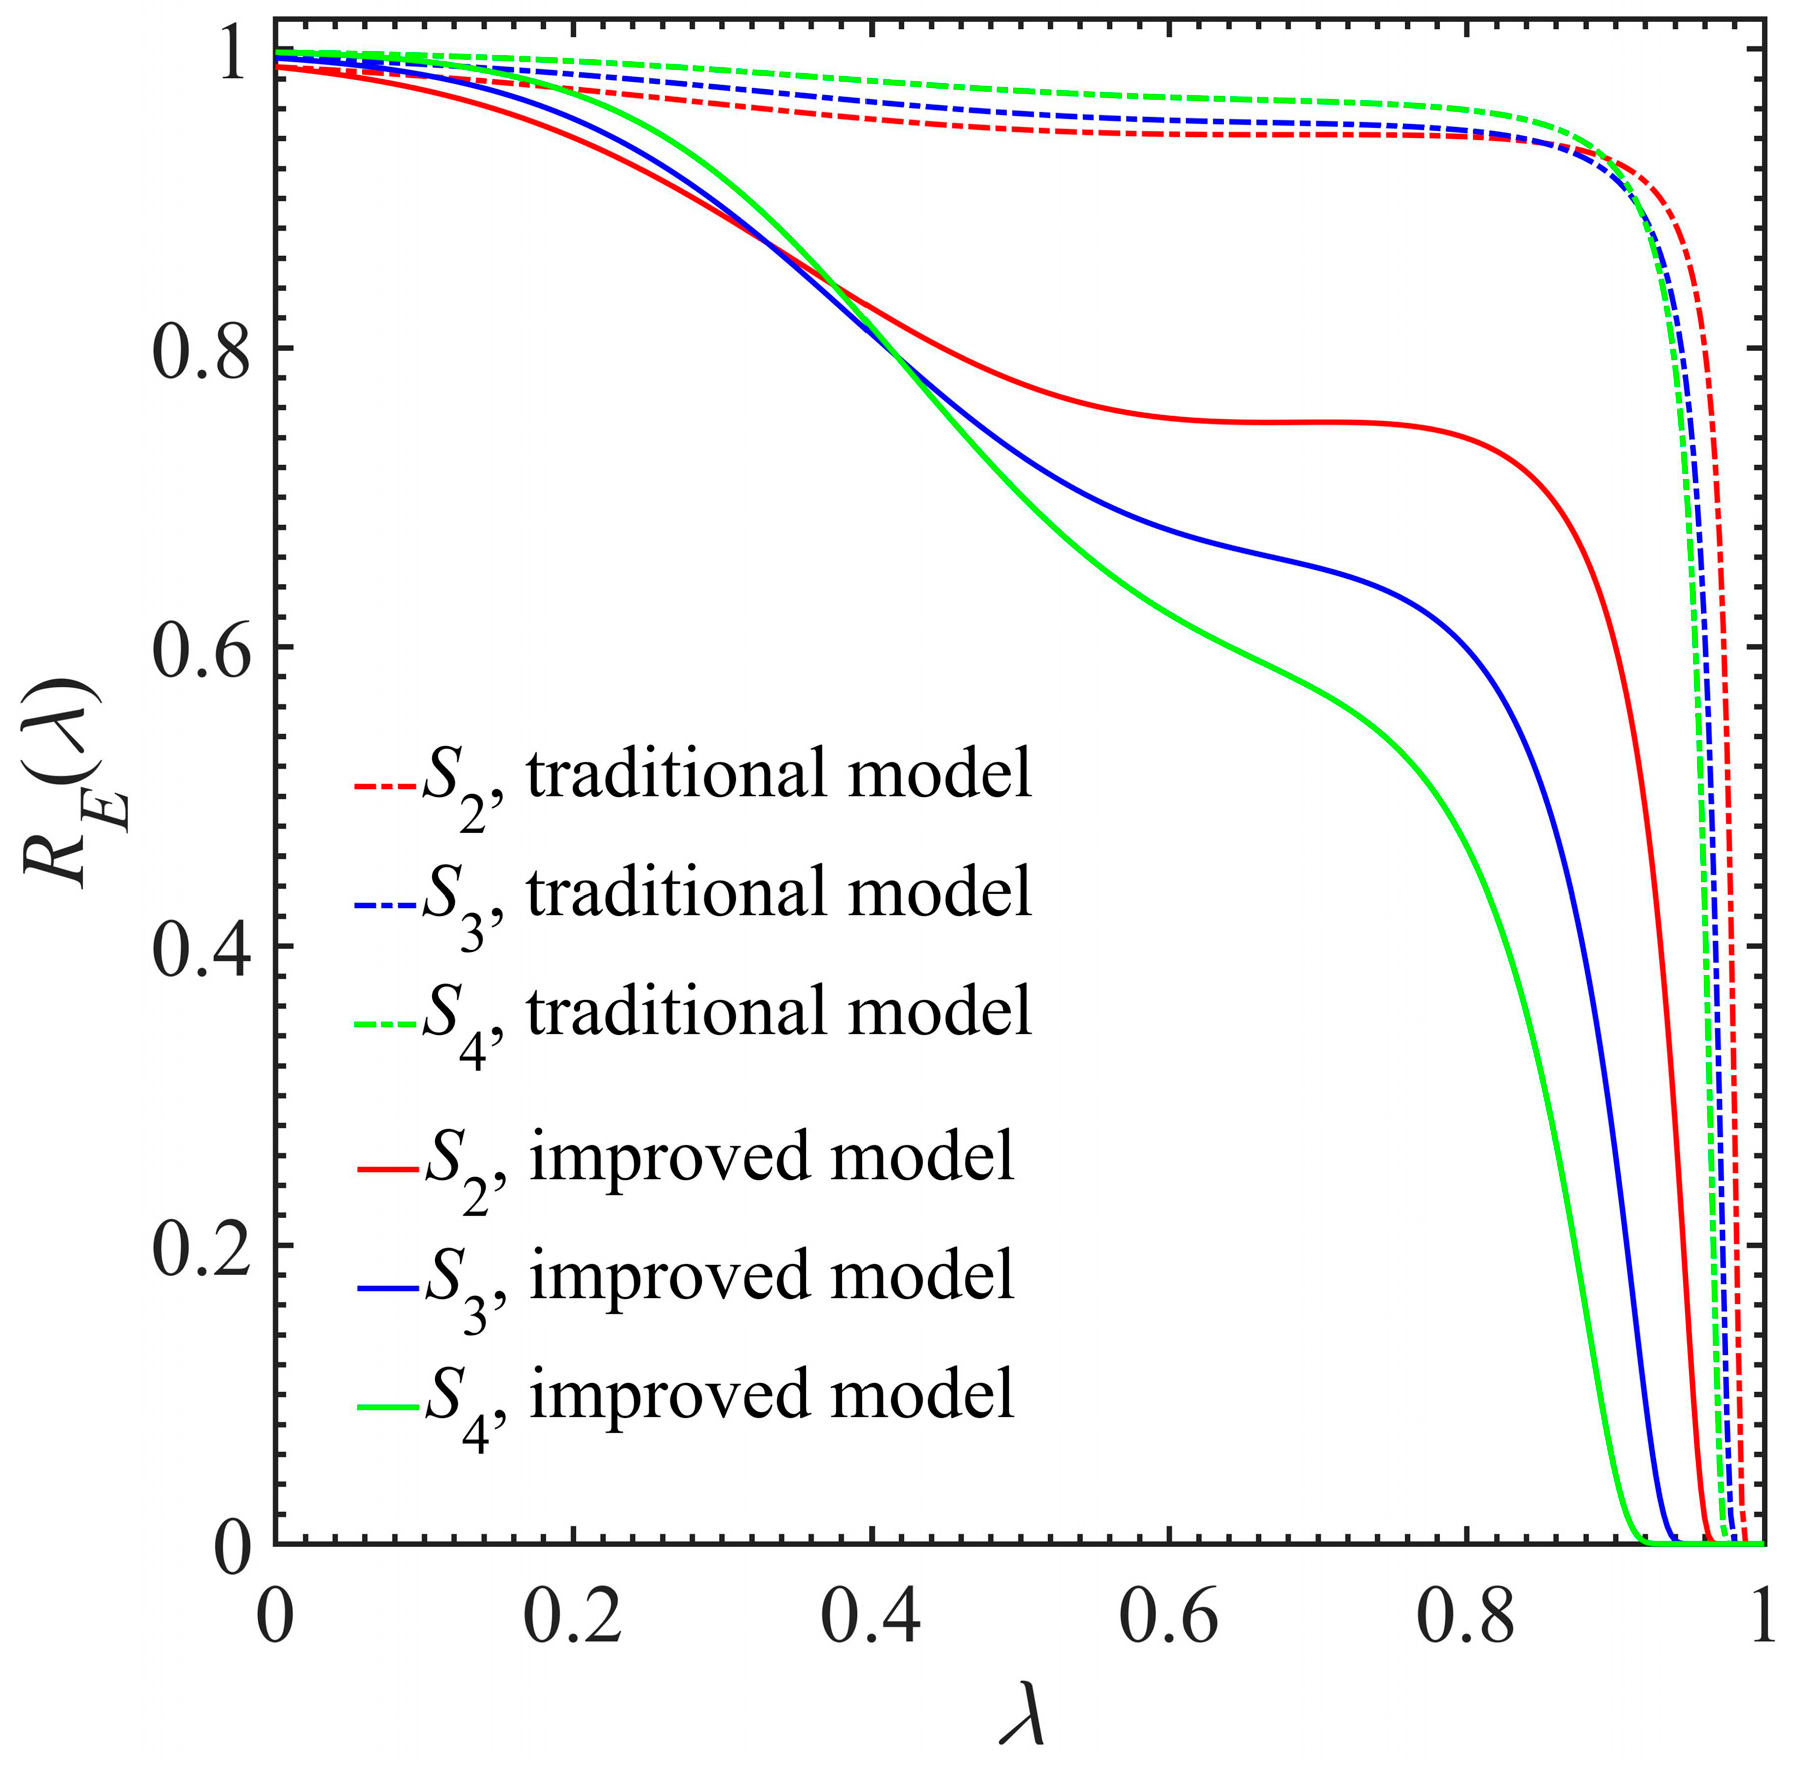
Based on Equations (28) and (29), the stiffness-based fatigue reliability curve of the Gr/PEEK [0/45/90/−45]2S laminates is obtained, as shown in Figure 16.
Figure 16 shows that the reliability curve based on the traditional model presents a slow–fast trend with the increase in the cycle ratio. By comparison, the reliability curve based on the improved model exhibits three distinct stages. The reliability decreases quickly at the first stage, and then it remains at a stable level without significant change and finally drops rapidly. This phenomenon is consistent with the development of stiffness-based fatigue damage. Compared with the improved model, the calculation results of the traditional model are conservative.
According to Equations (28) and (29), the stiffness-based failure rate model of a composite material can be formulated as Equation (30). Accordingly, the failure rate curve of the Gr/PEEK [0/45/90/−45]2S laminates is plotted, as shown in Figure 17.
where is the stiffness-based failure rate, is the PDF of stiffness-based lifetime and is the CDF of stiffness-based lifetime.
Note from Figure 17 that the stiffness-based failure rate curve of the Gr/PEEK [0/45/90/−45]2S laminates is similar to but different than the bathtub shape. For a specific cycle ratio, the failure rate calculated by the improved model is higher than that calculated by the traditional model. This is because the improved model considers both critical stiffness growth and stiffness degradation, while the traditional model only considers the latter.
5.3. Comparison between Different Reliability Analysis Approaches
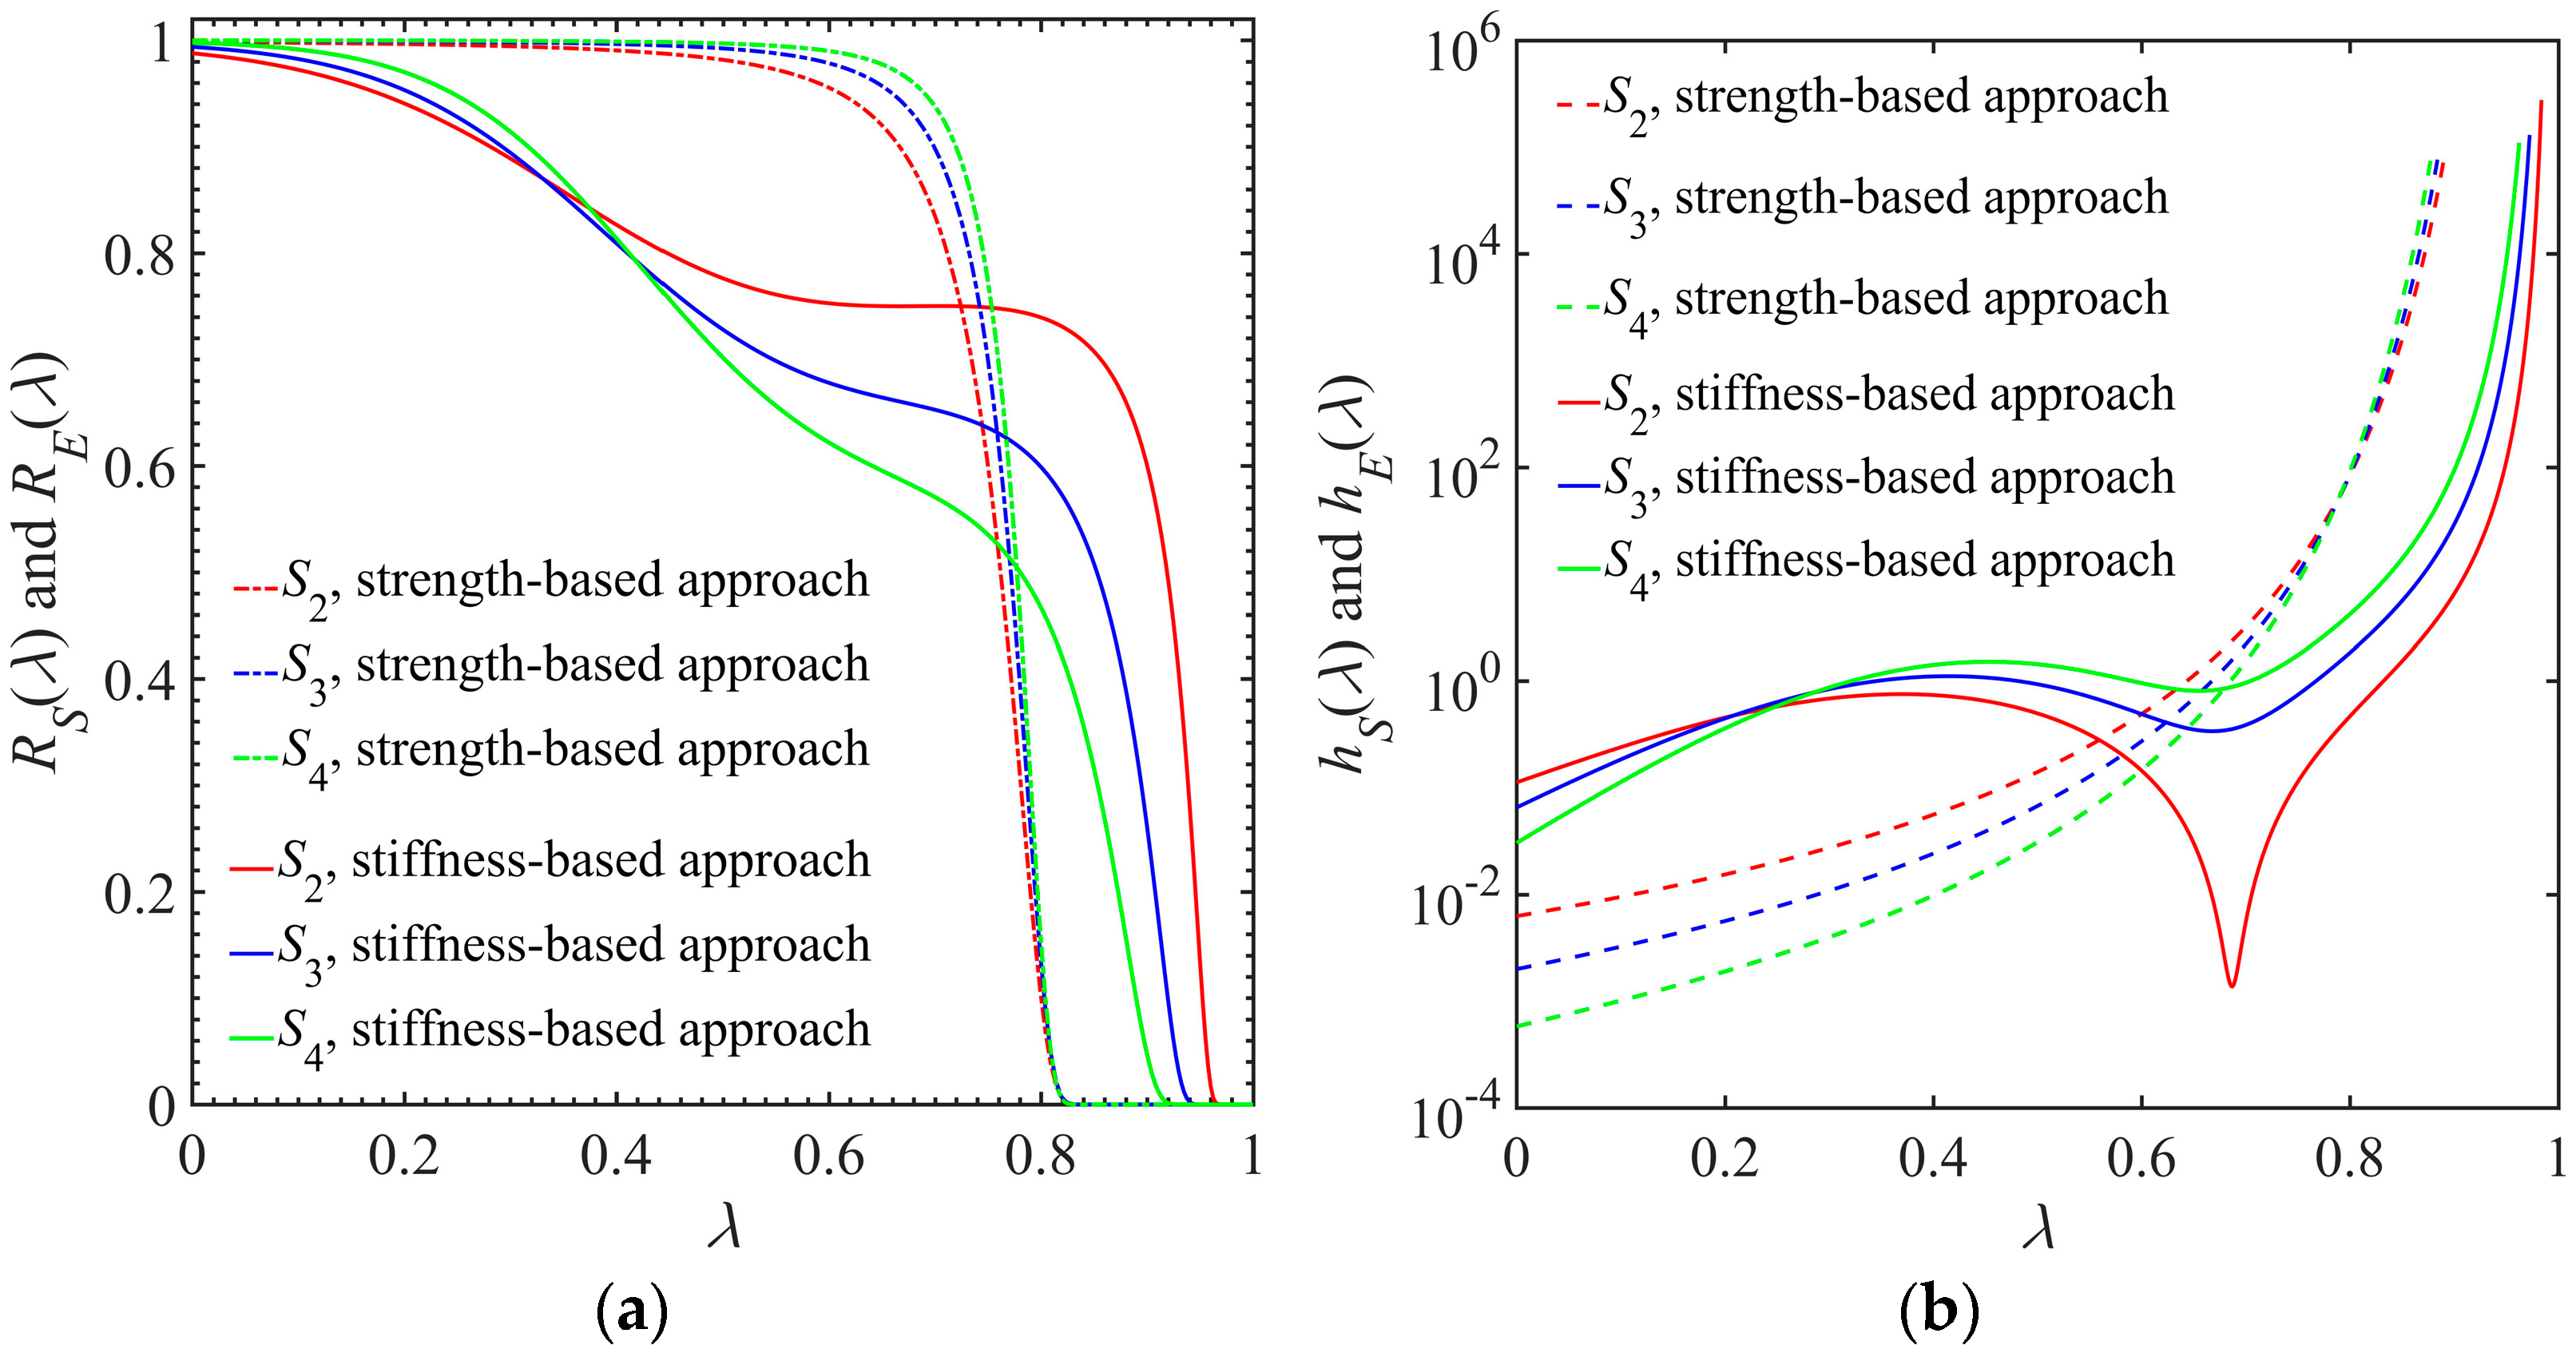
In engineering practice, the fatigue reliability of a composite material can be evaluated from two perspectives. One is the strength-based approach and the other is the stiffness-based approach. In this section, the differences between these two approaches are compared, as shown in Figure 18.
Figure 18 shows that the fatigue reliability and failure rate curves of these two approaches are significantly different. The strength-based fatigue reliability curve presents two distinct stages, while the stiffness-based fatigue reliability curve has three different stages, as shown in Figure 18a. In addition, the strength-based fatigue reliability is higher than the stiffness-based fatigue reliability when the cycle ratio is , while the former is less than the latter when . Note from Figure 18b that the strength-based failure rate curve shows a monotonic growth trend, while the stiffness-based failure rate curve is similar to but different than the bathtub shape. Moreover, the strength-based failure rate is less than the stiffness-based failure rate when the cycle ratio is , while the former is larger than the latter when . As a matter of fact, the strength-based approach evaluates the reliability of a composite material from the perspective of resistance to fatigue fracture, while the stiffness-based approach evaluates the reliability of a composite material from the perspective of resistance to elastic deformation.
6. Conclusions
In this paper, the growth mechanisms of effective stress and critical stiffness caused by fatigue damage accumulation are investigated, and a pair of strength-based and stiffness-based fatigue reliability models are proposed. The conclusions of this paper can be drawn as follows:
- (1)
- The fatigue damage accumulation of a composite material is quantified from the perspective of performance degradation. The fitting accuracy of some representative fatigue damage models is compared based on the fatigue damage data of Gr/PEEK [0/45/90/−45]2S laminates. Yao’s model and Gao’s model are adopted to characterize the strength-based and stiffness-based fatigue damage, respectively.
- (2)
- The Weibull distribution is applied to depict the probability distributions of initial strength and initial stiffness. A pair of probabilistic models of residual strength and residual stiffness are developed to characterize the performance degradation of a composite material. The strength and stiffness degradation data of Gr/PEEK [0/45/90/−45]2S laminates are used to verify the developed probabilistic models.
- (3)
- The effective bearing area of a composite material is treated as damage metric, and the growth mechanisms of effective stress and critical stiffness caused by fatigue damage accumulation are elaborated. A pair of strength-based and stiffness-based fatigue reliability models are proposed. The fatigue reliability and failure rate of Gr/PEEK [0/45/90/−45]2S laminates under different conditions are compared and discussed.
- (4)
- The strength degradation and stiffness degradation are dominated by the same damage state of composite materials. There is a certain correlation between these two degradation behaviors. In the future, the induced mechanisms and coupling effects between strength degradation behavior and stiffness degradation behavior will be further studied and discussed.
Author Contributions
Methodology, software, investigation, writing—review and editing, funding acquisition, J.-X.G.; formal analysis, software, original draft preparation, F.H.; investigation, writing—review and editing, supervision, Y.-P.Y.; data curation, writing—original draft preparation, Y.-Y.L. All authors have read and agreed to the published version of the manuscript.
Funding
This work was supported by the National Natural Science Foundation of China (Grant No. 52065062), the Fundamental Research Funds for Universities in Xinjiang Uygur Autonomous Region (Grant No. XJEDU2023P007), the Natural Science Foundation of Xinjiang Uygur Autonomous Region (Grant No. 2020D01C056) and the Key Research and Development Program of Xinjiang Uygur Autonomous Region (Grant No. 2021B01003).
Data Availability Statement
Data sharing not applicable.
Conflicts of Interest
The authors declare no conflict of interest.
References
- Saracyakupoglu, T. Usage of additive manufacturing and topology optimization process for weight reduction studies in the aviation industry. Adv. Sci. Technol. Eng. Syst. J. 2021, 6, 815–820. [Google Scholar] [CrossRef]
- Parveez, B.; Kittur, M.I.; Badruddin, I.A.; Kamangar, S.; Hussien, M.; Umarfarooq, M.A. Scientific advancements in composite materials for aircraft applications: A review. Polymers 2022, 14, 5007. [Google Scholar] [CrossRef]
- Towsyfyan, H.; Biguri, A.; Boardman, R.; Blumensath, T. Successes and challenges in non-destructive testing of aircraft composite structures. Chin. J. Aeronaut. 2020, 33, 771–791. [Google Scholar] [CrossRef]
- Liao, D.; Zhu, S.P.; Keshtegar, B.; Qian, G.; Wang, Q.Y. Probabilistic framework for fatigue life assessment of notched components under size effects. Int. J. Mech. Sci. 2020, 181, 105685. [Google Scholar] [CrossRef]
- Li, H.; Soares, C.G. Assessment of failure rates and reliability of floating offshore wind turbines. Reliab. Eng. Syst. Saf. 2022, 228, 108777. [Google Scholar] [CrossRef]
- Li, X.Q.; Song, L.K.; Bai, G.C. Recent advances in reliability analysis of aeroengine rotor system: A review. Int. J. Struct. Integr. 2022, 13, 1–29. [Google Scholar] [CrossRef]
- Larsson, T.S.; Rönnbäck, A.; Vanhatalo, E. Integrating mixture experiments and six sigma methodology to improve fibre-reinforced polymer composites. Qual. Reliab. Eng. Int. 2022, 38, 2233–2254. [Google Scholar] [CrossRef]
- Zhu, S.P.; Liu, Q.; Peng, W.; Zhang, X.C. Computational-experimental approaches for fatigue reliability assessment of turbine bladed disks. Int. J. Mech. Sci. 2018, 142–143, 502–517. [Google Scholar] [CrossRef]
- Teng, D.; Feng, Y.W.; Chen, J.Y.; Lu, C. Structural dynamic reliability analysis: Review and prospects. Int. J. Struct. Integr. 2022, 13, 753–783. [Google Scholar] [CrossRef]
- Li, X.K.; Zhu, S.P.; Liao, D.; Correia, J.A.F.O.; Berto, F.; Wang, Q.Y. Probabilistic fatigue modelling of metallic materials under notch and size effect using the weakest link theory. Int. J. Fatigue 2022, 159, 106788. [Google Scholar] [CrossRef]
- Crane, R.; Dillingham, G.; Oakley, B. Progress in the reliability of bonded composite structures. Appl. Compos. Mater. 2017, 24, 221–233. [Google Scholar] [CrossRef]
- Solazzi, L.; Vaccari, M. Reliability design of a pressure vessel made of composite materials. Compos. Struct. 2022, 279, 114726. [Google Scholar] [CrossRef]
- Fei, C.W.; Li, H.; Lu, C.; Han, L.; Keshtegar, B.; Taylan, O. Vectorial surrogate modeling method for multi-objective reliability design. Appl. Math. Model. 2022, 109, 1–20. [Google Scholar] [CrossRef]
- Zaharia, S.M.; Pop, M.A.; Udroiu, R. Reliability and lifetime assessment of glider wing’s composite spar through accelerated fatigue life testing. Materials 2020, 13, 2310. [Google Scholar] [CrossRef]
- Zhang, C.Z.; Chen, H.P.; Tee, K.F.; Liang, D.F. Reliability-based lifetime fatigue damage assessment of offshore composite wind turbine blades. J. Aerosp. Eng. 2021, 34, 4021019.1–4021019.11. [Google Scholar] [CrossRef]
- Talreja, R. A mechanisms-based reliability model for fatigue of composite laminates. Z. Angew. Math. Mech.-J. Appl. Math. Mech. 2015, 95, 1058–1066. [Google Scholar] [CrossRef]
- Cheng, H.C.; Hwu, F.S. Fatigue reliability analysis of composites based on residual strength. Adv. Compos. Mater. 2008, 15, 385–402. [Google Scholar] [CrossRef]
- Chen, C.L.; Tsai, Y.T.; Wang, K.S. Characteristics of reliability-dependent hazard rate for composites under fatigue loading. J. Mech. Eng. 2009, 25, 195–203. [Google Scholar] [CrossRef]
- Gao, J.X.; Zhu, P.N.; Yuan, Y.P.; Wu, Z.F.; Xu, R.X. Strength and stiffness degradation modeling and fatigue life prediction of composite materials based on a unified fatigue damage model. Eng. Fail. Anal. 2022, 137, 106290. [Google Scholar] [CrossRef]
- Ma, H.D.; Ma, Q.; Bai, X.Z.; Xu, J.L.; An, Z.W. A material property degradation model of composite laminates considering stress level. Mech. Adv. Mater. Struct. 2023, 30, 272–283. [Google Scholar] [CrossRef]
- Feng, Y.; He, Y.T.; Gao, C. TT fatigue behaviors of composite T800/MTM46 cross-ply laminate and reliability analysis on fatigue life. Adv. Mech. Eng. 2017, 9, 1–14. [Google Scholar] [CrossRef]
- Häusler, S.; Fink, R.; Benz, C.; Sander, M. An investigation of the residual stiffness of a glass fibre reinforced composite in high cycle fatigue experiments. Procedia Struct. 2022, 38, 230–237. [Google Scholar] [CrossRef]
- Wang, X.J.; Ma, Y.J.; Wang, L.; Geng, X.Y.; Wu, D. Composite laminate oriented reliability analysis for fatigue life under non-probabilistic time-dependent method. Comput. Methods Appl. Mech. Eng. 2017, 326, 1–19. [Google Scholar] [CrossRef]
- Wu, Z.W.; Fang, G.D.; Fu, M.Q.; Chen, X.J.; Liang, J.; Lv, D.K. Random fatigue damage accumulation analysis of composite thin-wall structures based on residual stiffness method. Compos. Struct. 2019, 211, 546–556. [Google Scholar] [CrossRef]
- Van Paepegem, W.; Degrieck, J. A new coupled approach of residual stiffness and strength for fatigue of fibre-reinforced composites. Int. J. Fatigue 2002, 24, 747–762. [Google Scholar] [CrossRef]
- Gao, J.X.; Yuan, Y.P. Probabilistic modeling of stiffness degradation for fiber reinforced polymer under fatigue loading. Eng. Fail. Anal. 2020, 116, 104733. [Google Scholar] [CrossRef]
- Shiri, S.; Yazdani, M.; Pourgol-Mohammad, M. A fatigue damage accumulation model based on stiffness degradation of composite materials. Mater. Des. 2015, 88, 1290–1295. [Google Scholar] [CrossRef]
- Hu, Y.N.; Wu, S.C.; Xie, C.; Wu, W.W.; Zhang, J. Fatigue life evaluation of Ti–6Al–4V welded joints manufactured by electron beam melting. Fatigue Fract. Eng. Mater. Struct. 2021, 44, 2210–2221. [Google Scholar] [CrossRef]
- Li, X.Q.; Song, L.K.; Bai, G.C. Physics-informed distributed modeling for CCF reliability evaluation of aeroengine rotor systems. Int. J. Fatigue 2023, 167, 107342. [Google Scholar] [CrossRef]
- Li, H.; Diaz, H.; Soares, C.G. A developed failure mode and effect analysis for floating offshore wind turbine support structures. Renew. Energ. 2021, 164, 133–145. [Google Scholar] [CrossRef]
- Shi, B.K.; Deng, Z.M.; Tan, L.S.; Zhao, Y.L.; Zhang, X.J. Micromechanics-based reliability analysis method for laminated composite structures. Mech. Adv. Mater. Struct. 2020, 28, 2096–2113. [Google Scholar] [CrossRef]
- Niu, X.P.; Zhu, S.P.; He, J.C.; Liao, D.; Correia, J.A.F.O.; Berto, F.; Wang, Q.Y. Defect tolerant fatigue assessment of AM materials: Size effect and probabilistic prospects. Int. J. Fatigue 2022, 160, 106884. [Google Scholar] [CrossRef]
- Liu, X.T.; Liu, J.Z.; Wang, H.J.; Yang, X.B. Prediction and evaluation of fatigue life considering material parameters distribution characteristic. Int. J. Struct. Integr. 2022, 13, 309–326. [Google Scholar] [CrossRef]
- Gao, P.; Xie, L.Y. Reliability evaluation based on different distributions of random load. Sci. World J. 2013, 2013, 415327. [Google Scholar] [CrossRef] [PubMed]
- Reifsnider, K.L.; Henneke, E.G.; Stinchcomb, W.W. Damage mechanics and NDE of composite laminates. In Mechanics of Composite Materials; Hashin, Z., Herakovich, C.T., Eds.; Elsevier Press Inc.: Oxford, UK, 1983; pp. 399–420. [Google Scholar]
- Yao, W.; Himmel, N. A new cumulative fatigue damage model for fibre-reinforced plastics. Compos. Sci. Technol. 2000, 60, 59–64. [Google Scholar] [CrossRef]
- Mu, P.G.; Wan, X.P.; Zhao, M.Y. A new pair of cumulative fatigue damage models for composite materials. Adv. Mater. Res. 2011, 160–162, 226–230. [Google Scholar] [CrossRef]
- Hwu, F.S. Study on Fatigue Reliability of Quasi-homogeneous Gr/PEEK Composite Laminate under Variable Load. Ph.D. Thesis, National Taiwan University, Taipei, Taiwan, 2000. (In Chinese). [Google Scholar]
- Mao, H.; Mahadevan, S. Fatigue damage modelling of composite materials. Compos. Struct. 2002, 58, 405–410. [Google Scholar] [CrossRef]
- Guo, J.Y.; Li, Y.F.; Peng, W.W.; Huang, H.Z. Bayesian information fusion method for reliability analysis with failure-time data and degradation data. Qual. Reliab. 2022, 38, 1944–1956. [Google Scholar] [CrossRef]
- Li, H.; Huang, C.G.; Soares, C.G. A real-time inspection and opportunistic maintenance strategies for floating offshore wind turbines. Ocean Eng. 2022, 256, 111433. [Google Scholar] [CrossRef]
- Li, H.; Soares, C.G.; Huang, H.Z. Reliability analysis of a floating offshore wind turbine using Bayesian Networks. Ocean Eng. 2020, 217, 107827. [Google Scholar] [CrossRef]
- Chou, P.C.; Croman, R. Residual strength in fatigue based on strength-life equal rank assumption. J. Compos. Mater. 1978, 12, 177–194. [Google Scholar] [CrossRef]
- He, J.C.; Zhu, S.P.; Luo, C.; Niu, X.; Wang, Q.Y. Size effect in fatigue modelling of defective materials: Application of the calibrated weakest-link theory. Int. J. Fatigue 2022, 165, 107213. [Google Scholar] [CrossRef]
- Lemaitre, J. Evaluation of dissipation and damage in metals, submitted to dynamic loading. In Proceedings of the Conference lnternationale sur Ie Comportement Mecanique des Materiaux, Kyoto, Japan, 15–20 August 1971. [Google Scholar]
- Shi, B.K.; Deng, Z.M. Multiscale reliability analysis of composite structures based on computer vision. Compos. Struct. 2022, 292, 115587. [Google Scholar] [CrossRef]
- Maurizio Gobbato, J.P.; Conte, J.B.; Kosmatka, C.R.F. A reliability-based framework for fatigue damage prognosis of composite aircraft structures. Probabilistic Eng. Mech. 2012, 29, 176–188. [Google Scholar] [CrossRef]
- Li, X.Q.; Song, L.K.; Choy, Y.S.; Bai, G.C. Multivariate ensembles-based hierarchical linkage strategy for system reliability evaluation of aeroengine cooling blades. Aerosp. Sci. Technol. 2023, 138, 108325. [Google Scholar] [CrossRef]
- Yang, L.; Shuang, L.Z. The preliminary analysis of reliability for a composite structure with damage. Eng. Fract. Mech. 1990, 37, 1157–1163. [Google Scholar] [CrossRef]
- Li, H.; Teixeira, A.P.; Soares, C.G. A two-stage failure mode and effect analysis of an offshore wind turbine. Renew. Energ. 2020, 162, 1438–1461. [Google Scholar] [CrossRef]
- Zhang, H.; Song, L.K.; Bai, G.C. Active extremum Kriging-based multi-level linkage reliability analysis and its application in aeroengine mechanism systems. Aerosp. Sci. Technol. 2022, 131, 107968. [Google Scholar] [CrossRef]
Figure 1.
Fitting curves of strength-based fatigue damage models: (a) S = S2; (b) S = S3; (c) S = S4.
Figure 1.
Fitting curves of strength-based fatigue damage models: (a) S = S2; (b) S = S3; (c) S = S4.
Figure 2.
Fitting curves of stiffness-based fatigue damage models: (a) S = S2; (b) S = S3; (c) S = S4.
Figure 2.
Fitting curves of stiffness-based fatigue damage models: (a) S = S2; (b) S = S3; (c) S = S4.
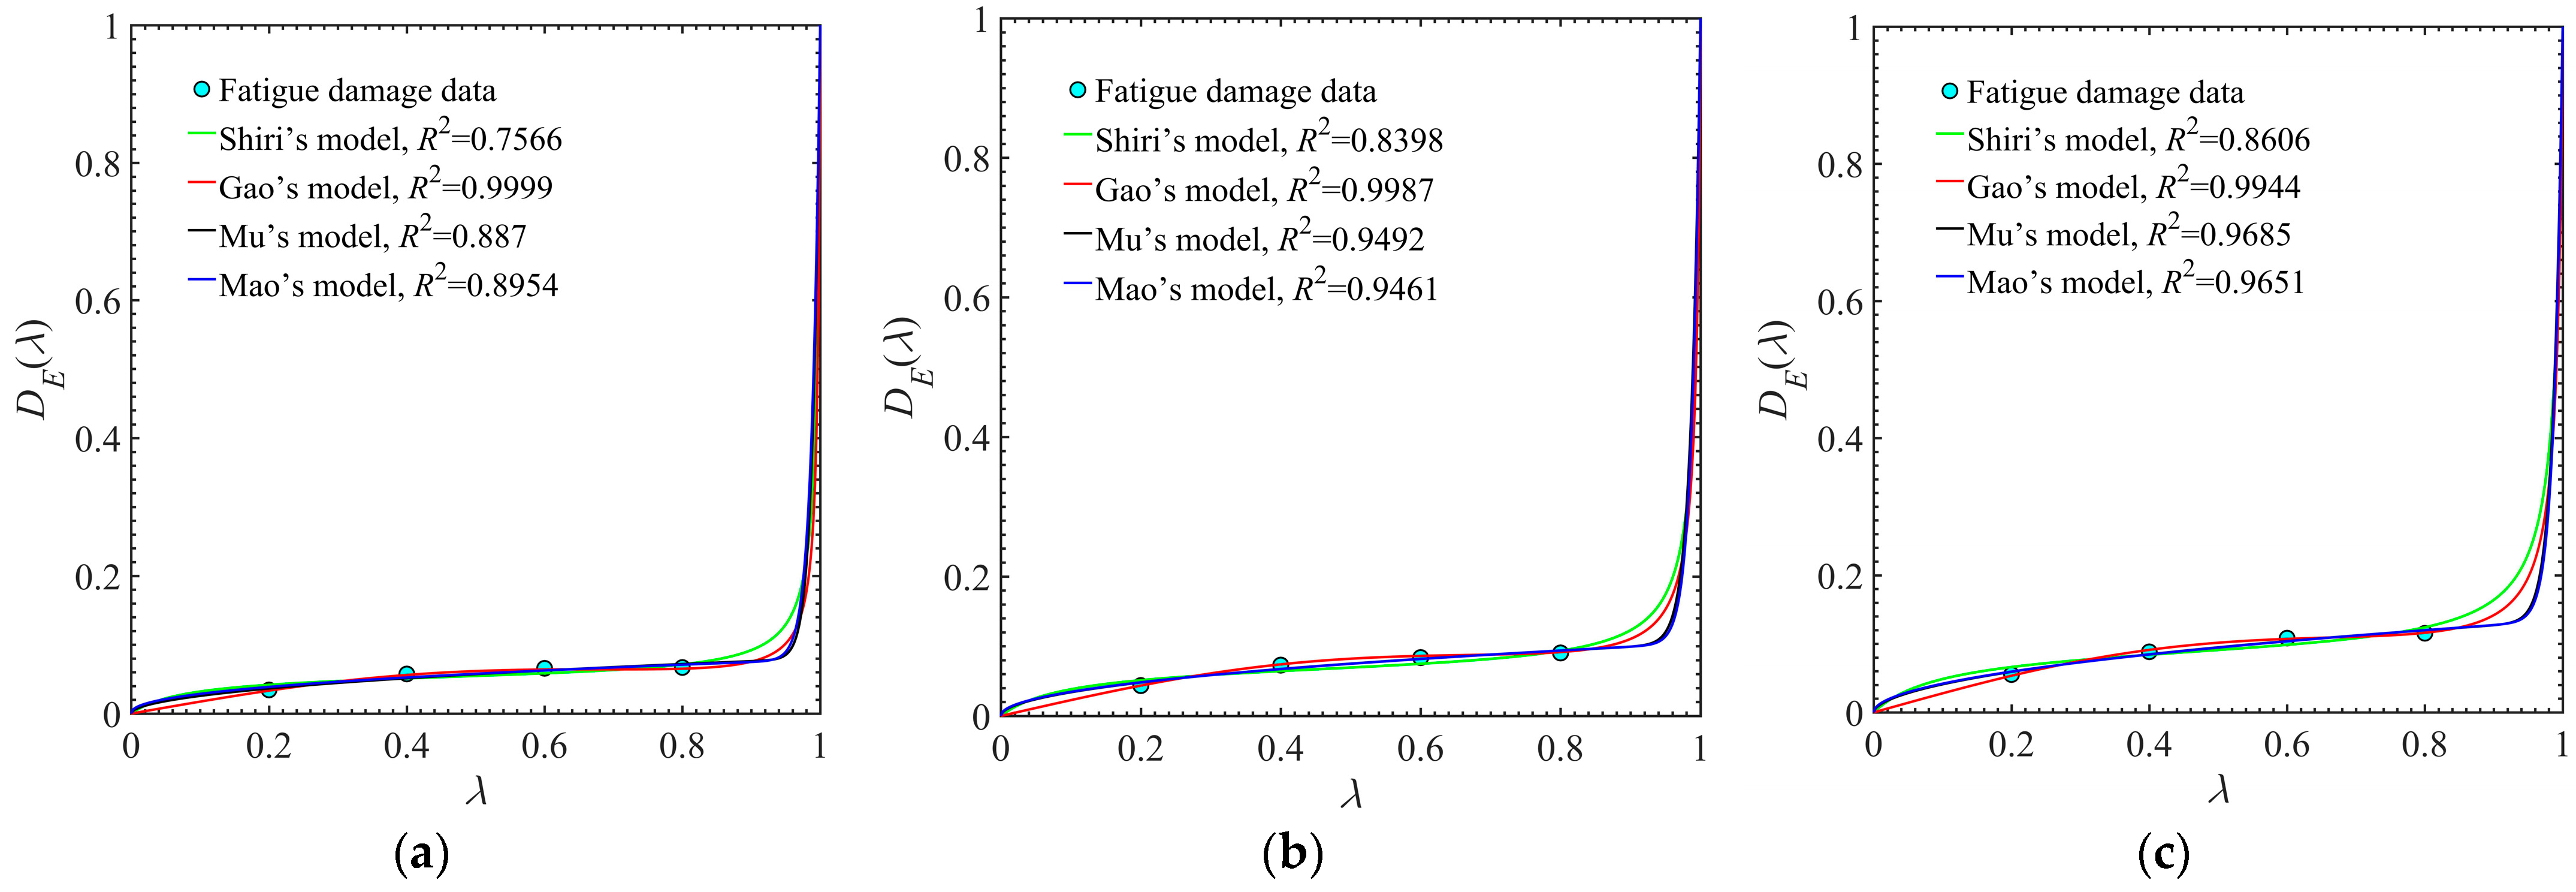
Figure 3.
Mean value curve of residual strength of Gr/PEEK [0/45/90/−45]2S laminates.
Figure 4.
Probability distribution of initial strength of Gr/PEEK [0/45/90/−45]2S laminates: (a) PDF of initial strength; (b) PDF of initial strength.
Figure 4.
Probability distribution of initial strength of Gr/PEEK [0/45/90/−45]2S laminates: (a) PDF of initial strength; (b) PDF of initial strength.
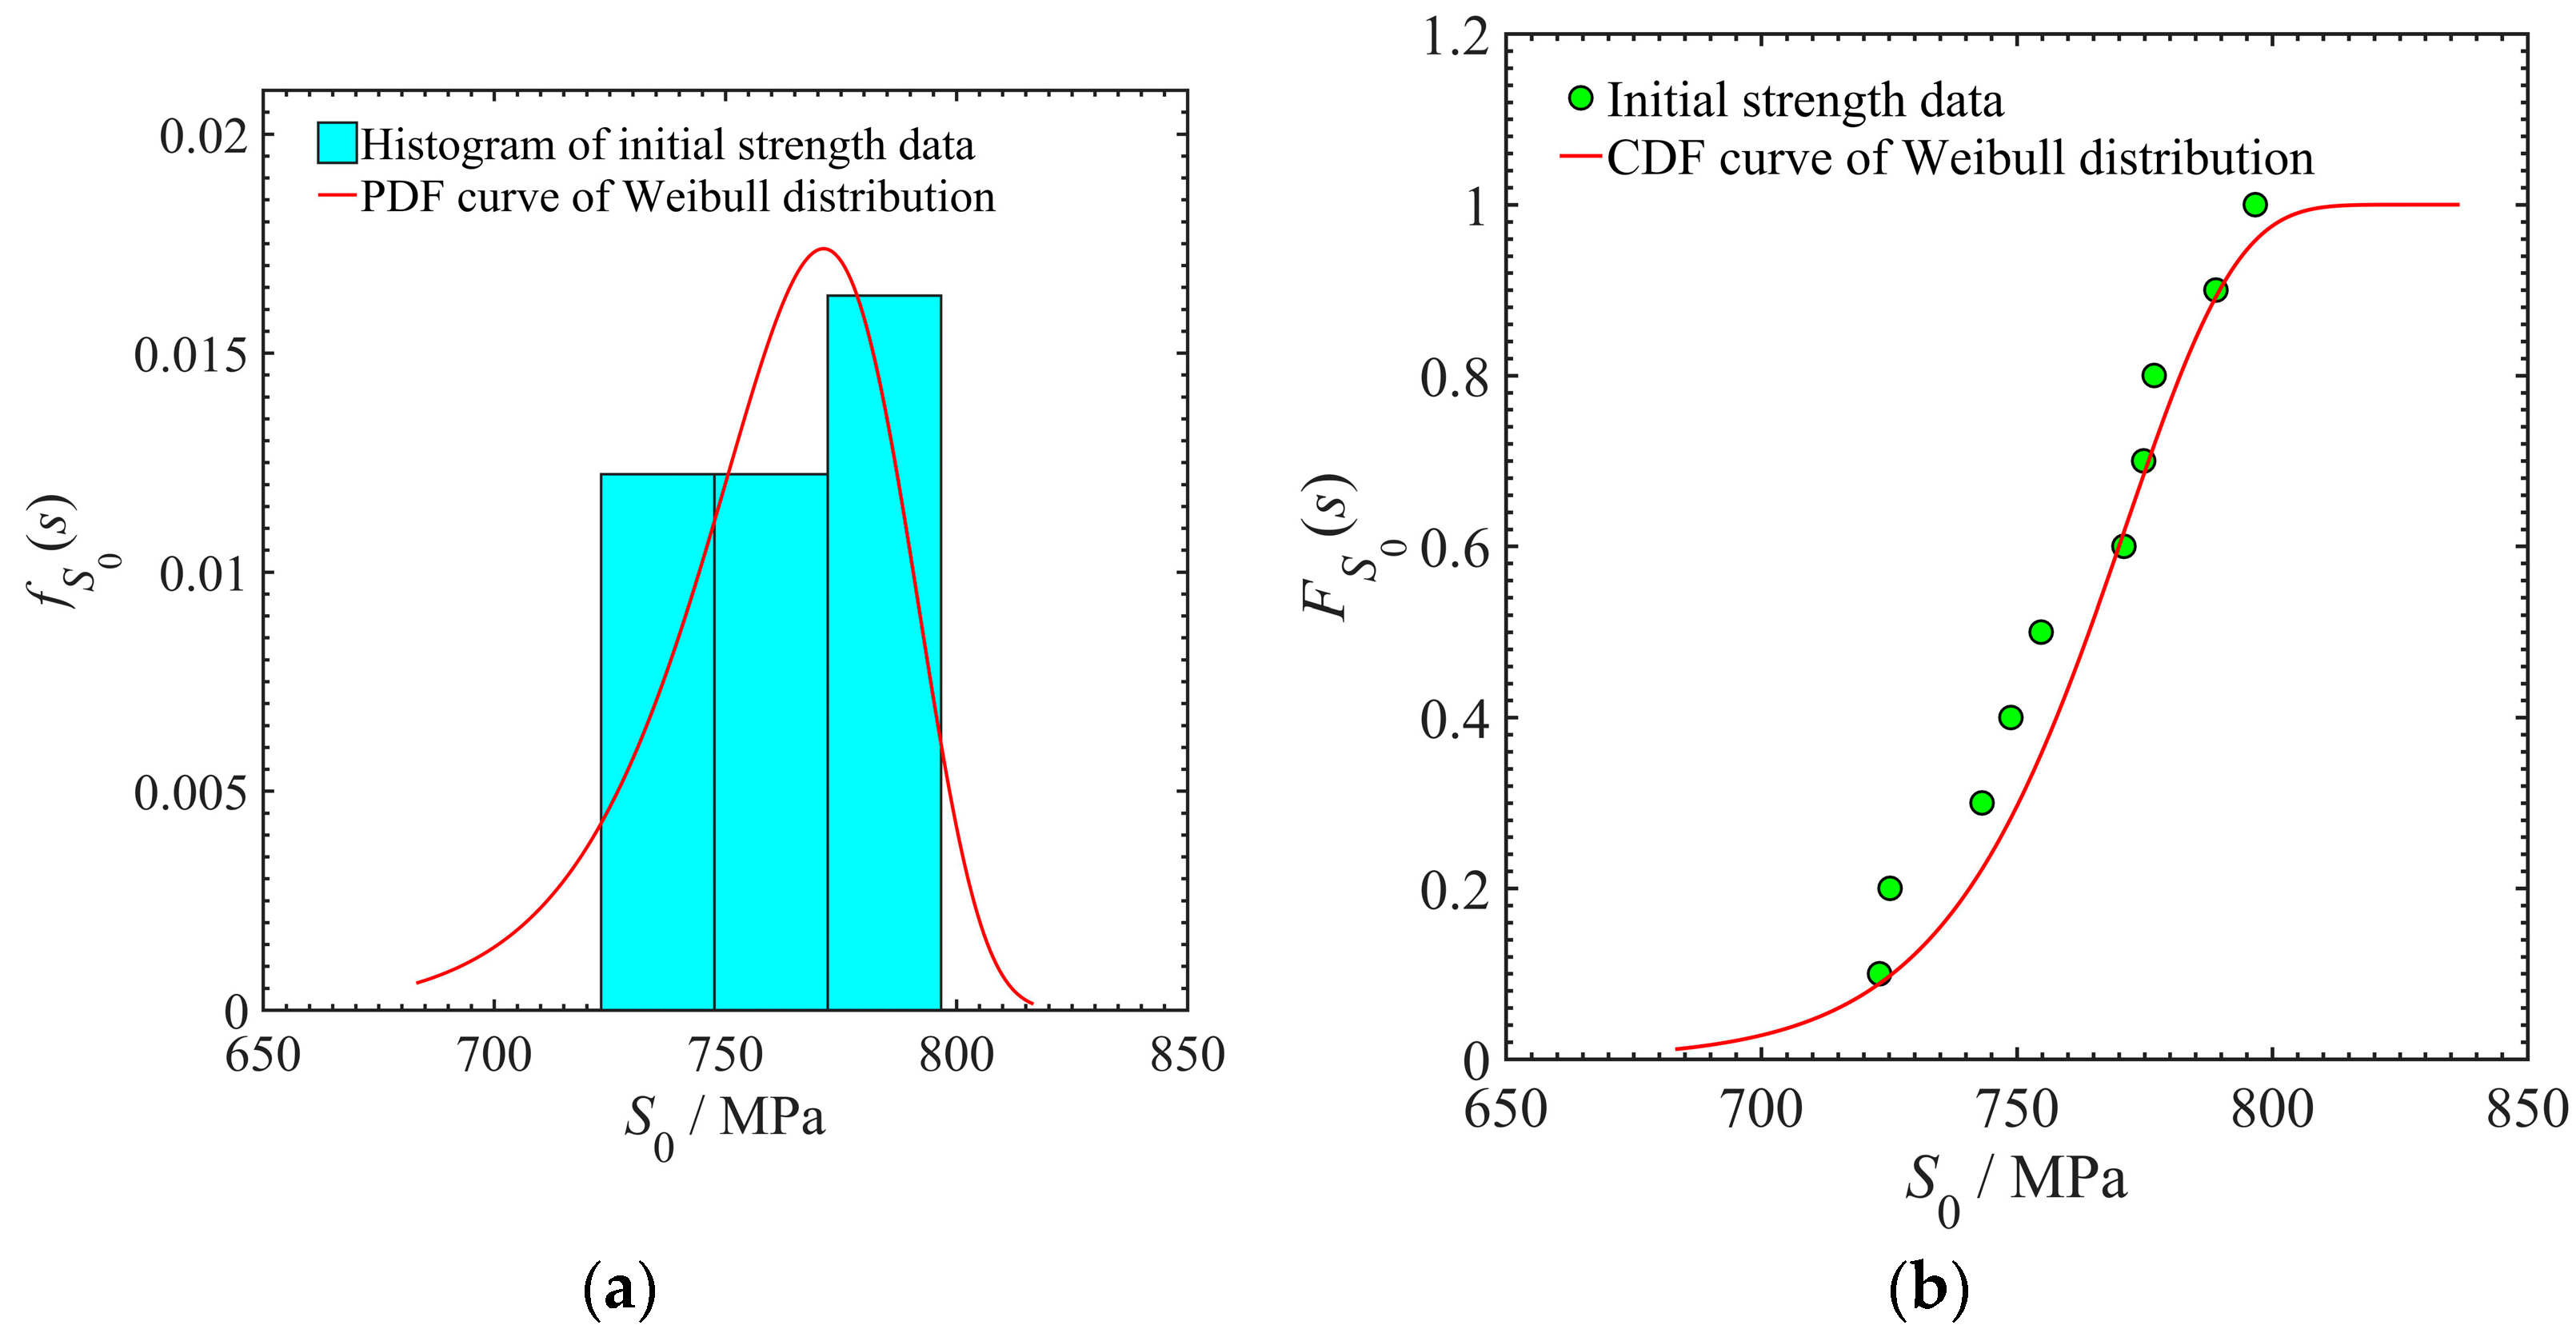
Figure 5.
Evolution rule of PDF of residual strength under different stress levels: (a) PDF of residual strength under S2; (b) PDF of residual strength under S3; (c) PDF of residual strength under S4.
Figure 5.
Evolution rule of PDF of residual strength under different stress levels: (a) PDF of residual strength under S2; (b) PDF of residual strength under S3; (c) PDF of residual strength under S4.
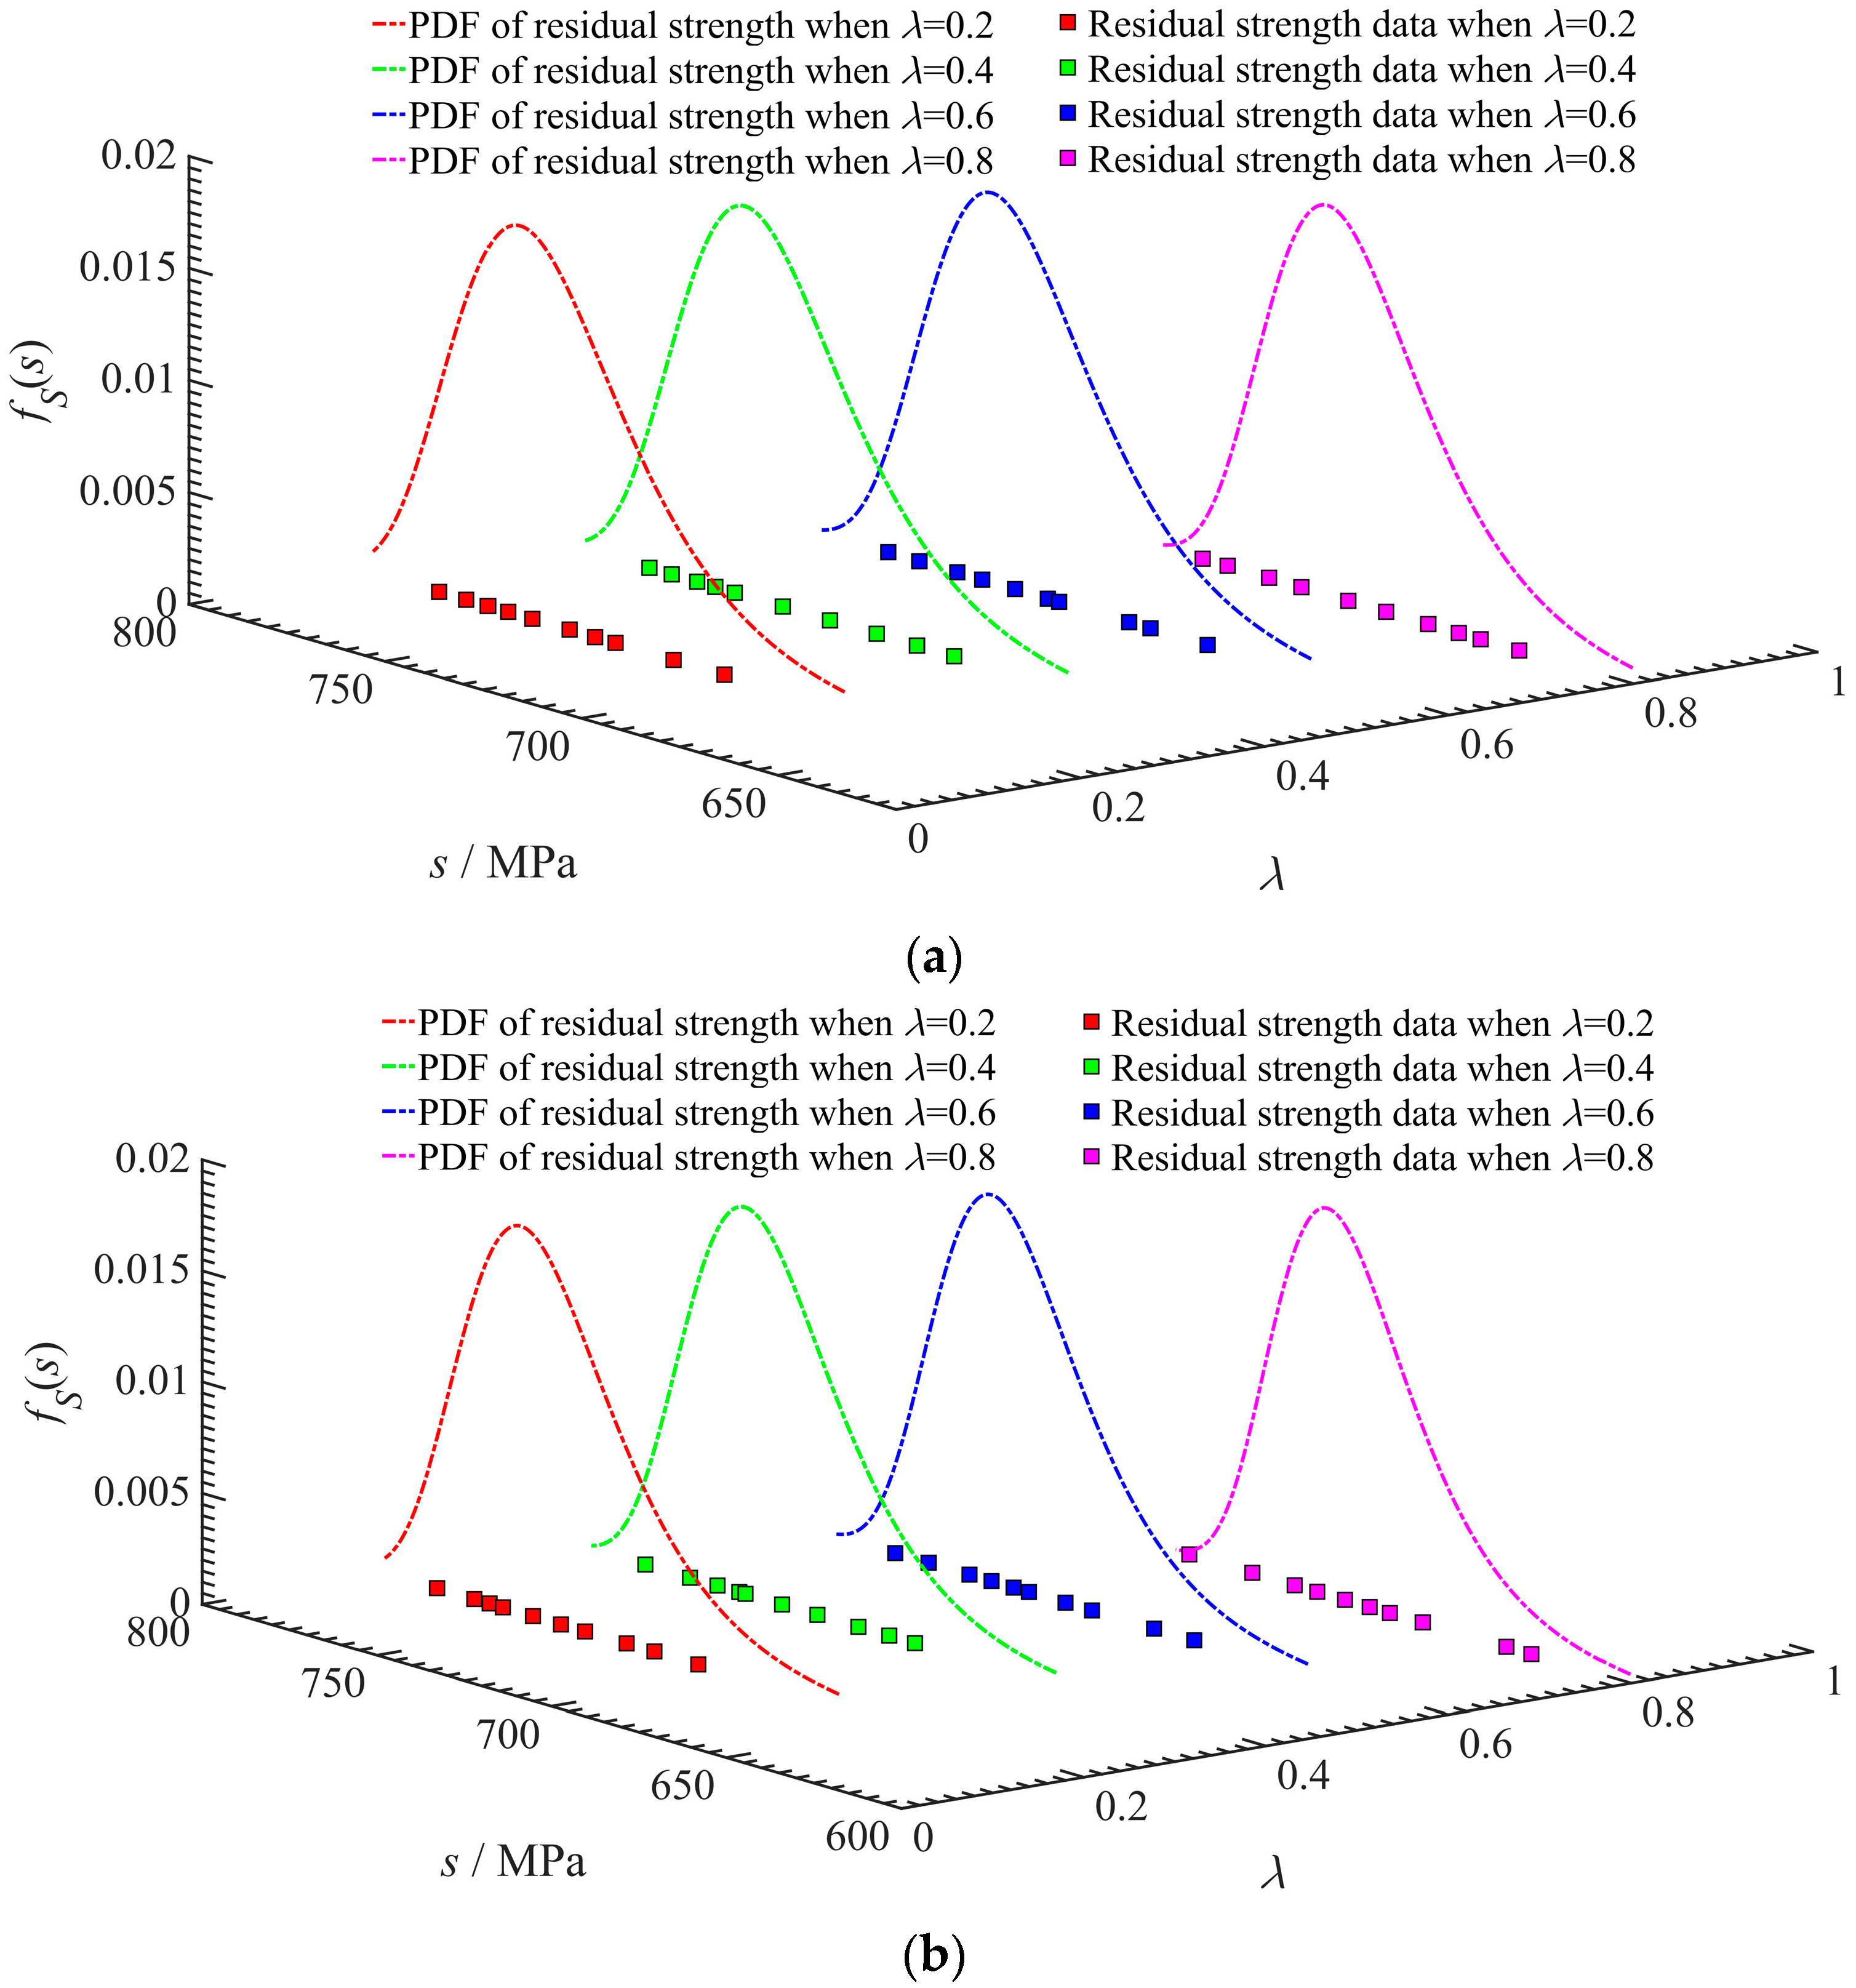
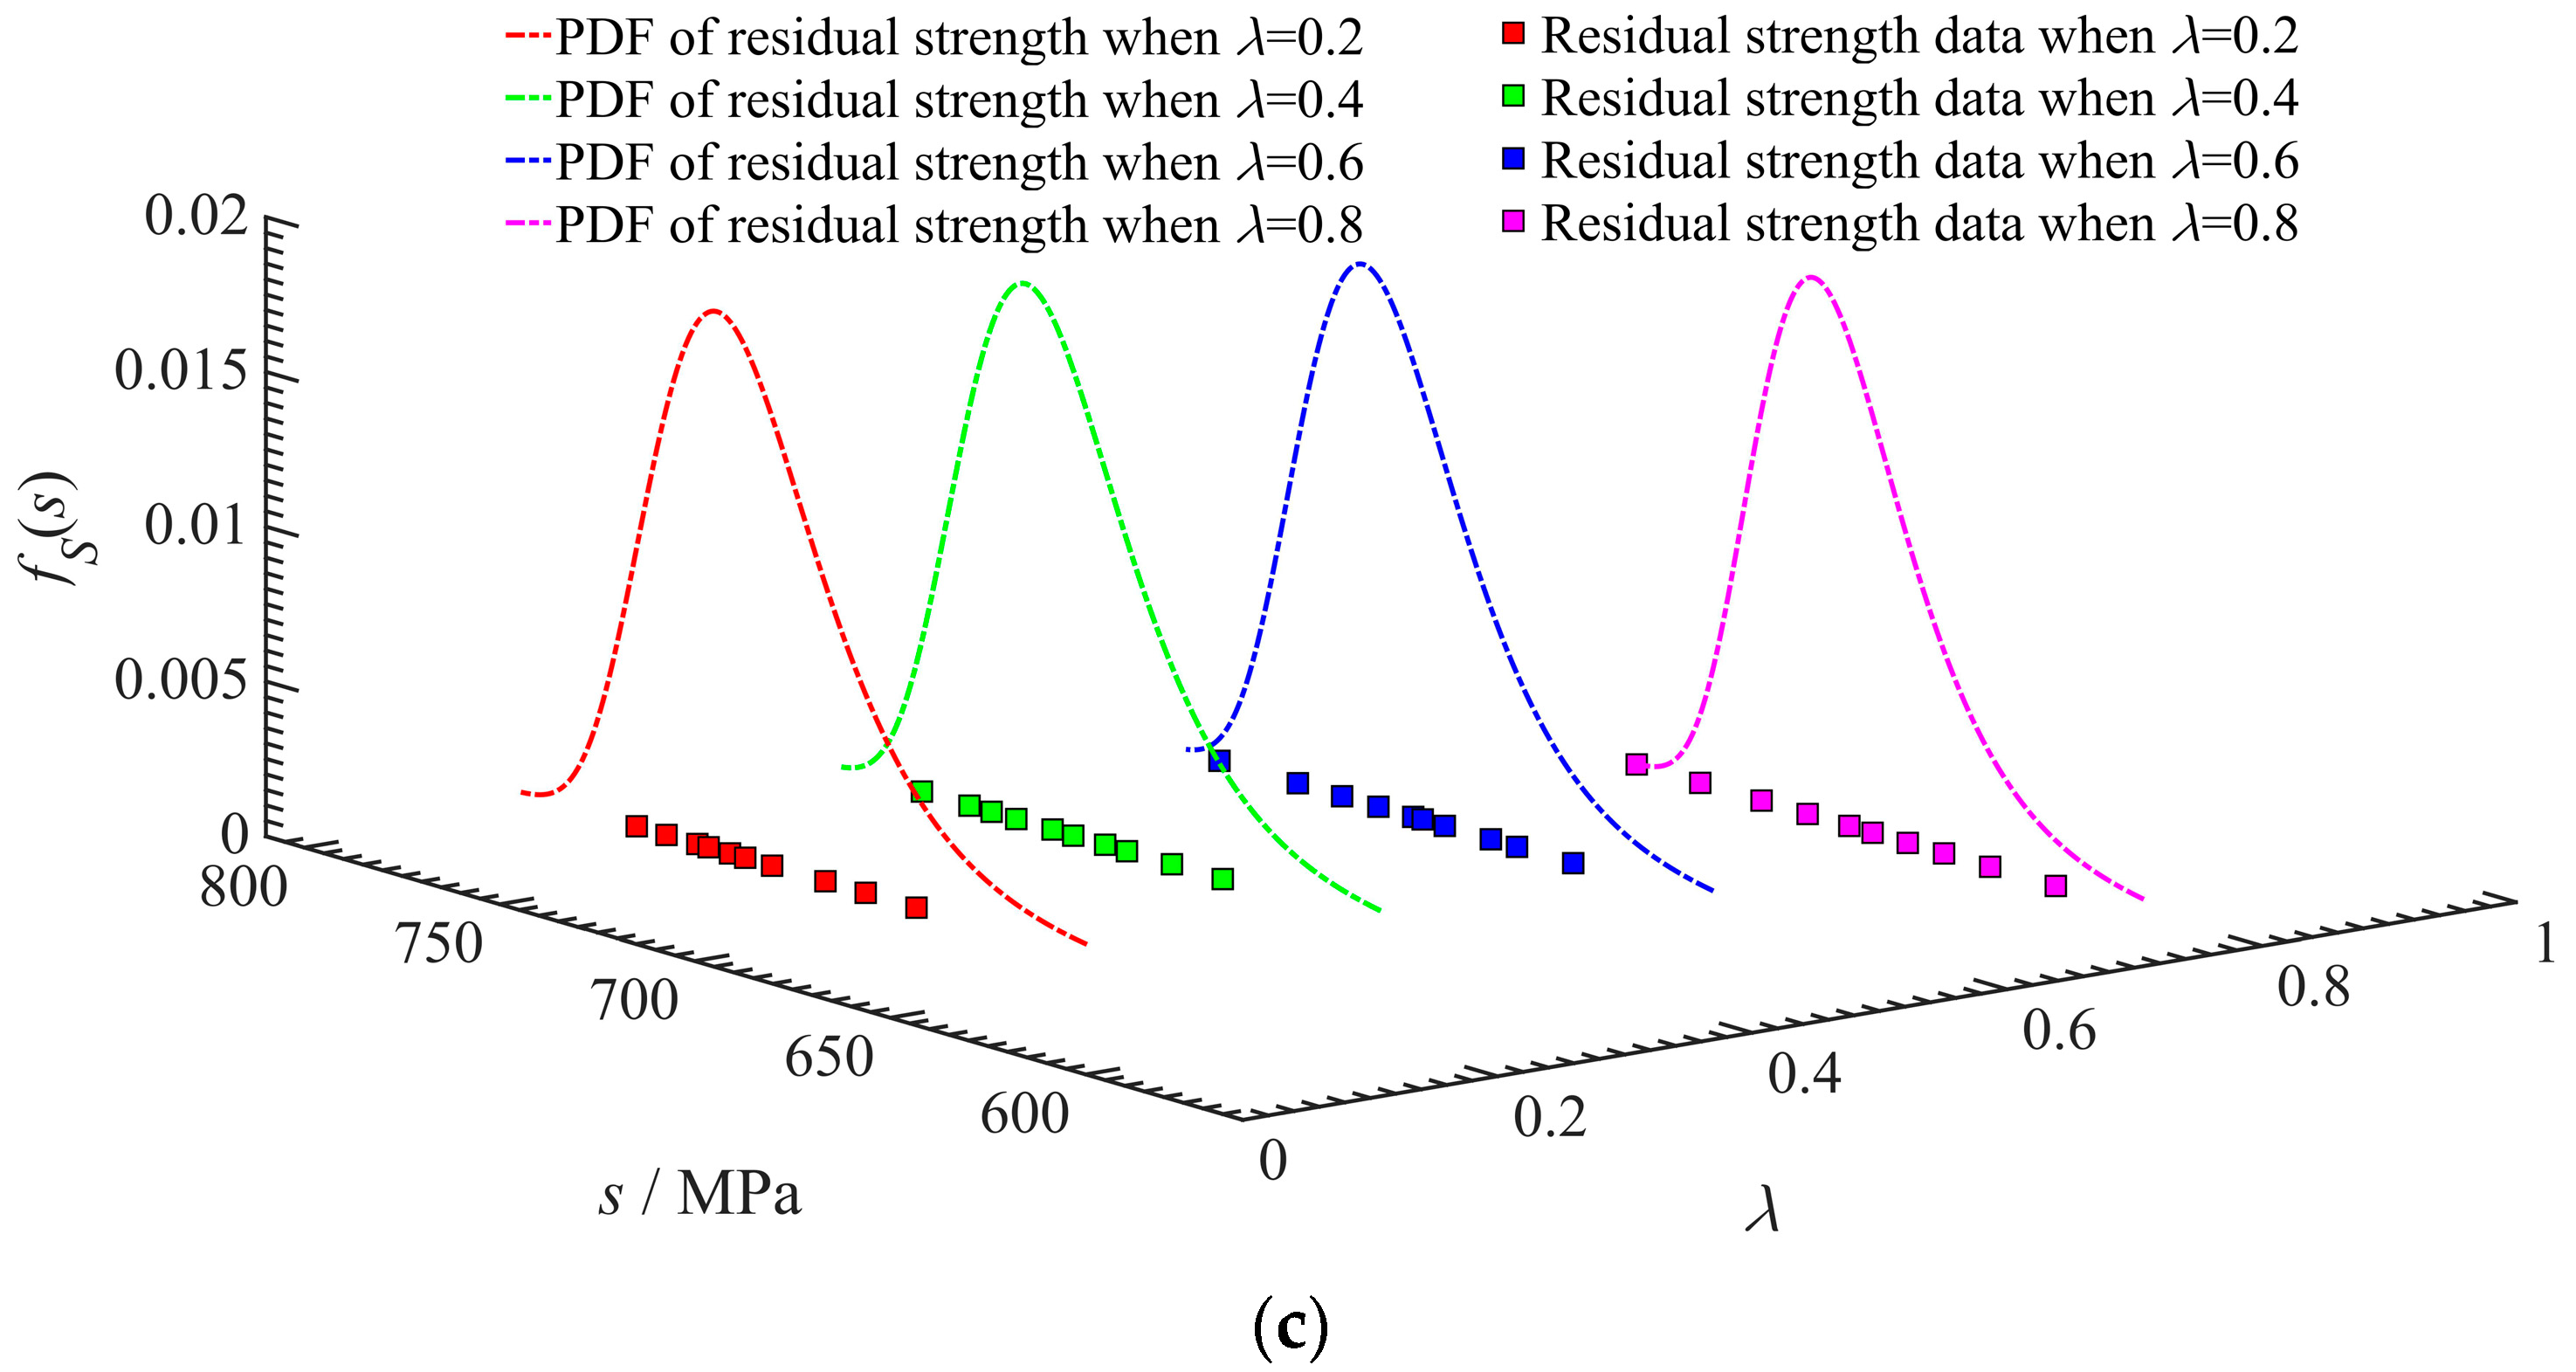
Figure 6.
Mean value curve of residual stiffness of Gr/PEEK [0/45/90/−45]2S laminates.
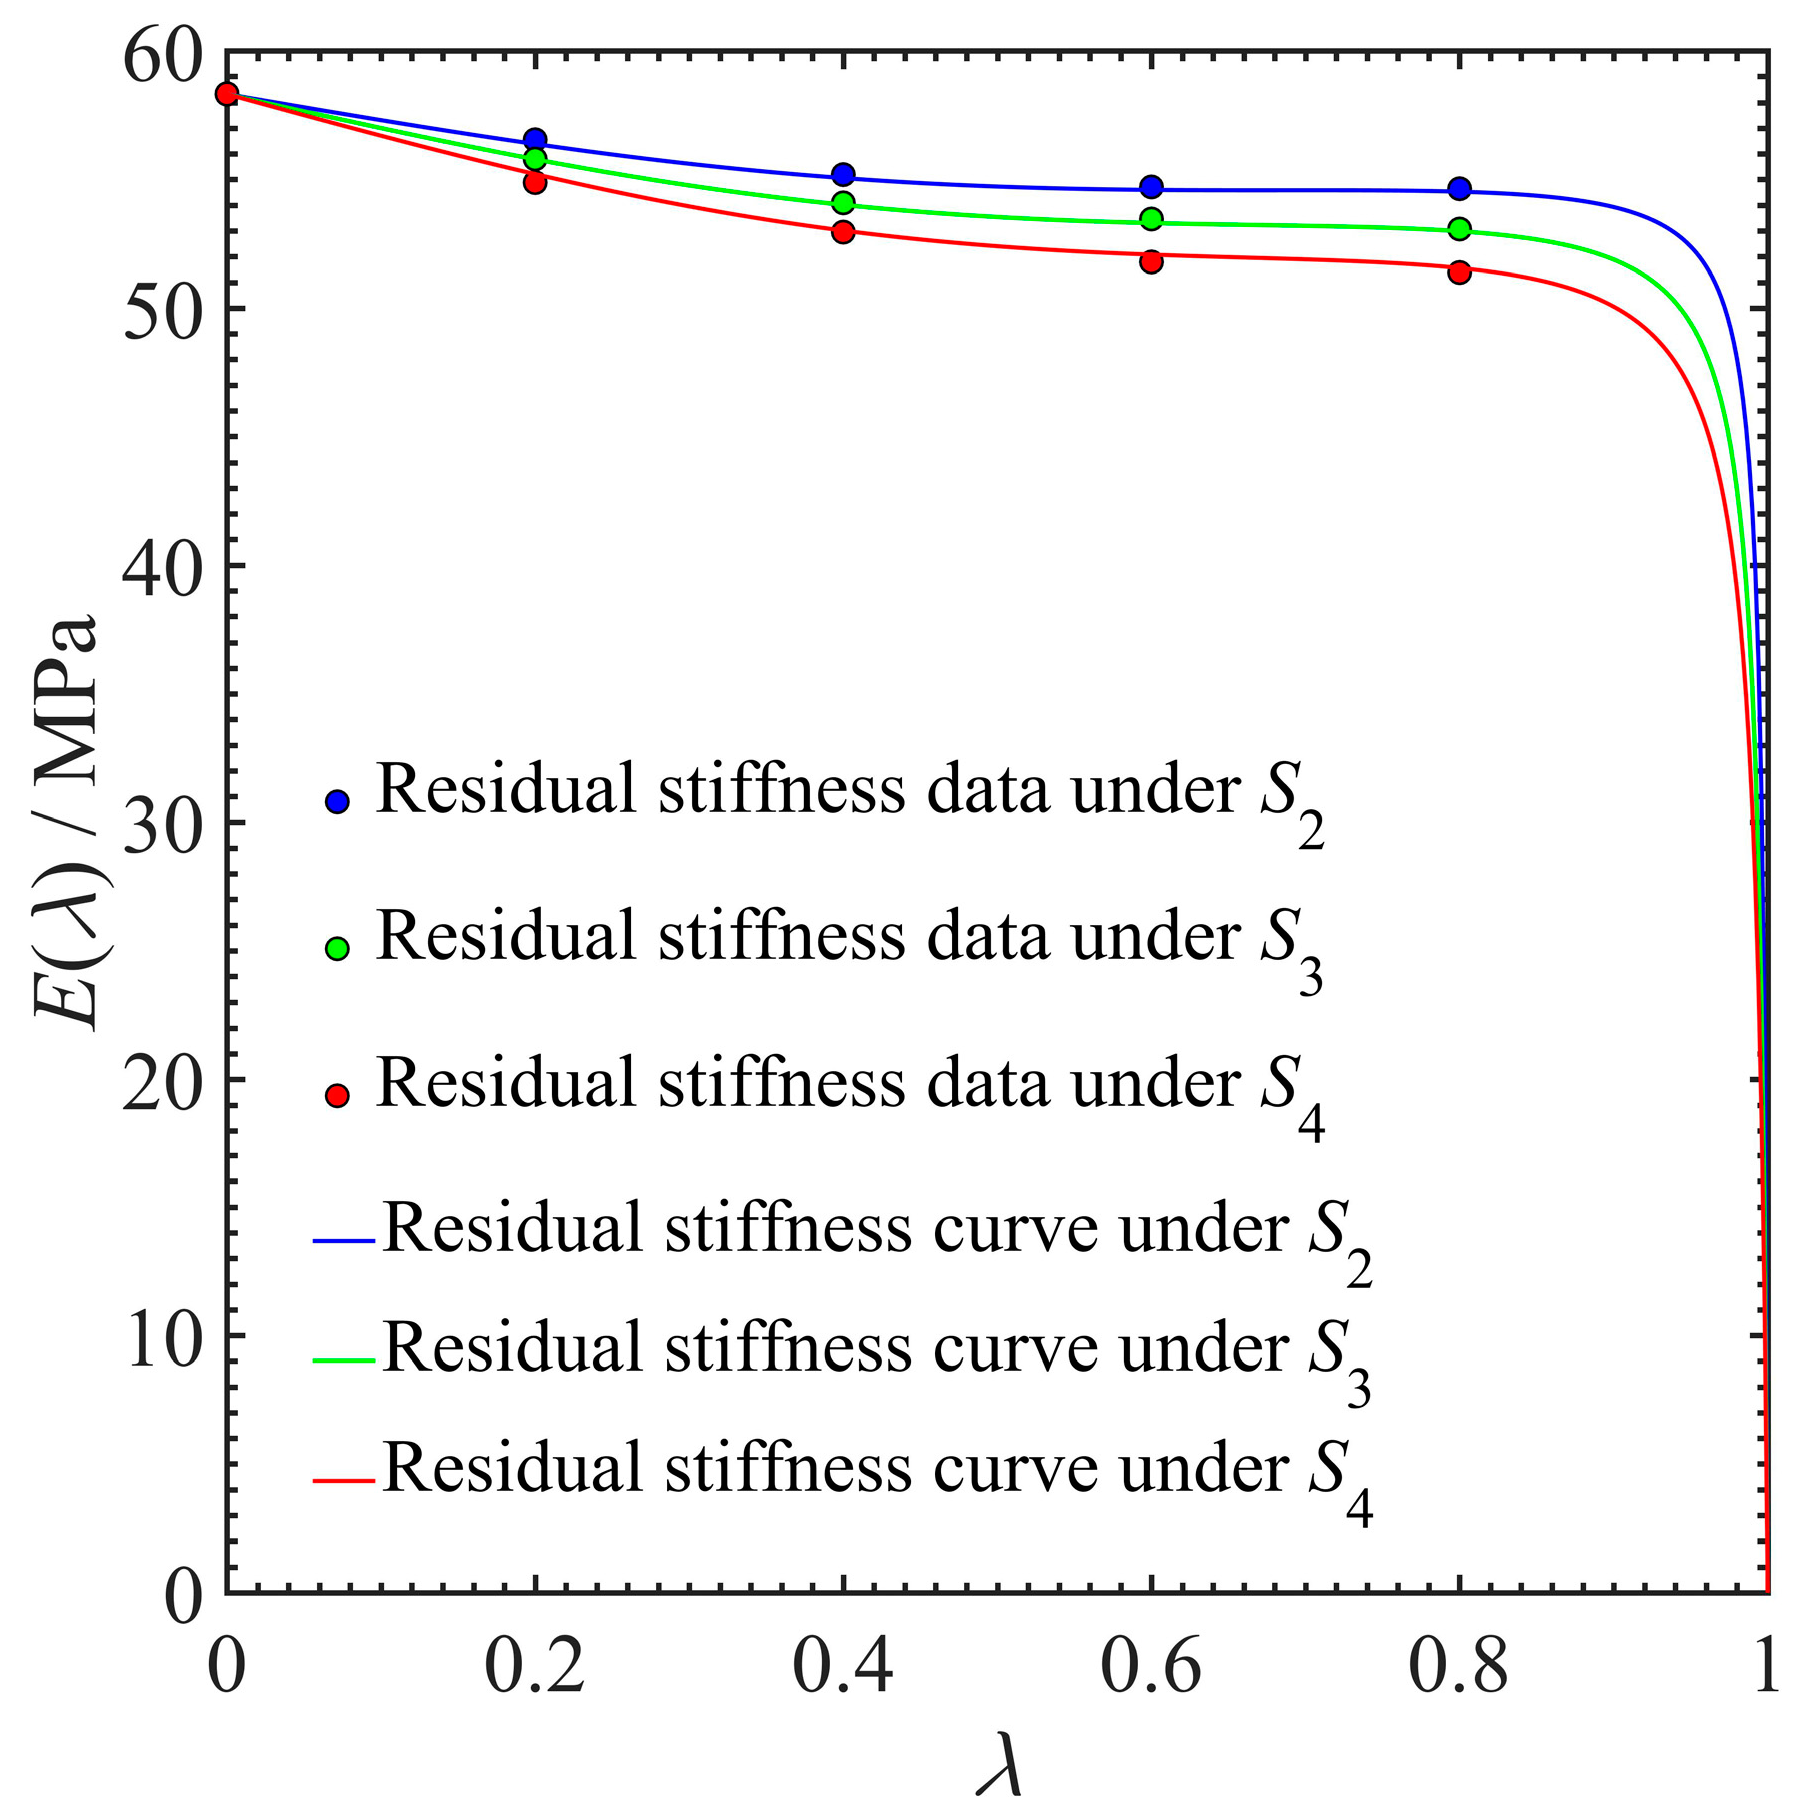
Figure 7.
Probability distribution of initial stiffness of Gr/PEEK [0/45/90/−45]2S laminates: (a) PDF of initial stiffness under S2; (b) CDF of initial stiffness under S2; (c) PDF of initial stiffness under S3; (d) CDF of initial stiffness under S3; (e) PDF of initial stiffness under S4; (f) CDF of initial stiffness under S4.
Figure 8.
Evolution rule of PDF of residual stiffness under different stress levels: (a) PDF of residual stiffness under S2; (b) PDF of residual stiffness under S3; (c) PDF of residual stiffness under S4.
Figure 8.
Evolution rule of PDF of residual stiffness under different stress levels: (a) PDF of residual stiffness under S2; (b) PDF of residual stiffness under S3; (c) PDF of residual stiffness under S4.
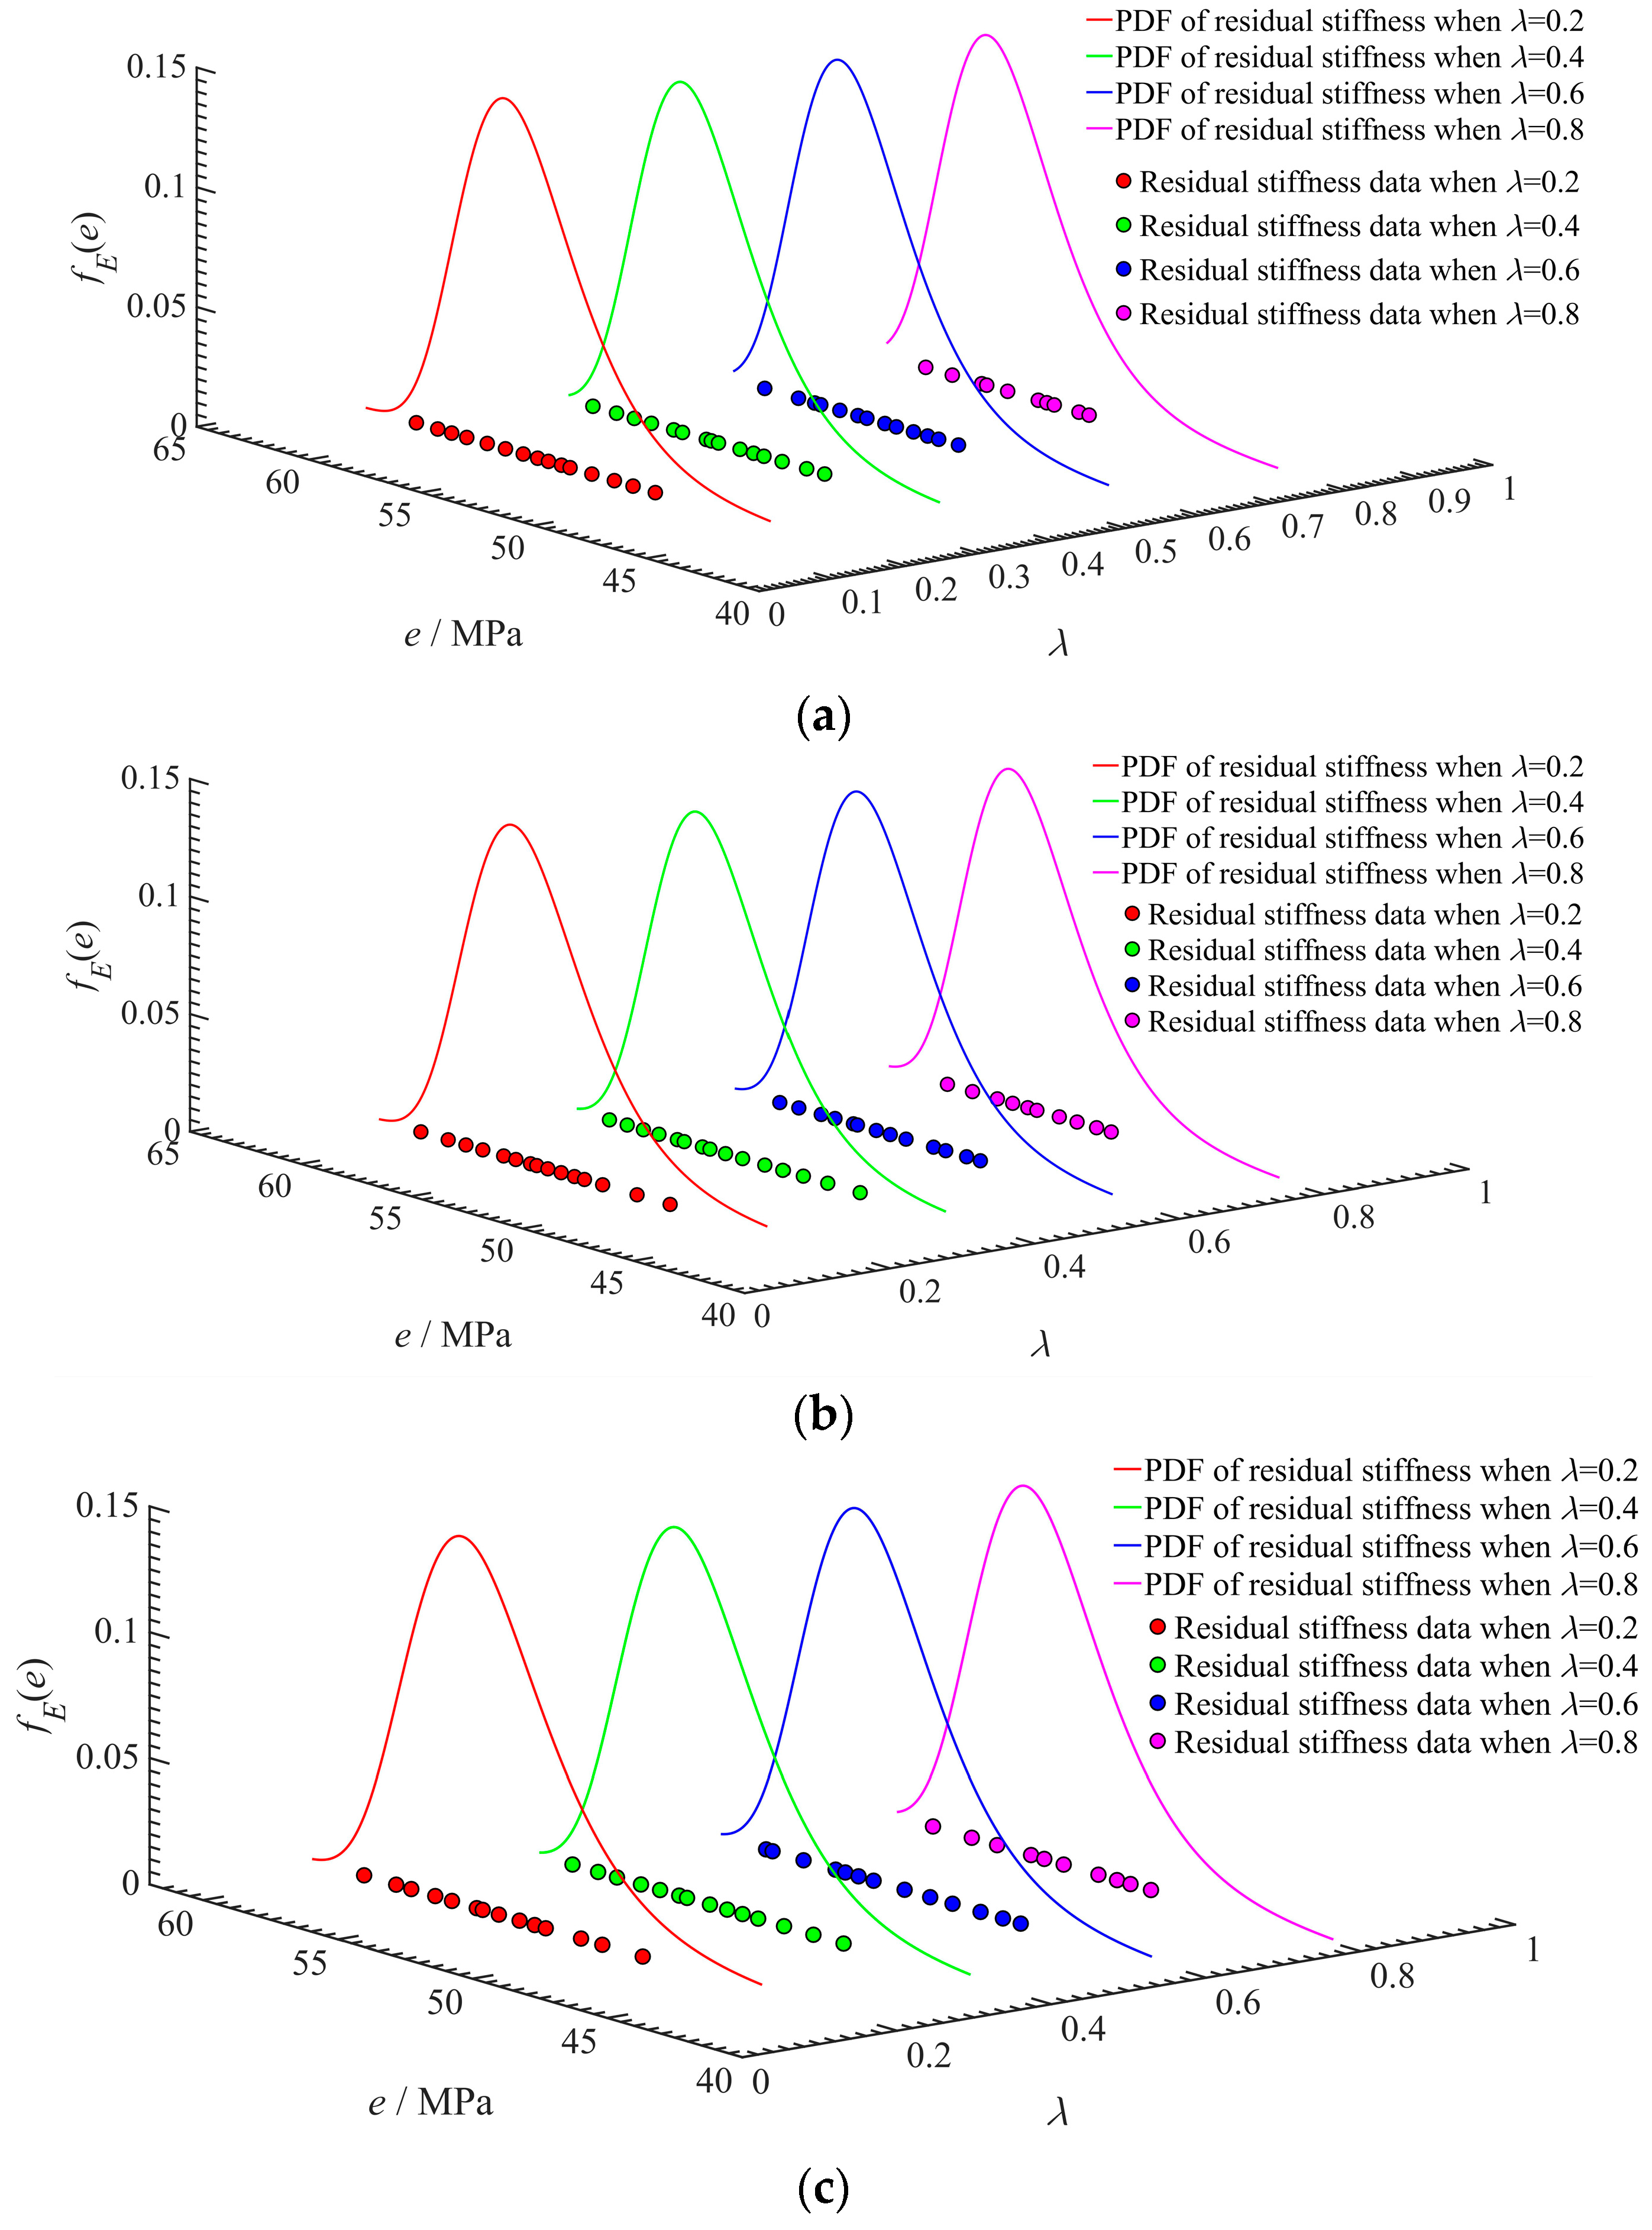
Figure 9.
Effective stress growth caused by fatigue damage accumulation.
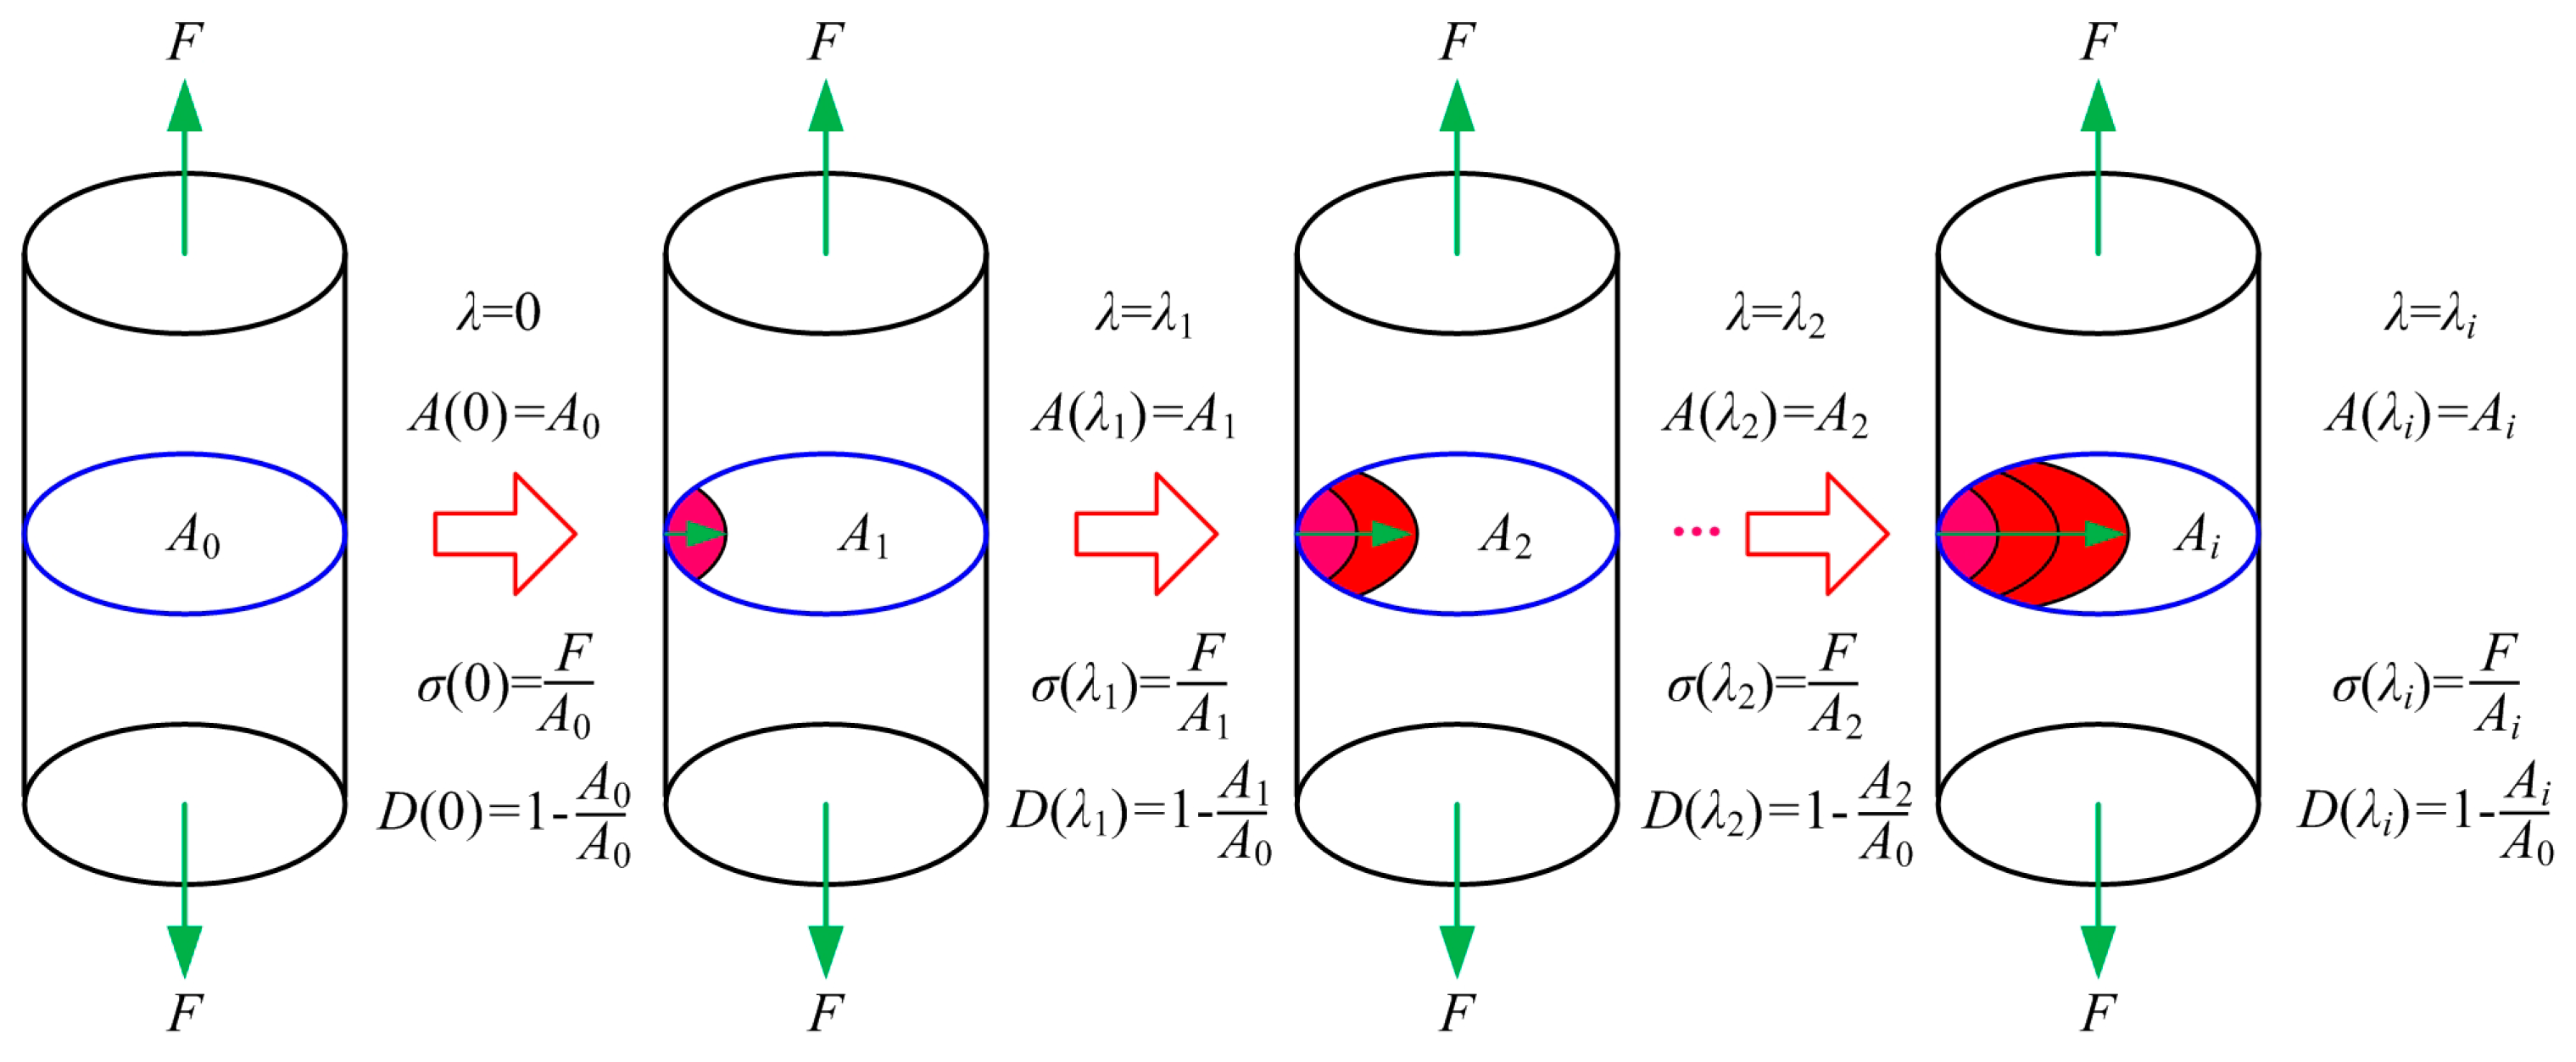
Figure 10.
Schematic diagram of traditional and improved strength-based fatigue reliability models: (a) traditional strength-based fatigue reliability model; (b) improved strength-based fatigue reliability model.
Figure 10.
Schematic diagram of traditional and improved strength-based fatigue reliability models: (a) traditional strength-based fatigue reliability model; (b) improved strength-based fatigue reliability model.
Figure 11.
Effective stress growth curve of Gr/PEEK [0/45/90/−45]2S laminates.
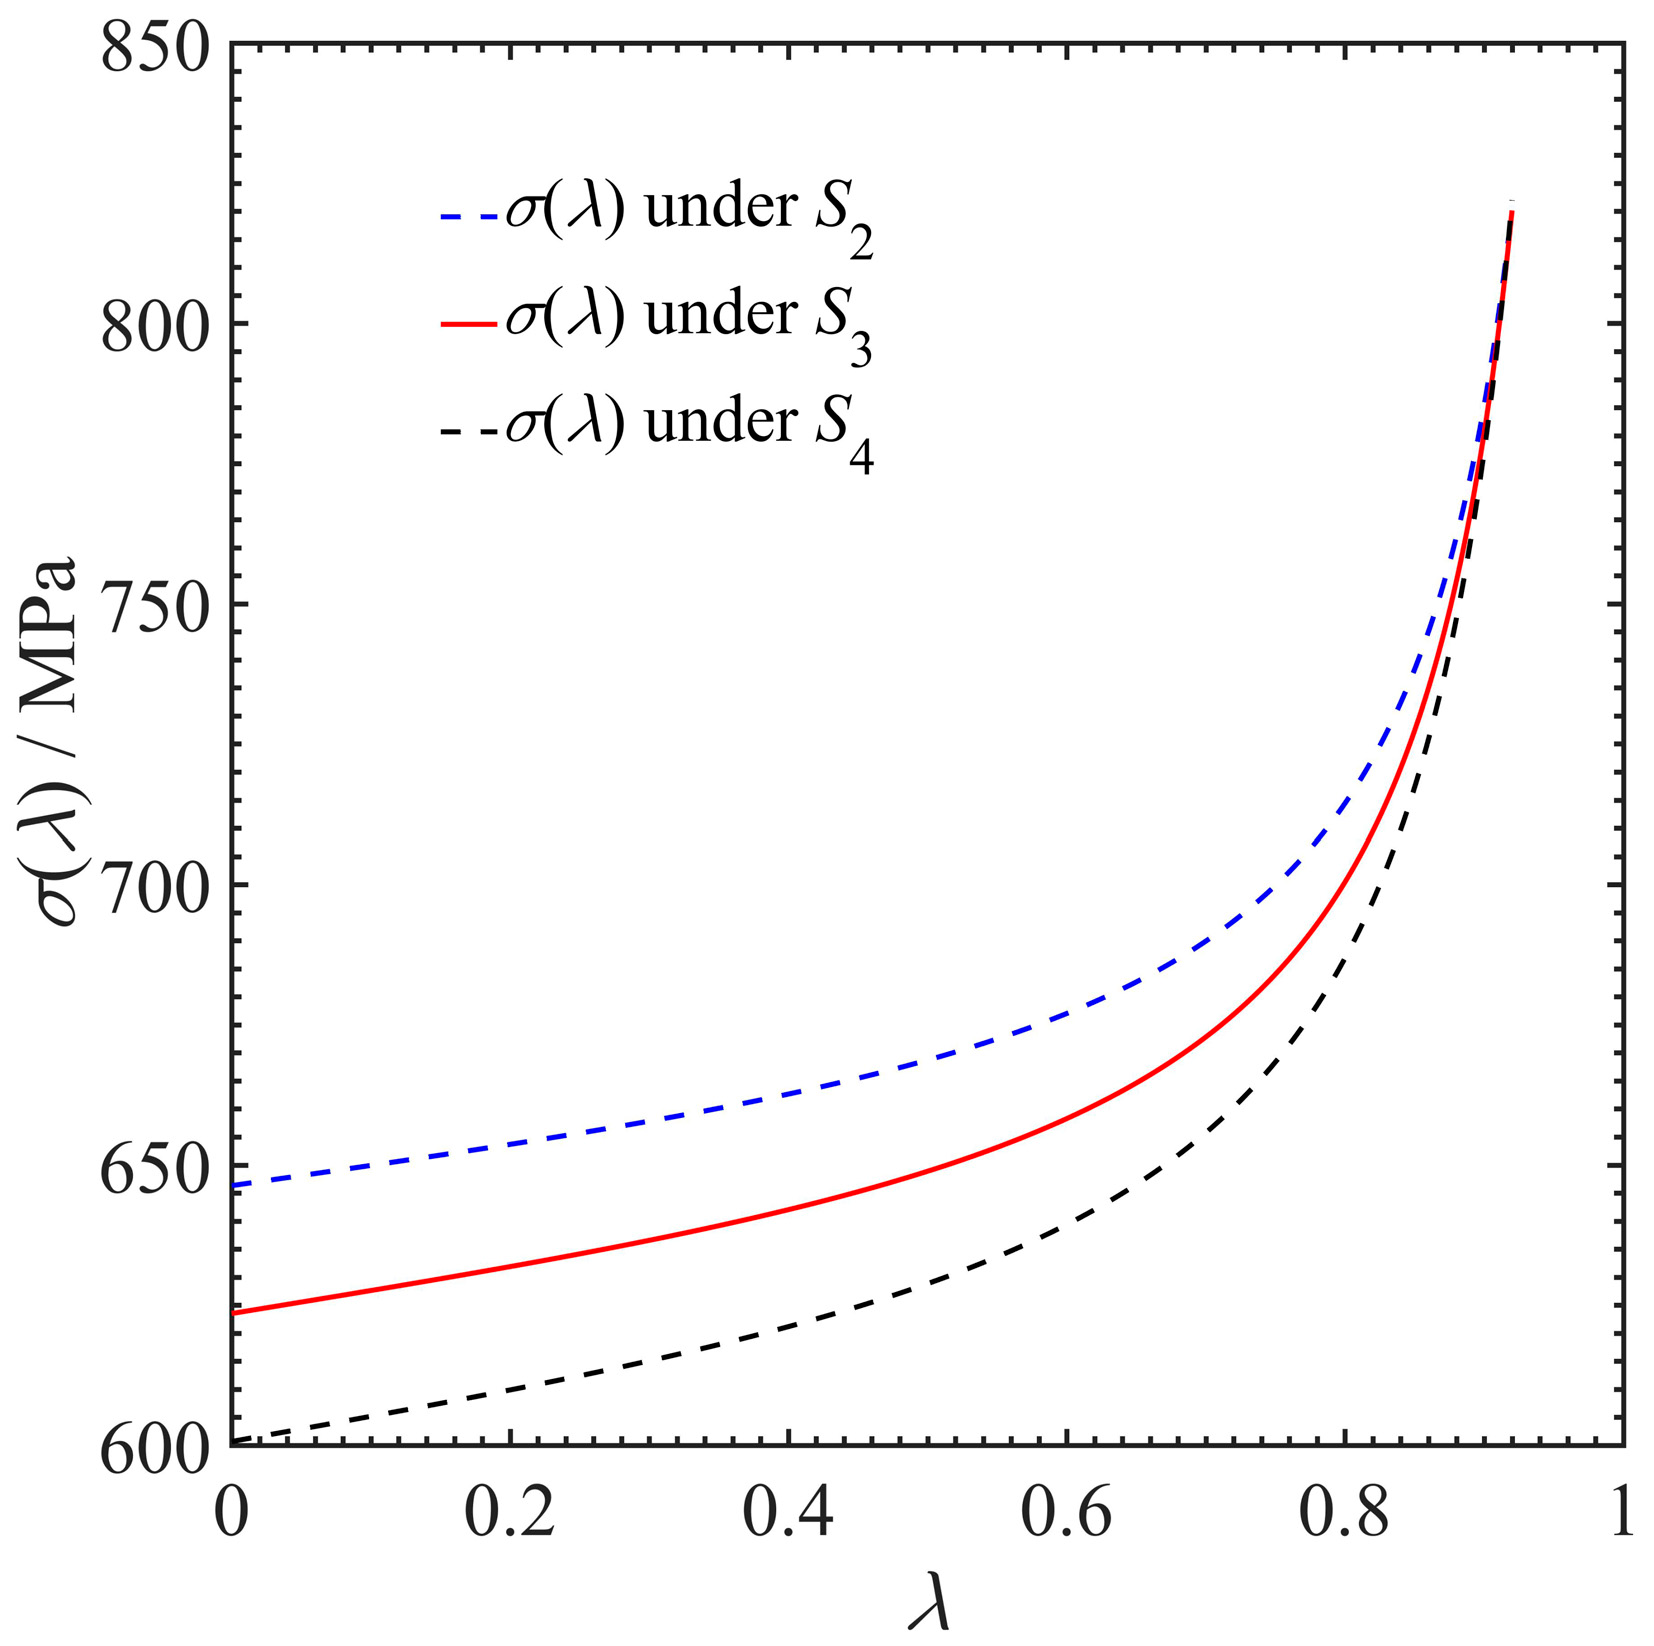
Figure 12.
Strength-based fatigue reliability curve of Gr/PEEK [0/45/90/−45]2S laminates.
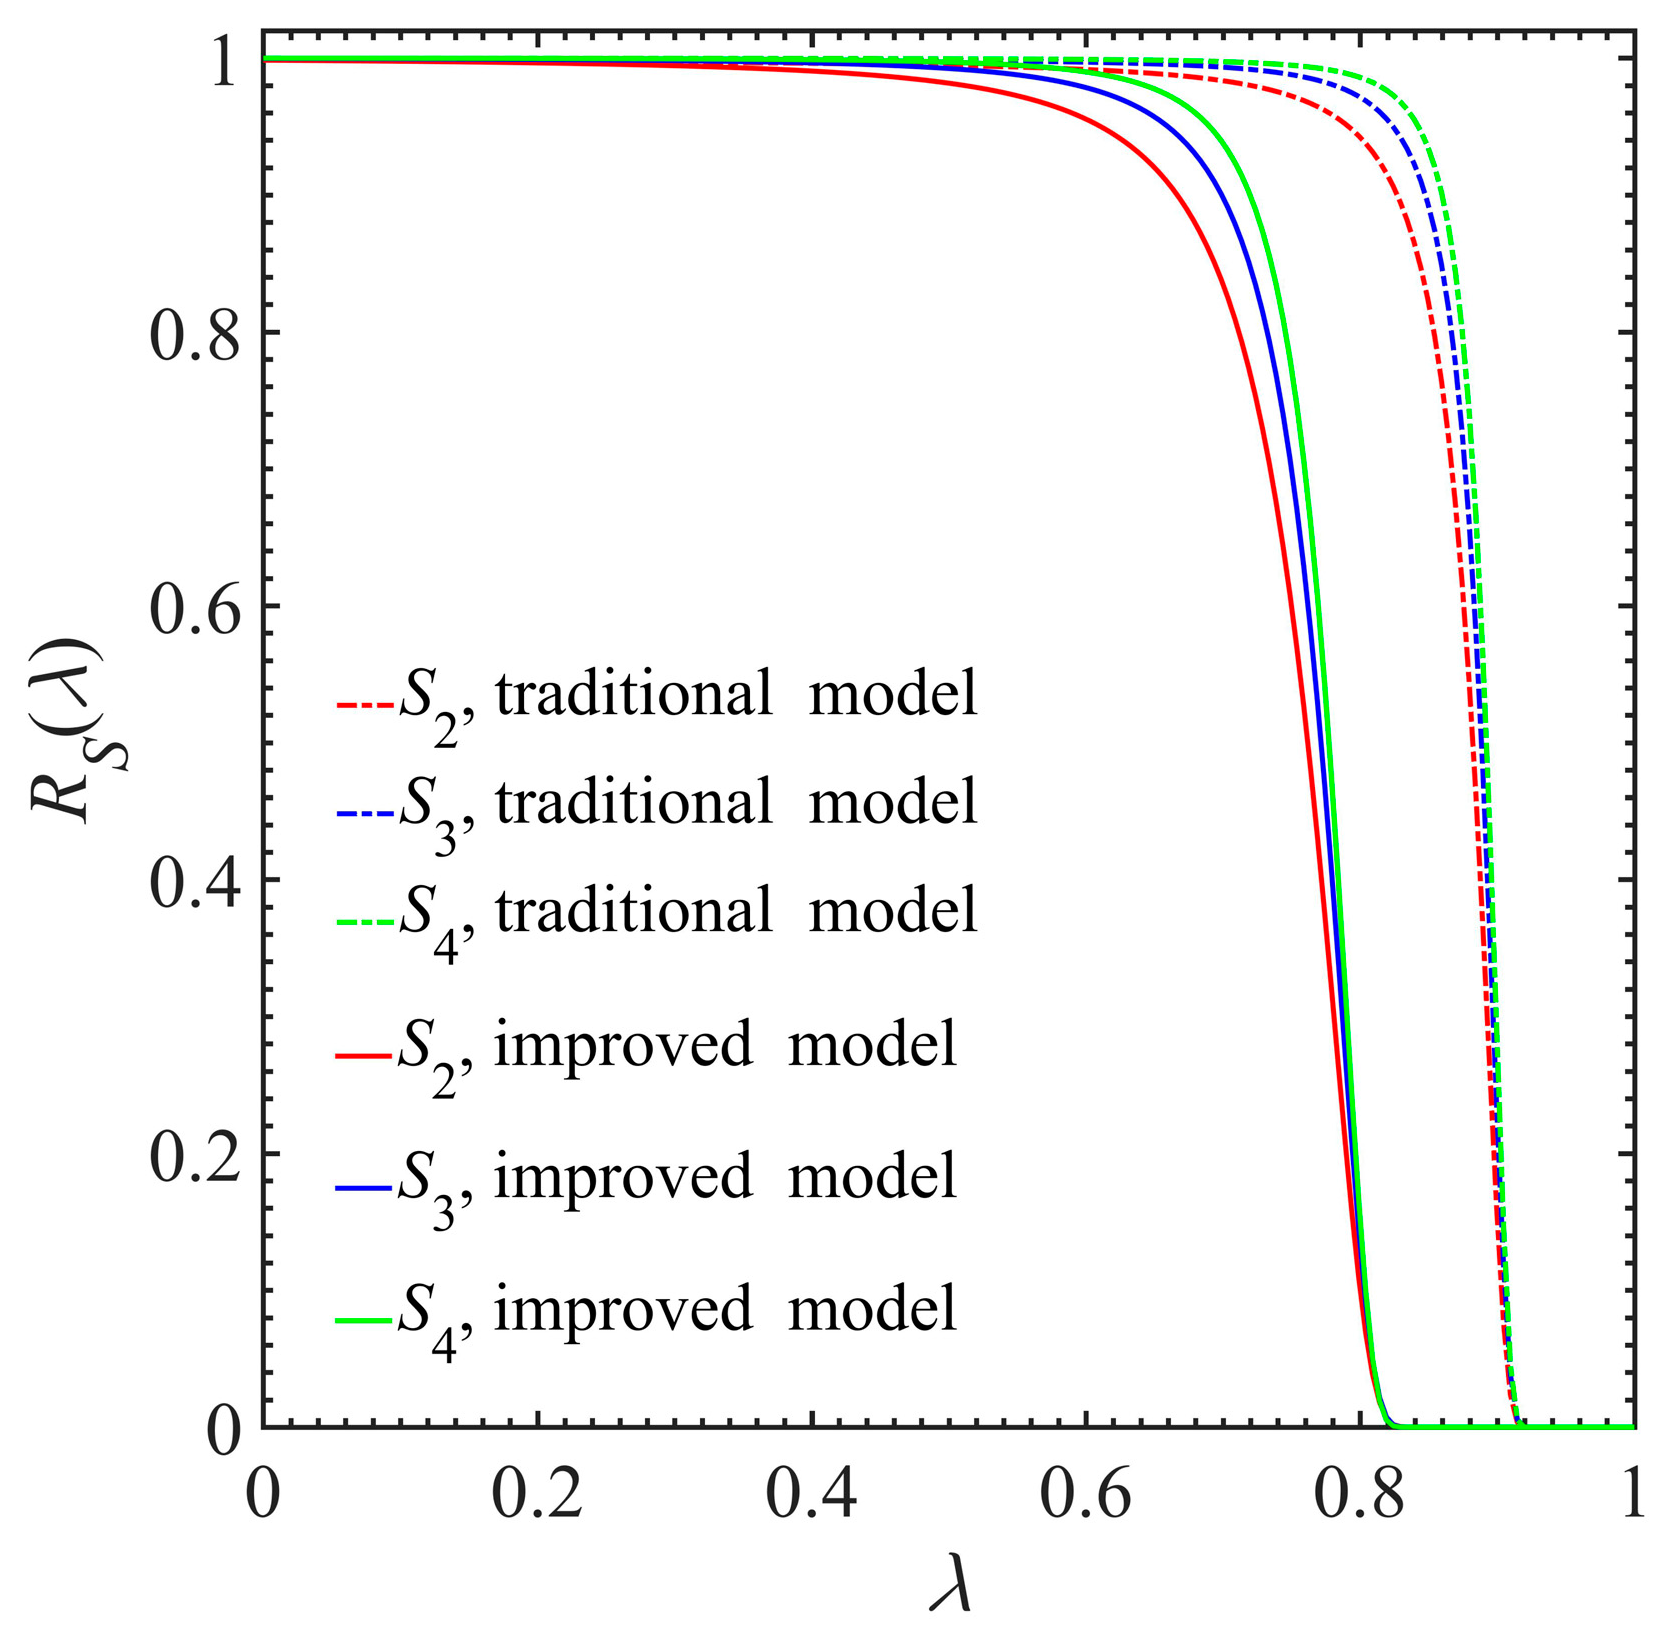
Figure 13.
Strength-based failure rate curve of Gr/PEEK [0/45/90/−45]2S laminates.
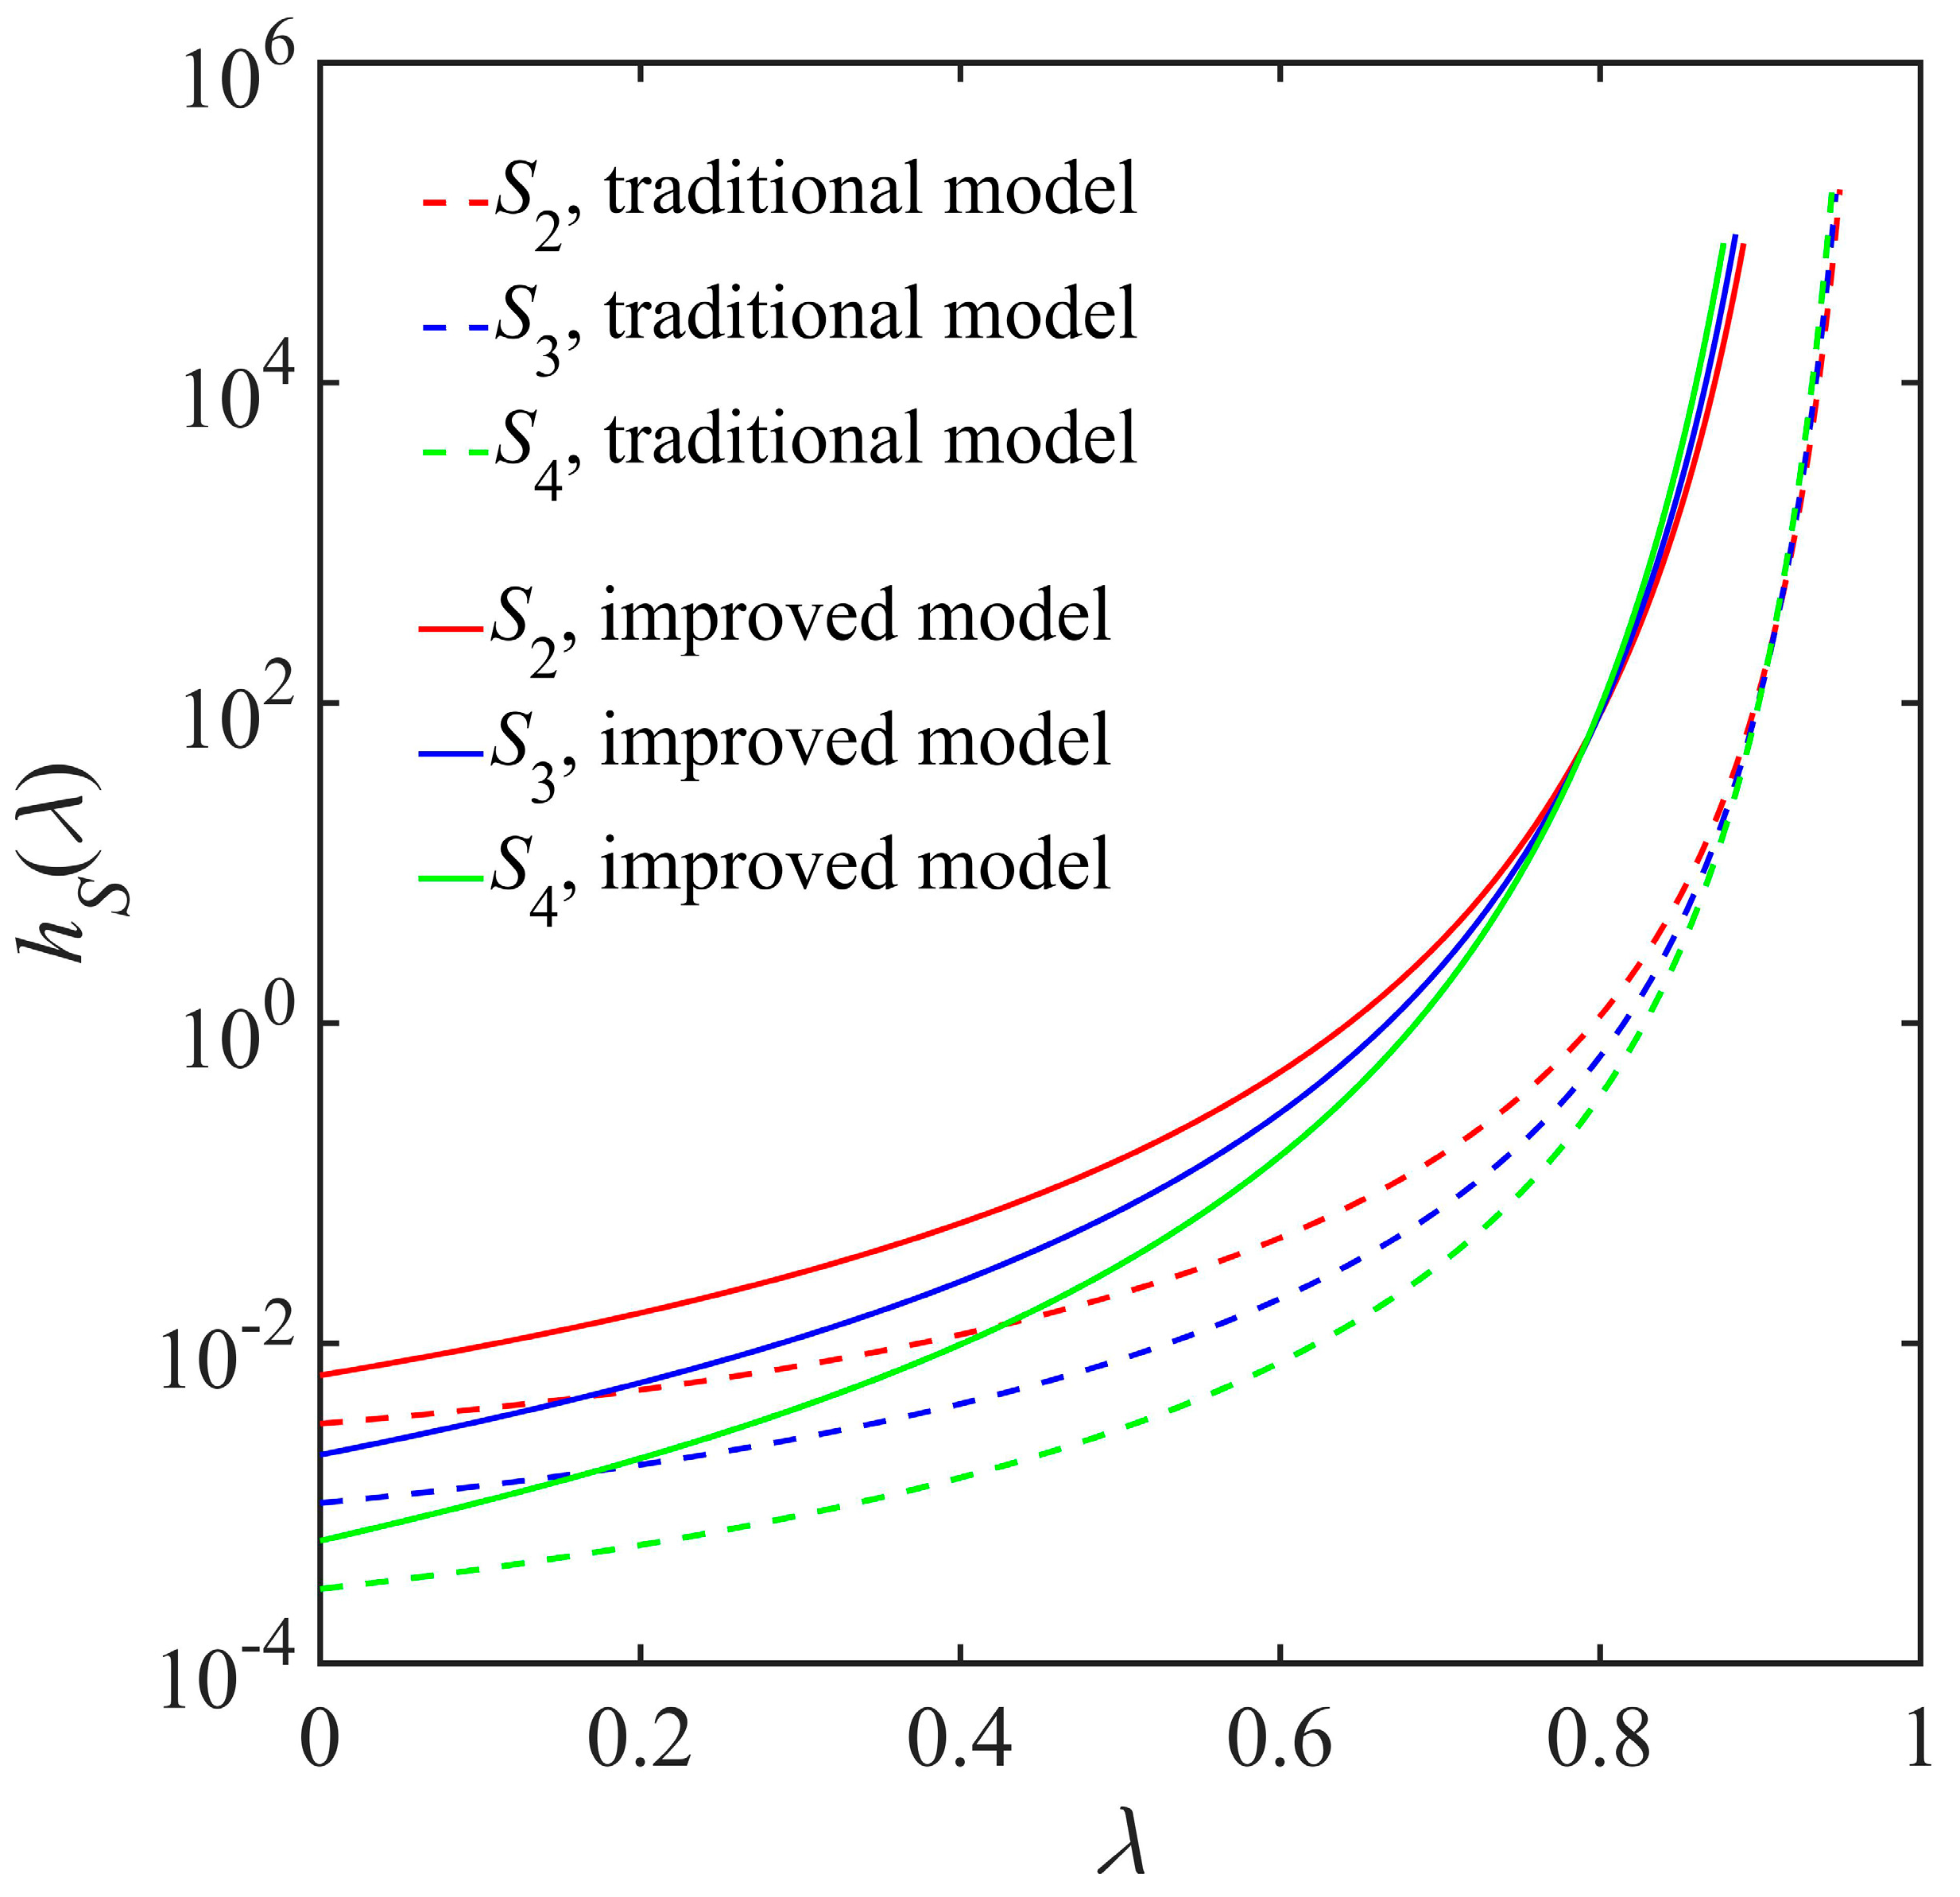
Figure 14.
Schematic diagram of traditional and improved stiffness-based fatigue reliability model: (a) traditional stiffness-based fatigue reliability model; (b) improved stiffness-based fatigue reliability model.
Figure 14.
Schematic diagram of traditional and improved stiffness-based fatigue reliability model: (a) traditional stiffness-based fatigue reliability model; (b) improved stiffness-based fatigue reliability model.
Figure 15.
Critical stiffness growth curve of Gr/PEEK [0/45/90/−45]2S laminates.
Figure 16.
Stiffness-based fatigue reliability curve of Gr/PEEK [0/45/90/−45]2S laminates.

Figure 17.
Stiffness-based failure rate curve of Gr/PEEK [0/45/90/−45]2S laminates.

Figure 18.
Comparison between strength-based and stiffness-based approaches: (a) fatigue reliability curve; (b) failure rate curve.
Figure 18.
Comparison between strength-based and stiffness-based approaches: (a) fatigue reliability curve; (b) failure rate curve.

Table 1.
Strength-based fatigue damage models.
| Researchers | Models | Parameters |
|---|---|---|
| Gao [34] | ||
| Reifsnider [35] | , | |
| Yao [36] | , | |
| Mu [37] | , , |
Table 2.
Parameter estimation results of strength-based fatigue damage models.
| Stress Levels/MPa | Models | Parameters | Goodness of Fit | ||
|---|---|---|---|---|---|
| a | b | c | R2 | ||
| S2 = 646.31 | Gao’s model | 0.0577 | — | — | 0.9771 |
| Reifsnider’s model | 0.0755 | 1.433 | — | 0.997 | |
| Yao’s model | 1.603 | −9.358 | — | 0.9992 | |
| Mu’s model | 16.1 | 1.51 | 0.1027 | 0.9983 | |
| S3 = 623.50 | Gao’s model | 0.0683 | — | — | 0.9793 |
| Reifsnider’s model | 0.0883 | 1.411 | — | 0.9977 | |
| Yao’s model | 1.611 | -9.344 | — | 0.9991 | |
| Mu’s model | 15.48 | 1.518 | 0.1237 | 0.9988 | |
| S4 = 600.68 | Gao’s model | 0.0787 | — | — | 0.9784 |
| Reifsnider’s model | 0.1025 | 1.422 | — | 0.9975 | |
| Yao’s model | 1.584 | 0.06 | — | 0.9993 | |
| Mu’s model | 14.7 | 1.51 | 0.1417 | 0.9989 | |
Table 3.
Stiffness-based fatigue damage models.
| Researchers | Models | Parameters |
|---|---|---|
| Shiri [27] | , | |
| Gao [19] | , | |
| Mu [37] | , , | |
| Mao [39] | , , |
Table 4.
Parameter estimation results of stiffness-based fatigue damage models.
| Stress Levels/MPa | Models | Parameters | Goodness of Fit | ||
|---|---|---|---|---|---|
| α | β | γ | R2 | ||
| S2 = 646.31 | Shiri’s model | 2.906 | 1.348 | — | 0.7566 |
| Gao’s model | 2.896 | 1.556 | — | 0.9999 | |
| Mu’s model | 94.56 | 0.5177 | 0.087 | 0.887 | |
| Mao’s model | 0.0783 | 0.437 | 82.8 | 0.8954 | |
| S3 = 623.50 | Shiri’s model | 2.868 | 1.316 | — | 0.8398 |
| Gao’s model | 2.831 | 1.546 | — | 0.9987 | |
| Mu’s model | 75.46 | 0.5184 | 0.1161 | 0.9492 | |
| Mao’s model | 0.1044 | 0.4804 | 83.67 | 0.9461 | |
| S4 = 600.68 | Shiri’s model | 2.844 | 1.3 | — | 0.8606 |
| Gao’s model | 2.799 | 1.537 | — | 0.9944 | |
| Mu’s model | 75.09 | 0.5569 | 0.1541 | 0.9685 | |
| Mao’s model | 0.8658 | 80.78 | 0.5055 | 0.9651 | |
Table 5.
Initial strength data of Gr/PEEK [0/45/90/−45]2S laminates.
| Initial Strength Data/MPa | Mean Value/MPa | Standard Deviation/MPa |
|---|---|---|
| 723.13, 725.19, 743.20, 748.85, 754.77, 770.98, 774.84, 776.90, 788.99, 796.70 | 760.36 | 25.42 |
Table 6.
Initial stiffness data of Gr/PEEK [0/45/90/−45]2S laminates.
| Stress Level/MPa | Initial Stiffness Data/MPa | Mean value/MPa | Standard Deviation/MPa |
|---|---|---|---|
| S2 = 646.31 | 52.78, 54.29, 55.43, 56.42, 56.86, 57.63, 58.43, 58.95, 59.27, 59.84, 60.48, 61.11, 61.52, 62.16, 63.22 | 58.56 | 3.00 |
| S3 = 623.50 | 52.83, 54.15, 55.31, 56.18, 57.15, 57.47, 57.96, 58.29, 58.76, 59.53, 59.98, 60.62, 61.38, 62.21, 63.27 | 58.34 | 2.95 |
| S4 = 600.68 | 52.69, 54.09, 55.12, 55.78, 56.86, 57.55, 58.02, 58.63, 59.12, 59.78, 60.11, 60.98, 61.58, 62.84 | 58.08 | 2.94 |
Table 7.
Parameter estimation results of initial stiffness distribution.
| Stress Level/MPa | Shape Parameter C | Scale Parameter D |
|---|---|---|
| S2 = 646.31 | 23.8008 | 59.9005 |
| S3 = 623.50 | 22.9969 | 59.6813 |
| S4 = 600.68 | 23.5257 | 59.4076 |
Disclaimer/Publisher’s Note: The statements, opinions and data contained in all publications are solely those of the individual author(s) and contributor(s) and not of MDPI and/or the editor(s). MDPI and/or the editor(s) disclaim responsibility for any injury to people or property resulting from any ideas, methods, instructions or products referred to in the content. |
© 2023 by the authors. Licensee MDPI, Basel, Switzerland. This article is an open access article distributed under the terms and conditions of the Creative Commons Attribution (CC BY) license (https://creativecommons.org/licenses/by/4.0/).
Share and Cite
MDPI and ACS Style
Gao, J.-X.; Heng, F.; Yuan, Y.-P.; Liu, Y.-Y. Fatigue Reliability Analysis of Composite Material Considering the Growth of Effective Stress and Critical Stiffness. Aerospace 2023, 10, 785. https://doi.org/10.3390/aerospace10090785
AMA Style
Gao J-X, Heng F, Yuan Y-P, Liu Y-Y. Fatigue Reliability Analysis of Composite Material Considering the Growth of Effective Stress and Critical Stiffness. Aerospace. 2023; 10(9):785. https://doi.org/10.3390/aerospace10090785
Chicago/Turabian StyleGao, Jian-Xiong, Fei Heng, Yi-Ping Yuan, and Yuan-Yuan Liu. 2023. "Fatigue Reliability Analysis of Composite Material Considering the Growth of Effective Stress and Critical Stiffness" Aerospace 10, no. 9: 785. https://doi.org/10.3390/aerospace10090785
Note that from the first issue of 2016, this journal uses article numbers instead of page numbers. See further details here.