
Parameter Identification of Pilot Model and Stability Analysis of Human-in-Loop Image Seeker

1
School of Automation, Northwest Polytechnic University, Xi’an 710072, China
2
Xi’an Modern Control Technology Research Institute, Xi’an 710065, China
*
Author to whom correspondence should be addressed.
Aerospace 2023, 10(9), 806; https://doi.org/10.3390/aerospace10090806
Submission received: 25 May 2023
/
Revised: 12 June 2023
/
Accepted: 15 June 2023
/
Published: 15 September 2023
(This article belongs to the Section Aeronautics)
Abstract
:In the human-in-loop (HIL) guidance mode, a pilot quickly identifies and flexibly locks on to a target through a real-time image signal transmitted by the aircraft. Then, the line-of-sight (LOS) angle error in the viewing field is tracked and compensated for in order to improve the guidance and control performance of the image-guided aircraft. Based on the physical structure and device parameters of the image seeker, an appropriate correction network is designed to improve the performance of the seeker stability loop. Aiming at a precise-extended crossover (PEC) pilot model, the structure of the dynamic model is optimized, and the maximum likelihood estimation (MLE) method of the output error structure is used to identify the dynamic parameters. This makes up for the deficiency of the existing modeling. In order to solve the nonlinear optimization problems encountered in the identification process, a hybrid strategy of a genetic algorithm (GA) and Gauss–Newton optimization algorithm is used to improve the probability of finding the global optimal solution. The simplex method is also used to improve the robustness of the algorithm. In addition, a hardware-in-the-loop simulation is designed and multi-round HIL experiment flow is performed. Moreover, based on the adaptability of the pilot to different image signal delays, the effects of different image signal delays on the stability and disturbance rejection rate (DRR) of the seeker control system are studied. The results demonstrate that the hybrid gradient optimization algorithm (HGOA) can find the global optimal value, and the identification model can accurately reflect the dynamic characteristics of the pilot. In the HIL guidance mode, the tracking compensation behavior of the pilot can reduce the influence of image signal delay on the disturbance of the aircraft body isolated by the seeker. The optimized PEC model and the identified dynamic parameters improve the efficiency of pilot training and screening.
1. Introduction
With the development of modern science and technology, image-guided aircraft have been highly valued for their features such as clear imaging, high accuracy, etc. [1,2,3,4,5]. As the core of image precision-guided aircraft, image guidance technology (IGT) performs object detection, identification and tracking, and provides accurate guidance information. With the rapid development of image processing, high-resolution sensors, chips and artificial intelligence, IGT has been widely studied and developed [6,7]. IGT can obtain rich imaging information with multi band, high sensitivity and high resolution, which helps in finding and identifying objects in a complex background [8,9].
The future environment is becoming more complex. In the case of long distance or similar interference, automatic target recognition (ATR) still has many technical difficulties [10,11]. Based on the recognition ability of the pilot, HIL recognition technology is suitable for object recognition under the interference of a complex environment and camouflage, and it has a high flexibility. The pilot can quickly identify and flexibly lock on to the object through the real-time image information sent back by the aircraft, and automatically track the object through the image tracker or manually through the control handle, which is referred to as HIL guidance [12,13]. Due to the limitations of quality and carrying space, optical fiber cannot be used to transmit image information over a longer distance [14]. On the other hand, data link communication using radio has the advantage of a longer transmission distance [15,16]. However, radio signals are susceptible to interference and obstruction, and the transmission and reception of image data require compression and decompression. This process will inevitably lead to image signal delay [17,18]. Therefore, the pilot cannot quickly and accurately identify and capture the object, and the phenomenon of pilot-induced oscillation (PIO) will also be potentially dangerous and paroxysmal [19,20,21].
The pilot model describes the process of the pilot controlling the optical axis of the seeker in order to track the object. When tracking manually, the pilot–seeker is a manual control system. The control loop of the image seeker with pilot dynamics will track and compensate for the error angle of the object in the field of view, so as to improve the control performance and guidance accuracy of the image-guided aircraft. Therefore, it is necessary to clarify the response of the pilot to the tracking error of the image seeker under different image signal delays in order to design the guidance and control system and improve the guidance accuracy. In the mid-20th century, researchers started to model the pilot. For instance, the PEC model [22,23] is the most representative and widely used model, which describes the dynamic characteristics of the pilot in a wider frequency range. However, in an actual control task, in order to better adapt to the dynamics of the control object and the image signal delay, the operation behavior of the pilot is mostly distributed in the higher frequency band, and it shows advanced characteristics. Afterwards, several studies on the identification of pilot model parameters used the PEC model, which contains different types of excitation signals [24]. The used identification methods included the MLE, GA and interval analysis method [25,26,27]. After the 1970s, modern control theory quickly developed. Kleinman proposed the optimal control model [28], and Hess developed the Hess structure model [19], which can accurately characterize the signal processing procedure of the pilot. In recent years, neural network and fuzzy control technologies have been frequently used in pilot modeling [29].
The parameters of the pilot model reflect the detailed characteristics of the pilot response, which can be obtained using experimental data identification. The parameter identification methods are divided into two types. The first one is the pilot response to time-invariant control objects, such as the Fourier coefficient method and MLE method [24,30]. The second one is the pilot response to time-varying control objects, such as the wavelet transform [13,31] and Kalman filtering [32] methods. The MLE method is a classical time-domain parameter identification method, which can identify model parameters directly using fitting time-domain data. Compared with frequency domain methods, time-domain parameter identification methods only use one step to fit the model, thereby reducing the bias and variance of parameter identification. In addition, the time-domain method has fewer design constraints on the excitation signal, and the frequency information of the excitation signal has less influence on the identifiability of the parameters. Zhao J.M. [33] used the auxiliary variable method to identify the parameters of the pilot model. However, he fixed the neural delay link of the pilot model and only tracked the tank target moving in a straight line. Therefore, the response of the pilot cannot be fully stimulated. Tang D.G. [34] studied the performance of the seeker loop and guidance loop in three modes: automatic tracking, manual tracking without delay and manual tracking with delay. However, the parameters of the pilot model remained unchanged in different control environments, while ignoring the adaptability of the pilot to the control environment. Potter [35] studied whether input shaping can improve the tracking performance of the pilot to a flexible system, in a manual control system with a time delay. However, the control object was limited to a low frequency and slightly damped vibration mode. In [36], the authors studied the modeling process of pilot adaptation to time-varying control dynamics in multi axis control tasks. However, the pilot model parameters were not obtained from the experimental data.
This paper focuses on the parameter identification of a pilot model and stability analysis of a human-in-loop image seeker, which mainly solves the following three problems. Firstly, based on a real image seeker model and parameters, the PEC model structure is optimized in order to solve the problem that the PEC model cannot accurately describe the pilot advanced compensation characteristics to image signal delay and the high-frequency distribution of operation behavior, compared to the work in [35]. Secondly, the pilot model dynamics parameters are identified using the HIL hardware-in-the-loop simulation system and experimental flow. A simulation experiment platform and wide-frequency random excitation signal are designed, and multiple rounds of HIL experiments are performed in order to tackle the problem of a single excitation signal and parameters that are not obtained from the parameter identification experiment, compared with the work in [33,36]. The MLE method of output error structure is used to identify the dynamic parameters, and the hybrid strategy of a GA and Gauss–Newton optimization algorithm is used to improve the probability of finding a global optimal solution. The simplex method is used to improve the robustness of the algorithm. Thirdly, the impacts of different image signal delays on the stability and DRR of the image seeker control system are studied, which solves the problem that the pilot dynamics are not considered in DRR research, compared with the work in [34].
The remainder of this paper is organized as follows. Section 2 introduces the image seeker physical model. Section 3 optimizes the PEC model structure, and proposes the method of dynamic parameter identification. Section 4 introduces the HIL hardware-in-the-loop simulation system and experimental flow. In Section 5, the impacts of different image signal delays on the stability and DRR of the seeker control system are studied. Finally, the conclusions are drawn in Section 6.
2. Image Seeker Physical Model
2.1. Seeker Physical Structure and Parameters
An image seeker usually uses an angular rate gyro platform seeker, whose control systems of pitch frame and yaw frame are independent and have a similar structure. The model representing the single channel control loop of the actual image seeker system, including the stabilization loop and tracking loop, is shown in Figure 1. As the inner loop of the tracking loop, the stabilization loop is used to isolate the angular disturbance of the aircraft, stabilize the optical axis of the seeker and improve the velocity and acceleration characteristics of the tracking system. The tracking loop controls the seeker’s optical axis movement according to the target position error information given by the pilot or image tracker under manual or automatic tracking mode, so as to perform the real-time tracking of the target [11,18,34].
When the seeker tracks the target, the image sensor is sensitive to the real-time LOS angle error. The control circuit synthesizes the LOS angle error and the feedback signal from the angular rate gyro in order to generate a control current to drive the torque motor. The latter drives the platform to rotate in order to eliminate the LOS angle error so that the seeker optical axis can track the LOS in real-time. The parameters of a certain platform seeker are given in Table 1 [37].
2.2. Stabilization Loop Correction Network
Because of friction torque, damping torque and other disturbances between the bearings, the aircraft attitude change will affect the direction and output of the seeker in inertial space. In order to eliminate projectile motion coupling, the stabilization loop is usually designed with a higher open-loop gain and wider bandwidth. The stabilization loop, based on the established image seeker control loop, is shown in Figure 2.
Based on these seeker parameters, the hysteresis correction can be designed as follows [38]:
The open-loop frequency responses of the stabilization loop before and after correction are presented in Figure 3, and the response parameters are shown in Table 2. It can be seen that the stability of the uncorrected system is low, while the addition of hysteresis correction attenuates the amplitude of the system in the high-frequency band, which reduces the amplitude crossing frequency of the system. In addition, the appropriate selection of the hysteresis correction parameters highly improves the stability of the corrected system, and therefore ensures that the corrected system can meet the requirements of both the stability margin and the decoupling capacity index.
3. Pilot Model Dynamic Parameter Identification
In image-guided weapon systems, the pilot can manipulate the handle to track the target based on the LOS angle error displayed in the image screen, until it hits the target. Therefore, understanding and modelling the pilot’s response to the image display provides insights into the pilot perception process, and plays an important role in the evaluation of aircraft control systems and training simulation equipment.
3.1. Pilot Model Structure Optimization
McRuer describes pilot behavior using the PEC pilot model [22]. The frequency coverage range of the PEC model is extended to higher and lower frequencies, compared with the pilot crossover model whose frequency application range is limited to the vicinity of the amplitude crossing frequency [22]. The pilot response to the LOS angle error consists of two components: the response of the linear transfer function and the residual signal. The residual signal is usually considered a Gaussian signal which represents the non-linear part of the pilot model, because it is difficult to quantitatively measure its magnitude. This results in the inability of quantitatively studying control system metrics. Therefore, in this paper, the effect of the residual signal on the control system is not considered when analyzing the structure of the pilot model [37,39]. In the PEC model, the linear transfer function of the pilot response to the LOS angle error is given by:
As shown in Figure 4, the PEC model consists of a balance term and a physical constraint. The neuromuscular system is represented by the second-order oscillation link, whose dynamics limit the pilot’s response to tracking LOS angle error. The crossover theorem [22] proposed by McRuer shows that, in order to better adapt to the control object dynamics, the pilot will adjust the balance term dynamics so that the frequency characteristics of the system open-loop transfer function at the crossover frequency are close to those of a single integrator system. In actual control tasks, the dynamic form of the pilot’s control object is generally similar, which is mostly distributed in a higher frequency band, and the pilot will balance it near this band [39,40]. Moreover, when the pilot tracks the LOS angle error in the image screen, it has an adaptability to the image signal delay. More precisely, a longer image signal delay results in a lead compensation instead of a lag compensation from the pilot. Due to these two reasons, it is difficult for the lag time constant , representing the low-frequency characteristics, to accurately describe the real operation behavior of pilots. Furthermore, the authors in [37] show that it is hard to obtain through an identification experiment. Hence, the structure of the PEC model expressed in Equation (2) is optimized as follows:
The following study is based on the pilot model shown in Equation (3), while the dynamic parameter vector to be identified is given by .
3.2. Dynamic Parameter Identification
Identifying the pilot model dynamic parameters from experimental measurement data is a highly nonlinear optimization problem, which results in an objective function containing many local minima besides the global minima. Compared to the frequency-domain parameter identification methods, time-domain parameter identification methods can identify the model parameters by directly fitting the time-domain data, while the excitation signal has fewer design constraints and the frequency information of the excitation signal has less influence on the parameter’s identifiability. MLE is a time-domain parameter estimation method that has been widely used in several fields [41]. It belongs to probabilistic Bayesian estimation methods. It consists of obtaining estimates of the model parameters by introducing the conditional probability density of the observations, constructing a likelihood function with the observations and the unknown parameters as independent variables, and taking the maximum probability of the observed value as the estimation criterion. In [37], the performance of the MLE algorithm is higher than that of the Fourier coefficient method in identifying the parameters of a pilot dynamic model.
The MLE method based on output error structure (OES) is used to improve identification accuracy. The hybrid gradient algorithm is used for optimization in order to deal with the problem that the gradient optimization algorithm of the parameter estimation process is sensitive to the initial values and prone to scattering. In other words, a GA is used to determine the initial value of the gradient algorithm. A Gauss–Newton algorithm is then used to speed up the operation. Finally, a simplex method is used to improve the robustness, which increases the probability of finding the global optima of a nonlinear optimization problem.
3.2.1. OES-Based MLE
Before applying the MLE method, the PEC model should be expressed in the form of state space. The pure delay link in the PEC model is a nonlinear link, which can be approximated by a high-order transfer function, such as the Padé approximation [39,42], expressed as follows:
where , is the order of the approximation.
In order to ensure an accurate description of the pure delay link at high frequency, and avoid a high approximation of the PEC model, this paper uses a fifth-order Padé approximation [25]:
Substituting the expression of into Equation (3) results in the following:
Due to the introduced Padé approximation, the coefficients in Equation (6) are nonlinear functions of the unknown identification parameters. For instance, the coefficients of the first and last terms of the denominator can be expressed as follows:
The canonical form of the state space of Equation (6) is given by:
where is the state vector of the system, is the state matrix, is the control matrix and is the output matrix expressed as follows:
Assuming that there is no influence of process noise, Equation (8) only contains an additional noise term n in the output equation. Therefore, the MLE of the OES method can be used to simplify the identification procedure. In the study of pilot model identification in [43], it is assumed that the residual signal of the pilot response is a zero-mean Gaussian noise, and this hypothesis was verified by experiments. Similarly, the residual signal n in Equation (8) is considered as a zero-mean Gaussian noise, and its mean and variance are defined as follows:
where is the discrete sampling time series of the residual signal n, and represents the serial number, such that is the number of sampling points.
The MLE method requires finding an estimate of the model parameter vector which maximizes the likelihood function. The latter defines the conditional probability density function of the prediction error:
where the prediction error is defined as the difference between the measured pilot output signal and the PEC model output signal :
According to the residual property defined in Equation (10), Equation (11) can be rewritten as follows:
It can be seen from Figure 5 that the OES requires minimizing a quadratic penalty function related to the prediction error . Hence, the penalty function is defined as the match degree between the actual and simulated data, i.e., the difference between the actual estimates and the parameter estimates. The OES uses an iterative search algorithm in order to find the optimal parameter in the parameter space, and therefore minimize the penalty function.
When applying the MLE method, the model parameter vector estimation maximizes the likelihood function. On the other hand, using the MLE of OES requires obtaining the global minimum of the logarithmic likelihood function, thus simplifying it to a more direct optimization problem. The resulting parameter vector is the maximum likelihood estimate , expressed as follows:
Equation (14) summarizes the parameter estimation problem for the PEC model, which defines a strongly nonlinear optimization problem. Similar to [39], the hybrid gradient optimization algorithm is then used to obtain the global optimal solution of this optimization problem.
3.2.2. Hybrid Gradient Optimization Algorithm
The traditional methods of solving the maximum likelihood minimum include the Levenberg–Marquardt, Gauss–Newton and Newton–Raphson methods. This paper proposes a hybrid gradient optimization algorithm (HGOA), which combines a genetic optimization algorithm and Gauss–Newton gradient optimization algorithm in order to estimate the parameters of the PEC model, as illustrated in Figure 6.
In the absence of a priori knowledge, the HGOA firstly applies the GA for the initial iteration, and then optimizes Equation (14) using the Gauss–Newton and simplex method algorithms. Because a large initial error may lead to scattered parameter estimates, the GA is used at the initial moment of the calculation in order to reduce the sensitivity of the algorithm to the initial value. In addition, Gauss–Newton has a fast convergence speed. However, it will produce inaccurate gradient information and lead to divergence when it is far from the real solution. Hence, in order to enhance the robustness of the algorithm, when the Gauss–Newton algorithm diverges, it is switched to the Nelder–Mead simplex method in the next iteration until the Gauss–Newton algorithm converges.
Due to the inherent randomness of a GA and the search for the optimal solution in the initial parameter vector set, the algorithm has a high probability of finding the global optimal value of the problem [44]. The GA first requires creating an initial population, i.e., the initial parameter vector set. The latter is randomly selected on the upper and lower bounds of the parameters, and it is represented by the following matrix:
where represents the number of model parameters, denotes the number of the parameter vector, element in each row represents the model parameter in the parameter vector, and each row of the population matrix represents the gene sequence of an individual.
The GA selects the individuals with higher fitness using gene manipulation. The population size should be large enough for each generation in order to have a high probability of searching for the global optimum.
The fitness of each individual in the population is assessed by the objective function presented in Equation (14). Figure 7 shows the process of generating a new population by applying three gene manipulations to each individual of the current population. The detailed steps are given by:
- Select: the fittest individuals are selected from the current population and copied to the next generation.
- Crossover: two individuals are randomly selected from the current population. The position of the crossover point in the gene is randomly selected to simulate the reproduction phenomenon in the evolution process, and therefore, the individuals with brand-new genes are obtained.
- Mutate: the current individual gene randomly selects the mutation point to change with a small probability, and then produces the new individual.
These steps are repeated until the termination condition is met. Because a GA uses probability search technology, the transfer mode and relationship from one search point to another are uncertain, which leads to inconsistent results in each iteration. Hence, the GA cannot be used only to estimate the PEC model parameters based on test data. The PEC model parameters estimated by the GA are very close to the global optimal solution. Furthermore, in order to obtain an accurate parameter estimation, the solution of the GA is used as the initial parameter estimation of the Gauss–Newton optimization algorithm. This gradient-based optimization algorithm is a classical method for solving MLE optimization problems [39,41]. The iterative equation of the Gauss–Newton optimization algorithm is given by:
where is the iterative value of the parameter vector at step , and is the gradient of the likelihood function relative to the model parameters which can be obtained by calculating the Jacobian matrix of the model output relative to .
The derivation process is presented in Appendix A.
In addition, to prevent the Gauss–Newton optimization algorithm from diverging and terminating the iteration, the algorithm is switched to the Nelder–Mead simplex method. The Nelder–Mead simplex method is a multi-dimensional direct search approach for local optimization. It adapts itself to the local landscape and contracts on to the final minimum. It is efficient and computationally compact. Its detailed process is provided in [45].
In this study, the residual variance of the PEC model is unknown. Its estimated value is provided in [46]:
It can be seen that the variance estimate is related to the model parameter vector . For actual optimization, the relaxation technique is often used to optimize the objective function shown in Equation (14). It consists in alternately estimating the variance and the model parameter vector . More precisely, a variance estimate is obtained based on a fixed model parameter vector , by fixing . The variable to be optimized then becomes . When the iteration step is very small, the variance estimate is calculated based on the current model parameter vector . Finally, these steps are repeated until the convergence criteria are met.
4. HIL Simulation Experiment
4.1. Experimental Setup
In HIL guidance, the pilot controls the inner loop of seeker, and its dynamic characteristics slightly change. In the parameter identification experiment of the pilot model, the pilot tracks and compensates for the error angle of the target in the field of view. In order to make the excitation signal have a wide frequency range and high signal-to-noise ratio, and show a certain randomness, the excitation signal was designed as the superposition of some sinusoidal signals [47]:
In order to fully excite the pilot’s response, the spectrum of the excitation signal should be distributed halfway between high frequency and low frequency. Therefore, the frequency of the sinusoidal signal was designed to be evenly distributed in , according to the logarithmic scale. The amplitude distribution was similar to a first-order low-pass filter.
The variance of the excitation signal was defined as the integral of the square of the sinusoidal signal amplitude. The relationship is shown in Equation (19), and the derivation process is provided in Appendix B.
In addition, Damveld [40] mentioned that the phase has a small effect on the experimental results and was randomly selected. The excitation signal with a number of sinusoidal signals is shown in Figure 8. It can be seen that the maximum field angle is less than 15 degrees.
Figure 9 shows the hardware-in-the-loop simulation system and HIL experimental flow. The dynamic simulation module was developed on the basis of embedded system RTX, which collects the output of the handle and simulates the dynamic of the seeker system in real-time (cf. Figure 1), with a calculation frequency of 1000 Hz. The display module was developed using vista2D+MFC to present the LOS error angle through the UDP communication protocol. According to the error signal, the participants manipulate the handle to point the optical axis of the seeker to the target in order to reduce tracking error. It can be seen from the test time axis of Figure 9 that a preparation time of 10 s was set as the initial transient response time before the test in order to ensure that the participants could stably track the error signal. The test was divided into two stages:
- Training stage: the participants were trained for five rounds. The duration of each test round was 90 s. A fade-in time of 6 s and a fade-out time of 4 s was introduced to make the participants adapt to the task and turn into a linear control behavior.
- Test stage: it was performed under three conditions; no delay condition (phase I), small delay condition (phase II) and large delay condition (phase III). Phase II and phase III displayed the field error angle with an image signal delay of and , respectively. As in the training stage, the participants also conducted five rounds of tests.
Six participants were selected to perform the HIL experiment. Participant A as a “new-hand”, did not carry out the preliminary training stage, but only carried out the test stage of five rounds. As an “old-hand”, participants B~F had five rounds of early training, and then five rounds of testing. During the test phase, a short rest period was provided to prevent the participants from becoming fatigued. After each test round, the participants were informed of their tracking score, so as to motivate them to improve their tracking performance during the initial familiarity period and maintain a stable performance after reaching a certain proficiency level. Mcruer [22] believes that participants need a transition process in order to adapt to changes in the dynamics of the controlled object. During the transition process, participants still maintain the original control mode, and then gradually adapt to the dynamic characteristics of the controlled object, and finally complete the compensation operation. In this experiment, the fade-in time provided sufficient time for the participants to make their control strategy adapt to the dynamics of the changed controlled object. That is, a delay link was added to the control loop.
4.2. Dynamic Parameter Selection
The signals of all the participants were recorded in the experiment. In order to reduce the signal noise influence and improve the accuracy of the pilot model parameter estimation, repeated experimental signals of all the participants were averaged. Taking “old-hand” participant B as an example, Figure 10 shows the LOS error angle signal, output signal, excitation signal (LOS angle) and tracking signal (optical axis space angle) for 25 s before the test. It can be seen from Figure 10c that participant B successfully aligned the optical axis with the target.
Figure 11 presents the amplitude spectrum of all the signals of Figure 10, where the frequency of the excitation signal shown in Figure 8a is indicated by a circle. It can be seen that, in the whole control loop, all the signals had a high signal-to-noise ratio at the excitation frequency, which met the requirements of the identification experiment.
The LOS error angle signal and pilot output signal in Figure 10 were used to identify the pilot model parameter vector in Equation (3). The HGOA (cf. Figure 6) was used. The GA was iterated 100 times before the GN optimization algorithm was used. The upper and lower bounds of the GA parameter field were set as shown in Table 3. The lower bound of the parameter field was set to 0, while the upper bound was set large enough to make the initial parameter field include all the possible solutions. In the process of GA optimization, the crossover probability and mutation probability of genes were set to 0.7 and 0.1, respectively. In order to simplify the calculation, the initial residual variance identification value was set to 1. After the GA iteration, the result was used as the initial value for the GN optimization. If the iteration step of the parameter vector, objective function and residual variance identification value were smaller than the convergence index, the GN iterations were stopped.
GA is a search algorithm based on a probabilistic heuristic. The results of each iteration are not exactly the same under a certain iteration step constraint. The GA identification operation was repeated several times for the experimental results of each participant, and the eight solutions with the smallest iteration results were substituted into the GN algorithm for further optimization. Figure 12 shows all the iterative processes of these eight solutions for “old-hand” participant B. It can be seen that the final values given by the GA are different after eight repetitions. After performing the optimization using the GN algorithm, the same results were obtained. In other words, the value of the global minimum logarithmic likelihood function was obtained, and the corresponding model parameters were the identification results. Because the initial identification values of the residual variance in the two optimization algorithms were both set to 1, the obtained objective function values were large. Finally, the identification value of each algorithm was obtained through the previously mentioned alternate iteration process.
One hundred initial parameter vectors were randomly selected from the parameter domain in Table 3. The HGOA was used for optimization. The obtained results are presented in Figure 13, in ascending order. It can be seen that the HGOA can highly reduce the initial value selection, and accurately converge to the global minimum.
The test data of all the participants were collected for 80 s in the middle of the five rounds of the test stage. The parameter estimation value was first obtained using the MLE method. The global optimal solution was then determined using the HGOA, so as to obtain the dynamic parameter vector . Figure 14 shows the difference in the mean value of the frequency response obtained by participant B, after five rounds of test stage. Under the same excitation signal and control object conditions, participant B had a very similar frequency response in the training stage and phase I stage. This shows that participant B had a good training effect and reached the control level of the “old-hand”. In addition, the frequency response of participant B had clear adaptive changes to the time delay. Its amplitude at low frequency decreased to ensure the stability margin of the seeker loop, and it provided the lead phase to compensate for the impact of the time delay. The identification results of all the participants are shown in Table 4. Due to the individual differences of the participants and different control strategies, the experimental results were slightly different.
Figure 15 shows the Bode diagram of the identification model for all the participants. It can be seen that the amplitude frequency characteristics of participant A are significantly lower than those of other participants, which resulted in a lower tracking performance. In order to more truly and generally reflect the dynamic characteristics of the pilots, the identification results of participants B~F were selected for further analysis.
The correlation coefficient is generally used to evaluate the accuracy of an identification model. It can be used to represent the ability of the identification model output to reproduce the measured output. If is close to 1, the output of the identification model can well fit the measurement output, and the identification model can truly reflect the dynamic characteristics of the actual object. On the other hand, if is close to 0, the identification result is poor and the dynamic characteristics of the actual object are not captured. is expressed as follows [48]:
Figure 16 shows a comparison between the measured output of participant B and the PEC model output. It can be seen that the output of the PEC model can better fit the measured output. Table 5 shows the values of all the participants. It can be seen that the values of the PEC model for participants B~F are greater than 70%. Therefore, the PEC identification model can better fit and reflect the dynamic characteristics of the pilots.
It can be seen from Figure 14 that trained pilots will adjust their control behavior in order to adapt to the dynamic changes of the controlled object caused by time delay. Simultaneously, it can be observed from Table 4 that differences in the identification results of trained pilots exist. The difference of pilot dynamics in [33] is mainly reflected in the visual perception lead time constant and visual perception response delay . Moreover, the of trained pilots is usually stable at almost 0.15 s. Thus, based on the identification results of participants B~F (cf. Table 4), the average value of was considered and the value range of was given, so as to represent the different control strategies and tracking compensation behaviors used by different pilots when facing the dynamic changes of the controlled object caused by delay. The values of the dynamic parameter vector are presented in Table 6.
It can be seen from the Bode diagram shown in Figure 14 and Figure 15 that the dynamic response of the new-hand and old-hand are quite different. The dynamic response of the new-hand trained by the simulator can be expressed by the PEC model shown in Equation (3). When the dynamic parameters of the new-hand meet Table 6, they can be judged to have a good operation performance and meet the conditions for becoming a professional pilot, so as to improve the efficiency of the pilot training and screening.
Figure 17 shows the open-loop frequency response (Bode diagram) of the seeker tracking loop, including the image signal delay, pilot link and stabilization loop. Figure 17 validates the crossing theorem proposed by McRuer. That is, in the amplitude frequency characteristic curve, the slope at the amplitude crossover frequency is almost , while the slope at the high-frequency input area is less than , because the participants have an adaptive advance adjustment behavior when dealing with image signal delay.
5. HIL Image Seeker Stability Analysis
5.1. Stability Domain Analysis
It can be seen from Figure 14 that participants will adjust their control behavior according to the existence of delay and the delay length, when the LOS angle error is displayed. For example, they will provide lead phase to compensate for the delay impact, and adaptively adjust their own response delay , so as to improve the tracking performance.
Therefore, it is important to clarify the influence of the variation of the typical pilot model parameters on the stability of the image seeker under different image signal delays, for the design of the guidance control system and improvement of guidance accuracy. The influence of the pilot model parameters and on the stability of the seeker control system was studied according to the image seeker control loop shown in Figure 1. The closed-loop transfer function of the seeker stabilization loop is given by:
The dominant pole plays an important role in the transient response of the system. Therefore, by combining the lag correction network shown in Equation (1) and the platform seeker parameters shown in Table 1, Equation (21) is approximately equivalent to the following:
The open-loop transfer function of the seeker tracking loop is given by:
The stability margin represents the relative stability of the control system, including the amplitude margin and phase margin. The phase margin is expressed as follows:
The physical meaning of is that, when lags behind the angle, the system is in a critical stable state, and is generally considered.
The Nyquist stability criterion plays an important role in the frequency domain control theory, which can obtain the stability degree of the system. Equations (25) and (26), respectively, present the relationship between the image signal delay and the seeker tracking loop open-loop gain under the change of the visual perception lead time constant , and under the change of the visual perception response delay , when the phase margin is and according to the Nyquist stability criterion. The derivation process is provided in Appendix C.
The stability region of the seeker under different parameter changes of the pilot model is shown in Figure 18. The stability region at special values is shown in Table 7. It can be seen that the larger the phase margin (or the longer the image signal delay ), the smaller the stability region of the seeker, and therefore, the smaller the designed open-loop gain . This reduces the seeker speed of target tracking. In addition, the smaller the visual perception lead time constant (or the greater the visual perception response delay ), the smaller the stability region of the seeker, and therefore, the smaller the designed open-loop gain .
5.2. Disturbance Rejection Rate Analysis
The DRR of the seeker is an important index that characterizes its isolation ability to projectile disturbance. The greater the DRR, the lower the seeker’s ability to isolate the projectile disturbance. In order to achieve the stability of the seeker optical axis in the inertial space, the DRR should be reduced as much as possible in the seeker design. At present, the existing research on DRR [49,50,51,52,53,54] is limited to its amplitude percentage at the typical frequency, without considering the influence of the pilot dynamics in a real application. However, the DRR amplitude characteristics at different frequencies are generally concerned with engineering applications. In addition, the amplitude characteristics of the seeker DRR vary with the frequency change. Hence, the influence of the pilot dynamics on the DRR amplitude characteristics at different frequencies should be clarified in engineering applications.
The interference torque is generated by the relative rotation between the seeker frame and the base, which is the main factor leading to the DRR of platform seeker. It mainly includes spring torque and damping torque. The simplified model shown in Figure 19 is used to analyze the influence of the interference torque on the DRR and output accuracy of the seeker [49]. In the process of aircraft flight, the aircraft attitude disturbance is partially coupled to the seeker, so that the output LOS angular velocity has an error. The seeker DRR represents the decoupling ability of seeker to aircraft disturbance. It is defined as follows:
where is an additional component of the seeker output caused by projectile disturbance.
In an aircraft guidance system, due to the existence of DRR, the seeker outputs the wrong LOS angular velocity, which is introduced into the guidance system. It then generates an overload instruction according to the guidance law and passes it to the autopilot. The actuator on the aircraft deflects according to the control command, changes the aircraft attitude, and generates the aircraft motion. The motion passes through the seeker DRR model and causes the seeker to produce an error output. The block diagram of the platform seeker DRR under interference torque is shown in Figure 20. Considering the pilot model, the DRR transfer function caused by interference torque is given by:
The parameter settings are presented in Table 8. Figure 21 shows the variation of the DRR amplitude near projectile frequency with different signal delays. It can be seen from Figure 21 that:
- When the pilot dynamics are not introduced into the system, the DRR is highly affected by the signal delay. In the vicinity of the projectile frequency, with the increase in signal delay, the DRR amplitude increases, resulting in the reduction of the seeker’s ability to isolate the projectile disturbance. In addition, the influence of signal delay on the DRR decreases with the increase in the projectile frequency. Therefore, when there is no pilot to track and compensate for the LOS error angle in the field of view, the large signal delay will reduce the stability of the seeker’s optical axis in the inertial space.
- When pilot dynamics are introduced into the system, the pilot will track and compensate for the LOS error angle in the field of view. The change of signal delay has a small influence on the DRR amplitude of the seeker.
6. Conclusions
The proposed optimized pilot model describes more accurately the pilot’s lead compensation characteristics for the image signal delay and high-frequency distribution of operation behavior. Multi-round HIL experiments were performed based on the simulation platform, and a wide frequency random excitation signal was designed to fully stimulate the pilot’s response. MLE was used to identify the dynamic parameters of the PEC model. In addition, the GA and HGOA were used to find the global optimal solution, while the simplex method was used to improve the robustness of the algorithm, so as to solve the nonlinear optimization problems encountered in the identification process. Moreover, the impacts of different image signal delays on the stability and DRR of image seeker control system were studied.
The simulation experiment shows that in the HIL tracking mode, the longer the image signal delay, the smaller the stability region of the seeker. This results in a slower seeker tracking speed and a larger error angle during stable tracking, which can easily cause the target to escape from the probe field. The adaptive control behavior of the pilot compensates for the phase lag caused by the signal delay to a certain extent. The smaller the visual perception lead time constant (or the larger the visual perception response delay ), the smaller the stability region of the seeker, and therefore, the slower the seeker tracking speed. When the pilot dynamics are introduced into the system, the pilot will track and compensate for the error angle of the probe field, and the change in image signal delay has a small impact on the DRR amplitude of the seeker. Furthermore, the optimized PEC model and identified dynamic parameters improve the efficiency of the pilot training and screening.
Author Contributions
Conceptualization, Y.Z. and T.L.; Methodology, Y.L.; Software, Y.Z.; Validation, G.W. and T.L.; Formal Analysis, Y.L.; Investigation, T.L.; Resources, Y.Z.; Data Curation, G.W.; Writing—Original Draft Preparation, Y.Z. and T.L.; Writing—Review and Editing, Y.L. and G.W.; Visualization, Y.Z.; Supervision, T.L.; Project Administration, Y.L.; Funding Acquisition, G.W. All authors have read and agreed to the published version of the manuscript.
Funding
This research was funded by the National Natural Science Foundation of China, grant number 61827901.
Data Availability Statement
Not applicable.
Conflicts of Interest
The authors declare no conflict of interest.
Nomenclature
| Line of sight (LOS) angle, | |
| Seeker optical axis angle, | |
| LOS angle error, | |
| Pitch angle, | |
| Seeker frame angle, | |
| Image signal time delay, s | |
| Residual signal | |
| Pilot’s output signal | |
| Operational amplifier of tracking loop | |
| Operational amplifier of stabilization loop | |
| Torque constant, | |
| Inductance, H | |
| Resistance, | |
| Motor moment of inertia, | |
| Motor input voltage, | |
| Open-loop gain | |
| Natural frequency of rate gyro, Hz | |
| Damping coefficient of rate gyro | |
| Back EMF constant, | |
| Amplitude margin, | |
| Phase margin, degree | |
| Amplitude crossing frequency, Hz | |
| Visual perception gain of PEC model | |
| Amplitude of sinusoidal signal | |
| Frequency of sinusoidal signal | |
| Phase of sinusoidal signal | |
| Track loop amplifier gain | |
| Damping moment coefficient | |
| Visual perception response delay, s | |
| Spring moment coefficient | |
| Visual perception lead time constant of PEC model | |
| Visual perception lag time constant of PEC model | |
| Neuromuscular system damping of PEC model | |
| Neuromuscular system natural frequency of PEC model, | |
| N is the number of sinusoidal signals |
Appendix A
is the gradient of the likelihood function relative to the model parameters. It can be obtained by calculating the Jacobian matrix of the model output relative to parameter vector :
The Fisher information matrix can be expressed as follows:
Equation (16) requires that be invertible. By solving , the Cramér–Rao Lower Bound (CRLB) [55] can be obtained, that is, the minimum variance achievable for parameter estimation. When there are too many unknown model parameters or insufficient information in the data, tends to become pathological or singular, which results in a too-large iteration step size in some directions, or is irreversible. Thus, the singular value decomposition and inversion of is given by:
where are, respectively, the row of matrix and , and are singular values of having the following descending order:
In general, the smallest singular values contain less matrix information and lead to a pathological or irreversible . The criterion of eliminating the small singular values is given by:
where is the computational accuracy of the computer and is the largest singular value.
Based on the reduced-order algorithm of matrix inversion [46], if there are singular values that satisfy the eliminating criterion shown in Equation (A5), the order of reduces from to .
Appendix B
The variance of the excitation signal is defined as the integral of the signal amplitude square. It can be expressed as follows:
By substituting Equation (18) into Equation (A6), the following is obtained:
where T is the duration of the excitation signal, and is the frequency of the sinusoidal signal.
When the condition () is satisfied, Equation (A7) can be expressed as follows:
Note that Equation (A8) is the derivation process of Equation (19).
Appendix C
According to Table 6, by setting the parameters to , the open-loop transfer function of the image seeker tracking loop is given by:
where the open-loop gain is .
Equation (A9) is written in the plural form:
where .
According to the Nyquist stability criterion, the stability condition is given by:
By substituting Equation (A10) into Equation (A11), the following is obtained:
Assuming that the ballistic variation of the air-to-ground aircraft and anti-tank aircraft studied in this paper is small, and the frequency of the seeker input signal is low (i.e., is small), then:
Hence, the relationship between image signal delay and seeker tracking loop open-loop gain , under the change of visual perception lead time constant , is expressed as Equation (25).
According to Table 6, the parameters are set to . Similarly, the relationship between image signal delay and seeker tracking loop open-loop gain , under the change of visual perception response delay , is expressed as Equation (26).
References
- Yang, Z.; Wang, H.; Lin, D.F. Time-varying biased proportional guidance with seeker’s field-of-view limit. Int. J. Aerosp. Eng. 2016, 2016, 9272019. [Google Scholar] [CrossRef]
- Mao, D.P.; Ding, J.W.; Wang, G.H. Key Technology of Semi-strapdown Stabilization in Engineering Application. Laser Infrared 2012, 42, 1171–1176. [Google Scholar]
- Trivedi, P.K.; Bandyopadhyay, B.; Mahata, S. Roll stabilization: A higher-order sliding-mode approach. IEEE Trans. 2015, 51, 2489–2496. [Google Scholar] [CrossRef]
- Chen, C.B.; Chen, S.F.; Hu, G.S.; Chen, B.; Chen, P.; Su, K. An auto-landing strategy based on pan-tilt based visual servoing for unmanned aerial vehicle in GNSS-denied environments. Aerosp. Sci. Technol. 2021, 116, 106891. [Google Scholar] [CrossRef]
- Wang, H.; Lin, D.F.; Cheng, Z.; Wang, J. Optimal guidance of extended trajectory shaping. Chin. J. Aeronaut. 2014, 27, 1259–1272. [Google Scholar] [CrossRef]
- Alatawi, H.; Albalawi, N.; Shahata, G. Augmented Reality-Assisted Deep Reinforcement Learning-Based Model towards Industrial Training and Maintenance for NanoDrop Spectrophotometer. Sensors 2023, 23, 6024. [Google Scholar] [CrossRef]
- Meng, Y.; Wang, W.; Han, H.; Ban, J. A visual/inertial integrated landing guidance method for UAV landing on the ship. Aerosp. Sci. Technol. 2019, 85, 474–480. [Google Scholar] [CrossRef]
- Aasen, H.; Honkavaara, E.; Lucieer, A.; Zarco-Tejada, P.J. Quantitative remote sensing at ultra-high resolution with UAV spectroscopy: A review of sensor technology, measurement procedures, and data correction workflows. Remote Sens. 2018, 10, 1091. [Google Scholar] [CrossRef]
- Wang, J.; Ding, J.; Ran, S.; Qin, S.; Liu, B.; Li, X. Automatic Pear Extraction from High-Resolution Images by a Visual Attention Mechanism Network. Remote Sens. 2023, 15, 3283. [Google Scholar] [CrossRef]
- Jia, J.Q.; Duan, H.B. Automatic recognition system for unmanned aerial vehicle via backpropagation artificial neural network. Aircr. Eng. Aerosp. Technol. 2017, 89, 145–154. [Google Scholar] [CrossRef]
- Yang, L.; Liu, S.; Zhao, Y. Deep-Learning Based Algorithm for Detecting Objects in Infrared Images. Appl. Sci. 2022, 12, 3322. [Google Scholar] [CrossRef]
- Mulder, M.; Pool, D.M.; Abbink, D.A.; Boer, E.R.; Zaal, P.M.T.; Drop, F.M.; van der El, K.; van Paassen, M.M. Manual control cybernetics: State-of-the-art and current trends. IEEE Trans. Hum.-Mach. Syst. 2018, 48, 468–485. [Google Scholar] [CrossRef]
- Dubus, G.; David, O.; Measson, Y.; Friconneau, J.-P. PREFIT project: Integration of man-in-the-loop and automation for manipulation of heavy loads and forces in ITER. Fusion Eng. Des. 2008, 84, 698–702. [Google Scholar] [CrossRef]
- Kaushal, H.; Kaddoum, G. Applications of lasers for tactical military operations. IEEE Access 2017, 5, 20736–20753. [Google Scholar] [CrossRef]
- Amoah, A.; Bao, J.; Philip, A.K.; Mawuli, E.S. Microwave super high frequency antenna for satellite communication systems, radar, aircraft navigation, radio astronomy, remote sensing and communications. In Proceedings of the 2018 IEEE Symposium on Product Compliance Engineering, Boston, MA, USA, 12–13 November 2018. [Google Scholar]
- Khan, M.F.; Yau, K.-L.A.; Ling, M.H.; Imran, M.A.; Chong, Y.-W. An Intelligent Cluster-Based Routing Scheme in 5G Flying Ad Hoc Networks. Appl. Sci. 2022, 12, 3665. [Google Scholar] [CrossRef]
- Zhang, Y.; Sun, L.; Shen, J.; Lee, K.Y.; Zhong, Q.-C. Iterative tuning of modified uncertainty and disturbance estimator for time-delay processes: A data-driven approach. Isa Trans. 2019, 84, 164–177. [Google Scholar] [CrossRef] [PubMed]
- Hong, J.H.; Park, S.S.; Lee, C.H.; Ryoo, C.-K. Study on parasite effect with strapdown seeker in consideration of time delay. J. Guid. Control Dyn. 2019, 42, 1383–1392. [Google Scholar] [CrossRef]
- Xu, S.T.; Tan, W.Q.; Efremov, A.V.; Sun, L.; Qu, X. Review of control models for human pilot behavior. Annu. Rev. Control 2017, 44, 274–291. [Google Scholar] [CrossRef]
- Perng, J.W. Application of parameter plane method to pilot-induced oscillations. Aerosp. Sci. Technol. 2012, 23, 140–145. [Google Scholar] [CrossRef]
- Hess, R.A. Analysis of aircraft attitude-control systems prone to pilot-induced oscillations. J. Guid. Control Dyn. 1984, 7, 106–112. [Google Scholar] [CrossRef]
- Yu, B.; Gillespie, R.B.; Freudenberg, J.S.; Cook, J.A. Identification of human feedforward control in grasp and twist tasks. In Proceedings of the 2014 American Control Conference, Portland, OR, USA, 4–6 June 2014; pp. 2833–2838. [Google Scholar]
- Mcruer, D.T.; Jex, H.R. A review of quasi-linear pilot models. IEEE Trans. Hum. Factors Electron. 1967, 8, 231–249. [Google Scholar] [CrossRef]
- Pool, D.M.; Zaal, P.M.T.; Van-Paassen, M.M.; Mulder, M. Identification of multimodal pilot models using ramp target and multisine disturbance signals. J. Guid. Control Dyn. 2011, 34, 86–97. [Google Scholar] [CrossRef]
- Kirill, Z.; Frank, C. Genetic algorithm based approach for parameters estimation of the Hess operator model. In Proceedings of the AIAA Modeling and Simulation Technologies Conference and Exhibit, Hilton Head, SC, USA, 20–23 August 2007; AIAA: Reston, WV, USA, 2007; pp. 1–13. [Google Scholar]
- Van-Kampen, E.; Zaal, P.M.T.; De-Weerdt, E.; Chu, Q.P.; Mulder, J.A. Optimization of human perception modeling using interval analysis. J. Guid. Control Dyn. 2010, 33, 42–52. [Google Scholar] [CrossRef]
- Zaal, P.M.T.; Pool, D.M.; Chu, Q.P.; Van Paassen, M.M.; Mulder, M.; Mulder, J.A. Modeling human multimodal perception and control using genetic maximum likelihood estimation. J. Guid. Control Dyn. 2009, 32, 1089–1099. [Google Scholar] [CrossRef]
- Kleinman, D.L.; Baron, S.; Levison, W.H. An optimal control model of human response part I: Theory and validation. Automatica 1970, 6, 357–369. [Google Scholar] [CrossRef]
- Wang, L.; Zhu, Q.; Zhang, Z.; Dong, R. Modeling pilot behaviors based on discrete-time series during carrier-based aircraft landing. J. Aircr. 2016, 53, 1922–1931. [Google Scholar] [CrossRef]
- Zaal, P.M.T. Manual control adaptation to changing vehicle dynamics in roll-pitch control tasks. J. Guid. Control Dyn. 2016, 39, 1046–1058. [Google Scholar] [CrossRef]
- Yang, X.; Zhou, Y.; Zhou, D.; Yang, R.; Hu, Y. A new infrared small and dim object detection algorithm based on multi-directional composite window. Infrared Phys. Technol. 2015, 71, 402–407. [Google Scholar] [CrossRef]
- Pires, D.S.; Serra, G.L.D. Methodology for Evolving Fuzzy Kalman Filter Identification. Int. J. Control Autom. Syst. 2019, 17, 793–800. [Google Scholar] [CrossRef]
- Zhao, J.M.; Hu, G.H.; Duan, C.L. The research on pilot modeling in the imaged-guided aircraft of ‘Human-in-the-Loop’. J. Proj. Rocket. 2012, 32, 74–76. [Google Scholar]
- Tang, D.G.; Zhang, G.P.; Du, X. The research on the influence of human-in-the-loop on aircraft guidance performance. Aero Weapon. 2018, 3, 24–30. [Google Scholar]
- Potter, J.J.; Singhose, W.E. Effects of input shaping on manual control of flexible and time-delayed systems. Hum. Factors J. Hum. Factors Ergon. Soc. 2014, 56, 1284–1295. [Google Scholar] [CrossRef] [PubMed]
- Hess, R.A. Modeling human pilot adaptation to flight control anomalies and changing task demands. J. Guid. Control Dyn. 2016, 39, 655–666. [Google Scholar] [CrossRef]
- Wu, J.X. Research on Key Guidance Technologies Based on Optical Imaging Seeker. Ph.D. Dissertation, Beijing Institute of Technology, Beijing, China, 2019. [Google Scholar]
- Du, Y.L.; Xia, Q.L.; Qi, Z.K. Research on effect of seeker disturbance rejection rate with phase lag on stability of parasitical loop. Acta Armamentarii 2011, 32, 28–32. [Google Scholar]
- Wu, J.X.; Lin, D.F.; Wang, H.; Yuan, Y. Identification of pilot model using maximum likelihood estimation and hybrid gradient optimization. Acta Armamentarii 2018, 39, 2399–2409. [Google Scholar]
- Beerens, G.C.; Damveld, H.J.; Mulder, M.; Van-Paassen, M.M. Design of forcing functions for identification of human control behavior. J. Guid. Control Dyn. 2010, 33, 1064–1081. [Google Scholar]
- Mehra, R.K.; Prasanth, R.K. Time-domain system identification methods for aeromechanical and aircraft structural modeling. J. Aircr. 2004, 41, 721–729. [Google Scholar] [CrossRef]
- Partington, J.R. Some frequency-domain approaches to the model reduction of delay systems. Annu. Rev. Control 2004, 28, 65–73. [Google Scholar] [CrossRef]
- Nieuwenhuizen, F.M.; Zaal, P.M.T.; Mulder, M.; Van Paassen, M.M.; Mulder, J.A.; Van Paassen, R. Modeling human multichannel perception and control using linear time-invariant models. J. Guid. Control Dyn. 2008, 31, 999–1013. [Google Scholar] [CrossRef]
- Li, D.; Wang, Y. Parameter identification of a differentiable Bouc-Wen model using constrained extended Kalman filter. Struct. Health Monit. 2021, 20, 360–378. [Google Scholar] [CrossRef]
- Nelder, J.A.; Mead, R. A simplex method for function minimization. Comput. J. 1965, 7, 308–313. [Google Scholar] [CrossRef]
- Klein, V.; Morelli, E.A. Aircraft System Identification: Theory and Practice; AIAA: Reston, VA, USA, 2006. [Google Scholar]
- Wang, H.; Li, T.; Tang, D.G. Optimization and identification of pilot model and its influence on image guidance. Acta Aeronaut. Astronaut. Sin. 2021, 42, 466–479. [Google Scholar]
- Cruz, R.V.; Góes, L.C.S. Results of short-period helicopter system identification using output-error and hybrid search-gradient optimization algorithm. Math. Probl. Eng. 2010, 2010, 242–256. [Google Scholar] [CrossRef]
- Li, F.G.; Xia, Q.L.; Cui, X.X.; Qi, Z. Effect of Seeker Disturbance Rejection Rate Parasitic Loop on Line of Sight Rate Extraction. J. Astronaut. 2013, 34, 1073–1077. [Google Scholar]
- Li, W.; Wen, Q.Q.; Yang, Y. Stability analysis of spinning aircrafts induced by seeker disturbance rejection rate parasitical loop. Aerosp. Sci. Technol. 2019, 90, 194–208. [Google Scholar] [CrossRef]
- Hu, O.L.; Wang, J.; Huang, P.; Lin, D.; Yang, Z. Effect of Disturbance Rejection Rate on Semi-Strapdown Seeker and On-line Compensation of STUKF. Infrared Laser Eng. 2017, 46, 0331002. [Google Scholar]
- Sadhu, S.; Ghoshal, T.K. Sight line rate estimation in aircraft seeker using disturbance observer-based technique. IEEE Trans. Control Syst. Technol. 2011, 19, 449–454. [Google Scholar] [CrossRef]
- Yu, Y.; Wang, H.L.; Li, N.; Zhang, H.; Su, Z.; Shao, X. Finite-time model-assisted active disturbance rejection control with a novel parameters optimizer for hypersonic reentry vehicle subject to multiple disturbances. Aerosp. Sci. Technol. 2018, 79, 588–600. [Google Scholar] [CrossRef]
- Song, J.M.; Cai, G.H.; Kong, L.X.; Fan, J. Precision Analysis of the Semi-Strapdown Homing Guided System. J. Aerosp. Eng. 2014, 27, 151–167. [Google Scholar] [CrossRef]
- Montgomery, D.C.; Peck, E.A.; Vining, G.G. Introduction to Linear Regression Analysis; John Wiley & Sons: New York, NY, USA, 2001. [Google Scholar]
Figure 1.
Control loop of image seeker.
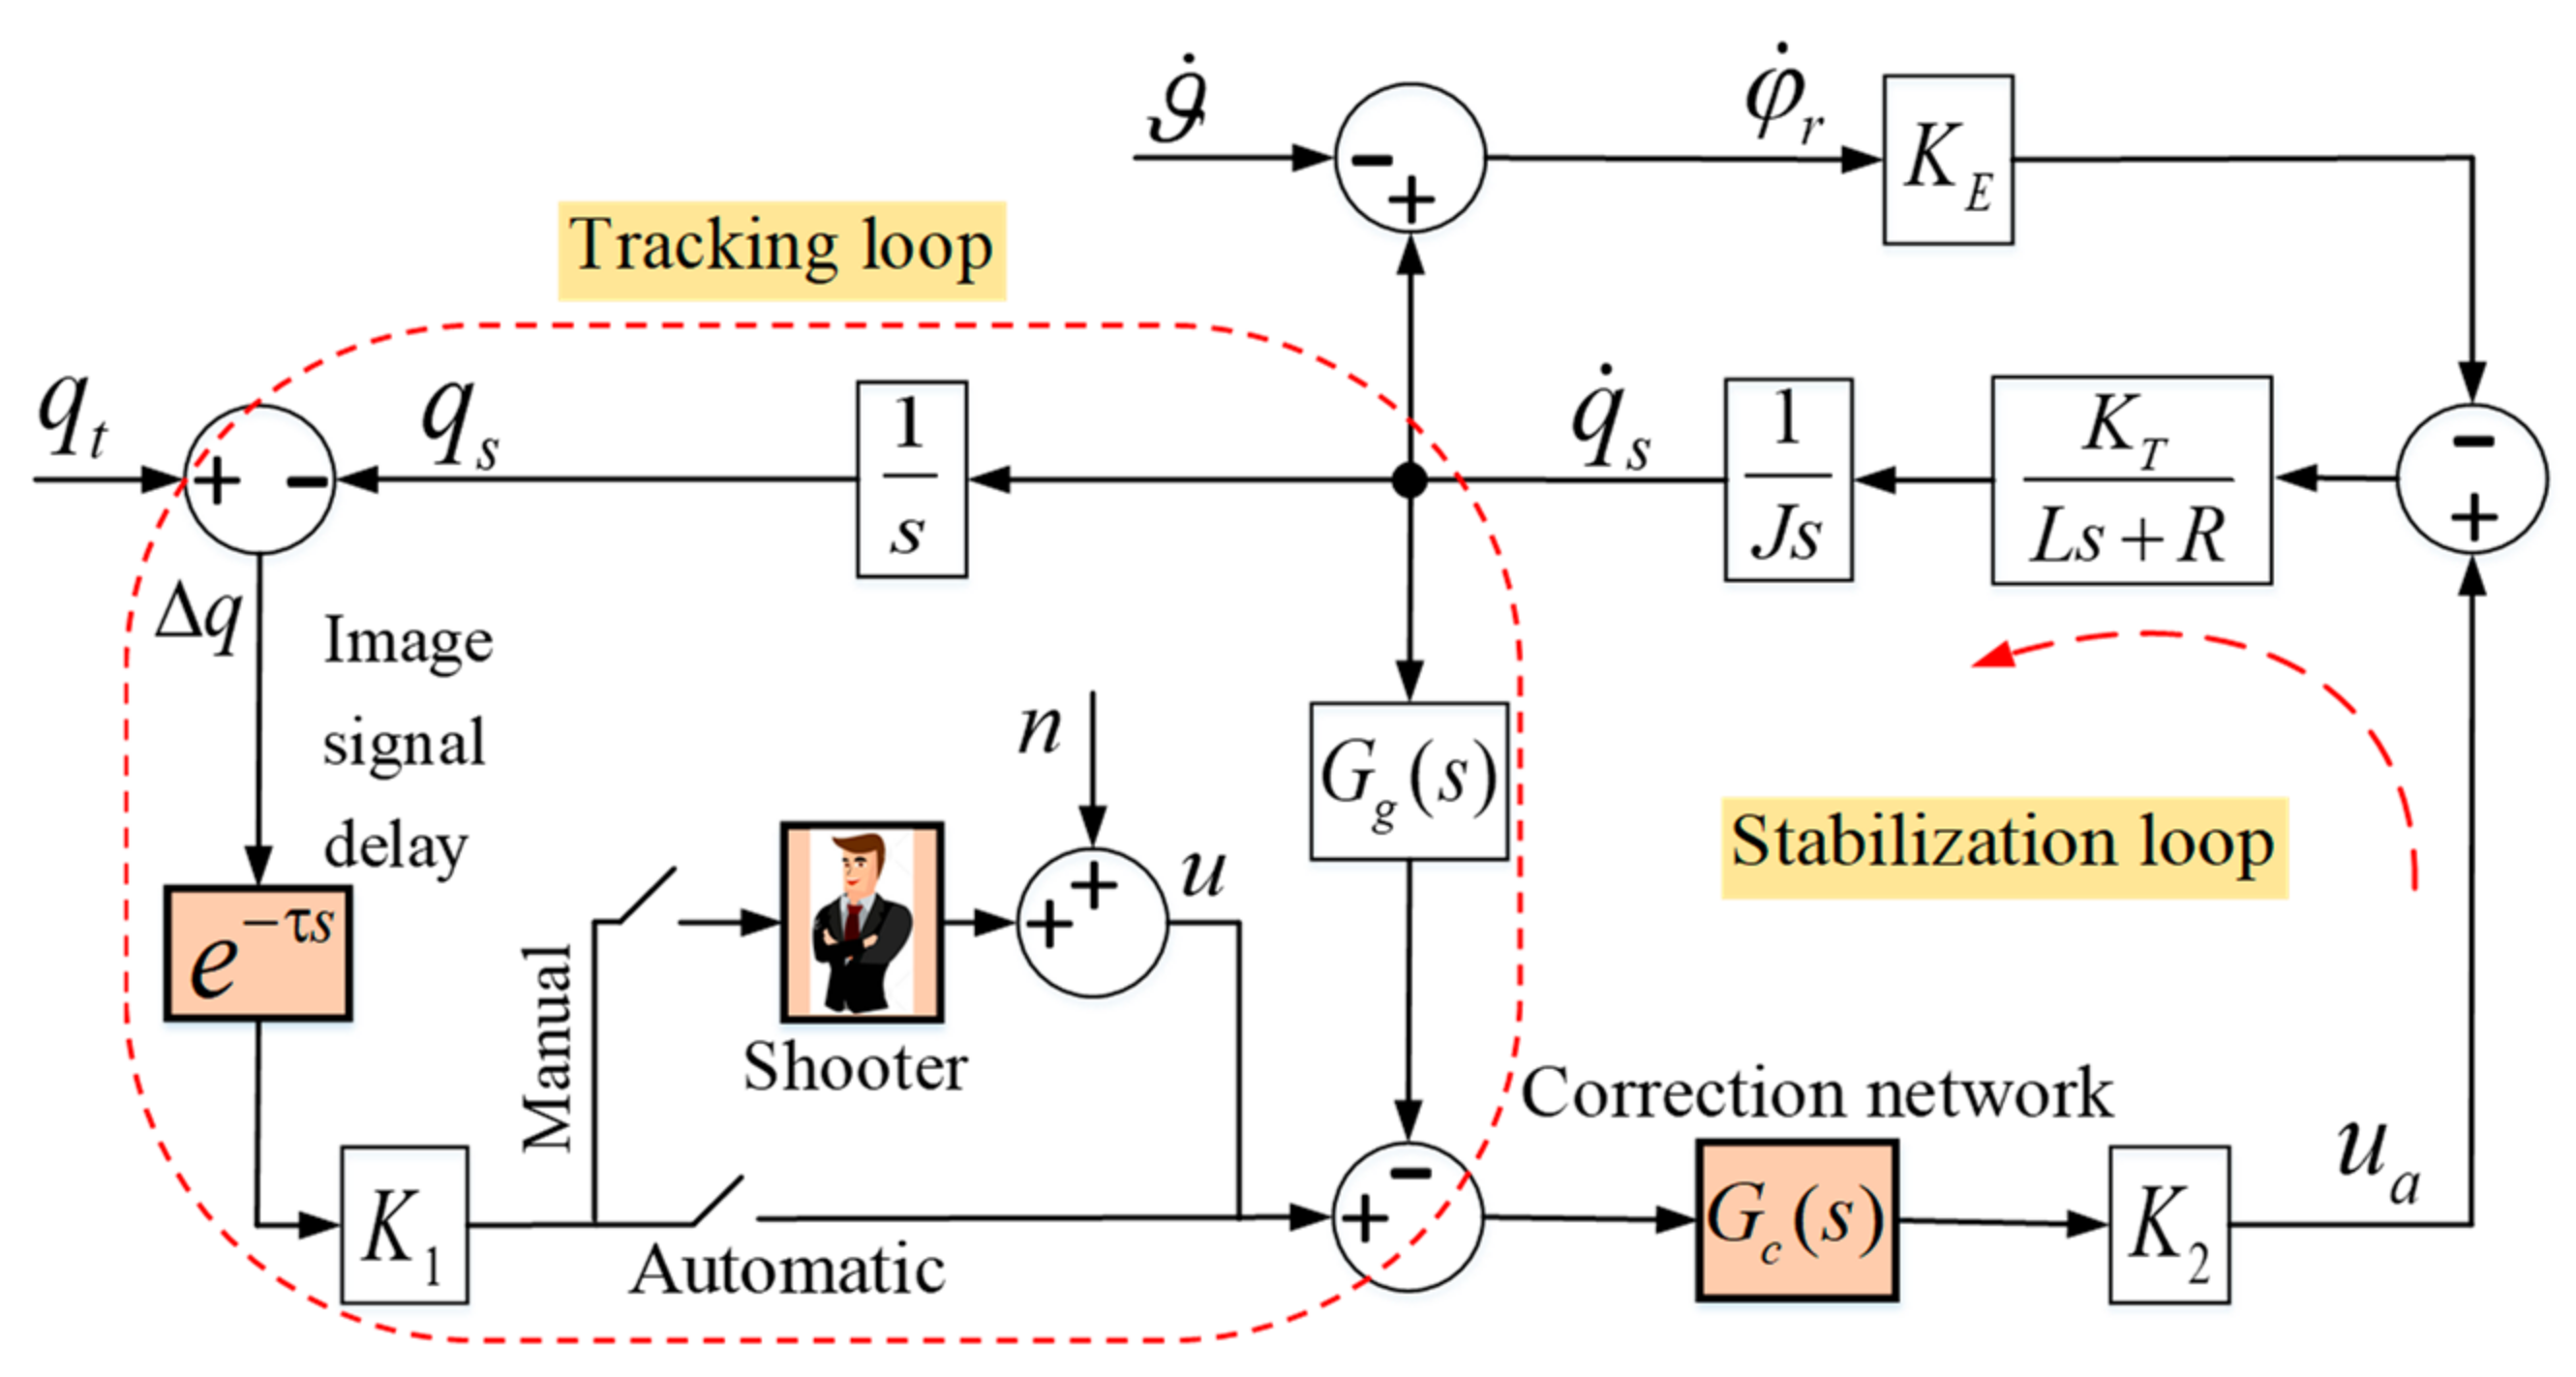
Figure 2.
The stabilization loop of the image seeker.

Figure 3.
Open-loop frequency characteristics of the stabilization loop.

Figure 4.
The PEC model.

Figure 5.
The output error structure (OES).

Figure 6.
The proposed HGOA.

Figure 7.
Population reproduction process.

Figure 8.
The excitation signal.

Figure 9.
Hardware-in-the-loop simulation and experimental flow.

Figure 10.
Time-domain signal for participant B.

Figure 11.
Amplitude spectrum of the acquisition signal for participant B.

Figure 12.
Optimization process for participant B.

Figure 13.
Optimization results of HGOA for participant B.

Figure 14.
Frequency response for participant B.

Figure 15.
Frequency characteristics of the identified model, for all the participants.

Figure 16.
Comparison between the PEC model output and measurement output for participant B.

Figure 17.
Open-loop frequency characteristics of all the man–machine systems.

Figure 18.
Seeker stability region when considering the PEC pilot model.


Figure 19.
Linearized interference torque model.

Figure 20.
Block diagram of the platform seeker DRR under interference torque.

Figure 21.
Variation of the DRR amplitude near projectile frequency.


Table 1.
Platform seeker parameters.
| Parameter | L | R | J | ||||||
| Value | 13 | 22 | 0.007 | 8 | 0.24 | 0.002 | 85 | 0.4 | 0.17 |
Table 2.
Open-loop frequency response parameters of the stabilization loop.
| Parameter | ||||
| Before correction | 134 | 1 | 15 | 70 |
| After correction | 134 | 5 | 58 | 37 |
Table 3.
Upper and lower bounds of the GA parameter field.
| Parameter | |||||
| Lower bound | 0 | 0 | 0 | 0 | 0 |
| Upper bound | 5 | 5 | 10 | 1 | 1 |
Table 4.
Results of parameter identification for different subjects.
| Dynamic Parameters | New-Hand | Old-Hand | ||||
|---|---|---|---|---|---|---|
| A | B | C | D | E | F | |
| 0.18 | 0.32 | 0.32 | 0.27 | 0.29 | 0.31 | |
| 0.36 | 0.34 | 0.36 | 0.46 | 0.36 | 0.38 | |
| 4.33 | 4.78 | 5.09 | 4.78 | 4.82 | 4.79 | |
| 0.26 | 0.15 | 0.27 | 0.31 | 0.27 | 0.26 | |
| 0.19 | 0.16 | 0.15 | 0.15 | 0.14 | 0.16 | |
Table 5.
The values of the PEC model.
| Participant | B | C | D | E | F |
| 88.16 | 76.73 | 82.08 | 86.84 | 92.94 |
Table 6.
Dynamic parameter settings.
| Parameter | |||||
| Value | 0.3 | 0.34~0.46 | 4.85 | 0.25 | 0.1~0.2 |
Table 7.
Stability region of the seeker open-loop gain K.
| Visual perception lead time constant | Visual perception response delay | |||||||||||
| 0.34 | 0.4 | 0.46 | 0.34 | 0.4 | 0.46 | 0.1 | 0.15 | 0.2 | 0.1 | 0.15 | 0.2 | |
| 0.1 | 0.56 | 0.58 | 0.59 | 0.45 | 0.47 | 0.49 | 0.60 | 0.58 | 0.56 | 0.48 | 0.47 | 0.45 |
| 0.2 | 0.53 | 0.54 | 0.56 | 0.43 | 0.44 | 0.45 | 0.56 | 0.54 | 0.53 | 0.45 | 0.44 | 0.43 |
| 0.3 | 0.50 | 0.51 | 0.53 | 0.40 | 0.41 | 0.43 | 0.53 | 0.51 | 0.50 | 0.43 | 0.41 | 0.40 |
| 0.4 | 0.47 | 0.48 | 0.50 | 0.38 | 0.39 | 0.40 | 0.50 | 0.48 | 0.47 | 0.40 | 0.39 | 0.38 |
| 0.5 | 0.45 | 0.46 | 0.47 | 0.36 | 0.37 | 0.38 | 0.47 | 0.46 | 0.45 | 0.38 | 0.37 | 0.36 |
Table 8.
Parameter settings.
| Parameter | ||||
| Value | 0.04 | 0.8 | 0.4 | 0.15 |
Disclaimer/Publisher’s Note: The statements, opinions and data contained in all publications are solely those of the individual author(s) and contributor(s) and not of MDPI and/or the editor(s). MDPI and/or the editor(s) disclaim responsibility for any injury to people or property resulting from any ideas, methods, instructions or products referred to in the content. |
© 2023 by the authors. Licensee MDPI, Basel, Switzerland. This article is an open access article distributed under the terms and conditions of the Creative Commons Attribution (CC BY) license (https://creativecommons.org/licenses/by/4.0/).
Share and Cite
MDPI and ACS Style
Zhang, Y.; Li, T.; Li, Y.; Wang, G. Parameter Identification of Pilot Model and Stability Analysis of Human-in-Loop Image Seeker. Aerospace 2023, 10, 806. https://doi.org/10.3390/aerospace10090806
AMA Style
Zhang Y, Li T, Li Y, Wang G. Parameter Identification of Pilot Model and Stability Analysis of Human-in-Loop Image Seeker. Aerospace. 2023; 10(9):806. https://doi.org/10.3390/aerospace10090806
Chicago/Turabian StyleZhang, Yi, Tao Li, Yanning Li, and Gen Wang. 2023. "Parameter Identification of Pilot Model and Stability Analysis of Human-in-Loop Image Seeker" Aerospace 10, no. 9: 806. https://doi.org/10.3390/aerospace10090806
Note that from the first issue of 2016, this journal uses article numbers instead of page numbers. See further details here.