
Delay in the Air or Detour on the Ground?—A Case Study in Guangzhou Baiyun International Airport


College of Civil Aviation, Nanjing University of Aeronautics and Astronautics, Nanjing 210016, China
*
Author to whom correspondence should be addressed.
Aerospace 2024, 11(1), 10; https://doi.org/10.3390/aerospace11010010
Submission received: 8 November 2023
/
Revised: 7 December 2023
/
Accepted: 13 December 2023
/
Published: 22 December 2023
(This article belongs to the Collection Air Transportation—Operations and Management)
Abstract
:Collaboration between terminal airspace and airport surface operation shows an increasing significance for the best efficiency of both parts of the air traffic management domain. Runways play a critical role in connecting the two parts for departure and arrival aircraft. Suppose the gate and the entry fix of an aircraft are predetermined according to the flight plan, and they are on the opposite side of the airport terminal. The aircraft will either spend more time (i.e., delay in the air) landing on a runway close to its gate or take a longer distance (i.e., detour on the ground) taxiing to its gate if a runway close to its entry fix is assigned. This paper proposes a runway assignment model considering terminal airspace operation and airport surface movement simultaneously to discover how runway assignments can affect integrated operations. Four different runway assignment schemes are applied in this model. Subsequently, a metaheuristic method is proposed to solve the model. Furthermore, the historical taxiing and flight time data are analyzed to demonstrate the potential benefits of runway reassignment. Finally, the results show that the free assignment of the runway stands out among the four schemes, not only in the performance of terminal airspace operation (lower flight time) but also in airport surface movement (lower pushback delay, taxi time).
1. Introduction
The terminal maneuvering area (TMA) and the airport surface (AS) are both critical places for air traffic management (ATM), as they simultaneously accommodate all the arrival and departure aircraft. With the rapid increase in air traffic demand and limited capacity of TMA and AS, situations such as congestion, delays, and occasional conflicts arise. The arrival aircraft enters the TMA from an entry fix (EF), flies with a standard arrival route (STAR), and lands on a pre-allocated runway based on the instructions given by approach Air Traffic Controllers (ATCOs). Afterward, the ground ATCOs guide the landing aircraft to their pre-allocated gate according to the specific taxi routes. The departure aircraft reverses the above procedure of arrivals. In such an operation procedure, scheduling the temporal–spatial resource reasonably and simultaneously has been a critical challenge in the ATM domain to most utilize the precious limited air-ground capacity.
Approach ATCOs, when handling a series of arrival aircraft, tend to use a First-Come-First-Served (FCFS) methodology to establish the landing sequence and maintain safe separation between arrival aircraft. At the same time, arrival aircraft following such a guiding method often lands on a runway close to its EF. In this case, the workload of approach ATCOs can be reduced, and the flight time of arrivals can be saved. Such a control strategy, so-called ‘air-priority’, helps the arrival aircraft to land orderly, and the reduced flight time contributes to multiple stakeholders’ concerns [1]. However, when the near runway is overloaded, approach ATCOs need to vector the arrival aircraft to another (i.e., further) runway.
In current operations, the ‘air-priority’ principle is widely adopted. Namely, arrival aircraft will be given a higher priority to choose a landing runway close to its EF, and the departure aircraft will apply a ground delay program (GDP) [2], finding a suitable takeoff time window in the gap of two successive landing aircraft. The ‘air-priority’ principle has its merit since landing aircraft is widely considered with more uncertainty and consumes a higher workload of ATCOs. However, the above operation method also has its drawbacks. Some ground ATCOs claim that aircraft always landing on a runway close to its EF may result in detours on the airport surface. They wonder whether approach ATCOs could vector the arrival aircraft to the runway close to its gate (which may incur more delay in the air) so that the ground movement can be handled more efficiently, which motivates this paper to study the runway assignment problem.
The runway assignment problem corresponds to two aspects: AS and TMA. For optimizing the operation of airport surface, most previous studies modeled the taxi and arrivals routes as a network containing nodes and links to find an optimal pushback time, taxi route, or takeoff sequence and time [3]. However, taxiing time modeling techniques varied apparently. Some used the kinematic model to calculate the trajectories of each aircraft to detect the conflicts and obtain the taxiing time in a deterministic manner [4,5,6,7]. Some estimated taxiing time using historical data [8], assuming it is subject to some specific distribution [9]. Some divided taxiing time into two parts, unimpeded taxi time and stationary time, respectively [10,11]. Some used an average taxi time based on their accuracy demand [12]. Their common decision variables were pushback time, while some advanced models used pushback rate [10] or taxi routes [4] as the decision variables. With taxi capacity [13] or conflict constraints, pushback delays were minimized, and runway throughputs are maximized in the optimization [14]. However, previous research mostly assumed a fixed runway selection and seldom focused on runway assignment problems [15,16].
For optimizing the operation of TMA, researchers mainly focus on arrival sequencing and scheduling problems (ASSP) to optimize a landing sequence, target landing time, and arrival flight time [17,18] et al. Similar to taxiing time modeling, ASSP can be tackled generally with time only or with both time and trajectories. On the one hand, only the required time of arrival (RTA) on the runway is optimized, assuming the aircraft can arrive on time [19], in which an model-based [20] online 4D trajectory prediction or data-driven methods [21,22] can be applied to obtain the estimated time of arrival (ETA). Using more advanced modeling techniques, Khassiba et al. [23,24,25] took flight time uncertainty under consideration, formulating a two-stage stochastic programming model to obtain robust landing sequences. On the other hand, arrival trajectories can also be included for scheduling a conflict-free solution [26,27,28,29]. The latter outperforms the former since it provides RTAs with the corresponding trajectories, which can better assist ATCOs as decision support tools.
Based on the study of airport surface and airspace solely, how to integrate optimizing both air and ground operation is attracting more and more attention. Queuing-based approaches were applied to tackle integrated optimization problems. A control algorithm was used to optimize the landing sequence, which is an input for subsequent determining surface optimal control policy [13,30]. Ma et al. [31] performed integrated optimization of AS and TMA at macroscopic and microscopic levels. At the macroscopic level, they used an average taxi time to model surface movement and a node-link graph to model the standard departure and arrival route, assigning a runway and scheduling a landing time for arrivals. After completing the runway assignments and schedules, the microscopic level started optimizing the specific taxi routes based on the assigned runways. However, the former works overlook the possibility of changing a runway for arrivals or departures, while the latter method may lead to sub-optimal runway assignments due to the segregation of two levels.
Therefore, this paper focuses on the runway assignment problem by integrating the optimization for both operations of AS and TMA. A microscopic taxi and arrival model is built and will be optimized simultaneously, considering four different runway assignment schemes. A metaheuristic algorithm is proposed to solve the model efficiently. The contributions of this paper are two-fold. On the one hand, an integrated optimization model to solve the runway assignment problem is proposed, and a metaheuristic algorithm is applied to solve the proposed model. On the other hand, historical operation cases on runway assignment and operation time are studied. Subsequently, four different runway assignment schemes are compared for series of performance metrics. Finally, insights on operational feasibility are discussed for future potential deployment of the proposed model for Guangzhou Baiyun International Airport.
The remainder of this paper is arranged below: the runway assignment model formulation is presented in Section 2. Then, Section 3 introduced the solution metaheuristic of the proposed model. Section 4 analyzes history data to quantify taxi and flight time differences using different runways. Subsequently, the results of the four assignment schemes are shown in Section 5. Finally, Section 6 comes to a conclusion.
2. Model Formulation
This section first formulates the proposed runway assignment model and then details how the alternate taxi routes are recognized using historical trajectory data. Table 1 lists the notation used in this section.
2.1. Formulation of the Runway Assignment Model
The runway assignment problem can be described as follows: in a TMA, a set of aircraft is given within a short future time horizon (e.g., 1 h), where and denote set of arriving and departure aircraft, respectively. For each aircraft , it enters the TMA right over a predefined EF at a time . Then, it approaches following STARs which may have one or two route options that lead to a different runway . After landing on the runway at the time , it chooses a controller-designated taxi route from the set of taxi routes from the runway to the pre-allocated gate (Note is denoted as for the sake of simplicity). After a short holding time interval to cross the runway or merge into the taxi network, it arrives at its gate after an unimpeded taxi time (UTT). For each aircraft , it takes off the wheel block at its pushback time and follows one taxi route from its gate to the departure runway.
In the above procedure, conflicts in the air and on the ground are considered, respectively. For two successive aircraft and , three parts of separation are included—distance-based radar separation in the air, time-based separation on the runway, and safe separations during taxiing, in which the first two parts of separations are relevant to aircraft types and what aircraft set they belong to (i.e., or ) while the taxi separation is set to a unified constant (60 m) for all types of aircraft according to ref. [32].
Consequently, the proposed model seeks to optimize a series of metrics of TMA and AS operation performance by decisions of entry speed, entry time, arrival routes for arrivals and pushback time, departure route for departures and taxi routes for all, under specific runway assignment scheme.
Some assumptions are made below:
- The initial EF time , initial pushback time , and initial speed are known based on the historical data;
- Aircraft follows the STAR route and taxi route precisely;
- Final speed landing on the runway is a constant according to Charts;
- Arrivals are to approach with a constant deceleration ;
- Taxi speeds are a constant for arrivals and departures;
- TMA and taxi route networks are treated as a graph containing nodes and links.
With the above assumptions, the time that aircraft passes a waypoint can be derived:
where denotes the distance from EF to waypoint , is a deceleration calculated by total distance and start and final speed. is speed at waypoint , is the speed at EF, represented time at waypoint . Similarly, the time aircraft passes a taxi route intersection can be induced. The formulation of the total model is presented below.
An integrated objective function of RAM composed of EF delay , flight time , taxi time , hold time and pushback delay is given by Equation (2a). Equations (2b,c) define the delay at EF and gate, which are calculated by the absolute difference with initial EF or pushback time, respectively. Equations (2d)–(2f) define the flight time and the taxi time as the result of dividing distance by speed. Constraint (2g) defines landing time for arrivals and take off time for departures, which we call runway time to name them uniformly in this paper. Constraints (2h)–(2k) set boundaries for the corresponding decision variables. Constraints (2l)–(2n), (2o)–(2p), and (2q)–(2s) ensure the safety of operations in the air, on the runway, and on the ground, respectively. Specifically, Constraint (2l) ensures two successive aircraft should maintain a radar separation at all the common waypoints. Constraints (2m) and (2n) ensure that the sequence of two successive aircraft cannot be changed when flying on a common segment. Constraints (2o)–(2s) can be understood similarly. Constraint (2t) stipulates the binary nature of the 0–1 variables [33]. Constraint (2u) specifies , , and as indices of waypoints, runway, and taxi routes, respectively. Constraint (2v) explains all the indices are integer.
2.2. Taxi Route Recognition based on Historical Trajectories
For airport surface operation, only the preferred taxi route is regulated in an Aeronautical Information Publication (AIP). However, various taxi routes exist to meet the demand of actual operations like avoiding hotspot areas or narrow routes. Furthermore, ground ATCOs may feel confident using some specific routes while not using routes they consider unsafe. Thus, recognizing underlying alternate taxi routes from a gate to a runway are pivotal in operations. The -shortest path algorithms is one of several algorithms used to obtain taxi routes, which can find the first shortest path of a graph with nodes and links [34]. However, it often generates inapplicable routes in actual operations, namely too short segments and too much unnecessary turns.
This paper proposes to recognize alternative taxi routes using historical data to address the above problems. We use history taxi trajectories of January 2020 in Guangzhou Baiyun International Airport (ZGGG). Since northbound operation of ZGGG accounts for nearly 90%, we take the northbound operations of ZGGG as an example (the specific configuration of ZGGG is detailed in Section 4). A taxi routes recognition algorithm is given in Algorithm 1.
| Algorithm 1. Taxi routes recognition |
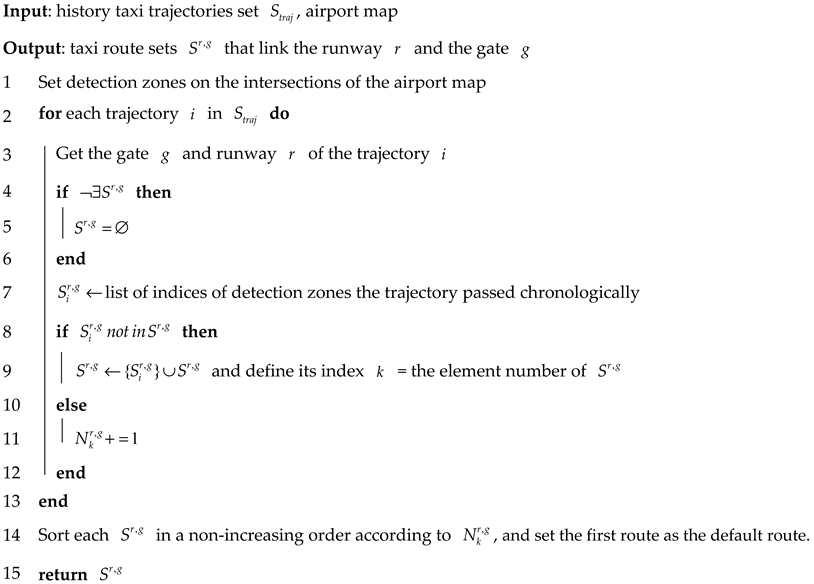 |
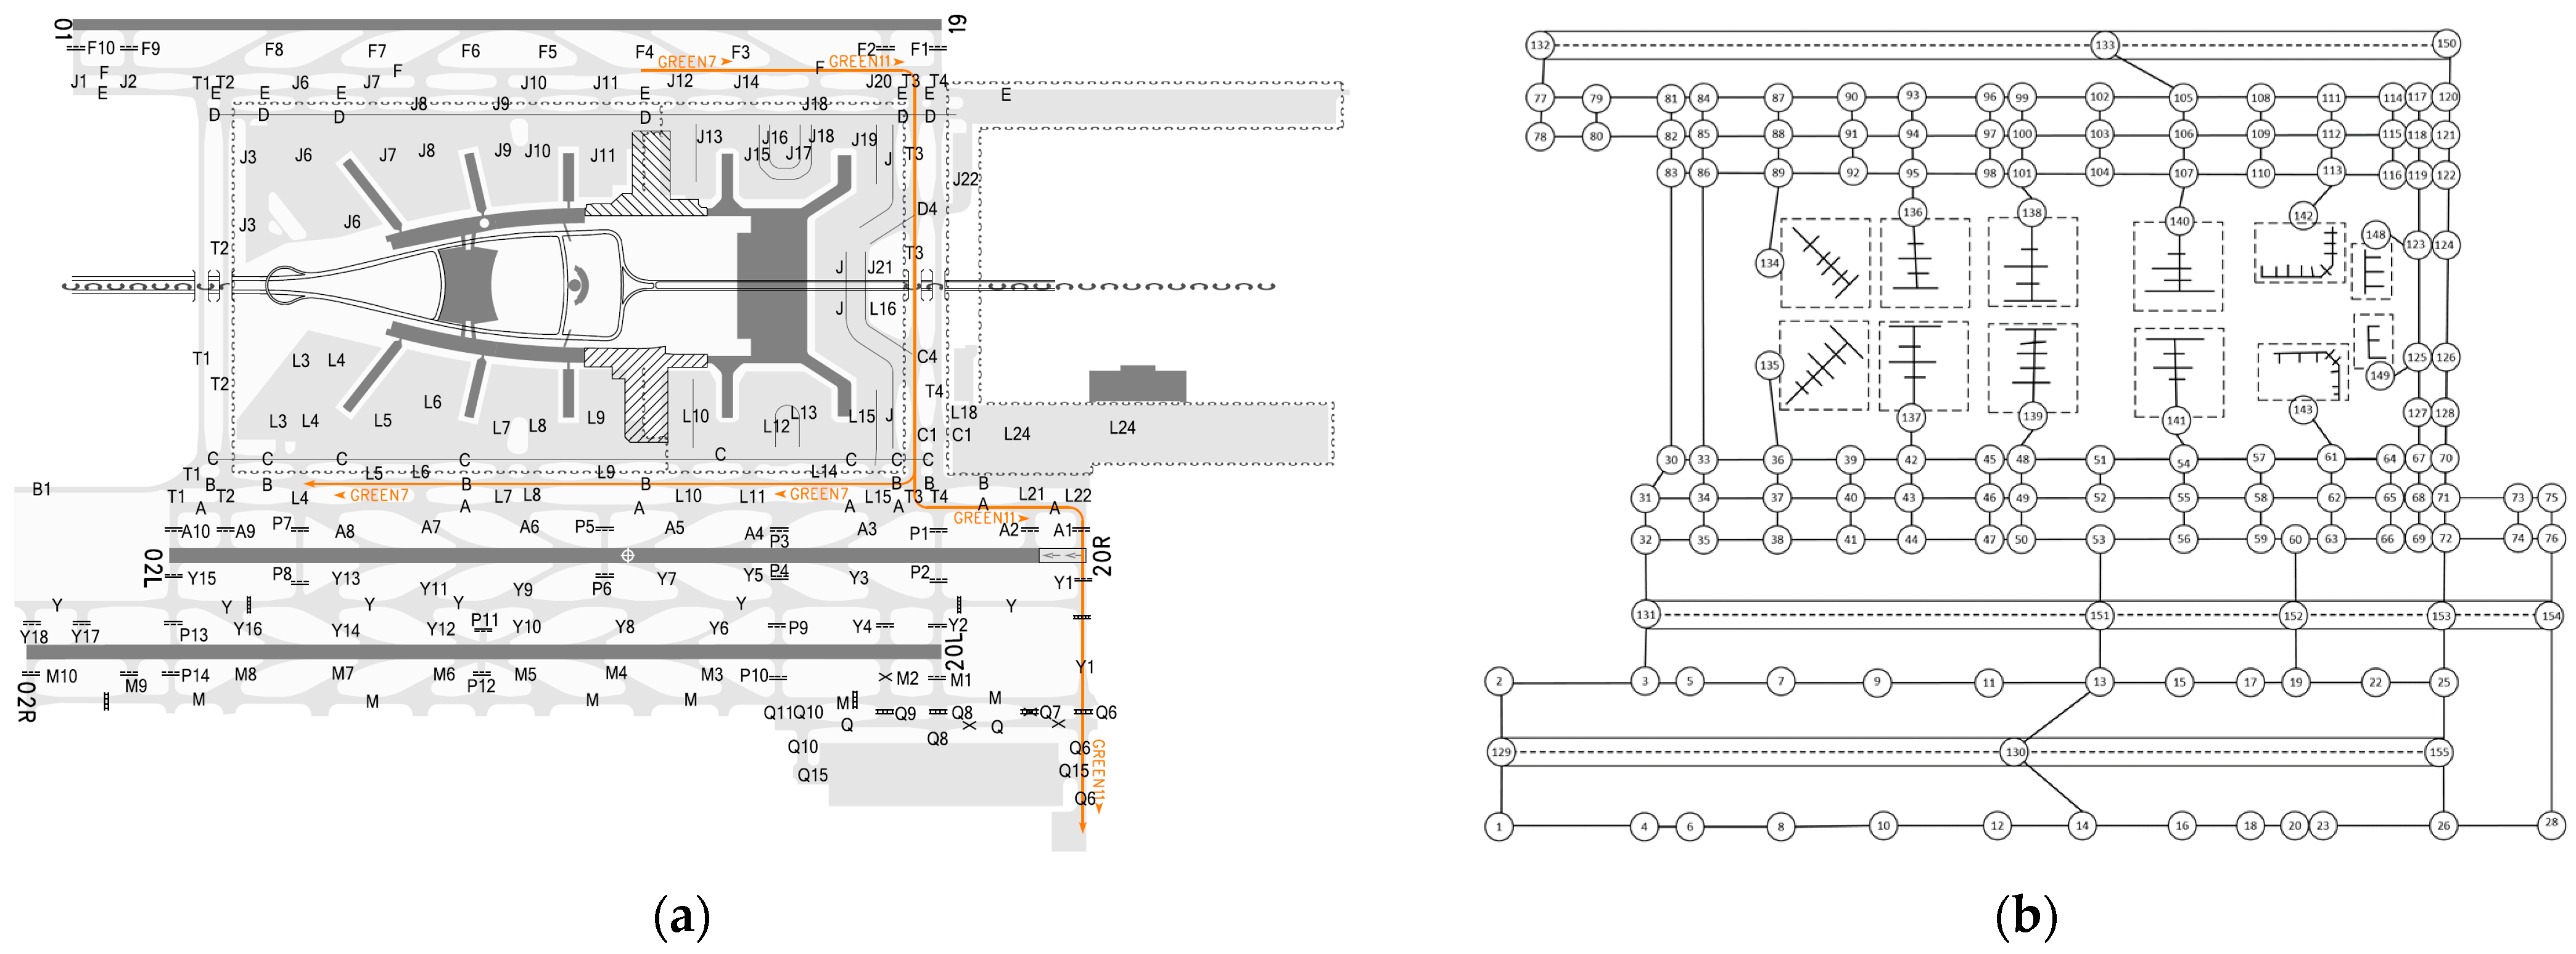
Firstly, polygonal detection zones on the intersections of the taxiways are set to capture the trajectories (line 1). Since no direct coordinates of the taxi route intersections available from AIP or other data sources, we cannot set a detection range threshold around the intersection to formulate detection zones. Therefore, we tried a manual approach to solve this problem. After indexing all the interested taxi route intersections (Figure 1b), we manually collect the coordination of several points (4 points in this paper) surrounding the taxiway intersection with the help of the airport map (Figure 1a) and google map. Secondly, a large set of trajectories is fed into detection iteratively (line 2). The gate and runway that the trajectories passed through are extracted for each trajectory , and whether a route between this pair of gate and runway exists is determined. An empty set will be created if this pair of runway and gate is discovered for the first time (lines 3~6). Then, a list of indices of detection zones that the trajectory passed chronologically is obtained (line 7) as the representation of the taxi route. Note that duplicated detection zone indices will be dropped in this step. Subsequently, the taxi route will be appended to the taxi route set of the current pair of runways and gates if the taxi route is discovered for the first time (lines 8~9). Otherwise, only the number of this route will be updated (line 11), indicating the frequency of using this route. Finally, after the whole trajectory set is examined, each taxi route set is sorted according to the frequency of each taxi route within (line 14), and only routes used over five times will be kept. The route with highest frequency is set as default route of that runway–gate pair. Note that adjacent gates in the same ramp are considered as one gate in this paper to help aggregate alternate routes.
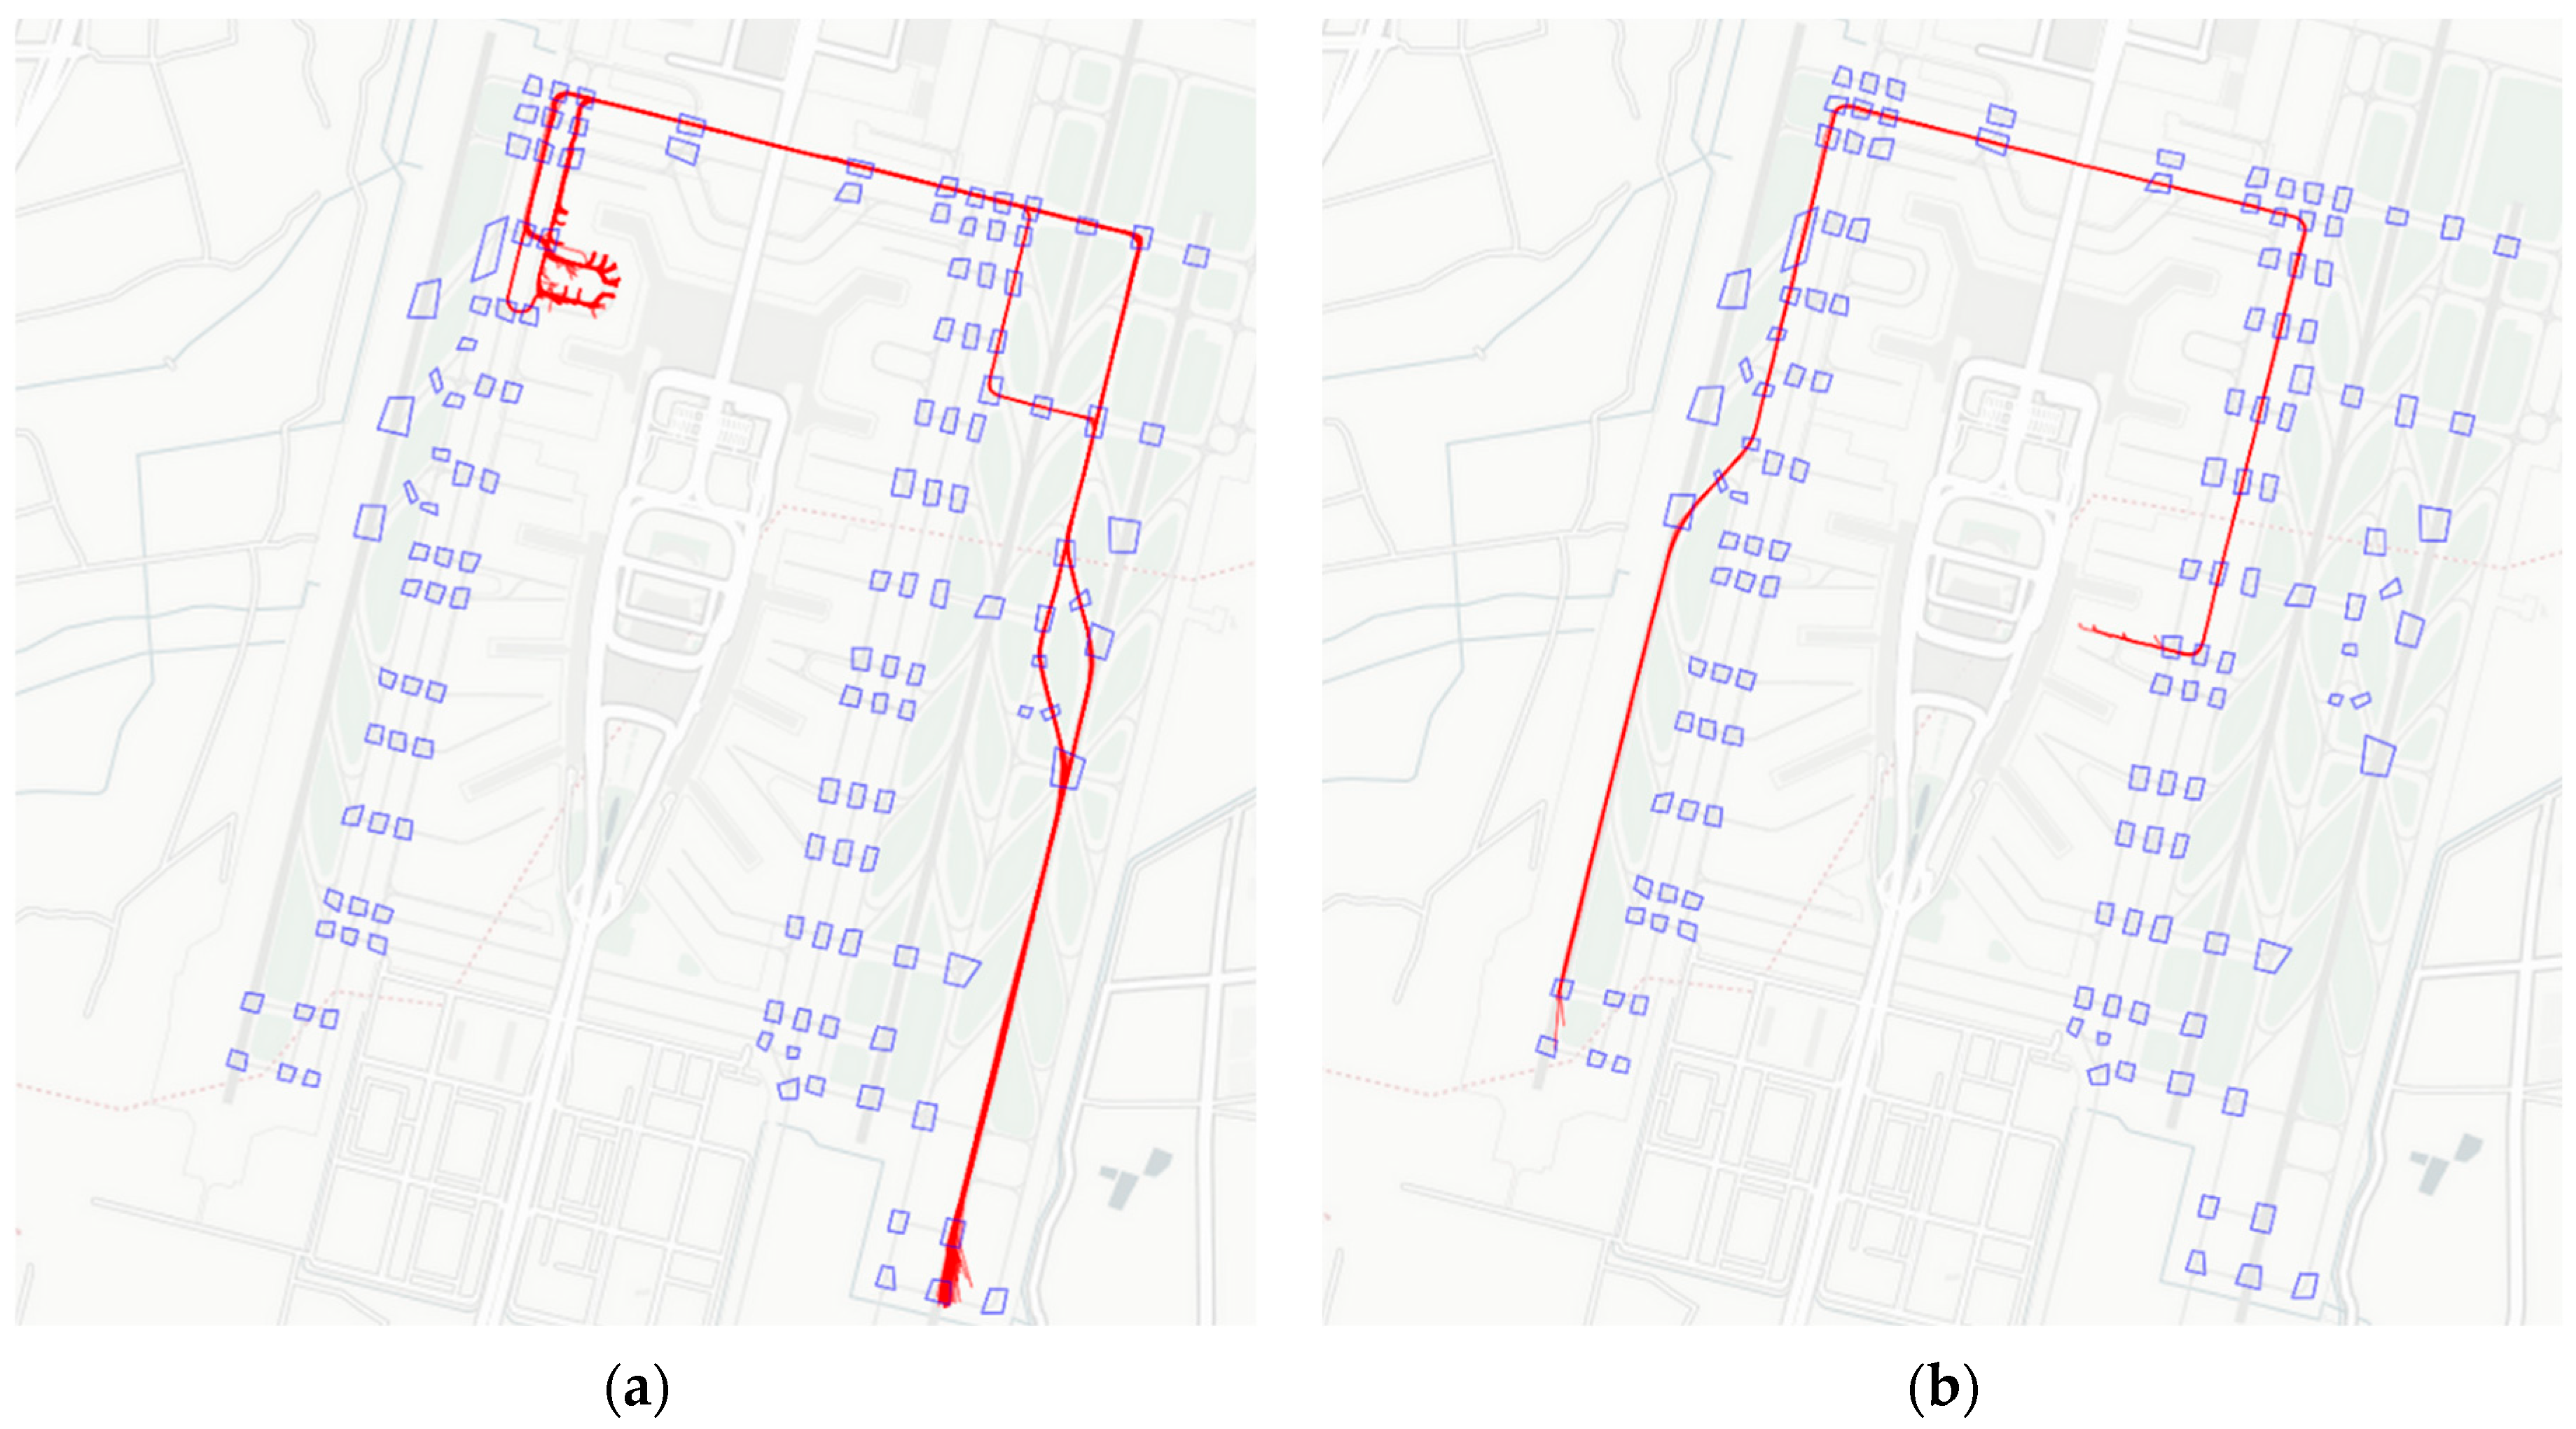
Figure 2 gives an example of alternate taxi route options, in which Figure 2a shows eight options from runway 02R to gate 142, and Figure 2b shows only one option route from runway 01 to gate 139. The alternate route options are summarized in Figure 3, in which 88 pairs are recognized, and most pairs have 2~4 options to taxi.
3. Solution Algorithm
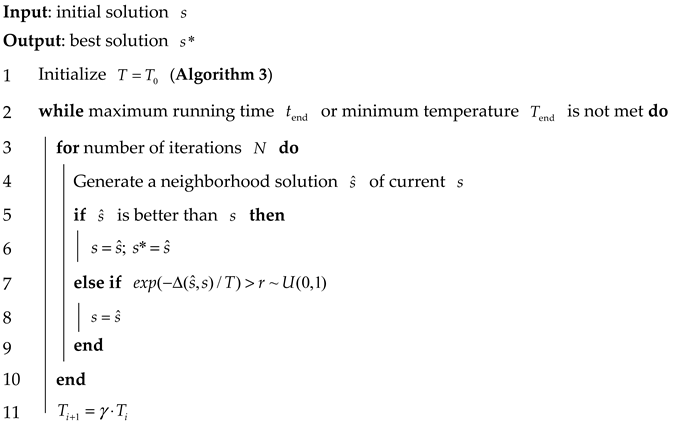
The extensive literature has widely acknowledged integrated optimization of the airspace and airport surface operation as an NP-hard problem [34]. Solving such an NP-hard optimization problem can be computationally expensive using commercial solvers. Thus, this paper proposes a metaheuristic method to address this problem. Simulated annealing (SA) is one of the widespread evolutionary algorithms that can be applied to different domains of problems [35]. Algorithm 2 is proposed below to detail the pseudo-code of the SA and how SA finds a neighborhood solution in our problem.
| Algorithm 2. Simulated annealing |
 |
 |
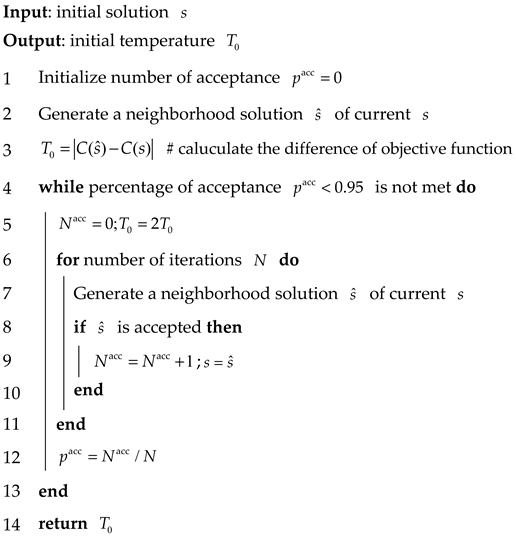
In Algorithm 2, a temperature is first initialized (line 1). An adaptive initial temperature scheme (Algorithm 3) is adopted to find an initial temperature that can accept any solution, whether better or worse, with a high probability. During this process, the temperature is doubled if the acceptance rate falls below the threshold [36] (set at 0.95 in this paper). Then, a neighborhood solution is found based on the user-defined neighborhood function (line 4), which will be detailed in Algorithm 4. Thirdly, a metropolis acceptance criterion is adopted to accept several degraded solutions probabilistically (lines 5~9). After repeating a number of iterations times (line 3), the temperature is cooled down according to the cooling scheme (line 11). This parameter allows the algorithm to explore a wide solution space initially, reducing the possibility of becoming trapped in local optima, and then gradually focus on refining solutions as the temperature lowers. In this paper, a geometrical cooling scheme is engaged. Finally, the algorithm stops when the stopping criterion is met (line 2). Readers are referred to [35] for more information about the simulated annealing algorithm.
| Algorithm 3. Adaptive initial temperature |
 |
To apply the SA in our specific runway assignment problem, we must define what is a solution in our context and how the neighborhood function is customized to find a neighborhood solution. In addition, how to handle the hard constraints in the RAM using SA is another problem that remains to be addressed.
First, we treat the whole aircraft decision variables as a solution. The initial solution is generated using the historical data. Second, to create a neighborhood solution, we modify one decision of an aircraft and see what will happen to the whole solution. More details are available in Algorithm 4. Third, we apply a penalty function method to convert hard constraints (constraints (2l)–(2s)) to soft constraints in objective function. The conflicts are added into the objective function with a high coefficient . Therefore, SA could firstly target to resolve the potential conflicts and then, seek to optimize the original objectives, without being required to find a conflict-free solution directly at each iteration.
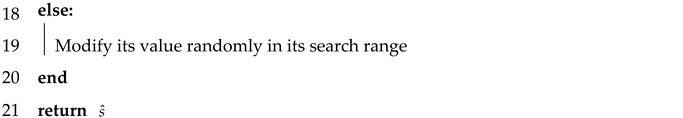
In Algorithm 4, an aircraft is firstly chosen according to its contribution, which means cost of each aircraft (i.e., delay at EF, flight time and hold time for arrivals, pushback delay for departures, and taxi time for both) plus corresponding conflict penalty, to the total cost function in each neighborhood solution (line 2). The aircraft with the higher cost is more probable to be chosen. After the selection of aircraft, one decision variable of that aircraft is randomly determined to be modified. If the chosen aircraft (line 3), the neighborhood function first targets solving conflicts in the air, so only decisions impacting the time of arrival will be considered, namely entry speed, entry time, and landing runway (lines 5~6). After solving the air conflicts, the algorithm aims to optimize the solution as a whole, which means all decision variables will have a uniform chance to be modified (lines 7~9). For ZGGG, arrivals from some specific EFs (i.e., GYA, IDUMA, and P270, detailed in Section 4) have only one STAR route. Therefore, their runway cannot be modified (lines 4, 10~12). If the chosen aircraft (line 13), pushback time, departure runway, and taxi route will be randomly chosen (line 14). At last, the chosen decision variable will be modified within the predefined search range (line 19). A fact should be addressed that when the algorithm chooses to change a runway, the corresponding taxi route should also be changed to link the runway and the gate. In this paper, the default route of that runway–gate pair is set when this happens.
| Algorithm 4. Neighborhood function |
 |
 |
4. Case Study
To better understand the historical operations in ZGGG, we take radar surveillance data and surface movement data of northbound operation in December 2019 and January 2020 as examples. How runways were assigned and how flight and taxi time were distributed are analyzed.
First, for runway assignment statistics, Table 2 shows the historical distribution of runway assignment for arrivals and departures in December 2019. The statistics reveal that a large proportion of arrivals (77.16%) was assigned a runway close to the gate, which is higher than that close to EF (59.22%). Since ZGGG started a trial to optimize taxi performance in December 2019 with the arrival manager system (AMAN) decision support tool [37], many more arrivals were assigned a runway close to its gate to reduce potential taxi time. On the contrary, departures still apply a principle to take off at a runway close to its exit fix. From the percentage of runways close to or far from the gate and EF, we can find that ZGGG has done well in runway assignment and still has the potential to increase its ground operations further.
Second, before discussing on flight time distribution, we would like to address how EFs and runways are configured. ZGGG has three runways, namely the west runway 01 (RWY01), the east inner runway 02L (RWY02L), and the east outer runway 02R (RWY02R). The west runway is typically used for takeoff and landing in a mixed operation mode. The east runways are closely spaced parallel runways used for takeoff (RWY02L) and landing (RWY02R) in a segregated operation mode. The TMA has six entry fixes, namely ATAGA, IGONO, P270, IDUMA, GYA, and P71, as shown in Figure 4. Only three out of five EFs have STARs to both runways, namely P71, ATAGA, and IGONO, while arrivals from GYA are regulated to land on RWY01 and P270, IDUMA to RWY02R.
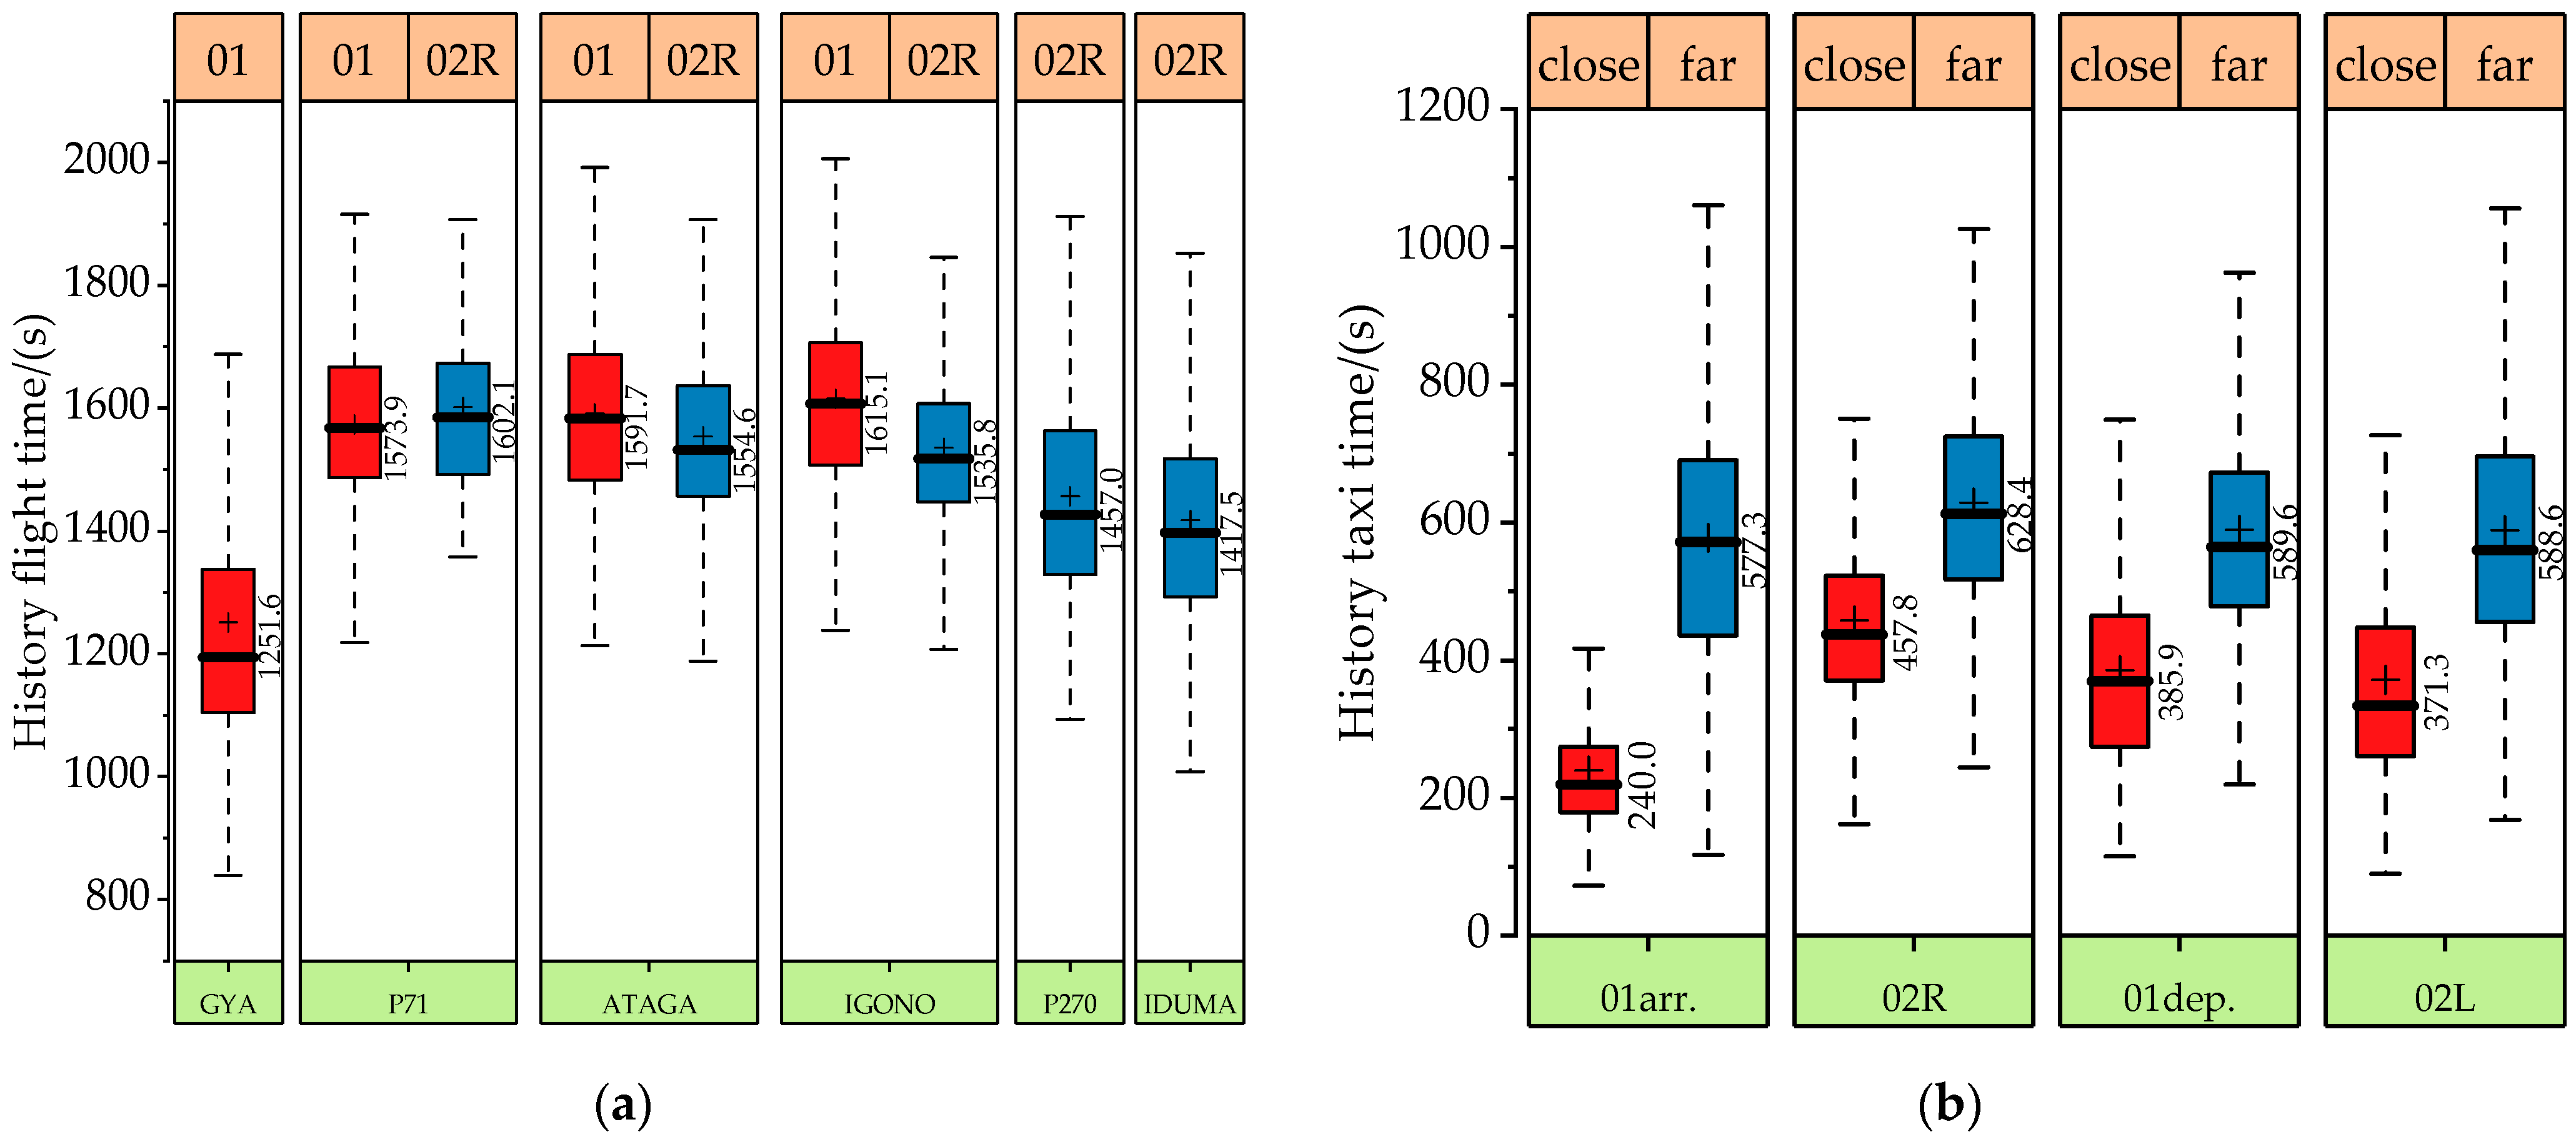
Figure 5a shows the flight time distribution of arrival aircraft. From the boxplot of the middle three EFs that can change runways, we can find that the time distribution and average flight time are similar, with the highest difference in IGONO no more than 80 s, which provides a possibility to assign arrivals on another runway to improve the surface movement at the cost of increasing just a little flight time.
Figure 5b shows taxiing time variation for arrivals (departures) moving to (from) a close or far gate of each runway. Contrary to what is shown in flight time, taxiing time between far and near gates shows a significant difference. Approximately 200 s taxiing time can be saved if an aircraft uses a runway close to its gate. This motivates us to design several runway assignment schemes to cultivate the potential for better operation efficiency, which is detailed in the following section.
5. Results
This section clarifies the experimental setting of the proposed runway assignment model and hyperparameters of SA, followed by the results of different assigning schemes. Then, the stability of the proposed model and applied algorithms are examined.
5.1. Experimental Settings
This study chooses a busy time in the ZGGG terminal, from 1600 to 1900 UTC+8, on 3 December 2019, to carry out optimizations. Based on the former analysis, four schemes are studied in this case: runways are assigned freely, according to the actual, close to the gate, and close to the entry fix, respectively. For simplicity of explanation, the four schemes are indexed and named after its rule of assigning runways: scheme #1: free, scheme #2: actual, scheme #3: gate, and scheme #4: EF.
It is noted that when the arrivals are arriving from 1600, the corresponding departures are considered from approximately 15 min later, which is a representative flight time that arrivals need to land on the runway. In this way, ground conflicts can be more realistic since the first 15 min of departures must consider the arrivals when they push back.
The code is written in Python 3.9 and operated on the Windows 11 platform on a laptop with an AMD Ryzen 7 5800H processor, which has 8 cores, 16 threads, and a 3.2 GHz base clock. After extensive testing of the terminal time for SA, 1000 s was found to be suitable for obtaining satisfactory solutions. All four assignment schemes terminated at this time limit during the experiments. Other critical parameters of the SA algorithm and the runway assignment model are detailed in Table 3 below.
5.2. Results Analysis
5.2.1. Cost Function
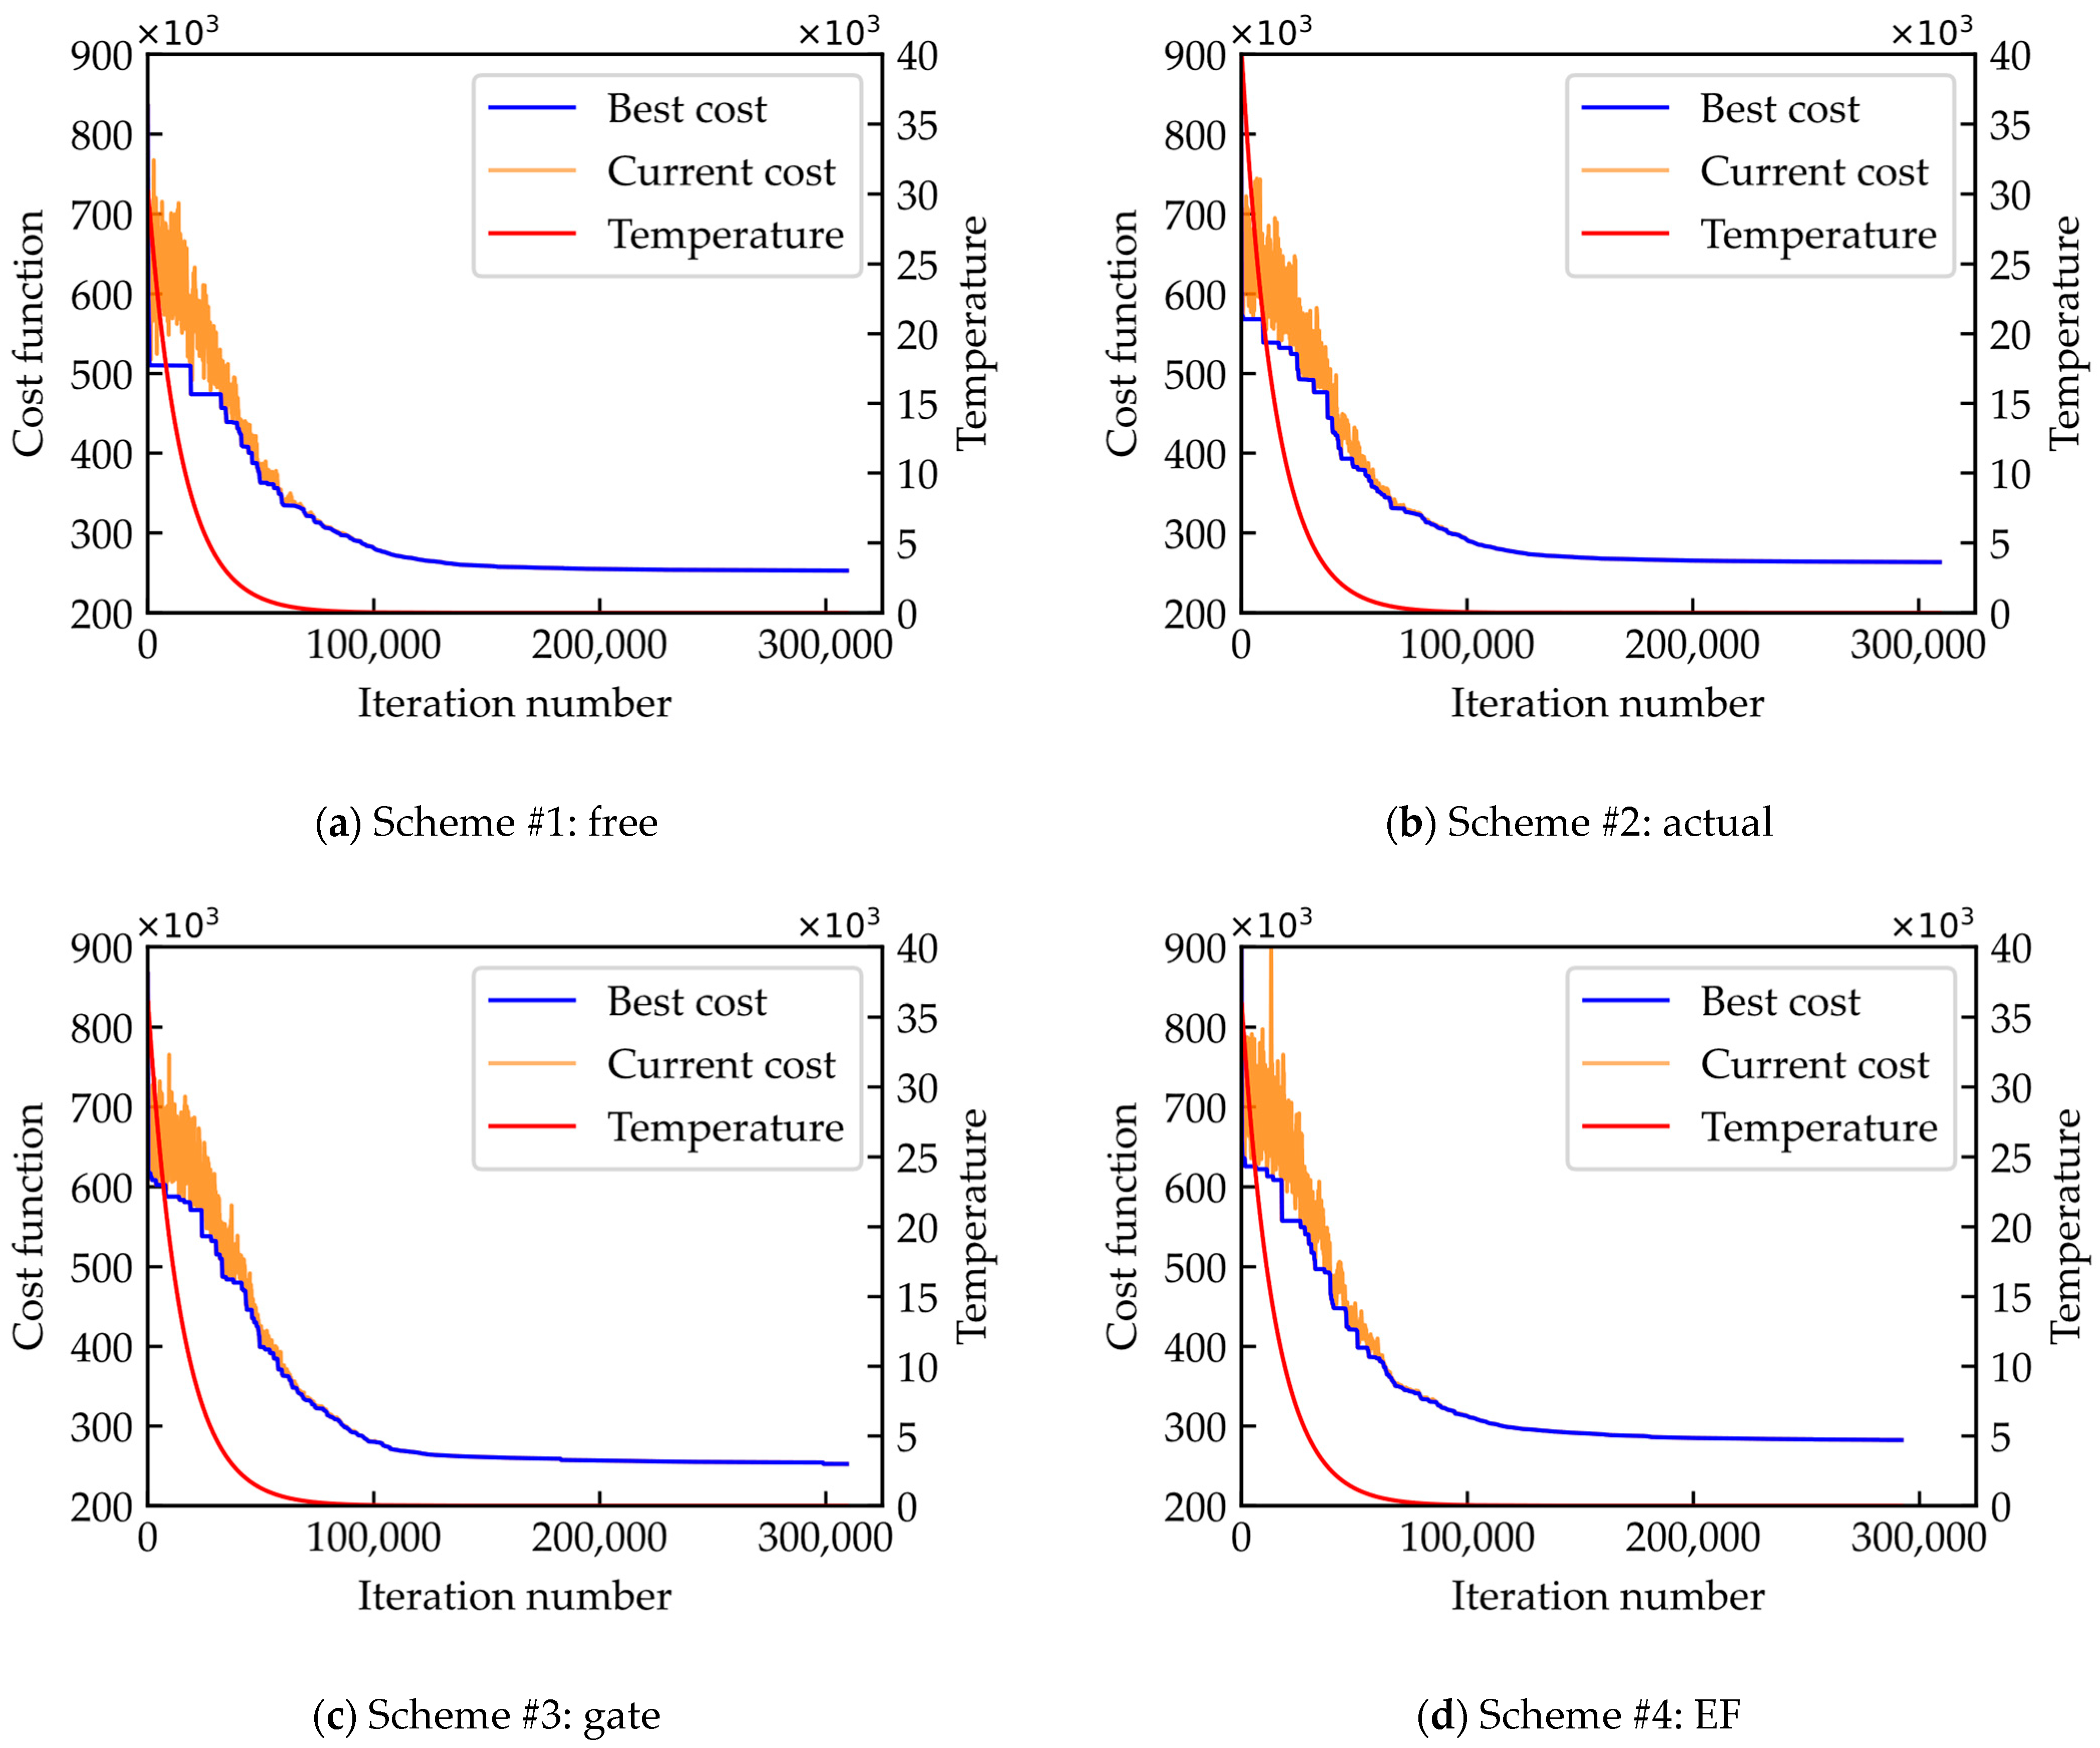
As shown in Figure 6, all four schemes converge gradually after 300,000 iterations; the first approximately 75,000 iterations focus on exploration, and the subsequent iterations mainly concentrate on exploiting the best solution. Through the four schemes, we could find four schemes have a different initial temperature (red line), as we adopted a dynamic initial temperature scheme, which was determined by the difference of several initial neighborhood costs.
5.2.2. Conflict
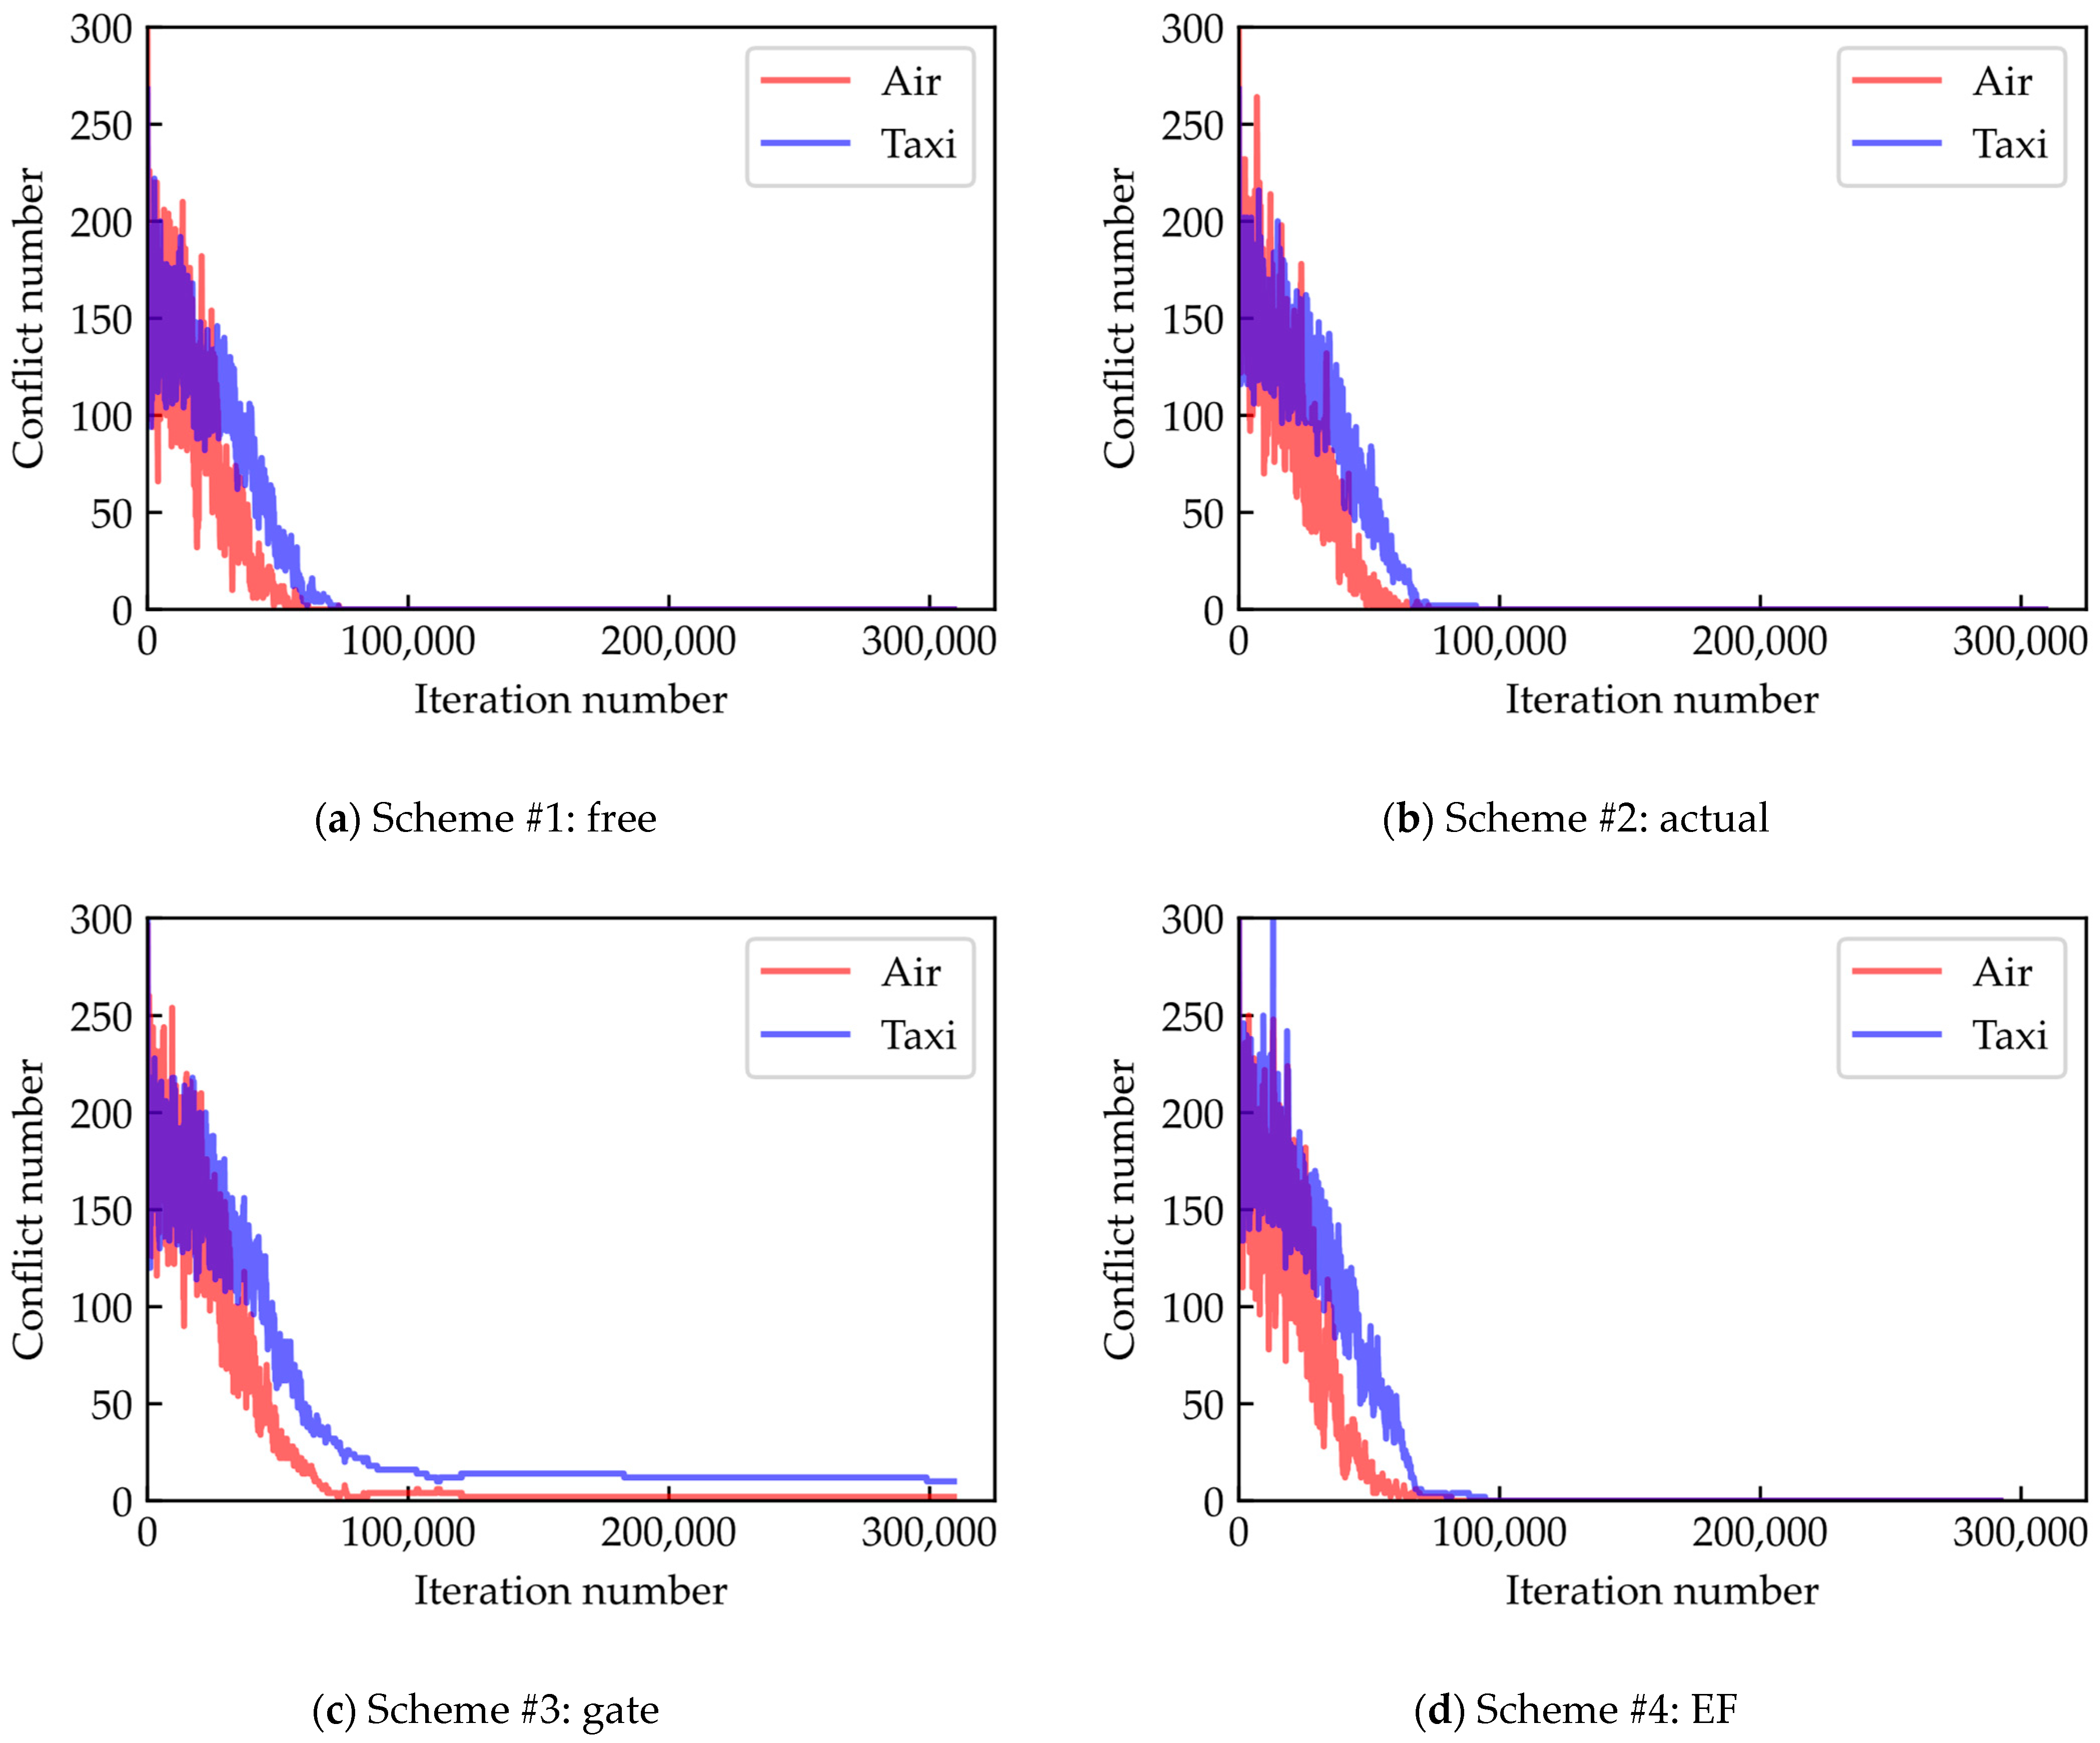
Figure 7 gives conflicts of the four schemes, in which blue lines represent conflicts in taxiways while red lines represent conflicts in TMA. The iterations number used to find a conflict-free solution are different. Scheme #1 found the conflict-free solution in the first 75,000 iterations, while schemes #2 and #4 needed more than 10,000 iterations. However, for scheme #3, the algorithm failed to find a conflict-free solution. This could be attributed to too many aircraft being assigned to one specific side of the runway according to the configuration of the gates, resulting in an unbalance of the total runway resources.
5.2.3. Flight Time and Delay
Figure 8 shows the flight time and delay at EF of arrivals. All four schemes converged after the iterations finished. Scheme #4 led to the shortest flight time (1167.1 s) among the four schemes since scheme #4 used a runway close to the EF of each arrival aircraft. Correspondingly, using a runway close to gates (Figure 8c) would increase the average flight time by 22 s (to 1189.9 s).
Regarding delay at EF, scheme #4 had average delay of 52.7 s, the lowest delay of the four schemes, while scheme #3 had the highest (73.2 s). The value of other two schemes lied between them, without showing significant difference. We infer that the similarity of flight time and EF delay among the four schemes may result from similar flight distance of changing a runway.
5.2.4. Taxi Time, Hold Time and Pushback Delay
In Figure 9, taxi time reflects a significant difference, and pushback delay and holding time showed similar values with no more than 100 s and 10 s differences, respectively. Regarding taxi time, scheme #4 showed the highest in average (579.2 s), while scheme #3 showed the lowest (382.1 s). This taxi time variation resulted from the nature of this two schemes. Note that aircraft could be assigned a runway close to the gate and entry fix at the same time, but this proportion was fairly small (refer to Table 2).
Figure 10 depicts the taxi time of departure and arrival aircraft separately. We could find that arrival taxi time is generally lower than that of departure for the four schemes. This is because the gate for arrival was closer to the runway exit than the gate for departure to the runway entrance. Furthermore, scheme #3 showed more arrival taxi time reduction than the departure one, over 100 s reduction against scheme #2, from which we could infer that gates close to the runway were more beneficial for arrival. However, the cost of lower taxi time was apparent: more conflicts in the air and on the ground existed, and runway usage was highly unbalanced, which will be provided in the following subsection.
5.2.5. Runway Usage
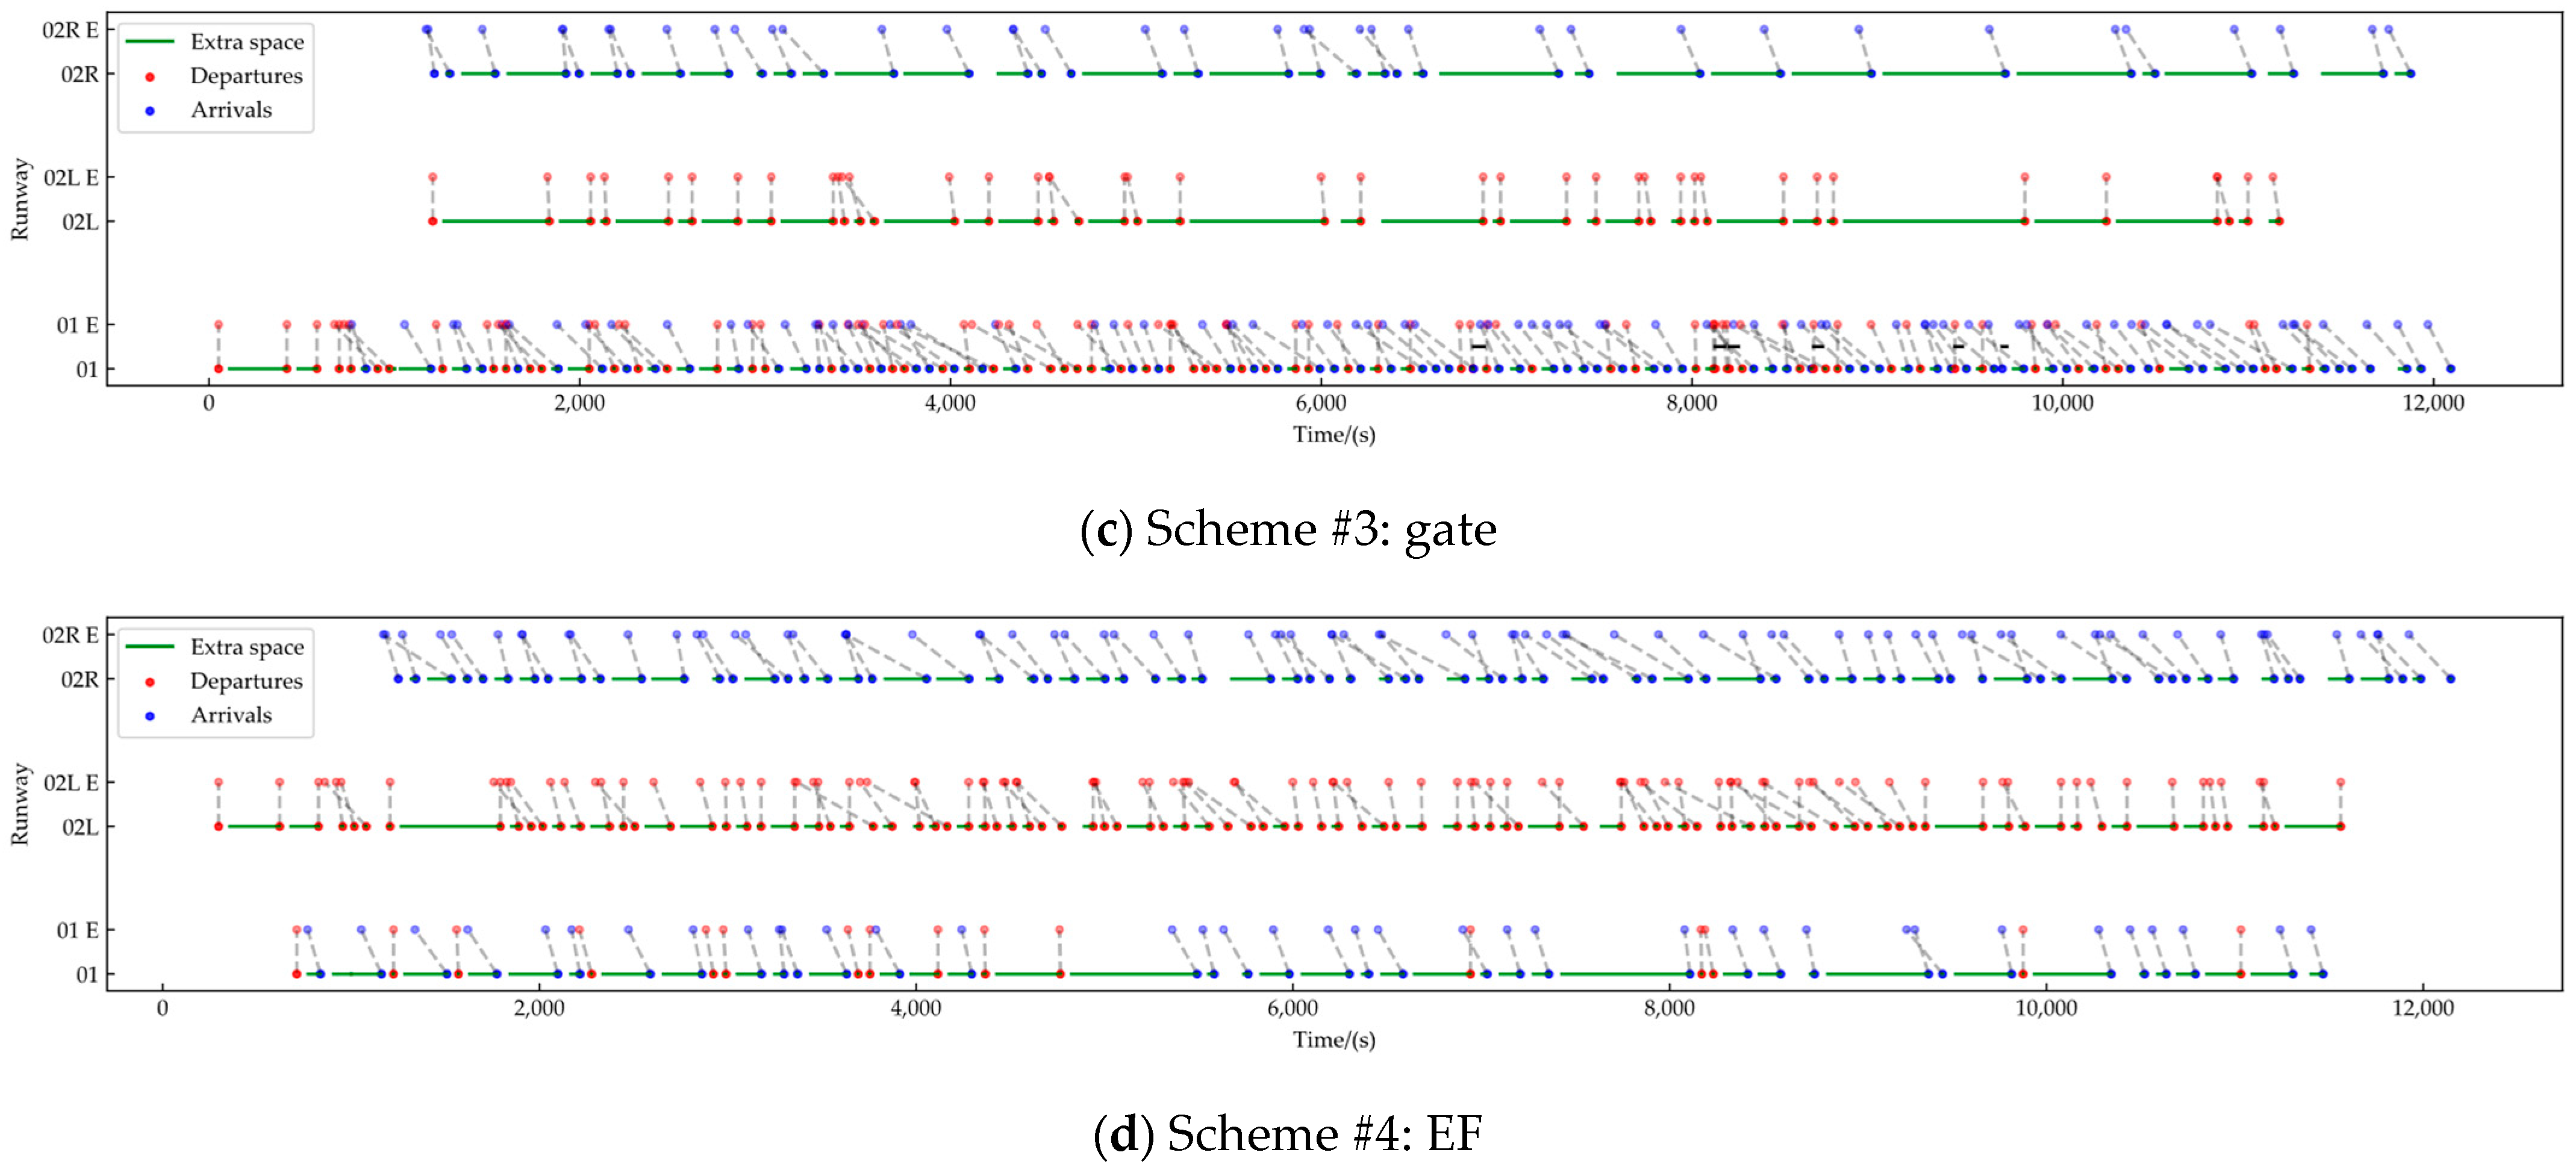
Figure 11 shows the runway usage of three runways of four schemes. According to Figure 11, scheme #3 had a high density on RWY01, which validate the former analysis that too much traffic flow causes severe unbalance in runway capacity, and conflicts cannot be fully mitigated in this scheme. On the other hand, the other two runways were not made the most of usage.
For scheme #1, RWY01 was also used more frequently than the other two runways. This phenomenon could be explained in the following two aspects. Firstly, arrival from EF GYA made a high percentage of the arrivals. This direction of arrival cannot select another runway due to the limit of STAR. Secondly, the west side of ZGGG has only one runway, while the east has two. RWY01 has to hold more traffic than RWY02L and RWY02R to encounter aircraft choosing a better runway (to reduce the taxi time).
6. Discussion
6.1. Analysis of Ten Days’ Peak Hours
To better evaluate the capability of the proposed model, we extend our range of runway assignment optimization to 10 days of operations from 3 December to 12 December 2019. The results are given in Table 4. Specifically, the performance of schemes #1, #3, and #4 are shown in difference from scheme #2, which fixes the runway as the actual operation.
From Table 4, scheme #4 always has the highest cost, which demonstrates that always choosing a runway close to the entry fix cannot have an improvement of operations in the air and on the ground. The flight time decreases, but the gain is at the cost of a considerable taxi time increase. For scheme #3, always assigning a runway close to the gate causes severe runway unbalance, with over 70% of aircraft assigned to RWY01. Using this scheme, though taxi time reduces dramatically, it cannot even deal with all the conflicts, which means this scheme #3 is not operationally applicable.
Scheme #1, sharing both advantages of schemes #3 and #4, assigns runway smartly, leading to a satisfactory result that reduces taxi time and solves all the conflicts simultaneously.
6.2. Solution Validation
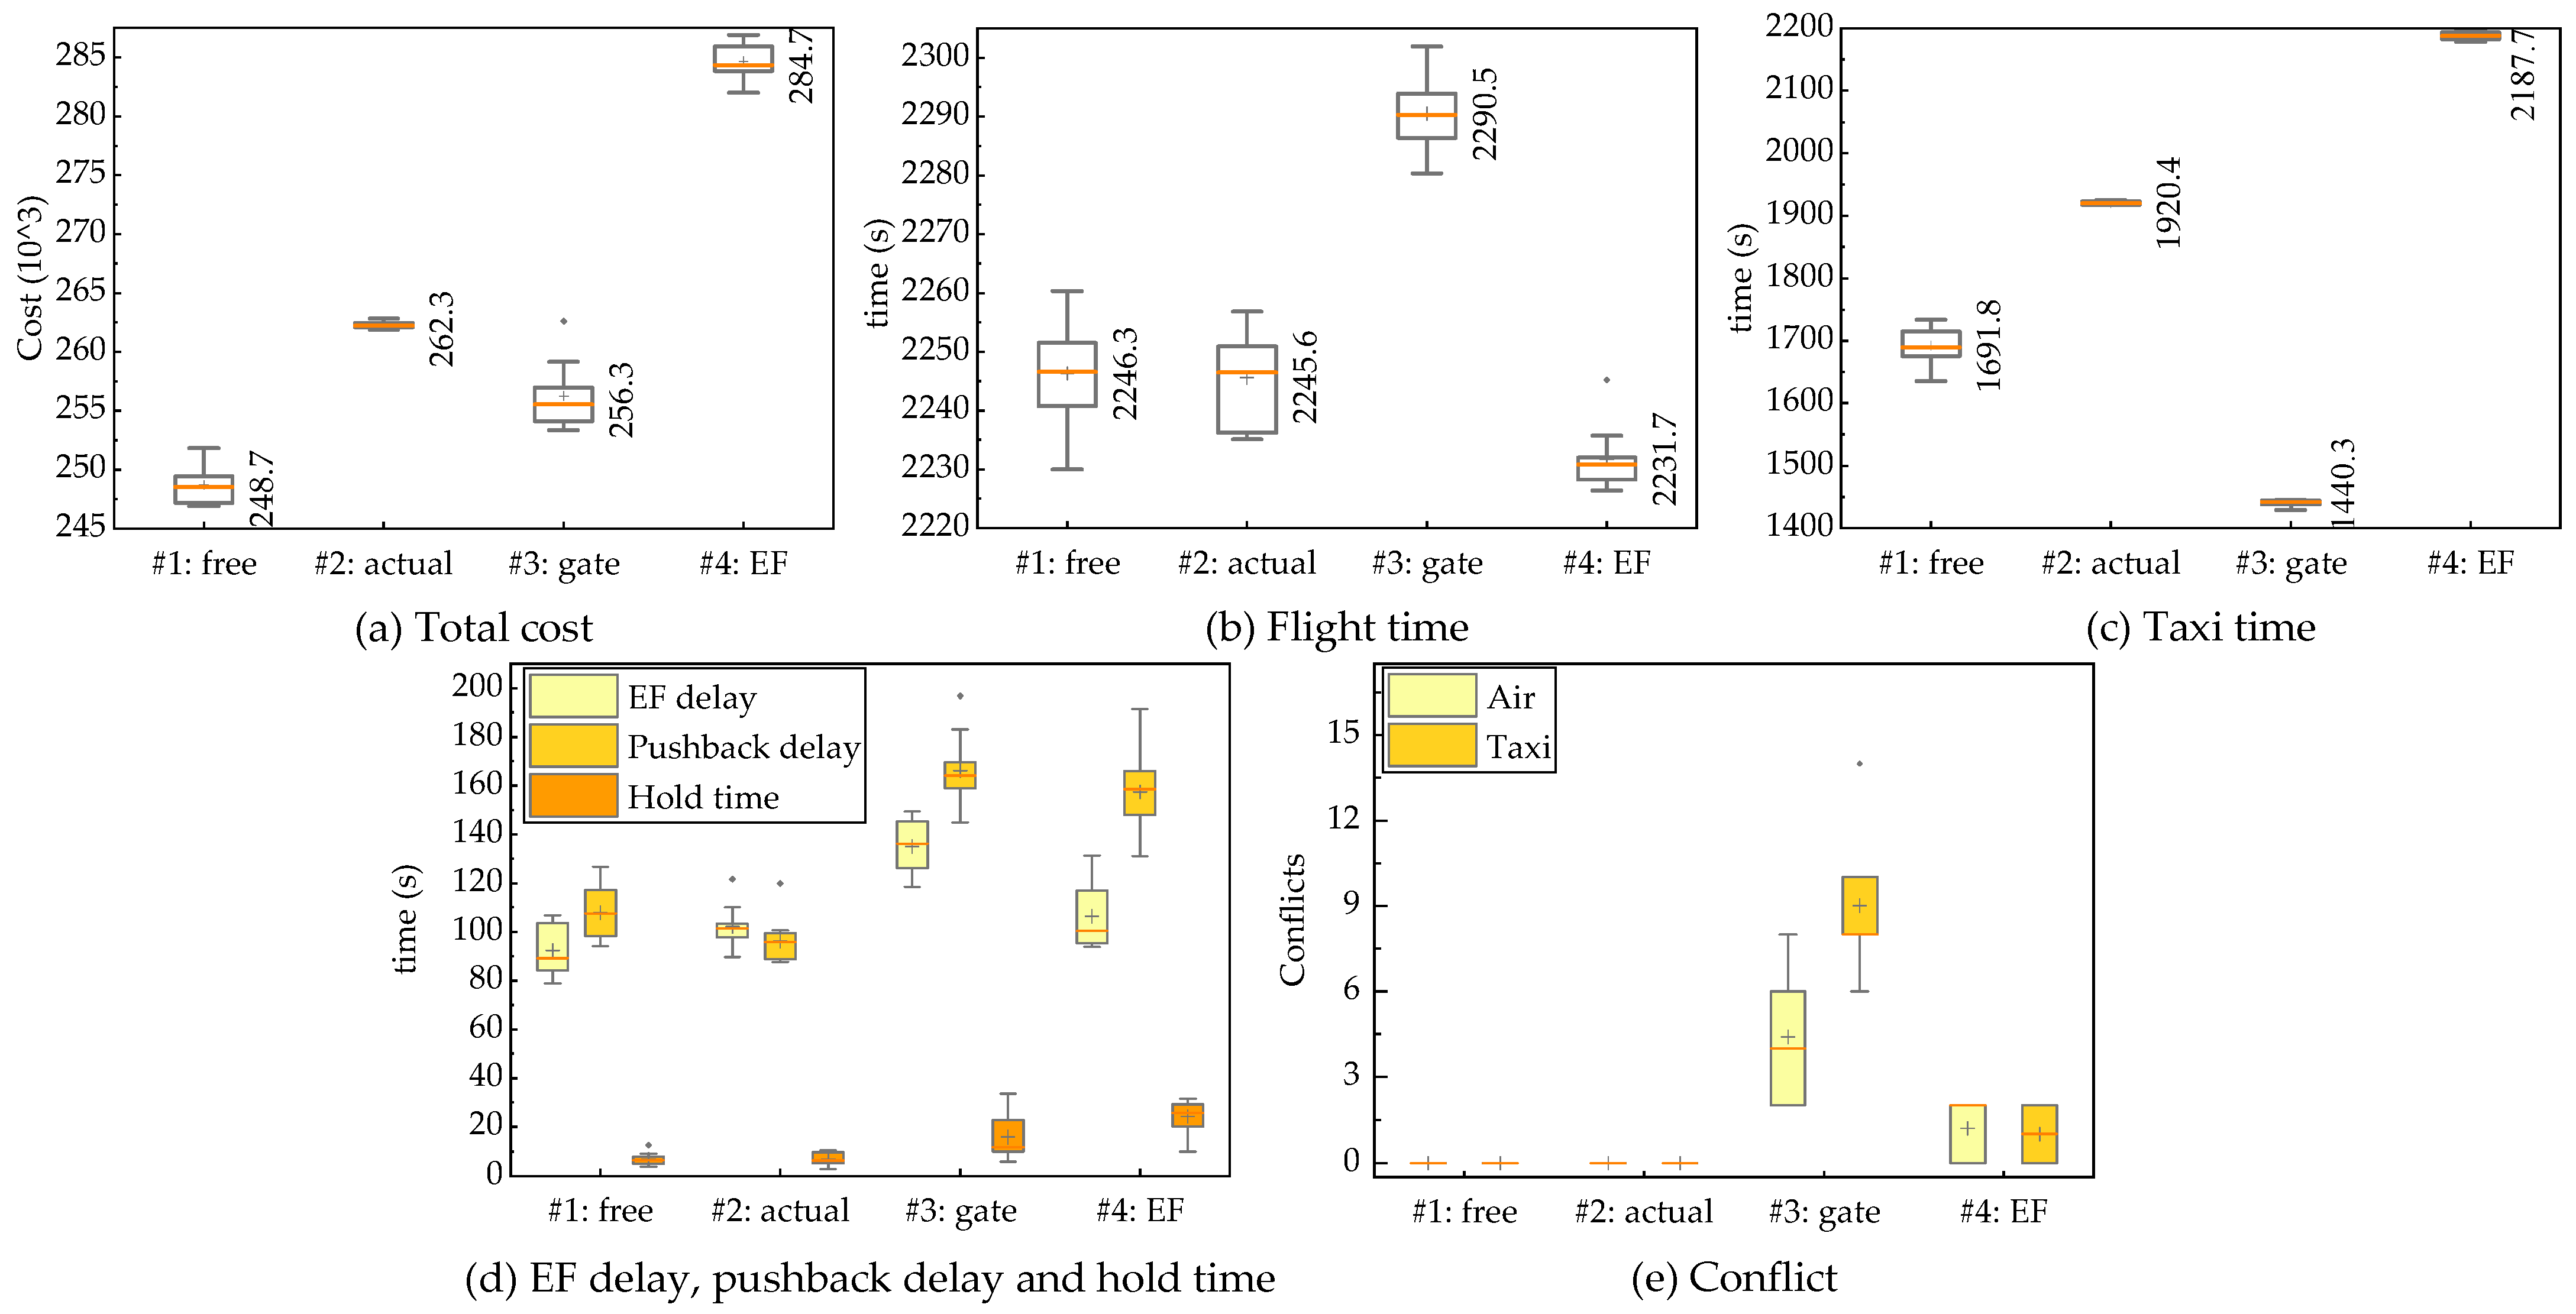
As metaheuristic algorithms have a random characteristic, solutions vary when rerunning the algorithm. Most solutions obtained by metaheuristics are sub-optimal or near-optimal when solving a nonconvex cost function. Therefore, to study the solutions’ quality and the algorithm’s stability, four schemes are run ten times, respectively, based on the scenario on 3 December. The results are shown in Figure 12 below.
As shown in Figure 12, the total cost and other objectives are presented. With each scheme running ten times, respectively, box plots are adopted to present the variation in results. From Figure 12a, scheme #1 always has the lowest cost of the four schemes and is followed by scheme #3, scheme #2, and scheme #4. From Figure 12b,c, we compare schemes #1, #3, and #4 with scheme #2. Scheme #1 shows a similar flight time distribution but saves over 200 s of taxi time instead. Scheme #3 increases approximately 45 s flight time while reducing nearly 500 s of taxi time. Scheme #4, however, saves less than 10 s of flight time but increases taxi time by more than 200 s using a runway close to the entry fix. From Figure 12d,e, scheme #1 and #2 has a generally low delay and hold time, and these two schemes can always solve all the conflicts, while scheme #3 and #4 cannot due to fixing a solid preference of runways.
Through many repetitions above, scheme #1 performs stably and proves its advantage against other schemes, especially in the reduction in taxi time without loss edges in other metrics.
6.3. Insights on Operational Feasibility of Free Assignment Schemes
Now that scheme #1, or free assignment scheme, outperforms among the four schemes, this subsection tries to discover why this scheme is better and whether it is feasible under real operation conditions.
First, Table 5 summarizes the percentage of assigned runway that is close to gate, EF and both, after ten replications of optimization using free assignment and ten days of historical data (3 December to 12 December 2019), compared with history allocation and assignment close to gate. From Table 5, we can find that free assignment scheme is indeed a ‘weaker’ version of assignment close to gate, which also presents a trend to assign more aircraft to the runway that is close to its predefined gate (77.65% on average). However, free assignment has an ability to balance the runway traffic flow, which avoid too much traffic to be simply assigned to the runway close to their gates, thus achieving a conflict-free solution of operation.
Second, from the perspective of multiple stakeholders, considerable efforts would be required to implement such a scheme. For TMA ATCOS, or approach controllers, their workload would increase significantly, as the percentage of runway assigned close to EF is reduced by approximately 14% compared with history data. Therefore, they would spend more time on each aircraft since the flight time may increase when using a runway close to gate. In addition, they may have less experience in instructing aircraft to that runway since they are used to the runway close to EF. For tower controllers, their workload may decrease, and overall taxi network efficiency would benefit as higher percentage of runway close to gate enables a reduction taxi time. For flight crews, they may experience a longer flight time but gain more time during taxiing to their gate. Given that modern civil airliners are equipped with advanced Flight Management Systems (FMS), pilots can easily switch to a standard arrival route in their FMS or follow the controllers’ instructions.
Third, somes modification are required on the current framework. From a strategic level, a better standard flight procedure aimed at improving the terminal airspace efficiency should be designed. This may include straightening the routes, ensure each EF have a STAR to each runway, and decoupling traffic flow based on different EFs, runways, and operation types (i.e., arrivals and departures). Meanwhile, more intelligent gate allocation strategies [38] have potential to enhance airport surface operation efficiency. The collaboration of both strategies is likely to obtain more desirable results. Furthermore, an advanced data sharing mechanism should be established to facilitate better negotiation among multiple stakeholders and a centralized ground-based decision support system is required to compute the optimal solutions and distribute the decision advice using data links.
Fourth, uncertainty in operation must be taken considerations when applying a free assignment scheme. Uncertainty modeling has been a heated research topic in ATM to cater to the real operation environment. In the context of the terminal airspace operation and airport surface operation, there is a wide focus on time uncertainty (i.e., flight or taxi time), given concerns about on-time performance in the aviation industry and deviations in time can disrupt deterministic optimization schedules. To address uncertainties in operations, the concept of robust optimization [8] is proposed, with its family including stochastic programming [39] and distributionally robust optimization [40]. Though most of the above methods are prevalent in mathematical optimization, these frameworks can also be incorporated in metaheuristics by Monte Carlo simulation on different realizations or analytic derivation [41] of uncertain parameters.
Fifth, if the proposed model is about to deploy in the real operation environment, a more efficient programming language (e.g., C++ or Java) will be a substitute for Python used in this paper. Also, to adapt to a dynamic operation environment, the implementation of a rolling horizon method [42] is well applicable for the proposed model. In the end, if the uncertainty is incorporated, the distributed computation can accelerate the optimization effectively through parallel processing.
7. Conclusions
This paper proposes a runway assignment model to integrate and optimize both terminal airspace and airport surface movement operation, addressing controllers’ concerns about whether detours on the ground or delays in the air result in better operational performance. This paper aims to minimize the total sum of each operation metric related to the TMA (flight time, flight delay) and the AS (hold time, pushback delay, taxi time) using a free assignment of runways. First, a runway assignment model is proposed, formulating STARs and taxi routes as a node-link graph. Second, alternate taxi routes are recognized based on historical trajectories. Third, a simulated annealing algorithm is used to solve the model. Fourth, a case study of historical runway assignment and operational performance on flight and taxi time based on ZGGG is carried out. Results show that free runway assignment can facilitate each metric compared with the initial runway assignment, except for a slight increase in delay at EF. Assigning a runway close to the gate will lead to highly unbalanced runway usage, and conflicts remain in the air and on the ground, though an optimal taxi time can be obtained, while assigning a runway close to its entry reduces flight time at the cost of its metrics downgrading.
However, there are certain limitations in this paper. First, the current objective function only considers a sum of various time metrics, which cannot accurately measure the different cost coefficients on the ground and in the air. A more precise weight of the objective will be set in the future. Second, the current version of simulated annealing still has more room to fasten its convergence. Thus, a more powerful heuristic neighborhood function should be defined. Lastly, while the free assignment scheme effectively identifies conflict-free solutions, there is potential for further optimizing the distribution of runway usage. Future studies should focus more on achieving a balanced utilization of runways.
Author Contributions
Conceptualization, Z.D. and J.Z.; methodology, Z.D. and Z.M.; data curation, J.X. and Z.M.; writing—original draft preparation, Z.D.; writing—review and editing, Z.D. and J.Z. All authors have read and agreed to the published version of the manuscript.
Funding
This research was funded by the National Natural Science Foundation of China (Grant No. 52372315), as well as the Postgraduate Research & Practice Innovation Program of NUAA (No. xcxjh20230734).
Data Availability Statement
The data that support the findings of this study are available from Central and Southern Regional ATMB of the CAAC. Restrictions apply to the availability of these data, which were used under license for this study. Data are available from the corresponding author ([email protected]) with the permission of Central and Southern Regional ATMB of the CAAC.
Conflicts of Interest
The authors declare no conflict of interest.
References
- Adacher, L.; Flamini, M.; Romano, E. Airport Ground Movement Problem: Minimization of Delay and Pollution Emission. IEEE Trans. Intell. Transp. Syst. 2018, 19, 3830–3839. [Google Scholar] [CrossRef]
- Liu, Y.; Hansen, M. Incorporating Predictability Into Cost Optimization for Ground Delay Programs. Transp. Sci. 2016, 50, 132–149. [Google Scholar] [CrossRef]
- Jiang, Y.; Liu, Z.; Hu, Z.; Zhang, H. A Priority-Based Conflict Resolution Strategy for Airport Surface Traffic Considering Suboptimal Alternative Paths. IEEE Access 2021, 9, 606–617. [Google Scholar] [CrossRef]
- Bosson, C.S.; Sun, D. Optimization of Airport Surface Operations Under Uncertainty. J. Air Transp. 2016, 24, 84–92. [Google Scholar] [CrossRef]
- Ma, J.; Delahaye, D.; Sbihi, M.; Scala, P.M.; Mota, M.M. A Study of Tradeoffs in Airport Coordinated Surface Operations. In Proceedings of the 5th ENRI International Workshop on ATM/CNS: Drafting Future Skies, Tokyo, Japan, 14–16 November 2017. [Google Scholar]
- Weiszer, M.; Burke, E.K.; Chen, J. Multi-Objective Routing and Scheduling for Airport Ground Movement. Transp. Res. Part C Emerg. Technol. 2020, 119, 102734. [Google Scholar] [CrossRef]
- Jiang, Y.; Wang, Y.; Liu, M.; Xue, Q.; Zhang, H.; Zhang, H. Bilevel Spatial–Temporal Aircraft Taxiing Optimization Considering Carbon Emissions. Sustain. Energy Technol. Assess. 2023, 58, 103358. [Google Scholar] [CrossRef]
- Murça, M.C.R. A Robust Optimization Approach for Airport Departure Metering under Uncertain Taxi-out Time Predictions. Aerosp. Sci. Technol. 2017, 68, 269–277. [Google Scholar] [CrossRef]
- Ma, J.; Zhou, J.; Liang, M.; Delahaye, D. Data-Driven Trajectory-Based Analysis and Optimization of Airport Surface Movement. Transp. Res. Part C Emerg. Technol. 2022, 145, 103902. [Google Scholar] [CrossRef]
- Badrinath, S.; Balakrishnan, H.; Ma, J.; Delahaye, D. Comparative Analysis of Departure Metering at United States and European Airports. J. Air Transp. 2020, 28, 93–104. [Google Scholar] [CrossRef]
- Khadilkar, H.; Balakrishnan, H. Network Congestion Control of Airport Surface Operations. J. Guid. Control Dyn. 2014, 37, 933–940. [Google Scholar] [CrossRef]
- Ma, J.; Delahaye, D.; Sbihi, M.; Scala, P.; Mujica Mota, M.A. Integrated Optimization of Terminal Maneuvering Area and Airport at the Macroscopic Level. Transp. Res. Part C Emerg. Technol. 2019, 98, 338–357. [Google Scholar] [CrossRef]
- Khadilkar, H.; Balakrishnan, H. Integrated Control of Airport and Terminal Airspace Operations. IEEE Trans. Control Syst. Technol. 2016, 24, 216–225. [Google Scholar] [CrossRef]
- Bosson, C.; Xue, M.; Zelinski, S.; Field, M. Optimizing Integrated Arrival, Departure and Surface Operations Under Uncertainty. In Proceedings of the 10th USA/Europe Air Traffic Management Research and Development Seminar (ATM2015), Lisbon, Portugal, 23 June 2015. [Google Scholar]
- Chandrasekar, S.; Hwang, I. Algorithm for Optimal Arrival and Departure Sequencing and Runway Assignment. J. Guid. Control Dyn. 2015, 38, 601–613. [Google Scholar] [CrossRef]
- Kim, B.; Li, L.; Clarke, J.-P. Runway Assignments That Minimize Terminal Airspace and Airport Surface Emissions. J. Guid. Control Dyn. 2014, 37, 789–798. [Google Scholar] [CrossRef]
- Zhang, J.; Zhao, P.; Zhang, Y.; Dai, X.; Sui, D. Criteria Selection and Multi-Objective Optimization of Aircraft Landing Problem. J. Air Transp. Manag. 2020, 82, 101734. [Google Scholar] [CrossRef]
- Solveling, G.; Solak, S.; Clarke, J.-P.; Johnson, E. Runway Operations Optimization in the Presence of Uncertainties. J. Guid. Control Dyn. 2011, 34, 1373–1382. [Google Scholar] [CrossRef]
- Zhang, J.; Zhao, P. A New Meta Heuristic Approach for Aircraft Landing Problem. Trans. Nanjing Univ. Aeronaut. Astronaut. 2020, 37, 197–208. [Google Scholar]
- Zhang, J.; Liu, J.; Hu, R.; Zhu, H. Online Four Dimensional Trajectory Prediction Method Based on Aircraft Intent Updating. Aerosp. Sci. Technol. 2018, 77, 774–787. [Google Scholar] [CrossRef]
- Zhang, J.; Peng, Z.; Yang, C.; Wang, B. Data-Driven Flight Time Prediction for Arrival Aircraft within the Terminal Area. IET Intell. Transp. Syst. 2022, 16, 263–275. [Google Scholar] [CrossRef]
- Xu, J.; Zhang, J.; Peng, Z.; Bao, J.; Wang, B. Data-Driven Departure Flight Time Prediction Based on Feature Construction and Ensemble Learning. J. Aerosp. Inf. Syst. 2023, 20, 1–14. [Google Scholar] [CrossRef]
- Khassiba, A.; Bastin, F.; Cafieri, S.; Gendron, B.; Mongeau, M. Two-Stage Stochastic Mixed-Integer Programming with Chance Constraints for Extended Aircraft Arrival Management. Transp. Sci. 2020, 54, 897–919. [Google Scholar] [CrossRef]
- Khassiba, A.; Cafieri, S.; Bastin, F.; Mongeau, M.; Gendron, B. Two-Stage Stochastic Programming Models for the Extended Aircraft Arrival Management Problem with Multiple Pre-Scheduling Points. Transp. Res. Part C Emerg. Technol. 2022, 142, 103769. [Google Scholar] [CrossRef]
- Khassiba, A.; Bastin, F.; Gendron, B.; Cafieri, S.; Mongeau, M. Extended Aircraft Arrival Management Under Uncertainty: A Computational Study. J. Air Transp. 2019, 27, 131–143. [Google Scholar] [CrossRef]
- Sáez, R.; Prats, X.; Polishchuk, T.; Polishchuk, V. Traffic Synchronization in Terminal Airspace to Enable Continuous Descent Operations in Trombone Sequencing and Merging Procedures: An Implementation Study for Frankfurt Airport. Transp. Res. Part C Emerg. Technol. 2020, 121, 102875. [Google Scholar] [CrossRef]
- Kamo, S.; Rosenow, J.; Fricke, H.; Soler, M. Robust Optimization Integrating Aircraft Trajectory and Sequence under Weather Forecast Uncertainty. Transp. Res. Part C Emerg. Technol. 2023, 152, 104187. [Google Scholar] [CrossRef]
- Gui, D.; Le, M.; Huang, Z.; Zhang, J.; D’Ariano, A. Optimal Aircraft Arrival Scheduling with Continuous Descent Operations in Busy Terminal Maneuvering Areas. J. Air Transp. Manag. 2023, 107, 102344. [Google Scholar] [CrossRef]
- Gui, X.; Zhang, J.; Tang, X.; Bao, J.; Wang, B. A Data-Driven Trajectory Optimization Framework for Terminal Maneuvering Area Operations. Aerosp. Sci. Technol. 2022, 131, 108010. [Google Scholar] [CrossRef]
- Badrinath, S.; Li, M.Z.; Balakrishnan, H. Integrated Surface-Airspace Model of Airport Departures. J. Guid. Control Dyn. 2019, 42, 1049–1063. [Google Scholar] [CrossRef]
- Ma, J.; Delahaye, D.; Sbihi, M.; Scala, P.M. Integrated Optimization of Arrival, Departure, and Surface Operations. In Proceedings of the 8th International Conference for Research in Air Transportation (ICRAT2018), Catalonia, Spain, 26–29 June 2018. [Google Scholar]
- Deau, R.; Gotteland, J.-B.; Durand, N. Airport Surface Management and Runways Scheduling. In Proceedings of the 8th USA/Europe Air Traffic Management Research and Development Seminar (ATM2009), Napa, CA, USA, 29 June–2 July 2009. [Google Scholar]
- Beasley, J.E.; Krishnamoorthy, M.; Sharaiha, Y.M.; Abramson, D. Scheduling Aircraft Landings—The Static Case. Transp. Sci. 2000, 34, 180–197. [Google Scholar] [CrossRef]
- Evertse, C.; Visser, H.G. Real-Time Airport Surface Movement Planning: Minimizing Aircraft Emissions. Transp. Res. Part C Emerg. Technol. 2017, 79, 224–241. [Google Scholar] [CrossRef]
- Franzin, A.; Stützle, T. Revisiting Simulated Annealing: A Component-Based Analysis. Comput. Oper. Res. 2019, 104, 191–206. [Google Scholar] [CrossRef]
- Khassiba, A.; Delahaye, D. Simulated-Annealing Hyper-Heuristic for Demand-Capacity Balancing in Air Traffic Flow Management. In Proceedings of the 12th SESAR Innovation Days, Budapest, Hungary, 5–8 December 2022. [Google Scholar]
- Peng, Z.; Zhang, J.; Xiang, T.; Wang, B.; Guo, H. Benefits Derived from Arrival Management and Wake Turbulence Re-Categorization in China. Transp. Res. Rec. 2021, 2675, 373–383. [Google Scholar] [CrossRef]
- Jiang, Y.; Wang, Y.; Hu, Z.; Xue, Q.; Yu, B. Airport Gate Assignment Problem with Harbor Constraints Based on Branch-and-Price Algorithm. Transp. Res. Part E Logist. Transp. Rev. 2023, 176, 103192. [Google Scholar] [CrossRef]
- Wang, Y.; Liu, C.; Wang, H.; Duong, V. Slot Allocation for a Multiple-Airport System Considering Airspace Capacity and Flying Time Uncertainty. Transp. Res. Part C Emerg. Technol. 2023, 153, 104185. [Google Scholar] [CrossRef]
- Xu, Y.; Wandelt, S.; Sun, X. A Distributionally Robust Optimization Approach for Airline Integrated Recovery under In-Flight Pandemic Transmission Risks. Transp. Res. Part C Emerg. Technol. 2023, 152, 104188. [Google Scholar] [CrossRef] [PubMed]
- Huo, Y.; Delahaye, D.; Sbihi, M. A Probabilistic Model Based Optimization for Aircraft Scheduling in Terminal Area under Uncertainty. Transp. Res. Part C Emerg. Technol. 2021, 132, 103374. [Google Scholar] [CrossRef]
- Jacquillat, A. Predictive and Prescriptive Analytics Toward Passenger-Centric Ground Delay Programs. Transp. Sci. 2022, 56, 265–298. [Google Scholar] [CrossRef]
Figure 1.
Airport map and its abstraction: (a) airport map of Guangzhou Baiyun International Airport; (b) node-link abstraction and the detection zones indices.
Figure 1.
Airport map and its abstraction: (a) airport map of Guangzhou Baiyun International Airport; (b) node-link abstraction and the detection zones indices.

Figure 2.
History taxi trajectories from the same runway–gate pair: (a) eight alternate routes from runway 02R to gate 142; (b) only one route from runway 01 to gate 139.
Figure 2.
History taxi trajectories from the same runway–gate pair: (a) eight alternate routes from runway 02R to gate 142; (b) only one route from runway 01 to gate 139.

Figure 3.
Numbers of runway–gate pairs for each number of alternate taxi routes, with 21 pairs having 3 taxi route options and 2 pairs having 8 options.
Figure 3.
Numbers of runway–gate pairs for each number of alternate taxi routes, with 21 pairs having 3 taxi route options and 2 pairs having 8 options.
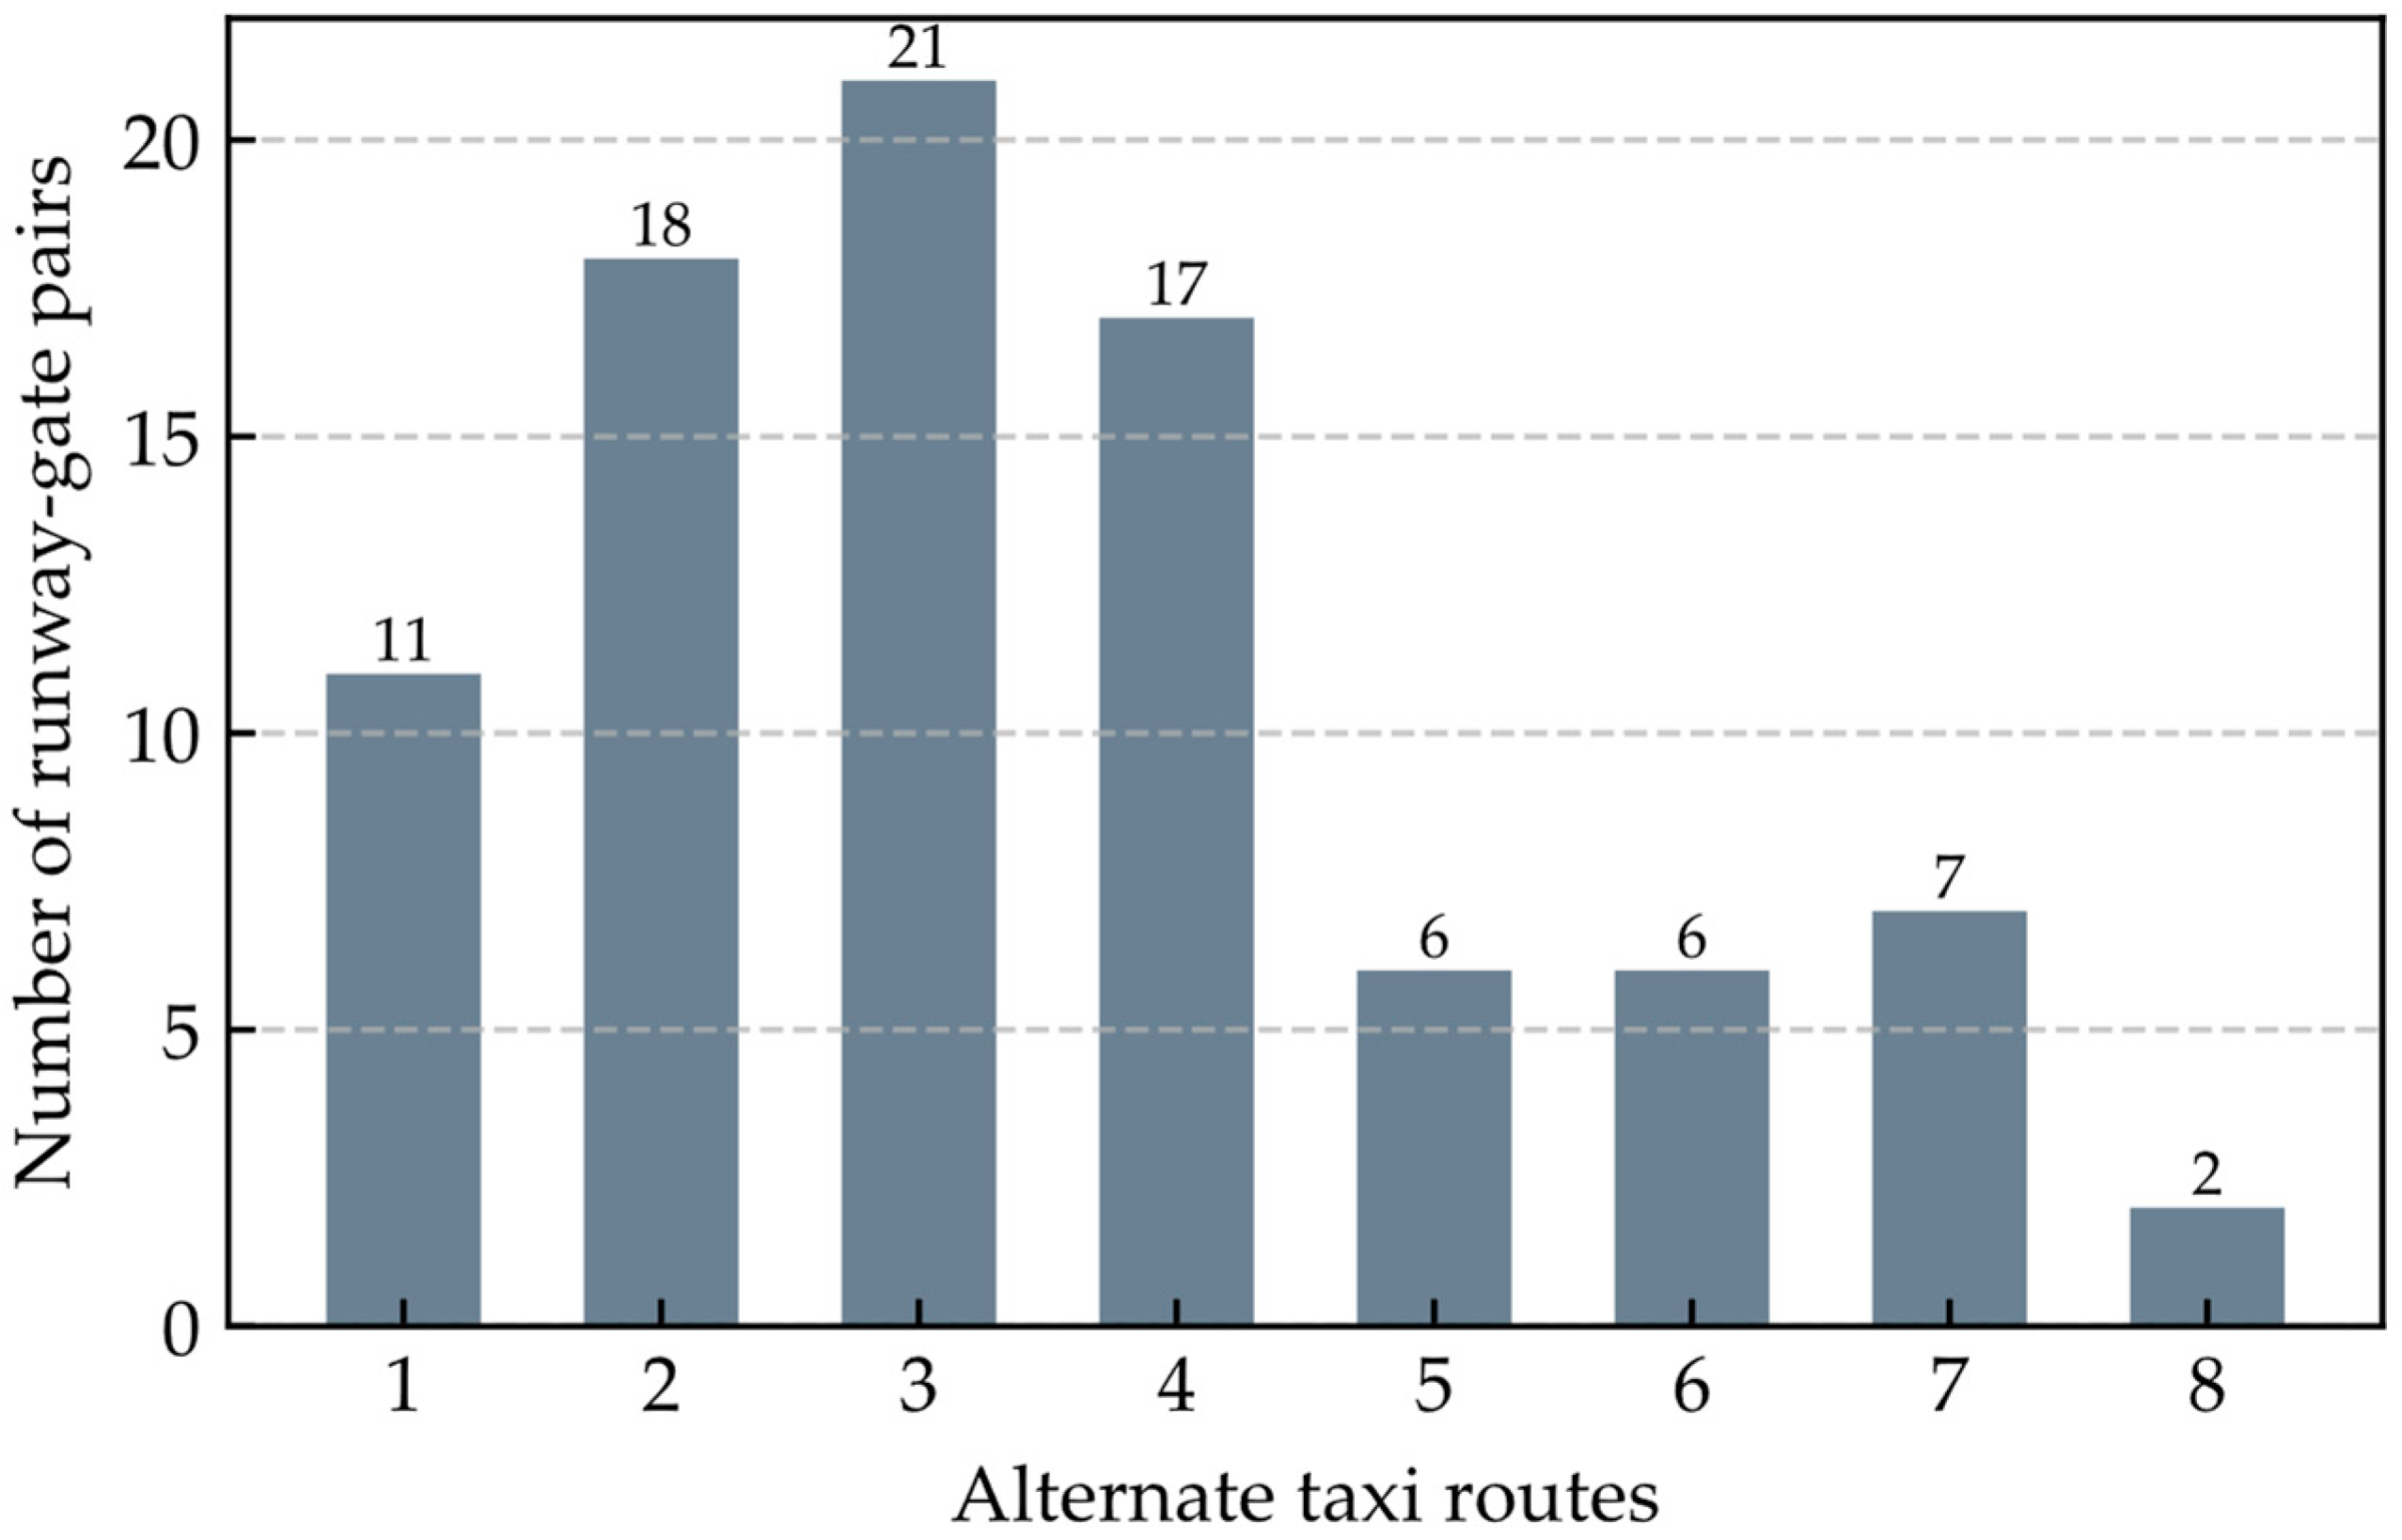
Figure 4.
Illustration of ZGGG terminal area and entry fixes: traffic flow from GYA landed on runway 01 only; P71, ATAGA, and IGONO on either runway 01 or 02R; P270 and IDUMA on runway 02R only.
Figure 4.
Illustration of ZGGG terminal area and entry fixes: traffic flow from GYA landed on runway 01 only; P71, ATAGA, and IGONO on either runway 01 or 02R; P270 and IDUMA on runway 02R only.
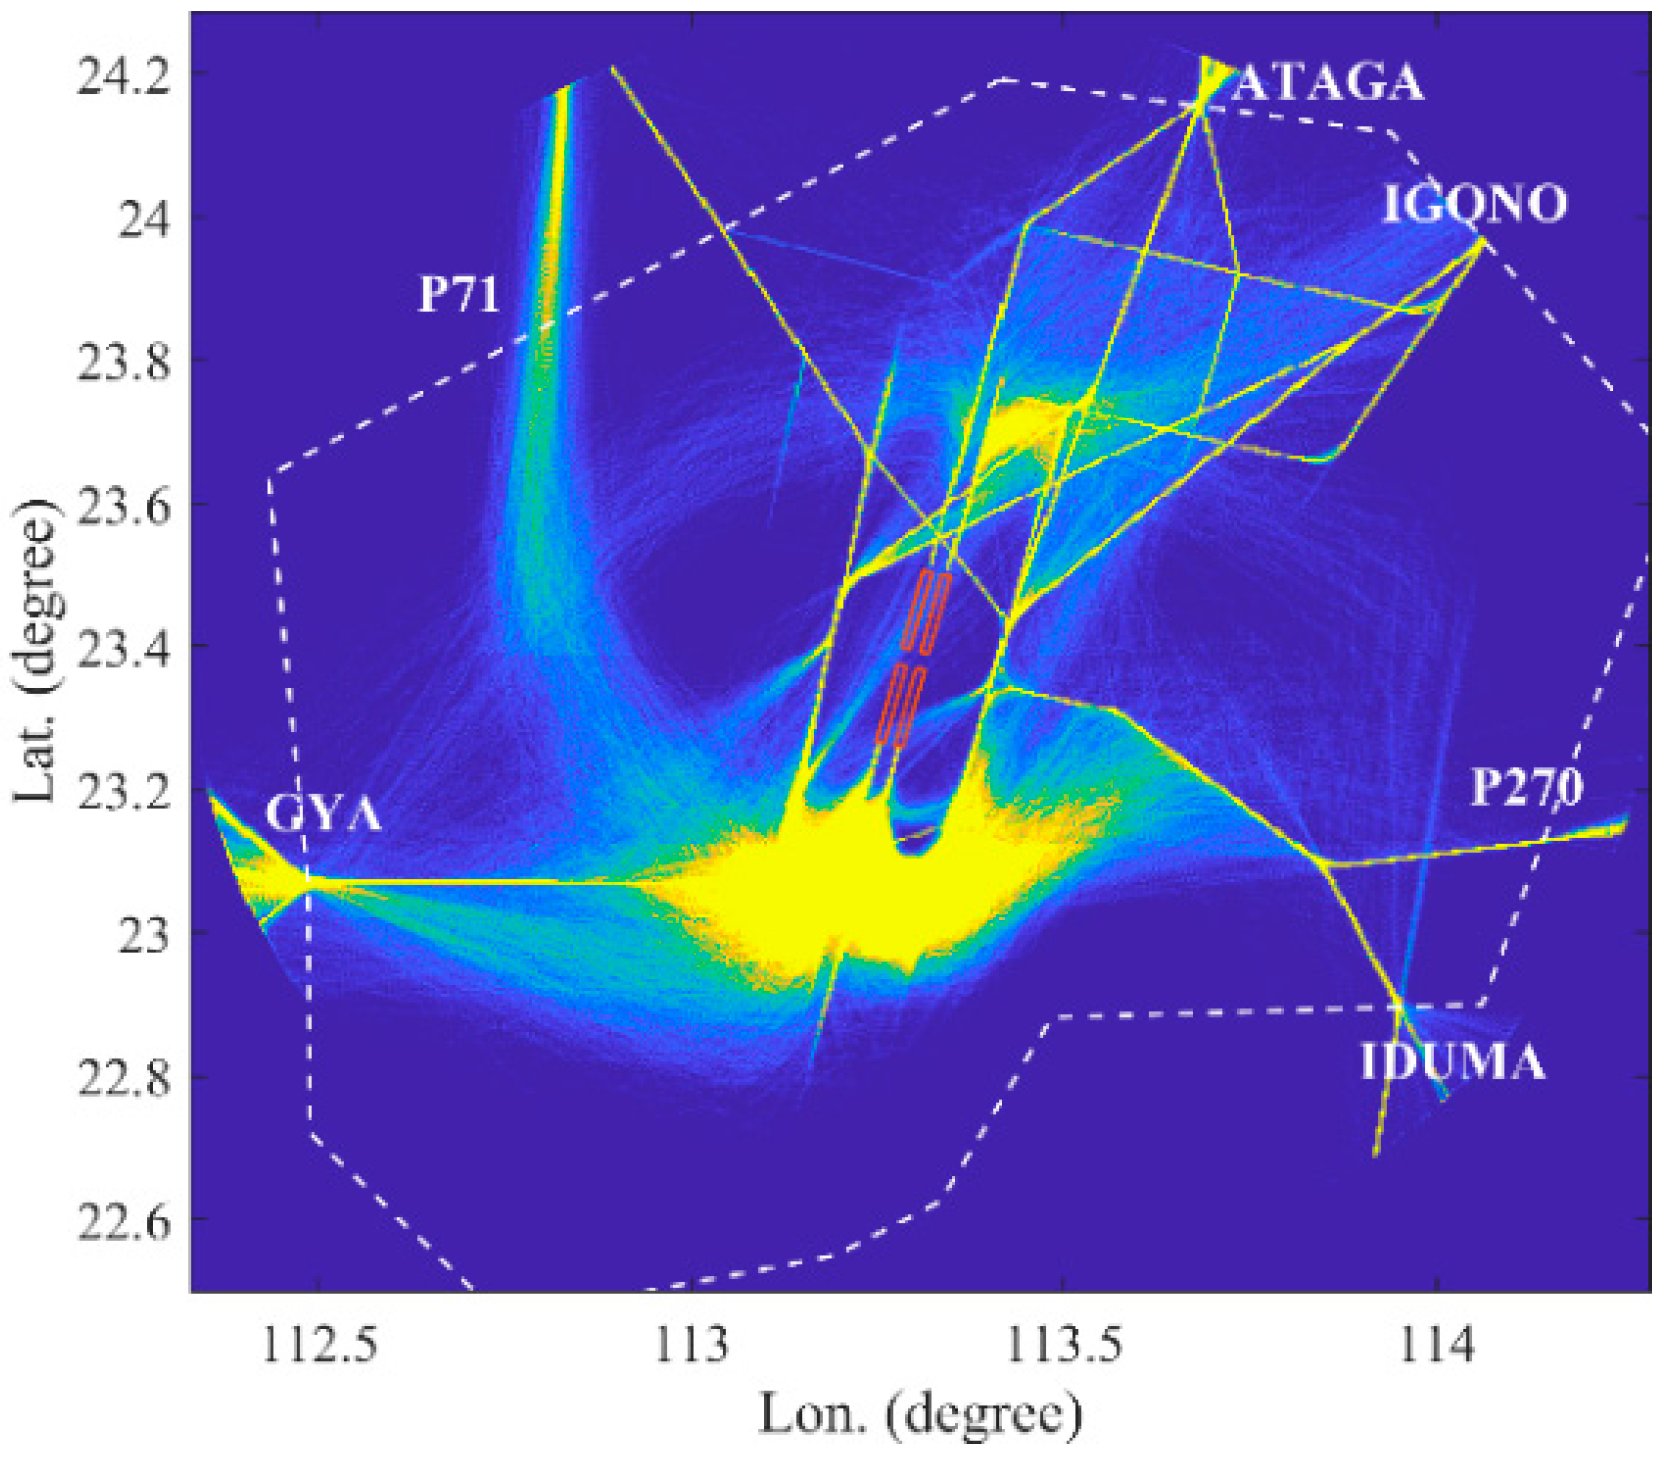
Figure 5.
History operation time distribution: (a) History flight time distribution from entry fix to the corresponding runway. Aircraft from P71, ATAGA and IGONO have a similar average flight time. (b) History taxi time distribution from the runway either close to or far from the gate. Arrivals have a lower average taxi time than departures.

Figure 6.
Cost function value and temperature convergence curve. All the four schemes converged after 100,000 iterations.
Figure 6.
Cost function value and temperature convergence curve. All the four schemes converged after 100,000 iterations.

Figure 7.
Taxi and air conflicts. Most schemes conflicts converged to zero while scheme #3 cannot find a conflict-free solution.
Figure 7.
Taxi and air conflicts. Most schemes conflicts converged to zero while scheme #3 cannot find a conflict-free solution.

Figure 8.
Metrics in the air. Scheme #4 has the lowest arrival delay and flight time.
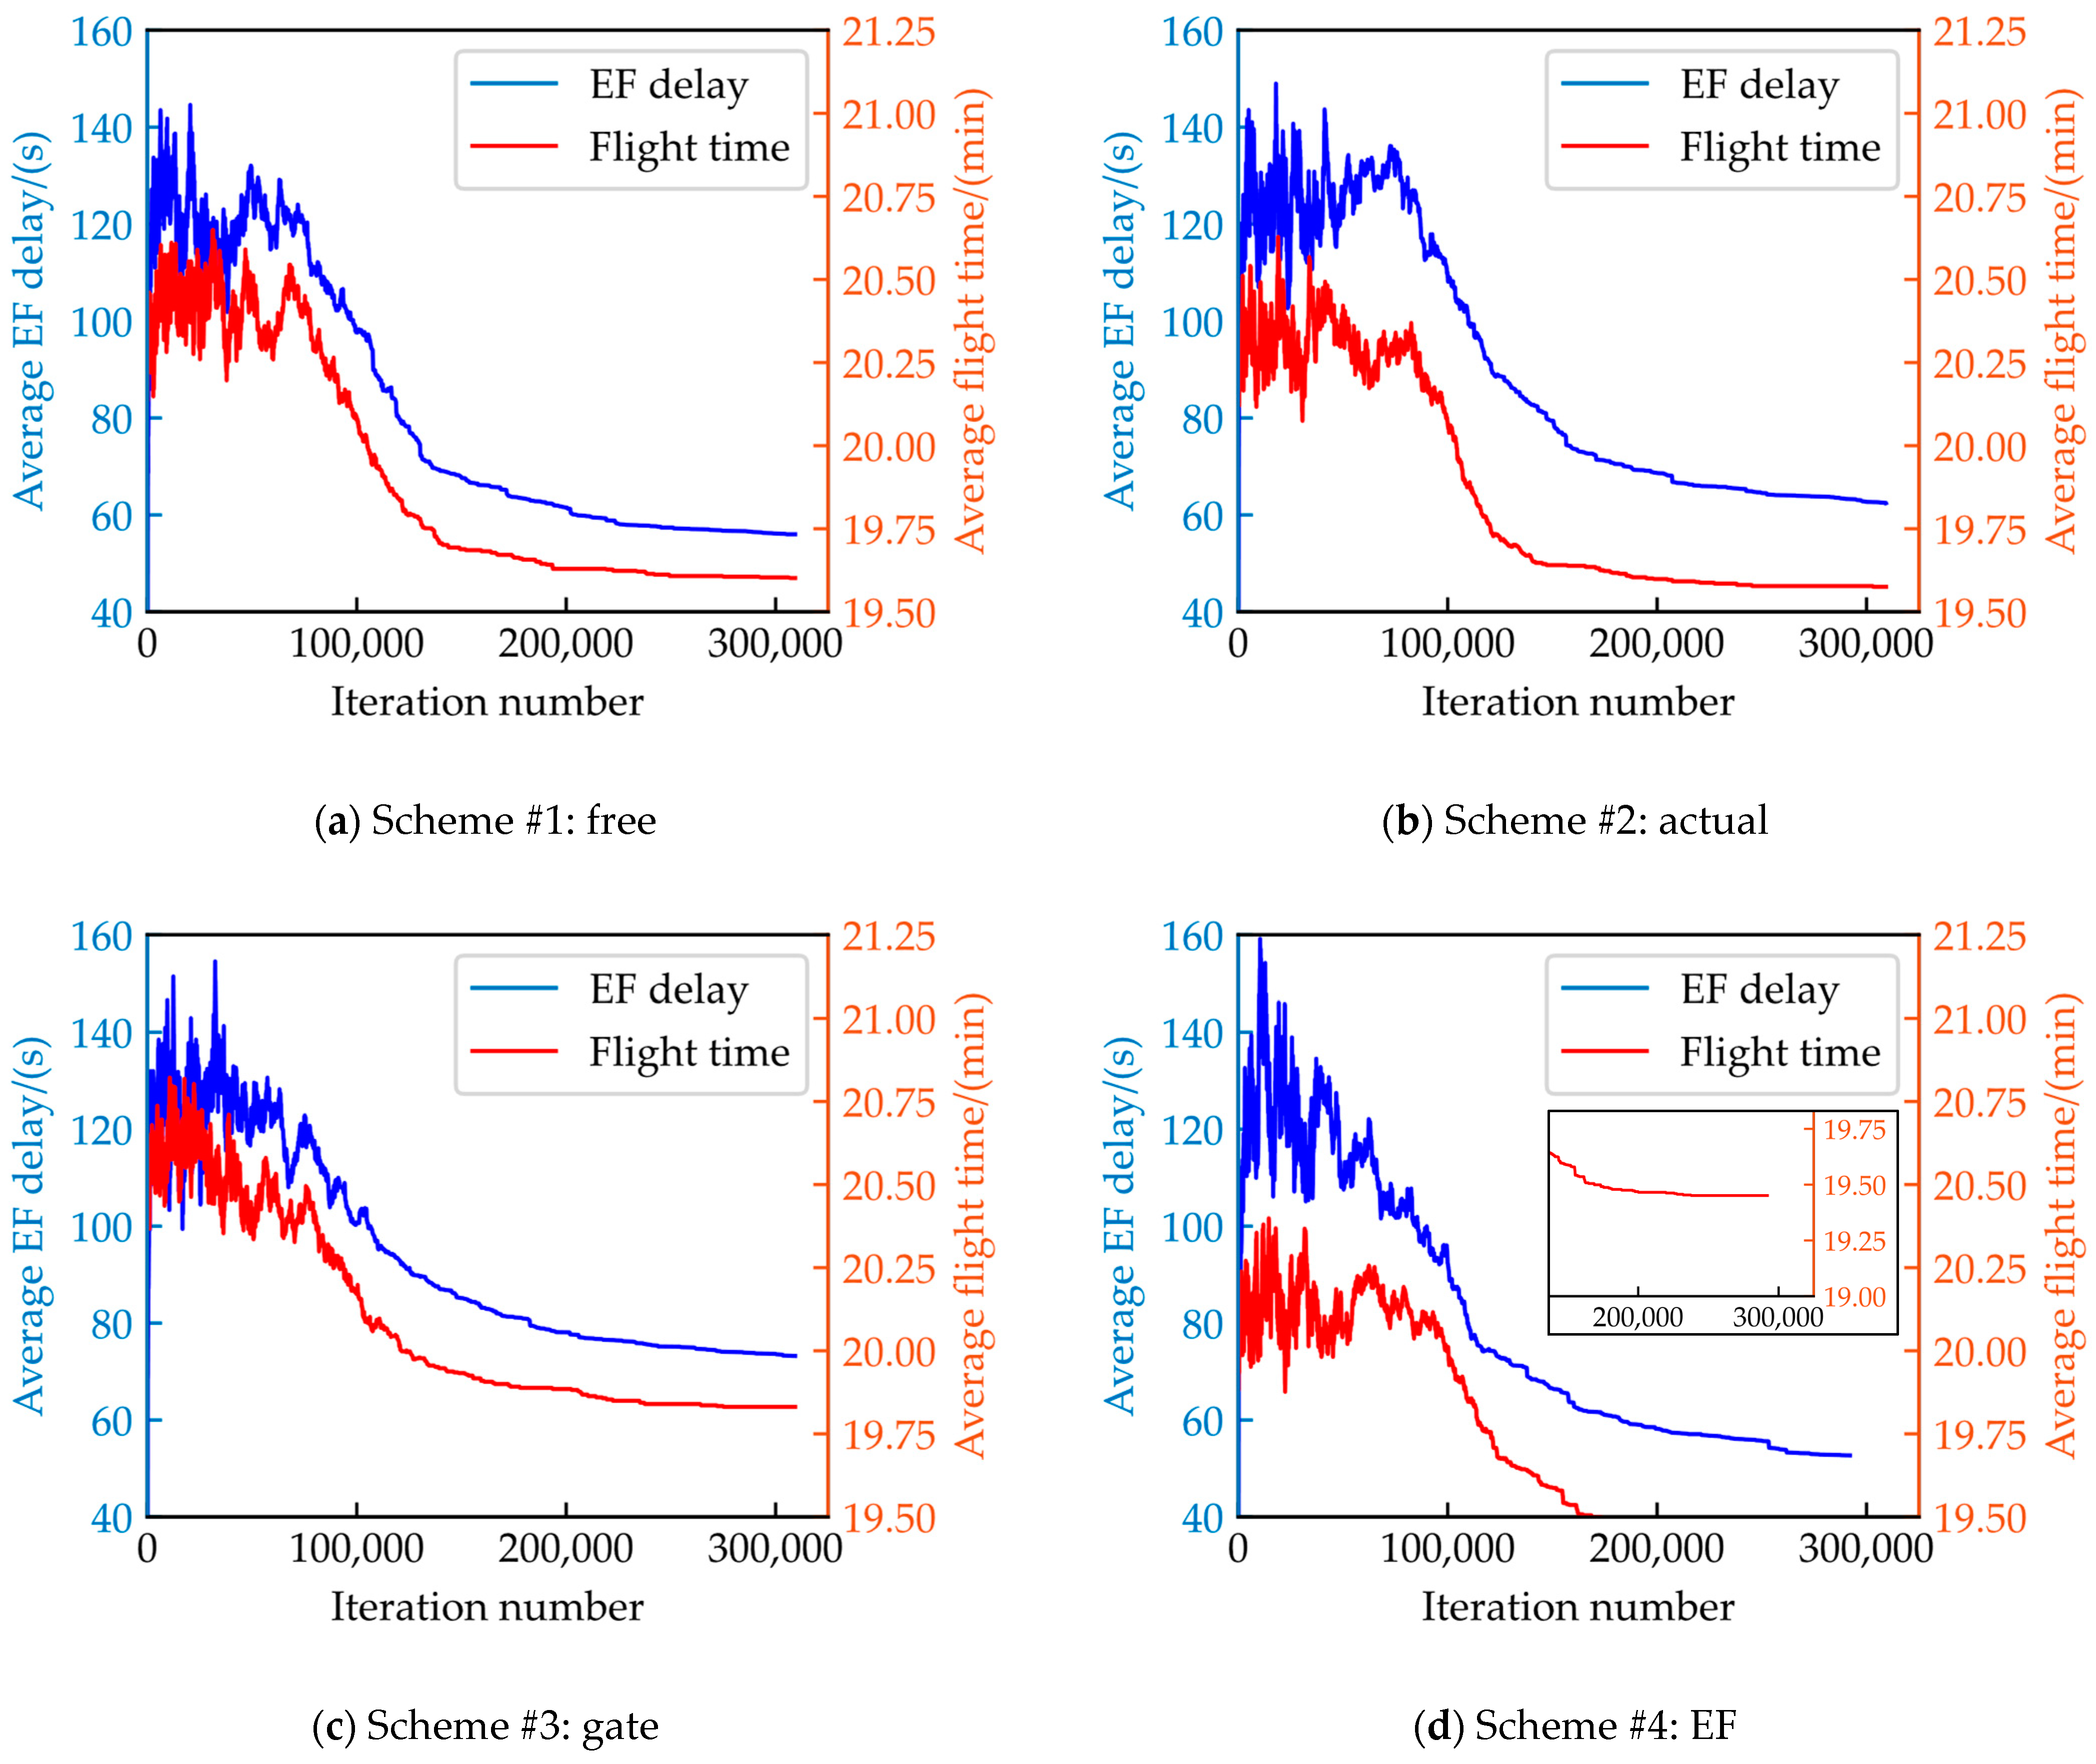
Figure 9.
Metrics on the ground, including pushback delay, hold time and taxi time. Scheme #3 has the lowest taxi time while scheme #4 is the highest. Other metrics show similar values.
Figure 9.
Metrics on the ground, including pushback delay, hold time and taxi time. Scheme #3 has the lowest taxi time while scheme #4 is the highest. Other metrics show similar values.
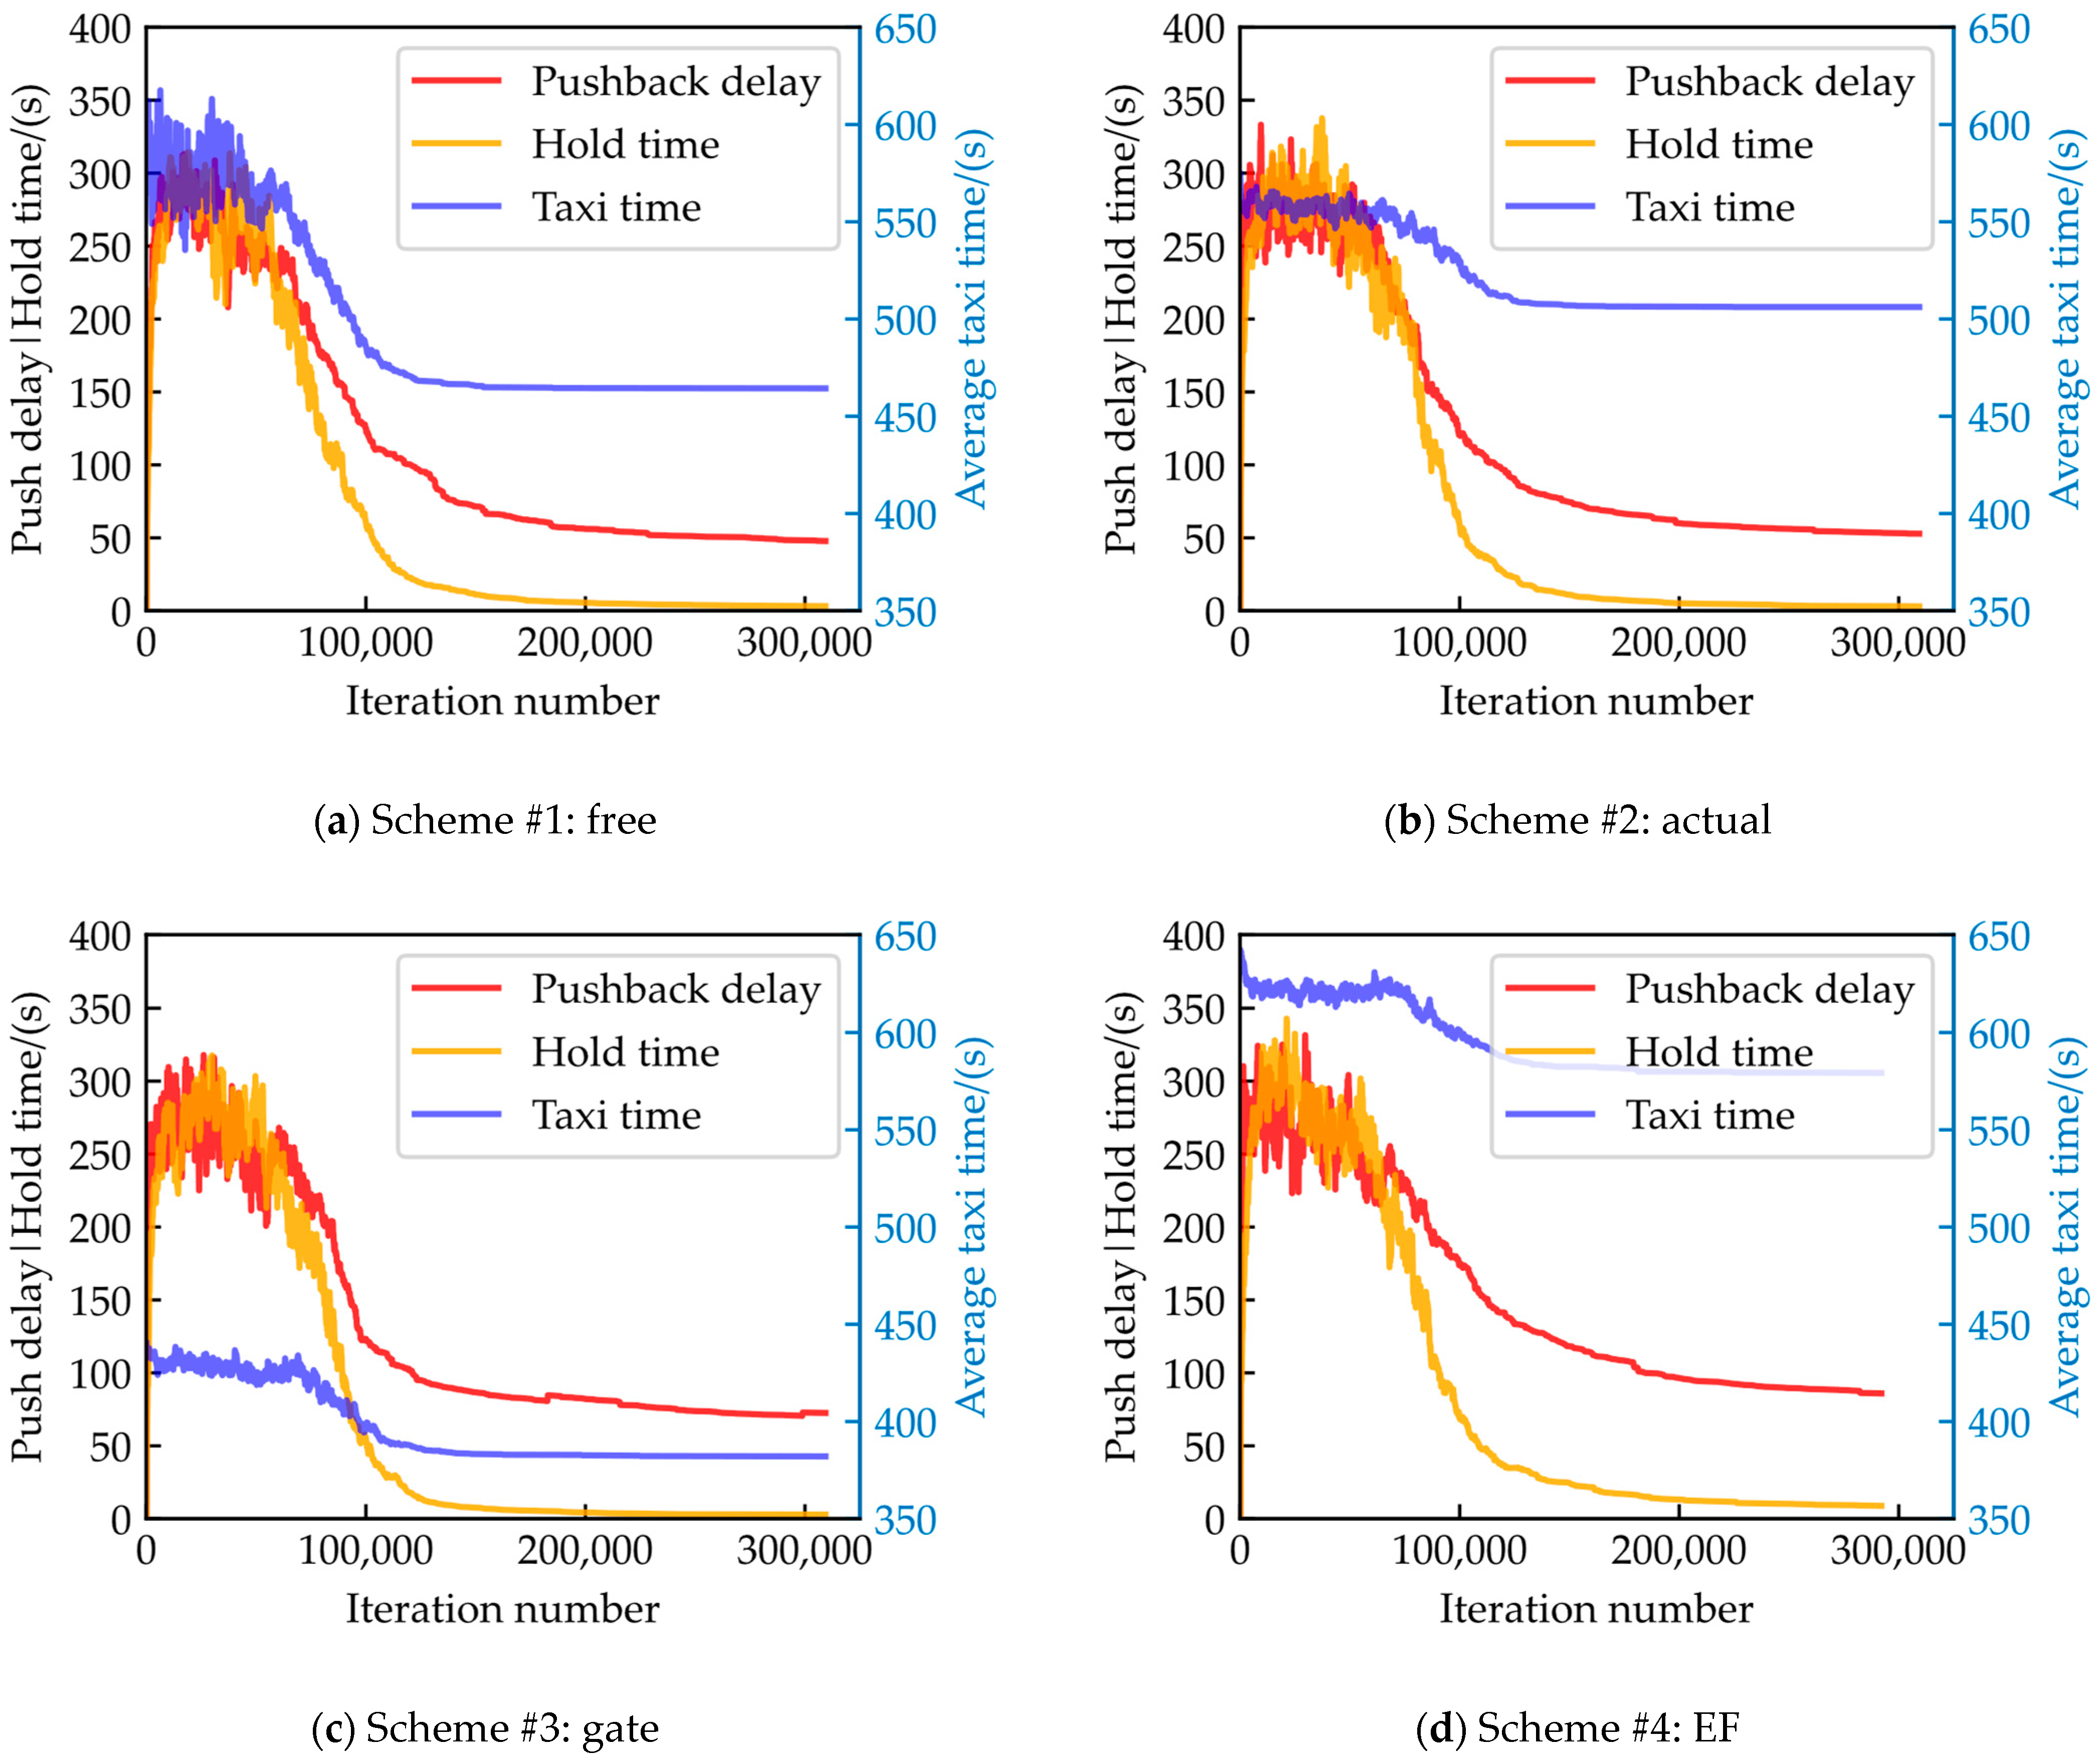
Figure 10.
Taxi time of departure and arrival aircraft. Scheme#1 maintains similar taxi time to scheme #2, while the scheme #3 is lower and scheme #4 is higher.
Figure 10.
Taxi time of departure and arrival aircraft. Scheme#1 maintains similar taxi time to scheme #2, while the scheme #3 is lower and scheme #4 is higher.
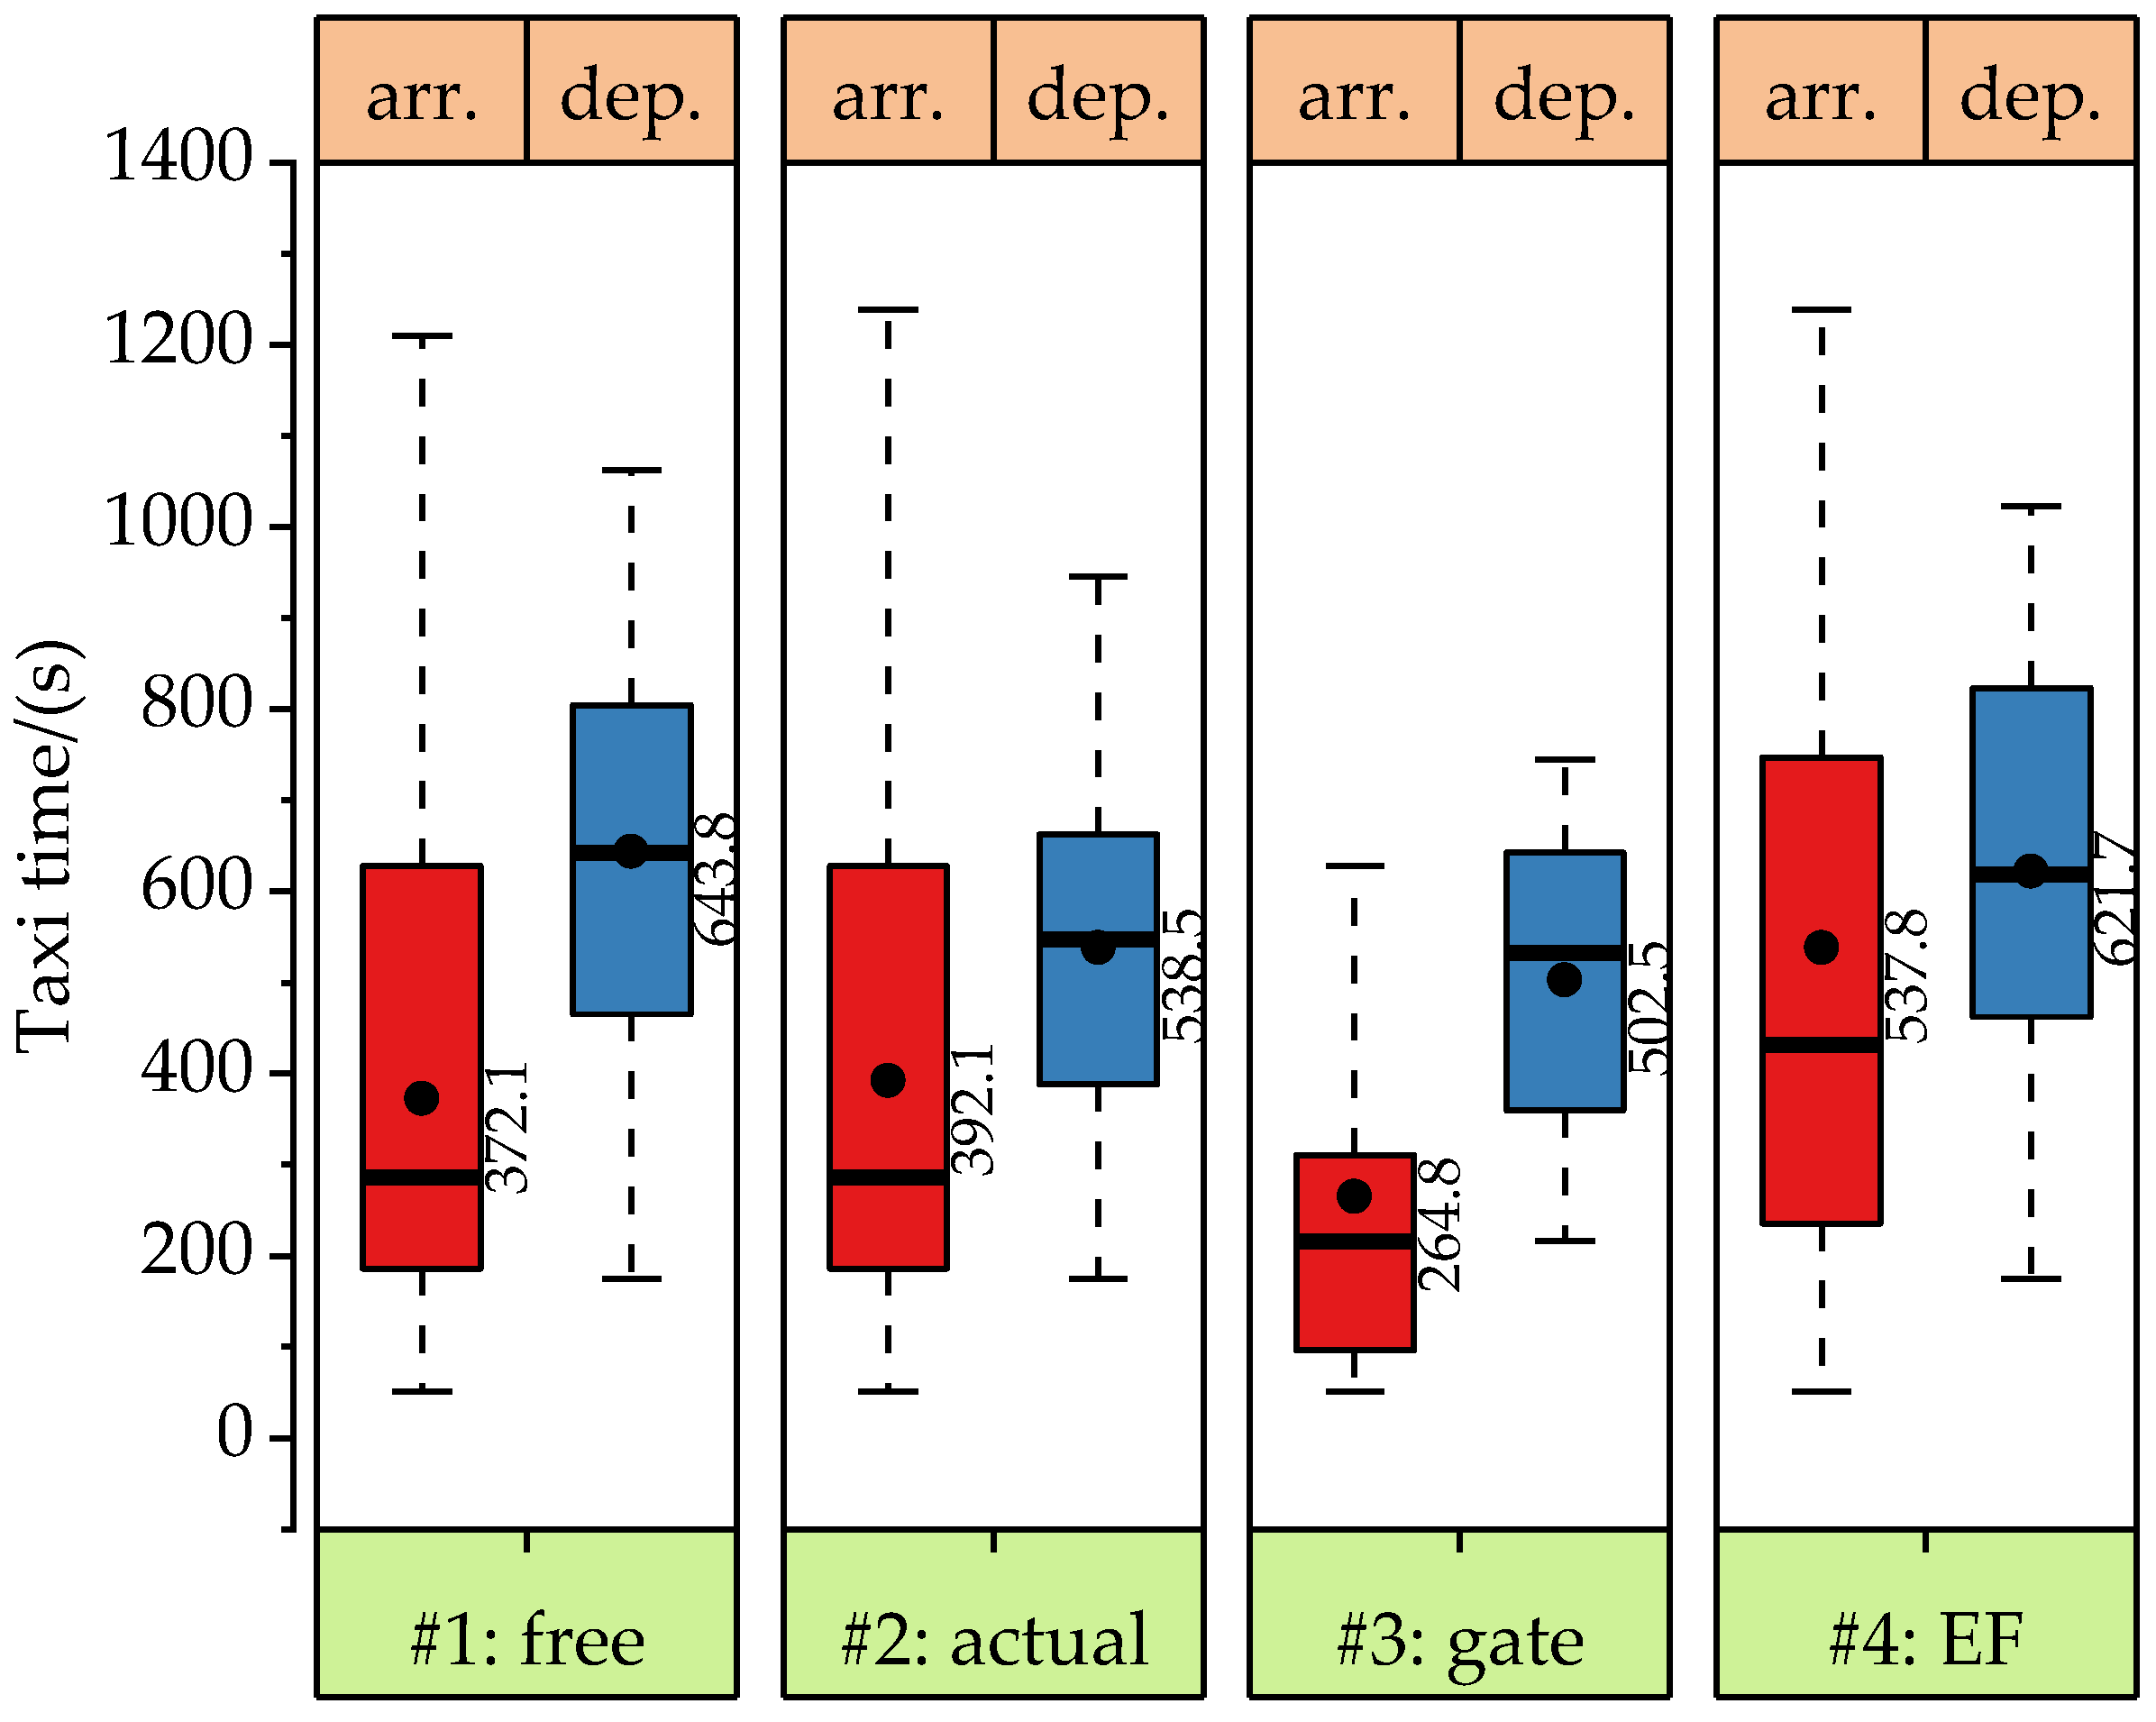
Figure 11.
Runway usage. The blue and red points represent runway time of arrival and departure on runways 01, 02L, and 02R. 01 E, 02L E, and 02R E of the Y-axis represent the earliest time to runway 01 using selected arrival or taxi route. The short black line between the earliest and current times represents the remaining conflicts (in Figure 11c), and the green line means the extra buffer between two successive aircraft considering runway separation requirements.
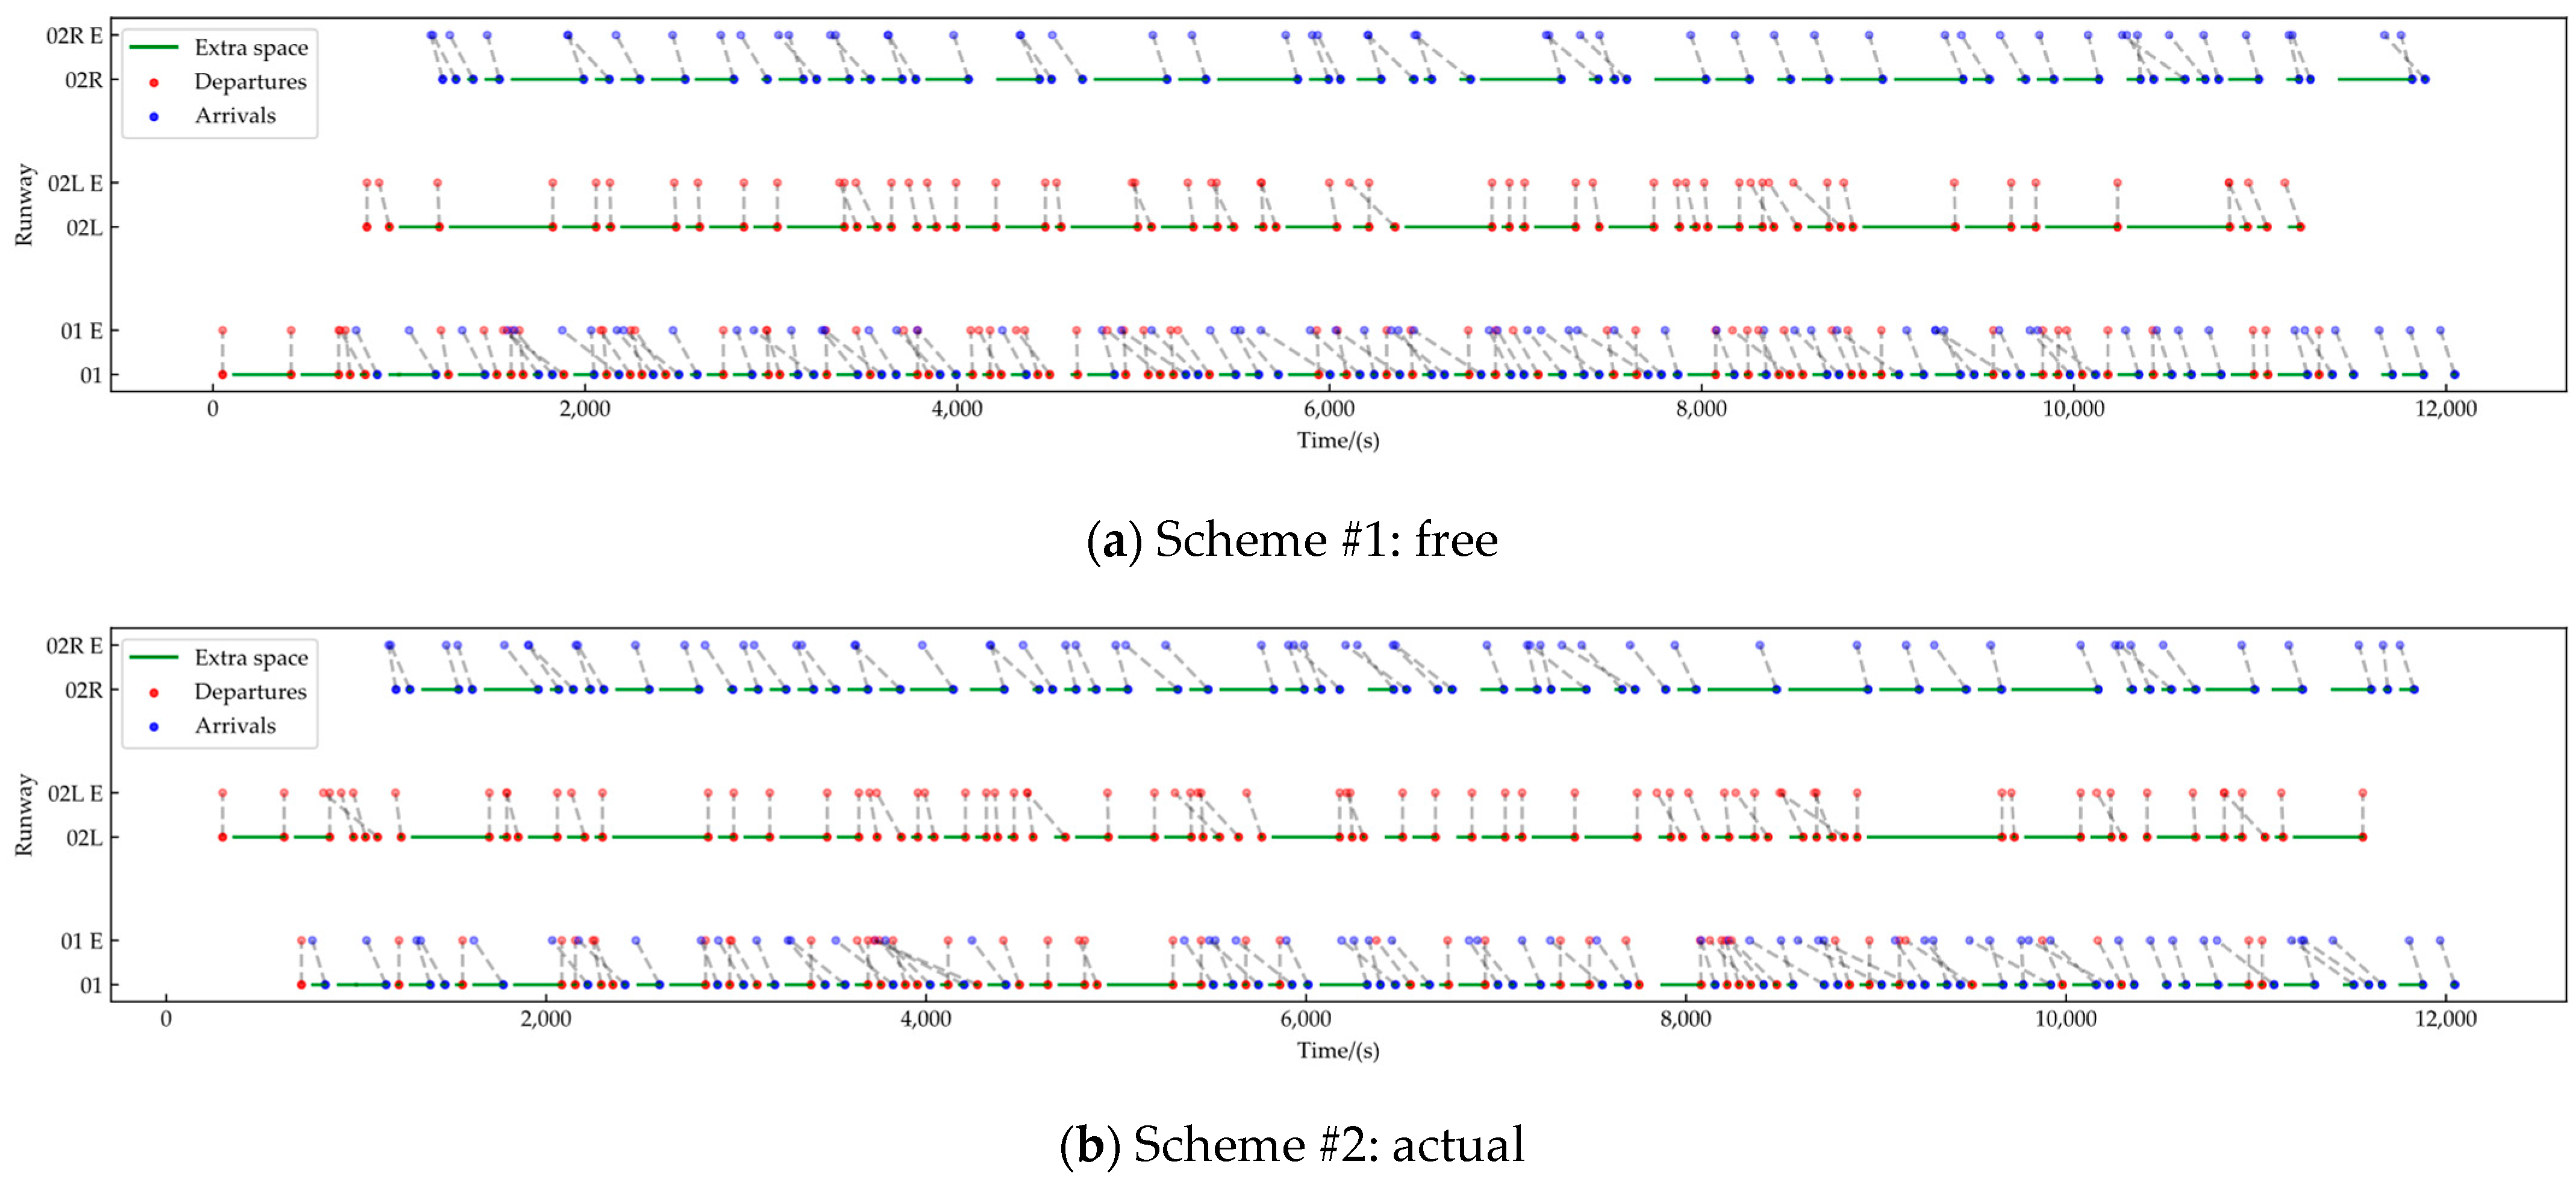

Figure 12.
Results of 3rd Dec. with ten times running. The number besides the boxplot (also the plus sign in the boxplot) and the orange line represent the average and median value of corresponding metrics, respectively. The black diamond means the outliers.
Figure 12.
Results of 3rd Dec. with ten times running. The number besides the boxplot (also the plus sign in the boxplot) and the orange line represent the average and median value of corresponding metrics, respectively. The black diamond means the outliers.

Table 1.
Notations of the runway assignment model.
| Notation | Description |
|---|---|
| Sets | |
| Set of aircraft in the time horizon, | |
| Subset of , set of arrival aircraft | |
| Subset of , set of departure aircraft | |
| Set of gates, | |
| Set of runways, | |
| Set of entry fixes, | |
| Set of taxi routes from runway to gate , | |
| Subset of , set of intersections of taxi route of , intersection | |
| Set of waypoints from an entry fix to runway , | |
| Parameters | |
| , | Radar separation when aircraft precedes , |
| , | Runway and taxi separation when aircraft precedes , |
| Pre-allocated gate for aircraft | |
| Constant deceleration for aircraft | |
| Constant taxi speed | |
| Initial entry time over a predefined EF for aircraft | |
| Initial pushback time for aircraft | |
| , | Lower and upper bound time difference for entry time |
| , | Lower and upper bound coefficient for pushback time |
| , | Lower and upper bound coefficient for entry speed |
| , | Lower and upper bound time difference for hold time |
| Distance from EF to waypoint for aircraft | |
| Distance from runway to gate for aircraft | |
| Decision variables | |
| Speed at EF for aircraft | |
| Entry time at EF for aircraft | |
| Taxiway entrance hold time for aircraft | |
| Pushback time for aircraft | |
| Assigned runway for aircraft | |
| Assigned taxi route of for aircraft | |
| Auxiliary decision variables | |
| Binary decision variables for sequencing in the air when aircraft precedes , | |
| , | Binary decision variables for sequencing on the runway and taxiway when aircraft precedes , |
| Indirect decision variables | |
| , | Speed and time at waypoint for aircraft |
| Average speed for aircraft | |
| Time at intersection for aircraft | |
| Landing or take off time for aircraft | |
| Taxi time for aircraft | |
| Objective | |
| Total delay at entry fix for aircraft | |
| Total flight time for aircraft | |
| Total hold time for aircraft | |
| Total pushback delay for aircraft | |
| Total taxi time for aircraft |
Table 2.
Number and percentage of history runway assignments.
| Runway Assigned | Arrivals | Departures | ||
|---|---|---|---|---|
| Number | Percentage | Number | Percentage | |
| Close to gate | 12,202 | 77.16% | 6594 | 42.26% |
| Close to EF | 9365 | 59.22% | 12,250 | 78.52% |
| Close to both gate and EF | 6899 | 43.62% | 5428 | 34.79% |
| Far from both gate and EF | 1145 | 7.24% | 2184 | 14.00% |
| Total number | 15,813 | 100% | 15,600 | 100% |
Table 3.
Parameters of SA and RAM.
| Parameters | Value | Parameters | Value |
|---|---|---|---|
| SA terminal time | 1000 s | Conflict penalty coefficient | 1000 |
| SA terminal temperature | Taxi speed | 5 m/s | |
| SA cooling coefficient | 0.99 | Initial pushback time | History data |
| SA iterations at temperature | 100 | Initial entry time and speed , | |
| bound of pushback time window , | [0, 600] | Bound of entry time window , | [−60, 300] |
| bound of hold time window , | [0, 300] | Bound of entry speed window , | 0.9, 1.1 |
Note. The unit of bounds of time window is seconds.
Table 4.
Optimization of 10 days operations of the four schemes. Costs are given in difference between the scheme #2 (in bold).
Table 4.
Optimization of 10 days operations of the four schemes. Costs are given in difference between the scheme #2 (in bold).
| Date and Scheme (No. of Dep. and Arr.) | Conflicts | Performance in Difference | Numbers in Runway | |||||||||
|---|---|---|---|---|---|---|---|---|---|---|---|---|
| Air | Taxi | Total Cost | EF Delay | Pushback Delay | Hold Time | Flight Time | Taxi Time | 01 | 02L | 02R | ||
| /(min) | /(min) | /(min) | /(min) | /(min) | ||||||||
| 3 | #2: actual | 0 | 0 | 263,414.2 | 119.7 | 98.7 | 5.8 | 2251.2 | 1915 | 101 | 68 | 58 |
| 112 | #1: free | 0 | 0 | −10,596.1 | −12.4 | −9.5 | 0.3 | 3 | −158.2 | 120 | 54 | 53 |
| 115 | #3: gate | 2 | 10 | −10,975 | 20.6 | 36.7 | −0.3 | 29.4 | −469.5 | 150 | 40 | 37 |
| #4: EF | 0 | 0 | 18,993.6 | −18.7 | 61.7 | 11.2 | −14.3 | 276.5 | 53 | 96 | 78 | |
| 4 | #2: actual | 2 | 0 | 257,931.6 | 138.9 | 68.2 | 20.7 | 2220.8 | 1816.9 | 100 | 66 | 50 |
| 104 | #1: free | 0 | 0 | −14,663.7 | −20.4 | 12.2 | −18.2 | −4.2 | −180.4 | 117 | 51 | 48 |
| 112 | #3: gate | 10 | 6 | −4879.8 | −8.1 | 73.2 | 24.1 | 34.7 | −438.6 | 144 | 36 | 36 |
| #4: EF | 4 | 0 | 19,673.6 | −8.3 | −4.5 | 5.3 | −41.7 | 343.8 | 61 | 77 | 78 | |
| 5 | #2: actual | 2 | 0 | 268,514.9 | 122.9 | 127.3 | 8.7 | 2387.7 | 1795.3 | 115 | 69 | 41 |
| 111 | #1: free | 0 | 0 | −9631 | −21.7 | −41 | −1.8 | −37.8 | −24.9 | 117 | 56 | 52 |
| 114 | #3: gate | 4 | 18 | 1697.9 | 14.1 | 28.7 | 6.7 | 2.1 | −356.6 | 152 | 35 | 38 |
| #4: EF | 0 | 0 | 22,656 | 37.6 | −22.9 | 12 | −52.4 | 436.6 | 65 | 78 | 82 | |
| 6 | #2: actual | 4 | 0 | 258,110.3 | 140.8 | 92.9 | 26.6 | 2136.3 | 1838.6 | 111 | 69 | 46 |
| 114 | #1: free | 2 | 0 | −10,811.9 | −21.6 | 21.2 | −21 | 3.9 | −129.3 | 119 | 57 | 50 |
| 112 | #3: gate | 12 | 10 | 705.7 | −2.3 | 53.9 | 0.6 | 40.2 | −380.6 | 149 | 39 | 38 |
| #4: EF | 0 | 0 | 14,411.5 | −11.7 | 7.1 | −17.3 | −18.4 | 347.1 | 70 | 80 | 76 | |
| 7 | #2: actual | 0 | 2 | 255,654.9 | 120.5 | 124.6 | 5.6 | 2147.3 | 1829.6 | 108 | 68 | 49 |
| 112 | #1: free | 0 | 0 | −11,287.3 | −11.7 | −3.4 | 2.6 | −1.3 | −141.1 | 118 | 57 | 50 |
| 113 | #3: gate | 6 | 18 | 1258.6 | 10.1 | 33.4 | 6.4 | 25 | −420.6 | 147 | 40 | 38 |
| #4: EF | 6 | 0 | 25,900.5 | 25 | −19.6 | 22.6 | −32.1 | 369.1 | 67 | 79 | 79 | |
| 8 | #2: actual | 0 | 0 | 259,398 | 141.2 | 84.3 | 8.2 | 2268.6 | 1820.9 | 111 | 68 | 50 |
| 110 | #1: free | 0 | 0 | 198.9 | −31.6 | 23.4 | 1 | 17.4 | −6.7 | 120 | 52 | 57 |
| 119 | #3: gate | 2 | 4 | −9111.9 | 5.6 | 60.1 | −2.2 | 32 | −347.2 | 150 | 37 | 42 |
| #4: EF | 0 | 0 | 11,955.6 | −37.1 | 18.6 | 11 | −20.5 | 227.3 | 89 | 77 | 63 | |
| 9 | #2: actual | 0 | 0 | 252,097.1 | 117.9 | 83.8 | 9.4 | 2204 | 1786.5 | 111 | 64 | 49 |
| 111 | #1: free | 0 | 0 | −5681.5 | 2.5 | 12 | −1.2 | 7.3 | −115.3 | 123 | 50 | 51 |
| 113 | #3: gate | 4 | 10 | 1096 | 44.7 | 55 | 10.3 | 42.9 | −367.9 | 148 | 36 | 40 |
| #4: EF | 0 | 0 | 9989.2 | −26.2 | 15.2 | 4 | −34.6 | 208.1 | 85 | 77 | 62 | |
| 10 | #2: actual | 2 | 0 | 248,500.6 | 119.6 | 76.2 | 11.9 | 2219.1 | 1681.6 | 107 | 61 | 47 |
| 103 | #1: free | 0 | 0 | −16,950.0 | −43 | 35 | −8.7 | −7.7 | −224.8 | 112 | 55 | 48 |
| 112 | #3: gate | 2 | 4 | −10,876.8 | −1.2 | 79.2 | −6.1 | 24.6 | −344.6 | 138 | 38 | 39 |
| #4: EF | 2 | 0 | 25,408.8 | 25.9 | 10.9 | 1.9 | −22.2 | 406.9 | 63 | 72 | 80 | |
| 11 | #2: actual | 6 | 0 | 257,852.5 | 125.1 | 94.8 | 15.8 | 2244.2 | 1717.6 | 107 | 68 | 44 |
| 107 | #1: free | 0 | 0 | −13,779 | −42.3 | 8.3 | −11 | −22.7 | −61.9 | 116 | 50 | 53 |
| 112 | #3: gate | 10 | 18 | 4204.3 | 15.1 | 15 | −0.7 | 11 | −337 | 146 | 34 | 39 |
| #4: EF | 6 | 0 | 25813 | 10.7 | −2 | 18.6 | −31.1 | 434 | 64 | 75 | 80 | |
| 12 | #2: actual | 0 | 0 | 248,336.2 | 116.7 | 92.8 | 7.8 | 2201.7 | 1720 | 103 | 61 | 50 |
| 101 | #1: free | 0 | 0 | −2644 | −8.8 | 3.2 | −0.1 | 20.4 | −58.8 | 112 | 50 | 52 |
| 113 | #3: gate | 10 | 12 | 11,320.7 | 14 | 81.4 | 17.7 | 54.6 | −345.6 | 145 | 33 | 36 |
| #4: EF | 0 | 0 | 21,179.8 | 24.7 | −4.2 | 5.3 | −13.4 | 340.6 | 64 | 73 | 77 | |
Table 5.
Average percentage of assigned runways close to gate, EF and both gate and EF for ten days operation of free assignment scheme, each date with ten replications of optimization, compared with historical data and scheme gate.
Table 5.
Average percentage of assigned runways close to gate, EF and both gate and EF for ten days operation of free assignment scheme, each date with ten replications of optimization, compared with historical data and scheme gate.
| Date | History Percentage | Scheme Free | Scheme Gate | ||||
|---|---|---|---|---|---|---|---|
| Gate | EF | Both | Gate | EF | Both | Gate | |
| 3 | 58.15% | 76.21% | 41.85% | 78.63% | 66.04% | 47.00% | 93.83% |
| 4 | 56.94% | 79.63% | 40.74% | 78.80% | 60.65% | 42.18% | 94.44% |
| 5 | 61.78% | 71.11% | 39.11% | 77.73% | 59.69% | 41.38% | 94.67% |
| 6 | 59.73% | 76.99% | 42.04% | 77.43% | 63.63% | 44.20% | 93.81% |
| 7 | 60.44% | 77.33% | 43.11% | 78.67% | 64.62% | 45.87% | 94.67% |
| 8 | 63.76% | 81.22% | 49.78% | 77.60% | 64.85% | 48.52% | 94.32% |
| 9 | 64.73% | 81.25% | 49.55% | 76.43% | 65.71% | 47.63% | 94.64% |
| 10 | 63.26% | 73.49% | 41.86% | 79.12% | 61.72% | 43.91% | 93.02% |
| 11 | 62.10% | 75.80% | 42.47% | 76.30% | 62.69% | 43.01% | 94.52% |
| 12 | 64.49% | 77.10% | 44.39% | 75.75% | 66.40% | 44.67% | 92.52% |
Disclaimer/Publisher’s Note: The statements, opinions and data contained in all publications are solely those of the individual author(s) and contributor(s) and not of MDPI and/or the editor(s). MDPI and/or the editor(s) disclaim responsibility for any injury to people or property resulting from any ideas, methods, instructions or products referred to in the content. |
© 2023 by the authors. Licensee MDPI, Basel, Switzerland. This article is an open access article distributed under the terms and conditions of the Creative Commons Attribution (CC BY) license (https://creativecommons.org/licenses/by/4.0/).
Share and Cite
MDPI and ACS Style
Du, Z.; Zhang, J.; Ma, Z.; Xu, J. Delay in the Air or Detour on the Ground?—A Case Study in Guangzhou Baiyun International Airport. Aerospace 2024, 11, 10. https://doi.org/10.3390/aerospace11010010
AMA Style
Du Z, Zhang J, Ma Z, Xu J. Delay in the Air or Detour on the Ground?—A Case Study in Guangzhou Baiyun International Airport. Aerospace. 2024; 11(1):10. https://doi.org/10.3390/aerospace11010010
Chicago/Turabian StyleDu, Zhuoming, Junfeng Zhang, Zhao Ma, and Jiaxin Xu. 2024. "Delay in the Air or Detour on the Ground?—A Case Study in Guangzhou Baiyun International Airport" Aerospace 11, no. 1: 10. https://doi.org/10.3390/aerospace11010010
Note that from the first issue of 2016, this journal uses article numbers instead of page numbers. See further details here.