
Research on Passenger Evacuation Behavior in Civil Aircraft Demonstration Experiments Based on Neural Networks and Modeling

College of Safety Science and Engineering, Civil Aviation University of China, Tianjin 300300, China
*
Author to whom correspondence should be addressed.
Aerospace 2024, 11(3), 221; https://doi.org/10.3390/aerospace11030221
Submission received: 28 December 2023
/
Revised: 29 February 2024
/
Accepted: 6 March 2024
/
Published: 12 March 2024
(This article belongs to the Special Issue Advances in Air Traffic and Airspace Control and Management (2nd Edition))
Abstract
:Evacuation simulation is an important method for studying and evaluating the safety of passenger evacuation, and the key lies in whether it can accurately predict personnel evacuation behavior in different environments. The existing models have good adaptability in building environments but have weaker adaptability to personnel evacuation in civil aircraft cabins with more obstacles and stronger hindrances. We target the narrow seat aisle environment on airplanes and use a BP neural network to establish a continuous displacement model for personnel evacuation. We compare the simulation accuracy of evacuation time with the social force model based on continuous displacement and further compare the similarity of personnel evacuation process behavior. The results show that both models were close to the experimental values in simulating evacuation time, while our BP neural network evacuation model based on experimental data was more accurate in predicting the personnel evacuation process, showing more realistic details such as the probability of conflicts and bottleneck evolution in the cross aisle.
1. Introduction
Modern civil aircraft have high seat occupancy rates and concentrated passenger densities, and in the event of a crisis, passengers need to evacuate quickly from dangerous environments to avoid additional hazards such as fire or explosions.
Simulating personnel evacuation is an effective way to design and assess the safety of buildings or transportation vehicles. Representative models of personnel evacuation simulation can be summarized into four types [1]: macroscopic models, cellular automata models, social force models, and ABM. However, macroscopic models cannot reproduce detailed evacuation processes, which limits their application in evacuation research, such as priority rights at intersections [2]. Presently, micro-level modeling methods have emerged as the primary focus of research on simulation models for emergency evacuation. Among these, discrete models such as cellular automaton models and network models are widely used [3,4,5,6,7,8,9]. Discrete model algorithms are mature, fast, and suitable for large-scale population simulation studies in a human-nature style. However, Pan [10] found that people exhibit unrealistic jumping and skipping behavior in nodes or cells during the research process. Additionally, discrete models discretize continuous space into grids, with each grid typically occupied by only one person. This results in a deviation between simulation results and the actual distribution of people in continuous space, especially in high-density evacuation environments where unrealistically ordered queues and other significant behavioral deviations occur [11].
In continuous models, the space for personnel movement is a continuous domain, which can better describe the continuous motion and interaction behavior of personnel. The social force model proposed by Helbing et al. [12] is a typical continuous model widely used in pedestrian walking and evacuation simulations. The model simplifies the effects of different personnel attributes, passenger interactions, and obstacles as “forces” acting on personnel to simulate the evacuation behavior of personnel in real environments. The social force model has been continuously improved, whether in terms of mathematical expressions [13], the scope of action forces [14], or the resolution of pedestrian collisions [15], pedestrian oscillations [16], and other issues, making it increasingly adept at simulating personnel evacuation in building environments.
Unlike building environments, the internal space of large public transportation vehicles is narrow, and there are many obstacles, characterizing it as a special environment with a high personnel density, more obstacles, and stronger obstruction [4,17,18,19,20,21,22]. When using social forces to drive high-density crowds to evacuate between obstacles in such an environment, it is difficult to simulate real crowd flow, bottleneck evolution, and frequent interaction conflicts and avoidance behaviors among personnel in multiple areas [23]. The definition and verification of specific evacuation behaviors of personnel are complex, resulting in difficulties in quantitative verification. The accuracy of the model is mainly evaluated by personnel evacuation time, lacking more quantitative indicators that can reflect details to verify the model.
In recent years, detailed behavioral rules for pedestrian movement have begun to receive attention. Shi et al. [24] quantitatively described the movement of crowds at bottlenecks by studying personnel trajectories, spatial distances, and average speeds through experiments, considering the effects of carrying luggage and different obstacle distributions on personnel behavior, and improving the congestion situation of bottlenecks with luggage-carrying flows. Yang et al. [25] investigated the motivations behind pedestrian crossing behavior on roads in a nature-style translation. They chose TAdv as the main indicator to describe pedestrian–vehicle conflicts and found that pedestrians are unlikely to change their behavior during the conflict process, especially in conflicts with non-motorized vehicles. Pedestrians have a faster speed and higher expectations of successfully passing through. Li et al. [26] proposed an extended cellular automaton model to simulate bidirectional pedestrian flow through bottlenecks in a nature-like style and found that pedestrian flow increased linearly with increasing bottleneck width. Li et al. [27] studied the movement characteristics of pedestrians with high and low motivation passing through bottlenecks of different widths and observed that the density distribution of Voronoi diagrams was arched for high-motivation pedestrians and teardrop-shaped for low-motivation pedestrians. Huang et al. [11] conducted evacuation experiments in narrow train seat aisles and found that the behavior of evacuees in such environments differed significantly from that in general building environments. They proposed a conflict model for aisle evacuation to simulate the specific behavior of evacuees facing conflicts in such environments.
The layout of an aircraft cabin is similar to that of a train, with multiple rows of seats forming branching paths that intersect with the main aisle. Extensive experimental research has been conducted by authoritative agencies to investigate aircraft evacuations. These studies include the impact of emergency light positioning on evacuation speeds, conducted by the Federal Aviation Administration (FAA) [28], and assessments of aisle configurations and internal/external lighting on passenger evacuation rates, carried out by Transport Canada and Cranfield University [29]. Furthermore, the Federal Aviation Administration (FAA) and the National Transportation Safety Board (NTSB) [30,31,32] conducted numerous emergency evacuation experiments in simulated civil aircraft cabin facilities, varying the exit configurations. Their findings indicate that the overall evacuation time is significantly influenced by the width of the exits, and excessive exit heights from the ground significantly reduce the evacuation rate at exit points. These studies primarily focused on the influence of cabin configurations on evacuation outcomes. Building upon this foundation, the present study aims to conduct demonstration experiments in accordance with the airworthiness regulations FAR·25 [33].
During evacuation, passengers will frequently engage in complex behaviors such as conflict and avoidance due to the competition for optimal positions in the narrow space, making the evacuation process more complex and difficult to predict accurately using existing models. To address this, we conducted a certified emergency evacuation experiment simulating an aircraft cabin layout, involving 54 participants. The primary focus was on the incoming direction of passengers entering the main aisle, transitioning from previous macro-level studies on evacuation time and efficiency to micro-level investigations of passenger incoming probabilities. Image tracking was utilized to capture the movement trajectories of each participant, resulting in a personnel evacuation dataset that encompassed information such as the location of escape exits, obstacles surrounding individuals, and the real-time positions of nearby passengers. We established a BP neural network evacuation model and a social force model as controls, using the probability of conflict resolution among aisle passengers and bottleneck evolution trends as quantitative verification indicators for evacuation behavior. Our study validates the superiority of the neural network evacuation model in predicting passenger evacuation behavior in aircraft cabin seat aisles.
2. Civil Aircraft Emergency Evacuation Simulation Experiment
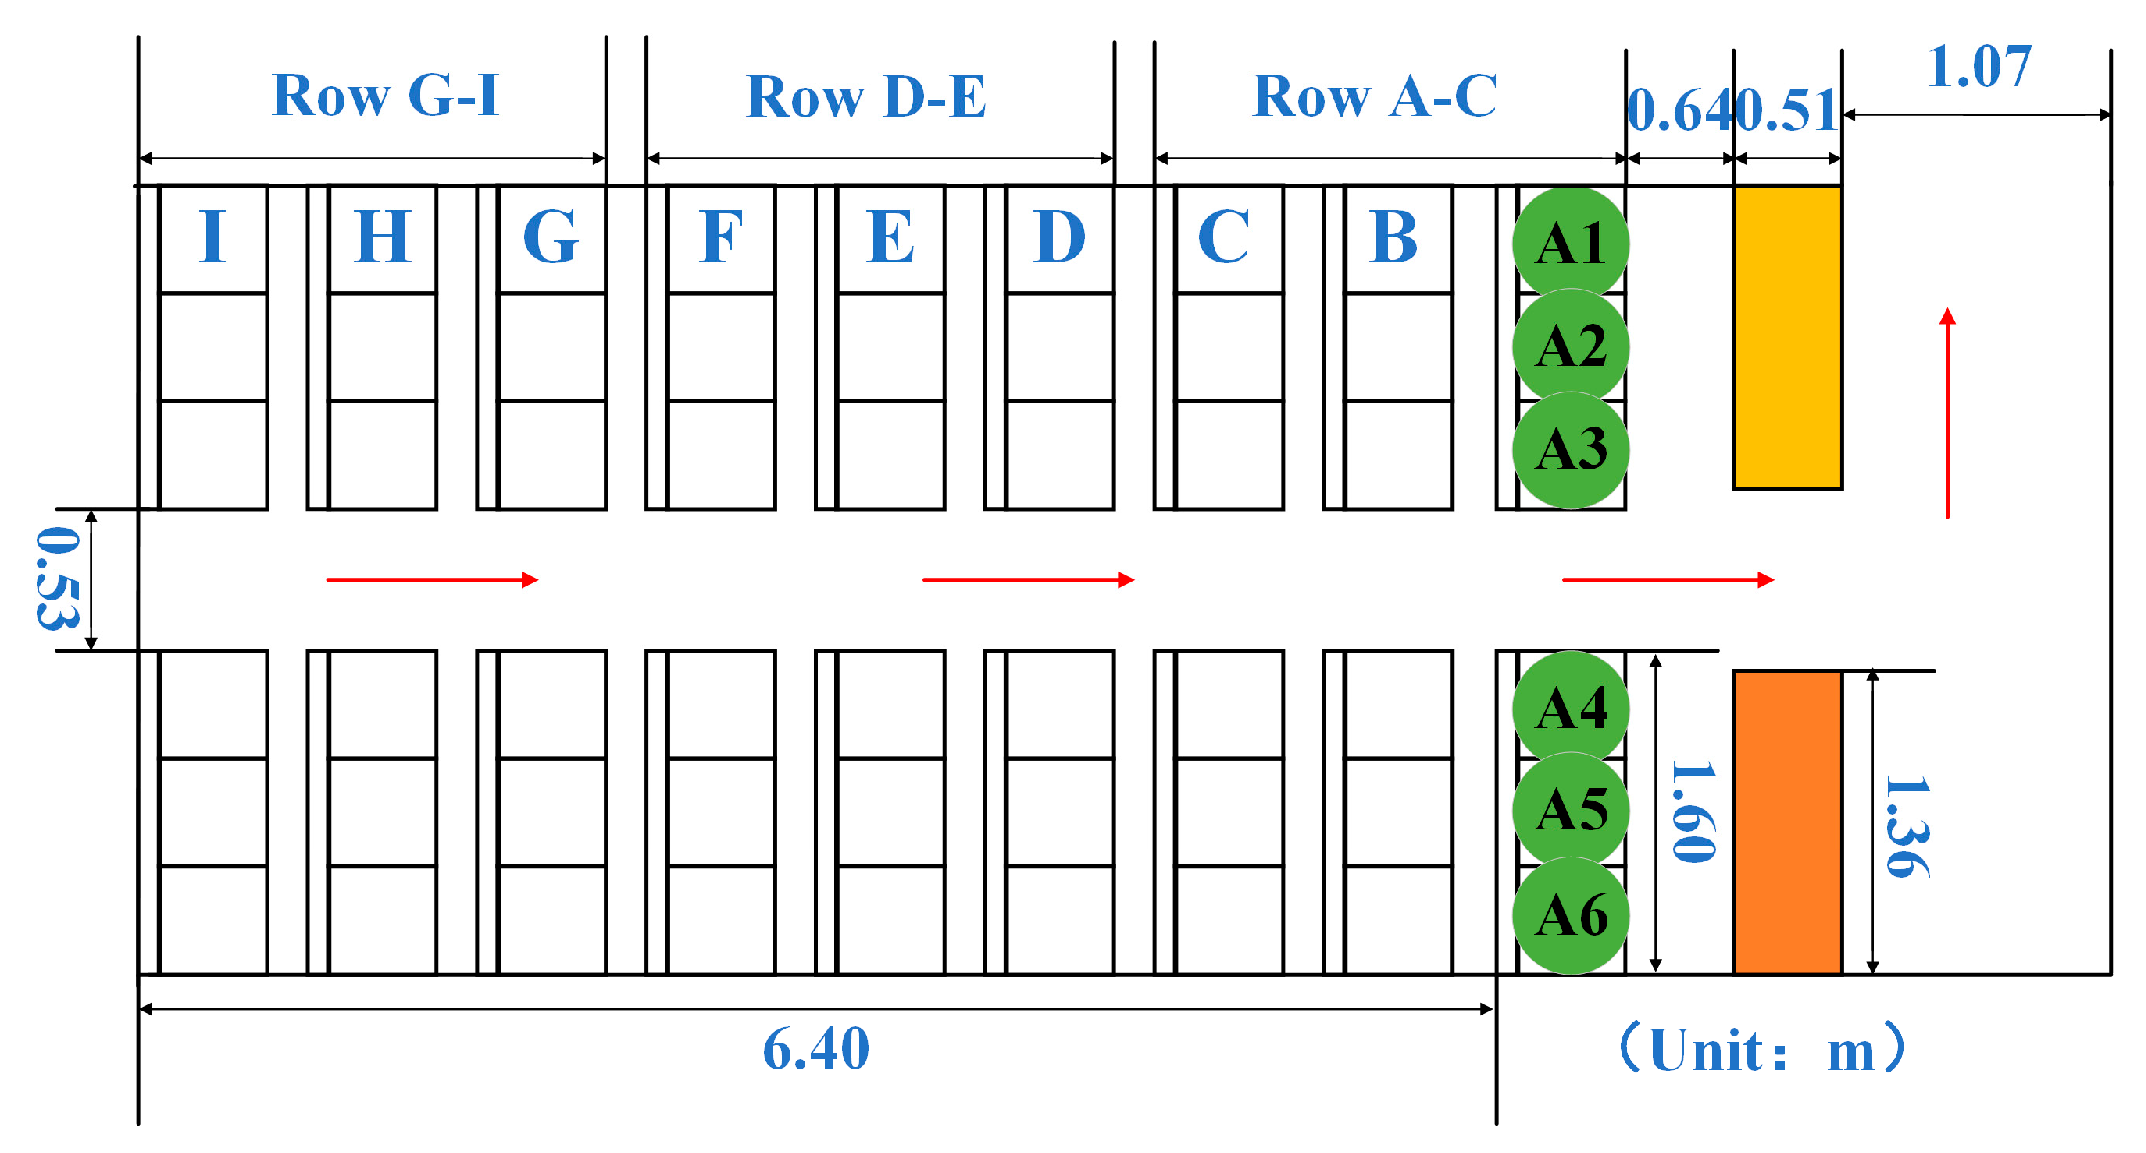
To ensure correspondence between the model’s calculations and actual personnel behavior during evacuation experiments, as well as to generate ample data for training deep learning networks, the environmental configuration of the simulated cabin, including the lighting, obstacles, and other elements, was designed in accordance with the FAR·25 [33] regulations. The specific dimensions of the simulated cabin are shown in Figure 1. The main aisle area of the cabin is divided into three sections. Each section consists of three rows of seats (A-I), with seats numbered sequentially from 1 to 6 from top to bottom, for example, A1, A2, A3. The exit is located on the left side at the end of the aisle, indicated by a red arrow pointing towards the evacuation direction. Qualified participants and flight attendant personnel were carefully selected based on gender, age, and health status, as required by the regulations. The experimental facilities and procedures were strictly adhered to in accordance with the regulations.
To extract motion data during emergency passenger evacuation, a high-definition camera was installed at a height of 12 m in the center of the experimental site, recording the entire evacuation process at a rate of 25 frames per second (Figure 2). The experimental process is depicted in Figure 3.
Dynamic videos of the evacuation process were captured using the high-definition camera, and video processing software was employed to obtain the trajectory coordinates, speed, and acceleration of the experimental personnel. A direct linear transformation algorithm was then utilized to correct the phenomenon of trajectory deviation caused by image distortion when reading 2D data from the 3D experimental platform, thereby obtaining real and reliable emergency evacuation test data, as shown in Figure 4a. This process yielded a set of 54-person evacuation test trajectory data information files, as shown in Figure 4b.
3. Establishing a Social Force Simulation Model and Training a BP Neural Network
3.1. Simulation Study Based on the Social Force Model
3.1.1. Designing the Simulation Model Layout
The social force model captures the force situation experienced by cabin crew during evacuation, as individuals move under the influence of multiple forces acting in their expected direction [13]. Building on our research group’s previous 54-person simulated evacuation experiment, we incorporated experimental data to establish an emergency evacuation simulation model for civil aircraft with a main aisle width of 0.53 m. The model includes emergency exits on each side of the cabin front, with a total of nine rows of seats and six passengers per row. The simulation model’s layout is illustrated in Figure 5, and specific dimensions are provided in Table 1.
3.1.2. Parameter Setting Based on the Social Force Model
The social force model includes three forces: the self-propulsion force of passenger i, the interaction force of passenger j on passenger i, and the obstacle force of obstacle w on passenger i.
In the equation, mi represents the mass of passenger i and vi represents the velocity of passenger i at time t. The self-propulsion force, fi0(t), is shown in Formula (2).
The symbols vi0(t), vi(t), and ei0(t) represent the expected velocity, the actual velocity, and the expected direction of evacuation for passenger i at time t, respectively. is the adaptation time for passenger i.
The applied forces, fji, include the psychological repulsion force, Fji, to reduce the probability of physical contact with passenger j, the normal repulsion force, Nji, when there is contact, and the tangential friction force, Tji, as shown in Formulas (3)–(6). The force exerted by obstacle w on passenger i is shown in Formulas (7)–(10).
Among them, Ai and Bi are the strength and distance of the interaction force between passengers, respectively, rji is the sum of the radii of passengers i and j, dji is the distance between the center points of passengers i and j, and (rji − dji) is the overlapping distance between the two passengers. Aw and Bw represent the strength and distance of the interaction force between the passenger and the obstacle, ri is the radius of passenger i, diw is the distance between passenger i and obstacle w, and (ri − dwi) is the overlapping distance between the two. K and are constant coefficients, vi is the velocity of passenger i, and twi is the tangential direction between passenger i and obstacle w. The function used to determine the relationship between passenger i and j or between passenger i and an obstacle w is as follows: when , ; otherwise, .
Each parameter of a passenger is not only dependent on their own physical fitness but is also influenced by the evacuation environment. In most cases, researchers establish passenger parameters in pedestrian flow simulation models based on the motion rules of passengers in their experimental environment. To address this limitation, we present a simulation that sets various parameters of passengers based on the evacuation situation of evacuation experiments, as presented in Table 2.
To generate the required data, we extracted and processed a set of evacuation experiment data for 54 individuals. We then applied the social force model to successfully generate a data file containing information such as the location coordinates, velocity, and acceleration of the individuals. Figure 6 shows the calculation process of social force at 5.641 s.
3.2. Simulation Study Based on the BP Neural Network
This article presents another model for predicting passenger evacuation behavior in emergency situations in an aircraft cabin environment based on emergency evacuation experiments. The model is based on a back-propagation (BP) neural network, a widely used methodology in this field.
3.2.1. Extracting Feature Data
During the evacuation process, the behavior of passengers is heavily influenced by obstacles and other individuals within their vicinity, as demonstrated in Figure 7. To effectively address this issue, this study identifies several key behavioral features that must be extracted by the BP neural network. These include the speed of nearby passengers that may impede the target passenger’s movement, information regarding obstacles (e.g., seats), and the location of exits. By employing the distance calculation in Formula (11), the relative distance, dia, between the target passenger and other passengers, as well as the center position of obstacles and the exit, can be determined using the coordinates xi and yi for the target passenger and xa and ya for other passengers, obstacles, and exit center positions. By using the position coordinates, we can derive the instantaneous velocity, vi, of the target passenger, i. This is achieved through the application of Formula (12), which takes into account the horizontal coordinates of the current frame, n (xn), and the previous frame, n − 1 (xn−1), as well as the vertical coordinates of the current frame, n (yn), and the previous frame, n − 1 (yn−1). Upon identifying the four nearest personnel and obstacles surrounding the target passenger, the input vector of the neural network model is shown in Formula (13), where xi and yi denote the coordinates of the target passenger, i, dij represents the relative distance between the closest four passengers and the target passenger, vj signifies the instantaneous velocity of the surrounding passengers, which is calculated in a consistent manner with vi, dim denotes the relative distance between the four surrounding obstacles and the target passenger, and die represents the relative distance between the target passenger and the exit. Drawing on data from the emergency evacuation test platform, we constructed the model as depicted in Figure 7. If the red dot is the object of study, the area in which it is affected is the red box. Following rigorous testing, the parameter file trained by the network model effectively predicted the evacuation trajectory of the passenger.
The data collected through 10 emergency evacuation experiments include the time and motion trajectory information (x, y coordinates, speed, and acceleration information) of each passenger. By extracting data at arbitrary time intervals, extracting trajectory data within rectangular areas of different spacing, and selecting behavioral information within a certain range around each passenger at each moment, three sets of sample libraries with different formats and data volumes were finally obtained. The three sample libraries have 1458, 189, and 1458 pedestrian samples, respectively, which are more than the commonly available pedestrian trajectory datasets: ETH and UCY. ETH contains data from two groups of 750 pedestrians, and UCY is a pedestrian dataset containing two groups of 786 people. The sample characteristics of this study are obvious, which is conducive to studying the behavioral and trajectory characteristics of passengers during emergency evacuation and is convenient for subsequent use.
3.2.2. Establishing a BP Neural Network Model
The Levenberg–Marquardt algorithm is utilized to train the BP neural network with square errors and functions, resulting in a rapid training process. To harness the powerful approximation capabilities of the BPNN, nonlinear functions are typically selected as the activation functions for the hidden-layer neurons. The most frequently employed activation functions include threshold functions, sigmoid functions, and hyperbolic tangent functions, among others. In this study, the sigmoid activation function is employed for the BP neural network, as depicted in Formula (14). To expedite the convergence of the learning outcomes, the mean square error loss function (mean square error, MSE) is selected as the loss function for this model, as illustrated in Formula (15).
The time interval of the sample experimental data is 0.2 s, spanning five consecutive frames. Our study employs a learning rate of 0.02. Our neural network architecture comprises three layers, with a topology structure of 7-n-4. The input vector encompasses the target passenger’s horizontal and vertical coordinates and velocity, the velocity of the nearest four passengers, the relative distance between the target passenger and the nearest four passengers, four obstacles, and the exit. The output vector includes the position coordinates, velocity, and acceleration of the passengers, resulting in a seven-dimensional input and a four-dimensional output, with seven and four neurons in the input and output layers, respectively. To extract features relevant to emergency evacuation behavior while considering the network complexity, we utilize two hidden layers. The first hidden layer effectively extracts simpler features, such as time and trajectory, while the second hidden layer captures more complex features like turning and avoidance. Based on our research and comparisons, we employ a network structure with a moderate complexity of 10 neurons in the first hidden layer and 20 neurons in the second hidden layer, denoted as Hidden layer = [10, 20]. This architecture ensures that neither overfitting nor excessively long training times occur while accurately capturing the nuances of emergency evacuation behavior.
After performing multiple iterations with varying training times and target accuracies, an analysis of the experimental results was conducted to optimize training efficiency and achieve the peak performance of the network model. The outcome indicates that, to attain the maximum level of efficiency, the training time should be set to 1000 while targeting an accuracy of 10−6. Table 3 summarizes the parameter settings for this outcome.
4. Results and Analysis
In this study, an investigation was undertaken to compare the efficacy of the social force model and the results produced by training the BP neural network in simulating an emergency evacuation scenario in a cabin. A comparison was made across three key areas, with the aim of elucidating the strengths of both methods.
4.1. Evacuation Time of Passengers
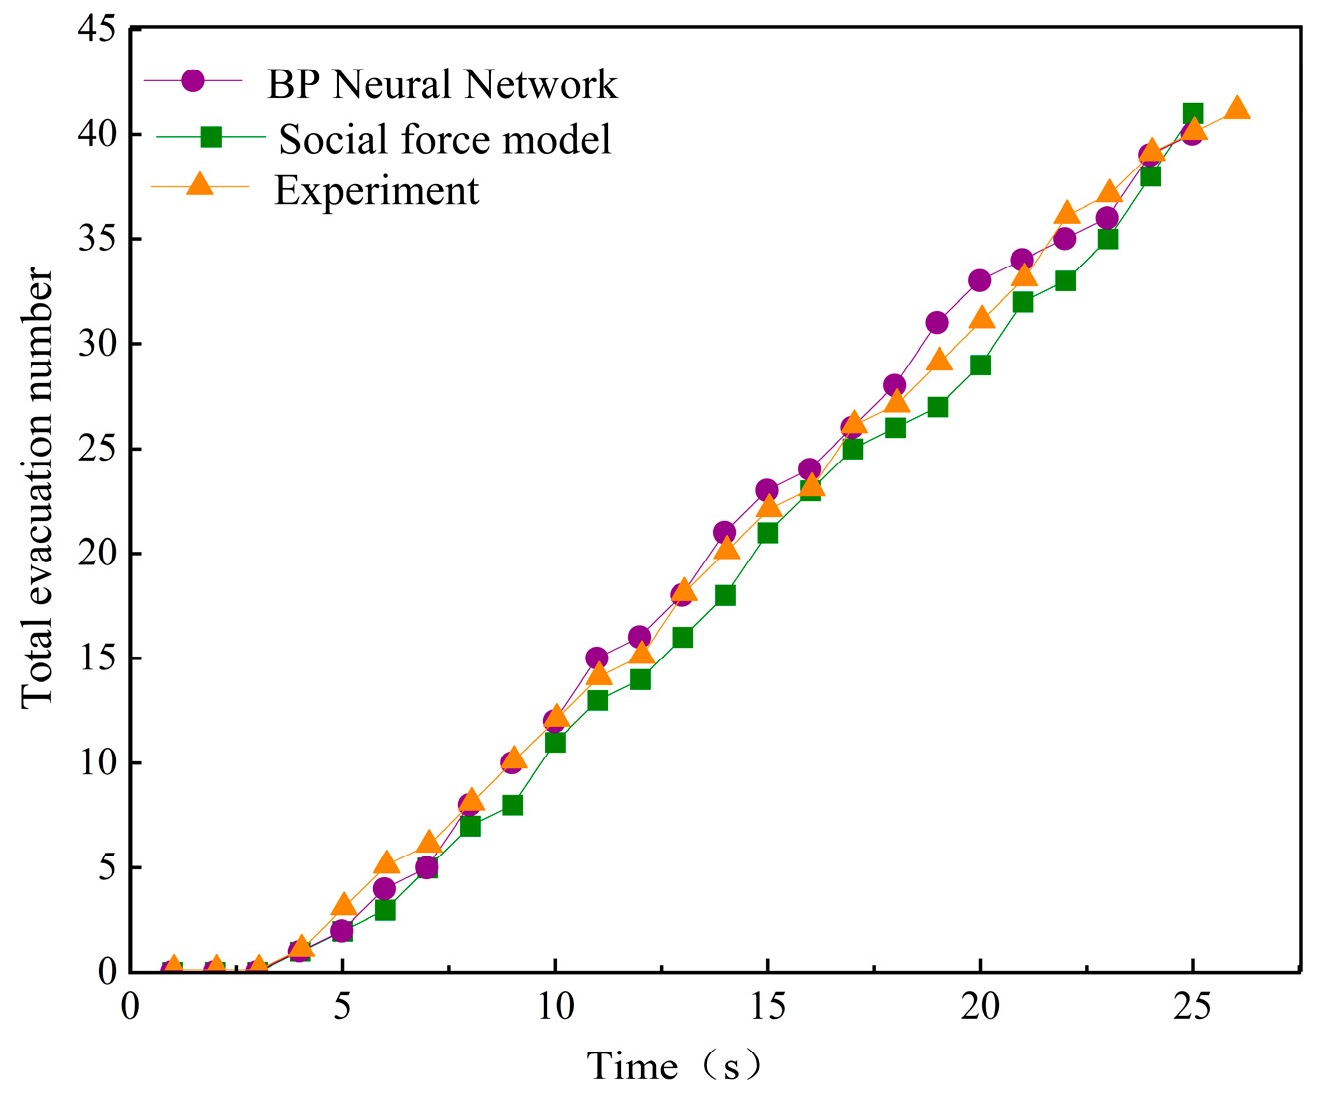
In order to evaluate the evacuation time of passengers, five rounds of social force simulation were performed, coupled with BP neural network training. Utilizing a time unit of 1 s, the time taken for the first 40 passengers to complete the evacuation exercise was carefully recorded. Furthermore, the relationship between the total number of evacuees and time was also calculated. To complete the dataset, real-life emergency evacuation data were incorporated, resulting in Figure 8.
The present study assesses the overall change in the number of evacuees over time, employing both a social force model and a BP neural network to predict emergent patterns in experimental data. The computational results of the two methods are highly consistent with the actual measurements. Specifically, the evacuation times for the first passenger to complete the evacuation in the experiments, social force simulation models, and BP neural networks are all approximately 3.8 s, 3.7 s, and 3.8 s, respectively. Similarly, the total evacuation times for 40 people yield close values of 26.5 s, 24.6 s, and 24.7 s, respectively. Moreover, the slopes of the evacuation count and duration graphs amount to 1.8133, 1.78538, and 1.83632, respectively. The percent errors between the slope values of the social force simulation model and the BP neural network measure 1.53% and 1.27%, respectively. The observed changes in the number of evacuees over time demonstrate that both the social force model and neural networks can suitably represent passenger evacuation duration. The quantified results unambiguously confirm the fitting effectiveness of both modelling techniques, aligning well with the corresponding experimental findings.
4.2. Priority of Main Aisles
Throughout the entirety of the evacuation process, conflicts in the aisles persisted. As illustrated in Figure 9, these conflicts arise when passengers exit their seats and enter the aisle. Passengers from three different directions (L: seat positions A1, A2, A3; R: seat positions A4, A5, A6; B: “back”) vie for space at the intersection of the aisle. In our experimental area, there exist seven intersections, marked with circles in Figure 9. While a passerby in the midst of an aisle conflict may approach from any of the three directions (R, L, and B), the probability of passage from each direction may vary. To discern these probabilities, a frequency statistical analysis was conducted.
Figure 10 illustrates the analysis of the videos obtained from the experimental trials, social force model simulations, and neural network learning outcomes. The data from nine experiments, along with their corresponding social force simulations and neural network training, were recorded. The frequency of incoming passengers from the first eight individuals at each main corridor intersection was calculated.
By comparing the three figures, it can be seen that the learning results of the BP neural network and the experiment have a similar distribution of priority in the main aisle. Specifically, the first passenger comes from the left or right side, and the second mainly comes from the left and right directions, but there are also cases from the rear because passengers with strong mobility in the rear row can surpass front-row passengers and enter the main aisle first. For the third passerby, the relative frequency in the right and left directions gradually decreases, while the frequency in the rear direction keeps increasing. This is because passengers who are closer to the main aisle in the early stage can enter the main aisle more smoothly, showing a lower probability of passengers coming from the rear. However, passengers who are closer to the cabin wall need to compete with the “pedestrian tunnel” that is passing by when entering the main aisle, which poses a greater obstacle, so the probability of coming from the rear increases. The results of the social force model show a greater difference from the experiment. The first two passengers come from both sides, and the third and fourth passersby mainly come from both sides because the social force model cannot simulate the decision-making behavior of personnel interaction, such as pushing, competing, and accelerating modes of rear-row personnel to front-row personnel, so they move forward according to the set force situation. Because the social force model simplifies the force situation of personnel into three types of forces, when applied in the narrow environment of a civil aircraft cabin, due to many interactions between personnel, this can easily cause a balance of passenger forces, such as passengers on both sides near the cabin wall becoming stuck in the aisle, so the frequency of passengers from the rear keeps increasing. The commonality among the three is that due to the “left–right symmetry” of the seat arrangement, the probability in the right and left directions shows good consistency.
4.3. The Bottleneck Distribution in the Main Aisle
Cabin bottlenecks are a critical issue that poses a significant challenge to evacuation operations. The main cause of a bottleneck is the presence of various obstacles that compress and restrict the evacuation space. As a result, pedestrian flow becomes deformed, leading to a locally low-speed, high-density state. To address this issue, Zhang [34] proposed the use of Voronoi diagrams for processing experimental data in small, irregular areas and obtaining relatively stable measurement results. Therefore, we utilized the basic theory of Voronoi diagrams to construct a real-time spatiotemporal distribution map of the bottleneck in the cabin environment. We established identification indicators for the front bottleneck in the cabin and studied the rules of the spatiotemporal distribution of the entire cabin flow.
Due to the narrow space within the simulated cabin, movement is generally in a low-speed state, and when people are too concentrated, it is easy for bottleneck areas to form. The main aisle is divided from left to right into areas 1 to 8, and the bottleneck center’s coordinate values are calculated from the left side. Figure 11 illustrates the evacuation direction of the pedestrian flow in the cabin, indicated by a red arrow. Overall, the use of Voronoi diagrams proved to be a valuable approach to developing an accurate spatial distribution map.
Based on the personnel density characteristics observed in the present study, bottleneck formation was identified in area j of the main aisle when the average density within j (j = 1–8) exceeded 6.5 m−2, thus defining area j as a bottleneck. Figure 12a–c delineate the bottleneck regions on the main aisle for experiments conducted at 5 s, 10 s, and 16 s, i.e., the red boxes, with different regions falling within the bottleneck at each time point in the experiments. By applying the same calculation method to the results obtained from the learning-based BP neural network and the simulation-based social force models, Figure 12d–i are obtained, respectively.
By comparing the two experiments and two calculation results, the position of the bottleneck center in the aisle is shown in Figure 13. It can be seen that the results of the social force model are significantly different from the experiment, and the bottleneck center was moving forward continuously. The reason for this is that in the early evacuation stage, passengers near the cabin wall become stuck at the seats before reaching the main aisle, resulting in the bottleneck center being formed in most of the main aisle. As the evacuation progresses, some passengers begin to enter the main aisle and move towards the exit, which causes the bottleneck center to move forward towards the front of the cabin. In contrast, the BP neural network has a better learning effect on the distribution of the bottleneck in the main aisle, and the evolution law of the bottleneck center is basically consistent with the experiment. Its bottleneck center first moves forward and then moves backward in the aisle. This is because in the early stages of evacuation, passengers on the outside have a tendency to leave the cabin as soon as possible, resulting in a bottleneck being formed in the front of the cabin. As some passengers leave, the density of personnel in the front decreases, passengers near the wall behind the middle to the rear enter the main aisle, and the density of personnel increases, resulting in a bottleneck being formed and moving towards the exit or the front of the cabin.
Through a comparison of the two experiments and two calculation results, the position of the bottleneck center in the aisle is depicted in Figure 13. The results of the social force model are significantly different from the experiment, as the bottleneck center shows a continuous forward movement. Similar to the analysis of the passenger blockage in Section 3.2, passengers exhibit a stationary state during the process of moving from their seats to the main aisle during the early stages of evacuation. This results in the formation of bottleneck centers in most areas of the main aisle, as shown in Figure 12h, where a bottleneck is formed in most parts of the main aisle at 10 s. As other passengers evacuate, the blocked passengers’ force balance is disrupted, and they start moving towards the aisle and the exit, causing the bottleneck center to continuously move towards the front of the cabin, as shown at 16 s in Figure 12i. However, the BP neural network has a good learning effect on the distribution of bottleneck centers in the main aisle, and the evolution law of the bottleneck center is basically consistent with the experiment. The bottleneck center initially moves forward in the aisle and then moves backwards, as shown in Figure 12a,b. In the early stages of evacuation, passengers on the outside tend to leave the cabin as quickly as possible, resulting in a bottleneck at the front of the cabin. As some passengers leave, the density of people in the front decreases, and passengers near the wall in the middle and back of the cabin enter the main aisle, causing the density of people to increase and a bottleneck to form, which moves towards the exit at the front of the cabin.
This study presents an analysis of bottleneck regions in the main corridor during evacuation, as evidenced by the results of the first and second experiments, as well as the findings of the social force simulation and neural network learning, as depicted in Figure 14. The spatial and temporal distribution of the eight regions in the main corridor is depicted on the horizontal axis, while the evacuation time is represented on the vertical axis. To visualize the occurrence and duration of bottlenecks in each region, a scatter plot is employed, with the horizontal axis denoting various sections of the cabin and the vertical axis corresponding to the time of evacuation. Each scatter point represents the length of time that a bottleneck persisted in a particular region.
According to Formula (16) and Table 4, the frequency of bottleneck occurrences in the main aisle area for each experiment was calculated. Formula (16) indicates the frequency of bottleneck occurrences in region j (where j ranges from 1 to 8):
where represents the total time of bottleneck occurrence in the main aisle of area j. T denotes the total evacuation time for the evacuation experiment, E denotes the experimental time, S denotes the social force model time, and N denotes the neural network model time, for convenience. All experimental and calculation model evacuation times are shown in Table 4.
The average bottleneck frequency and the relative error, e, of the two computational models are calculated for eight regions according to Equations (17) and (18), as presented in Table 5.
In these equations, represents the average frequency of the social force model or the BP neural network model.
The primary constriction zone of the central walkway in the study was primarily established within the temporal span of 2–20 s and predominantly manifested in areas 2 through 8. Upon scrutinizing the relative error, e, it becomes evident that the bottleneck frequency of the BP neural network approximates the experimental outcomes more accurately, exhibiting a superior depiction of the bottleneck’s evolutionary trajectory during the experiment, particularly in areas 3 through 7. In essence, in contrast to the social force model, the BP neural network model exhibits a more verisimilar representation of the passengers’ evacuation behavior, evincing less deviation from the experimental observations.
5. Summary and Discussion
We aimed to carry out demonstration experiments in the narrow seat aisle environment of aircraft based on standard airworthiness certification standards to explore the guiding significance and reference value of computer modeling in civil aircraft emergency evacuation airworthiness certification. Using a BP neural network, we established a continuous displacement model for personnel evacuation in the narrow seat aisle environments commonly found on planes. We compared the accuracy of this model to a social force model based on continuous displacement in simulating evacuation time and further compared the similarity of the behavior of personnel during evacuation. The results showed that both models accurately simulated the evacuation time compared to the experimental values, but the BP neural network model, driven by experimental data, more accurately predicted the evacuation process, showing more realistic details such as the probability of conflicts and bottleneck evolution in cross aisles. Based on multiple experiments with 54 people, we used the BP neural network and social force model to establish a continuous displacement model for personnel evacuation and tested the accuracy of the model in terms of the evacuation time, main aisle priority, and bottleneck distribution. The main conclusions of this study are as follows:
- Both the BP neural network model and the social force model have high accuracy in predicting evacuation time.
- Compared to the social force simulation model, the BP neural network has a more similar distribution of main aisle priority.
- BP neural networks can better demonstrate the evolution law of experimental bottlenecks, especially in regions 3–7. By comparing the evolution law of bottleneck centers and the relative error, e, it can be found that the BP neural network is more realistic in predicting the main bottleneck, with a smaller difference from the experiment.
Conclusions (2) and (3) are both due to the fact that the social force model simplifies personnel force into three forces, which cannot reflect the decision-making behavior of personnel during interactions, leading to an equilibrium of forces in high-density cabin evacuation environments, resulting in passengers becoming stuck in their position near their seat and not reaching the main aisle. The BP neural network, through learning from the dataset, performs better in simulating the evacuation process.
Our objective was to conduct demonstration experiments in enclosed aircraft aisle environments in accordance with standard airworthiness certification requirements to explore the technical guidance and facilitation role of computer modeling in the airworthiness certification of emergency evacuations for civil aircraft. We aimed to provide computer simulation methods for the airworthiness certification technology of aircraft emergency evacuations, reducing the risk of injury to participants and exploring airworthiness verification techniques that combine computer calculations with experiments. Additionally, this study provides comparative and quantitative indicators for simulation models used in demonstration experiments for emergency evacuations of civil aircraft. However, there is still room for improvement in modeling the main aisle bottleneck, and more optimized models are needed to quantitatively demonstrate the process of passengers moving from their seats to the main aisle. Alternatively, conducting more experiments that align with real-world evacuation scenarios would enhance the learning sample library for neural networks.
Author Contributions
Conceptualization, Z.F. and Q.Y.; methodology, Q.Y. and K.C.; software, H.S.; validation, Q.Y. and H.P.; formal analysis, Q.Y.; investigation, Q.Y.; resources, Z.F. and K.C.; data curation, Z.F. and Q.Y.; writing—original draft preparation, Q.Y.; writing—review and editing, Z.F. and K.C.; visualization, Z.F. and Q.Y.; supervision, Z.F. and K.C.; project administration, Z.F.; funding acquisition, K.C. All authors have read and agreed to the published version of the manuscript.
Funding
This research was funded by Civil Aviation University of China [Fundamental Research Funds for the Central Universities, No. 3122014B006] and [National KeyR&D Program of China, 2022YFB4301000].
Institutional Review Board Statement
The ethical approval number obtained for this experiment is Approval No. (CAUC-826-2022-036), and the ethics committee is the Academic Committee of the Civil Aviation University of China; see Annex: Approval of a research experiment on the emergency evacuation behavior of aircraft occupants. Volunteers were briefed on the procedure and informed of the risks prior to the trial, and those who agreed to participate in the trial signed an informed consent letter; see Annex: Informed Consent Letter.
Data Availability Statement
The raw data supporting the conclusions of this article will be made available by the authors on request.
Acknowledgments
I would like to express my sincere gratitude to my supervisors for their guidance and support throughout the entire research process. Without their help, we would not have been able to complete this paper. At the same time, I am thankful for the funding from my country, which enabled us to successfully complete the research. I would also like to thank my classmates and friends for their help and support during the research; their suggestions and support played an important role in my study. Finally, I want to thank my family, whose encouragement and support have been the biggest driving force for me on my journey.
Conflicts of Interest
The authors declare no conflict of interest.
References
- Chen, J.; Shi, T.; Li, N. Pedestrian evacuation simulation in indoor emergency situations: Approaches, models and tools. Saf. Sci. 2021, 142, 105378. [Google Scholar] [CrossRef]
- Zhang, Z.; Fu, D. Modeling pedestrian–vehicle mixed-flow in a complex evacuation scenario. Phys. A Stat. Mech. Its Appl. 2022, 599, 127468. [Google Scholar] [CrossRef]
- Xu, H.-H.; Guo, R.-Y. Passenger emergency evacuation from bus carriage: Results from realistic data and modeling simulations. J. Manag. Sci. Eng. 2022, 7, 530–549. [Google Scholar] [CrossRef]
- Fang, S.; Liu, Z.; Wang, X.; Wang, J.; Yang, Z. Simulation of evacuation in an inclined passenger vessel based on an improved social force model. Saf. Sci. 2022, 148, 105675. [Google Scholar] [CrossRef]
- Fathianpour, A.; Evans, B.; Jelodar, M.B.; Wilkinson, S. Tsunami evacuation modelling via micro-simulation model. Prog. Disaster Sci. 2023, 17, 100277. [Google Scholar] [CrossRef]
- Liu, J.; Jia, Y.; Mao, T.; Wang, Z. Modeling and simulation analysis of crowd evacuation behavior under terrorist attack. Phys. A Stat. Mech. Its Appl. 2022, 604, 127891. [Google Scholar] [CrossRef]
- Chang, K.-H.; Wu, Y.-Z.; Ke, S.-S. A simulation-based decision support tool for dynamic post-disaster pedestrian evacuation. Decis. Support Syst. 2022, 157, 113743. [Google Scholar] [CrossRef]
- Ren, X.; Hu, Y.; Li, H.; Zhang, J.; Song, W.; Xu, H. Simulation of building evacuation with different ratios of the elderly considering the influence of obstacle position. Phys. A Stat. Mech. Its Appl. 2022, 604, 127833. [Google Scholar] [CrossRef]
- Makinoshima, F.; Oishi, Y.; Imamura, F. Mechanism of an evacuation cascade during the 2011 Tohoku tsunami inferred from an evacuation simulation incorporating communications in social networks. Int. J. Disaster Risk Reduct. 2022, 71, 102810. [Google Scholar] [CrossRef]
- Pan, X. Computational modeling of human and social behaviors for emergency egress analysis. Diss. Abstr. Int. 2006, 67, 448–461. [Google Scholar]
- Huang, S.; Lu, S.; Lo, S.; Li, C.; Guo, Y. Experimental study on occupant evacuation in narrow seat aisle. Phys. A Stat. Mech. Its Appl. 2018, 502, 506–517. [Google Scholar] [CrossRef]
- Helbing, D.; Molnár, P. Social force model for pedestrian dynamics. Phys. Rev. E 1995, 51, 4282–4286. [Google Scholar] [CrossRef] [PubMed]
- Helbing, D.; Farkas, I.; Vicsek, T. Simulating dynamical features of escape panic. Nature 2000, 407, 487–490. [Google Scholar] [CrossRef] [PubMed]
- Helbing, D.; Johansson, A. Pedestrian, crowd, and evacuation dynamics. Encycl. Complex. Syst. Sci. 2013, 16, 697–716. [Google Scholar]
- Rudloff, C.; Matyus, T.; Seer, S.; Bauer, D. Can Walking Behavior be Predicted? Analysis of Calibration and Fit of Pedestrian Models. Transp. Res. Rec. J. Transp. Res. Board 2011, 2264, 101–109. [Google Scholar] [CrossRef]
- Kretz, T. On oscillations in the social force model. Phys. A Stat. Mech. Its Appl. 2015, 438, 272–285. [Google Scholar] [CrossRef]
- Marlow, F.; Jacob, J.; Sagaut, P. A multidisciplinary model coupling Lattice-Boltzmann-based CFD and a Social Force Model for the simulation of pollutant dispersion in evacuation situations. J. Affect. Disord. 2021, 205, 108212. [Google Scholar] [CrossRef]
- Sun, Y.; Liu, H. Crowd evacuation simulation method combining the density field and social force model. Phys. A Stat. Mech. Its Appl. 2020, 566, 125652. [Google Scholar] [CrossRef]
- Han, Y.; Liu, H. Modified social force model based on information transmission toward crowd evacuation simulation. Phys. A Stat. Mech. Its Appl. 2017, 469, 499–509. [Google Scholar] [CrossRef]
- Yang, X.; Zhang, R.; Pan, F.; Yang, Y.; Li, Y.; Yang, X. Stochastic user equilibrium path planning for crowd evacuation at subway station based on social force model. Phys. A Stat. Mech. Its Appl. 2022, 594, 127033. [Google Scholar] [CrossRef]
- Zhou, R.; Cui, Y.; Wang, Y.; Jiang, J. A modified social force model with different categories of pedestrians for subway station evacuation. Tunn. Undergr. Space Technol. 2021, 110, 103837. [Google Scholar] [CrossRef]
- Quagliarini, E.; Bernardini, G.; Romano, G.; D’Orazio, M. Simplified flood evacuation simulation in outdoor built environments. Preliminary comparison between setup-based generic software and custom simulator. Sustain. Cities Soc. 2022, 81, 103848. [Google Scholar] [CrossRef]
- Gao, Y.; Chen, T.; Luh, P.B.; Zhang, H. Modified Social Force Model Based on Predictive Collision Avoidance Considering Degree of Competitiveness. Fire Technol. 2016, 53, 331–351. [Google Scholar] [CrossRef]
- Shi, Z.; Zhang, J.; Shang, Z.; Fan, M.; Song, W. The effect of obstacle layouts on regulating luggage-laden pedestrian flow through bottlenecks. Phys. A Stat. Mech. Its Appl. 2022, 608, 128255. [Google Scholar] [CrossRef]
- Chen, H.; Wang, Y.; Wang, J.; Li, H.; Jiang, J.; Ni, L.; Zhou, R. Effect of S-shaped guardrails on pedestrian crowd flows in bottleneck areas. Saf. Sci. 2023, 159, 106020. [Google Scholar] [CrossRef]
- Li, N.; Guo, R.-Y. Simulation of bi-directional pedestrian flow through a bottleneck: Cell transmission model. Phys. A Stat. Mech. Its Appl. 2020, 555, 124542. [Google Scholar] [CrossRef]
- Li, H.; Zhang, J.; Song, W.; Yuen, K.K.R. A comparative study on the bottleneck pedestrian flow under different movement motivations. Fire Saf. J. 2020, 120, 103014. [Google Scholar] [CrossRef]
- National Transportation Safety Board. Safety Aspects of Emergency Evacuations from Air Carrier Aircraft. In Special Study NTSB/AAS-74/03; NTSB: Washington, DC, USA, 1974. [Google Scholar]
- Muir, H.; Cobbett, A. Aircraft Evacuation Tests—An Initial Assessment of the Influence of Various Aisle Configurations and Lighting Conditions under Different Evacuation Scenarios; Transportation Development Center: Montreal, QC, Canada, 1996.
- National Transportation Safety Board. Emergency Evacuation of Commercial Airplanes; NTSB: Washington, DC, USA, 2000.
- McLean, G.A. Access-to-egress: A meta-analysis of the factors that control emergency evacuation through the transport airplane type-III overwing exit. Aviat. Saf. 2001, 30, 15–26. [Google Scholar]
- McLean, G.A.; Corbett, C.L. Access-to Egress III: Repeated Measurement of Factors That Control the Emergency Evacuation of Passengers through the Transport Airplane Type-III Overwing Exit; DOT/FAA/AM-04/2; FAA: Washington, DC, USA, 2004.
- Federal Aviation Regulations. Part 25-Airworthiness Standards: Transport Category Airplanes; Federal Aviation Administration (FAA): Washington, DC, USA, 1989; p. 86.
- Zhang, J.; Klingsch, W.; Schadschneider, A.; Seyfried, A. Transitions in pedestrian fundamental diagrams of straight corridors and T-junctions. J. Stat. Mech. Theory Exp. 2011, 2011, P06004. [Google Scholar] [CrossRef]
Figure 1.
Schematic diagram of simulated cabin dimensions.

Figure 2.
Schematic diagram of experimental data collection.

Figure 3.
Diagram of the emergency evacuation experiment process.

Figure 4.
Experimental data processing diagram; (a) Image disambiguation phenomenon; (b) Trajectories of 54-person in an evacuation experiment.
Figure 4.
Experimental data processing diagram; (a) Image disambiguation phenomenon; (b) Trajectories of 54-person in an evacuation experiment.

Figure 5.
Simulation model of a 9 × 6 cabin layout.

Figure 6.
Calculation process.

Figure 7.
Schematic diagram of simulation of affected area of individual occupants.

Figure 8.
Evacuation numbers versus time graph.

Figure 9.
Eight main aisles for calculation.

Figure 10.
Relative frequency statistics of incoming direction of the first eight passengers at major intersections. (a) Experiment, (b) BP neural network, and (c) social force model.
Figure 10.
Relative frequency statistics of incoming direction of the first eight passengers at major intersections. (a) Experiment, (b) BP neural network, and (c) social force model.

Figure 11.
Cabin partitions.

Figure 12.
The process of bottleneck area calculation. (a) Bottleneck area at 5 s of experimental data, (b) bottleneck area at 10 s of experimental data, (c) bottleneck area at 16 s of experimental data, (d) bottleneck area at 5 s of BP neural network results, (e) bottleneck area at 10 s of BP neural network results, (f) bottleneck area at 16 s of BP neural network results, (g) bottleneck area at 5 s of social force model results, (h) bottleneck area at 10 s of social force model results, and (i) Bottleneck area at 16 s of social force model results.

Figure 13.
Evolution of bottleneck center locations. (a) Comparison of the first experiment and calculation results and (b) comparison of the second experiment and calculation results.
Figure 13.
Evolution of bottleneck center locations. (a) Comparison of the first experiment and calculation results and (b) comparison of the second experiment and calculation results.

Figure 14.
Comparison of bottleneck results between experimental and computational results. (a) Comparison between the first experiment and BP neural network results, (b) comparison between the first experiment and social force model results, (c) comparison between the second experiment and BP neural network results, and (d) comparison between the second experiment and social force model results.


Table 1.
Size of an emergency evacuation simulation model for a 9 × 6 aircraft.
| Variable | Size (m) | Variable | Size (m) |
|---|---|---|---|
| L0 | 0.10 | H0 | 0.53 |
| L1 | 1.07 | H1 | 1.60 |
| L2 | 0.51 | H2 | 1.11 |
| L3 | 1.14 | H3 | 1.31 |
| L4 | 0.80 | XS, YS | 9.22, 3.63 |
Table 2.
Parameter settings for simulation model.
| Parameters | Setting | |
|---|---|---|
| Number of passengers (people) | 54 | |
| Passenger weight (kg) | 60 ± 15 | |
| Body projection diameter (m) | Normal distribution With a mean of 0.33 and a variance of 0.05 | |
| Force intensity, expected distance to maintain (m) | Wall | 2.40, 0.50 |
| Seat to main aisle | 3.00, 0.08 | |
| Main aisle to front of cabin | 2.00, 0.50 | |
| Emergency exit | 3.00, 0.08 | |
| Force range (m) | Range of force from other passengers | 0.50 |
| Range of force from obstacles in the cabin | 0.30 | |
| Expected speed (m/s) | Seat and back half of main aisle | 0.65 ± 0.20 |
| Emergency exit, front half of main Aisle, and partitioned areas | 1.00 ± 0.20 | |
| Maximum speed (m/s) | 1.60 | |
| Elasticity coefficient (N/m) | 28,000 | |
| Sliding friction force (N/m) | 14,000 | |
| Reaction time (s) | 0.3 ± 0.2 | |
| Relaxation time (s) | 0.5 | |
Table 3.
Parameter settings of the BP neural network model.
| Parameters | Settings |
|---|---|
| Learning rate | 0.02 |
| Input layer neurons | 7 |
| Output layer neurons | 4 |
| Two hidden layers | [10, 20] |
| Number of training iterations | 1000 |
| Target accuracy | 10−6 |
Table 4.
Total evacuation time.
| Number | Experimental and Calculation Models | Total Evacuation Time (T)/s |
|---|---|---|
| 1 | E | 33.6 |
| S | 30.1 | |
| N | 32.9 | |
| 2 | E | 32.5 |
| S | 30.4 | |
| N | 32.6 |
Table 5.
Bottleneck frequency of the main aisle.
| 1 | 2 | |||||
|---|---|---|---|---|---|---|
| E | S | N | E | S | N | |
| A1 | 0.00 | 0.00 | 0.00 | 0.00 | 0.00 | 0.00 |
| A2 | 0.16 | 0.00 | 0.23 | 0.00 | 0.04 | 0.00 |
| A3 | 0.43 | 0.16 | 0.42 | 0.09 | 0.18 | 0.09 |
| A4 | 0.49 | 0.32 | 0.45 | 0.28 | 0.33 | 0.30 |
| A5 | 0.51 | 0.32 | 0.33 | 0.33 | 0.42 | 0.32 |
| A6 | 0.43 | 0.42 | 0.38 | 0.26 | 0.43 | 0.25 |
| A7 | 0.45 | 0.51 | 0.37 | 0.43 | 0.52 | 0.40 |
| A8 | 0.21 | 0.40 | 0.22 | 0.21 | 0.32 | 0.09 |
| 0.34 | 0.27 | 0.30 | 0.20 | 0.28 | 0.18 | |
| e | 0 | 20% | 12% | 0 | 40% | 10% |
Disclaimer/Publisher’s Note: The statements, opinions and data contained in all publications are solely those of the individual author(s) and contributor(s) and not of MDPI and/or the editor(s). MDPI and/or the editor(s) disclaim responsibility for any injury to people or property resulting from any ideas, methods, instructions or products referred to in the content. |
© 2024 by the authors. Licensee MDPI, Basel, Switzerland. This article is an open access article distributed under the terms and conditions of the Creative Commons Attribution (CC BY) license (https://creativecommons.org/licenses/by/4.0/).
Share and Cite
MDPI and ACS Style
Feng, Z.; You, Q.; Chen, K.; Song, H.; Peng, H. Research on Passenger Evacuation Behavior in Civil Aircraft Demonstration Experiments Based on Neural Networks and Modeling. Aerospace 2024, 11, 221. https://doi.org/10.3390/aerospace11030221
AMA Style
Feng Z, You Q, Chen K, Song H, Peng H. Research on Passenger Evacuation Behavior in Civil Aircraft Demonstration Experiments Based on Neural Networks and Modeling. Aerospace. 2024; 11(3):221. https://doi.org/10.3390/aerospace11030221
Chicago/Turabian StyleFeng, Zhenyu, Qianqian You, Kun Chen, Houjin Song, and Haoxuan Peng. 2024. "Research on Passenger Evacuation Behavior in Civil Aircraft Demonstration Experiments Based on Neural Networks and Modeling" Aerospace 11, no. 3: 221. https://doi.org/10.3390/aerospace11030221
Note that from the first issue of 2016, this journal uses article numbers instead of page numbers. See further details here.