
A Novel Optimal Sensor Placement Method for Optimizing the Diagnosability of Liquid Rocket Engine

1
School of Mechanical Engineering, Xi’an Jiaotong University, Xi’an 710049, China
2
School of Future Technology, Xi’an Jiaotong University, Xi’an 710049, China
*
Author to whom correspondence should be addressed.
Aerospace 2024, 11(3), 239; https://doi.org/10.3390/aerospace11030239
Submission received: 1 February 2024
/
Revised: 1 March 2024
/
Accepted: 14 March 2024
/
Published: 19 March 2024
(This article belongs to the Section Astronautics & Space Science)
Abstract
:There are hundreds of various sensors used for online Prognosis and Health Management (PHM) of LREs. Inspired by the fact that a limited number of key sensors are selected for inflight control purposes in LRE, it is practical to optimal placement of redundant sensors for improving the diagnosability and economics of PHM systems. To strike a balance between sensor cost, real-time performance and diagnosability of the fault diagnosis algorithm in LRE, this paper proposes a novel Optimal Sensor Placement (OSP) method. Firstly, a Kernel Extreme Learning Machine-based (KELM) two-stage diagnosis algorithm is developed based on a system-level failure simulation model of LRE. Secondly, hierarchical diagnosability metrics are constructed to formulate the OSP problem in this paper. Thirdly, a Hierarchy Ranking Evolutionary Algorithm-based (HREA) two-stage OSP method is developed, achieving further optimization of Pareto solutions by the improved hypervolume indicator. Finally, the proposed method is validated using failure simulation datasets and hot-fire test-run experiment datasets. Additionally, four classical binary multi-objective optimization algorithms are introduced for comparison. The testing results demonstrate that the HREA-based OSP method outperforms other classical methods in effectively balancing the sensor cost, real-time performance and diagnosability of the diagnosis algorithm. The proposed method in this paper implements system-level OSP for LRE fault diagnosis and exhibits the potential for application in the development of reusable LREs.
1. Introduction
Future space transportation systems are expected to be constructed towards the goal of regular launches like airplane flights, in which the reusable launch vehicles served as the main used vehicle of the space transportation system, have put forward higher requirements for their service life, economy, reliability, maintainability, safety and dispatchability. The reusable Liquid Rocket Engine (LRE) is a decisive subsystem for the reliability, economy and dispatchability of a reusable launch vehicle. The Prognosis and Health Management (PHM) technologies based on in situ sensor measurements are useful tools for realizing the increasing reliability requirements of reusable LREs [1]. Meanwhile, data-driven fault diagnosis algorithms are currently the hottest research area in the PHM community, which develops fault diagnosis algorithms using sensor measurements data from multi-physics modeling, hot-fire test-run experiments or actual launch telemetry data. The more sensors are equipped, the more precise the diagnosis will be. Nevertheless, the inclusion of more redundant sensors in an actual LRE reduces its reliability, which is vital in space vehicles [2]. The above analysis shows that the placement of sensors can greatly affect the online fault diagnosis performance of LREs. Maul et al. [3] proposed that there are four requirements of Optimal Sensor Placement (OSP) in aerospace systems: fault observability, reliability, fault detectability, and sensor cost. This paper focuses on the optimization of LREs system-level fault detectability under the constraint of sensor cost, which is also referred to as the diagnosability of PHM systems. The key issue of the OSP technique in this paper lies in how to correctly construct the metrics for diagnosability, how to perform the multi-objective optimization and how to choose the optimal solution with non-inferior solutions.
Since decades ago, there have been massive statistic-based online fault diagnosis algorithms developed by researchers for solving the real-time fault diagnosis of LREs, such as the red line method, Adaptive Threshold Algorithm (ATA), autoregressive moving average model, etc. [4]. In recent years, the data-driven model-assisted online fault diagnosis algorithms have achieved further progress thanks to the vigorous development of machine leaning and time series analysis. Ma et al. [5,6] reported a Deep Coupling Autoencoder (DCAE) model that handles the multimodal sensory signals for fault diagnosis and a Convolution-based Long Short-Term Memory (C-LSTM) network to predict the Remaining Useful Life (RUL) of rotating machineries mining the in situ vibration data. Chen et al. [7] proposed a degradation consistency recurrent neural network for RUL prediction by integrating the natural degradation knowledge of components. Wang et al. [8] presented a fault diagnosis algorithm for planetary gearbox using a Transferable Deep Q Network (TDQN) that merges Deep Reinforcement Learning (DRL) and Transfer Learning (TL). Lee et al. [9] proposed a Kalman filter and a fault-factor-based fault diagnosis method for an open-cycle LRE in a steady state of full thrust level. Kawatsu et al. [10,11] developed a fault diagnosis method based on Dynamic Time Warping (DTW) algorithm and hierarchical clustering technique, and demonstrated the possibility of fault diagnosis for electromechanical actuators in an LRE with fault injection experiment data. Tsutsumi et al. [12] proposed a data-driven fault detection method using a bivariate time-series analysis, and the static firing tests of a reusable liquid-propellant rocket engine developed by Japan demonstrated its effectiveness of fault detection and robustness. Deng et al. [13] proposed a fault detection and diagnosis method for a LOX/kerosene LRE based on LSTM and Generative Adversarial Networks (GANs) and shows its effectiveness of fault detection during startup and steady-state processes. Zhang et al. [14] proposed a fault diagnosis method based on a one-dimensional Convolutional Neural Network (1D-CNN) and interpretable bidirectional LSTM (bi-LSTM) for LREs. Similarly, Jana et al. [15] proposed a real-time sensor fault detection, localization, and correction framework, in which a CNN is used to detect and locate the sensor faults well as a suite of individually trained Convolutional Autoencoder (CAE) networks corresponding to each type of fault are employed for reconstruction. Park and Ahn [16] proposed a two-stage method for fault detection and diagnosis during the startup transient of LRE, in which LSTM is employed for fault detection and CNN-LSTM is utilized for fault diagnosis. Wang et al. [17] proposed a dynamic model-assisted transferable network for LRE fault diagnosis using limited fault samples. Sun et al. [18] proposed a rocket engine anomaly detection method based on convex optimization and the adaptive Exponentially Weighted Moving Average–cumulative sum (EWMA-CUSUM) algorithm to achieve higher detection accuracy and lower detection time. In conclusion, there is a degree of inherent contradiction between real-time performance and diagnosis accuracy of the existing methods.
The OSP problem has garnered attention across various fields for an extended period, as rapid data sampling, analysis, and decision-making for complex systems can be archived with limited measurements. There are tremendous OSP methods developed for structural health monitoring systems [19,20,21], intelligent manufacturing systems [22], fluid control systems [23,24], wireless sensor networks [25], building monitoring systems [26], pipeline systems [27], hydraulic control systems [28], environmental monitoring systems, thermal systems [29], Internet of Things (IoT) systems [30], condition monitoring systems [31,32], etc., and most of these methods are based on high-dimensional data decomposition methods or heuristic optimization algorithms. The data-driven decomposition methods have elegant mathematical expressions, but they are mostly applicable to component-level OSP problems. Meanwhile, the main drawbacks of heuristic optimization methods include the tendency to fall into the local optimal solution, and repeated iterations may result in varied solutions. In addition, there are several OSP methods using the information content in measured data as the evaluating metric, such as Papadimitriou and Costas [33], who presented an OSP method for parameter estimation in structural dynamics based on information entropy, Udwadia [34], who provided an OSP method for parameter identification in dynamic systems based on the Fisher Information Matrix (FIM) and Jana et al. [35], who proposed an FIM-based approach to determine optimal locations of input forces for experimental modal analysis. However, the calculation of information-theory-based metrics requires comprehensive modeling of the system’s state space, which is nearly impossible to achieve for an extremely complex system like LRE. Specific to aerospace systems, there are also some related works. Omata et al. [36] employed a greedy approach utilizing the detection performance score from multivariate supervised analysis for sensor placement optimization to identify propellant leaks in an LRE. Yang et al. [37] reported a two-step strategy of non-probabilistic multi-objective optimization for load-dependent sensor placement with interval uncertainties to determine the final sensor configuration from a Pareto solution, and the accuracy of the proposed method was verified using an example involving space docking module in Space Power Satellites (SPSs). Li et al. [38] introduced a data-driven OSP method based on sparse learning applied to classify the pattern of a hypersonic aircraft engine inlet, and the effectiveness of the proposed method has been validated through simulations and a real engineering example. The literature referred to in this paragraph shares a common opinion that the development of OSP methods is an effective means for the trade-off between the functionality of a given system and the given constrains, such as the sensor cost and so on.
The above literature review indicates that few works have focused on balancing the relationship between the real-time performance of the diagnosis algorithm, diagnosis accuracy and the cost of sensors within the reusable LRE online PHM system. Simultaneously, the aforementioned literature also offers us some insights. Selective execution of the task that divides fault detection and diagnosis into two stages can effectively enhance the real-time performance of the algorithm. The on-board sensors of the LREs are designed with redundancy, and optimizing these redundant sensors can often yield advantages in both real-time performance and cost. Furthermore, the selection of critical sensors also provides some assurance of diagnostic accuracy. It is essential to make decisions intelligently on Pareto solutions to obtain the final optimal sensor configuration, which can be directly applied to engineering practice. Hence, this paper aims to optimize the diagnosability of the LRE online PHM system in hierarchical diagnosability metrics. Based on this goal, a two-stage diagnosis algorithm and a two-stage OSP method based on Kernel Extreme Learning Machine (KELM) and Hierarchy Ranking Evolutionary Algorithm (HREA) are proposed. For the proposed OSP method validation, LRE failure simulation and hot-fire test-run experiments are conducted. The contribution of this paper is summarized as follows:
- A two-stage diagnosis algorithm is proposed for constructing hierarchical diagnosability metrics achieving multi-scale optimization of diagnosability of the LRE online PHM system;
- A two-stage OSP method is proposed to solve the intelligent optimal decision-making problem in the Pareto Solutions (PSs);
- The proposed diagnosability metrics can be computed for different sensor placements without retraining the classifier model while optimizing, and the superiority of the proposed method is verified by retraining the classifier model based on the optimal sensor configuration selected from PSs;
- The proposed method in this paper implements system-level Optimal Sensor Placement for LRE fault diagnosis, and the effectiveness of the proposed method was verified by LRE system-level simulation and ground hot-fire test-run experiments. The results show the proposed method has the potential to be used for the developing of reusable LREs.
The remaining sections of this paper are structured as follows. In Section 2, the methodology of this paper is introduced. Firstly, the theoretical basis of a system-level failure simulation model of LRE is briefly described. Subsequently, the KELM-based two-stage fault diagnosis method is presented along with the construction of hierarchical diagnosability metrics. Then, the OSP problem of this paper is analyzed. Finally, a two-stage OSP method based on HREA is illustrated. LRE failure simulations and ground hot-fire test-run experiments are conducted to verify the effectiveness and feasibility of the proposed method in Section 3. Section 4 shows the algorithm test results, followed by comprehensive discussions based on these results. Concluding remarks and future works are drawn in Section 5.
2. Methodology
In this section, the methodology of LRE system-level modeling, LRE diagnosability modeling and the proposed OSP methods are described in turn. The overall procedure of the proposed OSP method is shown in Figure 1.
2.1. System-Level Failure Simulation Model of LRE
As shown in Figure 2, this paper presents system-level failure modeling of a classic reusable LOX/H2 cryogenic LRE, which is also known as the Space Shuttle Main Engine (SSME). Furthermore, there are four typical failure modes modeled in this section.
The 1st failure mode is the efficiency decrease in turbine components, which is caused by other failures that occur in turbine components such as rotor rubbing, centrifugal pump cavitation, etc. An efficiency factor is introduced to simulate a decrease in power leading to a decrease in rotational speed and a decrease in the work conducted by centrifugal pumps for fault simulation, which can be modeled as (1).
In Equation (1), power is denoted by , f is the efficiency factor, is the efficiency of turbines, Q is the volumetric flow rate, represents the pressure difference across turbines, T is the torque and is the rotational speed of turbine and centrifugal pump.
The 2nd failure mode is valve opening failure. It is modeled by adjusting the timing and response speed of five main valves, namely the main oxidizer valve (MOV), main fuel valve (MFV), oxidizer pre-burner oxidizer valve (OPOV), fuel pre-burner oxidizer valve (FPOV) and chamber coolant valve (CCV). As shown in (2), the degree of valve opening failure can be controlled by manipulating the control function.
where the control function is denoted by , represents the mass flow rate, is the flow coefficient, A is the maximum flow area, is the average density of fluid, and is the pressure difference before and after the valve.
The 3rd failure mode is flow leakage, which commonly occurs in hydraulic systems. When fluid leaks into the pump or outside of pipelines, it equates to two additional flow paths. Thus, a valve with a maximum flow area of A is virtually added to each flow path, and the valve opening degree is controlled by an external signal to simulate the different levels of leakage. It can be expressed by Equation (3).
where and denote the mass flow rate of two main flows, respectively, and is the leakage flow in the pipeline, which controlled by Equation (2).
The 4th failure mode is cooling jacket leakage, which can easily lead to high-pressure hydrogen gas leakage into the combustion chamber to participate in combustion for LREs using regenerative cooling. The cooling jacket leakage can be modeled as adding an alternate flow path to the combustion chamber, and it is similar to the failure simulation of flow leakage. Consequently, the failure simulation model of cooling jacket leakage can be substituted by flow leakage.
2.2. Diagnosability Modeling of LRE
It is noteworthy that the occurrence of LRE failures is sparse in the time dimension, which suggests the possibility of using a two-stage diagnosis method to increase the computing resource usage rate of LREs inflight hardware for diagnosis and the real-time performance of fault detection by dividing the overall process into two consecutive stages: fault detection and subsequent diagnosis. The main idea of the two-stage diagnosis method proposed in this paper can be concluded as follows.
Fault detection is initially conducted to ascertain whether the system state is normal, abnormal, or faulty. In the event of a fault, a shutdown command is issued to the main control loop. Simultaneously, fault diagnosis is carried out to locate the fault from the moment it occurs. The localized fault is then relayed to the LRE control system for isolation and reconfiguration. If the faults are amenable to isolation or reconfiguration, the LRE will be restarted. The time to issue a shutdown command can ideally be reduced to half or even less compared to a typical one-stage diagnosis algorithm.
KELM [39] is a forward neural network with a single hidden layer, which requires fewer parameters for tuning and exhibits faster convergence and good generalization performance. In addition, KELM exclusively involves the inner product operation in feature space, which is independent of the dimension of the features. It is suitable for processing multisensory signals in LRE online condition monitoring.
Meanwhile, the LRE hardware platform for prognosis is a streaming data processing platform, enabling the dynamic update of prognostic data through the sliding window processing of streaming data. Incremental learning as an effective approach to solving the problem of model catastrophic forgetting, which is achieved by learning new knowledge while retaining the judgment of old knowledge and even optimizing the understanding of the latter. LRE online fault diagnosis algorithms urgently require the integration of incremental learning to enhance online diagnosis accuracy. Since KELM eliminates the need to train backpropagation of hidden layer weights, it facilitates the implementation of online incremental learning on platforms with limited hardware resources, which is also one of the future research directions for LRE online fault diagnosis methods. Consequently, KELM is employed as the classifier model in the two-stage fault diagnosis algorithm proposed in this paper.
The objective function of the KELM training process can be expressed as Equation (4).
where denotes the connection weights vector between the hidden layer of k neurons and output layer of n neurons, c is regularization factor, represents the training error, is the hidden layer feature mapping function, denotes the d-dimensional input vector of the ith sample and corresponds to the classified label of the ith sample. The output matrix H of the hidden layer is defined as Equation (5).
Then can be expressed as Equation (6), where Y denotes the training label vector and I is an eye matrix.
The key idea of KELM is constructing kernel matrix to replace , which can be expressed as Equation (7).
where is the kernel function. The output of KELM can be obtained as Equation (8).
The Radial Basis Function (RBF) kernel function used in this paper can be expressed as Equation (9), where denotes the kernel parameter.
Considering the balance of real-time performance, precision and recall of the classifier model, the diagnosability of fault diagnosis can be modeled as parameter fraction rates and macro-average scores, respectively. The hierarchical diagnosability metrics are defined as Equations (10) and (11) in this paper.
In Equations (10) and (11), -norm is denoted as , s denotes the current sensor configuration and denotes the configuration containing all sensors, , and represent parameter fraction rates, macro-average score of n-categorical fault detection model and m-categorical fault diagnosis model, respectively. , and are true positive, false positive and false negative classified samples, respectively.
The overall procedure of the two-stage fault diagnosis algorithm proposed in this paper can be summarized in Figure 3.
2.3. OSP Problem Analysis
There are hundreds of sensors used for online condition monitoring, but there are only 21 sensors used for SSME inflight control, which shows the potential of OSP for diagnosis purposes. The measurement system of LREs is equipped with valve position sensors, pressure sensors, temperature sensors, rotational speed sensors, flowmeters and accelerometers, while the sensor placement and redundancy are usually limited by physical constraints and risk considerations. The rotary variable differential transformer (RVDT) and linear variable differential transformer (LVDT) type of valve position sensors are typically employed to measure rotational angles and linear motion. Piezoelectric and piezoresistive pressure sensors are utilized for pipeline static pressure and dynamic pressure, chamber pressure measuring. Thermocouples and resistance temperature devices (RTD) are used as gas generators and preburner combustion temperature sensors under high temperatures and pressures. Rotational speed sensors are typically of the variable-reluctance type and consist of a permanent magnet and an independent pole piece surrounded by a coil winding made of thin-filament magnet wire. Volumetric flowmeters and mass flowmeters are used for measuring flows through valves and chambers. Integrated electronics piezoelectric (IEPE) accelerometers are usually placed on the turbopumps for vibration monitoring to diagnose faults in rotating components. The sensor configuration for diagnosis can be formulated as (12).
where denotes the p pressure sensors, denotes the q flowmeters, denotes the t temperature sensors, denotes the n rotational speed sensors, denotes the v vibration sensors, and the sensors numbers are encoded as the order of elements in the binary vector s. It is critical to account for each kind of sensor to retain the diversity of information served for diagnosis. The common OSP problem for diagnosis summarized in this paper can be formulated as (13).
where -norm is denoted as and c is the price vector corresponding to s. It is worth noting that there is some correlation between the two objective functions and .
2.4. Two-Stage OSP Method
When the total number of sensors is b, the number of all possible sensor configurations is . This indicates that when b is relatively large, the search space of the decision variables becomes too extensive, making it nearly impossible to employ exhaustive search methods to solve the OSP problem described in this paper. Consequently, this section presents a two-stage OSP method based on the Binary Multi-objective Optimization Algorithm (BMOA).
The OSP problem discussed in this paper exhibits a multimodal characteristic that encompasses global and local Pareto Fronts (PFs). This implies that while one solution is slightly inferior to another in terms of objective values, the solutions are significantly distant in the decision space. To address this kind of issue, Li et al. [40] proposed HREA, which can find both the global and the local PFs based on the preference settings. Therefore, HREA serves as the first stage of the two-stage OSP method to obtain the PSs for further evaluation. The main idea of this section is to construct evaluation metrics to solve the intelligent optimal decision-making problem in PSs, which constitutes the second stage of the two-stage OSP method. Hypervolume (HV) [41] is a unitary indicator used in multi-objective optimization that acts as a quality metric to measure the space covered by a set of non-dominated solutions in the objective space. However, the classical HV as defined in Equation (14) is incapable of assessing the diversity of PSs.
where denotes the Lebesgue measure, denotes the hyperarea delimited below by ith solution belonging to PF and above by the nadir point r, which is defined as Equation (15). In (15), denotes the norm and represents the kth category sensors in s.
The objective function can be understood as a metric of PSs’ diversity in a sense. Then, the HV indicator is redefined as Equation (16) in this paper.
In this section, the procedure of the second stage method involves initially calculating the HV values covered by each point on the PF, and ultimately selecting the solution associated with the highest HV as the preferred solution. The overall procedure of the two-stage OSP method is demonstrated in Figure 4.
It can be found that we utilize the OSP method for KELM achieving an effect similar to the channel-wise structured pruning of neural network. Based on the lottery tickets hypothesis in the pruning method, an optimal sub-network can be found that can utilize a smaller-scale network structure to achieve a prediction accuracy approximating that of a full-scale neural network. In this paper, the lottery tickets hypothesis can be interpreted as suggesting that a sensor configuration with fewer sensors can be found to approximate the diagnosis accuracy of redundant sensor configuration.
3. Simulations and Experiments
To verify the effectiveness of the proposed OSP method, numerical simulations of SSME and ground hot-fire test-run experiments of a LOX/Kerosene LRE are carried out for creating datasets including operations under normal and abnormal states in this section. The proposed OSP method is then applied to the simulation and experimental datasets, respectively. Furthermore, various typical BMOAs based on evolutionary computing and crowd intelligence are applied to compare their effectiveness with the proposed method, such as Non-Dominated Sorting Genetic Algorithm-II (NSGA-II) [42], Adaptive Geometry Estimation based Multi-objective Evolutionary Algorithm-II (AGE-MOEA-II) [43], Bi-criterion Evolution in Multi-objective Evolutionary Algorithm based on Decomposition (BCE-MOEA/D) [44] and Competitive Mechanism-based Multi-objective Particle Swarm Optimizer (CMMOPSO) [45,46].
3.1. LRE Failure Simulations
Leakage fault is the most frequent fault of SSME according to the statistical analysis of the failure incidences data of SSME test firing, which leads to the main focus of this section on the simulation of leakage fault. In this paper, the simulations of leakage at different positions and levels of LRE are carried out.
The output of the simulation model is the measurements of 28 sensors, and the correspondence between sensor number and sensor label is shown in Table 1. To create the training and testing datasets, the embedding data quantity is configured as 10 with employing a sampling rate of 1000 Hz, which means a fault will be detected in 10 ms if a fault occurs. In total, five different leakage positions with two leakage levels are simulated. The fault is emulated through varying the size of the fault factor, where the leakage is located at pipelines of the fuel pump and oxidizer pump. The simulation dataset is constructed using simulation data in the same proportion of normal state and 10 different leakage states, with 3000 samples at each category. Furthermore, the dataset is randomly divided into training and testing sets according to an 80/20% distribution.
The typical measurements during normal and leakage states are illustrated in Figure 5a,b, respectively. As depicted in Figure 5, it is evident that following the onset of leakage, the measurements undergo changes over time with varying trends. The inference time of the proposed two-stage fault diagnosis method has been evaluated, the anomaly detection time to complete a normal sample is 5.182 ms and the fault diagnosis time for a faulty sample is 11.868 ms. The tests were conducted on a platform equipped with 12th Gen Intel(R) Core(TM) i5-12400F processor, 16GB of RAM, and MATALAB R2023b.
The proposed OSP method is employed for the OSP of SSME with simulated data. The OSP problem with 4 objectives and 28 variables in this section can be expressed as Equation (17).
where c denotes the price vector corresponding to binary sensor vector s, , and denotes parameter fraction rates, macro-average score of n-categorical fault detection model and m-categorical fault diagnosis model, respectively.
In addition, the sensor price used in this section is an assumed price based on an integrated assessment of the components price from Alibaba and installation cost.
As we can see in Figure 6, the objective functions , and are significantly affected by the number of sensors with different sensor configurations which is another form of . It turns out that objective functions and exhibit a strong nonlinear property under nonlinear constrains, which can hardly be addressed by non-convex algorithms.
The parameters of the proposed two-stage diagnosis algorithm include the regularization factor c and the kernel parameter , which are specialized as 0.5 and 10 by utilizing the grid search method for fine tuning, respectively. Subsequently, the parameters of the two-stage OSP method include maximum generations , population size N and the acceptable local PF gap , which are specialized as 5600, 1000 and 0.3, respectively. The parameters of other BMOAs used for the comparison are shown in Table 2.
3.2. Hot-Fire Test-Run Experiments
Hot-fire test-run experiments of a LOX/Kerosene LRE were carried out to further verify the effectiveness of the proposed method. The structure of the LOX/Kerosene LRE is shown in Figure 7. More than 100 sensors were deployed in various components to monitor the health condition of the LRE during hot-fire test-run experiments. A failure mode of leakage was detected after a hot-fire test-run experiment. There were 48 pressure sensors employed for leakage diagnosis, and the details of the sensors are listed in Table 3. Sensors are categorized into expensive and cheap types with different assumed prices. In the fourth column of Table 3, an entry labeled ’unknown’ indicates that the corresponding sensor is cheap, and other entries indicate that the corresponding sensors are both important and expensive.
As depicted in Figure 8, the signals at the initial and final stages were categorized as normal and faulty due to the uncertainty surrounding the precise moment of the leakage fault.
The normalized signals from a hot-fire test-run experiment with a leakage fault are shown in Figure 9. Then, the inference time of the proposed two-stage fault diagnosis method was evaluated, the anomaly detection time to complete a sample is 5.822 ms. Combined with the results of inference time evaluation in simulation data, the proposed two-stage fault diagnosis method has demonstrated its capability for online prognosis.
Subsequently, the proposed OSP method is utilized for OSP with experimental data. The OSP problem with 3 objectives and 48 variables in this section can be formulated as (18).
where , and denotes the vector of expensive and cheap sensors, respectively.
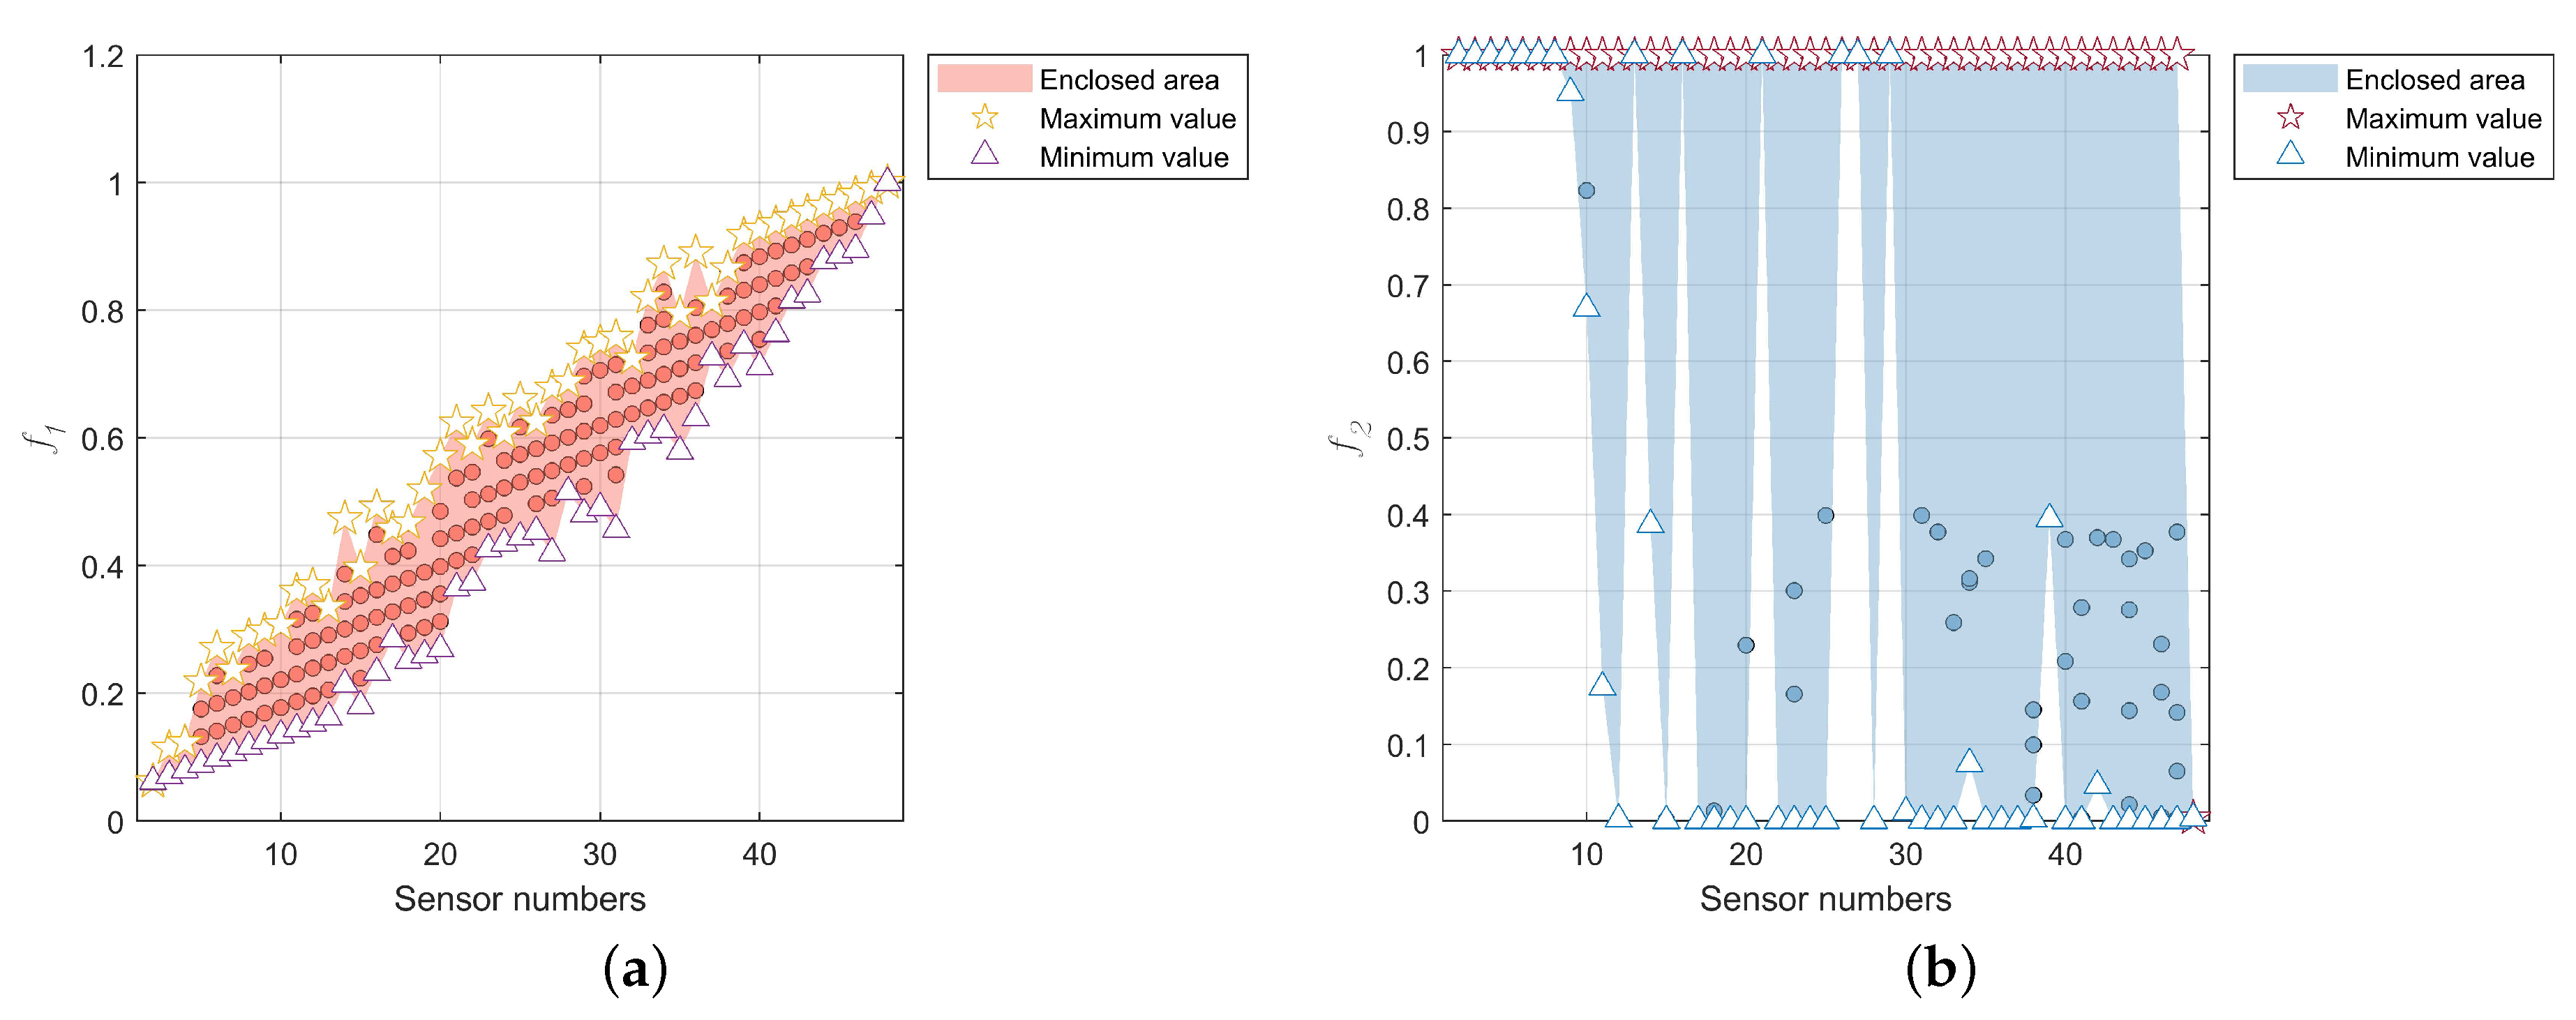
As depicted in Figure 10, the objective function and are very sensitive to changes in the number of sensors and reflect the multimodal characteristic. This implies that even minor changes in the number or configuration of sensors can lead to significant alterations in the objective function. In addition, the parameters of algorithms used in this section remain consistent with those detailed in Section 3.1 except the maximum generations are 9600 and the population size is 2000.
4. Results and Discussions
4.1. Results on the Simulated Datasets
The PF and the corresponding HV values are shown in Figure 11 and Figure 12, respectively. The number of unique PSs in the decision space of the five algorithms are 12, 12, 14, 48 and 74, respectively, indicating that HREA has the highest number of unique PSs. Compared to other algorithms, the PSs of HREA show better diversity in the decision space. In Figure 12, we have found that HREA outperforms other BMOAs in the diversity and absolute numerical value of the HV indicator.
The selected sensor configurations are listed in Table 4, while they are applied for validating the effectiveness of the proposed OSP method by means of retraining the diagnosis models and testing them on the testing datasets. Analyzing the frequency of selection for each sensor in various configurations reveals that sensors numbered 1, 2, and 15 (referred to as Pc, Tc, and lpftpN, respectively) play a crucial role in diagnosing leakage faults in LRE.
Based on the test results shown in Figure 13, each algorithm’s performance on each metric is scored. The scoring system assigns a score of 5 to the best metric achieved and a score of 1 to the worst metric. Notably, a score of 0 is assigned when the value exceeds 0.4, with higher scores indicating better performance. Following these scoring rules, the final scores achieved by each algorithm are 14, 9, 8, 11 and 14, respectively. However, the presence of zero-score items in NSGA-II and BCE-MOEA/D is considered unacceptable. The above analysis highlights that the comprehensive performance of the HREA-based OSP method outperforms the other methods. Many enlightening results can be found by comparing the evaluation metrics. The sensor configuration obtained using the NSGA-II-based method can compress the sensor cost better while ignoring the guarantee of diagnosability. The AGE-MOEA-II-based and BCE-MOEA/D-based methods tend to choose cheaper sensors to reduce sensor costs, disregarding the necessity of ensuring real-time performance and diagnosability of the diagnosis algorithm. The CMOPSO-based and HREA-based methods strike a good balance between sensor cost, real-time performance and diagnosability of the diagnosis algorithm. However, the CMOPSO-based method is slightly more optimized in terms of sensor cost and real-time performance, while the HREA-based method offers the best trade-off between the three.
4.2. Results on the Experimental Datasets
Figure 14 and Figure 15 depict the PF and the corresponding HV values, respectively. The number of unique PSs in the decision space of the five algorithms are 3, 6, 3, 174 and 10, respectively, indicating that HREA has the highest number of unique PSs except CMOPSO. It is evident from Figure 14 that CMOPSO faces challenges in converging to the true PF, while the PSs derived from HREA demonstrate notable diversity within the decision space. Consequently, the results based on CMOPSO are not further analyzed below.
Table 5 lists the selected sensor configurations. The most frequently selected sensors are numbers 5, 12, 17, 32, and 33, which are not consistent with the conclusion made in Section 4.1. Given that the sensor configurations in this section are sparse and introduce significant randomness through low counts, the conclusions drawn based on the analysis of the number of times a sensor is selected are considered unreliable.
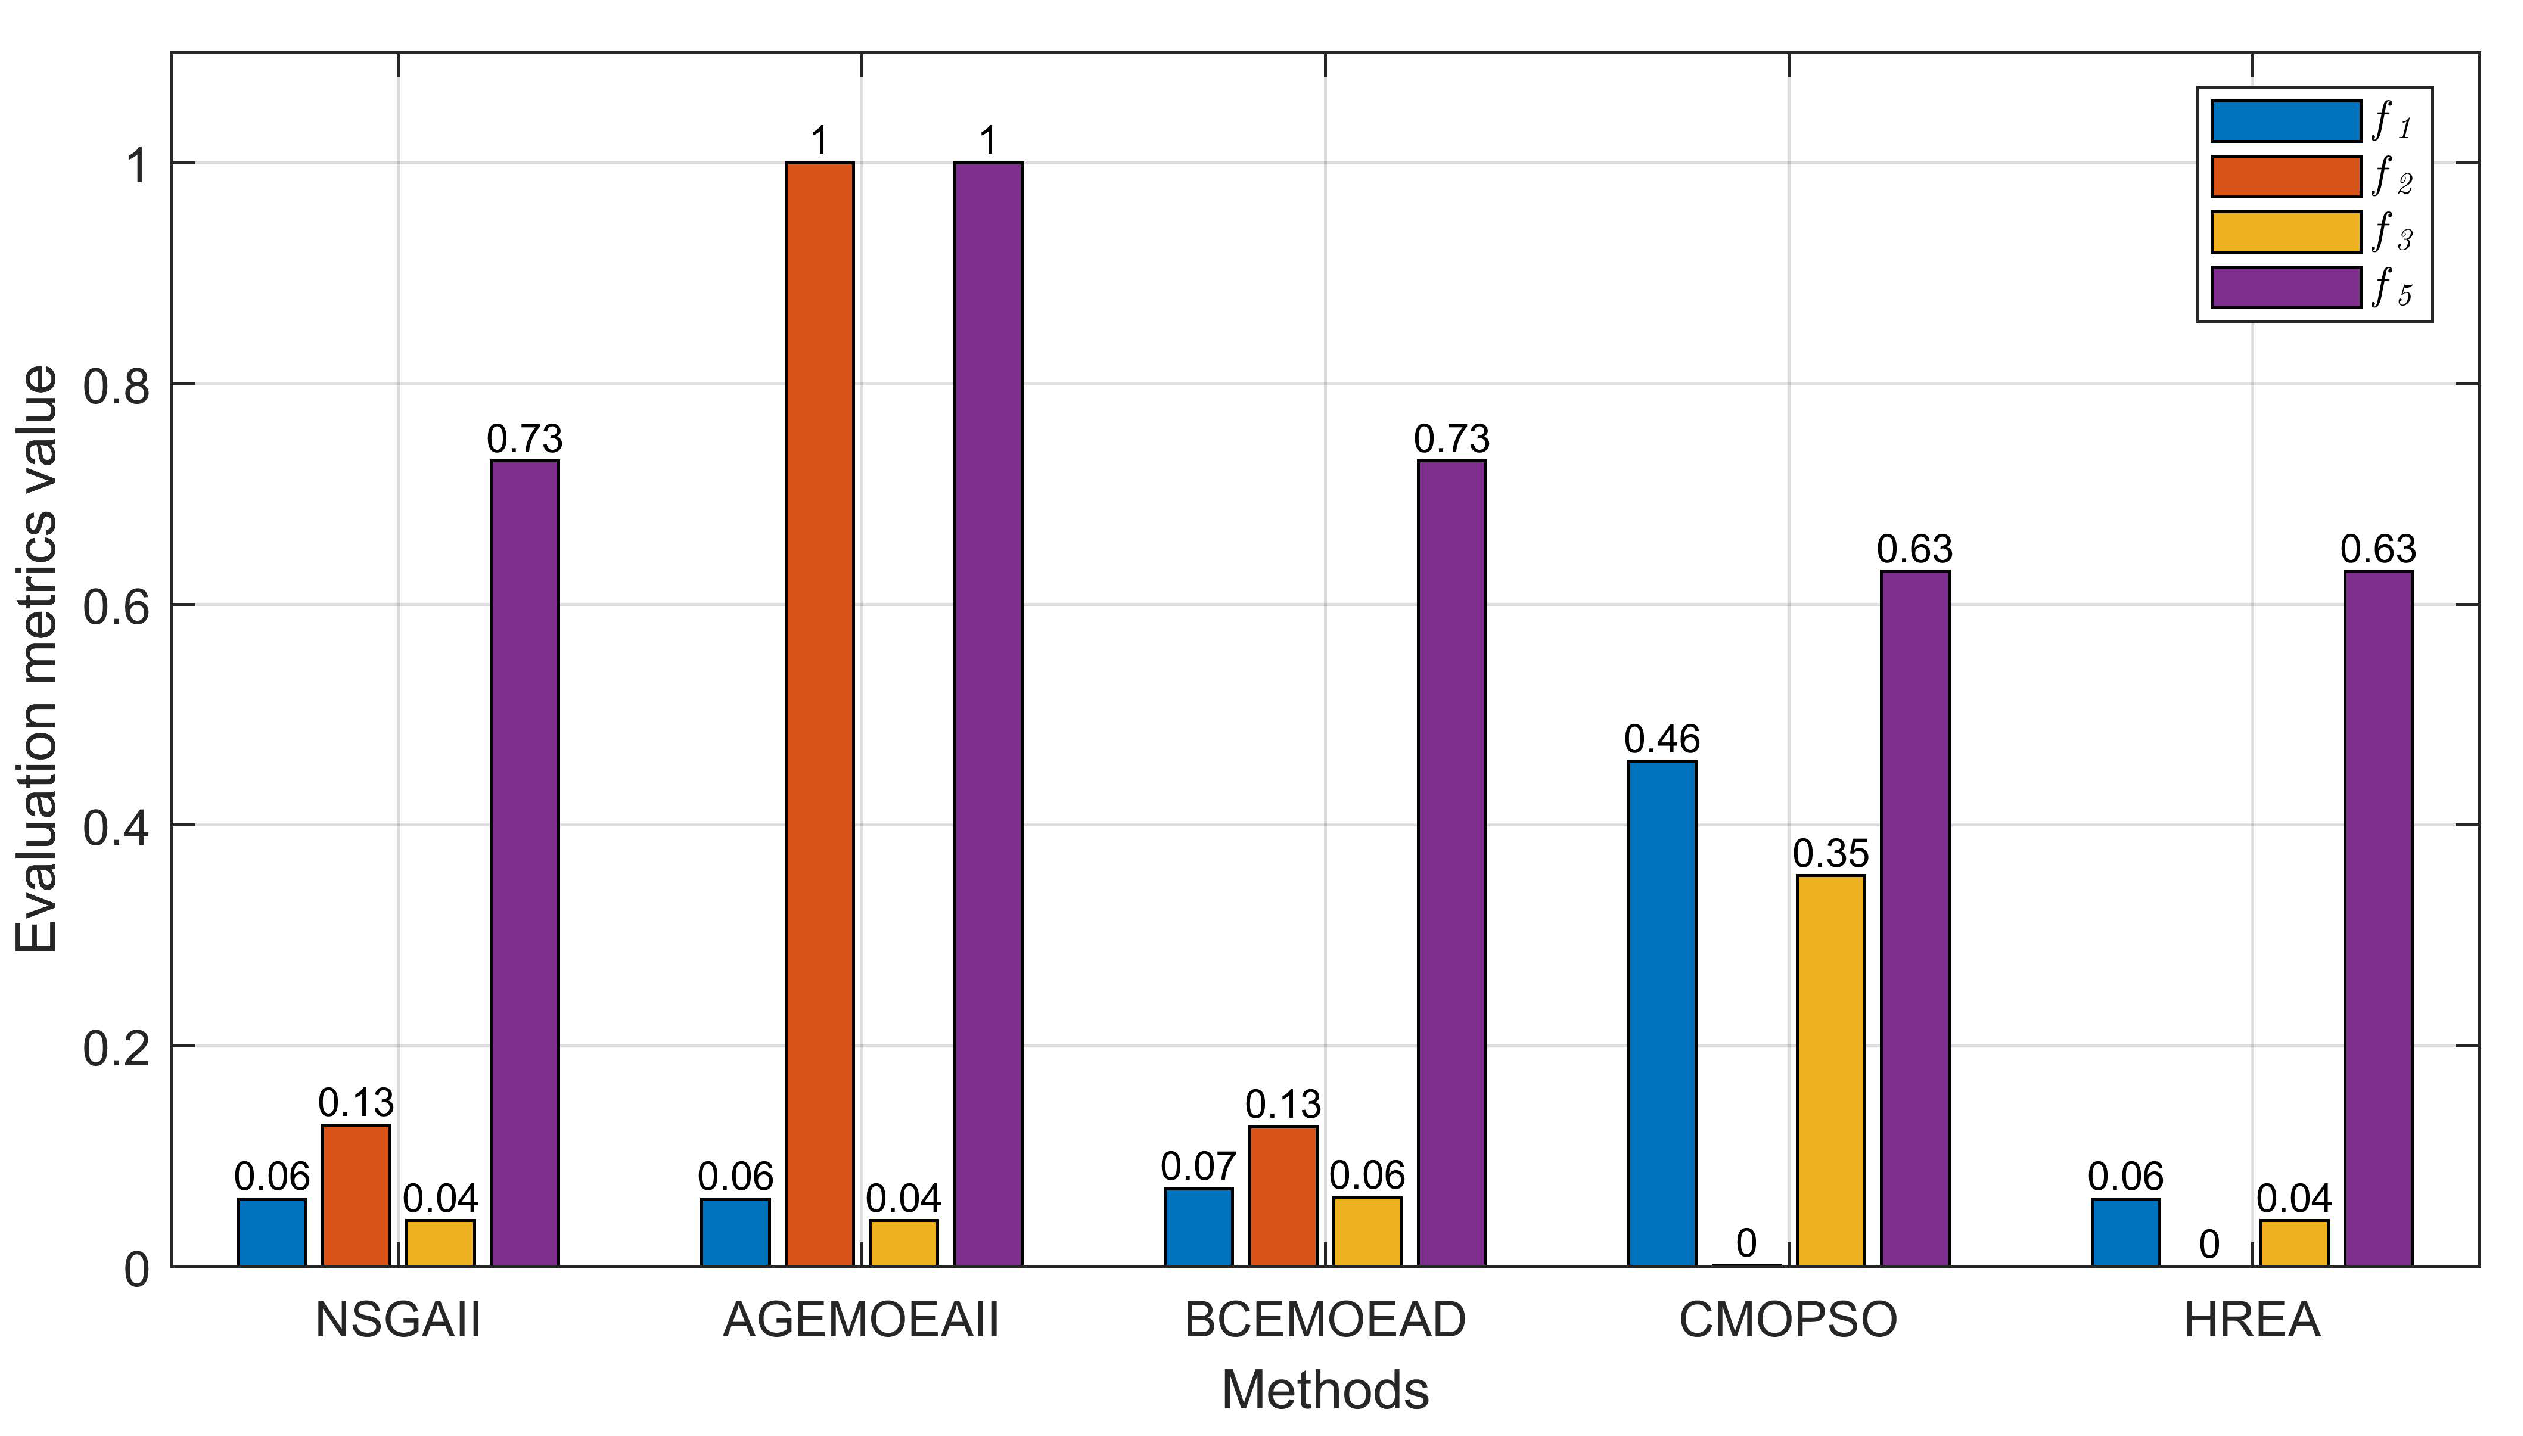
The testing datasets and an anomaly detection dataset with a precise anomaly occurrence time log are used for validating the effectiveness of the proposed OSP method via testing at the retrained classifier model which is trained according to the optimal sensor configurations. The test results in Figure 16 show the superiority of the HREA-based OSP method proposed in this paper. The significant comparison of high diagnosis accuracy is obtained through CMOPSO-based and HREA-based methods using more and fewer sensors, respectively, which further demonstrates that the method presented herein is effective in finding critical sensors for diagnosis purposes. The sensor configurations obtained based on HREA, NSGA-II, and BCE-MOEA/D achieve equivalent results in terms of real-time performance and sensor cost, whereas the HREA-based method achieves better diagnosability. The AGE-MOEA-II-based method fails to seek out an effective sensor configuration, while the NSGA-II-based and BCE-MOEA/D-based methods only yield suboptimal results.
Moreover, the fourth evaluation metric used in this section is the normalized anomaly detection time. It is defined as the difference between the anomaly detection time and the actual anomaly occurrence time (22.38 s) divided by the maximum acceptable anomaly detection time (0.5 s in this paper). The test results in this section obviously illustrate the ability of the OSP method for diagnosis algorithm to optimize the detection time while assuring accuracy, which is also referred to as optimal diagnosability.
5. Conclusions Remarks and Future Works
In summary, an OSP method is proposed to optimize the diagnosability of online diagnosis algorithm in inflight PHM systems for LREs based on hierarchical diagnosability metrics and comprehensive evaluation metrics for PSs. Firstly, a two-stage diagnosis algorithm based on KELMs is proposed for online application and the diagnosability is modeled in hierarchical views while some of the metrics exhibit nonlinear characteristics approaching chaos. Subsequently, we proposed an HREA-based two-stage OSP method which achieved further optimization of PSs by the improved HV indicator. With the help of the channel-wise pruning KELM model, the diagnosability metrics can be calculated for different sensor configurations without retraining the classifier model while optimizing. Finally, the proposed HREA-based OSP method is applied to an LRE failure simulation dataset and a hot-fire test-run experiment dataset while introducing NSGA-II, AGE-MOEA-II, BCE-MOEA/D and CMMOPSO as BMOA to proposed two-stage OSP framework in the sake of comparing. The algorithm testing results show that the HREA-based OSP method outperforms other methods. In a sense of the specificity of the OSP problem described in this paper, HREA considers the multimodal property to achieve better performance in terms of PS diversity. Moreover, the proposed OSP method can balance well the cost of the sensors, real-time performance and diagnosability of the diagnosis method. The proposed method implements system-level OSP for LRE fault diagnosis and shows the potential of using it for developing reusable LREs. Notably, the proposed OSP framework provides a universal approach that is scalable and adaptable to aero-engines or other complex industrial systems by considering system-specific complexities and constraints.
Future works will be conducted as follows. The parameters of the diagnosis algorithm and MOAs in this paper are manually set, which can be subsequently optimized by introducing a crowd intelligence algorithm. Sensor failures can affect the robustness of the fault diagnosis methods, and it is feasible to construct the robustness metric of the diagnostic algorithm through the probability of sensor failures. Ensuring the robustness of inflight fault diagnosis methods for LREs is critical, and it will be followed by further research on the OSP method in conjunction with the robustness of the diagnostic algorithm. Measurement signals acquired from expensive sensors usually have a higher Signal-to-Noise Ratio (SNR), and the effect of the OSP method in combination with the SNR of measurement signals will be considered in our future studies. Different nonlinear constraints in the OSP problem significantly influence the final sensor configuration obtained, and subsequent efforts will focus on incorporating more practical constraints related to the installation of sensors in LREs into the analysis of the OSP problem.
Author Contributions
Conceptualization, Z.Z. (Zhirong Zhong) and M.M.; methodology, Z.Z. (Zhirong Zhong) and M.M.; software, Z.Z. (Zhirong Zhong); validation, Z.Z. (Zhirong Zhong), M.M., Z.Z. (Zhi Zhai) and R.S.; formal analysis, Z.Z. (Zhi Zhai) and R.S.; investigation, Z.Z. (Zhi Zhai) and R.S.; resources, M.M.; data curation, Z.Z. (Zhi Zhai) and R.S.; writing—original draft preparation, Z.Z. (Zhirong Zhong); writing—review and editing, M.M., Z.Z. (Zhi Zhai) and R.S.; visualization, Z.Z. (Zhi Zhai); supervision, M.M., Z.Z. (Zhi Zhai) and R.S.; project administration, M.M. and Z.Z. (Zhi Zhai); funding acquisition, M.M. All authors have read and agreed to the published version of the manuscript.
Funding
This work was supported by the National Natural Science Foundation of China (No. 52205124), the Postdoctoral Science Fund (No. 2021M702634), the Basic Research Program of China (No. 2022-JCJQ-JJ-0643), and the Basic Research Fund of Xi’an Jiaotong University (No. xxj032022011).
Institutional Review Board Statement
Not applicable.
Informed Consent Statement
Not applicable.
Data Availability Statement
The data presented in this study are available on request from the corresponding author. The data are not publicly available due to privacy.
Conflicts of Interest
The authors declare no conflicts of interest.
Abbreviations
The following abbreviations are used in this manuscript:
| LRE | Liquid Rocket Engine |
| PHM | Prognosis and Health Management |
| OSP | Optimal Sensor Placement |
| ATA | Adaptive Threshold Algorithm |
| DTW | Dynamic Time Warping |
| LSTM | Long Short-Term Memory |
| RUL | Remaining Useful Life |
| TDQN | transferable deep Q network |
| DRL | Deep Reinforcement Learning |
| TL | Transfer Learning |
| CAE | Convolutional Autoencoder |
| FIM | Fisher Information Matrix |
| GANs | Generative Adversarial Networks |
| 1D-CNN | one-dimension Convolutional Neural Network |
| KELM | Kernel Extreme Learning Machine |
| HREA | Hierarchy Ranking Evolutionary Algorithm |
| PSs | Pareto Solutions |
| SSME | Space Shuttle Main Engine |
| RBF | Radial Basis Function |
| BMOA | Binary Multi-objective Optimization Algorithm |
| PFs | Pareto Fronts |
| HV | Hypervolume |
| NSGA-II | Non-Dominated Sorting Genetic Algorithm-II |
| AGE-MOEA-II | Adaptive Geometry Estimation based Multi-objective Evolutionary Algorithm-II |
| BCE-MOEA/D | Bi-criterion Evolution in MOEA based on Decomposition |
| CMMOPSO | Competitive Mechanism based Multi-objective Particle Swarm Optimizer |
| SNR | Signal-to-Noise Ratio |
References
- Lin, R.; Yang, J.; Huang, L.; Liu, Z.; Zhou, X.; Zhou, Z. Review of Launch Vehicle Engine PHM Technology and Analysis Methods Research. Aerospace 2023, 10, 517. [Google Scholar] [CrossRef]
- Pérez-Roca, S.; Marzat, J.; Piet-Lahanier, H.; Langlois, N.; Farago, F.; Galeotta, M.; Le Gonidec, S. A survey of automatic control methods for liquid-propellant rocket engines. Prog. Aerosp. Sci. 2019, 107, 63–84. [Google Scholar] [CrossRef]
- Maul, W.A.; Kopasakis, G.; Santi, L.M.; Sowers, T.S.; Chicatelli, A. Sensor selection and optimization for health assessment of aerospace systems. J. Aerosp. Comput. Inf. Commun. 2008, 5, 16–34. [Google Scholar] [CrossRef]
- Deng, L.; Cheng, Y.; Yang, S.; Wu, J.; Shi, Y. Fault detection and diagnosis for liquid rocket engines with sample imbalance based on Wasserstein generative adversarial nets and multilayer perceptron. Proc. Inst. Mech. Eng. Part G J. Aerosp. Eng. 2023, 237, 1751–1763. [Google Scholar] [CrossRef]
- Ma, M.; Sun, C.; Chen, X. Deep coupling autoencoder for fault diagnosis with multimodal sensory data. IEEE Trans. Ind. Inform. 2018, 14, 1137–1145. [Google Scholar] [CrossRef]
- Ma, M.; Mao, Z. Deep-convolution-based LSTM network for remaining useful life prediction. IEEE Trans. Ind. Inform. 2020, 17, 1658–1667. [Google Scholar] [CrossRef]
- Chen, X.; Ma, M.; Zhao, Z.; Zhai, Z.; Mao, Z. Physics-informed deep neural network for bearing prognosis with multisensory signals. J. Dyn. Monit. Diagn. 2022, 1, 200–207. [Google Scholar] [CrossRef]
- Wang, H.; Xu, J.; Yan, R. Intelligent fault diagnosis for planetary gearbox using transferable deep q network under variable conditions with small training data. J. Dyn. Monit. Diagn. 2023, 2, 30–41. [Google Scholar]
- Lee, K.; Cha, J.; Ko, S.; Park, S.Y.; Jung, E. Fault detection and diagnosis algorithms for an open-cycle liquid propellant rocket engine using the Kalman filter and fault factor methods. Acta Astronaut. 2018, 150, 15–27. [Google Scholar] [CrossRef]
- Kawatsu, K. PHM by using multi-physics system-level modeling and simulation for EMAs of liquid rocket engine. In Proceedings of the 2019 IEEE Aerospace Conference, Big Sky, MT, USA, 2–9 March 2019; IEEE: Piscataway, NJ, USA, 2019; pp. 1–10. [Google Scholar]
- Kawatsu, K.; Tsutsumi, S.; Hirabayashi, M.; Sato, D. Model-based fault diagnostics in an electromechanical actuator of reusable liquid rocket engine. In Proceedings of the AIAA Scitech 2020 Forum, Orlando, FL, USA, 6–10 January 2020; p. 1624. [Google Scholar]
- Tsutsumi, S.; Hirabayashi, M.; Sato, D.; Kawatsu, K.; Sato, M.; Kimura, T.; Hashimoto, T.; Abe, M. Data-driven fault detection in a reusable rocket engine using bivariate time-series analysis. Acta Astronaut. 2021, 179, 685–694. [Google Scholar] [CrossRef]
- Deng, L.; Cheng, Y.; Shi, Y. Fault detection and diagnosis for liquid rocket engines based on long short-term memory and generative adversarial networks. Aerospace 2022, 9, 399. [Google Scholar] [CrossRef]
- Zhang, X.; Hua, X.; Zhu, J.; Ma, M. Intelligent Fault Diagnosis of Liquid Rocket Engine via Interpretable LSTM with Multisensory Data. Sensors 2023, 23, 5636. [Google Scholar] [CrossRef]
- Jana, D.; Patil, J.; Herkal, S.; Nagarajaiah, S.; Duenas-Osorio, L. CNN and Convolutional Autoencoder (CAE) based real-time sensor fault detection, localization, and correction. Mech. Syst. Signal Process. 2022, 169, 108723. [Google Scholar] [CrossRef]
- Park, S.Y.; Ahn, J. Deep neural network approach for fault detection and diagnosis during startup transient of liquid-propellant rocket engine. Acta Astronaut. 2020, 177, 714–730. [Google Scholar] [CrossRef]
- Wang, C.; Zhang, Y.; Zhao, Z.; Chen, X.; Hu, J. Dynamic model-assisted transferable network for liquid rocket engine fault diagnosis using limited fault samples. Reliab. Eng. Syst. Saf. 2024, 243, 109837. [Google Scholar] [CrossRef]
- Sun, H.; Cheng, Y.; Jiang, B.; Lu, F.; Wang, N. Anomaly Detection Method for Rocket Engines Based on Convex Optimized Information Fusion. Sensors 2024, 24, 415. [Google Scholar] [CrossRef] [PubMed]
- Mehrjoo, A.; Song, M.; Moaveni, B.; Papadimitriou, C.; Hines, E. Optimal sensor placement for parameter estimation and virtual sensing of strains on an offshore wind turbine considering sensor installation cost. Mech. Syst. Signal Process. 2022, 169, 108787. [Google Scholar] [CrossRef]
- Ercan, T.; Sedehi, O.; Katafygiotis, L.S.; Papadimitriou, C. Information theoretic-based optimal sensor placement for virtual sensing using augmented Kalman filtering. Mech. Syst. Signal Process. 2023, 188, 110031. [Google Scholar] [CrossRef]
- Wang, M.; Incecik, A.; Feng, S.; Gupta, M.; Królczyk, G.; Li, Z. Damage identification of offshore jacket platforms in a digital twin framework considering optimal sensor placement. Reliab. Eng. Syst. Saf. 2023, 237, 109336. [Google Scholar] [CrossRef]
- Kohtz, S.; Zhao, J.; Renteria, A.; Lalwani, A.; Xu, Y.; Zhang, X.; Haran, K.S.; Senesky, D.; Wang, P. Optimal sensor placement for permanent magnet synchronous motor condition monitoring using a digital twin-assisted fault diagnosis approach. Reliab. Eng. Syst. Saf. 2024, 242, 109714. [Google Scholar] [CrossRef]
- Wrobel, M.; Meurer, T. Optimal sensor placement and estimator-based temperature control for a deep drawing process. J. Process Control 2023, 124, 92–104. [Google Scholar] [CrossRef]
- Manohar, K.; Kutz, J.N.; Brunton, S.L. Optimal sensor and actuator selection using balanced model reduction. IEEE Trans. Autom. Control 2021, 67, 2108–2115. [Google Scholar] [CrossRef]
- Inoue, T.; Ikami, T.; Egami, Y.; Nagai, H.; Naganuma, Y.; Kimura, K.; Matsuda, Y. Data-driven optimal sensor placement for high-dimensional system using annealing machine. Mech. Syst. Signal Process. 2023, 188, 109957. [Google Scholar] [CrossRef]
- Yarinezhad, R.; Hashemi, S.N. A sensor deployment approach for target coverage problem in wireless sensor networks. J. Ambient. Intell. Humaniz. Comput. 2023, 14, 5941–5956. [Google Scholar] [CrossRef]
- Taher, S.A.; Li, J.; Fang, H. Simultaneous seismic input and state estimation with optimal sensor placement for building structures using incomplete acceleration measurements. Mech. Syst. Signal Process. 2023, 188, 110047. [Google Scholar] [CrossRef]
- Kim, C.; Oh, H.; Chang Jung, B.; Moon, S.J. Optimal sensor placement to detect ruptures in pipeline systems subject to uncertainty using an Adam-mutated genetic algorithm. Struct. Health Monit. 2022, 21, 2354–2369. [Google Scholar] [CrossRef]
- Kong, X.; Cai, B.; Liu, Y.; Zhu, H.; Liu, Y.; Shao, H.; Yang, C.; Li, H.; Mo, T. Optimal sensor placement methodology of hydraulic control system for fault diagnosis. Mech. Syst. Signal Process. 2022, 174, 109069. [Google Scholar] [CrossRef]
- Karnik, N.; Abdo, M.G.; Perez, C.E.E.; Yoo, J.S.; Cogliati, J.J.; Skifton, R.S.; Calderoni, P.; Brunton, S.L.; Manohar, K. Optimal Sensor Placement with Adaptive Constraints for Nuclear Digital Twins. arXiv 2023, arXiv:2306.13637. [Google Scholar]
- Jiang, J.A.; Wang, J.C.; Wu, H.S.; Lee, C.H.; Chou, C.Y.; Wu, L.C.; Yang, Y.C. A novel sensor placement strategy for an IoT-based power grid monitoring system. IEEE Internet Things J. 2020, 7, 7773–7782. [Google Scholar] [CrossRef]
- Zhong, Z.; Jiang, H.; Zuo, H. An optimization method of electrostatic sensor array based on Kriging surrogate model and improved non-dominated sorting genetic algorithm with elite strategy algorithm. Proc. Inst. Mech. Eng. Part G J. Aerosp. Eng. 2023, 238, 198–210. [Google Scholar] [CrossRef]
- Papadimitriou, C. Optimal sensor placement methodology for parametric identification of structural systems. J. Sound Vib. 2004, 278, 923–947. [Google Scholar] [CrossRef]
- Udwadia, F.E. Methodology for optimum sensor locations for parameter identification in dynamic systems. J. Eng. Mech. 1994, 120, 368–390. [Google Scholar] [CrossRef]
- Jana, D.; Mukhopadhyay, S.; Ray-Chaudhuri, S. Fisher information-based optimal input locations for modal identification. J. Sound Vib. 2019, 459, 114833. [Google Scholar] [CrossRef]
- Omata, N.; Satoh, D.; Tsutsumi, S.; Kawatsu, K.; Abe, M. Model-based supervised sensor placement optimization to detect propellant leak in a liquid rocket engine. Acta Astronaut. 2022, 195, 234–242. [Google Scholar] [CrossRef]
- Yang, C.; Xia, Y. A novel two-step strategy of non-probabilistic multi-objective optimization for load-dependent sensor placement with interval uncertainties. Mech. Syst. Signal Process. 2022, 176, 109173. [Google Scholar] [CrossRef]
- Li, B.; Zhao, Y.P.; Wu, H.; Tan, H.J. Optimal sensor placement using data-driven sparse learning method with application to pattern classification of hypersonic inlet. Mech. Syst. Signal Process. 2021, 147, 107110. [Google Scholar] [CrossRef]
- Huang, G.B. An insight into extreme learning machines: Random neurons, random features and kernels. Cogn. Comput. 2014, 6, 376–390. [Google Scholar] [CrossRef]
- Li, W.; Yao, X.; Zhang, T.; Wang, R.; Wang, L. Hierarchy ranking method for multimodal multiobjective optimization with local Pareto fronts. IEEE Trans. Evol. Comput. 2022, 27, 98–110. [Google Scholar] [CrossRef]
- de la Fuente, D.; Vega-Rodríguez, M.A.; Pérez, C.J. Automatic selection of a single solution from the Pareto front to identify key players in social networks. Knowl. Based Syst. 2018, 160, 228–236. [Google Scholar] [CrossRef]
- Deb, K.; Pratap, A.; Agarwal, S.; Meyarivan, T. A fast and elitist multiobjective genetic algorithm: NSGA-II. IEEE Trans. Evol. Comput. 2002, 6, 182–197. [Google Scholar] [CrossRef]
- Panichella, A. An improved Pareto front modeling algorithm for large-scale many-objective optimization. In Proceedings of the Genetic and Evolutionary Computation Conference (GECCO 2022), Boston, MA, USA, 9–13 July 2022; pp. 565–573. [Google Scholar]
- Li, M.; Yang, S.; Liu, X. Pareto or non-Pareto: Bi-criterion evolution in multiobjective optimization. IEEE Trans. Evol. Comput. 2015, 20, 645–665. [Google Scholar] [CrossRef]
- Gu, Q.; Liu, Y.; Chen, L.; Xiong, N. An improved competitive particle swarm optimization for many-objective optimization problems. Expert Syst. Appl. 2022, 189, 116118. [Google Scholar] [CrossRef]
- Zhang, X.; Zheng, X.; Cheng, R.; Qiu, J.; Jin, Y. A competitive mechanism based multi-objective particle swarm optimizer with fast convergence. Inf. Sci. 2018, 427, 63–76. [Google Scholar] [CrossRef]
Figure 1.
The overall procedure of the proposed OSP method.

Figure 2.
Schematic of system-level failure simulation model of LRE [14]. The full name of all the abbreviations are as follows: Liquid Hydrogen (LH2), Low-pressure Fuel Pump (LPFP), High-pressure Fuel Pump (HPFP), Fuel Pump Turbine (FPT), High-pressure Fuel Turbine (HPFT), Main Fuel Valve (MFV), Chamber Coolant Valve (CCV), Fuel Pre-burner (FPB), Fuel Pre-burner Oxidizer Valve (FPOV), Main Combustion Chamber (MCC), Liquid Propellant Nozzle (LPN), Oxidizer Pre-burner Oxidizer Valve (OPOV), Oxidizer Pre-burner (FPB), Main Oxidizer Valve (MOV), Oxidizer Pump Turbine (OPT), High-pressure Oxidizer Turbine (HPFT), Low-pressure Oxidizer Pump (LPOP), High-pressure Oxidizer Pump (HPOP), Liquid Oxygen (LO2).

Figure 3.
Flowchart of the two-stage fault diagnosis algorithm.

Figure 4.
Flowchart of the two-stage OSP method.

Figure 5.
Simulated results of parameters under (a) normal state and (b) leakage state.

Figure 6.
Evaluation result of objective function (a) , (b) , and (c) .

Figure 7.
The structure of a LOX/Kerosene LRE [13]. The description of numbered items is as follows: 1—fuel pre-pressure turbine pump; 2—oxidizer pre-pressure turbine pump; 3—gas generator; 4—main turbine; 5—oxidizer pump; 6—fuel primary pump; 7—fuel secondary pump; 8—combustion chamber; 9—throttle valve; 10—flow regulator; 11—starting box; 12—ignition duct.

Figure 8.
The process of dataset construction and online fault detection.

Figure 9.
The normalized signals.

Figure 10.
Evaluation result of objective function (a) and (b) .

Figure 11.
PF in (a) x-y-z view, (b) u-x-y view, (c) x-y view, (d) y-z view, (e) x-z view and (f) x-u view in the simulated datasets.
Figure 11.
PF in (a) x-y-z view, (b) u-x-y view, (c) x-y view, (d) y-z view, (e) x-z view and (f) x-u view in the simulated datasets.

Figure 12.
HV values of PSs in the simulated datasets.

Figure 13.
The test results of the simulated datasets.

Figure 14.
PF in (a) u-x-y view, (b) x-y view, (c) x-u view and (d) y-u view on the experimental datasets.
Figure 14.
PF in (a) u-x-y view, (b) x-y view, (c) x-u view and (d) y-u view on the experimental datasets.


Figure 15.
HV values of PSs on the experimental datasets.

Figure 16.
The test results of the experimental datasets.


Table 1.
Sensors for diagnosis.
| Sensor No. | Sensor Label | Price Per Sensor (Chinese Yuan) | Description |
|---|---|---|---|
| 1 | Pc | 10,000 | Main combustion chamber pressure |
| 2 | Tc | 10,000 | Main combustion chamber temperature |
| 3 | Qhoc | 3750 | Main combustion chamber fuel/oxidizer mixture flow |
| 4 | Qfc | 6500 | Main combustion chamber fuel flow |
| 5 | Qoc | 7500 | Main combustion chamber oxidizer flow |
| 6 | fpbPc | 10,000 | Fuel preburner pressure |
| 7 | fpbTc | 3000 | Fuel preburner temperature |
| 8 | fpbQfc | 2000 | Fuel preburner chamber fuel flow |
| 9 | fpbQoc | 4000 | Fuel preburner chamber oxidizer flow |
| 10 | opbPc | 8000 | Oxidizer preburner pressure |
| 11 | opbTc | 7500 | Oxidizer preburner temperature |
| 12 | opbQfc | 7500 | Oxidizer preburner chamber fuel flow |
| 13 | opbQoc | 5000 | Oxidizer preburner chamber oxidizer flow |
| 14 | lpftpPo | 1750 | Low-pressure fuel turbopump outlet pressure |
| 15 | lpftpN | 1750 | Low-pressure fuel turbopump speed |
| 16 | lpftpQ | 6500 | Low-pressure fuel turbopump outlet flow |
| 17 | hpftpPo | 6500 | High-pressure fuel turbopump outlet pressure |
| 18 | hpftpN | 7500 | High-pressure fuel turbopump speed |
| 19 | hpftpQ | 5000 | High-pressure fuel turbopump outlet flow |
| 20 | lpotpPo | 1500 | Low-pressure oxidizer turbopump outlet pressure |
| 21 | lpotpN | 3000 | Low-pressure oxidizer turbopump speed |
| 22 | lpotpQ | 7000 | Low-pressure oxidizer turbopump outlet flow |
| 23 | hpotpPo | 7000 | High-pressure oxidizer turbopump outlet pressure |
| 24 | hpotpN | 6500 | High-pressure oxidizer turbopump speed |
| 25 | hpotpQ | 3000 | High-pressure oxidizer turbopump outlet flow |
| 26 | cjP | 1750 | Cooling jacket pressure |
| 27 | ncP | 10,000 | Main combustion cooling pressure |
| 28 | pfsP | 6500 | Preburner fuel supply pressure |
Table 2.
Parameters of BMOAs.
| Algorithms | Parameters |
|---|---|
| NSGA-II | Population size is 1000, maximum generations are 5600, crossover fraction is 0.5, migration fraction is 0.2 and Pareto fraction is 0.1. |
| AGE-MOEA-II | Population size is 1000, maximum generations are 5600, crossover fraction is 0.5 and uniform mutation fraction rate is 0.01. |
| BCE-MOEA/D | Population size is 1000, maximum generations are 5600, the size of neighborhood is 100, the probability of parent individuals selected from the neighborhood is 0.9 and the maximum number of replaced individuals is 10. |
| CMMOPSO | Population size is 1000, maximum generations are 5600 and parameter is 10. |
Table 3.
Sensors for diagnosis of a LOX/Kerosene LRE.
| Sensor No. | Sensor Label | Price Per Sensor (Chinese Yuan) | Description |
|---|---|---|---|
| 1 | P1 | 1750 | Unknown |
| 2 | P2 | 10,000 | Oxidizer inlet pressure |
| 3 | P3 | 1750 | Unknown |
| 4 | P4 | 10,000 | Fuel solenoid valve outlet pressure |
| 5 | P5 | 10,000 | Fuel pressure before generator injector |
| 6 | P6 | 1750 | Unknown |
| 7 | P7 | 1750 | Unknown |
| 8 | P8 | 1750 | Unknown |
| 9 | P9 | 10,000 | Fuel primary pump outlet pressure 2 |
| 10 | P10 | 1750 | Unknown |
| 11 | P11 | 10,000 | Fuel pressure before Main combustion chamber injector |
| 12 | P12 | 1750 | Unknown |
| 13 | P13 | 1750 | Unknown |
| 14 | P14 | 1750 | Unknown |
| 15 | P15 | 1750 | Unknown |
| 16 | P16 | 1750 | Unknown |
| 17 | P17 | 10,000 | Fuel primary pump outlet pressure 1 |
| 18 | P18 | 1750 | Unknown |
| 19 | P19 | 1750 | Unknown |
| 20 | P20 | 1750 | Unknown |
| 21 | P21 | 1750 | Unknown |
| 22 | P22 | 1750 | Unknown |
| 23 | P23 | 10,000 | Oxidizer pump inlet pressure |
| 24 | P24 | 1750 | Unknown |
| 25 | P25 | 1750 | Unknown |
| 26 | P26 | 1750 | Unknown |
| 27 | P27 | 1750 | Unknown |
| 28 | S1 | 1750 | Unknown |
| 29 | S2 | 1750 | Unknown |
| 30 | S3 | 1750 | Unknown |
| 31 | P28 | 10,000 | Oxidizer pre-compressed pump gas mixing chamber pressure 2 |
| 32 | P29 | 1750 | Unknown |
| 33 | P30 | 1750 | Unknown |
| 34 | P31 | 1750 | Unknown |
| 35 | P32 | 10,000 | Oxidizer pre-compressed pump oxygen mixing chamber pressure |
| 36 | P33 | 1750 | Unknown |
| 37 | P34 | 1750 | Unknown |
| 38 | P35 | 1750 | Unknown |
| 39 | P36 | 1750 | Unknown |
| 40 | P37 | 1750 | Unknown |
| 41 | P38 | 1750 | Unknown |
| 42 | P39 | 1750 | Unknown |
| 43 | P40 | 10,000 | Oxidizer pump outlet pressure |
| 44 | P41 | 1750 | Unknown |
| 45 | P42 | 1750 | Unknown |
| 46 | P43 | 10,000 | Oxidizer pre-compressed pump gas mixing chamber pressure 1 |
| 47 | P44 | 10,000 | Oxidizer pump cooling bearing reflux tube pressure |
| 48 | P45 | 10,000 | Oxidizer pump cooling bearing reflux tube pressure 1 |
Table 4.
OSP results of the simulated datasets.
| Methods | Sensors Number | Sensor Configuration |
|---|---|---|
| NSGA-II | 4 | 1, 2, 15, 25 |
| AGE-MOEA-II | 10 | 1, 2, 3, 8, 14, 15, 19, 21, 23, 26 |
| BCE-MOEA/D | 8 | 1, 2, 7, 9, 15, 21, 26, 28 |
| CMOPSO | 9 | 2, 5, 12, 15, 16, 18, 22, 25, 26 |
| HREA | 9 | 1, 2, 3, 9, 10, 15, 19, 22, 23 |
Table 5.
OSP results of the experimental datasets.
| Methods | Sensors Number | Sensor Configuration |
|---|---|---|
| NSGA-II | 2 | 31, 32 |
| AGE-MOEA-II | 2 | 5, 12 |
| BCE-MOEA/D | 3 | 10, 31, 32 |
| CMOPSO | 17 | 2, 3, 5, 7, 11, 12, 15, 17, 21, 22, 24, 38, 39, 42, 43, 47, 48 |
| HREA | 2 | 17, 33 |
Disclaimer/Publisher’s Note: The statements, opinions and data contained in all publications are solely those of the individual author(s) and contributor(s) and not of MDPI and/or the editor(s). MDPI and/or the editor(s) disclaim responsibility for any injury to people or property resulting from any ideas, methods, instructions or products referred to in the content. |
© 2024 by the authors. Licensee MDPI, Basel, Switzerland. This article is an open access article distributed under the terms and conditions of the Creative Commons Attribution (CC BY) license (https://creativecommons.org/licenses/by/4.0/).
Share and Cite
MDPI and ACS Style
Ma, M.; Zhong, Z.; Zhai, Z.; Sun, R. A Novel Optimal Sensor Placement Method for Optimizing the Diagnosability of Liquid Rocket Engine. Aerospace 2024, 11, 239. https://doi.org/10.3390/aerospace11030239
AMA Style
Ma M, Zhong Z, Zhai Z, Sun R. A Novel Optimal Sensor Placement Method for Optimizing the Diagnosability of Liquid Rocket Engine. Aerospace. 2024; 11(3):239. https://doi.org/10.3390/aerospace11030239
Chicago/Turabian StyleMa, Meng, Zhirong Zhong, Zhi Zhai, and Ruobin Sun. 2024. "A Novel Optimal Sensor Placement Method for Optimizing the Diagnosability of Liquid Rocket Engine" Aerospace 11, no. 3: 239. https://doi.org/10.3390/aerospace11030239
Note that from the first issue of 2016, this journal uses article numbers instead of page numbers. See further details here.