
A Resilient Approach to a Test Rig Setup in the Qualification of a Tilt Rotor Carbon Fiber-Reinforced Polymer (CFRP) Wing
 and
and
Abstract
:1. Introduction
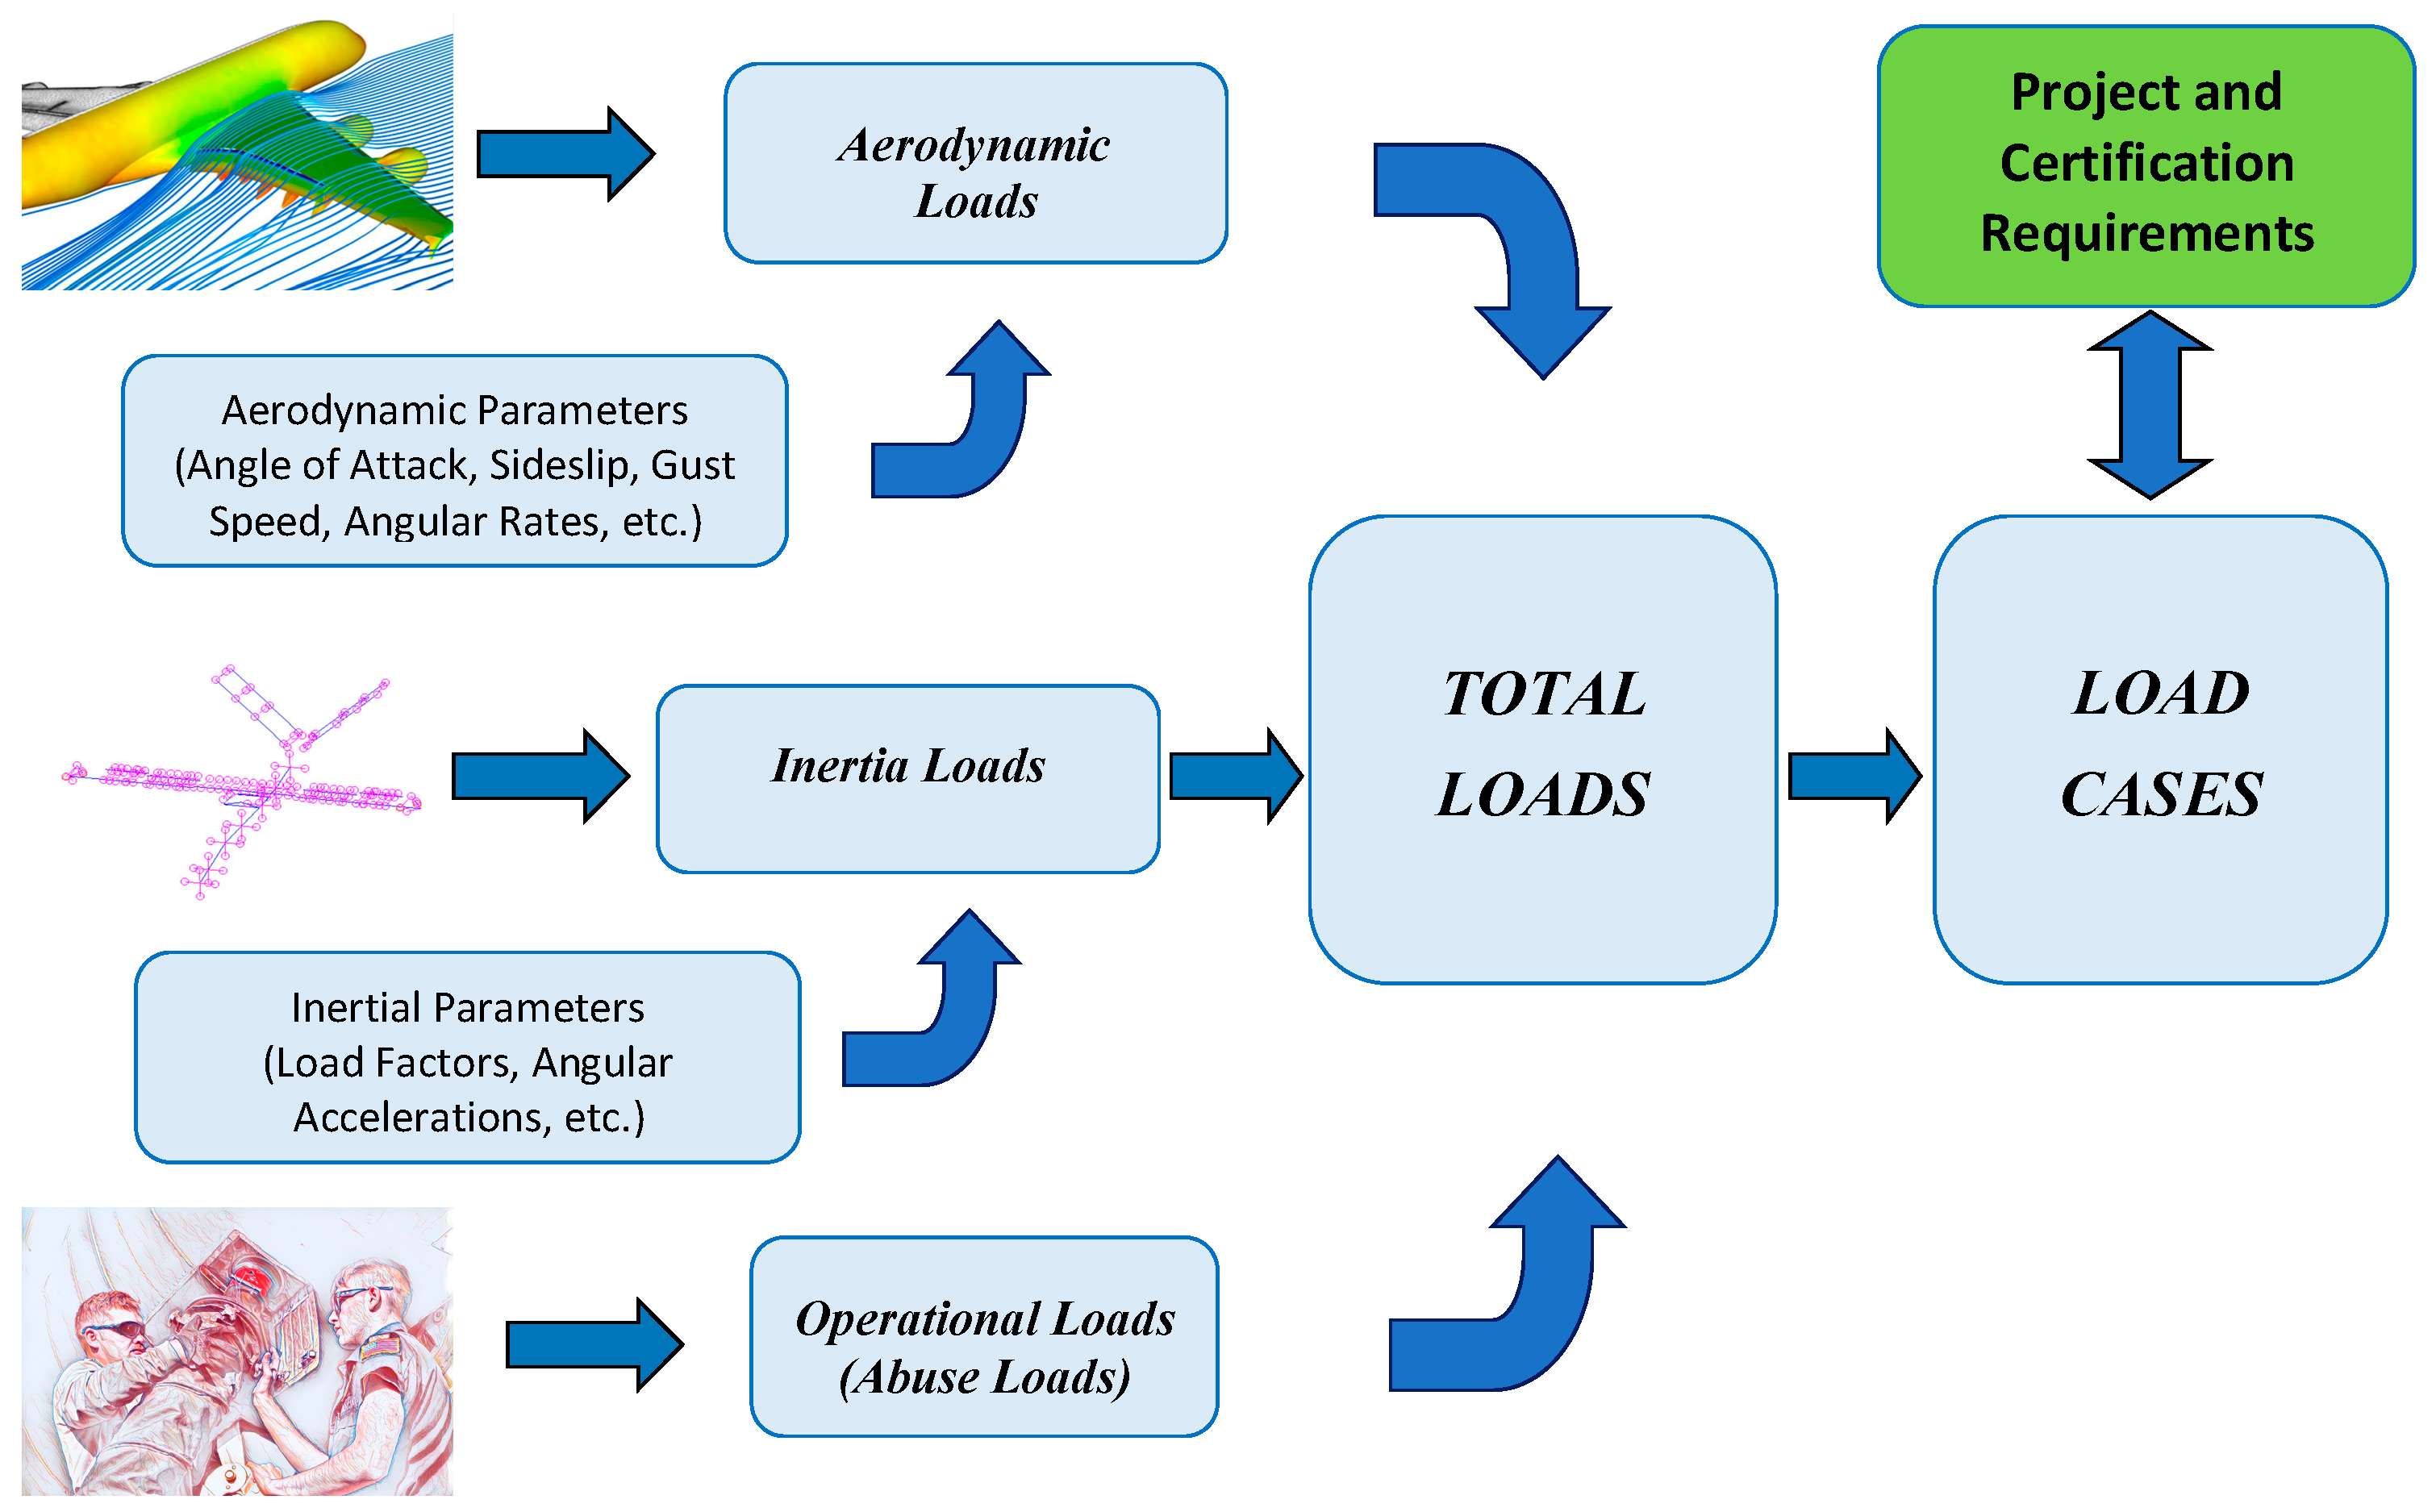
2. Loading Conditions
- Aerodynamic loads, abbreviated as “airloads”, arise from forces and moments induced by the dynamic pressure acting on an aircraft. These loads encompass forces like the wing lift and drag, as well as moments such as the wing torsion and bending. Their intensity is influenced by the aircraft’s weight, load factor, geometry, and dynamic pressure. The overall magnitude adheres to requirements established by aviation authorities, exemplified by regulations like the 14 CFR Part 23 and 25. However, local values are contingent on the specific geometry.
- Inertia loads arise from the forces and moments experienced by aircraft components due to acceleration. Take the fuel or battery, for instance, which are not influenced by aerodynamic loads but require a support structure capable of withstanding the forces resulting from applied load factors. On the other hand, certain components, like a propeller engine, undergo both aerodynamic and inertia loads simultaneously.
- Operational loads encompass forces distinct from aerodynamics and inertia, arising from the inherent usage of the airplane. Examples of these loads include the forces on the door hinges and locks, floor loading, wing step-on forces, and similar factors.
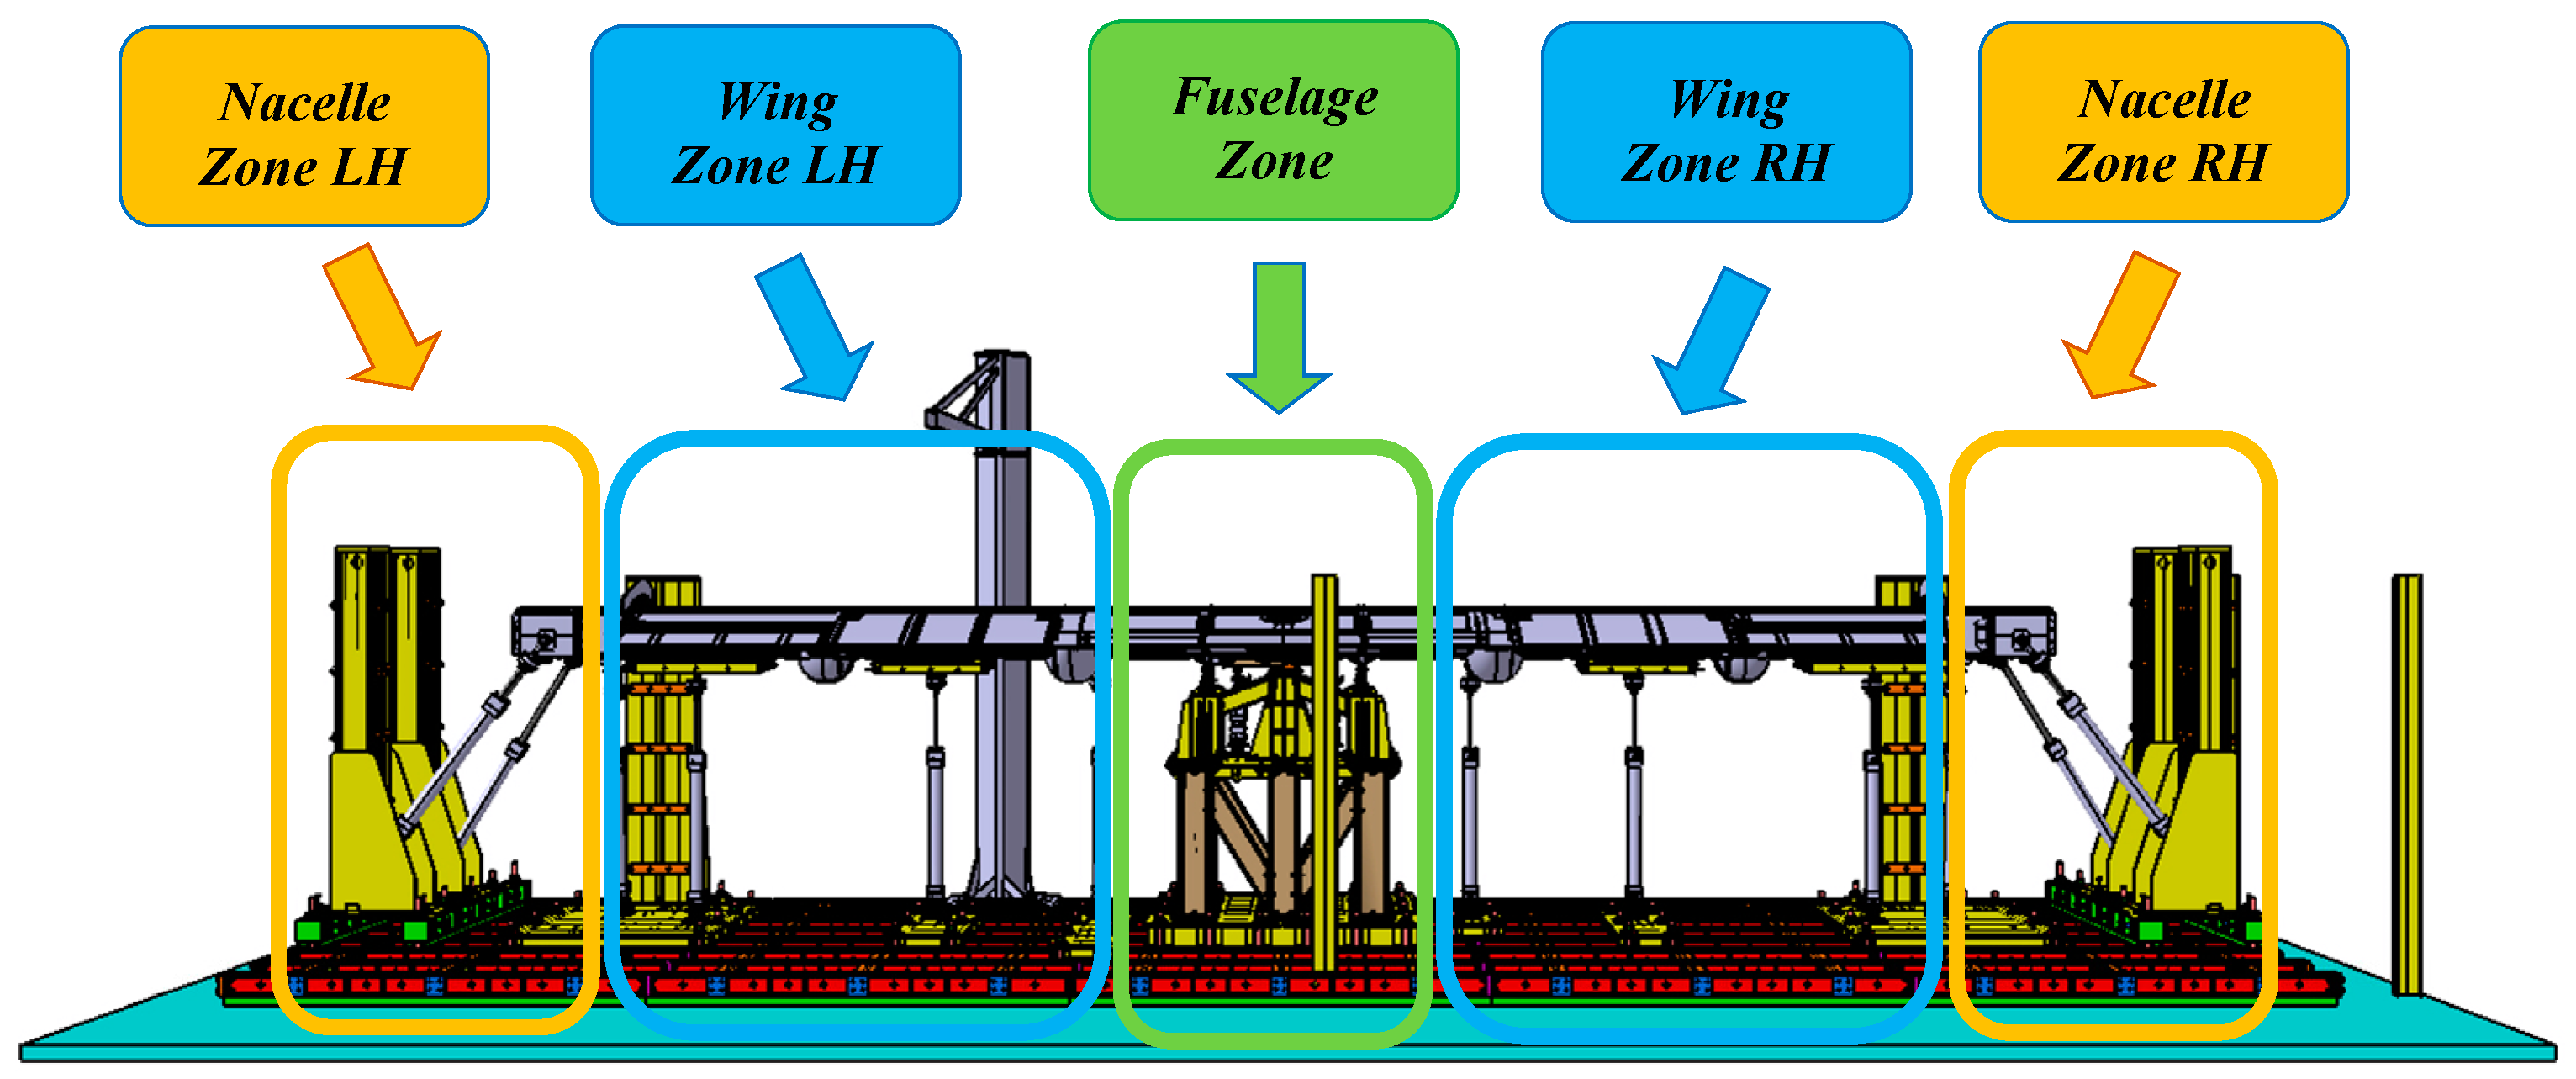
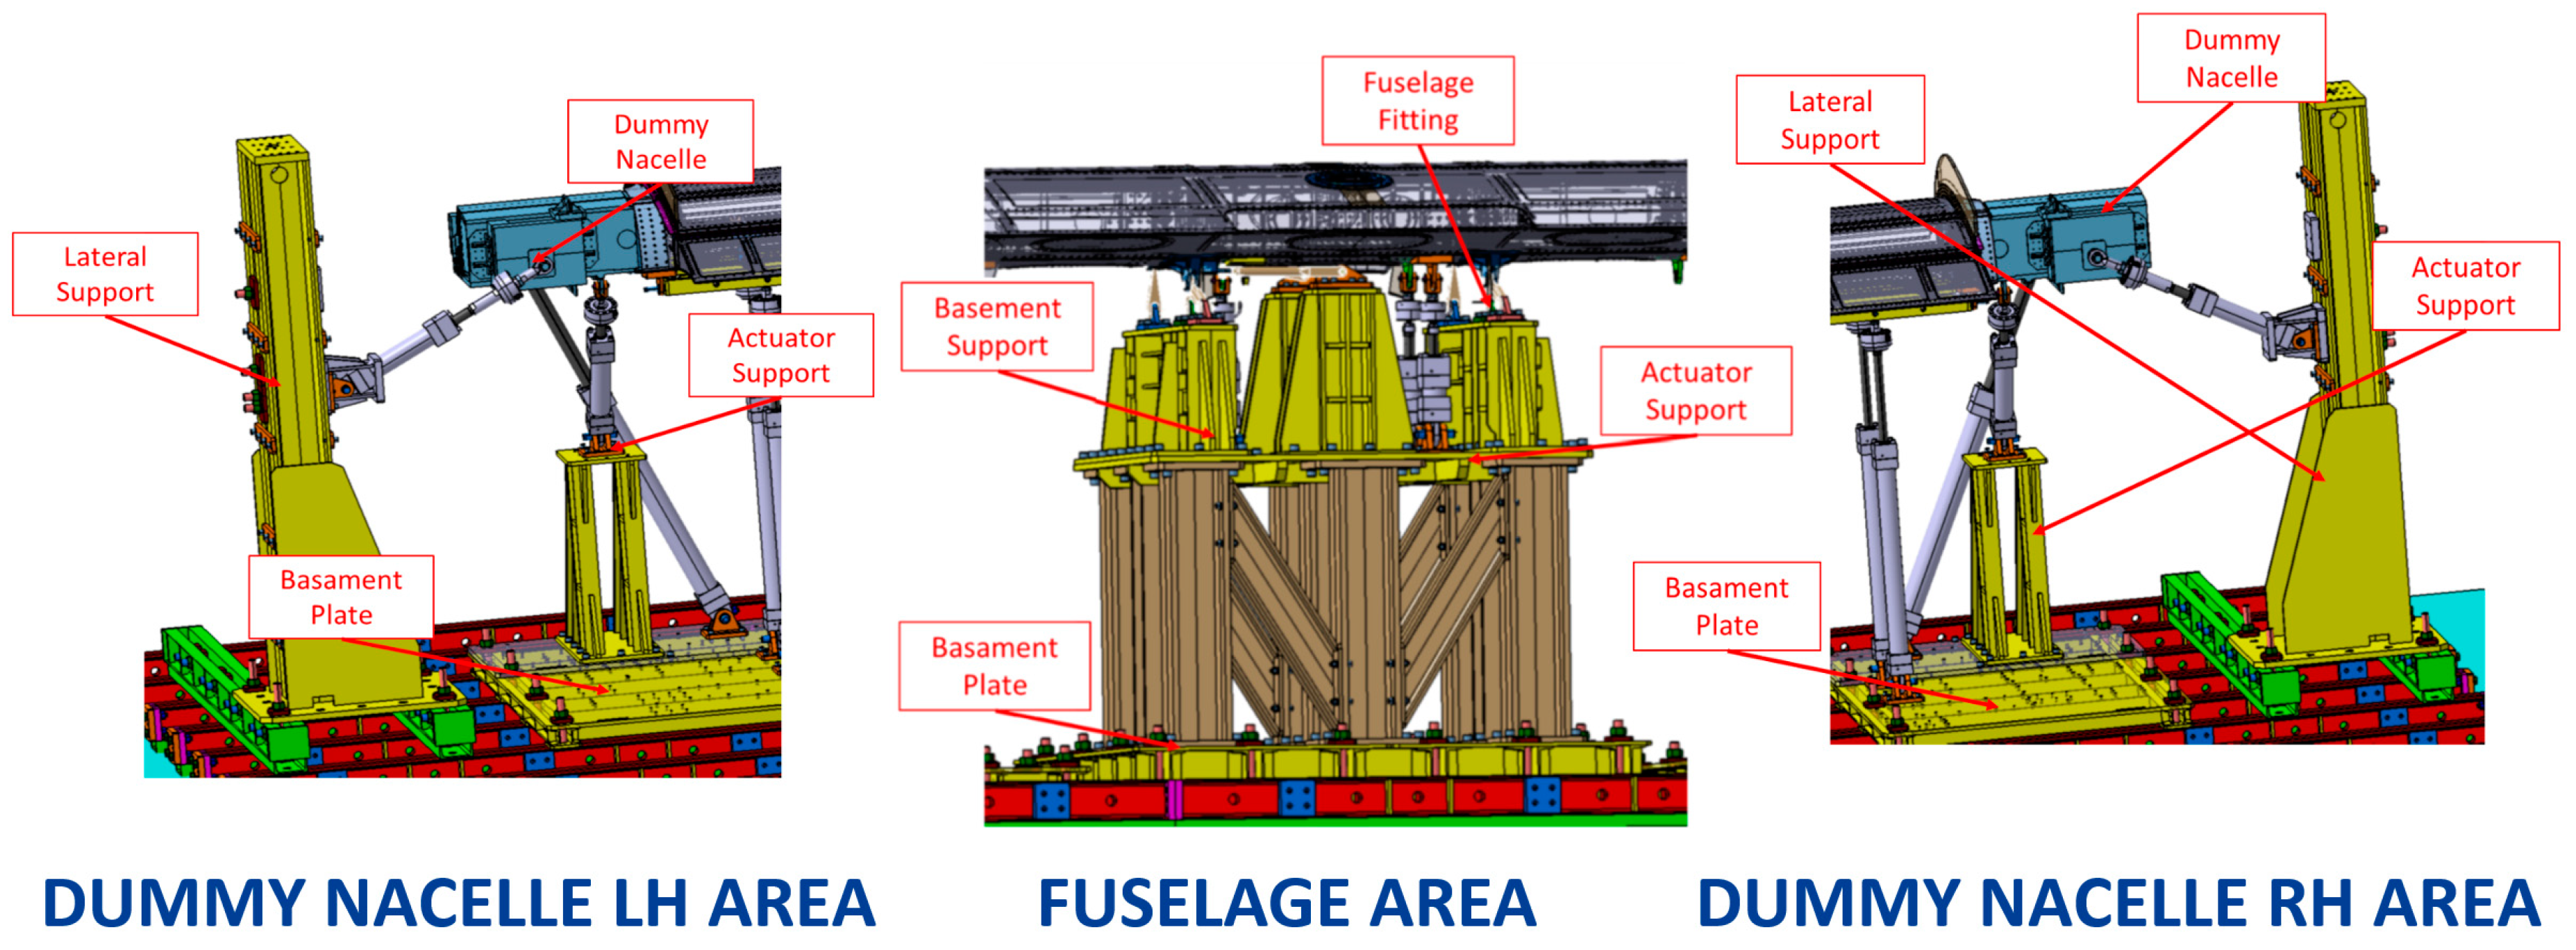
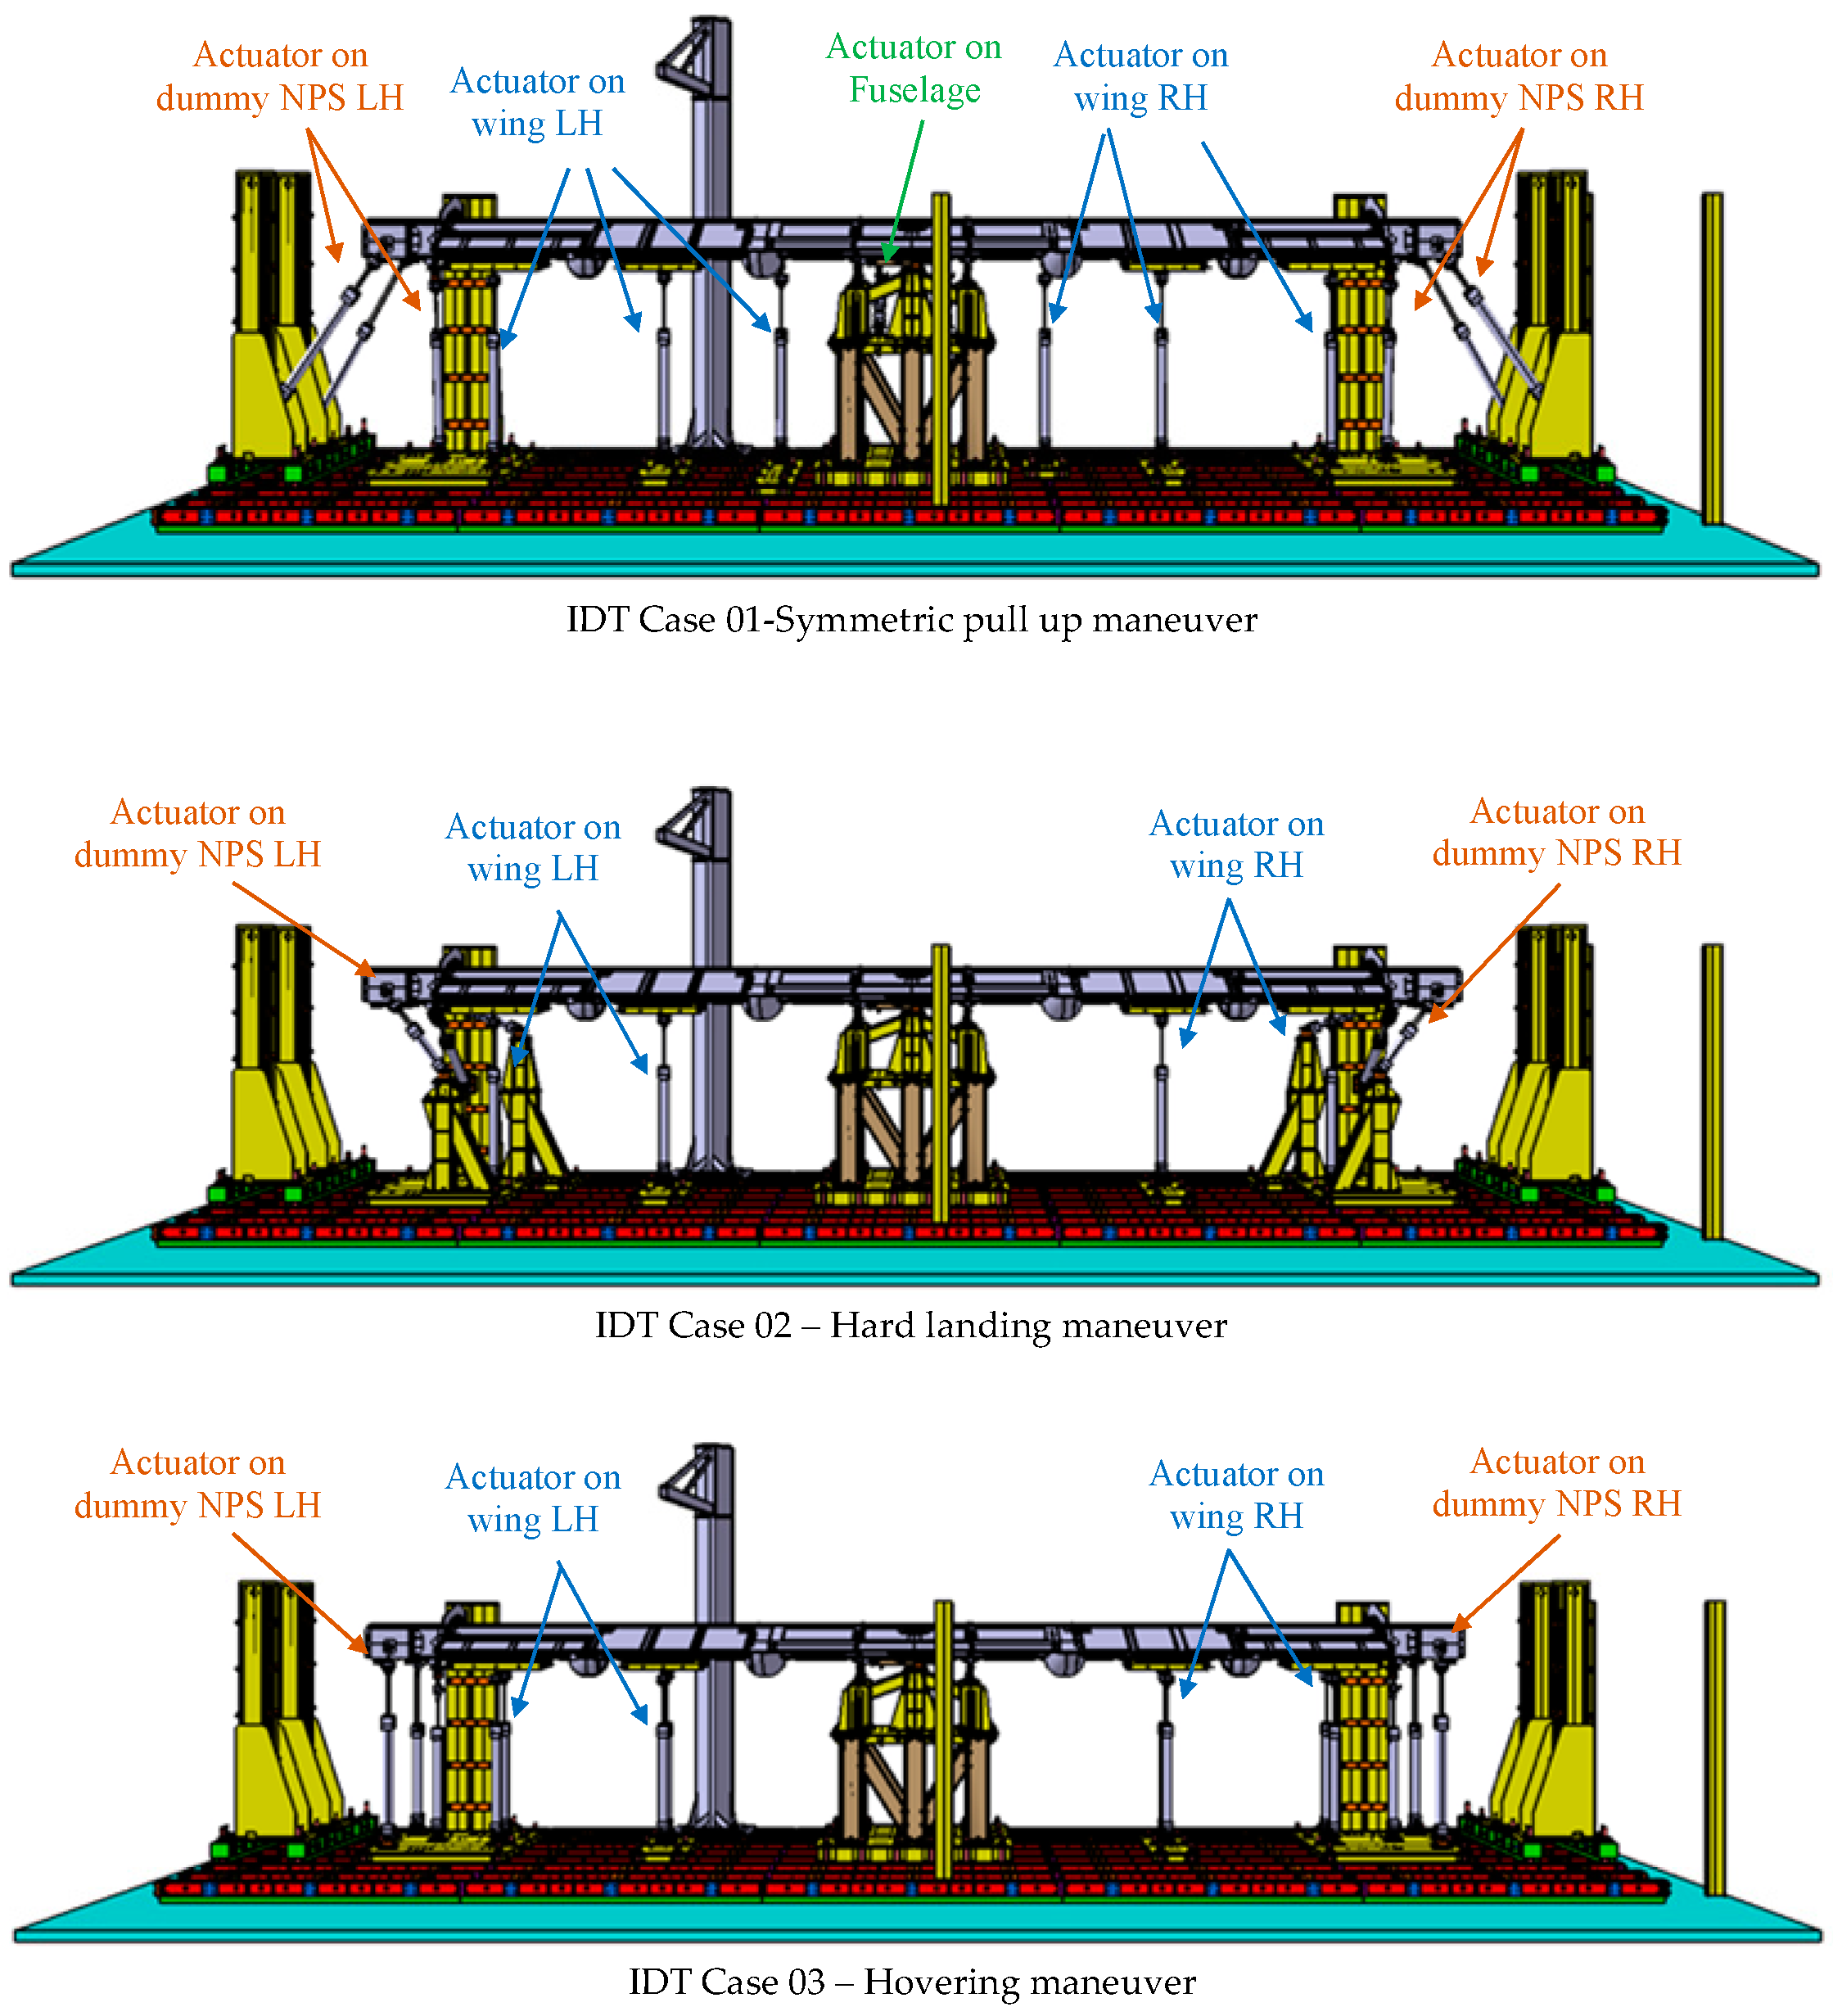
3. Geometrical Constraints
- Nacelle Zone LH (left side of the aircraft)
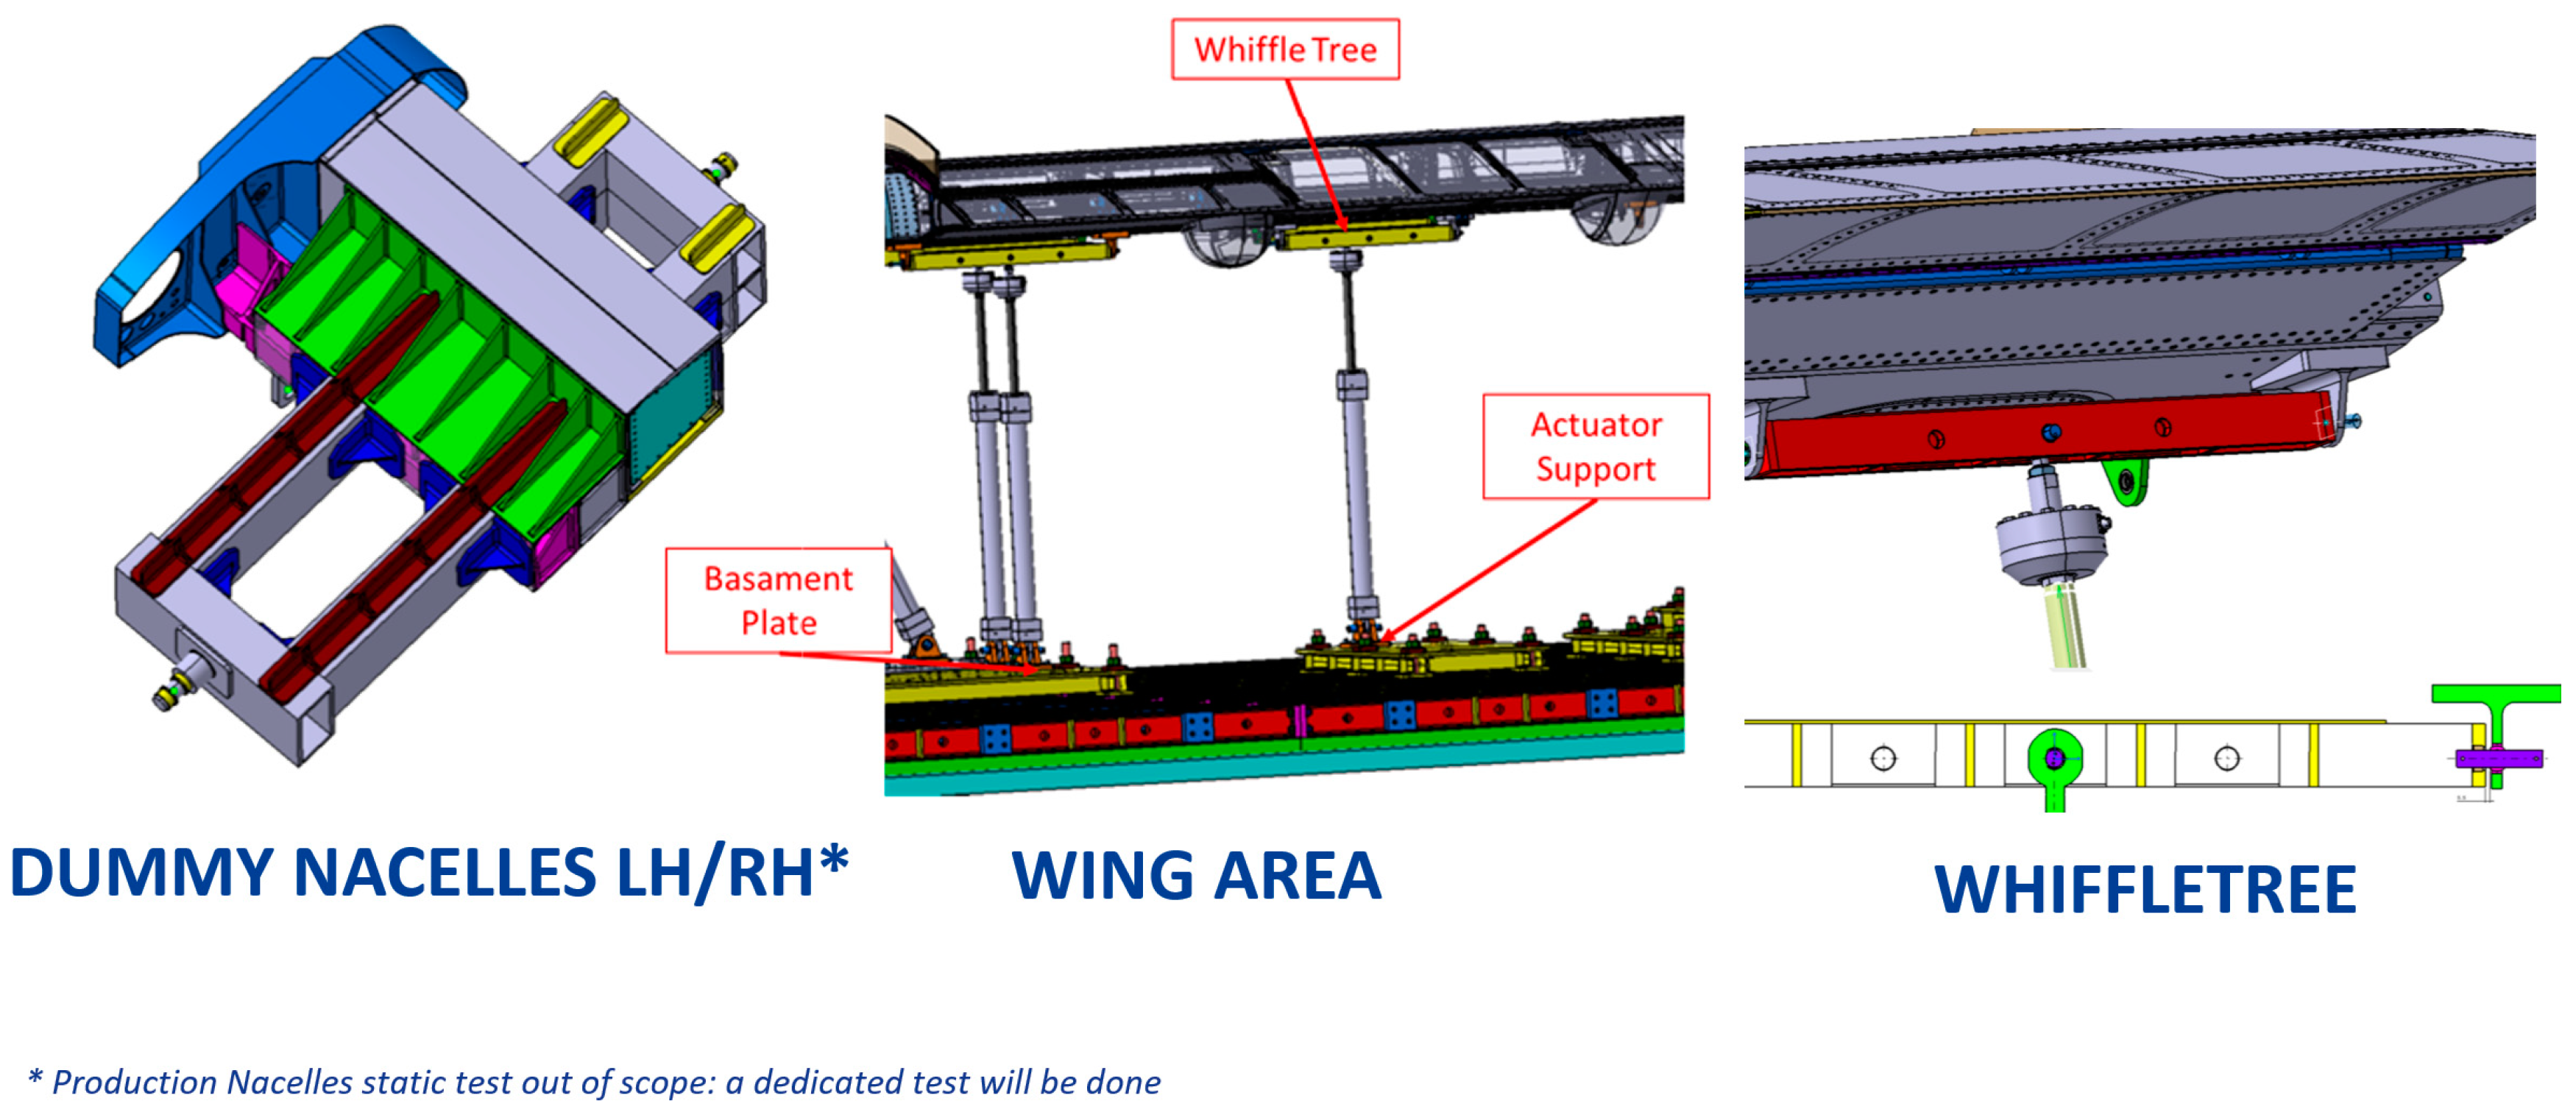
- Wing Zone LH (left side of the aircraft
- Fuselage Zone
- Wing Zone RH (right side of the aircraft)
- Nacelle Zone RH (right side of the aircraft)
4. Optimization of Test Rig Setup
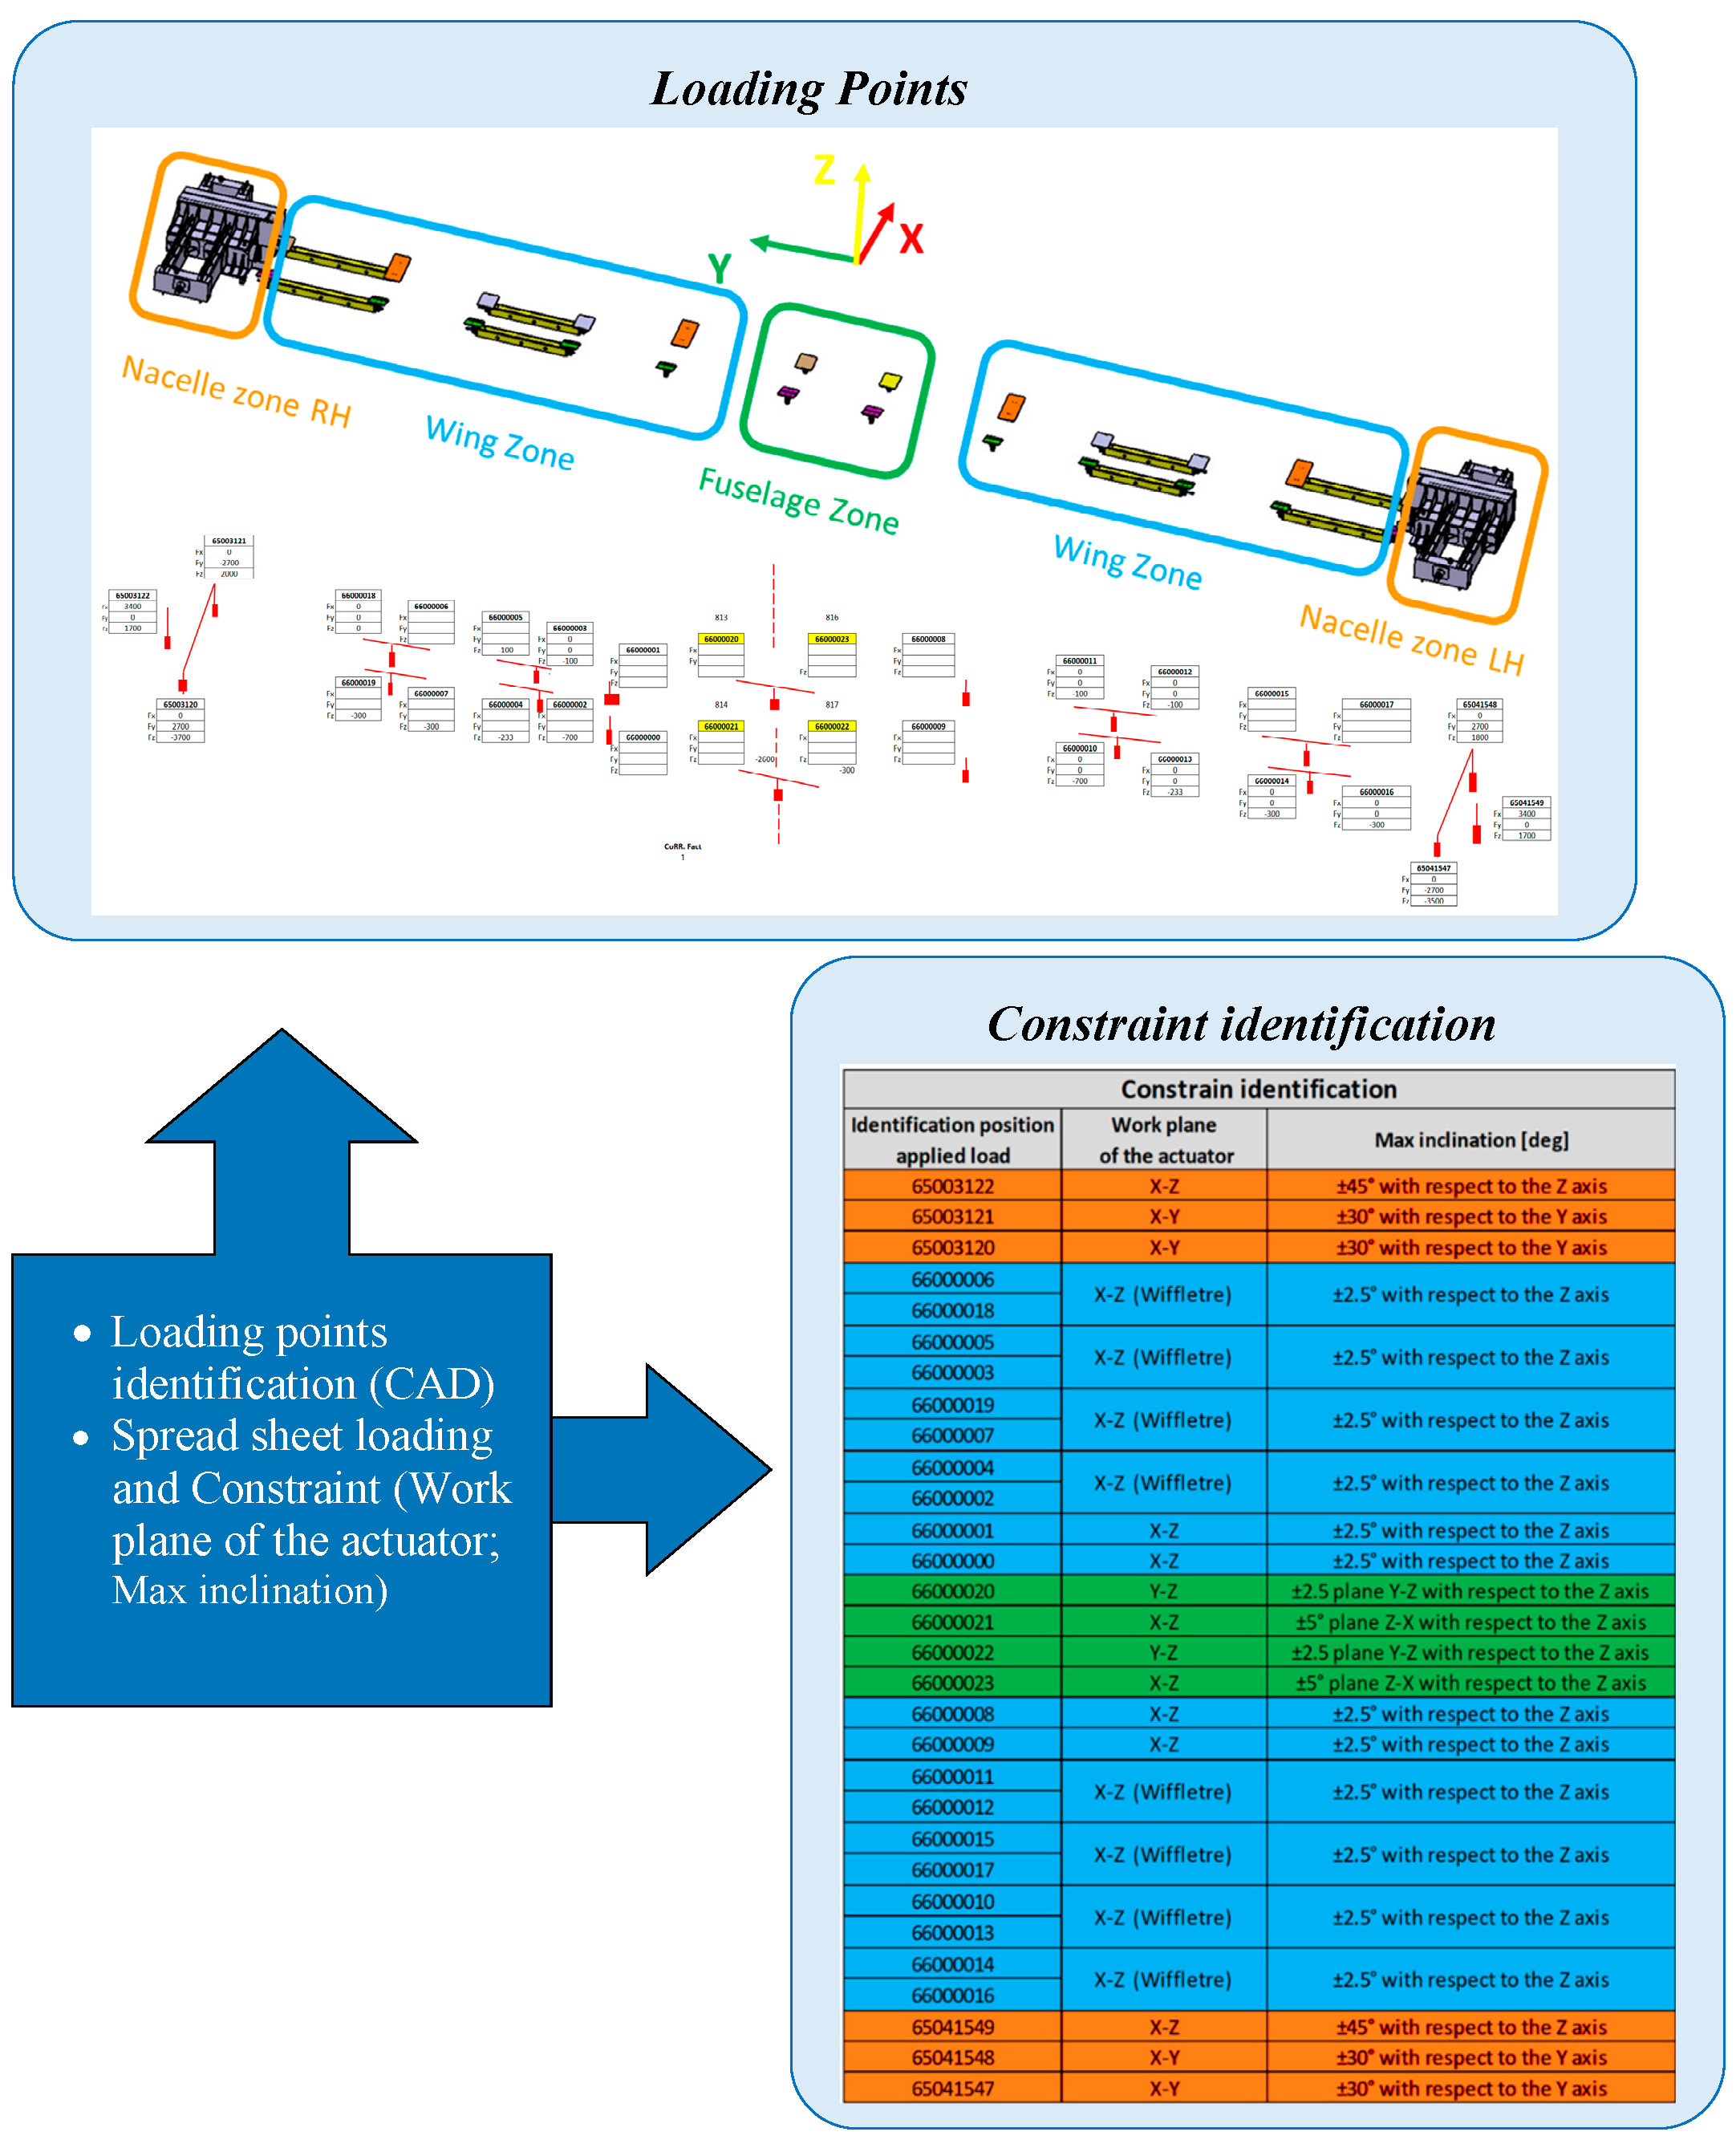
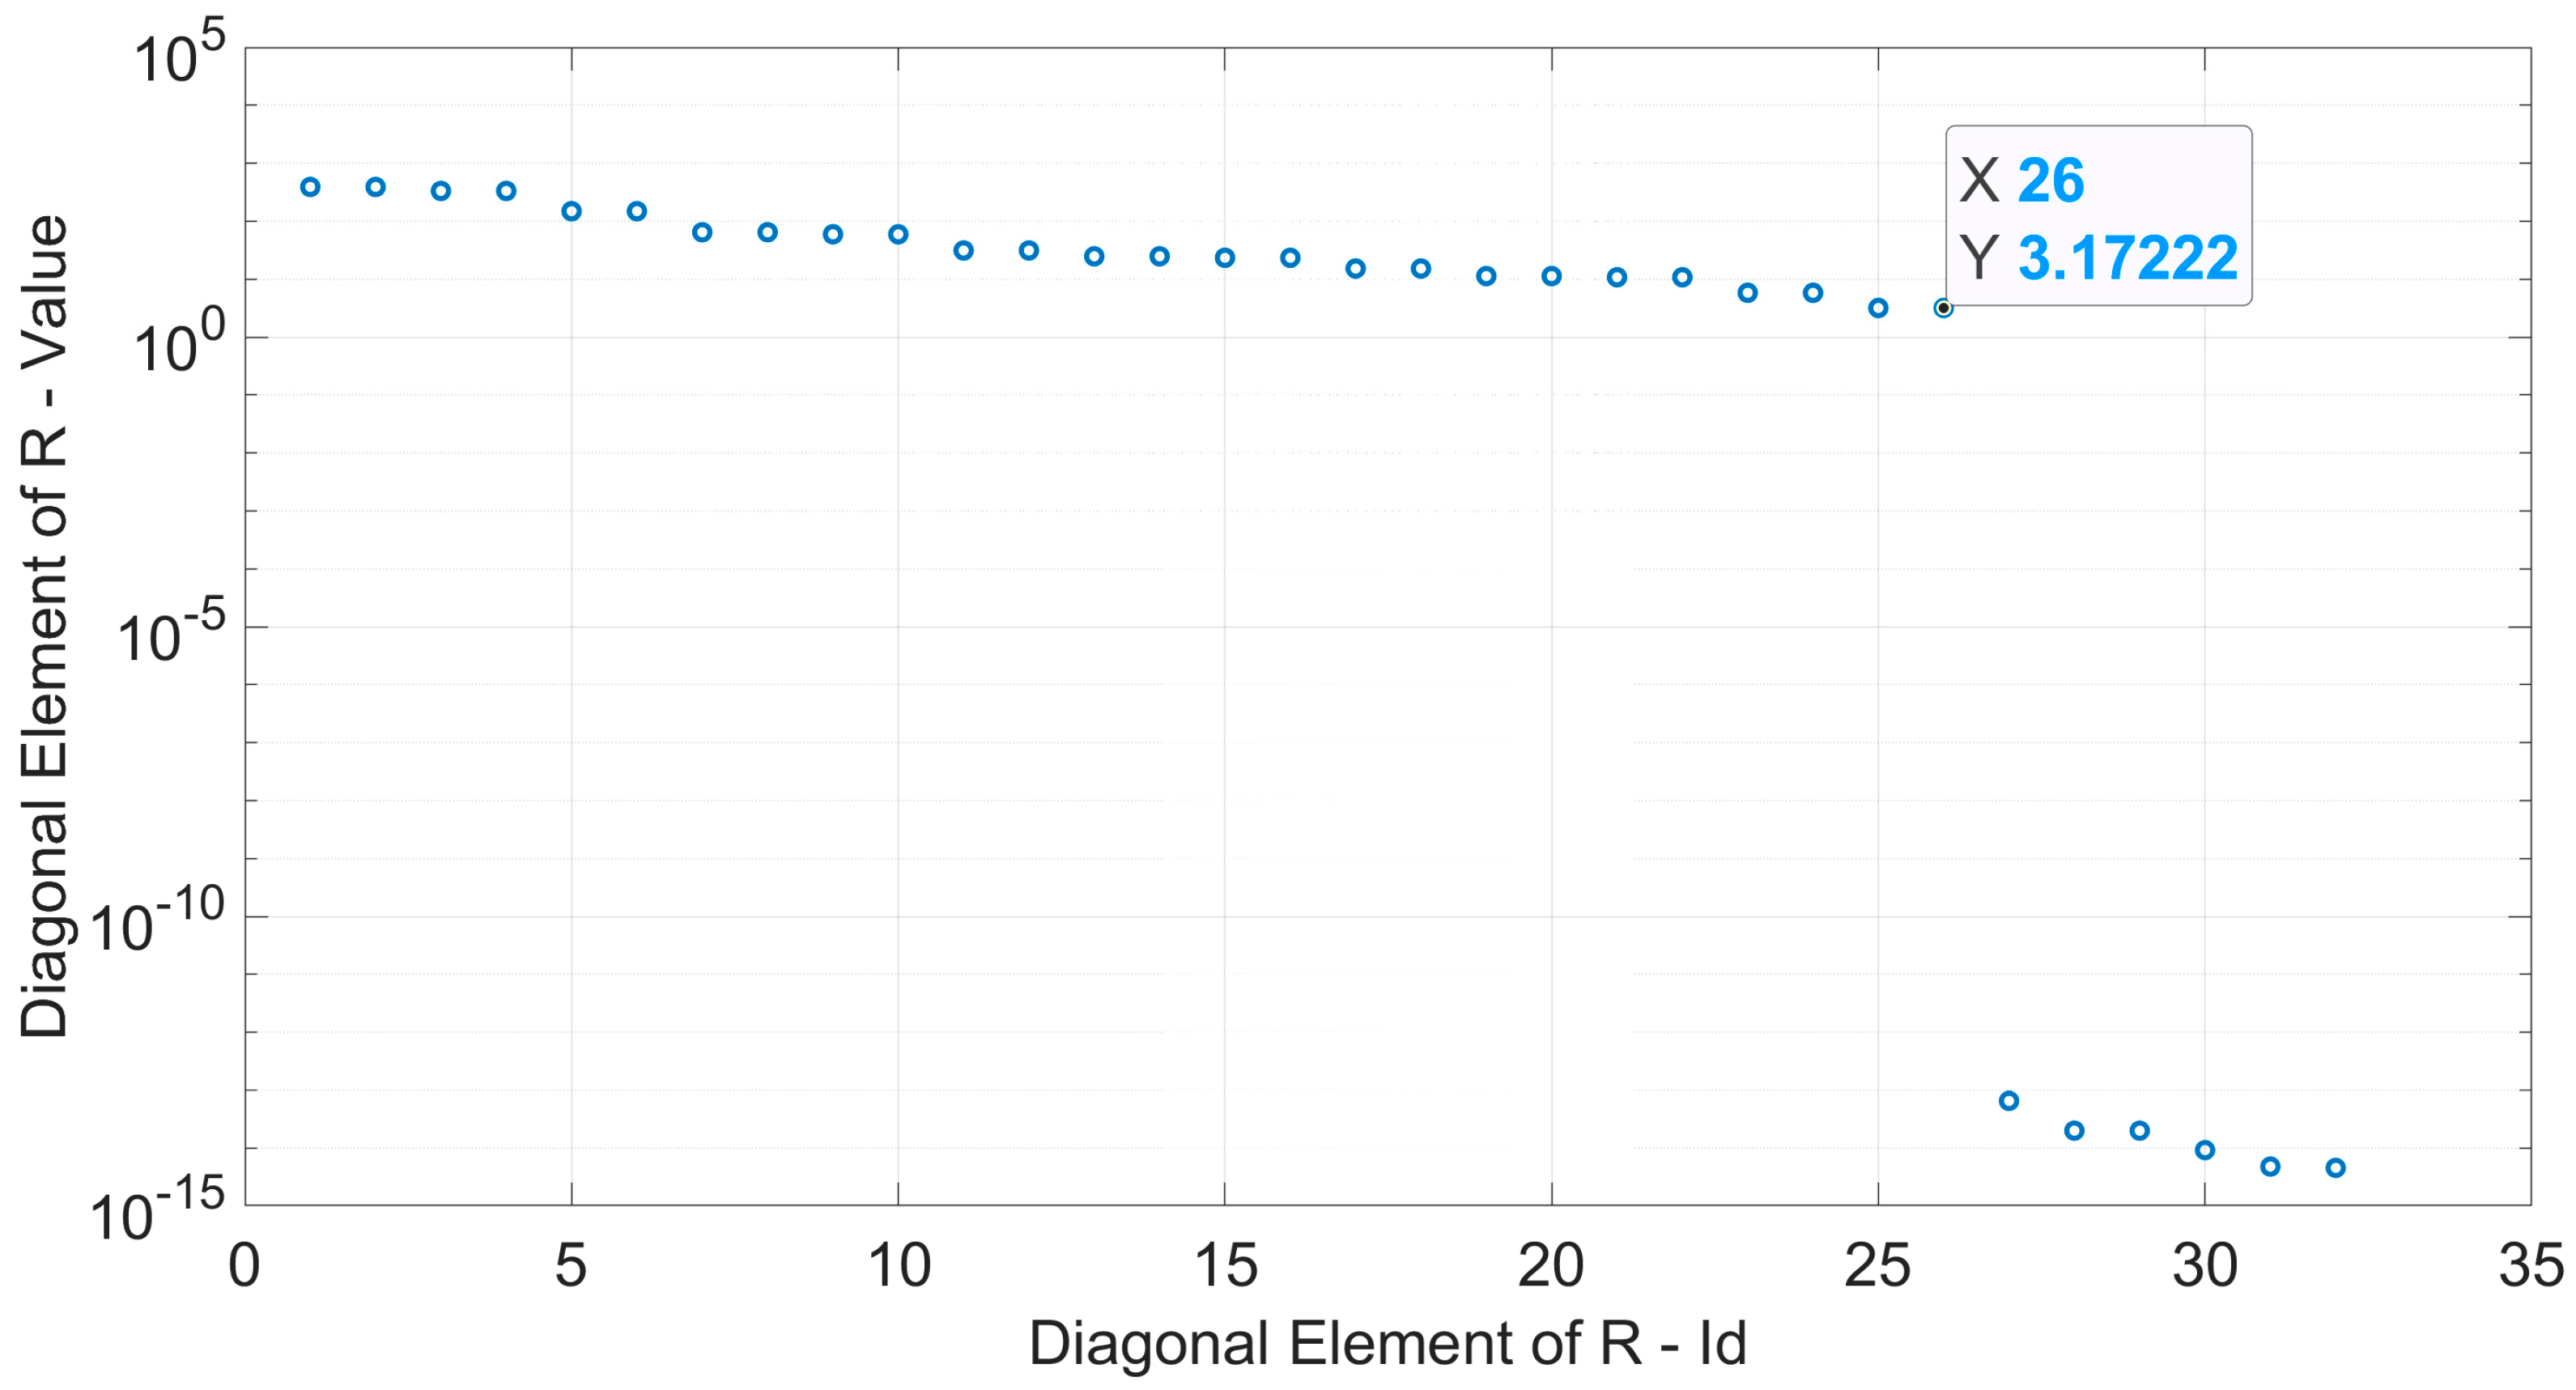
- Significant components determination (step 1): each actuator’s force component gives rise to a particular SFBM diagram. The global SFBM diagram is obtained as a linear combination of the SFBM diagram of each load component. Considering the constraints on the actuator force components (driven by the test rig implementation), only 32 actuator force components are “free” (actuators can be only placed respecting some relative positions between them and can mainly act along some preferential directions). To reduce the computational loads of the successive steps, a linear independence analysis of the SFBMs of these 32 load components has been performed by means of a QR decomposition—see [18,19]—of the SFBMs’ matrix (the matrix whose columns are the SFBMs on the control points generated by each load component). In Figure 8, the diagonal elements of the upper triangular matrix of the decomposition (calculated in Matlab, see [18]) are displayed: only 26 elements have values comparable between them and higher than the remaining 6, so only 26 load components are actually linear independent.
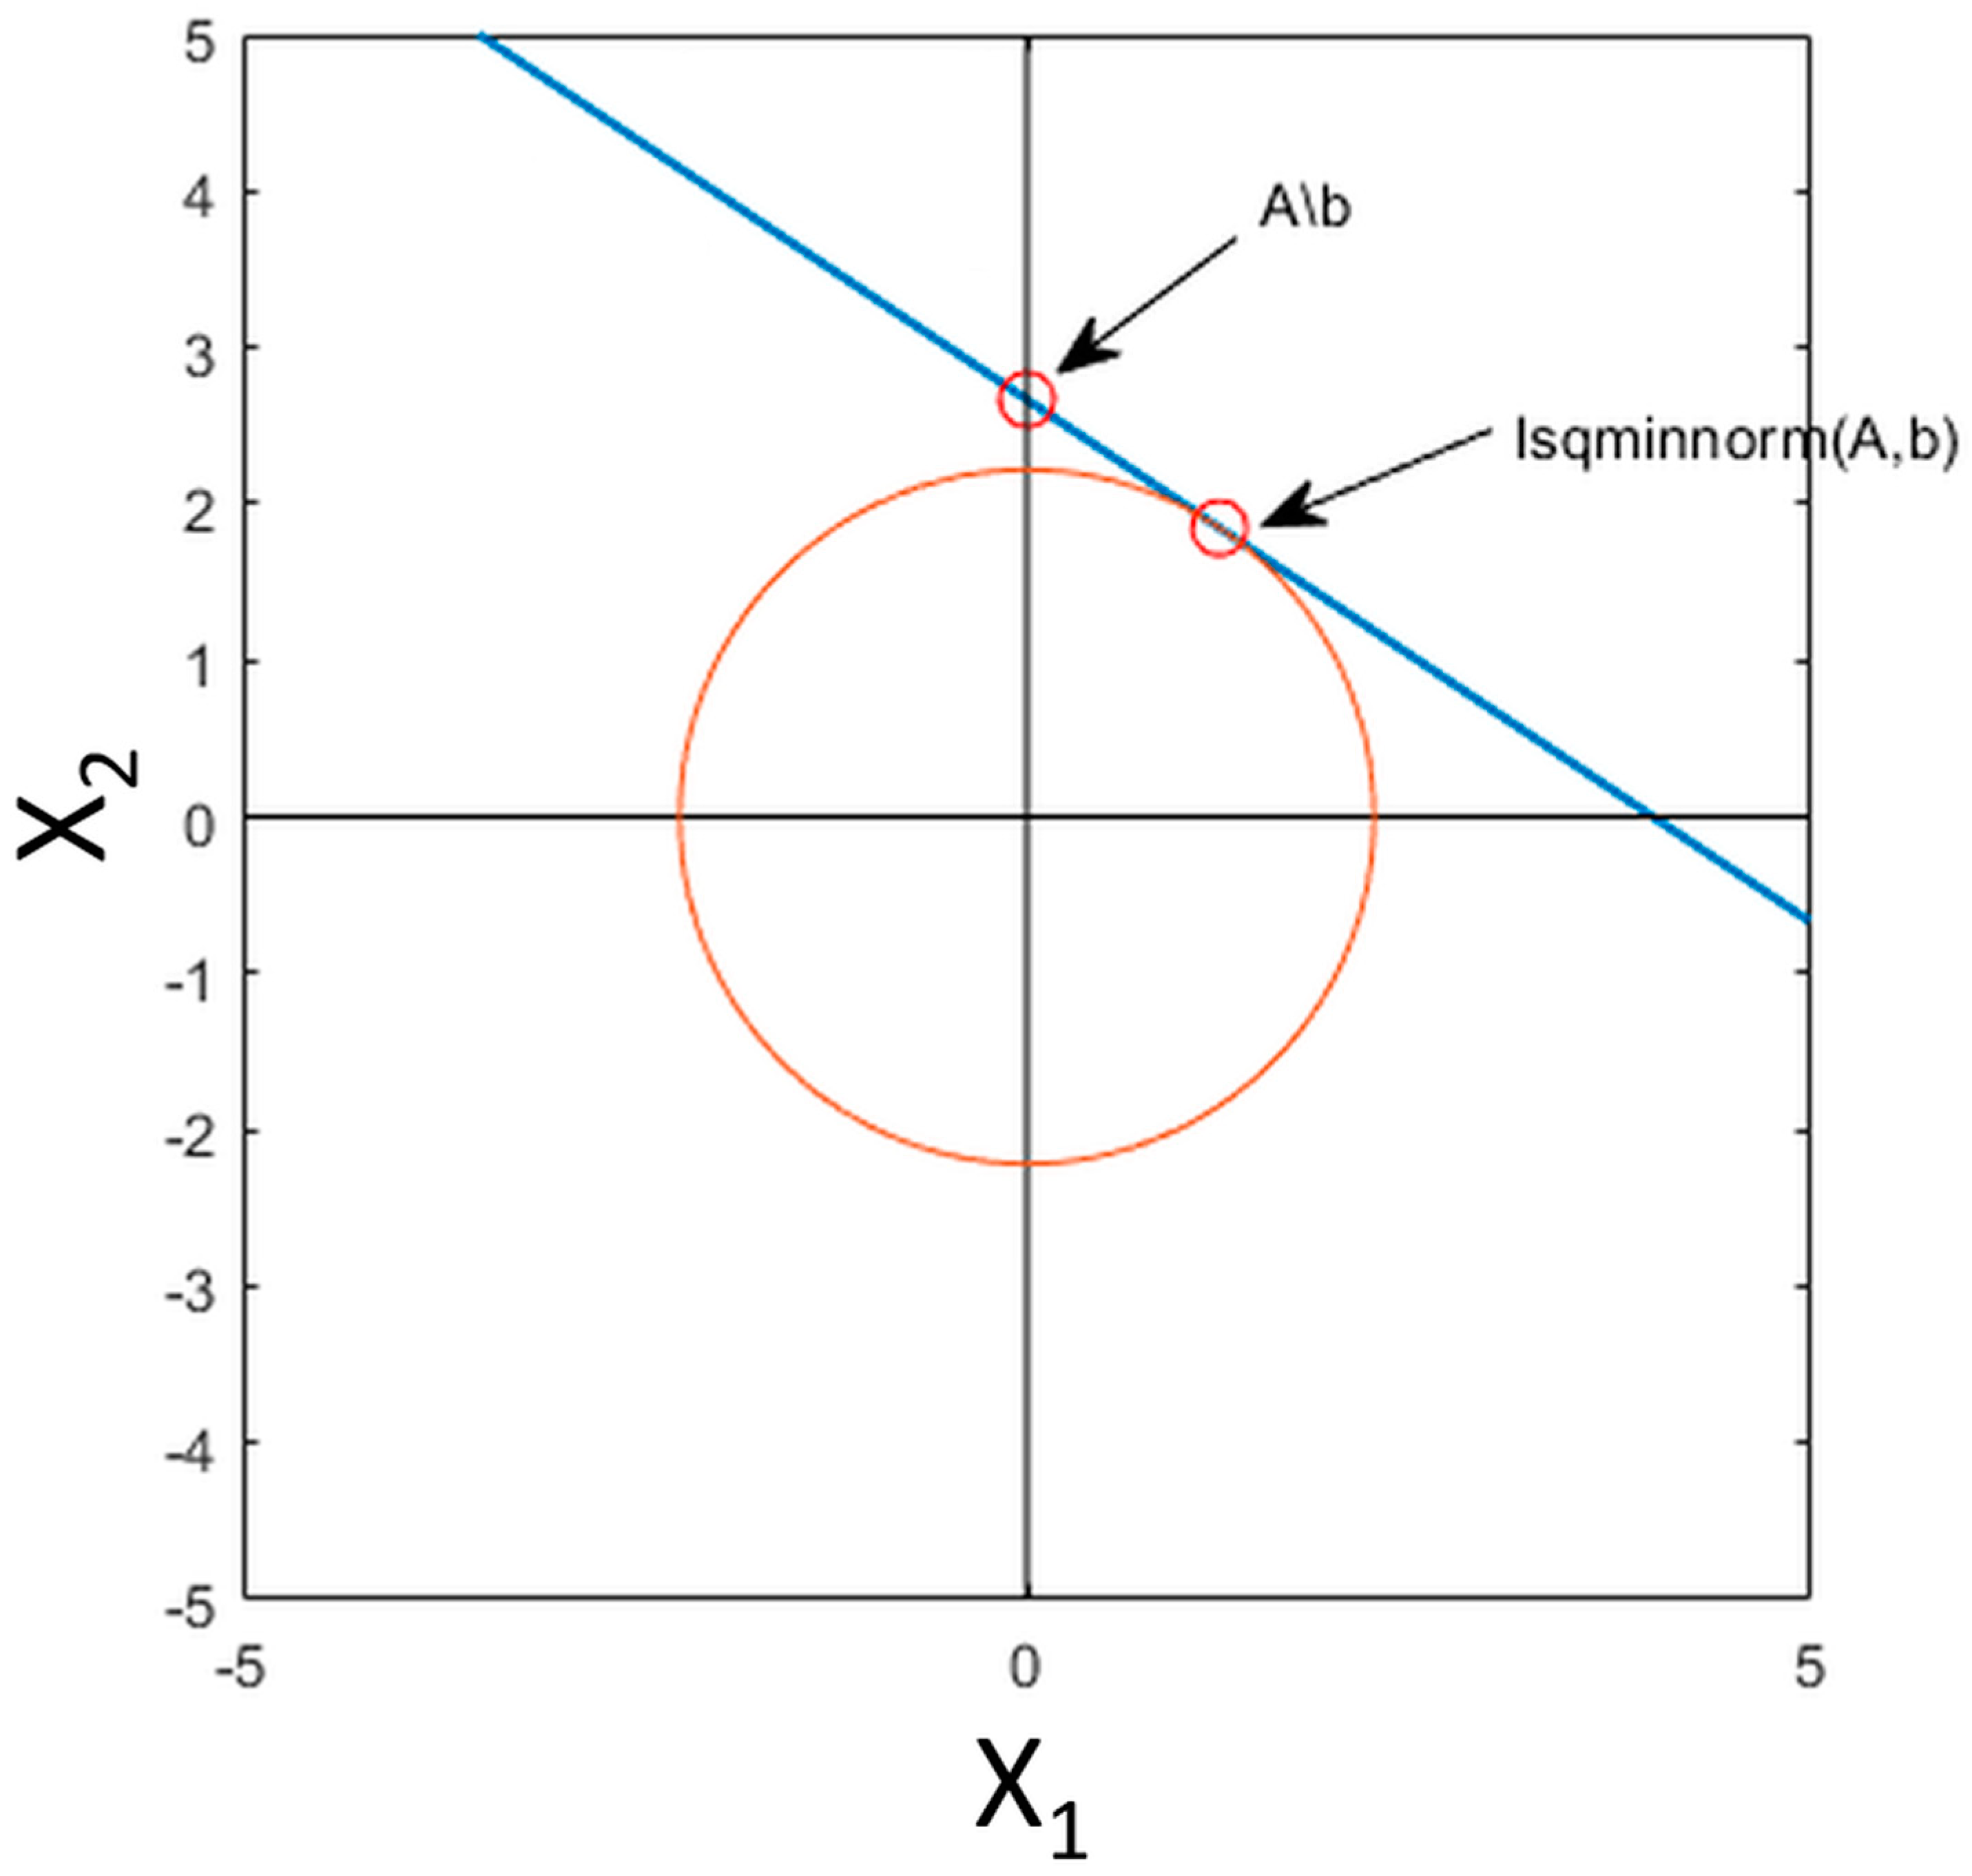
- Least square linear optimizations with only the actuator’s load direction constrained (step 2): a least square minimum norm unconstrained optimization has been launched for all the combinations (906,192). The number of combinations without repetition that can be formed taking k elements from a set made of n elements is given by the formula C(n,k) = n!/k!(n − k)! as 26 components among the 32 admissible actuators components (with the aim being to identify the best 26 independent load components between the 32 overall load components). For each combination, a minimum norm least square solution to the linear Equation (1) is calculated (where b—84 × 1 vector—is the SFBM diagram that must be replicated at the 14 control points—14 control points times 6 SFBM-, A—84 × 26—is the matrix whose columns are the SFBM generated by the 26 actuator force components retained and X—26 × 1—are the actuator force components retained).
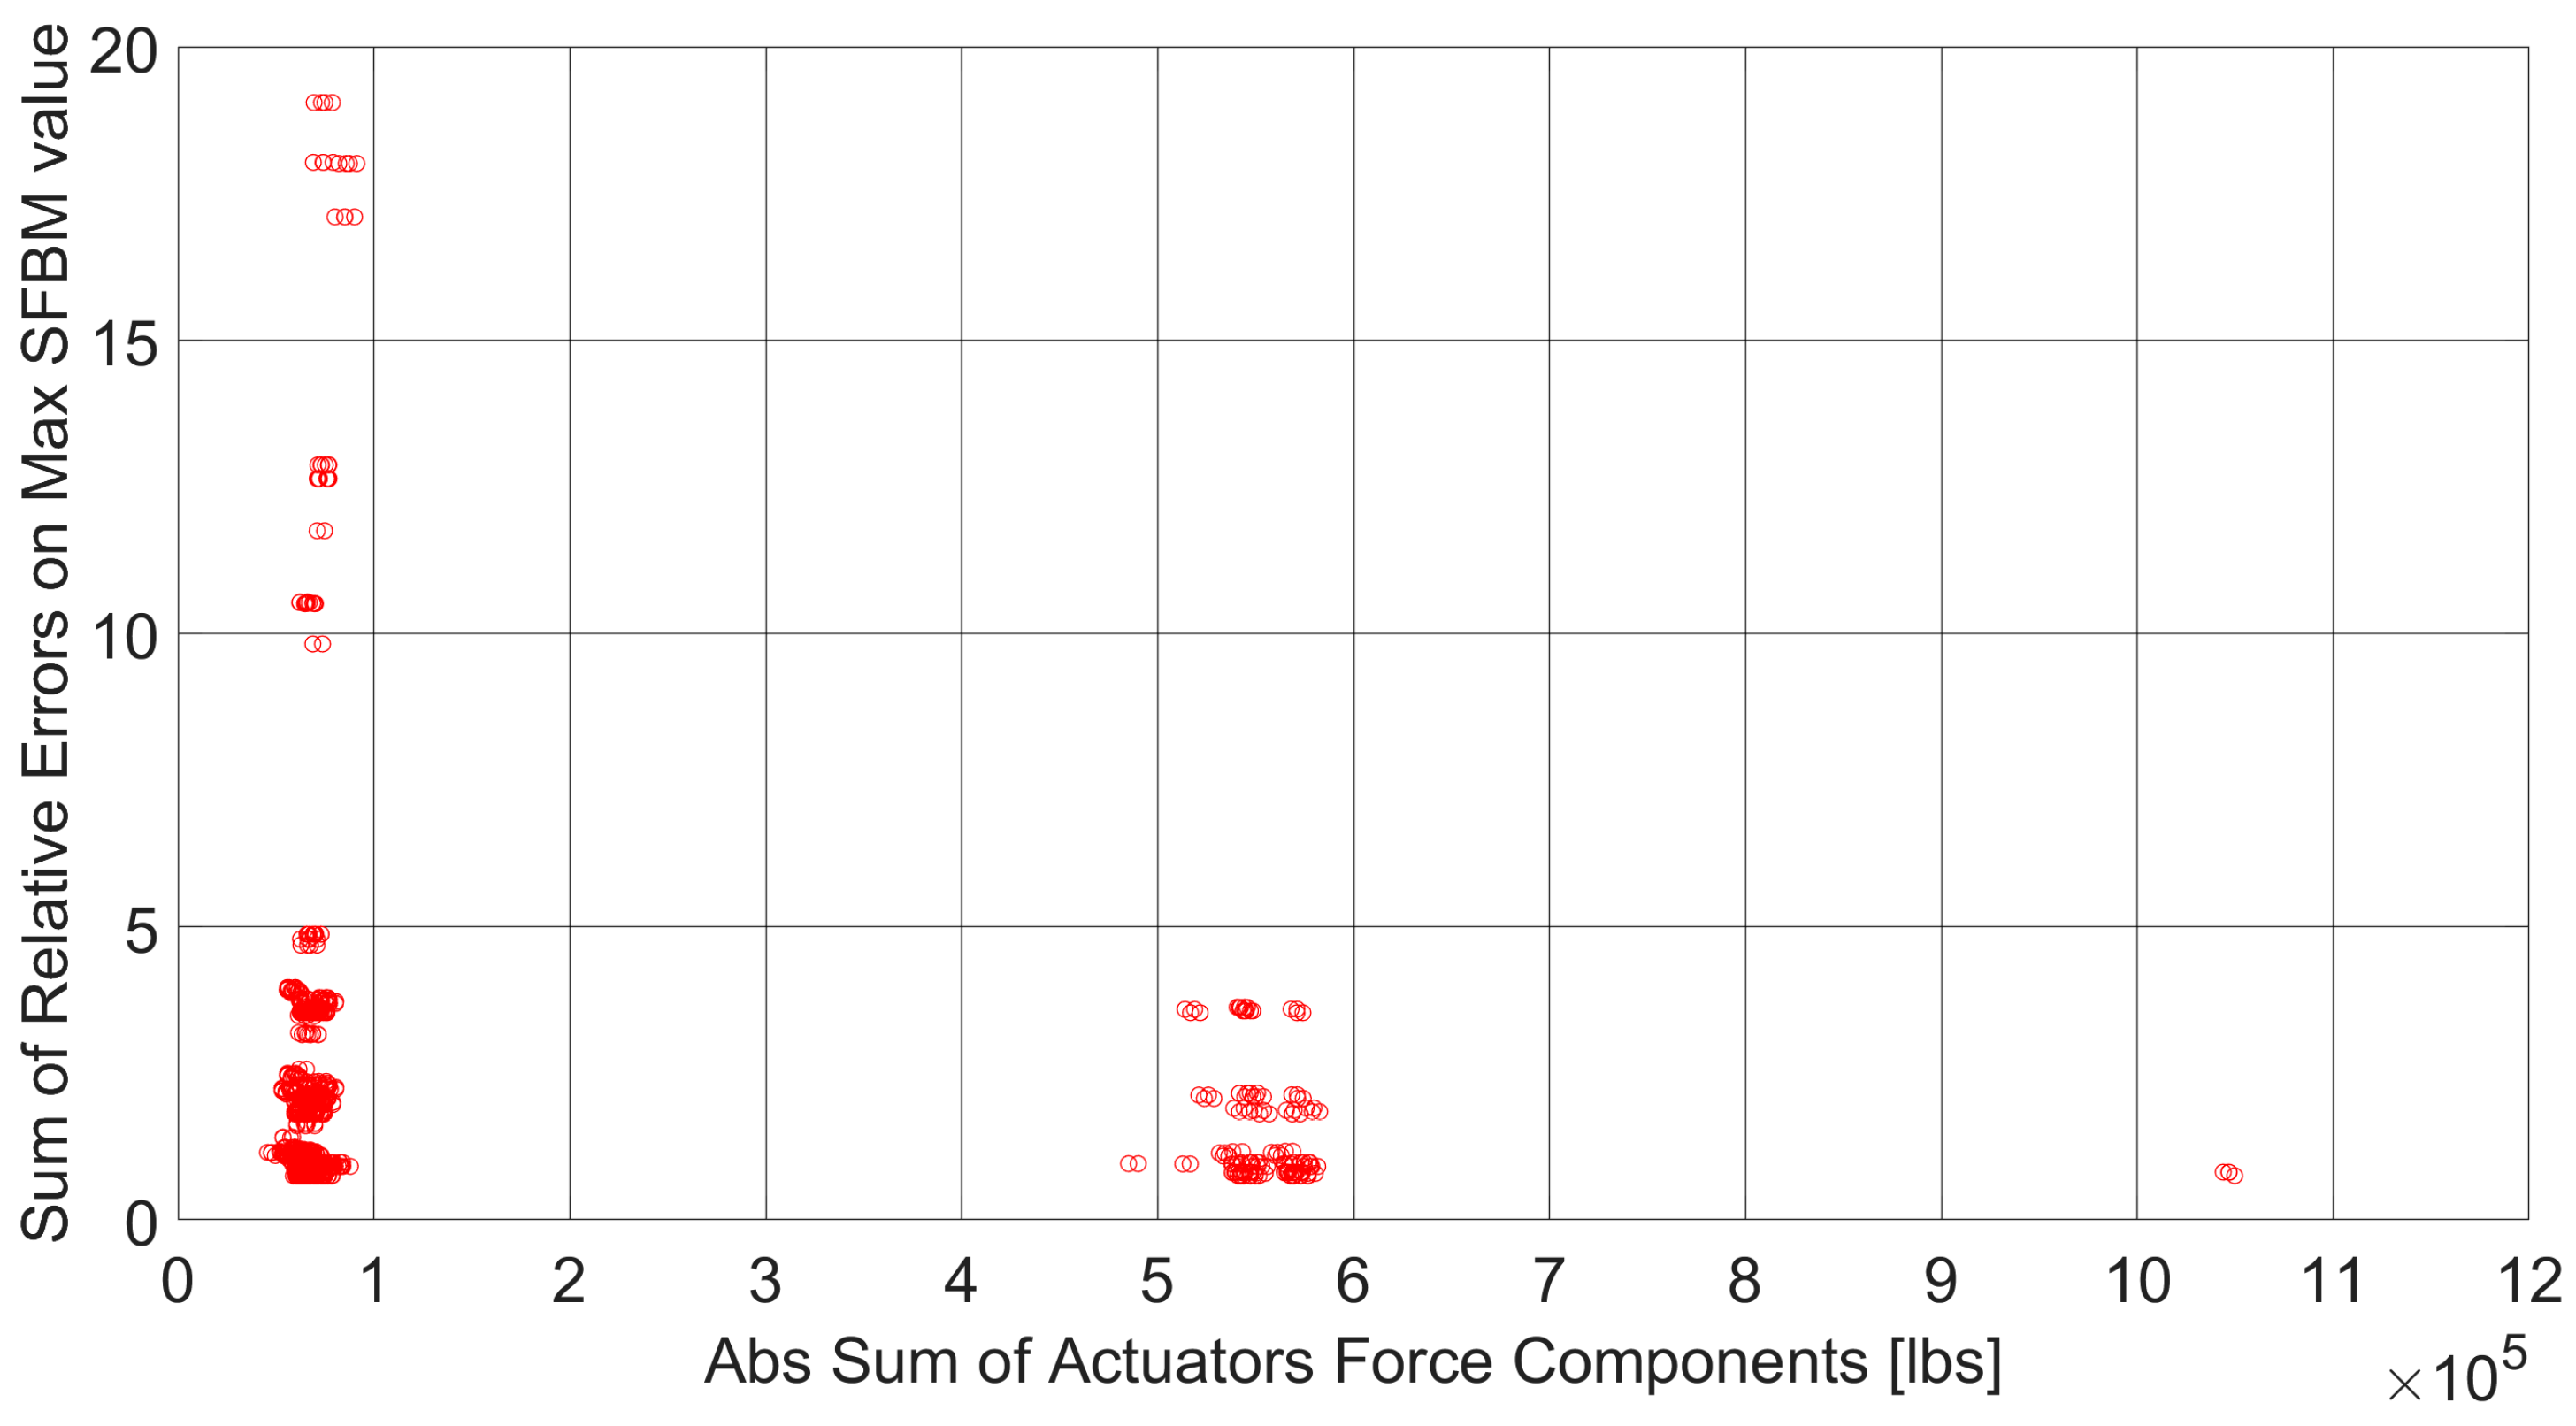
- Solution identification that satisfies the remaining test constraints (step 3): among the 906,192 optimized solutions, those solutions that verify all the other setup constraints (i.e., relative direction between actuators forces, maximum angle between load components of an actuator, see Section 4) have been identified and plotted (see Figure 11, where the red dots are a subset of the blue dots in Figure 10 that respect all the remaining setup constraints).Figure 11. Optimized solutions that verify all the test rig constraints.
![Aerospace 11 00323 g011]()

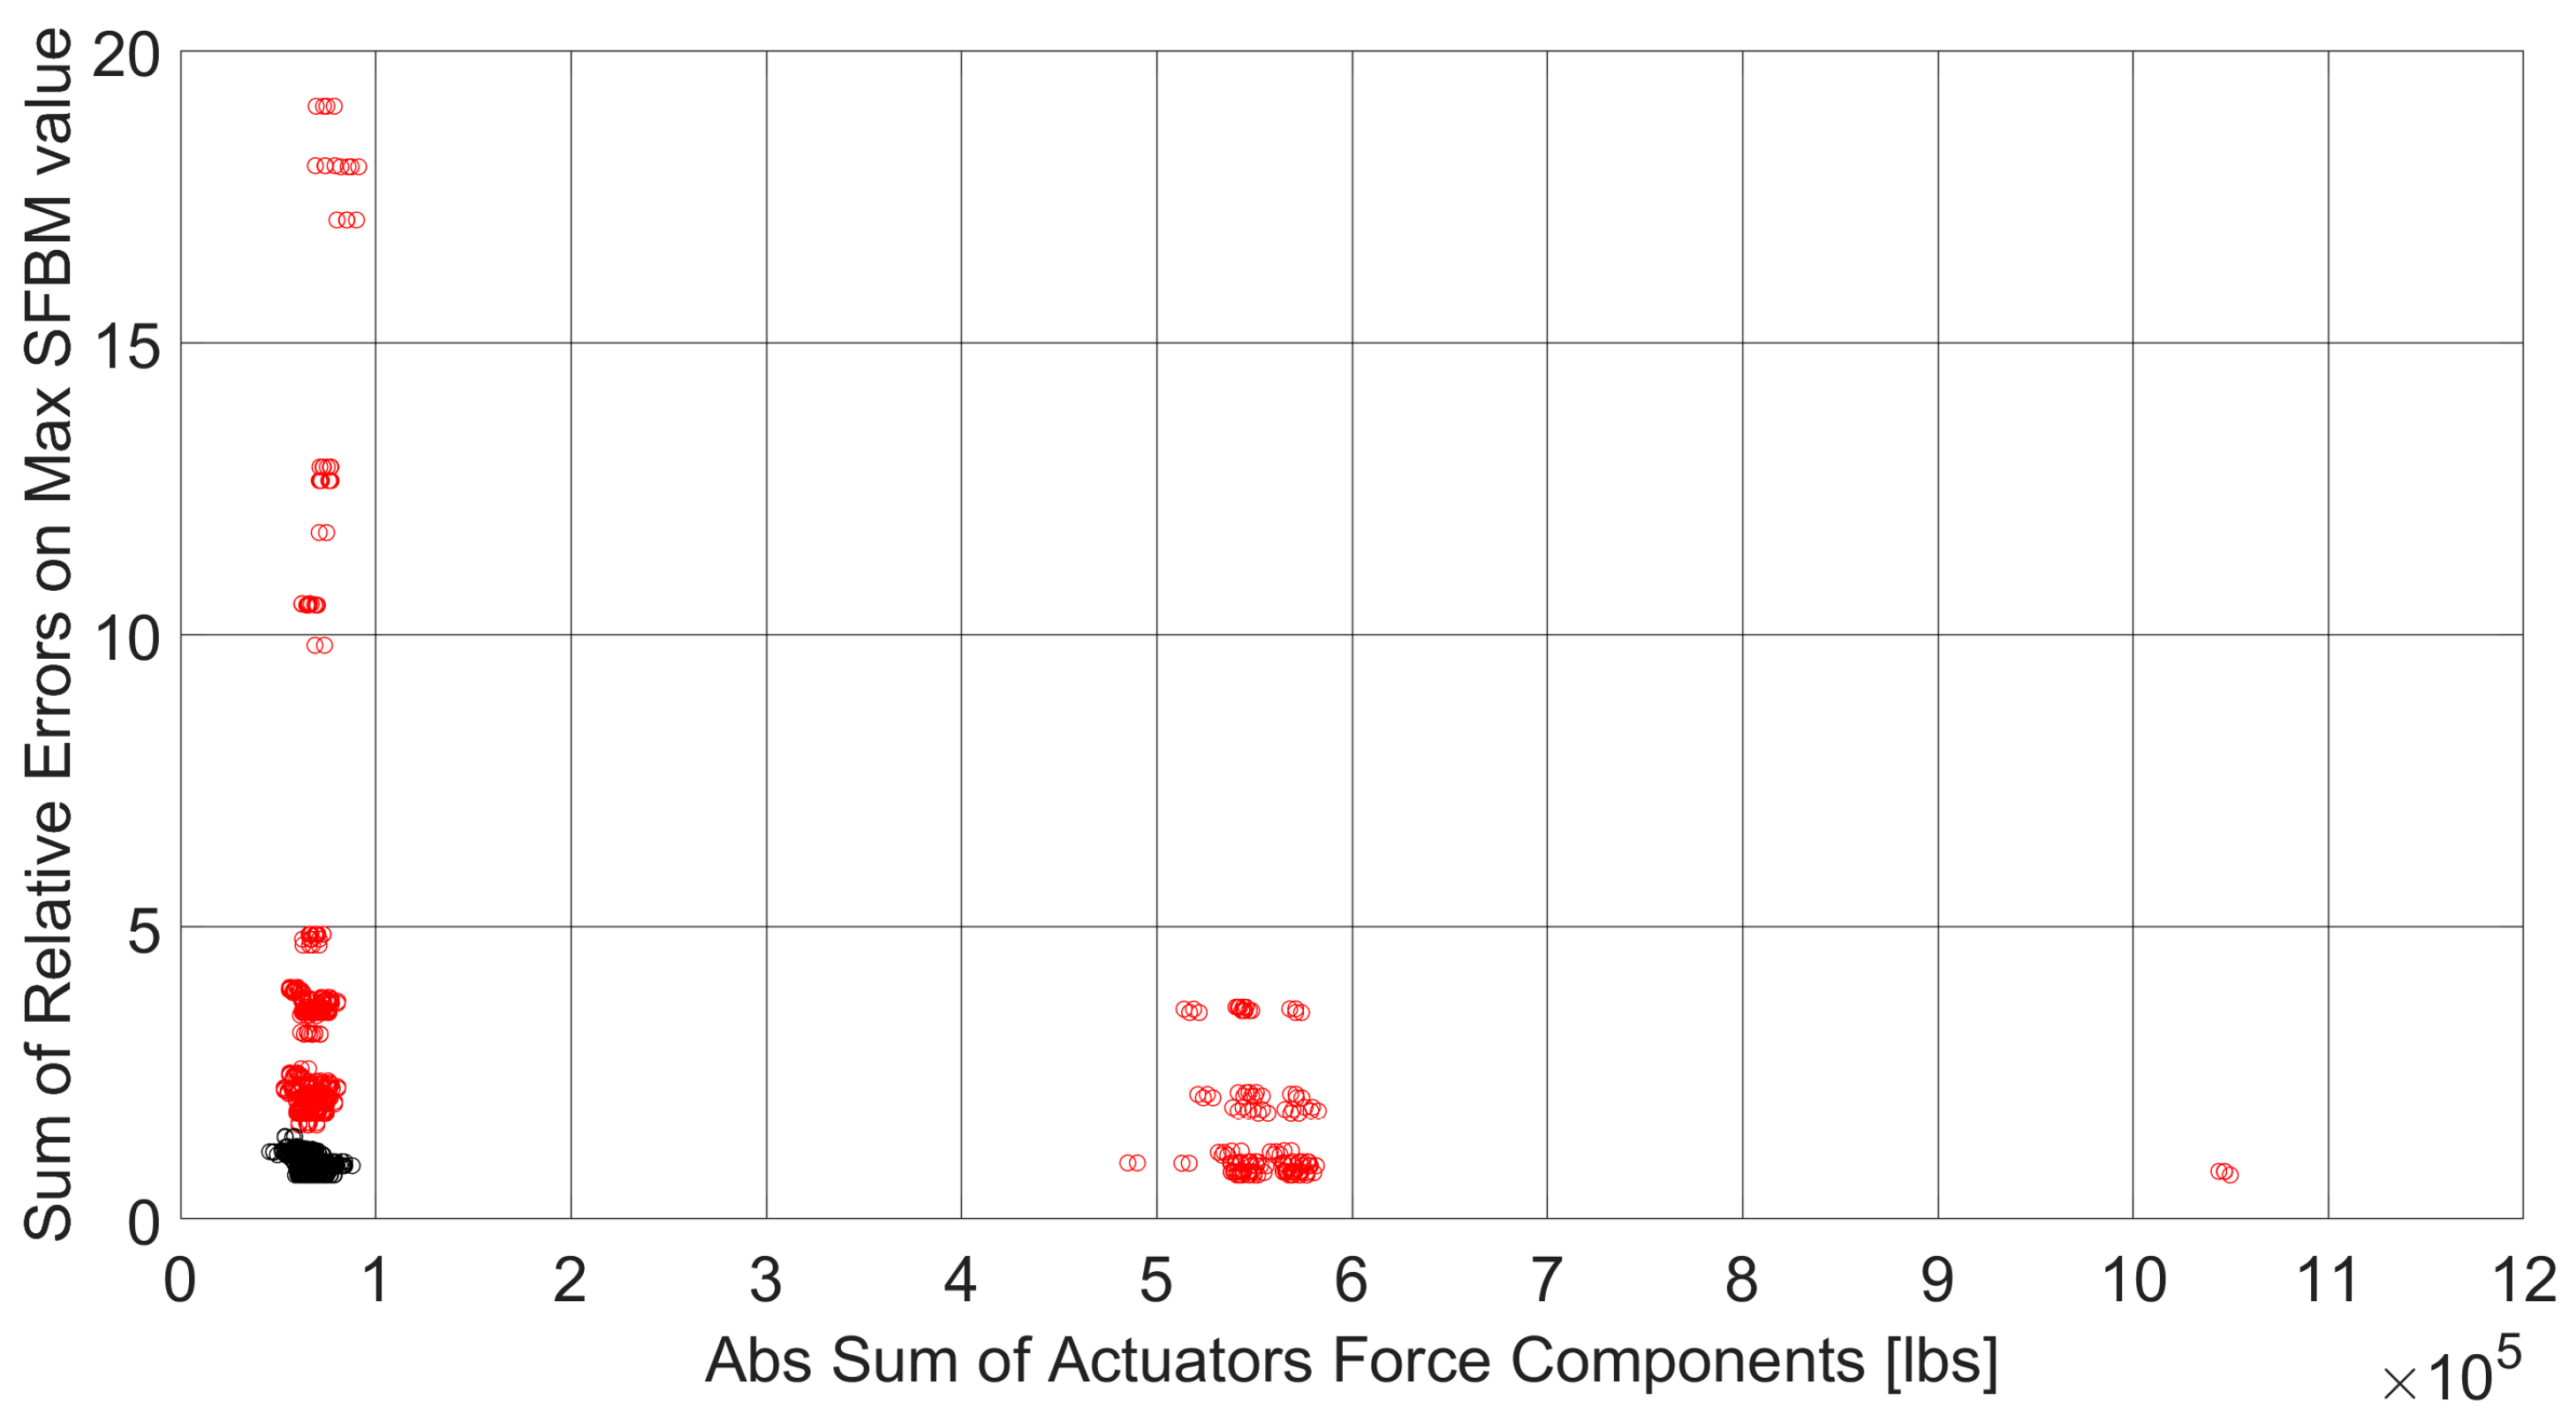
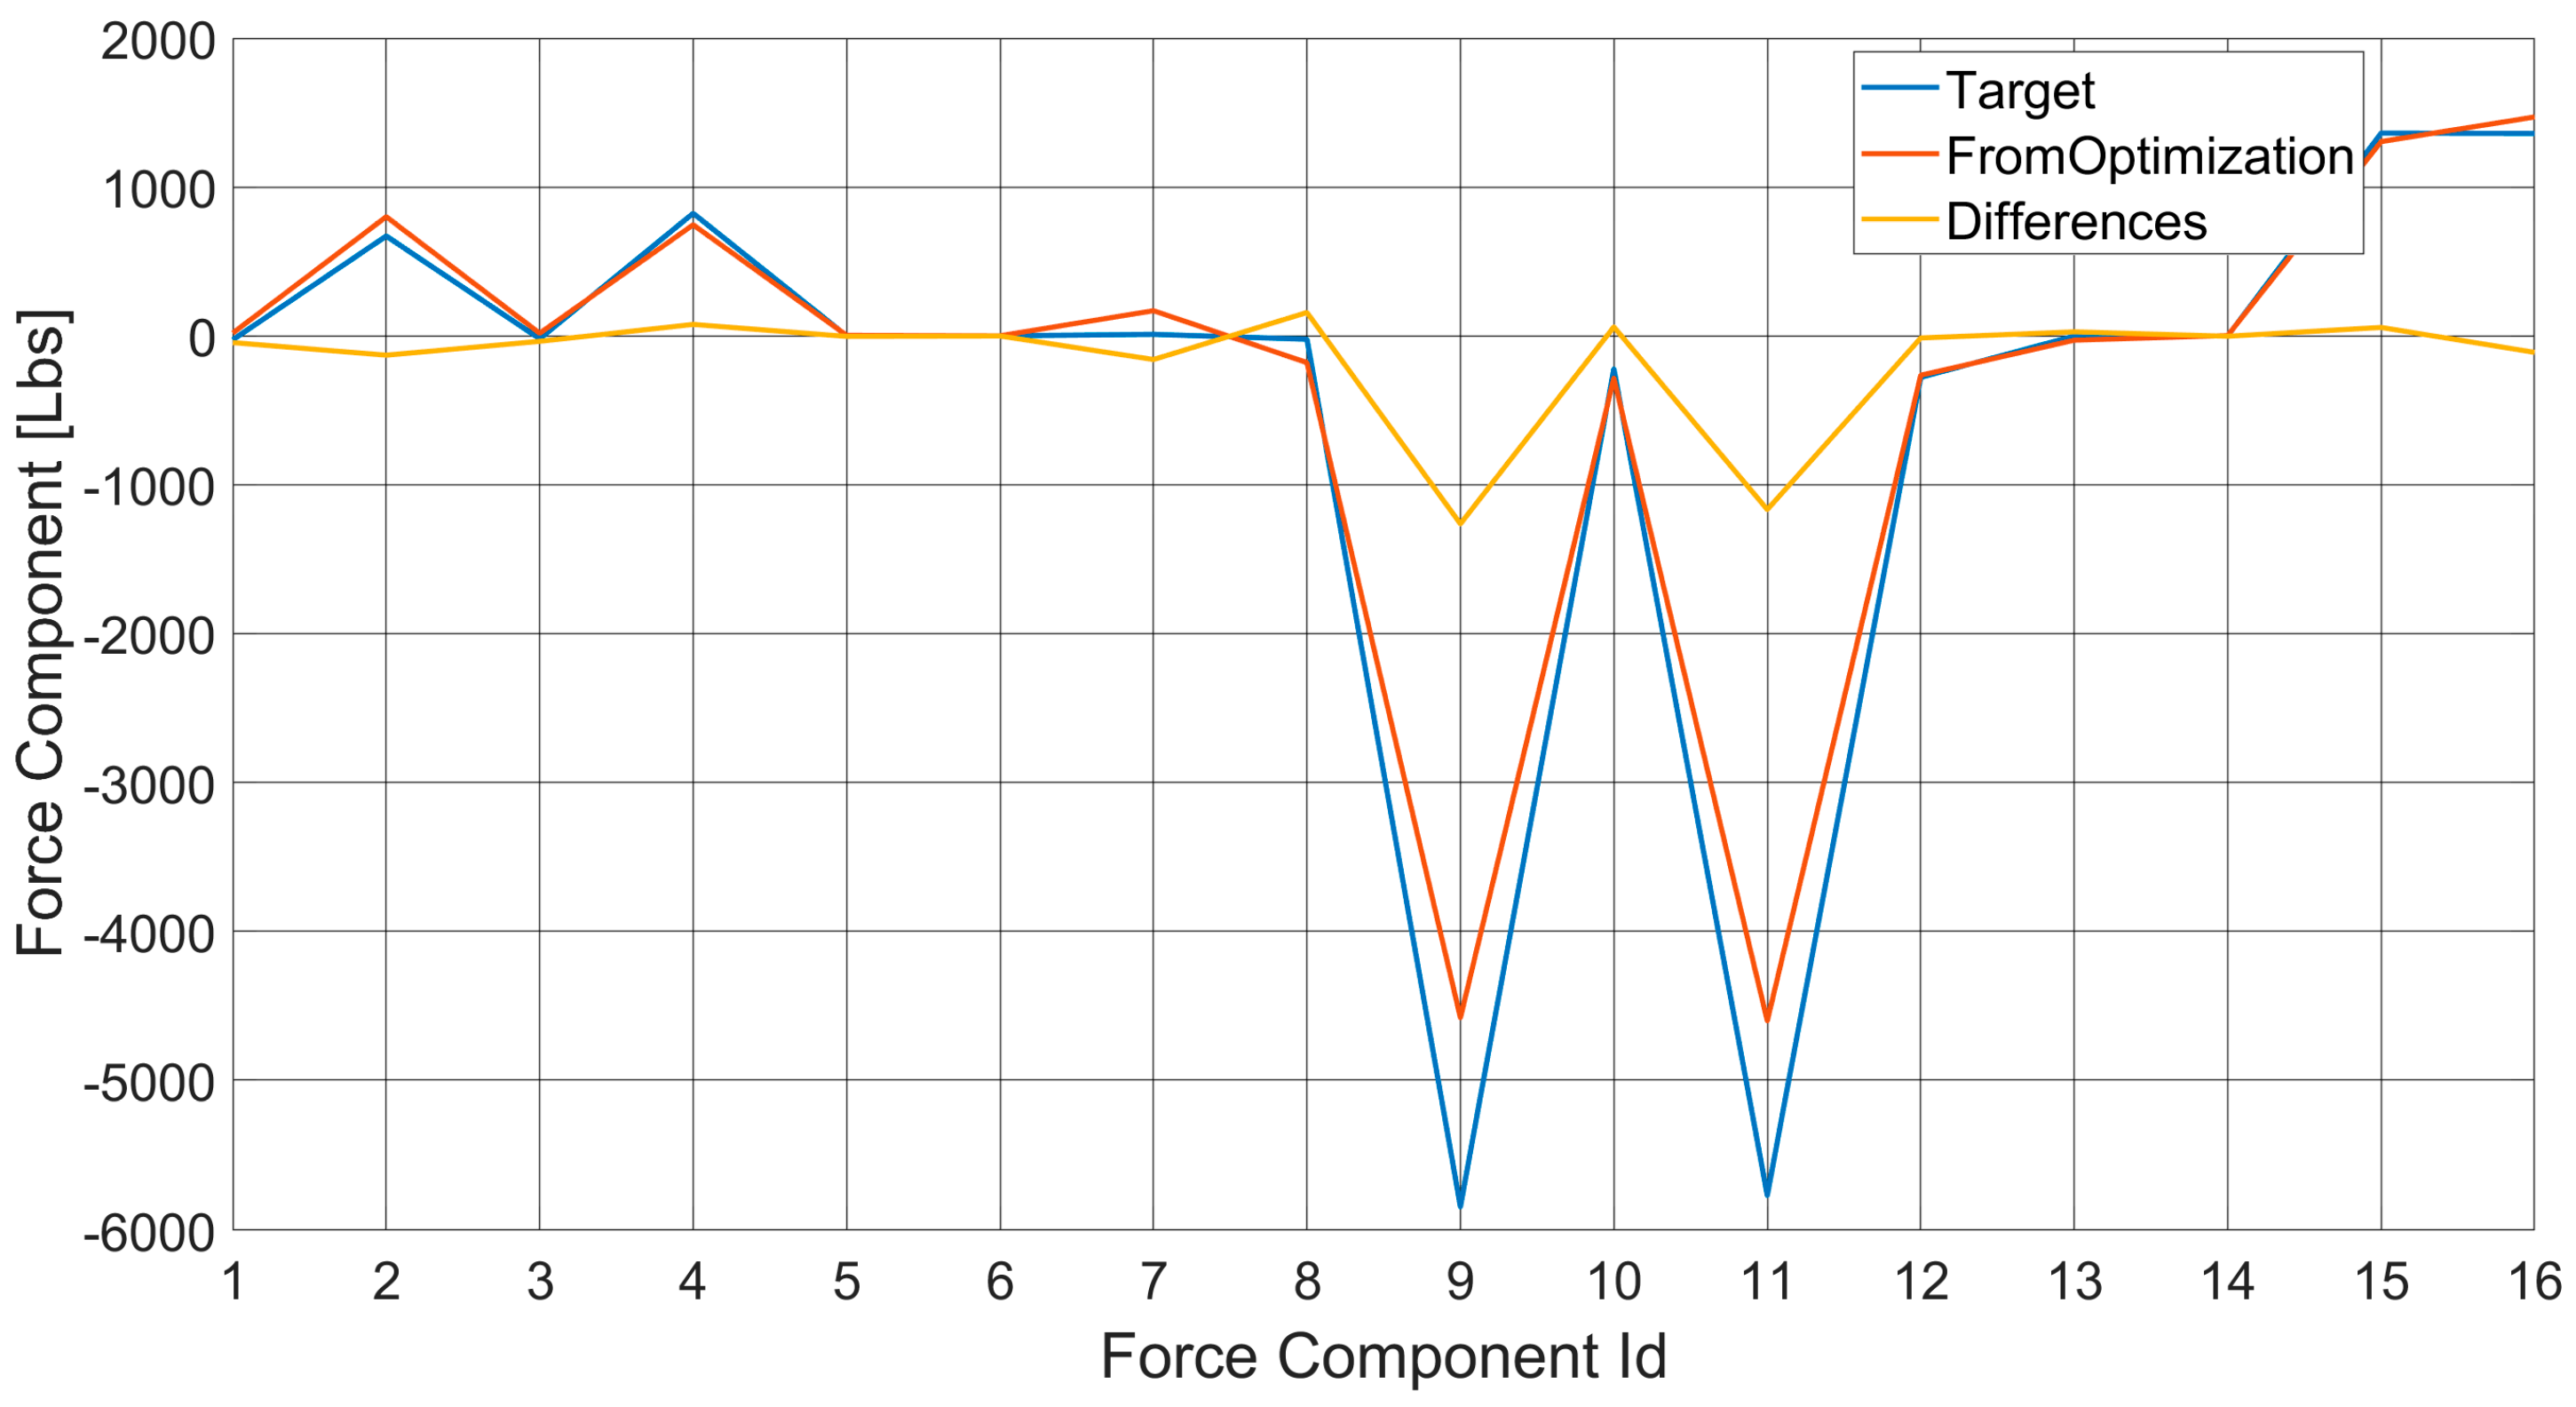
- Identification of a set of best solution constraints that comply (step 4): among the feasible solutions, those that have low values of actuation forces (low stress on the actuators) and SFBM errors (more accurate solutions) have been identified (black dot in Figure 12, those belonging to the lower-left part of the Pareto front). These solutions have been reviewed in detail in terms of SFBM plots (the differences in the target and reconstructed SFs and BMs have been calculated in the control points, raised to the fourth power and added, and the solution with the lowest errors both in SF and BM was then picked) to identify the best one between them (in Figure 13, all the “black dot” solutions of Figure 12 have been plotted in gray, the chosen one has been highlighted with red dots and compared with the target blue line).Figure 12. Best optimized solutions that verify all the test rig constraints (black dots).
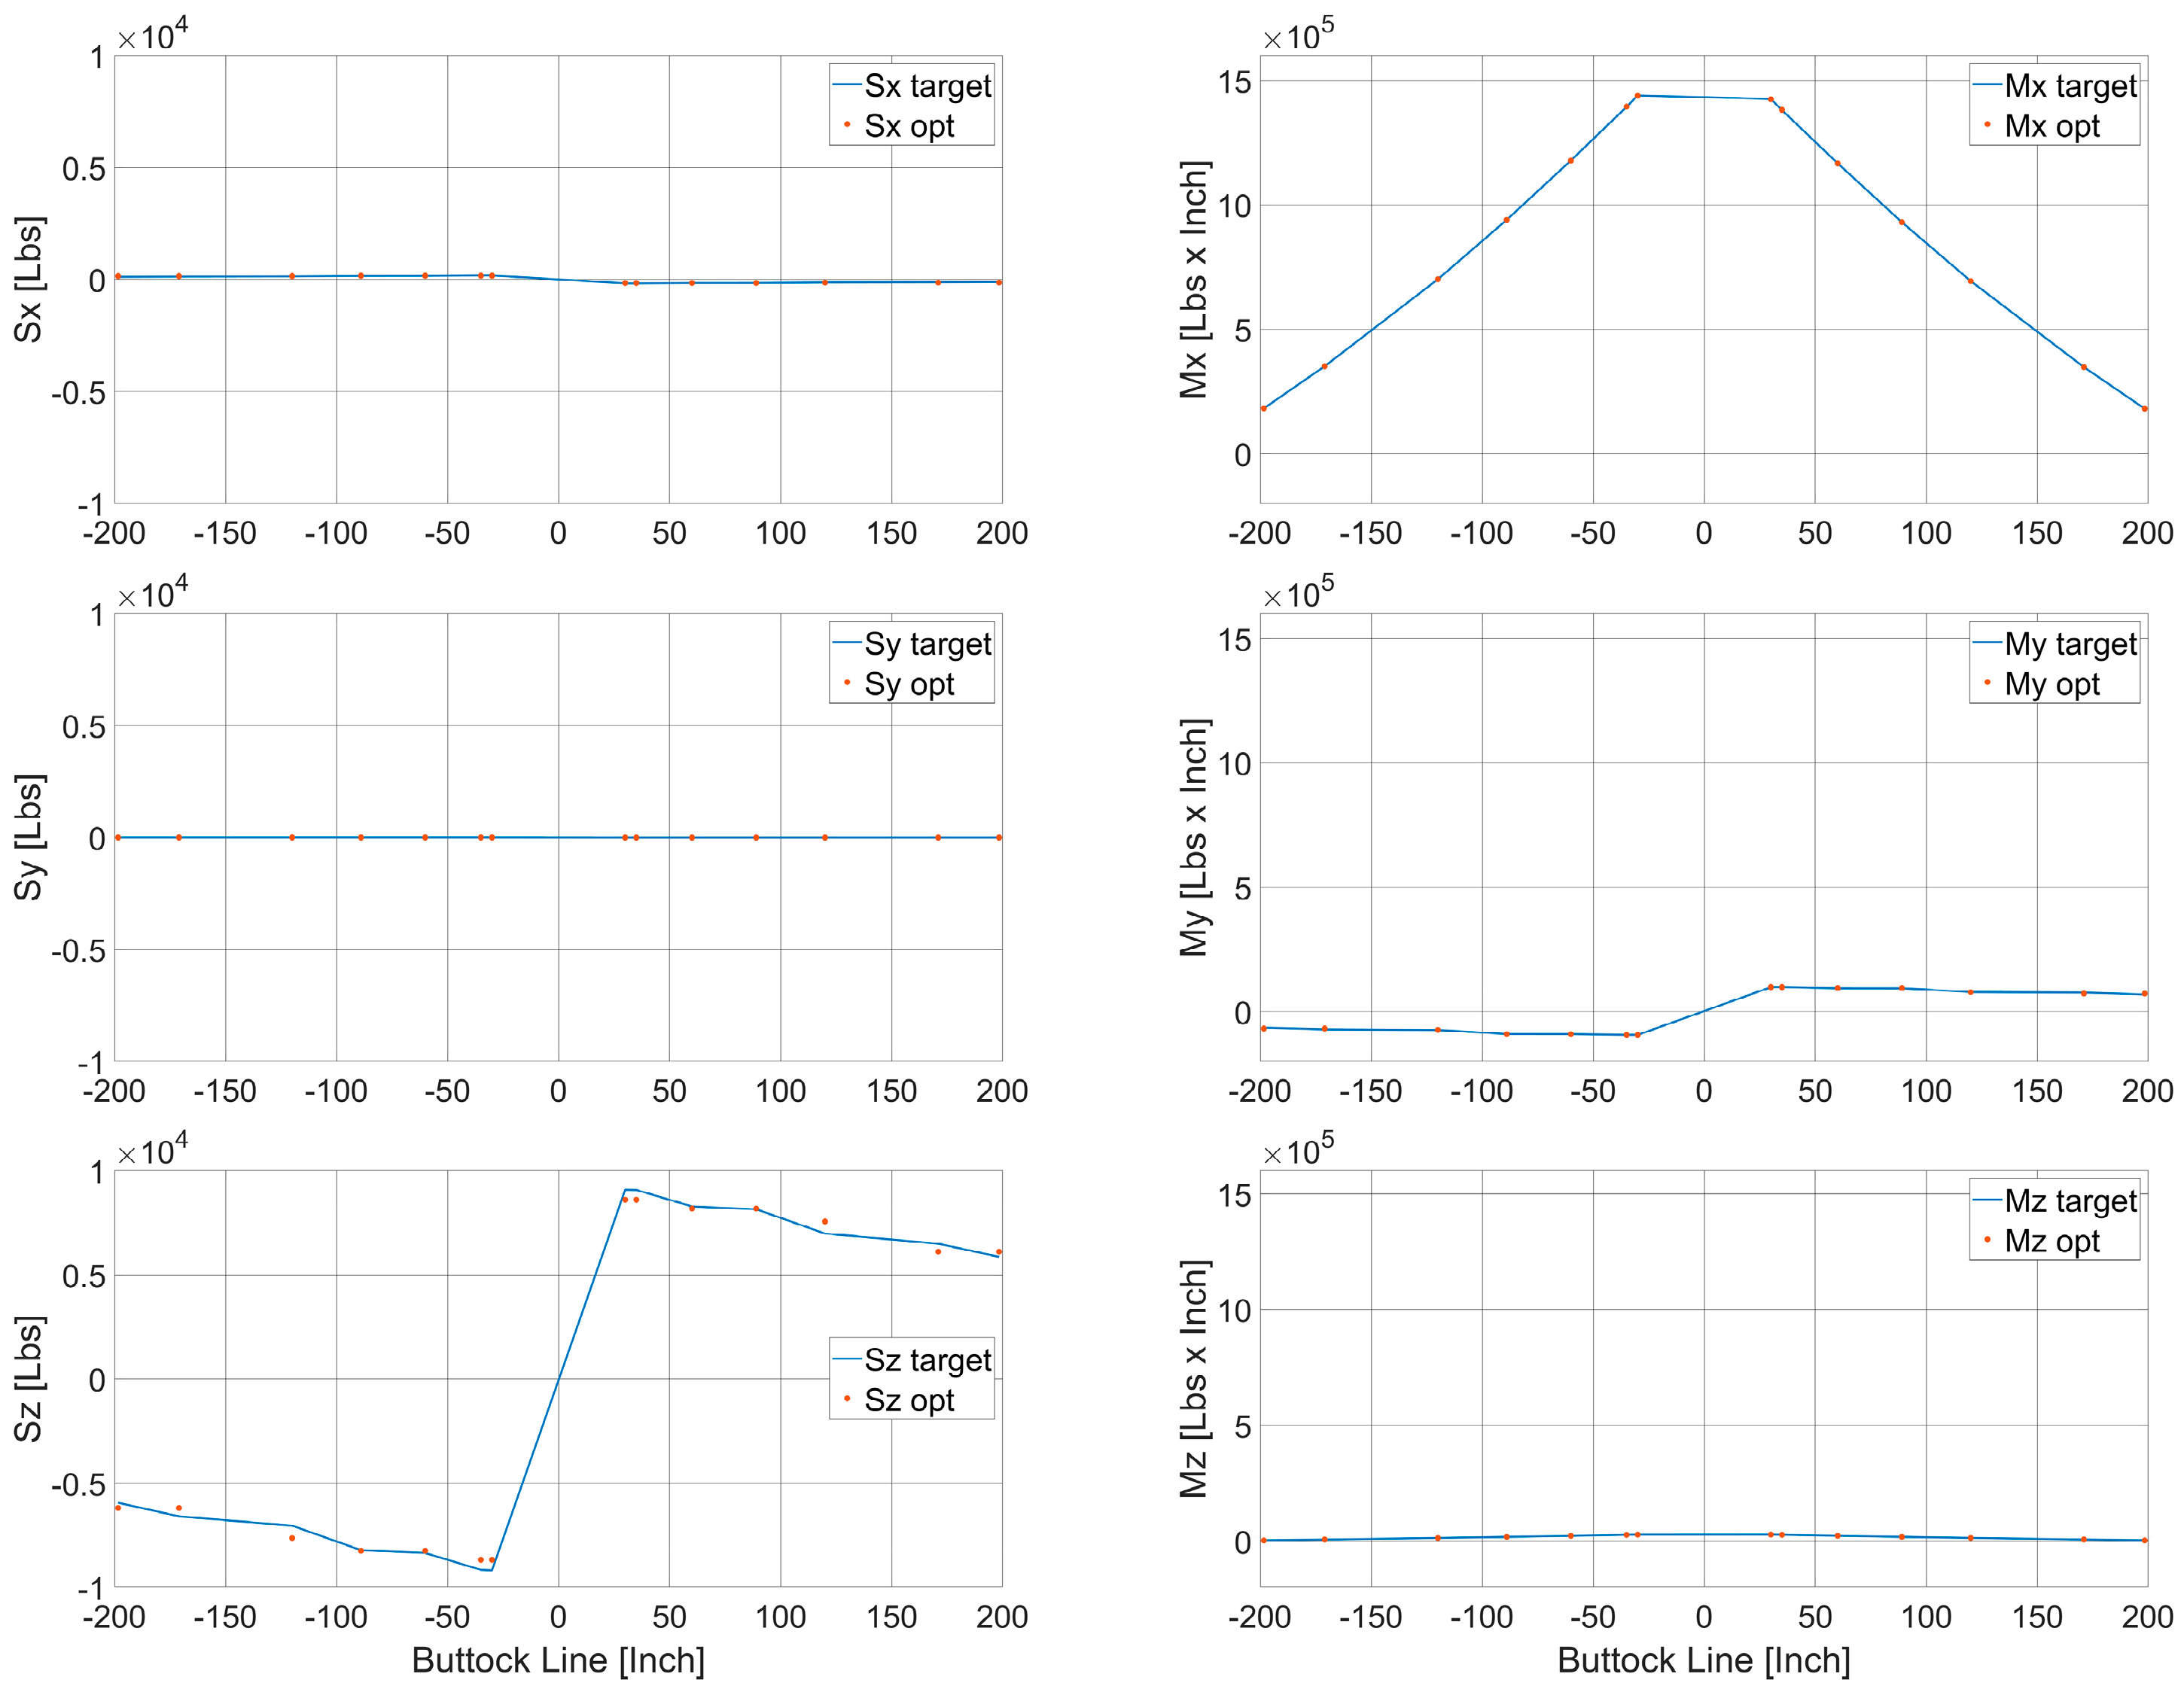
![Aerospace 11 00323 g012]() Figure 13. Comparison between the SFBMs target (blue), SFBMs of the optimized solutions (gray) and the selected one (red dots). Shear forces on the right (X–Y–Z from top to bottom) and bending moments on the left (X–Y–Z from top to bottom).Figure 13. Comparison between the SFBMs target (blue), SFBMs of the optimized solutions (gray) and the selected one (red dots). Shear forces on the right (X–Y–Z from top to bottom) and bending moments on the left (X–Y–Z from top to bottom).
Figure 13. Comparison between the SFBMs target (blue), SFBMs of the optimized solutions (gray) and the selected one (red dots). Shear forces on the right (X–Y–Z from top to bottom) and bending moments on the left (X–Y–Z from top to bottom).Figure 13. Comparison between the SFBMs target (blue), SFBMs of the optimized solutions (gray) and the selected one (red dots). Shear forces on the right (X–Y–Z from top to bottom) and bending moments on the left (X–Y–Z from top to bottom).![Aerospace 11 00323 g013]()


- Reaction forces matching (step 5): in the final step, a least square solution has been searched to match the forces at the interfaces through actuators placed at the wing root (actuators dedicated to this aim and not coincident with those used for the SFBMs reconstruction). An influence matrix C (forces at the interfaces generated by a unity force in each of the four additional internal actuators components) has been determined from the FEM model of the wing on the test rig. As depicted in the example in Figure 14, only the front right actuator is loaded with unit loads in all three directions. Subsequently, this procedure is repeated for all the loading points to obtain the influence matrix.Figure 14. Example of the FE model of the wing on the test rig subjected to unit loads in three directions to derive the influence matrix.Figure 14. Example of the FE model of the wing on the test rig subjected to unit loads in three directions to derive the influence matrix.
![Aerospace 11 00323 g014]()

- A least squares solution for the system (2), where X represents the actuator forces and d represents the target interface forces, provides the solution.
5. Results
- To minimize the actuator sizing and consequently to enhance safety of the test.
- To accommodate space constraints due to the overall rig size.
- To deliver to the lab personnel a suitable set of inputs on which to build and set up the test itself (e.g., actuator forces inputs to properly set up their activation, actuator positions in order to properly plan the change of setup between one test condition and the others)
- To minimize the overall time and costs connected to the whole qualification campaign.
6. Conclusions
Author Contributions
Funding
Data Availability Statement
Conflicts of Interest
References
- Boggs, B.C. The History of Static Test and Air Force Structures Testing; AFFDL-TR-79-3071; Whight-Patterson Air Force Base: Dayton, OH, USA, 1979. [Google Scholar]
- European Union Safety Agency, AMC-20 General Acceptable Means of Compliance for Airworthiness of Products, Parts and Appliances. Available online: https://www.easa.europa.eu/sites/default/files/dfu/Annex%20II%20-%20AMC%2020-29.pdf (accessed on 26 July 2010).
- USA Department of Defense. C-17 Wing Structural Integrity; Report No. 93-159; USA Department of Defense: Arlington, VT, USA, 1993.
- Smith, H.W. Static Test of an Ultralight Airplane. J. Aircr. 1988, 25, 37–40. [Google Scholar] [CrossRef]
- Wong, A.; Luke, G. The Static Testing of a Lockheed P-3 Orion Wing Leading Edge Centre Section; Report DSTO-TR-0423; Aeronautical and Maritime Research Lab.: Melbourne, Australia, 1996. [Google Scholar]
- Luo, D.; Tang, W.; Xue, C.; Zhang, P. Static test rig development and application for an airliner’s hyperstatic aero-engine pylon structure. J. Meas. Eng. 2014, 2, 145–153. [Google Scholar]
- Pagani, A.; Azzara, R.; Carrera, E.; Zappino, E. Static and dynamic testing of a full-composite VLA by using digital image correlation and output-only ground vibration testing. Aerosp. Sci. Technol. 2021, 112, 106632. [Google Scholar] [CrossRef]
- Miller, E.J.; Li, W.W.; Jordan, A.; Lung, S.-F. X-57 Wing Structural Load Testing. In Proceedings of the AIAA 2020-3090, Virtual, 15–19 June 2020. [Google Scholar] [CrossRef]
- Deb, K. Multi-Objective Optimization using Evolutionary Algorithms; John Wiley & Sons Inc.: Hoboken, NJ, USA, 2001. [Google Scholar]
- Snorri Gudmundsson. General Aviation Aircraft Design: Applied Methods and Procedures, Butterworth-Heinemann; Elsevier: Amsterdam, The Netherlands, 2021. [Google Scholar]
- Niu, C.-Y.M. Airframe Structural Design; Conmilit Press: Hongkong, China, 1988. [Google Scholar]
- Devroye, L.; Toussaint, G. A note on linear expected time algorithms for finding convex hulls. Computing 1981, 26, 361–366. [Google Scholar] [CrossRef]
- David, M. Mount, 2002, Dept. of Computer Science, University of Maryland, Computational Geometry. Available online: https://www.cs.umd.edu/~mount/754/Lects/754lects.pdf (accessed on 18 July 2018).
- Tsai, S.W. Composites Design, 4th ed.; Think Composites: Dayton, Ohio 45419, USA, 1988. [Google Scholar]
- Department of Defence. Composite Materials Handbook; MIL-HDBK-17F; Department of Defence: Arlington, VT, USA, 2002.
- Yang, K.; Guo, Y.-L.; Li, D.-H.; Ma, G.; Geng, H.; Li, Q.-F.; Xue, J.-J. Design and static testing of wing structure of a composite four-seater electric aircraft. Sci. Eng. Compos. Mater. 2020, 27, 258–263. [Google Scholar] [CrossRef]
- Kalpakjian, S. Manufacturing Engineering and Technology; Addison-Wesley: Boston, MA, USA, 1989. [Google Scholar]
- Available online: https://www.mathworks.com/help/matlab/ref/qr.html (accessed on 8 September 2023).
- Anderson, E. LAPACK Users’ Guide, 3rd ed.; Software, Environments, Tools. Society for Industrial and Applied Mathematics: Philadelphia, PA, USA, 1999. [Google Scholar]
- Available online: https://www.mathworks.com/help/matlab/ref/lsqminnorm.html (accessed on 8 September 2023).
- Cadzow, J.A. Minimum ℓ1, ℓ2, and ℓ∞ Norm Approximate Solutions to an Overdetermined System of Linear Equations. Digit. Signal Process. 2002, 12, 524–560. [Google Scholar] [CrossRef]


| Spanwise Section (Left Side) | [Inch] | −198.4 | −171 | −120 | −89 | −60.1 | −35 | −30 |
| [mm] | −5039 | −4343 | −3048 | −2261 | −1527 | −889 | −762 | |
| Shear Force Magnitude | [Lbs] | 6.19 × 10³ | 6.19 × 10³ | 7.63 × 10³ | 8.25 × 10³ | 8.25 × 10³ | 8.68 × 10³ | 8.68 × 10³ |
| [N] | 2.75 × 10⁴ | 2.75 × 10⁴ | 3.40 × 10⁴ | 3.67 × 10⁴ | 3.67 × 10⁴ | 3.86 × 10⁴ | 3.86 × 10⁴ | |
| Shear Force Magnitude Relative Errors | [%] | −4.02% | 6.49% | −7.78% | −0.42% | 1.21% | 5.57% | 5.81% |
| Bending Moment Magnitude | [Lbs × Inch] | 1.94 × 10⁵ | 3.58 × 10⁵ | 7.05 × 10⁵ | 9.44 × 10⁵ | 1.18 × 10⁶ | 1.40 × 10⁶ | 1.44 × 10⁶ |
| [N × mm] | 2.19 × 10⁷ | 4.04 × 10⁷ | 7.96 × 10⁷ | 1.07 × 10⁸ | 1.33 × 10⁸ | 1.58 × 10⁸ | 1.63 × 10⁸ | |
| Bending Moment Relative Errors | [%] | −0.65% | 0.20% | 0.00% | 0.00% | 0.02% | −0.09% | 0.07% |
| Spanwise Section (Right Side) | [Inch] | 30 | 35 | 60.1 | 89 | 120 | 171 | 198.4 |
| [mm] | 762 | 889 | 1527 | 2261 | 3048 | 4343 | 5039 | |
| Shear Force Magnitude | [Lbs] | 8.60 × 10³ | 8.60 × 10³ | 8.18 × 10³ | 8.18 × 10³ | 7.56 × 10³ | 6.11 × 10³ | 6.11 × 10³ |
| [N] | 3.83 × 10⁴ | 3.83 × 10⁴ | 3.64 × 10⁴ | 3.64 × 10⁴ | 3.36 × 10⁴ | 2.72 × 10⁴ | 2.72 × 10⁴ | |
| Shear Force Magnitude Relative Errors | [%] | 5.62% | 5.50% | 1.23% | −0.43% | −7.66% | 6.27% | −4.04% |
| Bending Moment Magnitude | [Lbs × Inch] | 1.43 × 10⁶ | 1.39 × 10⁶ | 1.17 × 10⁶ | 9.35 × 10⁵ | 6.98 × 10⁵ | 3.55 × 10⁵ | 1.95 × 10⁵ |
| [N × mm] | 1.61 × 10⁸ | 1.57 × 10⁸ | 1.32 × 10⁸ | 1.06 × 10⁸ | 7.89 × 10⁷ | 4.02 × 10⁷ | 2.20 × 10⁷ | |
| Bending Moment Relative Errors | [%] | 0.07% | −0.10% | 0.02% | 0.00% | 0.00% | 0.23% | −0.71% |
Disclaimer/Publisher’s Note: The statements, opinions and data contained in all publications are solely those of the individual author(s) and contributor(s) and not of MDPI and/or the editor(s). MDPI and/or the editor(s) disclaim responsibility for any injury to people or property resulting from any ideas, methods, instructions or products referred to in the content. |
© 2024 by the authors. Licensee MDPI, Basel, Switzerland. This article is an open access article distributed under the terms and conditions of the Creative Commons Attribution (CC BY) license (https://creativecommons.org/licenses/by/4.0/).
Share and Cite
Vitale, P.; Diodati, G.; Orlando, S.; Timbrato, F.; Miano, M.; Chiariello, A.; Belardo, M. A Resilient Approach to a Test Rig Setup in the Qualification of a Tilt Rotor Carbon Fiber-Reinforced Polymer (CFRP) Wing. Aerospace 2024, 11, 323. https://doi.org/10.3390/aerospace11040323
Vitale P, Diodati G, Orlando S, Timbrato F, Miano M, Chiariello A, Belardo M. A Resilient Approach to a Test Rig Setup in the Qualification of a Tilt Rotor Carbon Fiber-Reinforced Polymer (CFRP) Wing. Aerospace. 2024; 11(4):323. https://doi.org/10.3390/aerospace11040323
Chicago/Turabian StyleVitale, Pasquale, Gianluca Diodati, Salvatore Orlando, Francesco Timbrato, Mario Miano, Antonio Chiariello, and Marika Belardo. 2024. "A Resilient Approach to a Test Rig Setup in the Qualification of a Tilt Rotor Carbon Fiber-Reinforced Polymer (CFRP) Wing" Aerospace 11, no. 4: 323. https://doi.org/10.3390/aerospace11040323